Plots List
Plots
This endpoint handles manipulation of Plotly plot files.
Reference
Authorization
Any user with or without a Plotly account may view public plots. For private plots, see authentication.
Actions
list
Listing all public plots can be done via a GET request to this endpoint.
By default, plots will be listed in order of date created. The order_by
query parameter is accepted at this endpoint. Currently, only ordering by
views is supported. It is possible to filter the plots by quality
with min_quality or max_quality as query parameter.
Example:
// GET https://api.plotly.com/v2/plots/ ---> 200

// GET https://api.plotly.com/v2/plots/?order_by=-views ---> 200

// GET https://api.plotly.com/v2/plots/?min_quality=5 ---> 200

// GET https://api.plotly.com/v2/plots/?max_quality=5 ---> 200
feed
Listing all handpicked feed plots can be done via a GET request to this endpoint. By default, plots will be listed in a random order.
Example:
// GET https://api.plotly.com/v2/plots/feed ---> 200
create
You can create new plot resources here. The only required field is 'figure'. Currently, the figure is restricted to only contain references to grid data. That is, this will fail if raw data arrays are passed in. To create and manipulate underlying grids for plots, see the grids endpoint.
Example:
// This fails because a figure field is required.
// POST https://api.plotly.com/v2/plots ---> 400 Bad Request
{}

// This fails because the figure has raw data
//POST https://api.plotly.com/v2/plots ---> 400 Bad Request
{
    "figure": {"data": [{"y": ['this', 'is', 'raw', 'data']}]}
}

// This succeeds because the figure has src keys, not raw data.
//POST https://api.plotly.com/v2/plots ---> 200 OK
{
    "figure": {"data": [{"ysrc": "sven:88:u8nd62"}]}
}
When creating a grid, you can optionally specify a source_fid to specify where a plot has come from:
- source_fid: the fid of a plot that was copied (and presumably edited) to produce this one
detail
There is a lot of meta information stored about plot files including filename, title, share_url, and content_url to name a few.
This information can only be reached with a GET to this endpoint.
Example:
// GET https://api.plotly.com/v2/plots/iheartgraphs:90
content
The contents of a plot can be downloaded via the content resource. The plot
content contains referenced grid/column data by default. If you wish to
return the raw grid/column data, the inline_data=true query must be included
in the request url. The Content-Type header will be appropriately set for the
response body.
Alternatively, you can set ?map_data=unreadable to append a mapping of
sources to data that belongs to grids which are unreadable for the
requestor. This is useful when you have read access to another users plot,
but that plot contains grid references which you don't have access to.
Examples:
// Returns referenced grid/column data
// GET https://api.plotly.com/v2/plots/iheartgraphs:90/content ---> 200 OK

// Returns full grid/column data
// GET https://api.plotly.com/v2/plots/iheartgraphs:90/content?inline_data=true ---> 200 OK

// Returns full grid/column data when requestor doesn't have permission
// to read the referenced grid.
// GET https://api.plotly.com/v2/plots/iheartgraphs:90/content?map_data=unreadable ---> 200 OK
GET /v2/plots?format=api&order_by=-views
{ "next": "https://api.plot.ly/v2/plots?cursor=cD02OTE0Nzg%3D&format=api&order_by=-views", "previous": null, "results": [ { "creation_time": "2017-05-11T19:07:49.437427Z", "comments": { "results": [ { "cid": 9793, "comment": "import numpy as np\nimport matplotlib.pyplot as plt\n\n# Данные\nA = 0.1547 # Средняя амплитуда колебаний в радианах\ndelta_T_over_T0 = 0.00149781 # Относительное изменение периода маятника\nT0 = 1.796 # Исходный период маятника в секундах\n\n# Значения амплитуды колебаний\n\namplitudes = np.linspace(0.1, 0.5, 100) # Пример значений от 0.1 до 0.5 радиан\n\n# Вычисляем изменение периода для каждой амплитуды\ndelta_T = delta_T_over_T0 * T0\n\n# Строим график\nplt.plot(amplitudes, delta_T * np.ones_like(amplitudes), label='Относительное изменение периода')\nplt.xlabel('Средняя амплитуда колебаний (рад)')\nplt.ylabel('Изменение периода маятника (с)')\nplt.title('Зависимость изменения периода маятника от средней амплитуды колебаний')\nplt.legend()\nplt.grid(True)\nplt.show()", "commenter": { "profile_url": "https://plotly.com/~Danblk0936", "avatar_url": "https://storage.googleapis.com/plotly-prod-profiles/42.jpg", "background_url": "https://storage.googleapis.com/plotly-prod-profiles/bg-8.jpg", "bio": "", "nickname": "", "website": "", "stream_tokens": null, "feature_set_id": null, "csrf_token": null, "date_joined": "2024-03-12 11:34:00", "mapbox_access_tokens": null, "has_password": null, "username": "Danblk0936", "email": null, "is_active": null, "readonly": null, "is_dash_creator": null, "dash_created_count": null, "is_chart_creator": null, "charts_created_count": null }, "ref_id": null, "creation_time": "2024-03-12T11:41:57.024045Z" }, { "cid": 8022, "comment": "hello", "commenter": { "profile_url": "https://plotly.com/~monsterkc", "avatar_url": "https://storage.googleapis.com/plotly-prod-profiles/64BOHZ36HZ0SJLI0RQYX33K52I611B.jpg", "background_url": "https://storage.googleapis.com/plotly-prod-profiles/bg-7.jpg", "bio": "_.escape('fred, barney, & pebbles');", "nickname": "mooooooo1112222", "website": "", "stream_tokens": null, "feature_set_id": null, "csrf_token": null, "date_joined": "2019-12-13 11:32:05", "mapbox_access_tokens": null, "has_password": null, "username": "monsterkc", "email": null, "is_active": null, "readonly": null, "is_dash_creator": null, "dash_created_count": null, "is_chart_creator": null, "charts_created_count": null }, "ref_id": null, "creation_time": "2019-12-17T07:17:58.208390Z" }, { "cid": 8023, "comment": "<hello>", "commenter": { "profile_url": "https://plotly.com/~monsterkc", "avatar_url": "https://storage.googleapis.com/plotly-prod-profiles/64BOHZ36HZ0SJLI0RQYX33K52I611B.jpg", "background_url": "https://storage.googleapis.com/plotly-prod-profiles/bg-7.jpg", "bio": "_.escape('fred, barney, & pebbles');", "nickname": "mooooooo1112222", "website": "", "stream_tokens": null, "feature_set_id": null, "csrf_token": null, "date_joined": "2019-12-13 11:32:05", "mapbox_access_tokens": null, "has_password": null, "username": "monsterkc", "email": null, "is_active": null, "readonly": null, "is_dash_creator": null, "dash_created_count": null, "is_chart_creator": null, "charts_created_count": null }, "ref_id": null, "creation_time": "2019-12-17T07:18:35.401573Z" } ], "count": 3 }, "parented": true, "embed_url": "https://plotly.com/~PythonPlotBot/27.embed", "fid": "PythonPlotBot:27", "filename": "basic-line", "filetype": "plot", "img_url": "https://storage.googleapis.com/plotly-prod-images/PythonPlotBot/27/9_DKA4FVNM4RNN58AX2WDODY6GZVWX9M.png", "image_urls": { "default": "https://storage.googleapis.com/plotly-prod-images/PythonPlotBot/27/2_XPJSMWOVPOZRUKSVSD04DSRT9YHN0T.png", "block-thumb": "https://storage.googleapis.com/plotly-prod-images/PythonPlotBot/27/8_633Z0Z5LA86PDJ12B5PXPDTBDWFRMJ.png", "list-thumb": "https://storage.googleapis.com/plotly-prod-images/PythonPlotBot/27/9_DKA4FVNM4RNN58AX2WDODY6GZVWX9M.png" }, "api_urls": { "files": "https://api.plotly.com/v2/files/PythonPlotBot:27", "plots": "https://api.plotly.com/v2/plots/PythonPlotBot:27", "parent": "https://api.plotly.com/v2/folders/home?user=PythonPlotBot" }, "owner": "PythonPlotBot", "parent": -1, "preview": "", "referencers": [], "references": [], "title": "", "views": 1619478, "web_url": "https://plotly.com/~PythonPlotBot/27/", "world_readable": true, "date_modified": "2019-07-08T16:34:40.821Z", "stars": { "results": [ { "creator": { "profile_url": "https://plotly.com/~happylucky", "avatar_url": "https://storage.googleapis.com/plotly-prod-profiles/73.jpg", "background_url": "https://storage.googleapis.com/plotly-prod-profiles/bg-9.jpg", "bio": "", "nickname": "", "website": "", "stream_tokens": null, "feature_set_id": null, "csrf_token": null, "date_joined": "2019-03-22 00:01:04", "mapbox_access_tokens": null, "has_password": null, "username": "happylucky", "email": null, "is_active": null, "readonly": null, "is_dash_creator": null, "dash_created_count": null, "is_chart_creator": null, "charts_created_count": null } } ], "count": 1 }, "collaborators": { "results": [], "count": 0 }, "subfolder_count": null, "refresh_interval": null, "organize_view_url": "https://plotly.com/~PythonPlotBot/27/", "current_user_permission": "read", "is_theme": null, "is_template": null, "autosize": true, "caption": "", "figure": { "data": [ { "type": "scatter", "xsrc": "PythonPlotBot:3540:da66e8", "ysrc": "PythonPlotBot:3540:d4fd33" }, { "type": "scatter", "xsrc": "PythonPlotBot:3540:e9d291", "ysrc": "PythonPlotBot:3540:a55816" } ], "layout": { "template": { "data": { "bar": [ { "type": "bar", "marker": { "line": { "color": "#E5ECF6", "width": 0.5 } } } ], "table": [ { "type": "table", "cells": { "fill": { "color": "#EBF0F8" }, "line": { "color": "white" } }, "header": { "fill": { "color": "#C8D4E3" }, "line": { "color": "white" } } } ], "carpet": [ { "type": "carpet", "aaxis": { "gridcolor": "white", "linecolor": "white", "endlinecolor": "#2a3f5f", "minorgridcolor": "white", "startlinecolor": "#2a3f5f" }, "baxis": { "gridcolor": "white", "linecolor": "white", "endlinecolor": "#2a3f5f", "minorgridcolor": "white", "startlinecolor": "#2a3f5f" } } ], "mesh3d": [ { "type": "mesh3d", "colorbar": { "ticks": "", "outlinewidth": 0 } } ], "contour": [ { "type": "contour", "colorbar": { "ticks": "", "outlinewidth": 0 }, "colorscale": [ [ 0.0, "#0d0887" ], [ 0.1111111111111111, "#46039f" ], [ 0.2222222222222222, "#7201a8" ], [ 0.3333333333333333, "#9c179e" ], [ 0.4444444444444444, "#bd3786" ], [ 0.5555555555555556, "#d8576b" ], [ 0.6666666666666666, "#ed7953" ], [ 0.7777777777777778, "#fb9f3a" ], [ 0.8888888888888888, "#fdca26" ], [ 1.0, "#f0f921" ] ] } ], "heatmap": [ { "type": "heatmap", "colorbar": { "ticks": "", "outlinewidth": 0 }, "colorscale": [ [ 0.0, "#0d0887" ], [ 0.1111111111111111, "#46039f" ], [ 0.2222222222222222, "#7201a8" ], [ 0.3333333333333333, "#9c179e" ], [ 0.4444444444444444, "#bd3786" ], [ 0.5555555555555556, "#d8576b" ], [ 0.6666666666666666, "#ed7953" ], [ 0.7777777777777778, "#fb9f3a" ], [ 0.8888888888888888, "#fdca26" ], [ 1.0, "#f0f921" ] ] } ], "scatter": [ { "type": "scatter", "marker": { "colorbar": { "ticks": "", "outlinewidth": 0 } } } ], "surface": [ { "type": "surface", "colorbar": { "ticks": "", "outlinewidth": 0 } } ], "barpolar": [ { "type": "barpolar", "marker": { "line": { "color": "#E5ECF6", "width": 0.5 } } } ], "heatmapgl": [ { "type": "heatmapgl", "colorbar": { "ticks": "", "outlinewidth": 0 } } ], "histogram": [ { "type": "histogram", "marker": { "colorbar": { "ticks": "", "outlinewidth": 0 } } } ], "parcoords": [ { "line": { "colorbar": { "ticks": "", "outlinewidth": 0 } }, "type": "parcoords" } ], "scatter3d": [ { "line": { "colorbar": { "ticks": "", "outlinewidth": 0 } }, "type": "scatter3d", "marker": { "colorbar": { "ticks": "", "outlinewidth": 0 } } } ], "scattergl": [ { "type": "scattergl", "marker": { "colorbar": { "ticks": "", "outlinewidth": 0 } } } ], "choropleth": [ { "type": "choropleth", "colorbar": { "ticks": "", "outlinewidth": 0 } } ], "scattergeo": [ { "type": "scattergeo", "marker": { "colorbar": { "ticks": "", "outlinewidth": 0 } } } ], "histogram2d": [ { "type": "histogram2d", "colorbar": { "ticks": "", "outlinewidth": 0 }, "colorscale": [ [ 0.0, "#0d0887" ], [ 0.1111111111111111, "#46039f" ], [ 0.2222222222222222, "#7201a8" ], [ 0.3333333333333333, "#9c179e" ], [ 0.4444444444444444, "#bd3786" ], [ 0.5555555555555556, "#d8576b" ], [ 0.6666666666666666, "#ed7953" ], [ 0.7777777777777778, "#fb9f3a" ], [ 0.8888888888888888, "#fdca26" ], [ 1.0, "#f0f921" ] ] } ], "scatterpolar": [ { "type": "scatterpolar", "marker": { "colorbar": { "ticks": "", "outlinewidth": 0 } } } ], "contourcarpet": [ { "type": "contourcarpet", "colorbar": { "ticks": "", "outlinewidth": 0 } } ], "scattercarpet": [ { "type": "scattercarpet", "marker": { "colorbar": { "ticks": "", "outlinewidth": 0 } } } ], "scattermapbox": [ { "type": "scattermapbox", "marker": { "colorbar": { "ticks": "", "outlinewidth": 0 } } } ], "scatterpolargl": [ { "type": "scatterpolargl", "marker": { "colorbar": { "ticks": "", "outlinewidth": 0 } } } ], "scatterternary": [ { "type": "scatterternary", "marker": { "colorbar": { "ticks": "", "outlinewidth": 0 } } } ], "histogram2dcontour": [ { "type": "histogram2dcontour", "colorbar": { "ticks": "", "outlinewidth": 0 }, "colorscale": [ [ 0.0, "#0d0887" ], [ 0.1111111111111111, "#46039f" ], [ 0.2222222222222222, "#7201a8" ], [ 0.3333333333333333, "#9c179e" ], [ 0.4444444444444444, "#bd3786" ], [ 0.5555555555555556, "#d8576b" ], [ 0.6666666666666666, "#ed7953" ], [ 0.7777777777777778, "#fb9f3a" ], [ 0.8888888888888888, "#fdca26" ], [ 1.0, "#f0f921" ] ] } ] }, "layout": { "geo": { "bgcolor": "white", "showland": true, "lakecolor": "white", "landcolor": "#E5ECF6", "showlakes": true, "subunitcolor": "white" }, "font": { "color": "#2a3f5f" }, "polar": { "bgcolor": "#E5ECF6", "radialaxis": { "ticks": "", "gridcolor": "white", "linecolor": "white" }, "angularaxis": { "ticks": "", "gridcolor": "white", "linecolor": "white" } }, "scene": { "xaxis": { "ticks": "", "gridcolor": "white", "gridwidth": 2, "linecolor": "white", "zerolinecolor": "white", "showbackground": true, "backgroundcolor": "#E5ECF6" }, "yaxis": { "ticks": "", "gridcolor": "white", "gridwidth": 2, "linecolor": "white", "zerolinecolor": "white", "showbackground": true, "backgroundcolor": "#E5ECF6" }, "zaxis": { "ticks": "", "gridcolor": "white", "gridwidth": 2, "linecolor": "white", "zerolinecolor": "white", "showbackground": true, "backgroundcolor": "#E5ECF6" } }, "title": { "x": 0.05 }, "xaxis": { "ticks": "", "gridcolor": "white", "linecolor": "white", "automargin": true, "zerolinecolor": "white", "zerolinewidth": 2 }, "yaxis": { "ticks": "", "gridcolor": "white", "linecolor": "white", "automargin": true, "zerolinecolor": "white", "zerolinewidth": 2 }, "mapbox": { "style": "light" }, "ternary": { "aaxis": { "ticks": "", "gridcolor": "white", "linecolor": "white" }, "baxis": { "ticks": "", "gridcolor": "white", "linecolor": "white" }, "caxis": { "ticks": "", "gridcolor": "white", "linecolor": "white" }, "bgcolor": "#E5ECF6" }, "colorway": [ "#636efa", "#EF553B", "#00cc96", "#ab63fa", "#FFA15A", "#19d3f3", "#FF6692", "#B6E880", "#FF97FF", "#FECB52" ], "hovermode": "closest", "colorscale": { "diverging": [ [ 0, "#8e0152" ], [ 0.1, "#c51b7d" ], [ 0.2, "#de77ae" ], [ 0.3, "#f1b6da" ], [ 0.4, "#fde0ef" ], [ 0.5, "#f7f7f7" ], [ 0.6, "#e6f5d0" ], [ 0.7, "#b8e186" ], [ 0.8, "#7fbc41" ], [ 0.9, "#4d9221" ], [ 1, "#276419" ] ], "sequential": [ [ 0.0, "#0d0887" ], [ 0.1111111111111111, "#46039f" ], [ 0.2222222222222222, "#7201a8" ], [ 0.3333333333333333, "#9c179e" ], [ 0.4444444444444444, "#bd3786" ], [ 0.5555555555555556, "#d8576b" ], [ 0.6666666666666666, "#ed7953" ], [ 0.7777777777777778, "#fb9f3a" ], [ 0.8888888888888888, "#fdca26" ], [ 1.0, "#f0f921" ] ], "sequentialminus": [ [ 0.0, "#0d0887" ], [ 0.1111111111111111, "#46039f" ], [ 0.2222222222222222, "#7201a8" ], [ 0.3333333333333333, "#9c179e" ], [ 0.4444444444444444, "#bd3786" ], [ 0.5555555555555556, "#d8576b" ], [ 0.6666666666666666, "#ed7953" ], [ 0.7777777777777778, "#fb9f3a" ], [ 0.8888888888888888, "#fdca26" ], [ 1.0, "#f0f921" ] ] }, "hoverlabel": { "align": "left" }, "plot_bgcolor": "#E5ECF6", "paper_bgcolor": "white", "shapedefaults": { "line": { "width": 0 }, "opacity": 0.4, "fillcolor": "#506784" }, "annotationdefaults": { "arrowhead": 0, "arrowcolor": "#506784", "arrowwidth": 1 } } } } }, "height": null, "width": null, "user": { "profile_url": "https://plotly.com/~PythonPlotBot", "avatar_url": "https://storage.googleapis.com/plotly-prod-profiles/15.jpg", "background_url": "https://storage.googleapis.com/plotly-prod-profiles/bg-14.jpg", "bio": "", "nickname": "", "website": "", "stream_tokens": null, "feature_set_id": null, "csrf_token": null, "date_joined": "2017-02-14 21:07:30", "mapbox_access_tokens": null, "has_password": null, "username": "PythonPlotBot", "email": null, "is_active": null, "readonly": null, "is_dash_creator": null, "dash_created_count": null, "is_chart_creator": null, "charts_created_count": null } }, { "creation_time": "2017-02-28T22:53:04.175771Z", "comments": { "results": [], "count": 0 }, "parented": true, "embed_url": "https://plotly.com/~PythonPlotBot/226.embed", "fid": "PythonPlotBot:226", "filename": "Sine Wave Slider", "filetype": "plot", "img_url": "https://api.plotly.com/v2/files/PythonPlotBot:226/image?image_name=list-thumb", "image_urls": { "default": "https://api.plotly.com/v2/files/PythonPlotBot:226/image?image_name=default", "block-thumb": "https://api.plotly.com/v2/files/PythonPlotBot:226/image?image_name=block-thumb", "list-thumb": "https://api.plotly.com/v2/files/PythonPlotBot:226/image?image_name=list-thumb" }, "api_urls": { "files": "https://api.plotly.com/v2/files/PythonPlotBot:226", "plots": "https://api.plotly.com/v2/plots/PythonPlotBot:226", "parent": "https://api.plotly.com/v2/folders/home?user=PythonPlotBot" }, "owner": "PythonPlotBot", "parent": -1, "preview": "", "referencers": [], "references": [], "title": "𝜈 = 1.0", "views": 999280, "web_url": "https://plotly.com/~PythonPlotBot/226/_10/", "world_readable": true, "date_modified": "2019-07-08T16:37:14.292Z", "stars": { "results": [], "count": 0 }, "collaborators": { "results": [], "count": 0 }, "subfolder_count": null, "refresh_interval": null, "organize_view_url": "https://plotly.com/~PythonPlotBot/226/", "current_user_permission": "read", "is_theme": null, "is_template": null, "autosize": true, "caption": "", "figure": { "data": [ { "line": { "color": "#00CED1", "width": 6 }, "name": "𝜈 = 0.0", "type": "scatter", "xsrc": "PythonPlotBot:3547:f06ef0", "ysrc": "PythonPlotBot:3547:af191f", "visible": false }, { "line": { "color": "#00CED1", "width": 6 }, "name": "𝜈 = 0.1", "type": "scatter", "xsrc": "PythonPlotBot:3547:d5821d", "ysrc": "PythonPlotBot:3547:37e8ee", "visible": false }, { "line": { "color": "#00CED1", "width": 6 }, "name": "𝜈 = 0.2", "type": "scatter", "xsrc": "PythonPlotBot:3547:40db69", "ysrc": "PythonPlotBot:3547:0afd60", "visible": false }, { "line": { "color": "#00CED1", "width": 6 }, "name": "𝜈 = 0.30000000000000004", "type": "scatter", "xsrc": "PythonPlotBot:3547:9d3f82", "ysrc": "PythonPlotBot:3547:ec591c", "visible": false }, { "line": { "color": "#00CED1", "width": 6 }, "name": "𝜈 = 0.4", "type": "scatter", "xsrc": "PythonPlotBot:3547:5c2094", "ysrc": "PythonPlotBot:3547:f206be", "visible": false }, { "line": { "color": "#00CED1", "width": 6 }, "name": "𝜈 = 0.5", "type": "scatter", "xsrc": "PythonPlotBot:3547:da8c18", "ysrc": "PythonPlotBot:3547:e06859", "visible": false }, { "line": { "color": "#00CED1", "width": 6 }, "name": "𝜈 = 0.6000000000000001", "type": "scatter", "xsrc": "PythonPlotBot:3547:23c3d7", "ysrc": "PythonPlotBot:3547:e0ec14", "visible": false }, { "line": { "color": "#00CED1", "width": 6 }, "name": "𝜈 = 0.7000000000000001", "type": "scatter", "xsrc": "PythonPlotBot:3547:cb75b7", "ysrc": "PythonPlotBot:3547:68bc09", "visible": false }, { "line": { "color": "#00CED1", "width": 6 }, "name": "𝜈 = 0.8", "type": "scatter", "xsrc": "PythonPlotBot:3547:881806", "ysrc": "PythonPlotBot:3547:1dc66a", "visible": false }, { "line": { "color": "#00CED1", "width": 6 }, "name": "𝜈 = 0.9", "type": "scatter", "xsrc": "PythonPlotBot:3547:1d06c8", "ysrc": "PythonPlotBot:3547:1a5304", "visible": false }, { "line": { "color": "#00CED1", "width": 6 }, "name": "𝜈 = 1.0", "type": "scatter", "xsrc": "PythonPlotBot:3547:5872c4", "ysrc": "PythonPlotBot:3547:f64d33", "visible": true }, { "line": { "color": "#00CED1", "width": 6 }, "name": "𝜈 = 1.1", "type": "scatter", "xsrc": "PythonPlotBot:3547:91edaf", "ysrc": "PythonPlotBot:3547:9b1acf", "visible": false }, { "line": { "color": "#00CED1", "width": 6 }, "name": "𝜈 = 1.2000000000000002", "type": "scatter", "xsrc": "PythonPlotBot:3547:22379c", "ysrc": "PythonPlotBot:3547:5dd18c", "visible": false }, { "line": { "color": "#00CED1", "width": 6 }, "name": "𝜈 = 1.3", "type": "scatter", "xsrc": "PythonPlotBot:3547:591d7e", "ysrc": "PythonPlotBot:3547:1386ff", "visible": false }, { "line": { "color": "#00CED1", "width": 6 }, "name": "𝜈 = 1.4000000000000001", "type": "scatter", "xsrc": "PythonPlotBot:3547:5cc863", "ysrc": "PythonPlotBot:3547:af7ead", "visible": false }, { "line": { "color": "#00CED1", "width": 6 }, "name": "𝜈 = 1.5", "type": "scatter", "xsrc": "PythonPlotBot:3547:a599b5", "ysrc": "PythonPlotBot:3547:b20be6", "visible": false }, { "line": { "color": "#00CED1", "width": 6 }, "name": "𝜈 = 1.6", "type": "scatter", "xsrc": "PythonPlotBot:3547:1be860", "ysrc": "PythonPlotBot:3547:12b5d5", "visible": false }, { "line": { "color": "#00CED1", "width": 6 }, "name": "𝜈 = 1.7000000000000002", "type": "scatter", "xsrc": "PythonPlotBot:3547:f153b0", "ysrc": "PythonPlotBot:3547:4ba368", "visible": false }, { "line": { "color": "#00CED1", "width": 6 }, "name": "𝜈 = 1.8", "type": "scatter", "xsrc": "PythonPlotBot:3547:2b20f8", "ysrc": "PythonPlotBot:3547:9b68da", "visible": false }, { "line": { "color": "#00CED1", "width": 6 }, "name": "𝜈 = 1.9000000000000001", "type": "scatter", "xsrc": "PythonPlotBot:3547:c4d918", "ysrc": "PythonPlotBot:3547:28333d", "visible": false }, { "line": { "color": "#00CED1", "width": 6 }, "name": "𝜈 = 2.0", "type": "scatter", "xsrc": "PythonPlotBot:3547:3cfe07", "ysrc": "PythonPlotBot:3547:fa5865", "visible": false }, { "line": { "color": "#00CED1", "width": 6 }, "name": "𝜈 = 2.1", "type": "scatter", "xsrc": "PythonPlotBot:3547:19fbe2", "ysrc": "PythonPlotBot:3547:bcd801", "visible": false }, { "line": { "color": "#00CED1", "width": 6 }, "name": "𝜈 = 2.2", "type": "scatter", "xsrc": "PythonPlotBot:3547:845991", "ysrc": "PythonPlotBot:3547:12d549", "visible": false }, { "line": { "color": "#00CED1", "width": 6 }, "name": "𝜈 = 2.3000000000000003", "type": "scatter", "xsrc": "PythonPlotBot:3547:1be2ba", "ysrc": "PythonPlotBot:3547:f615df", "visible": false }, { "line": { "color": "#00CED1", "width": 6 }, "name": "𝜈 = 2.4000000000000004", "type": "scatter", "xsrc": "PythonPlotBot:3547:ae49fd", "ysrc": "PythonPlotBot:3547:41dc47", "visible": false }, { "line": { "color": "#00CED1", "width": 6 }, "name": "𝜈 = 2.5", "type": "scatter", "xsrc": "PythonPlotBot:3547:7c9460", "ysrc": "PythonPlotBot:3547:da03ec", "visible": false }, { "line": { "color": "#00CED1", "width": 6 }, "name": "𝜈 = 2.6", "type": "scatter", "xsrc": "PythonPlotBot:3547:550816", "ysrc": "PythonPlotBot:3547:588a50", "visible": false }, { "line": { "color": "#00CED1", "width": 6 }, "name": "𝜈 = 2.7", "type": "scatter", "xsrc": "PythonPlotBot:3547:14bb83", "ysrc": "PythonPlotBot:3547:d77be1", "visible": false }, { "line": { "color": "#00CED1", "width": 6 }, "name": "𝜈 = 2.8000000000000003", "type": "scatter", "xsrc": "PythonPlotBot:3547:35ee47", "ysrc": "PythonPlotBot:3547:75fb13", "visible": false }, { "line": { "color": "#00CED1", "width": 6 }, "name": "𝜈 = 2.9000000000000004", "type": "scatter", "xsrc": "PythonPlotBot:3547:71f401", "ysrc": "PythonPlotBot:3547:b11e55", "visible": false }, { "line": { "color": "#00CED1", "width": 6 }, "name": "𝜈 = 3.0", "type": "scatter", "xsrc": "PythonPlotBot:3547:0d309e", "ysrc": "PythonPlotBot:3547:6090b4", "visible": false }, { "line": { "color": "#00CED1", "width": 6 }, "name": "𝜈 = 3.1", "type": "scatter", "xsrc": "PythonPlotBot:3547:62f7db", "ysrc": "PythonPlotBot:3547:1af3cb", "visible": false }, { "line": { "color": "#00CED1", "width": 6 }, "name": "𝜈 = 3.2", "type": "scatter", "xsrc": "PythonPlotBot:3547:a8469f", "ysrc": "PythonPlotBot:3547:f0d165", "visible": false }, { "line": { "color": "#00CED1", "width": 6 }, "name": "𝜈 = 3.3000000000000003", "type": "scatter", "xsrc": "PythonPlotBot:3547:74e688", "ysrc": "PythonPlotBot:3547:709a4b", "visible": false }, { "line": { "color": "#00CED1", "width": 6 }, "name": "𝜈 = 3.4000000000000004", "type": "scatter", "xsrc": "PythonPlotBot:3547:00e8c7", "ysrc": "PythonPlotBot:3547:15b238", "visible": false }, { "line": { "color": "#00CED1", "width": 6 }, "name": "𝜈 = 3.5", "type": "scatter", "xsrc": "PythonPlotBot:3547:cc06fa", "ysrc": "PythonPlotBot:3547:ac716f", "visible": false }, { "line": { "color": "#00CED1", "width": 6 }, "name": "𝜈 = 3.6", "type": "scatter", "xsrc": "PythonPlotBot:3547:4a70b3", "ysrc": "PythonPlotBot:3547:c2f5c2", "visible": false }, { "line": { "color": "#00CED1", "width": 6 }, "name": "𝜈 = 3.7", "type": "scatter", "xsrc": "PythonPlotBot:3547:e3bb25", "ysrc": "PythonPlotBot:3547:eeaf46", "visible": false }, { "line": { "color": "#00CED1", "width": 6 }, "name": "𝜈 = 3.8000000000000003", "type": "scatter", "xsrc": "PythonPlotBot:3547:0670de", "ysrc": "PythonPlotBot:3547:400dc2", "visible": false }, { "line": { "color": "#00CED1", "width": 6 }, "name": "𝜈 = 3.9000000000000004", "type": "scatter", "xsrc": "PythonPlotBot:3547:b2b1ad", "ysrc": "PythonPlotBot:3547:ba7c23", "visible": false }, { "line": { "color": "#00CED1", "width": 6 }, "name": "𝜈 = 4.0", "type": "scatter", "xsrc": "PythonPlotBot:3547:ac6e1b", "ysrc": "PythonPlotBot:3547:fa773f", "visible": false }, { "line": { "color": "#00CED1", "width": 6 }, "name": "𝜈 = 4.1000000000000005", "type": "scatter", "xsrc": "PythonPlotBot:3547:846609", "ysrc": "PythonPlotBot:3547:d44c08", "visible": false }, { "line": { "color": "#00CED1", "width": 6 }, "name": "𝜈 = 4.2", "type": "scatter", "xsrc": "PythonPlotBot:3547:31c39f", "ysrc": "PythonPlotBot:3547:0ad65d", "visible": false }, { "line": { "color": "#00CED1", "width": 6 }, "name": "𝜈 = 4.3", "type": "scatter", "xsrc": "PythonPlotBot:3547:b32041", "ysrc": "PythonPlotBot:3547:54240a", "visible": false }, { "line": { "color": "#00CED1", "width": 6 }, "name": "𝜈 = 4.4", "type": "scatter", "xsrc": "PythonPlotBot:3547:c57f6e", "ysrc": "PythonPlotBot:3547:1336f5", "visible": false }, { "line": { "color": "#00CED1", "width": 6 }, "name": "𝜈 = 4.5", "type": "scatter", "xsrc": "PythonPlotBot:3547:86f005", "ysrc": "PythonPlotBot:3547:ea541f", "visible": false }, { "line": { "color": "#00CED1", "width": 6 }, "name": "𝜈 = 4.6000000000000005", "type": "scatter", "xsrc": "PythonPlotBot:3547:82dfcc", "ysrc": "PythonPlotBot:3547:0211a6", "visible": false }, { "line": { "color": "#00CED1", "width": 6 }, "name": "𝜈 = 4.7", "type": "scatter", "xsrc": "PythonPlotBot:3547:75ca84", "ysrc": "PythonPlotBot:3547:a4cc1b", "visible": false }, { "line": { "color": "#00CED1", "width": 6 }, "name": "𝜈 = 4.800000000000001", "type": "scatter", "xsrc": "PythonPlotBot:3547:166612", "ysrc": "PythonPlotBot:3547:f9eec1", "visible": false }, { "line": { "color": "#00CED1", "width": 6 }, "name": "𝜈 = 4.9", "type": "scatter", "xsrc": "PythonPlotBot:3547:d2bcb3", "ysrc": "PythonPlotBot:3547:79376c", "visible": false } ], "layout": { "sliders": [ { "pad": { "t": 50 }, "steps": [ { "args": [ "visible", [ true, false, false, false, false, false, false, false, false, false, false, false, false, false, false, false, false, false, false, false, false, false, false, false, false, false, false, false, false, false, false, false, false, false, false, false, false, false, false, false, false, false, false, false, false, false, false, false, false, false ] ], "method": "restyle" }, { "args": [ "visible", [ false, true, false, false, false, false, false, false, false, false, false, false, false, false, false, false, false, false, false, false, false, false, false, false, false, false, false, false, false, false, false, false, false, false, false, false, false, false, false, false, false, false, false, false, false, false, false, false, false, false ] ], "method": "restyle" }, { "args": [ "visible", [ false, false, true, false, false, false, false, false, false, false, false, false, false, false, false, false, false, false, false, false, false, false, false, false, false, false, false, false, false, false, false, false, false, false, false, false, false, false, false, false, false, false, false, false, false, false, false, false, false, false ] ], "method": "restyle" }, { "args": [ "visible", [ false, false, false, true, false, false, false, false, false, false, false, false, false, false, false, false, false, false, false, false, false, false, false, false, false, false, false, false, false, false, false, false, false, false, false, false, false, false, false, false, false, false, false, false, false, false, false, false, false, false ] ], "method": "restyle" }, { "args": [ "visible", [ false, false, false, false, true, false, false, false, false, false, false, false, false, false, false, false, false, false, false, false, false, false, false, false, false, false, false, false, false, false, false, false, false, false, false, false, false, false, false, false, false, false, false, false, false, false, false, false, false, false ] ], "method": "restyle" }, { "args": [ "visible", [ false, false, false, false, false, true, false, false, false, false, false, false, false, false, false, false, false, false, false, false, false, false, false, false, false, false, false, false, false, false, false, false, false, false, false, false, false, false, false, false, false, false, false, false, false, false, false, false, false, false ] ], "method": "restyle" }, { "args": [ "visible", [ false, false, false, false, false, false, true, false, false, false, false, false, false, false, false, false, false, false, false, false, false, false, false, false, false, false, false, false, false, false, false, false, false, false, false, false, false, false, false, false, false, false, false, false, false, false, false, false, false, false ] ], "method": "restyle" }, { "args": [ "visible", [ false, false, false, false, false, false, false, true, false, false, false, false, false, false, false, false, false, false, false, false, false, false, false, false, false, false, false, false, false, false, false, false, false, false, false, false, false, false, false, false, false, false, false, false, false, false, false, false, false, false ] ], "method": "restyle" }, { "args": [ "visible", [ false, false, false, false, false, false, false, false, true, false, false, false, false, false, false, false, false, false, false, false, false, false, false, false, false, false, false, false, false, false, false, false, false, false, false, false, false, false, false, false, false, false, false, false, false, false, false, false, false, false ] ], "method": "restyle" }, { "args": [ "visible", [ false, false, false, false, false, false, false, false, false, true, false, false, false, false, false, false, false, false, false, false, false, false, false, false, false, false, false, false, false, false, false, false, false, false, false, false, false, false, false, false, false, false, false, false, false, false, false, false, false, false ] ], "method": "restyle" }, { "args": [ "visible", [ false, false, false, false, false, false, false, false, false, false, true, false, false, false, false, false, false, false, false, false, false, false, false, false, false, false, false, false, false, false, false, false, false, false, false, false, false, false, false, false, false, false, false, false, false, false, false, false, false, false ] ], "method": "restyle" }, { "args": [ "visible", [ false, false, false, false, false, false, false, false, false, false, false, true, false, false, false, false, false, false, false, false, false, false, false, false, false, false, false, false, false, false, false, false, false, false, false, false, false, false, false, false, false, false, false, false, false, false, false, false, false, false ] ], "method": "restyle" }, { "args": [ "visible", [ false, false, false, false, false, false, false, false, false, false, false, false, true, false, false, false, false, false, false, false, false, false, false, false, false, false, false, false, false, false, false, false, false, false, false, false, false, false, false, false, false, false, false, false, false, false, false, false, false, false ] ], "method": "restyle" }, { "args": [ "visible", [ false, false, false, false, false, false, false, false, false, false, false, false, false, true, false, false, false, false, false, false, false, false, false, false, false, false, false, false, false, false, false, false, false, false, false, false, false, false, false, false, false, false, false, false, false, false, false, false, false, false ] ], "method": "restyle" }, { "args": [ "visible", [ false, false, false, false, false, false, false, false, false, false, false, false, false, false, true, false, false, false, false, false, false, false, false, false, false, false, false, false, false, false, false, false, false, false, false, false, false, false, false, false, false, false, false, false, false, false, false, false, false, false ] ], "method": "restyle" }, { "args": [ "visible", [ false, false, false, false, false, false, false, false, false, false, false, false, false, false, false, true, false, false, false, false, false, false, false, false, false, false, false, false, false, false, false, false, false, false, false, false, false, false, false, false, false, false, false, false, false, false, false, false, false, false ] ], "method": "restyle" }, { "args": [ "visible", [ false, false, false, false, false, false, false, false, false, false, false, false, false, false, false, false, true, false, false, false, false, false, false, false, false, false, false, false, false, false, false, false, false, false, false, false, false, false, false, false, false, false, false, false, false, false, false, false, false, false ] ], "method": "restyle" }, { "args": [ "visible", [ false, false, false, false, false, false, false, false, false, false, false, false, false, false, false, false, false, true, false, false, false, false, false, false, false, false, false, false, false, false, false, false, false, false, false, false, false, false, false, false, false, false, false, false, false, false, false, false, false, false ] ], "method": "restyle" }, { "args": [ "visible", [ false, false, false, false, false, false, false, false, false, false, false, false, false, false, false, false, false, false, true, false, false, false, false, false, false, false, false, false, false, false, false, false, false, false, false, false, false, false, false, false, false, false, false, false, false, false, false, false, false, false ] ], "method": "restyle" }, { "args": [ "visible", [ false, false, false, false, false, false, false, false, false, false, false, false, false, false, false, false, false, false, false, true, false, false, false, false, false, false, false, false, false, false, false, false, false, false, false, false, false, false, false, false, false, false, false, false, false, false, false, false, false, false ] ], "method": "restyle" }, { "args": [ "visible", [ false, false, false, false, false, false, false, false, false, false, false, false, false, false, false, false, false, false, false, false, true, false, false, false, false, false, false, false, false, false, false, false, false, false, false, false, false, false, false, false, false, false, false, false, false, false, false, false, false, false ] ], "method": "restyle" }, { "args": [ "visible", [ false, false, false, false, false, false, false, false, false, false, false, false, false, false, false, false, false, false, false, false, false, true, false, false, false, false, false, false, false, false, false, false, false, false, false, false, false, false, false, false, false, false, false, false, false, false, false, false, false, false ] ], "method": "restyle" }, { "args": [ "visible", [ false, false, false, false, false, false, false, false, false, false, false, false, false, false, false, false, false, false, false, false, false, false, true, false, false, false, false, false, false, false, false, false, false, false, false, false, false, false, false, false, false, false, false, false, false, false, false, false, false, false ] ], "method": "restyle" }, { "args": [ "visible", [ false, false, false, false, false, false, false, false, false, false, false, false, false, false, false, false, false, false, false, false, false, false, false, true, false, false, false, false, false, false, false, false, false, false, false, false, false, false, false, false, false, false, false, false, false, false, false, false, false, false ] ], "method": "restyle" }, { "args": [ "visible", [ false, false, false, false, false, false, false, false, false, false, false, false, false, false, false, false, false, false, false, false, false, false, false, false, true, false, false, false, false, false, false, false, false, false, false, false, false, false, false, false, false, false, false, false, false, false, false, false, false, false ] ], "method": "restyle" }, { "args": [ "visible", [ false, false, false, false, false, false, false, false, false, false, false, false, false, false, false, false, false, false, false, false, false, false, false, false, false, true, false, false, false, false, false, false, false, false, false, false, false, false, false, false, false, false, false, false, false, false, false, false, false, false ] ], "method": "restyle" }, { "args": [ "visible", [ false, false, false, false, false, false, false, false, false, false, false, false, false, false, false, false, false, false, false, false, false, false, false, false, false, false, true, false, false, false, false, false, false, false, false, false, false, false, false, false, false, false, false, false, false, false, false, false, false, false ] ], "method": "restyle" }, { "args": [ "visible", [ false, false, false, false, false, false, false, false, false, false, false, false, false, false, false, false, false, false, false, false, false, false, false, false, false, false, false, true, false, false, false, false, false, false, false, false, false, false, false, false, false, false, false, false, false, false, false, false, false, false ] ], "method": "restyle" }, { "args": [ "visible", [ false, false, false, false, false, false, false, false, false, false, false, false, false, false, false, false, false, false, false, false, false, false, false, false, false, false, false, false, true, false, false, false, false, false, false, false, false, false, false, false, false, false, false, false, false, false, false, false, false, false ] ], "method": "restyle" }, { "args": [ "visible", [ false, false, false, false, false, false, false, false, false, false, false, false, false, false, false, false, false, false, false, false, false, false, false, false, false, false, false, false, false, true, false, false, false, false, false, false, false, false, false, false, false, false, false, false, false, false, false, false, false, false ] ], "method": "restyle" }, { "args": [ "visible", [ false, false, false, false, false, false, false, false, false, false, false, false, false, false, false, false, false, false, false, false, false, false, false, false, false, false, false, false, false, false, true, false, false, false, false, false, false, false, false, false, false, false, false, false, false, false, false, false, false, false ] ], "method": "restyle" }, { "args": [ "visible", [ false, false, false, false, false, false, false, false, false, false, false, false, false, false, false, false, false, false, false, false, false, false, false, false, false, false, false, false, false, false, false, true, false, false, false, false, false, false, false, false, false, false, false, false, false, false, false, false, false, false ] ], "method": "restyle" }, { "args": [ "visible", [ false, false, false, false, false, false, false, false, false, false, false, false, false, false, false, false, false, false, false, false, false, false, false, false, false, false, false, false, false, false, false, false, true, false, false, false, false, false, false, false, false, false, false, false, false, false, false, false, false, false ] ], "method": "restyle" }, { "args": [ "visible", [ false, false, false, false, false, false, false, false, false, false, false, false, false, false, false, false, false, false, false, false, false, false, false, false, false, false, false, false, false, false, false, false, false, true, false, false, false, false, false, false, false, false, false, false, false, false, false, false, false, false ] ], "method": "restyle" }, { "args": [ "visible", [ false, false, false, false, false, false, false, false, false, false, false, false, false, false, false, false, false, false, false, false, false, false, false, false, false, false, false, false, false, false, false, false, false, false, true, false, false, false, false, false, false, false, false, false, false, false, false, false, false, false ] ], "method": "restyle" }, { "args": [ "visible", [ false, false, false, false, false, false, false, false, false, false, false, false, false, false, false, false, false, false, false, false, false, false, false, false, false, false, false, false, false, false, false, false, false, false, false, true, false, false, false, false, false, false, false, false, false, false, false, false, false, false ] ], "method": "restyle" }, { "args": [ "visible", [ false, false, false, false, false, false, false, false, false, false, false, false, false, false, false, false, false, false, false, false, false, false, false, false, false, false, false, false, false, false, false, false, false, false, false, false, true, false, false, false, false, false, false, false, false, false, false, false, false, false ] ], "method": "restyle" }, { "args": [ "visible", [ false, false, false, false, false, false, false, false, false, false, false, false, false, false, false, false, false, false, false, false, false, false, false, false, false, false, false, false, false, false, false, false, false, false, false, false, false, true, false, false, false, false, false, false, false, false, false, false, false, false ] ], "method": "restyle" }, { "args": [ "visible", [ false, false, false, false, false, false, false, false, false, false, false, false, false, false, false, false, false, false, false, false, false, false, false, false, false, false, false, false, false, false, false, false, false, false, false, false, false, false, true, false, false, false, false, false, false, false, false, false, false, false ] ], "method": "restyle" }, { "args": [ "visible", [ false, false, false, false, false, false, false, false, false, false, false, false, false, false, false, false, false, false, false, false, false, false, false, false, false, false, false, false, false, false, false, false, false, false, false, false, false, false, false, true, false, false, false, false, false, false, false, false, false, false ] ], "method": "restyle" }, { "args": [ "visible", [ false, false, false, false, false, false, false, false, false, false, false, false, false, false, false, false, false, false, false, false, false, false, false, false, false, false, false, false, false, false, false, false, false, false, false, false, false, false, false, false, true, false, false, false, false, false, false, false, false, false ] ], "method": "restyle" }, { "args": [ "visible", [ false, false, false, false, false, false, false, false, false, false, false, false, false, false, false, false, false, false, false, false, false, false, false, false, false, false, false, false, false, false, false, false, false, false, false, false, false, false, false, false, false, true, false, false, false, false, false, false, false, false ] ], "method": "restyle" }, { "args": [ "visible", [ false, false, false, false, false, false, false, false, false, false, false, false, false, false, false, false, false, false, false, false, false, false, false, false, false, false, false, false, false, false, false, false, false, false, false, false, false, false, false, false, false, false, true, false, false, false, false, false, false, false ] ], "method": "restyle" }, { "args": [ "visible", [ false, false, false, false, false, false, false, false, false, false, false, false, false, false, false, false, false, false, false, false, false, false, false, false, false, false, false, false, false, false, false, false, false, false, false, false, false, false, false, false, false, false, false, true, false, false, false, false, false, false ] ], "method": "restyle" }, { "args": [ "visible", [ false, false, false, false, false, false, false, false, false, false, false, false, false, false, false, false, false, false, false, false, false, false, false, false, false, false, false, false, false, false, false, false, false, false, false, false, false, false, false, false, false, false, false, false, true, false, false, false, false, false ] ], "method": "restyle" }, { "args": [ "visible", [ false, false, false, false, false, false, false, false, false, false, false, false, false, false, false, false, false, false, false, false, false, false, false, false, false, false, false, false, false, false, false, false, false, false, false, false, false, false, false, false, false, false, false, false, false, true, false, false, false, false ] ], "method": "restyle" }, { "args": [ "visible", [ false, false, false, false, false, false, false, false, false, false, false, false, false, false, false, false, false, false, false, false, false, false, false, false, false, false, false, false, false, false, false, false, false, false, false, false, false, false, false, false, false, false, false, false, false, false, true, false, false, false ] ], "method": "restyle" }, { "args": [ "visible", [ false, false, false, false, false, false, false, false, false, false, false, false, false, false, false, false, false, false, false, false, false, false, false, false, false, false, false, false, false, false, false, false, false, false, false, false, false, false, false, false, false, false, false, false, false, false, false, true, false, false ] ], "method": "restyle" }, { "args": [ "visible", [ false, false, false, false, false, false, false, false, false, false, false, false, false, false, false, false, false, false, false, false, false, false, false, false, false, false, false, false, false, false, false, false, false, false, false, false, false, false, false, false, false, false, false, false, false, false, false, false, true, false ] ], "method": "restyle" }, { "args": [ "visible", [ false, false, false, false, false, false, false, false, false, false, false, false, false, false, false, false, false, false, false, false, false, false, false, false, false, false, false, false, false, false, false, false, false, false, false, false, false, false, false, false, false, false, false, false, false, false, false, false, false, true ] ], "method": "restyle" } ], "active": 10, "currentvalue": { "prefix": "Frequency: " } } ], "template": { "data": { "bar": [ { "type": "bar", "marker": { "line": { "color": "#E5ECF6", "width": 0.5 } } } ], "table": [ { "type": "table", "cells": { "fill": { "color": "#EBF0F8" }, "line": { "color": "white" } }, "header": { "fill": { "color": "#C8D4E3" }, "line": { "color": "white" } } } ], "carpet": [ { "type": "carpet", "aaxis": { "gridcolor": "white", "linecolor": "white", "endlinecolor": "#2a3f5f", "minorgridcolor": "white", "startlinecolor": "#2a3f5f" }, "baxis": { "gridcolor": "white", "linecolor": "white", "endlinecolor": "#2a3f5f", "minorgridcolor": "white", "startlinecolor": "#2a3f5f" } } ], "mesh3d": [ { "type": "mesh3d", "colorbar": { "ticks": "", "outlinewidth": 0 } } ], "contour": [ { "type": "contour", "colorbar": { "ticks": "", "outlinewidth": 0 }, "colorscale": [ [ 0.0, "#0d0887" ], [ 0.1111111111111111, "#46039f" ], [ 0.2222222222222222, "#7201a8" ], [ 0.3333333333333333, "#9c179e" ], [ 0.4444444444444444, "#bd3786" ], [ 0.5555555555555556, "#d8576b" ], [ 0.6666666666666666, "#ed7953" ], [ 0.7777777777777778, "#fb9f3a" ], [ 0.8888888888888888, "#fdca26" ], [ 1.0, "#f0f921" ] ] } ], "heatmap": [ { "type": "heatmap", "colorbar": { "ticks": "", "outlinewidth": 0 }, "colorscale": [ [ 0.0, "#0d0887" ], [ 0.1111111111111111, "#46039f" ], [ 0.2222222222222222, "#7201a8" ], [ 0.3333333333333333, "#9c179e" ], [ 0.4444444444444444, "#bd3786" ], [ 0.5555555555555556, "#d8576b" ], [ 0.6666666666666666, "#ed7953" ], [ 0.7777777777777778, "#fb9f3a" ], [ 0.8888888888888888, "#fdca26" ], [ 1.0, "#f0f921" ] ] } ], "scatter": [ { "type": "scatter", "marker": { "colorbar": { "ticks": "", "outlinewidth": 0 } } } ], "surface": [ { "type": "surface", "colorbar": { "ticks": "", "outlinewidth": 0 } } ], "barpolar": [ { "type": "barpolar", "marker": { "line": { "color": "#E5ECF6", "width": 0.5 } } } ], "heatmapgl": [ { "type": "heatmapgl", "colorbar": { "ticks": "", "outlinewidth": 0 } } ], "histogram": [ { "type": "histogram", "marker": { "colorbar": { "ticks": "", "outlinewidth": 0 } } } ], "parcoords": [ { "line": { "colorbar": { "ticks": "", "outlinewidth": 0 } }, "type": "parcoords" } ], "scatter3d": [ { "line": { "colorbar": { "ticks": "", "outlinewidth": 0 } }, "type": "scatter3d", "marker": { "colorbar": { "ticks": "", "outlinewidth": 0 } } } ], "scattergl": [ { "type": "scattergl", "marker": { "colorbar": { "ticks": "", "outlinewidth": 0 } } } ], "choropleth": [ { "type": "choropleth", "colorbar": { "ticks": "", "outlinewidth": 0 } } ], "scattergeo": [ { "type": "scattergeo", "marker": { "colorbar": { "ticks": "", "outlinewidth": 0 } } } ], "histogram2d": [ { "type": "histogram2d", "colorbar": { "ticks": "", "outlinewidth": 0 }, "colorscale": [ [ 0.0, "#0d0887" ], [ 0.1111111111111111, "#46039f" ], [ 0.2222222222222222, "#7201a8" ], [ 0.3333333333333333, "#9c179e" ], [ 0.4444444444444444, "#bd3786" ], [ 0.5555555555555556, "#d8576b" ], [ 0.6666666666666666, "#ed7953" ], [ 0.7777777777777778, "#fb9f3a" ], [ 0.8888888888888888, "#fdca26" ], [ 1.0, "#f0f921" ] ] } ], "scatterpolar": [ { "type": "scatterpolar", "marker": { "colorbar": { "ticks": "", "outlinewidth": 0 } } } ], "contourcarpet": [ { "type": "contourcarpet", "colorbar": { "ticks": "", "outlinewidth": 0 } } ], "scattercarpet": [ { "type": "scattercarpet", "marker": { "colorbar": { "ticks": "", "outlinewidth": 0 } } } ], "scattermapbox": [ { "type": "scattermapbox", "marker": { "colorbar": { "ticks": "", "outlinewidth": 0 } } } ], "scatterpolargl": [ { "type": "scatterpolargl", "marker": { "colorbar": { "ticks": "", "outlinewidth": 0 } } } ], "scatterternary": [ { "type": "scatterternary", "marker": { "colorbar": { "ticks": "", "outlinewidth": 0 } } } ], "histogram2dcontour": [ { "type": "histogram2dcontour", "colorbar": { "ticks": "", "outlinewidth": 0 }, "colorscale": [ [ 0.0, "#0d0887" ], [ 0.1111111111111111, "#46039f" ], [ 0.2222222222222222, "#7201a8" ], [ 0.3333333333333333, "#9c179e" ], [ 0.4444444444444444, "#bd3786" ], [ 0.5555555555555556, "#d8576b" ], [ 0.6666666666666666, "#ed7953" ], [ 0.7777777777777778, "#fb9f3a" ], [ 0.8888888888888888, "#fdca26" ], [ 1.0, "#f0f921" ] ] } ] }, "layout": { "geo": { "bgcolor": "white", "showland": true, "lakecolor": "white", "landcolor": "#E5ECF6", "showlakes": true, "subunitcolor": "white" }, "font": { "color": "#2a3f5f" }, "polar": { "bgcolor": "#E5ECF6", "radialaxis": { "ticks": "", "gridcolor": "white", "linecolor": "white" }, "angularaxis": { "ticks": "", "gridcolor": "white", "linecolor": "white" } }, "scene": { "xaxis": { "ticks": "", "gridcolor": "white", "gridwidth": 2, "linecolor": "white", "zerolinecolor": "white", "showbackground": true, "backgroundcolor": "#E5ECF6" }, "yaxis": { "ticks": "", "gridcolor": "white", "gridwidth": 2, "linecolor": "white", "zerolinecolor": "white", "showbackground": true, "backgroundcolor": "#E5ECF6" }, "zaxis": { "ticks": "", "gridcolor": "white", "gridwidth": 2, "linecolor": "white", "zerolinecolor": "white", "showbackground": true, "backgroundcolor": "#E5ECF6" } }, "title": { "x": 0.05 }, "xaxis": { "ticks": "", "gridcolor": "white", "linecolor": "white", "automargin": true, "zerolinecolor": "white", "zerolinewidth": 2 }, "yaxis": { "ticks": "", "gridcolor": "white", "linecolor": "white", "automargin": true, "zerolinecolor": "white", "zerolinewidth": 2 }, "mapbox": { "style": "light" }, "ternary": { "aaxis": { "ticks": "", "gridcolor": "white", "linecolor": "white" }, "baxis": { "ticks": "", "gridcolor": "white", "linecolor": "white" }, "caxis": { "ticks": "", "gridcolor": "white", "linecolor": "white" }, "bgcolor": "#E5ECF6" }, "colorway": [ "#636efa", "#EF553B", "#00cc96", "#ab63fa", "#FFA15A", "#19d3f3", "#FF6692", "#B6E880", "#FF97FF", "#FECB52" ], "hovermode": "closest", "colorscale": { "diverging": [ [ 0, "#8e0152" ], [ 0.1, "#c51b7d" ], [ 0.2, "#de77ae" ], [ 0.3, "#f1b6da" ], [ 0.4, "#fde0ef" ], [ 0.5, "#f7f7f7" ], [ 0.6, "#e6f5d0" ], [ 0.7, "#b8e186" ], [ 0.8, "#7fbc41" ], [ 0.9, "#4d9221" ], [ 1, "#276419" ] ], "sequential": [ [ 0.0, "#0d0887" ], [ 0.1111111111111111, "#46039f" ], [ 0.2222222222222222, "#7201a8" ], [ 0.3333333333333333, "#9c179e" ], [ 0.4444444444444444, "#bd3786" ], [ 0.5555555555555556, "#d8576b" ], [ 0.6666666666666666, "#ed7953" ], [ 0.7777777777777778, "#fb9f3a" ], [ 0.8888888888888888, "#fdca26" ], [ 1.0, "#f0f921" ] ], "sequentialminus": [ [ 0.0, "#0d0887" ], [ 0.1111111111111111, "#46039f" ], [ 0.2222222222222222, "#7201a8" ], [ 0.3333333333333333, "#9c179e" ], [ 0.4444444444444444, "#bd3786" ], [ 0.5555555555555556, "#d8576b" ], [ 0.6666666666666666, "#ed7953" ], [ 0.7777777777777778, "#fb9f3a" ], [ 0.8888888888888888, "#fdca26" ], [ 1.0, "#f0f921" ] ] }, "hoverlabel": { "align": "left" }, "plot_bgcolor": "#E5ECF6", "paper_bgcolor": "white", "shapedefaults": { "line": { "width": 0 }, "opacity": 0.4, "fillcolor": "#506784" }, "annotationdefaults": { "arrowhead": 0, "arrowcolor": "#506784", "arrowwidth": 1 } } } } }, "height": null, "width": null, "user": { "profile_url": "https://plotly.com/~PythonPlotBot", "avatar_url": "https://storage.googleapis.com/plotly-prod-profiles/15.jpg", "background_url": "https://storage.googleapis.com/plotly-prod-profiles/bg-14.jpg", "bio": "", "nickname": "", "website": "", "stream_tokens": null, "feature_set_id": null, "csrf_token": null, "date_joined": "2017-02-14 21:07:30", "mapbox_access_tokens": null, "has_password": null, "username": "PythonPlotBot", "email": null, "is_active": null, "readonly": null, "is_dash_creator": null, "dash_created_count": null, "is_chart_creator": null, "charts_created_count": null } }, { "creation_time": "2017-07-07T15:46:18.767354Z", "comments": { "results": [], "count": 0 }, "parented": true, "embed_url": "https://plotly.com/~kweatherston/60.embed", "fid": "kweatherston:60", "filename": "Volusion", "filetype": "plot", "img_url": "https://storage.googleapis.com/plotly-prod-images/kweatherston/60/9_MY1WP4FM58CSY859BWZFG5XI9TZXTQ.png", "image_urls": { "default": "https://storage.googleapis.com/plotly-prod-images/kweatherston%2F60%2F2_QGF0SKRZXE7A678CGL17OW1TOB7QNV.png", "block-thumb": "https://storage.googleapis.com/plotly-prod-images/kweatherston%2F60%2F8_V2JJXK905RCOO5WSTWNC5OAS7G26BU.png", "list-thumb": "https://storage.googleapis.com/plotly-prod-images/kweatherston/60/9_MY1WP4FM58CSY859BWZFG5XI9TZXTQ.png" }, "api_urls": { "files": "https://api.plotly.com/v2/files/kweatherston:60", "plots": "https://api.plotly.com/v2/plots/kweatherston:60", "parent": "https://api.plotly.com/v2/folders/home?user=kweatherston" }, "owner": "kweatherston", "parent": -1, "preview": "", "referencers": [], "references": [], "title": "Volusion Transactions/Day (last update: 2017-07-07 08:46:00)", "views": 862581, "web_url": "https://plotly.com/~kweatherston/60/volusion-transactionsday-last-update-2017-07-07-084600/", "world_readable": true, "date_modified": "2017-07-07T15:46:19.410Z", "stars": { "results": [], "count": 0 }, "collaborators": { "results": [], "count": 0 }, "subfolder_count": null, "refresh_interval": null, "organize_view_url": "https://plotly.com/~kweatherston/60/", "current_user_permission": "read", "is_theme": null, "is_template": null, "autosize": true, "caption": "", "figure": { "data": [ { "name": "approved", "type": "scatter", "xsrc": "kweatherston:4818:fb2e8a", "ysrc": "kweatherston:4818:cf8021" }, { "name": "declined", "type": "scatter", "xsrc": "kweatherston:4818:fb2e8a", "ysrc": "kweatherston:4818:8c3053" } ], "layout": { "title": "Volusion Transactions/Day (last update: 2017-07-07 08:46:00)", "barmode": "stack" } }, "height": null, "width": null, "user": { "profile_url": "https://plotly.com/~kweatherston", "avatar_url": "https://storage.googleapis.com/plotly-prod-profiles/79.jpg", "background_url": "https://storage.googleapis.com/plotly-prod-profiles/bg-9.jpg", "bio": "", "nickname": "", "website": "", "stream_tokens": null, "feature_set_id": null, "csrf_token": null, "date_joined": "2017-05-10 19:15:18", "mapbox_access_tokens": null, "has_password": null, "username": "kweatherston", "email": null, "is_active": null, "readonly": null, "is_dash_creator": null, "dash_created_count": null, "is_chart_creator": null, "charts_created_count": null } }, { "creation_time": "2018-04-27T05:54:32.465983Z", "comments": { "results": [], "count": 0 }, "parented": true, "embed_url": "https://plotly.com/~PythonPlotBot/2675.embed", "fid": "PythonPlotBot:2675", "filename": "jupyter-parametric_plot", "filetype": "plot", "img_url": "https://storage.googleapis.com/plotly-prod-images/PythonPlotBot/2675/9_L3Z6XT89GCK798M7DAZ3S23EFNMGCF.png", "image_urls": { "default": "https://storage.googleapis.com/plotly-prod-images/PythonPlotBot/2675/2_DFIDU5MUO3EQWGT3CN9DPPMCSQXC8M.png", "block-thumb": "https://storage.googleapis.com/plotly-prod-images/PythonPlotBot/2675/8_Q529VA1TP8CI1NXVHQ727JOWF8WD36.png", "list-thumb": "https://storage.googleapis.com/plotly-prod-images/PythonPlotBot/2675/9_L3Z6XT89GCK798M7DAZ3S23EFNMGCF.png" }, "api_urls": { "files": "https://api.plotly.com/v2/files/PythonPlotBot:2675", "plots": "https://api.plotly.com/v2/plots/PythonPlotBot:2675", "parent": "https://api.plotly.com/v2/folders/home?user=PythonPlotBot" }, "owner": "PythonPlotBot", "parent": -1, "preview": "", "referencers": [], "references": [], "title": "Parametric Plot", "views": 849329, "web_url": "https://plotly.com/~PythonPlotBot/2675/parametric-plot/", "world_readable": true, "date_modified": "2019-07-08T16:37:04.610Z", "stars": { "results": [], "count": 0 }, "collaborators": { "results": [], "count": 0 }, "subfolder_count": null, "refresh_interval": null, "organize_view_url": "https://plotly.com/~PythonPlotBot/2675/", "current_user_permission": "read", "is_theme": null, "is_template": null, "autosize": true, "caption": "", "figure": { "data": [ { "type": "surface", "xsrc": "PythonPlotBot:3546:39d353", "ysrc": "PythonPlotBot:3546:3455b9", "zsrc": "PythonPlotBot:3546:43220f" } ], "layout": { "scene": { "xaxis": { "gridcolor": "rgb(255, 255, 255)", "zerolinecolor": "rgb(255, 255, 255)", "showbackground": true, "backgroundcolor": "rgb(230, 230,230)" }, "yaxis": { "gridcolor": "rgb(255, 255, 255)", "zerolinecolor": "rgb(255, 255, 255)", "showbackground": true, "backgroundcolor": "rgb(230, 230,230)" }, "zaxis": { "gridcolor": "rgb(255, 255, 255)", "zerolinecolor": "rgb(255, 255, 255)", "showbackground": true, "backgroundcolor": "rgb(230, 230,230)" } }, "title": { "text": "Parametric Plot" }, "template": { "data": { "bar": [ { "type": "bar", "marker": { "line": { "color": "#E5ECF6", "width": 0.5 } } } ], "table": [ { "type": "table", "cells": { "fill": { "color": "#EBF0F8" }, "line": { "color": "white" } }, "header": { "fill": { "color": "#C8D4E3" }, "line": { "color": "white" } } } ], "carpet": [ { "type": "carpet", "aaxis": { "gridcolor": "white", "linecolor": "white", "endlinecolor": "#2a3f5f", "minorgridcolor": "white", "startlinecolor": "#2a3f5f" }, "baxis": { "gridcolor": "white", "linecolor": "white", "endlinecolor": "#2a3f5f", "minorgridcolor": "white", "startlinecolor": "#2a3f5f" } } ], "mesh3d": [ { "type": "mesh3d", "colorbar": { "ticks": "", "outlinewidth": 0 } } ], "contour": [ { "type": "contour", "colorbar": { "ticks": "", "outlinewidth": 0 }, "colorscale": [ [ 0.0, "#0d0887" ], [ 0.1111111111111111, "#46039f" ], [ 0.2222222222222222, "#7201a8" ], [ 0.3333333333333333, "#9c179e" ], [ 0.4444444444444444, "#bd3786" ], [ 0.5555555555555556, "#d8576b" ], [ 0.6666666666666666, "#ed7953" ], [ 0.7777777777777778, "#fb9f3a" ], [ 0.8888888888888888, "#fdca26" ], [ 1.0, "#f0f921" ] ] } ], "heatmap": [ { "type": "heatmap", "colorbar": { "ticks": "", "outlinewidth": 0 }, "colorscale": [ [ 0.0, "#0d0887" ], [ 0.1111111111111111, "#46039f" ], [ 0.2222222222222222, "#7201a8" ], [ 0.3333333333333333, "#9c179e" ], [ 0.4444444444444444, "#bd3786" ], [ 0.5555555555555556, "#d8576b" ], [ 0.6666666666666666, "#ed7953" ], [ 0.7777777777777778, "#fb9f3a" ], [ 0.8888888888888888, "#fdca26" ], [ 1.0, "#f0f921" ] ] } ], "scatter": [ { "type": "scatter", "marker": { "colorbar": { "ticks": "", "outlinewidth": 0 } } } ], "surface": [ { "type": "surface", "colorbar": { "ticks": "", "outlinewidth": 0 } } ], "barpolar": [ { "type": "barpolar", "marker": { "line": { "color": "#E5ECF6", "width": 0.5 } } } ], "heatmapgl": [ { "type": "heatmapgl", "colorbar": { "ticks": "", "outlinewidth": 0 } } ], "histogram": [ { "type": "histogram", "marker": { "colorbar": { "ticks": "", "outlinewidth": 0 } } } ], "parcoords": [ { "line": { "colorbar": { "ticks": "", "outlinewidth": 0 } }, "type": "parcoords" } ], "scatter3d": [ { "line": { "colorbar": { "ticks": "", "outlinewidth": 0 } }, "type": "scatter3d", "marker": { "colorbar": { "ticks": "", "outlinewidth": 0 } } } ], "scattergl": [ { "type": "scattergl", "marker": { "colorbar": { "ticks": "", "outlinewidth": 0 } } } ], "choropleth": [ { "type": "choropleth", "colorbar": { "ticks": "", "outlinewidth": 0 } } ], "scattergeo": [ { "type": "scattergeo", "marker": { "colorbar": { "ticks": "", "outlinewidth": 0 } } } ], "histogram2d": [ { "type": "histogram2d", "colorbar": { "ticks": "", "outlinewidth": 0 }, "colorscale": [ [ 0.0, "#0d0887" ], [ 0.1111111111111111, "#46039f" ], [ 0.2222222222222222, "#7201a8" ], [ 0.3333333333333333, "#9c179e" ], [ 0.4444444444444444, "#bd3786" ], [ 0.5555555555555556, "#d8576b" ], [ 0.6666666666666666, "#ed7953" ], [ 0.7777777777777778, "#fb9f3a" ], [ 0.8888888888888888, "#fdca26" ], [ 1.0, "#f0f921" ] ] } ], "scatterpolar": [ { "type": "scatterpolar", "marker": { "colorbar": { "ticks": "", "outlinewidth": 0 } } } ], "contourcarpet": [ { "type": "contourcarpet", "colorbar": { "ticks": "", "outlinewidth": 0 } } ], "scattercarpet": [ { "type": "scattercarpet", "marker": { "colorbar": { "ticks": "", "outlinewidth": 0 } } } ], "scattermapbox": [ { "type": "scattermapbox", "marker": { "colorbar": { "ticks": "", "outlinewidth": 0 } } } ], "scatterpolargl": [ { "type": "scatterpolargl", "marker": { "colorbar": { "ticks": "", "outlinewidth": 0 } } } ], "scatterternary": [ { "type": "scatterternary", "marker": { "colorbar": { "ticks": "", "outlinewidth": 0 } } } ], "histogram2dcontour": [ { "type": "histogram2dcontour", "colorbar": { "ticks": "", "outlinewidth": 0 }, "colorscale": [ [ 0.0, "#0d0887" ], [ 0.1111111111111111, "#46039f" ], [ 0.2222222222222222, "#7201a8" ], [ 0.3333333333333333, "#9c179e" ], [ 0.4444444444444444, "#bd3786" ], [ 0.5555555555555556, "#d8576b" ], [ 0.6666666666666666, "#ed7953" ], [ 0.7777777777777778, "#fb9f3a" ], [ 0.8888888888888888, "#fdca26" ], [ 1.0, "#f0f921" ] ] } ] }, "layout": { "geo": { "bgcolor": "white", "showland": true, "lakecolor": "white", "landcolor": "#E5ECF6", "showlakes": true, "subunitcolor": "white" }, "font": { "color": "#2a3f5f" }, "polar": { "bgcolor": "#E5ECF6", "radialaxis": { "ticks": "", "gridcolor": "white", "linecolor": "white" }, "angularaxis": { "ticks": "", "gridcolor": "white", "linecolor": "white" } }, "scene": { "xaxis": { "ticks": "", "gridcolor": "white", "gridwidth": 2, "linecolor": "white", "zerolinecolor": "white", "showbackground": true, "backgroundcolor": "#E5ECF6" }, "yaxis": { "ticks": "", "gridcolor": "white", "gridwidth": 2, "linecolor": "white", "zerolinecolor": "white", "showbackground": true, "backgroundcolor": "#E5ECF6" }, "zaxis": { "ticks": "", "gridcolor": "white", "gridwidth": 2, "linecolor": "white", "zerolinecolor": "white", "showbackground": true, "backgroundcolor": "#E5ECF6" } }, "title": { "x": 0.05 }, "xaxis": { "ticks": "", "gridcolor": "white", "linecolor": "white", "automargin": true, "zerolinecolor": "white", "zerolinewidth": 2 }, "yaxis": { "ticks": "", "gridcolor": "white", "linecolor": "white", "automargin": true, "zerolinecolor": "white", "zerolinewidth": 2 }, "mapbox": { "style": "light" }, "ternary": { "aaxis": { "ticks": "", "gridcolor": "white", "linecolor": "white" }, "baxis": { "ticks": "", "gridcolor": "white", "linecolor": "white" }, "caxis": { "ticks": "", "gridcolor": "white", "linecolor": "white" }, "bgcolor": "#E5ECF6" }, "colorway": [ "#636efa", "#EF553B", "#00cc96", "#ab63fa", "#FFA15A", "#19d3f3", "#FF6692", "#B6E880", "#FF97FF", "#FECB52" ], "hovermode": "closest", "colorscale": { "diverging": [ [ 0, "#8e0152" ], [ 0.1, "#c51b7d" ], [ 0.2, "#de77ae" ], [ 0.3, "#f1b6da" ], [ 0.4, "#fde0ef" ], [ 0.5, "#f7f7f7" ], [ 0.6, "#e6f5d0" ], [ 0.7, "#b8e186" ], [ 0.8, "#7fbc41" ], [ 0.9, "#4d9221" ], [ 1, "#276419" ] ], "sequential": [ [ 0.0, "#0d0887" ], [ 0.1111111111111111, "#46039f" ], [ 0.2222222222222222, "#7201a8" ], [ 0.3333333333333333, "#9c179e" ], [ 0.4444444444444444, "#bd3786" ], [ 0.5555555555555556, "#d8576b" ], [ 0.6666666666666666, "#ed7953" ], [ 0.7777777777777778, "#fb9f3a" ], [ 0.8888888888888888, "#fdca26" ], [ 1.0, "#f0f921" ] ], "sequentialminus": [ [ 0.0, "#0d0887" ], [ 0.1111111111111111, "#46039f" ], [ 0.2222222222222222, "#7201a8" ], [ 0.3333333333333333, "#9c179e" ], [ 0.4444444444444444, "#bd3786" ], [ 0.5555555555555556, "#d8576b" ], [ 0.6666666666666666, "#ed7953" ], [ 0.7777777777777778, "#fb9f3a" ], [ 0.8888888888888888, "#fdca26" ], [ 1.0, "#f0f921" ] ] }, "hoverlabel": { "align": "left" }, "plot_bgcolor": "#E5ECF6", "paper_bgcolor": "white", "shapedefaults": { "line": { "width": 0 }, "opacity": 0.4, "fillcolor": "#506784" }, "annotationdefaults": { "arrowhead": 0, "arrowcolor": "#506784", "arrowwidth": 1 } } } } }, "height": null, "width": null, "user": { "profile_url": "https://plotly.com/~PythonPlotBot", "avatar_url": "https://storage.googleapis.com/plotly-prod-profiles/15.jpg", "background_url": "https://storage.googleapis.com/plotly-prod-profiles/bg-14.jpg", "bio": "", "nickname": "", "website": "", "stream_tokens": null, "feature_set_id": null, "csrf_token": null, "date_joined": "2017-02-14 21:07:30", "mapbox_access_tokens": null, "has_password": null, "username": "PythonPlotBot", "email": null, "is_active": null, "readonly": null, "is_dash_creator": null, "dash_created_count": null, "is_chart_creator": null, "charts_created_count": null } }, { "creation_time": "2018-04-27T05:53:08.502565Z", "comments": { "results": [], "count": 0 }, "parented": true, "embed_url": "https://plotly.com/~PythonPlotBot/2669.embed", "fid": "PythonPlotBot:2669", "filename": "jupyter-basic_bar", "filetype": "plot", "img_url": "https://storage.googleapis.com/plotly-prod-images/PythonPlotBot/2669/9_ZOE7R5SFO6C0C5Z7WZ7D80GRYTYOK1.png", "image_urls": { "default": "https://storage.googleapis.com/plotly-prod-images/PythonPlotBot/2669/2_A5EXKPZXZ68KA7F59AVL37HTXRBEKZ.png", "block-thumb": "https://storage.googleapis.com/plotly-prod-images/PythonPlotBot/2669/8_Z8IV4Y62QTMKVAC3L20U51SH3XBJZK.png", "list-thumb": "https://storage.googleapis.com/plotly-prod-images/PythonPlotBot/2669/9_ZOE7R5SFO6C0C5Z7WZ7D80GRYTYOK1.png" }, "api_urls": { "files": "https://api.plotly.com/v2/files/PythonPlotBot:2669", "plots": "https://api.plotly.com/v2/plots/PythonPlotBot:2669", "parent": "https://api.plotly.com/v2/folders/home?user=PythonPlotBot" }, "owner": "PythonPlotBot", "parent": -1, "preview": "", "referencers": [], "references": [], "title": "", "views": 848911, "web_url": "https://plotly.com/~PythonPlotBot/2669/", "world_readable": true, "date_modified": "2019-07-08T16:36:39.204Z", "stars": { "results": [ { "creator": { "profile_url": "https://plotly.com/~wenliuwen1", "avatar_url": "https://storage.googleapis.com/plotly-prod-profiles/32.jpg", "background_url": "https://storage.googleapis.com/plotly-prod-profiles/bg-0.jpg", "bio": "", "nickname": "", "website": "", "stream_tokens": null, "feature_set_id": null, "csrf_token": null, "date_joined": "2023-03-10 13:19:33", "mapbox_access_tokens": null, "has_password": null, "username": "wenliuwen1", "email": null, "is_active": null, "readonly": null, "is_dash_creator": null, "dash_created_count": null, "is_chart_creator": null, "charts_created_count": null } } ], "count": 1 }, "collaborators": { "results": [], "count": 0 }, "subfolder_count": null, "refresh_interval": null, "organize_view_url": "https://plotly.com/~PythonPlotBot/2669/", "current_user_permission": "read", "is_theme": null, "is_template": null, "autosize": true, "caption": "", "figure": { "data": [ { "type": "bar", "xsrc": "PythonPlotBot:3543:61e6fd", "ysrc": "PythonPlotBot:3543:1672d0" } ], "layout": { "template": { "data": { "bar": [ { "type": "bar", "marker": { "line": { "color": "#E5ECF6", "width": 0.5 } } } ], "table": [ { "type": "table", "cells": { "fill": { "color": "#EBF0F8" }, "line": { "color": "white" } }, "header": { "fill": { "color": "#C8D4E3" }, "line": { "color": "white" } } } ], "carpet": [ { "type": "carpet", "aaxis": { "gridcolor": "white", "linecolor": "white", "endlinecolor": "#2a3f5f", "minorgridcolor": "white", "startlinecolor": "#2a3f5f" }, "baxis": { "gridcolor": "white", "linecolor": "white", "endlinecolor": "#2a3f5f", "minorgridcolor": "white", "startlinecolor": "#2a3f5f" } } ], "mesh3d": [ { "type": "mesh3d", "colorbar": { "ticks": "", "outlinewidth": 0 } } ], "contour": [ { "type": "contour", "colorbar": { "ticks": "", "outlinewidth": 0 }, "colorscale": [ [ 0.0, "#0d0887" ], [ 0.1111111111111111, "#46039f" ], [ 0.2222222222222222, "#7201a8" ], [ 0.3333333333333333, "#9c179e" ], [ 0.4444444444444444, "#bd3786" ], [ 0.5555555555555556, "#d8576b" ], [ 0.6666666666666666, "#ed7953" ], [ 0.7777777777777778, "#fb9f3a" ], [ 0.8888888888888888, "#fdca26" ], [ 1.0, "#f0f921" ] ] } ], "heatmap": [ { "type": "heatmap", "colorbar": { "ticks": "", "outlinewidth": 0 }, "colorscale": [ [ 0.0, "#0d0887" ], [ 0.1111111111111111, "#46039f" ], [ 0.2222222222222222, "#7201a8" ], [ 0.3333333333333333, "#9c179e" ], [ 0.4444444444444444, "#bd3786" ], [ 0.5555555555555556, "#d8576b" ], [ 0.6666666666666666, "#ed7953" ], [ 0.7777777777777778, "#fb9f3a" ], [ 0.8888888888888888, "#fdca26" ], [ 1.0, "#f0f921" ] ] } ], "scatter": [ { "type": "scatter", "marker": { "colorbar": { "ticks": "", "outlinewidth": 0 } } } ], "surface": [ { "type": "surface", "colorbar": { "ticks": "", "outlinewidth": 0 } } ], "barpolar": [ { "type": "barpolar", "marker": { "line": { "color": "#E5ECF6", "width": 0.5 } } } ], "heatmapgl": [ { "type": "heatmapgl", "colorbar": { "ticks": "", "outlinewidth": 0 } } ], "histogram": [ { "type": "histogram", "marker": { "colorbar": { "ticks": "", "outlinewidth": 0 } } } ], "parcoords": [ { "line": { "colorbar": { "ticks": "", "outlinewidth": 0 } }, "type": "parcoords" } ], "scatter3d": [ { "line": { "colorbar": { "ticks": "", "outlinewidth": 0 } }, "type": "scatter3d", "marker": { "colorbar": { "ticks": "", "outlinewidth": 0 } } } ], "scattergl": [ { "type": "scattergl", "marker": { "colorbar": { "ticks": "", "outlinewidth": 0 } } } ], "choropleth": [ { "type": "choropleth", "colorbar": { "ticks": "", "outlinewidth": 0 } } ], "scattergeo": [ { "type": "scattergeo", "marker": { "colorbar": { "ticks": "", "outlinewidth": 0 } } } ], "histogram2d": [ { "type": "histogram2d", "colorbar": { "ticks": "", "outlinewidth": 0 }, "colorscale": [ [ 0.0, "#0d0887" ], [ 0.1111111111111111, "#46039f" ], [ 0.2222222222222222, "#7201a8" ], [ 0.3333333333333333, "#9c179e" ], [ 0.4444444444444444, "#bd3786" ], [ 0.5555555555555556, "#d8576b" ], [ 0.6666666666666666, "#ed7953" ], [ 0.7777777777777778, "#fb9f3a" ], [ 0.8888888888888888, "#fdca26" ], [ 1.0, "#f0f921" ] ] } ], "scatterpolar": [ { "type": "scatterpolar", "marker": { "colorbar": { "ticks": "", "outlinewidth": 0 } } } ], "contourcarpet": [ { "type": "contourcarpet", "colorbar": { "ticks": "", "outlinewidth": 0 } } ], "scattercarpet": [ { "type": "scattercarpet", "marker": { "colorbar": { "ticks": "", "outlinewidth": 0 } } } ], "scattermapbox": [ { "type": "scattermapbox", "marker": { "colorbar": { "ticks": "", "outlinewidth": 0 } } } ], "scatterpolargl": [ { "type": "scatterpolargl", "marker": { "colorbar": { "ticks": "", "outlinewidth": 0 } } } ], "scatterternary": [ { "type": "scatterternary", "marker": { "colorbar": { "ticks": "", "outlinewidth": 0 } } } ], "histogram2dcontour": [ { "type": "histogram2dcontour", "colorbar": { "ticks": "", "outlinewidth": 0 }, "colorscale": [ [ 0.0, "#0d0887" ], [ 0.1111111111111111, "#46039f" ], [ 0.2222222222222222, "#7201a8" ], [ 0.3333333333333333, "#9c179e" ], [ 0.4444444444444444, "#bd3786" ], [ 0.5555555555555556, "#d8576b" ], [ 0.6666666666666666, "#ed7953" ], [ 0.7777777777777778, "#fb9f3a" ], [ 0.8888888888888888, "#fdca26" ], [ 1.0, "#f0f921" ] ] } ] }, "layout": { "geo": { "bgcolor": "white", "showland": true, "lakecolor": "white", "landcolor": "#E5ECF6", "showlakes": true, "subunitcolor": "white" }, "font": { "color": "#2a3f5f" }, "polar": { "bgcolor": "#E5ECF6", "radialaxis": { "ticks": "", "gridcolor": "white", "linecolor": "white" }, "angularaxis": { "ticks": "", "gridcolor": "white", "linecolor": "white" } }, "scene": { "xaxis": { "ticks": "", "gridcolor": "white", "gridwidth": 2, "linecolor": "white", "zerolinecolor": "white", "showbackground": true, "backgroundcolor": "#E5ECF6" }, "yaxis": { "ticks": "", "gridcolor": "white", "gridwidth": 2, "linecolor": "white", "zerolinecolor": "white", "showbackground": true, "backgroundcolor": "#E5ECF6" }, "zaxis": { "ticks": "", "gridcolor": "white", "gridwidth": 2, "linecolor": "white", "zerolinecolor": "white", "showbackground": true, "backgroundcolor": "#E5ECF6" } }, "title": { "x": 0.05 }, "xaxis": { "ticks": "", "gridcolor": "white", "linecolor": "white", "automargin": true, "zerolinecolor": "white", "zerolinewidth": 2 }, "yaxis": { "ticks": "", "gridcolor": "white", "linecolor": "white", "automargin": true, "zerolinecolor": "white", "zerolinewidth": 2 }, "mapbox": { "style": "light" }, "ternary": { "aaxis": { "ticks": "", "gridcolor": "white", "linecolor": "white" }, "baxis": { "ticks": "", "gridcolor": "white", "linecolor": "white" }, "caxis": { "ticks": "", "gridcolor": "white", "linecolor": "white" }, "bgcolor": "#E5ECF6" }, "colorway": [ "#636efa", "#EF553B", "#00cc96", "#ab63fa", "#FFA15A", "#19d3f3", "#FF6692", "#B6E880", "#FF97FF", "#FECB52" ], "hovermode": "closest", "colorscale": { "diverging": [ [ 0, "#8e0152" ], [ 0.1, "#c51b7d" ], [ 0.2, "#de77ae" ], [ 0.3, "#f1b6da" ], [ 0.4, "#fde0ef" ], [ 0.5, "#f7f7f7" ], [ 0.6, "#e6f5d0" ], [ 0.7, "#b8e186" ], [ 0.8, "#7fbc41" ], [ 0.9, "#4d9221" ], [ 1, "#276419" ] ], "sequential": [ [ 0.0, "#0d0887" ], [ 0.1111111111111111, "#46039f" ], [ 0.2222222222222222, "#7201a8" ], [ 0.3333333333333333, "#9c179e" ], [ 0.4444444444444444, "#bd3786" ], [ 0.5555555555555556, "#d8576b" ], [ 0.6666666666666666, "#ed7953" ], [ 0.7777777777777778, "#fb9f3a" ], [ 0.8888888888888888, "#fdca26" ], [ 1.0, "#f0f921" ] ], "sequentialminus": [ [ 0.0, "#0d0887" ], [ 0.1111111111111111, "#46039f" ], [ 0.2222222222222222, "#7201a8" ], [ 0.3333333333333333, "#9c179e" ], [ 0.4444444444444444, "#bd3786" ], [ 0.5555555555555556, "#d8576b" ], [ 0.6666666666666666, "#ed7953" ], [ 0.7777777777777778, "#fb9f3a" ], [ 0.8888888888888888, "#fdca26" ], [ 1.0, "#f0f921" ] ] }, "hoverlabel": { "align": "left" }, "plot_bgcolor": "#E5ECF6", "paper_bgcolor": "white", "shapedefaults": { "line": { "width": 0 }, "opacity": 0.4, "fillcolor": "#506784" }, "annotationdefaults": { "arrowhead": 0, "arrowcolor": "#506784", "arrowwidth": 1 } } } } }, "height": null, "width": null, "user": { "profile_url": "https://plotly.com/~PythonPlotBot", "avatar_url": "https://storage.googleapis.com/plotly-prod-profiles/15.jpg", "background_url": "https://storage.googleapis.com/plotly-prod-profiles/bg-14.jpg", "bio": "", "nickname": "", "website": "", "stream_tokens": null, "feature_set_id": null, "csrf_token": null, "date_joined": "2017-02-14 21:07:30", "mapbox_access_tokens": null, "has_password": null, "username": "PythonPlotBot", "email": null, "is_active": null, "readonly": null, "is_dash_creator": null, "dash_created_count": null, "is_chart_creator": null, "charts_created_count": null } }, { "creation_time": "2018-04-27T05:53:06.993902Z", "comments": { "results": [], "count": 0 }, "parented": true, "embed_url": "https://plotly.com/~PythonPlotBot/2667.embed", "fid": "PythonPlotBot:2667", "filename": "jupyter-table1", "filetype": "plot", "img_url": "https://storage.googleapis.com/plotly-prod-images/PythonPlotBot/2667/9_5LYL4IN56V3WIW9VCSEXDUFVDB2HQ8.png", "image_urls": { "default": "https://storage.googleapis.com/plotly-prod-images/PythonPlotBot/2667/2_R3RQK6TMS6ATDP9QZEFS4DHM7DY2XN.png", "block-thumb": "https://storage.googleapis.com/plotly-prod-images/PythonPlotBot/2667/8_NI56M8YBEI809CZL4R60UM6RMJOWUC.png", "list-thumb": "https://storage.googleapis.com/plotly-prod-images/PythonPlotBot/2667/9_5LYL4IN56V3WIW9VCSEXDUFVDB2HQ8.png" }, "api_urls": { "files": "https://api.plotly.com/v2/files/PythonPlotBot:2667", "plots": "https://api.plotly.com/v2/plots/PythonPlotBot:2667", "parent": "https://api.plotly.com/v2/folders/home?user=PythonPlotBot" }, "owner": "PythonPlotBot", "parent": -1, "preview": "", "referencers": [], "references": [], "title": "", "views": 848569, "web_url": "https://plotly.com/~PythonPlotBot/2667/", "world_readable": true, "date_modified": "2019-07-08T16:36:32.743Z", "stars": { "results": [], "count": 0 }, "collaborators": { "results": [], "count": 0 }, "subfolder_count": null, "refresh_interval": null, "organize_view_url": "https://plotly.com/~PythonPlotBot/2667/", "current_user_permission": "read", "is_theme": null, "is_template": null, "autosize": true, "caption": "", "figure": { "data": [ { "type": "heatmap", "zsrc": "PythonPlotBot:3542:ea5e7a", "opacity": 0.75, "hoverinfo": "none", "showscale": false, "colorscale": [ [ 0, "#00083e" ], [ 0.5, "#ededee" ], [ 1, "#ffffff" ] ] } ], "layout": { "xaxis": { "dtick": 1, "tick0": -0.5, "ticks": "", "zeroline": false, "gridwidth": 2, "showticklabels": false }, "yaxis": { "dtick": 1, "tick0": 0.5, "ticks": "", "zeroline": false, "autorange": "reversed", "gridwidth": 2, "showticklabels": false }, "height": 710, "margin": { "b": 0, "l": 0, "r": 0, "t": 0 }, "template": { "data": { "bar": [ { "type": "bar", "marker": { "line": { "color": "#E5ECF6", "width": 0.5 } } } ], "table": [ { "type": "table", "cells": { "fill": { "color": "#EBF0F8" }, "line": { "color": "white" } }, "header": { "fill": { "color": "#C8D4E3" }, "line": { "color": "white" } } } ], "carpet": [ { "type": "carpet", "aaxis": { "gridcolor": "white", "linecolor": "white", "endlinecolor": "#2a3f5f", "minorgridcolor": "white", "startlinecolor": "#2a3f5f" }, "baxis": { "gridcolor": "white", "linecolor": "white", "endlinecolor": "#2a3f5f", "minorgridcolor": "white", "startlinecolor": "#2a3f5f" } } ], "mesh3d": [ { "type": "mesh3d", "colorbar": { "ticks": "", "outlinewidth": 0 } } ], "contour": [ { "type": "contour", "colorbar": { "ticks": "", "outlinewidth": 0 }, "colorscale": [ [ 0.0, "#0d0887" ], [ 0.1111111111111111, "#46039f" ], [ 0.2222222222222222, "#7201a8" ], [ 0.3333333333333333, "#9c179e" ], [ 0.4444444444444444, "#bd3786" ], [ 0.5555555555555556, "#d8576b" ], [ 0.6666666666666666, "#ed7953" ], [ 0.7777777777777778, "#fb9f3a" ], [ 0.8888888888888888, "#fdca26" ], [ 1.0, "#f0f921" ] ] } ], "heatmap": [ { "type": "heatmap", "colorbar": { "ticks": "", "outlinewidth": 0 }, "colorscale": [ [ 0.0, "#0d0887" ], [ 0.1111111111111111, "#46039f" ], [ 0.2222222222222222, "#7201a8" ], [ 0.3333333333333333, "#9c179e" ], [ 0.4444444444444444, "#bd3786" ], [ 0.5555555555555556, "#d8576b" ], [ 0.6666666666666666, "#ed7953" ], [ 0.7777777777777778, "#fb9f3a" ], [ 0.8888888888888888, "#fdca26" ], [ 1.0, "#f0f921" ] ] } ], "scatter": [ { "type": "scatter", "marker": { "colorbar": { "ticks": "", "outlinewidth": 0 } } } ], "surface": [ { "type": "surface", "colorbar": { "ticks": "", "outlinewidth": 0 } } ], "barpolar": [ { "type": "barpolar", "marker": { "line": { "color": "#E5ECF6", "width": 0.5 } } } ], "heatmapgl": [ { "type": "heatmapgl", "colorbar": { "ticks": "", "outlinewidth": 0 } } ], "histogram": [ { "type": "histogram", "marker": { "colorbar": { "ticks": "", "outlinewidth": 0 } } } ], "parcoords": [ { "line": { "colorbar": { "ticks": "", "outlinewidth": 0 } }, "type": "parcoords" } ], "scatter3d": [ { "line": { "colorbar": { "ticks": "", "outlinewidth": 0 } }, "type": "scatter3d", "marker": { "colorbar": { "ticks": "", "outlinewidth": 0 } } } ], "scattergl": [ { "type": "scattergl", "marker": { "colorbar": { "ticks": "", "outlinewidth": 0 } } } ], "choropleth": [ { "type": "choropleth", "colorbar": { "ticks": "", "outlinewidth": 0 } } ], "scattergeo": [ { "type": "scattergeo", "marker": { "colorbar": { "ticks": "", "outlinewidth": 0 } } } ], "histogram2d": [ { "type": "histogram2d", "colorbar": { "ticks": "", "outlinewidth": 0 }, "colorscale": [ [ 0.0, "#0d0887" ], [ 0.1111111111111111, "#46039f" ], [ 0.2222222222222222, "#7201a8" ], [ 0.3333333333333333, "#9c179e" ], [ 0.4444444444444444, "#bd3786" ], [ 0.5555555555555556, "#d8576b" ], [ 0.6666666666666666, "#ed7953" ], [ 0.7777777777777778, "#fb9f3a" ], [ 0.8888888888888888, "#fdca26" ], [ 1.0, "#f0f921" ] ] } ], "scatterpolar": [ { "type": "scatterpolar", "marker": { "colorbar": { "ticks": "", "outlinewidth": 0 } } } ], "contourcarpet": [ { "type": "contourcarpet", "colorbar": { "ticks": "", "outlinewidth": 0 } } ], "scattercarpet": [ { "type": "scattercarpet", "marker": { "colorbar": { "ticks": "", "outlinewidth": 0 } } } ], "scattermapbox": [ { "type": "scattermapbox", "marker": { "colorbar": { "ticks": "", "outlinewidth": 0 } } } ], "scatterpolargl": [ { "type": "scatterpolargl", "marker": { "colorbar": { "ticks": "", "outlinewidth": 0 } } } ], "scatterternary": [ { "type": "scatterternary", "marker": { "colorbar": { "ticks": "", "outlinewidth": 0 } } } ], "histogram2dcontour": [ { "type": "histogram2dcontour", "colorbar": { "ticks": "", "outlinewidth": 0 }, "colorscale": [ [ 0.0, "#0d0887" ], [ 0.1111111111111111, "#46039f" ], [ 0.2222222222222222, "#7201a8" ], [ 0.3333333333333333, "#9c179e" ], [ 0.4444444444444444, "#bd3786" ], [ 0.5555555555555556, "#d8576b" ], [ 0.6666666666666666, "#ed7953" ], [ 0.7777777777777778, "#fb9f3a" ], [ 0.8888888888888888, "#fdca26" ], [ 1.0, "#f0f921" ] ] } ] }, "layout": { "geo": { "bgcolor": "white", "showland": true, "lakecolor": "white", "landcolor": "#E5ECF6", "showlakes": true, "subunitcolor": "white" }, "font": { "color": "#2a3f5f" }, "polar": { "bgcolor": "#E5ECF6", "radialaxis": { "ticks": "", "gridcolor": "white", "linecolor": "white" }, "angularaxis": { "ticks": "", "gridcolor": "white", "linecolor": "white" } }, "scene": { "xaxis": { "ticks": "", "gridcolor": "white", "gridwidth": 2, "linecolor": "white", "zerolinecolor": "white", "showbackground": true, "backgroundcolor": "#E5ECF6" }, "yaxis": { "ticks": "", "gridcolor": "white", "gridwidth": 2, "linecolor": "white", "zerolinecolor": "white", "showbackground": true, "backgroundcolor": "#E5ECF6" }, "zaxis": { "ticks": "", "gridcolor": "white", "gridwidth": 2, "linecolor": "white", "zerolinecolor": "white", "showbackground": true, "backgroundcolor": "#E5ECF6" } }, "title": { "x": 0.05 }, "xaxis": { "ticks": "", "gridcolor": "white", "linecolor": "white", "automargin": true, "zerolinecolor": "white", "zerolinewidth": 2 }, "yaxis": { "ticks": "", "gridcolor": "white", "linecolor": "white", "automargin": true, "zerolinecolor": "white", "zerolinewidth": 2 }, "mapbox": { "style": "light" }, "ternary": { "aaxis": { "ticks": "", "gridcolor": "white", "linecolor": "white" }, "baxis": { "ticks": "", "gridcolor": "white", "linecolor": "white" }, "caxis": { "ticks": "", "gridcolor": "white", "linecolor": "white" }, "bgcolor": "#E5ECF6" }, "colorway": [ "#636efa", "#EF553B", "#00cc96", "#ab63fa", "#FFA15A", "#19d3f3", "#FF6692", "#B6E880", "#FF97FF", "#FECB52" ], "hovermode": "closest", "colorscale": { "diverging": [ [ 0, "#8e0152" ], [ 0.1, "#c51b7d" ], [ 0.2, "#de77ae" ], [ 0.3, "#f1b6da" ], [ 0.4, "#fde0ef" ], [ 0.5, "#f7f7f7" ], [ 0.6, "#e6f5d0" ], [ 0.7, "#b8e186" ], [ 0.8, "#7fbc41" ], [ 0.9, "#4d9221" ], [ 1, "#276419" ] ], "sequential": [ [ 0.0, "#0d0887" ], [ 0.1111111111111111, "#46039f" ], [ 0.2222222222222222, "#7201a8" ], [ 0.3333333333333333, "#9c179e" ], [ 0.4444444444444444, "#bd3786" ], [ 0.5555555555555556, "#d8576b" ], [ 0.6666666666666666, "#ed7953" ], [ 0.7777777777777778, "#fb9f3a" ], [ 0.8888888888888888, "#fdca26" ], [ 1.0, "#f0f921" ] ], "sequentialminus": [ [ 0.0, "#0d0887" ], [ 0.1111111111111111, "#46039f" ], [ 0.2222222222222222, "#7201a8" ], [ 0.3333333333333333, "#9c179e" ], [ 0.4444444444444444, "#bd3786" ], [ 0.5555555555555556, "#d8576b" ], [ 0.6666666666666666, "#ed7953" ], [ 0.7777777777777778, "#fb9f3a" ], [ 0.8888888888888888, "#fdca26" ], [ 1.0, "#f0f921" ] ] }, "hoverlabel": { "align": "left" }, "plot_bgcolor": "#E5ECF6", "paper_bgcolor": "white", "shapedefaults": { "line": { "width": 0 }, "opacity": 0.4, "fillcolor": "#506784" }, "annotationdefaults": { "arrowhead": 0, "arrowcolor": "#506784", "arrowwidth": 1 } } }, "annotations": [ { "x": -0.45, "y": 0, "font": { "color": "#ffffff" }, "text": "<b>School</b>", "xref": "x", "yref": "y", "align": "left", "xanchor": "left", "showarrow": false }, { "x": 0.55, "y": 0, "font": { "color": "#ffffff" }, "text": "<b>Women</b>", "xref": "x", "yref": "y", "align": "left", "xanchor": "left", "showarrow": false }, { "x": 1.55, "y": 0, "font": { "color": "#ffffff" }, "text": "<b>Men</b>", "xref": "x", "yref": "y", "align": "left", "xanchor": "left", "showarrow": false }, { "x": 2.55, "y": 0, "font": { "color": "#ffffff" }, "text": "<b>Gap</b>", "xref": "x", "yref": "y", "align": "left", "xanchor": "left", "showarrow": false }, { "x": -0.45, "y": 1, "font": { "color": "#000000" }, "text": "MIT", "xref": "x", "yref": "y", "align": "left", "xanchor": "left", "showarrow": false }, { "x": 0.55, "y": 1, "font": { "color": "#000000" }, "text": "94", "xref": "x", "yref": "y", "align": "left", "xanchor": "left", "showarrow": false }, { "x": 1.55, "y": 1, "font": { "color": "#000000" }, "text": "152", "xref": "x", "yref": "y", "align": "left", "xanchor": "left", "showarrow": false }, { "x": 2.55, "y": 1, "font": { "color": "#000000" }, "text": "58", "xref": "x", "yref": "y", "align": "left", "xanchor": "left", "showarrow": false }, { "x": -0.45, "y": 2, "font": { "color": "#000000" }, "text": "Stanford", "xref": "x", "yref": "y", "align": "left", "xanchor": "left", "showarrow": false }, { "x": 0.55, "y": 2, "font": { "color": "#000000" }, "text": "96", "xref": "x", "yref": "y", "align": "left", "xanchor": "left", "showarrow": false }, { "x": 1.55, "y": 2, "font": { "color": "#000000" }, "text": "151", "xref": "x", "yref": "y", "align": "left", "xanchor": "left", "showarrow": false }, { "x": 2.55, "y": 2, "font": { "color": "#000000" }, "text": "55", "xref": "x", "yref": "y", "align": "left", "xanchor": "left", "showarrow": false }, { "x": -0.45, "y": 3, "font": { "color": "#000000" }, "text": "Harvard", "xref": "x", "yref": "y", "align": "left", "xanchor": "left", "showarrow": false }, { "x": 0.55, "y": 3, "font": { "color": "#000000" }, "text": "112", "xref": "x", "yref": "y", "align": "left", "xanchor": "left", "showarrow": false }, { "x": 1.55, "y": 3, "font": { "color": "#000000" }, "text": "165", "xref": "x", "yref": "y", "align": "left", "xanchor": "left", "showarrow": false }, { "x": 2.55, "y": 3, "font": { "color": "#000000" }, "text": "53", "xref": "x", "yref": "y", "align": "left", "xanchor": "left", "showarrow": false }, { "x": -0.45, "y": 4, "font": { "color": "#000000" }, "text": "U.Penn", "xref": "x", "yref": "y", "align": "left", "xanchor": "left", "showarrow": false }, { "x": 0.55, "y": 4, "font": { "color": "#000000" }, "text": "92", "xref": "x", "yref": "y", "align": "left", "xanchor": "left", "showarrow": false }, { "x": 1.55, "y": 4, "font": { "color": "#000000" }, "text": "141", "xref": "x", "yref": "y", "align": "left", "xanchor": "left", "showarrow": false }, { "x": 2.55, "y": 4, "font": { "color": "#000000" }, "text": "49", "xref": "x", "yref": "y", "align": "left", "xanchor": "left", "showarrow": false }, { "x": -0.45, "y": 5, "font": { "color": "#000000" }, "text": "Princeton", "xref": "x", "yref": "y", "align": "left", "xanchor": "left", "showarrow": false }, { "x": 0.55, "y": 5, "font": { "color": "#000000" }, "text": "90", "xref": "x", "yref": "y", "align": "left", "xanchor": "left", "showarrow": false }, { "x": 1.55, "y": 5, "font": { "color": "#000000" }, "text": "137", "xref": "x", "yref": "y", "align": "left", "xanchor": "left", "showarrow": false }, { "x": 2.55, "y": 5, "font": { "color": "#000000" }, "text": "47", "xref": "x", "yref": "y", "align": "left", "xanchor": "left", "showarrow": false }, { "x": -0.45, "y": 6, "font": { "color": "#000000" }, "text": "Chicago", "xref": "x", "yref": "y", "align": "left", "xanchor": "left", "showarrow": false }, { "x": 0.55, "y": 6, "font": { "color": "#000000" }, "text": "78", "xref": "x", "yref": "y", "align": "left", "xanchor": "left", "showarrow": false }, { "x": 1.55, "y": 6, "font": { "color": "#000000" }, "text": "118", "xref": "x", "yref": "y", "align": "left", "xanchor": "left", "showarrow": false }, { "x": 2.55, "y": 6, "font": { "color": "#000000" }, "text": "40", "xref": "x", "yref": "y", "align": "left", "xanchor": "left", "showarrow": false }, { "x": -0.45, "y": 7, "font": { "color": "#000000" }, "text": "Georgetown", "xref": "x", "yref": "y", "align": "left", "xanchor": "left", "showarrow": false }, { "x": 0.55, "y": 7, "font": { "color": "#000000" }, "text": "94", "xref": "x", "yref": "y", "align": "left", "xanchor": "left", "showarrow": false }, { "x": 1.55, "y": 7, "font": { "color": "#000000" }, "text": "131", "xref": "x", "yref": "y", "align": "left", "xanchor": "left", "showarrow": false }, { "x": 2.55, "y": 7, "font": { "color": "#000000" }, "text": "37", "xref": "x", "yref": "y", "align": "left", "xanchor": "left", "showarrow": false }, { "x": -0.45, "y": 8, "font": { "color": "#000000" }, "text": "Tufts", "xref": "x", "yref": "y", "align": "left", "xanchor": "left", "showarrow": false }, { "x": 0.55, "y": 8, "font": { "color": "#000000" }, "text": "76", "xref": "x", "yref": "y", "align": "left", "xanchor": "left", "showarrow": false }, { "x": 1.55, "y": 8, "font": { "color": "#000000" }, "text": "112", "xref": "x", "yref": "y", "align": "left", "xanchor": "left", "showarrow": false }, { "x": 2.55, "y": 8, "font": { "color": "#000000" }, "text": "36", "xref": "x", "yref": "y", "align": "left", "xanchor": "left", "showarrow": false }, { "x": -0.45, "y": 9, "font": { "color": "#000000" }, "text": "Yale", "xref": "x", "yref": "y", "align": "left", "xanchor": "left", "showarrow": false }, { "x": 0.55, "y": 9, "font": { "color": "#000000" }, "text": "79", "xref": "x", "yref": "y", "align": "left", "xanchor": "left", "showarrow": false }, { "x": 1.55, "y": 9, "font": { "color": "#000000" }, "text": "114", "xref": "x", "yref": "y", "align": "left", "xanchor": "left", "showarrow": false }, { "x": 2.55, "y": 9, "font": { "color": "#000000" }, "text": "35", "xref": "x", "yref": "y", "align": "left", "xanchor": "left", "showarrow": false }, { "x": -0.45, "y": 10, "font": { "color": "#000000" }, "text": "Columbia", "xref": "x", "yref": "y", "align": "left", "xanchor": "left", "showarrow": false }, { "x": 0.55, "y": 10, "font": { "color": "#000000" }, "text": "86", "xref": "x", "yref": "y", "align": "left", "xanchor": "left", "showarrow": false }, { "x": 1.55, "y": 10, "font": { "color": "#000000" }, "text": "119", "xref": "x", "yref": "y", "align": "left", "xanchor": "left", "showarrow": false }, { "x": 2.55, "y": 10, "font": { "color": "#000000" }, "text": "33", "xref": "x", "yref": "y", "align": "left", "xanchor": "left", "showarrow": false }, { "x": -0.45, "y": 11, "font": { "color": "#000000" }, "text": "Duke", "xref": "x", "yref": "y", "align": "left", "xanchor": "left", "showarrow": false }, { "x": 0.55, "y": 11, "font": { "color": "#000000" }, "text": "93", "xref": "x", "yref": "y", "align": "left", "xanchor": "left", "showarrow": false }, { "x": 1.55, "y": 11, "font": { "color": "#000000" }, "text": "124", "xref": "x", "yref": "y", "align": "left", "xanchor": "left", "showarrow": false }, { "x": 2.55, "y": 11, "font": { "color": "#000000" }, "text": "31", "xref": "x", "yref": "y", "align": "left", "xanchor": "left", "showarrow": false }, { "x": -0.45, "y": 12, "font": { "color": "#000000" }, "text": "Dartmouth", "xref": "x", "yref": "y", "align": "left", "xanchor": "left", "showarrow": false }, { "x": 0.55, "y": 12, "font": { "color": "#000000" }, "text": "84", "xref": "x", "yref": "y", "align": "left", "xanchor": "left", "showarrow": false }, { "x": 1.55, "y": 12, "font": { "color": "#000000" }, "text": "114", "xref": "x", "yref": "y", "align": "left", "xanchor": "left", "showarrow": false }, { "x": 2.55, "y": 12, "font": { "color": "#000000" }, "text": "30", "xref": "x", "yref": "y", "align": "left", "xanchor": "left", "showarrow": false }, { "x": -0.45, "y": 13, "font": { "color": "#000000" }, "text": "NYU", "xref": "x", "yref": "y", "align": "left", "xanchor": "left", "showarrow": false }, { "x": 0.55, "y": 13, "font": { "color": "#000000" }, "text": "67", "xref": "x", "yref": "y", "align": "left", "xanchor": "left", "showarrow": false }, { "x": 1.55, "y": 13, "font": { "color": "#000000" }, "text": "94", "xref": "x", "yref": "y", "align": "left", "xanchor": "left", "showarrow": false }, { "x": 2.55, "y": 13, "font": { "color": "#000000" }, "text": "27", "xref": "x", "yref": "y", "align": "left", "xanchor": "left", "showarrow": false }, { "x": -0.45, "y": 14, "font": { "color": "#000000" }, "text": "Notre Dame", "xref": "x", "yref": "y", "align": "left", "xanchor": "left", "showarrow": false }, { "x": 0.55, "y": 14, "font": { "color": "#000000" }, "text": "73", "xref": "x", "yref": "y", "align": "left", "xanchor": "left", "showarrow": false }, { "x": 1.55, "y": 14, "font": { "color": "#000000" }, "text": "100", "xref": "x", "yref": "y", "align": "left", "xanchor": "left", "showarrow": false }, { "x": 2.55, "y": 14, "font": { "color": "#000000" }, "text": "27", "xref": "x", "yref": "y", "align": "left", "xanchor": "left", "showarrow": false }, { "x": -0.45, "y": 15, "font": { "color": "#000000" }, "text": "Cornell", "xref": "x", "yref": "y", "align": "left", "xanchor": "left", "showarrow": false }, { "x": 0.55, "y": 15, "font": { "color": "#000000" }, "text": "80", "xref": "x", "yref": "y", "align": "left", "xanchor": "left", "showarrow": false }, { "x": 1.55, "y": 15, "font": { "color": "#000000" }, "text": "107", "xref": "x", "yref": "y", "align": "left", "xanchor": "left", "showarrow": false }, { "x": 2.55, "y": 15, "font": { "color": "#000000" }, "text": "27", "xref": "x", "yref": "y", "align": "left", "xanchor": "left", "showarrow": false }, { "x": -0.45, "y": 16, "font": { "color": "#000000" }, "text": "Michigan", "xref": "x", "yref": "y", "align": "left", "xanchor": "left", "showarrow": false }, { "x": 0.55, "y": 16, "font": { "color": "#000000" }, "text": "62", "xref": "x", "yref": "y", "align": "left", "xanchor": "left", "showarrow": false }, { "x": 1.55, "y": 16, "font": { "color": "#000000" }, "text": "84", "xref": "x", "yref": "y", "align": "left", "xanchor": "left", "showarrow": false }, { "x": 2.55, "y": 16, "font": { "color": "#000000" }, "text": "22", "xref": "x", "yref": "y", "align": "left", "xanchor": "left", "showarrow": false }, { "x": -0.45, "y": 17, "font": { "color": "#000000" }, "text": "Brown", "xref": "x", "yref": "y", "align": "left", "xanchor": "left", "showarrow": false }, { "x": 0.55, "y": 17, "font": { "color": "#000000" }, "text": "72", "xref": "x", "yref": "y", "align": "left", "xanchor": "left", "showarrow": false }, { "x": 1.55, "y": 17, "font": { "color": "#000000" }, "text": "92", "xref": "x", "yref": "y", "align": "left", "xanchor": "left", "showarrow": false }, { "x": 2.55, "y": 17, "font": { "color": "#000000" }, "text": "20", "xref": "x", "yref": "y", "align": "left", "xanchor": "left", "showarrow": false }, { "x": -0.45, "y": 18, "font": { "color": "#000000" }, "text": "Berkeley", "xref": "x", "yref": "y", "align": "left", "xanchor": "left", "showarrow": false }, { "x": 0.55, "y": 18, "font": { "color": "#000000" }, "text": "71", "xref": "x", "yref": "y", "align": "left", "xanchor": "left", "showarrow": false }, { "x": 1.55, "y": 18, "font": { "color": "#000000" }, "text": "88", "xref": "x", "yref": "y", "align": "left", "xanchor": "left", "showarrow": false }, { "x": 2.55, "y": 18, "font": { "color": "#000000" }, "text": "17", "xref": "x", "yref": "y", "align": "left", "xanchor": "left", "showarrow": false }, { "x": -0.45, "y": 19, "font": { "color": "#000000" }, "text": "Emory", "xref": "x", "yref": "y", "align": "left", "xanchor": "left", "showarrow": false }, { "x": 0.55, "y": 19, "font": { "color": "#000000" }, "text": "68", "xref": "x", "yref": "y", "align": "left", "xanchor": "left", "showarrow": false }, { "x": 1.55, "y": 19, "font": { "color": "#000000" }, "text": "82", "xref": "x", "yref": "y", "align": "left", "xanchor": "left", "showarrow": false }, { "x": 2.55, "y": 19, "font": { "color": "#000000" }, "text": "14", "xref": "x", "yref": "y", "align": "left", "xanchor": "left", "showarrow": false }, { "x": -0.45, "y": 20, "font": { "color": "#000000" }, "text": "UCLA", "xref": "x", "yref": "y", "align": "left", "xanchor": "left", "showarrow": false }, { "x": 0.55, "y": 20, "font": { "color": "#000000" }, "text": "64", "xref": "x", "yref": "y", "align": "left", "xanchor": "left", "showarrow": false }, { "x": 1.55, "y": 20, "font": { "color": "#000000" }, "text": "78", "xref": "x", "yref": "y", "align": "left", "xanchor": "left", "showarrow": false }, { "x": 2.55, "y": 20, "font": { "color": "#000000" }, "text": "14", "xref": "x", "yref": "y", "align": "left", "xanchor": "left", "showarrow": false }, { "x": -0.45, "y": 21, "font": { "color": "#000000" }, "text": "SoCal", "xref": "x", "yref": "y", "align": "left", "xanchor": "left", "showarrow": false }, { "x": 0.55, "y": 21, "font": { "color": "#000000" }, "text": "72", "xref": "x", "yref": "y", "align": "left", "xanchor": "left", "showarrow": false }, { "x": 1.55, "y": 21, "font": { "color": "#000000" }, "text": "81", "xref": "x", "yref": "y", "align": "left", "xanchor": "left", "showarrow": false }, { "x": 2.55, "y": 21, "font": { "color": "#000000" }, "text": "9", "xref": "x", "yref": "y", "align": "left", "xanchor": "left", "showarrow": false } ] } }, "height": 710, "width": null, "user": { "profile_url": "https://plotly.com/~PythonPlotBot", "avatar_url": "https://storage.googleapis.com/plotly-prod-profiles/15.jpg", "background_url": "https://storage.googleapis.com/plotly-prod-profiles/bg-14.jpg", "bio": "", "nickname": "", "website": "", "stream_tokens": null, "feature_set_id": null, "csrf_token": null, "date_joined": "2017-02-14 21:07:30", "mapbox_access_tokens": null, "has_password": null, "username": "PythonPlotBot", "email": null, "is_active": null, "readonly": null, "is_dash_creator": null, "dash_created_count": null, "is_chart_creator": null, "charts_created_count": null } }, { "creation_time": "2018-04-27T05:54:10.063664Z", "comments": { "results": [], "count": 0 }, "parented": true, "embed_url": "https://plotly.com/~PythonPlotBot/2673.embed", "fid": "PythonPlotBot:2673", "filename": "jupyter-Nuclear Waste Sites on American Campuses", "filetype": "plot", "img_url": "https://storage.googleapis.com/plotly-prod-images/PythonPlotBot/2673/9_IABE3LADNKELYZPEQBN8S79QJ72FEP.png", "image_urls": { "default": "https://storage.googleapis.com/plotly-prod-images/PythonPlotBot/2673/2_VROBBL2ZFCZKFLHKYHXZ364HLT6QEG.png", "block-thumb": "https://storage.googleapis.com/plotly-prod-images/PythonPlotBot/2673/8_QH7EZS272YZ31Y3IQY4FNKJPUT36CT.png", "list-thumb": "https://storage.googleapis.com/plotly-prod-images/PythonPlotBot/2673/9_IABE3LADNKELYZPEQBN8S79QJ72FEP.png" }, "api_urls": { "files": "https://api.plotly.com/v2/files/PythonPlotBot:2673", "plots": "https://api.plotly.com/v2/plots/PythonPlotBot:2673", "parent": "https://api.plotly.com/v2/folders/home?user=PythonPlotBot" }, "owner": "PythonPlotBot", "parent": -1, "preview": "", "referencers": [], "references": [], "title": "Nuclear Waste Sites on Campus", "views": 847150, "web_url": "https://plotly.com/~PythonPlotBot/2673/nuclear-waste-sites-on-campus/", "world_readable": true, "date_modified": "2019-07-08T16:36:51.654Z", "stars": { "results": [], "count": 0 }, "collaborators": { "results": [], "count": 0 }, "subfolder_count": null, "refresh_interval": null, "organize_view_url": "https://plotly.com/~PythonPlotBot/2673/", "current_user_permission": "read", "is_theme": null, "is_template": null, "autosize": true, "caption": "", "figure": { "data": [ { "mode": "markers", "type": "scattermapbox", "latsrc": "PythonPlotBot:3545:8188c7", "lonsrc": "PythonPlotBot:3545:e80327", "marker": { "size": 17, "color": "rgb(255, 0, 0)", "opacity": 0.7 }, "textsrc": "PythonPlotBot:3545:22bf83", "hoverinfo": "text" }, { "mode": "markers", "type": "scattermapbox", "latsrc": "PythonPlotBot:3545:721557", "lonsrc": "PythonPlotBot:3545:9553b0", "marker": { "size": 8, "color": "rgb(242, 177, 172)", "opacity": 0.7 }, "hoverinfo": "none" } ], "layout": { "title": { "text": "Nuclear Waste Sites on Campus" }, "mapbox": { "zoom": 3, "pitch": 0, "style": "light", "center": { "lat": 38, "lon": -94 }, "bearing": 0, "accesstoken": "pk.eyJ1IjoibWljaGFlbGJhYnluIiwiYSI6ImNqanU5b24zdTAwbDMza282cmxyeGJpdzMifQ.F0n8GMvBBmqa61i6zuOYWg" }, "autosize": true, "template": { "data": { "bar": [ { "type": "bar", "marker": { "line": { "color": "#E5ECF6", "width": 0.5 } } } ], "table": [ { "type": "table", "cells": { "fill": { "color": "#EBF0F8" }, "line": { "color": "white" } }, "header": { "fill": { "color": "#C8D4E3" }, "line": { "color": "white" } } } ], "carpet": [ { "type": "carpet", "aaxis": { "gridcolor": "white", "linecolor": "white", "endlinecolor": "#2a3f5f", "minorgridcolor": "white", "startlinecolor": "#2a3f5f" }, "baxis": { "gridcolor": "white", "linecolor": "white", "endlinecolor": "#2a3f5f", "minorgridcolor": "white", "startlinecolor": "#2a3f5f" } } ], "mesh3d": [ { "type": "mesh3d", "colorbar": { "ticks": "", "outlinewidth": 0 } } ], "contour": [ { "type": "contour", "colorbar": { "ticks": "", "outlinewidth": 0 }, "colorscale": [ [ 0.0, "#0d0887" ], [ 0.1111111111111111, "#46039f" ], [ 0.2222222222222222, "#7201a8" ], [ 0.3333333333333333, "#9c179e" ], [ 0.4444444444444444, "#bd3786" ], [ 0.5555555555555556, "#d8576b" ], [ 0.6666666666666666, "#ed7953" ], [ 0.7777777777777778, "#fb9f3a" ], [ 0.8888888888888888, "#fdca26" ], [ 1.0, "#f0f921" ] ] } ], "heatmap": [ { "type": "heatmap", "colorbar": { "ticks": "", "outlinewidth": 0 }, "colorscale": [ [ 0.0, "#0d0887" ], [ 0.1111111111111111, "#46039f" ], [ 0.2222222222222222, "#7201a8" ], [ 0.3333333333333333, "#9c179e" ], [ 0.4444444444444444, "#bd3786" ], [ 0.5555555555555556, "#d8576b" ], [ 0.6666666666666666, "#ed7953" ], [ 0.7777777777777778, "#fb9f3a" ], [ 0.8888888888888888, "#fdca26" ], [ 1.0, "#f0f921" ] ] } ], "scatter": [ { "type": "scatter", "marker": { "colorbar": { "ticks": "", "outlinewidth": 0 } } } ], "surface": [ { "type": "surface", "colorbar": { "ticks": "", "outlinewidth": 0 } } ], "barpolar": [ { "type": "barpolar", "marker": { "line": { "color": "#E5ECF6", "width": 0.5 } } } ], "heatmapgl": [ { "type": "heatmapgl", "colorbar": { "ticks": "", "outlinewidth": 0 } } ], "histogram": [ { "type": "histogram", "marker": { "colorbar": { "ticks": "", "outlinewidth": 0 } } } ], "parcoords": [ { "line": { "colorbar": { "ticks": "", "outlinewidth": 0 } }, "type": "parcoords" } ], "scatter3d": [ { "line": { "colorbar": { "ticks": "", "outlinewidth": 0 } }, "type": "scatter3d", "marker": { "colorbar": { "ticks": "", "outlinewidth": 0 } } } ], "scattergl": [ { "type": "scattergl", "marker": { "colorbar": { "ticks": "", "outlinewidth": 0 } } } ], "choropleth": [ { "type": "choropleth", "colorbar": { "ticks": "", "outlinewidth": 0 } } ], "scattergeo": [ { "type": "scattergeo", "marker": { "colorbar": { "ticks": "", "outlinewidth": 0 } } } ], "histogram2d": [ { "type": "histogram2d", "colorbar": { "ticks": "", "outlinewidth": 0 }, "colorscale": [ [ 0.0, "#0d0887" ], [ 0.1111111111111111, "#46039f" ], [ 0.2222222222222222, "#7201a8" ], [ 0.3333333333333333, "#9c179e" ], [ 0.4444444444444444, "#bd3786" ], [ 0.5555555555555556, "#d8576b" ], [ 0.6666666666666666, "#ed7953" ], [ 0.7777777777777778, "#fb9f3a" ], [ 0.8888888888888888, "#fdca26" ], [ 1.0, "#f0f921" ] ] } ], "scatterpolar": [ { "type": "scatterpolar", "marker": { "colorbar": { "ticks": "", "outlinewidth": 0 } } } ], "contourcarpet": [ { "type": "contourcarpet", "colorbar": { "ticks": "", "outlinewidth": 0 } } ], "scattercarpet": [ { "type": "scattercarpet", "marker": { "colorbar": { "ticks": "", "outlinewidth": 0 } } } ], "scattermapbox": [ { "type": "scattermapbox", "marker": { "colorbar": { "ticks": "", "outlinewidth": 0 } } } ], "scatterpolargl": [ { "type": "scatterpolargl", "marker": { "colorbar": { "ticks": "", "outlinewidth": 0 } } } ], "scatterternary": [ { "type": "scatterternary", "marker": { "colorbar": { "ticks": "", "outlinewidth": 0 } } } ], "histogram2dcontour": [ { "type": "histogram2dcontour", "colorbar": { "ticks": "", "outlinewidth": 0 }, "colorscale": [ [ 0.0, "#0d0887" ], [ 0.1111111111111111, "#46039f" ], [ 0.2222222222222222, "#7201a8" ], [ 0.3333333333333333, "#9c179e" ], [ 0.4444444444444444, "#bd3786" ], [ 0.5555555555555556, "#d8576b" ], [ 0.6666666666666666, "#ed7953" ], [ 0.7777777777777778, "#fb9f3a" ], [ 0.8888888888888888, "#fdca26" ], [ 1.0, "#f0f921" ] ] } ] }, "layout": { "geo": { "bgcolor": "white", "showland": true, "lakecolor": "white", "landcolor": "#E5ECF6", "showlakes": true, "subunitcolor": "white" }, "font": { "color": "#2a3f5f" }, "polar": { "bgcolor": "#E5ECF6", "radialaxis": { "ticks": "", "gridcolor": "white", "linecolor": "white" }, "angularaxis": { "ticks": "", "gridcolor": "white", "linecolor": "white" } }, "scene": { "xaxis": { "ticks": "", "gridcolor": "white", "gridwidth": 2, "linecolor": "white", "zerolinecolor": "white", "showbackground": true, "backgroundcolor": "#E5ECF6" }, "yaxis": { "ticks": "", "gridcolor": "white", "gridwidth": 2, "linecolor": "white", "zerolinecolor": "white", "showbackground": true, "backgroundcolor": "#E5ECF6" }, "zaxis": { "ticks": "", "gridcolor": "white", "gridwidth": 2, "linecolor": "white", "zerolinecolor": "white", "showbackground": true, "backgroundcolor": "#E5ECF6" } }, "title": { "x": 0.05 }, "xaxis": { "ticks": "", "gridcolor": "white", "linecolor": "white", "automargin": true, "zerolinecolor": "white", "zerolinewidth": 2 }, "yaxis": { "ticks": "", "gridcolor": "white", "linecolor": "white", "automargin": true, "zerolinecolor": "white", "zerolinewidth": 2 }, "mapbox": { "style": "light" }, "ternary": { "aaxis": { "ticks": "", "gridcolor": "white", "linecolor": "white" }, "baxis": { "ticks": "", "gridcolor": "white", "linecolor": "white" }, "caxis": { "ticks": "", "gridcolor": "white", "linecolor": "white" }, "bgcolor": "#E5ECF6" }, "colorway": [ "#636efa", "#EF553B", "#00cc96", "#ab63fa", "#FFA15A", "#19d3f3", "#FF6692", "#B6E880", "#FF97FF", "#FECB52" ], "hovermode": "closest", "colorscale": { "diverging": [ [ 0, "#8e0152" ], [ 0.1, "#c51b7d" ], [ 0.2, "#de77ae" ], [ 0.3, "#f1b6da" ], [ 0.4, "#fde0ef" ], [ 0.5, "#f7f7f7" ], [ 0.6, "#e6f5d0" ], [ 0.7, "#b8e186" ], [ 0.8, "#7fbc41" ], [ 0.9, "#4d9221" ], [ 1, "#276419" ] ], "sequential": [ [ 0.0, "#0d0887" ], [ 0.1111111111111111, "#46039f" ], [ 0.2222222222222222, "#7201a8" ], [ 0.3333333333333333, "#9c179e" ], [ 0.4444444444444444, "#bd3786" ], [ 0.5555555555555556, "#d8576b" ], [ 0.6666666666666666, "#ed7953" ], [ 0.7777777777777778, "#fb9f3a" ], [ 0.8888888888888888, "#fdca26" ], [ 1.0, "#f0f921" ] ], "sequentialminus": [ [ 0.0, "#0d0887" ], [ 0.1111111111111111, "#46039f" ], [ 0.2222222222222222, "#7201a8" ], [ 0.3333333333333333, "#9c179e" ], [ 0.4444444444444444, "#bd3786" ], [ 0.5555555555555556, "#d8576b" ], [ 0.6666666666666666, "#ed7953" ], [ 0.7777777777777778, "#fb9f3a" ], [ 0.8888888888888888, "#fdca26" ], [ 1.0, "#f0f921" ] ] }, "hoverlabel": { "align": "left" }, "plot_bgcolor": "#E5ECF6", "paper_bgcolor": "white", "shapedefaults": { "line": { "width": 0 }, "opacity": 0.4, "fillcolor": "#506784" }, "annotationdefaults": { "arrowhead": 0, "arrowcolor": "#506784", "arrowwidth": 1 } } }, "hovermode": "closest", "showlegend": false } }, "height": null, "width": null, "user": { "profile_url": "https://plotly.com/~PythonPlotBot", "avatar_url": "https://storage.googleapis.com/plotly-prod-profiles/15.jpg", "background_url": "https://storage.googleapis.com/plotly-prod-profiles/bg-14.jpg", "bio": "", "nickname": "", "website": "", "stream_tokens": null, "feature_set_id": null, "csrf_token": null, "date_joined": "2017-02-14 21:07:30", "mapbox_access_tokens": null, "has_password": null, "username": "PythonPlotBot", "email": null, "is_active": null, "readonly": null, "is_dash_creator": null, "dash_created_count": null, "is_chart_creator": null, "charts_created_count": null } }, { "creation_time": "2014-06-02T23:24:22.000000Z", "comments": { "results": [], "count": 0 }, "parented": true, "embed_url": "https://plotly.com/~RhettAllain/111.embed", "fid": "RhettAllain:111", "filename": "flashPlot", "filetype": "plot", "img_url": "https://storage.googleapis.com/plotly-prod-images/RhettAllain%2F111%2F9_CCMW2NLGEB3BWSJXHGKFTPRI7LMXV5.png", "image_urls": { "default": "https://storage.googleapis.com/plotly-prod-images/RhettAllain%2F111%2F2_2JHLGU5KUQA96W8MPBTKMAEX8CI7KQ.png", "block-thumb": "https://storage.googleapis.com/plotly-prod-images/RhettAllain%2F111%2F8_BWMFKGH6GGFARD568Y06Z3O59B8YS5.png", "list-thumb": "https://storage.googleapis.com/plotly-prod-images/RhettAllain%2F111%2F9_CCMW2NLGEB3BWSJXHGKFTPRI7LMXV5.png" }, "api_urls": { "files": "https://api.plotly.com/v2/files/RhettAllain:111", "plots": "https://api.plotly.com/v2/plots/RhettAllain:111", "parent": "https://api.plotly.com/v2/folders/home?user=RhettAllain" }, "owner": "RhettAllain", "parent": -1, "preview": "", "referencers": [], "references": [], "title": "Flash Running in NY City", "views": 841463, "web_url": "https://plotly.com/~RhettAllain/111/flash-running-in-ny-city/", "world_readable": true, "date_modified": "2015-07-10T15:04:43.881Z", "stars": { "results": [ { "creator": { "profile_url": "https://plotly.com/~hascr", "avatar_url": "https://storage.googleapis.com/plotly-prod-profiles/33.jpg", "background_url": "https://storage.googleapis.com/plotly-prod-profiles/bg-0.jpg", "bio": "", "nickname": "", "website": "", "stream_tokens": null, "feature_set_id": null, "csrf_token": null, "date_joined": "2014-07-17 05:43:57", "mapbox_access_tokens": null, "has_password": null, "username": "hascr", "email": null, "is_active": null, "readonly": null, "is_dash_creator": null, "dash_created_count": null, "is_chart_creator": null, "charts_created_count": null } }, { "creator": { "profile_url": "https://plotly.com/~DamianK.tenBohmer", "avatar_url": "https://storage.googleapis.com/plotly-prod-profiles/74.jpg", "background_url": "https://storage.googleapis.com/plotly-prod-profiles/bg-10.jpg", "bio": "", "nickname": "", "website": "", "stream_tokens": null, "feature_set_id": null, "csrf_token": null, "date_joined": "2015-05-15 09:10:51", "mapbox_access_tokens": null, "has_password": null, "username": "DamianK.tenBohmer", "email": null, "is_active": null, "readonly": null, "is_dash_creator": null, "dash_created_count": null, "is_chart_creator": null, "charts_created_count": null } }, { "creator": { "profile_url": "https://plotly.com/~mraculus", "avatar_url": "https://storage.googleapis.com/plotly-prod-profiles/83.jpg", "background_url": "https://storage.googleapis.com/plotly-prod-profiles/bg-7.jpg", "bio": "", "nickname": "", "website": "", "stream_tokens": null, "feature_set_id": null, "csrf_token": null, "date_joined": "2017-03-01 19:38:25", "mapbox_access_tokens": null, "has_password": null, "username": "mraculus", "email": null, "is_active": null, "readonly": null, "is_dash_creator": null, "dash_created_count": null, "is_chart_creator": null, "charts_created_count": null } }, { "creator": { "profile_url": "https://plotly.com/~sunjiannankai", "avatar_url": "https://storage.googleapis.com/plotly-prod-profiles/3.jpg", "background_url": "https://storage.googleapis.com/plotly-prod-profiles/bg-6.jpg", "bio": "", "nickname": "", "website": "", "stream_tokens": null, "feature_set_id": null, "csrf_token": null, "date_joined": "2017-03-23 11:28:32", "mapbox_access_tokens": null, "has_password": null, "username": "sunjiannankai", "email": null, "is_active": null, "readonly": null, "is_dash_creator": null, "dash_created_count": null, "is_chart_creator": null, "charts_created_count": null } }, { "creator": { "profile_url": "https://plotly.com/~cristian1512", "avatar_url": "https://storage.googleapis.com/plotly-prod-profiles/3.jpg", "background_url": "https://storage.googleapis.com/plotly-prod-profiles/bg-6.jpg", "bio": "", "nickname": "", "website": "", "stream_tokens": null, "feature_set_id": null, "csrf_token": null, "date_joined": "2018-09-20 17:02:31", "mapbox_access_tokens": null, "has_password": null, "username": "cristian1512", "email": null, "is_active": null, "readonly": null, "is_dash_creator": null, "dash_created_count": null, "is_chart_creator": null, "charts_created_count": null } } ], "count": 5 }, "collaborators": { "results": [], "count": 0 }, "subfolder_count": null, "refresh_interval": null, "organize_view_url": "https://plotly.com/~RhettAllain/111/", "current_user_permission": "read", "is_theme": null, "is_template": null, "autosize": true, "caption": "", "figure": { "data": [ { "uid": "0b9334", "line": {}, "mode": "markers", "name": "x position [m]", "type": "scatter", "xsrc": "RhettAllain:1843:16b854", "ysrc": "RhettAllain:1843:825d80", "marker": { "line": {} }, "error_x": {}, "error_y": {}, "textfont": {} }, { "fit": { "rms": 7.804186181141988, "uid": "c607b8", "corr": 0.9919662151526164, "params": [ { "err": 3.8365070230480556, "hold": false, "name": "a", "value": 199.39379989368788 }, { "err": 11.193343915527556, "hold": false, "name": "b", "value": -316.4661927697245 } ], "parent": [ "0b9334" ], "weight": "", "fitname": "x position [m] - fit", "funcStr": "a + b*x", "ninterp": "50", "iterations": 1, "inputxrange": [ "", "" ], "outputxrange": [ "", "" ] }, "uid": "c607b8", "line": { "color": "rgb(55, 126, 184)", "width": 4 }, "name": "x position [m] - fit", "type": "scatter", "xsrc": "RhettAllain:1843:fa99fb", "ysrc": "RhettAllain:1843:5d2a98", "xaxis": "x", "yaxis": "y", "marker": { "line": {} }, "error_x": {}, "error_y": {}, "opacity": 0.5, "textfont": {} } ], "layout": { "font": { "size": 12, "color": "#444", "family": "\"Open sans\", verdana, arial, sans-serif" }, "smith": false, "title": "Flash Running in NY City", "width": 1189, "xaxis": { "type": "linear", "dtick": 0.1, "range": [ -0.03472905058450666, 0.6180623839178206 ], "tick0": 0, "ticks": "", "title": "Time [s]", "anchor": "y", "domain": [ 0, 1 ], "mirror": false, "nticks": 0, "ticklen": 5, "autotick": true, "position": 0, "showgrid": true, "showline": false, "tickfont": { "size": 0, "color": "", "family": "" }, "zeroline": true, "autorange": true, "gridcolor": "#eee", "gridwidth": 1, "linecolor": "#444", "linewidth": 1, "rangemode": "normal", "tickangle": "auto", "tickcolor": "#444", "tickwidth": 1, "titlefont": { "size": 0, "color": "", "family": "" }, "overlaying": false, "showexponent": "all", "zerolinecolor": "#444", "zerolinewidth": 1, "exponentformat": "B", "showticklabels": true }, "yaxis": { "type": "linear", "dtick": 50, "range": [ -11.644787586738268, 216.49049976832774 ], "tick0": 0, "ticks": "", "title": "x position [m]", "anchor": "x", "domain": [ 0, 1 ], "mirror": false, "nticks": 0, "ticklen": 5, "autotick": true, "position": 0, "showgrid": true, "showline": false, "tickfont": { "size": 0, "color": "", "family": "" }, "zeroline": true, "autorange": true, "gridcolor": "#eee", "gridwidth": 1, "linecolor": "#444", "linewidth": 1, "rangemode": "normal", "tickangle": "auto", "tickcolor": "#444", "tickwidth": 1, "titlefont": { "size": 0, "color": "", "family": "" }, "overlaying": false, "showexponent": "all", "zerolinecolor": "#444", "zerolinewidth": 1, "exponentformat": "B", "showticklabels": true }, "bargap": 0.2, "boxgap": 0.3, "height": 672, "legend": { "x": 1.02, "y": 1, "font": { "size": 0, "color": "", "family": "" }, "bgcolor": "#fff", "xanchor": "left", "yanchor": "top", "traceorder": "normal", "bordercolor": "#444", "borderwidth": 0 }, "margin": { "b": 80, "l": 80, "r": 80, "t": 100, "pad": 0, "autoexpand": true }, "barmode": "group", "boxmode": "overlay", "autosize": true, "dragmode": "zoom", "hovermode": "x", "titlefont": { "size": 0, "color": "", "family": "" }, "separators": ".,", "showlegend": true, "annotations": [ { "x": 0.29761904761903774, "y": 105.20743299793968, "ax": 28, "ay": -106, "tag": "", "uid": "c607b8", "font": { "size": 16 }, "text": "R<sup>2</sup> = 0.9840<br>y = 199 - 316x", "xref": "x", "yref": "y", "align": "left", "bgcolor": "rgba(0,0,0,0)", "opacity": 0.8, "xanchor": "auto", "yanchor": "auto", "arrowhead": 2, "arrowsize": 1, "borderpad": 1, "showarrow": true, "arrowcolor": "#636363", "arrowwidth": 2, "bordercolor": "", "borderwidth": 1 } ], "bargroupgap": 0, "boxgroupgap": 0.3, "hidesources": false, "plot_bgcolor": "#fff", "paper_bgcolor": "#fff" } }, "height": 672, "width": 1189, "user": { "profile_url": "https://plotly.com/~RhettAllain", "avatar_url": "https://storage.googleapis.com/plotly-prod-profiles/1406305592.jpg", "background_url": "https://storage.googleapis.com/plotly-prod-profiles/bg-6.jpg", "bio": "Physics faculty and Wired Science Blogger.", "nickname": "Rhett Allain", "website": "http://www.wired.com/wiredscience/dotphysics", "stream_tokens": null, "feature_set_id": null, "csrf_token": null, "date_joined": "2013-12-15 03:15:06", "mapbox_access_tokens": null, "has_password": null, "username": "RhettAllain", "email": null, "is_active": null, "readonly": null, "is_dash_creator": null, "dash_created_count": null, "is_chart_creator": null, "charts_created_count": null } }, { "creation_time": "2015-11-16T19:09:45.290764Z", "comments": { "results": [], "count": 0 }, "parented": true, "embed_url": "https://plotly.com/~chriddyp/1799.embed", "fid": "chriddyp:1799", "filename": "getting started", "filetype": "plot", "img_url": "https://storage.googleapis.com/plotly-prod-images/chriddyp%2F1799%2F9_IJ0U7VV8W4EMJUJ2QIS0FK6O19WNDI.png", "image_urls": { "default": "https://storage.googleapis.com/plotly-prod-images/chriddyp%2F1799%2F2_VP3WQ6IF2M77MVJX6AB4C1JAR48CSI.png", "block-thumb": "https://storage.googleapis.com/plotly-prod-images/chriddyp%2F1799%2F8_FQ1WQQ38ZA3LXPBP8QIZOLFU1NQA0S.png", "list-thumb": "https://storage.googleapis.com/plotly-prod-images/chriddyp%2F1799%2F9_IJ0U7VV8W4EMJUJ2QIS0FK6O19WNDI.png" }, "api_urls": { "files": "https://api.plotly.com/v2/files/chriddyp:1799", "plots": "https://api.plotly.com/v2/plots/chriddyp:1799", "parent": "https://api.plotly.com/v2/folders/home?user=chriddyp" }, "owner": "chriddyp", "parent": -1, "preview": "", "referencers": [], "references": [], "title": "IL, IN, MI, OH, WI", "views": 795368, "web_url": "https://plotly.com/~chriddyp/1799/il-in-mi-oh-wi/", "world_readable": true, "date_modified": "2015-11-16T19:09:45.648Z", "stars": { "results": [ { "creator": { "profile_url": "https://plotly.com/~Oubliette87", "avatar_url": "https://storage.googleapis.com/plotly-prod-profiles/52.jpg", "background_url": "https://storage.googleapis.com/plotly-prod-profiles/bg-5.jpg", "bio": "", "nickname": "", "website": "", "stream_tokens": null, "feature_set_id": null, "csrf_token": null, "date_joined": "2016-08-09 22:27:29", "mapbox_access_tokens": null, "has_password": null, "username": "Oubliette87", "email": null, "is_active": null, "readonly": null, "is_dash_creator": null, "dash_created_count": null, "is_chart_creator": null, "charts_created_count": null } }, { "creator": { "profile_url": "https://plotly.com/~sharun_syy", "avatar_url": "https://storage.googleapis.com/plotly-prod-profiles/24.jpg", "background_url": "https://storage.googleapis.com/plotly-prod-profiles/bg-14.jpg", "bio": "", "nickname": "", "website": "", "stream_tokens": null, "feature_set_id": null, "csrf_token": null, "date_joined": "2018-10-12 11:59:59", "mapbox_access_tokens": null, "has_password": null, "username": "sharun_syy", "email": null, "is_active": null, "readonly": null, "is_dash_creator": null, "dash_created_count": null, "is_chart_creator": null, "charts_created_count": null } } ], "count": 2 }, "collaborators": { "results": [], "count": 0 }, "subfolder_count": null, "refresh_interval": null, "organize_view_url": "https://plotly.com/~chriddyp/1799/", "current_user_permission": "read", "is_theme": null, "is_template": null, "autosize": true, "caption": "", "figure": { "data": [ { "uid": "69fe21", "name": "IL", "type": "box", "xsrc": "chriddyp:2108:3db68b", "marker": { "color": "#66C2A5" }, "inherit": true }, { "uid": "bc07c2", "name": "IN", "type": "box", "xsrc": "chriddyp:2108:e437b4", "marker": { "color": "#FC8D62" }, "inherit": true }, { "uid": "fdfb64", "name": "MI", "type": "box", "xsrc": "chriddyp:2108:f39875", "marker": { "color": "#8DA0CB" }, "inherit": true }, { "uid": "a035b0", "name": "OH", "type": "box", "xsrc": "chriddyp:2108:ddd2d6", "marker": { "color": "#E78AC3" }, "inherit": true }, { "uid": "b2b265", "name": "WI", "type": "box", "xsrc": "chriddyp:2108:6f6904", "marker": { "color": "#A6D854" }, "inherit": true } ], "layout": { "width": 845, "xaxis": { "type": "linear", "range": [ 5.0726414433333336, 50.341976976666665 ], "title": "percollege", "autorange": true }, "yaxis": { "type": "category", "range": [ -0.5, 4.5 ], "autorange": true }, "height": 812, "legend": { "x": 0.910828025477707, "y": 1 }, "margin": { "b": 60, "l": 40, "r": 20, "t": 10 }, "autosize": true } }, "height": 812, "width": 845, "user": { "profile_url": "https://plotly.com/~chriddyp", "avatar_url": "https://storage.googleapis.com/plotly-prod-profiles/84.jpg", "background_url": "https://storage.googleapis.com/plotly-prod-profiles/bg-3.jpg", "bio": "", "nickname": "", "website": "", "stream_tokens": null, "feature_set_id": null, "csrf_token": null, "date_joined": "2013-11-18 02:13:37", "mapbox_access_tokens": null, "has_password": null, "username": "chriddyp", "email": null, "is_active": null, "readonly": null, "is_dash_creator": null, "dash_created_count": null, "is_chart_creator": null, "charts_created_count": null } }, { "creation_time": "2015-07-19T19:08:23.541858Z", "comments": { "results": [], "count": 0 }, "parented": true, "embed_url": "https://plotly.com/~jackp/3880.embed", "fid": "jackp:3880", "filename": "2dhistogram-contour-subplots", "filetype": "plot", "img_url": "https://storage.googleapis.com/plotly-prod-images/jackp%2F3880%2F9_RJEGRUUD64E0MFV2BIHYAW7Y6DISKJ.png", "image_urls": { "default": "https://storage.googleapis.com/plotly-prod-images/jackp%2F3880%2F2_ETCLOP4Q1CTPVDR00FCU6QKLMB433P.png", "block-thumb": "https://storage.googleapis.com/plotly-prod-images/jackp%2F3880%2F8_4IL5G2SYGSVJUSVOORE2378PHSWMQ8.png", "list-thumb": "https://storage.googleapis.com/plotly-prod-images/jackp%2F3880%2F9_RJEGRUUD64E0MFV2BIHYAW7Y6DISKJ.png" }, "api_urls": { "files": "https://api.plotly.com/v2/files/jackp:3880", "plots": "https://api.plotly.com/v2/plots/jackp:3880", "parent": "https://api.plotly.com/v2/folders/home?user=jackp" }, "owner": "jackp", "parent": -1, "preview": "", "referencers": [], "references": [], "title": "Flights conflicts 2008-2009", "views": 691478, "web_url": "https://plotly.com/~jackp/3880/flights-conflicts-2008-2009/", "world_readable": true, "date_modified": "2015-07-19T19:08:23.834Z", "stars": { "results": [ { "creator": { "profile_url": "https://plotly.com/~Yao_Rs_2018", "avatar_url": "https://storage.googleapis.com/plotly-prod-profiles/12.jpg", "background_url": "https://storage.googleapis.com/plotly-prod-profiles/bg-7.jpg", "bio": "", "nickname": "", "website": "", "stream_tokens": null, "feature_set_id": null, "csrf_token": null, "date_joined": "2019-12-06 08:03:18", "mapbox_access_tokens": null, "has_password": null, "username": "Yao_Rs_2018", "email": null, "is_active": null, "readonly": null, "is_dash_creator": null, "dash_created_count": null, "is_chart_creator": null, "charts_created_count": null } }, { "creator": { "profile_url": "https://plotly.com/~tfg250", "avatar_url": "https://storage.googleapis.com/plotly-prod-profiles/44.jpg", "background_url": "https://storage.googleapis.com/plotly-prod-profiles/bg-13.jpg", "bio": "", "nickname": "", "website": "", "stream_tokens": null, "feature_set_id": null, "csrf_token": null, "date_joined": "2016-03-30 19:09:21", "mapbox_access_tokens": null, "has_password": null, "username": "tfg250", "email": null, "is_active": null, "readonly": null, "is_dash_creator": null, "dash_created_count": null, "is_chart_creator": null, "charts_created_count": null } }, { "creator": { "profile_url": "https://plotly.com/~born2bgeeky", "avatar_url": "https://storage.googleapis.com/plotly-prod-profiles/20.jpg", "background_url": "https://storage.googleapis.com/plotly-prod-profiles/bg-6.jpg", "bio": "", "nickname": "", "website": "", "stream_tokens": null, "feature_set_id": null, "csrf_token": null, "date_joined": "2015-11-07 12:33:27", "mapbox_access_tokens": null, "has_password": null, "username": "born2bgeeky", "email": null, "is_active": null, "readonly": null, "is_dash_creator": null, "dash_created_count": null, "is_chart_creator": null, "charts_created_count": null } }, { "creator": { "profile_url": "https://plotly.com/~LuisLoza", "avatar_url": "https://storage.googleapis.com/plotly-prod-profiles/21.jpg", "background_url": "https://storage.googleapis.com/plotly-prod-profiles/bg-1.jpg", "bio": "", "nickname": "Luis", "website": "", "stream_tokens": null, "feature_set_id": null, "csrf_token": null, "date_joined": "2016-01-04 18:19:26", "mapbox_access_tokens": null, "has_password": null, "username": "LuisLoza", "email": null, "is_active": null, "readonly": null, "is_dash_creator": null, "dash_created_count": null, "is_chart_creator": null, "charts_created_count": null } }, { "creator": { "profile_url": "https://plotly.com/~JohanDeLima", "avatar_url": "https://storage.googleapis.com/plotly-prod-profiles/98.jpg", "background_url": "https://storage.googleapis.com/plotly-prod-profiles/bg-13.jpg", "bio": "", "nickname": "", "website": "", "stream_tokens": null, "feature_set_id": null, "csrf_token": null, "date_joined": "2016-12-18 21:32:22", "mapbox_access_tokens": null, "has_password": null, "username": "JohanDeLima", "email": null, "is_active": null, "readonly": null, "is_dash_creator": null, "dash_created_count": null, "is_chart_creator": null, "charts_created_count": null } }, { "creator": { "profile_url": "https://plotly.com/~tlgt2017", "avatar_url": "https://storage.googleapis.com/plotly-prod-profiles/1.jpg", "background_url": "https://storage.googleapis.com/plotly-prod-profiles/bg-2.jpg", "bio": "", "nickname": "", "website": "", "stream_tokens": null, "feature_set_id": null, "csrf_token": null, "date_joined": "2017-02-20 08:08:43", "mapbox_access_tokens": null, "has_password": null, "username": "tlgt2017", "email": null, "is_active": null, "readonly": null, "is_dash_creator": null, "dash_created_count": null, "is_chart_creator": null, "charts_created_count": null } }, { "creator": { "profile_url": "https://plotly.com/~iyansri", "avatar_url": "https://storage.googleapis.com/plotly-prod-profiles/91.jpg", "background_url": "https://storage.googleapis.com/plotly-prod-profiles/bg-2.jpg", "bio": "", "nickname": "", "website": "", "stream_tokens": null, "feature_set_id": null, "csrf_token": null, "date_joined": "2017-06-06 05:54:29", "mapbox_access_tokens": null, "has_password": null, "username": "iyansri", "email": null, "is_active": null, "readonly": null, "is_dash_creator": null, "dash_created_count": null, "is_chart_creator": null, "charts_created_count": null } }, { "creator": { "profile_url": "https://plotly.com/~happyht", "avatar_url": "https://storage.googleapis.com/plotly-prod-profiles/51.jpg", "background_url": "https://storage.googleapis.com/plotly-prod-profiles/bg-5.jpg", "bio": "", "nickname": "", "website": "", "stream_tokens": null, "feature_set_id": null, "csrf_token": null, "date_joined": "2018-08-11 20:42:11", "mapbox_access_tokens": null, "has_password": null, "username": "happyht", "email": null, "is_active": null, "readonly": null, "is_dash_creator": null, "dash_created_count": null, "is_chart_creator": null, "charts_created_count": null } } ], "count": 8 }, "collaborators": { "results": [], "count": 0 }, "subfolder_count": null, "refresh_interval": null, "organize_view_url": "https://plotly.com/~jackp/3880/", "current_user_permission": "read", "is_theme": null, "is_template": null, "autosize": false, "caption": "", "figure": { "data": [ { "uid": "eb94b3", "mode": "markers", "name": "points", "type": "scatter", "xsrc": "jackp:17660:18bf02", "ysrc": "jackp:17660:b365fc", "marker": { "line": { "width": 0.5 }, "size": 4, "color": "rgb(255, 255, 255)", "opacity": 0.4 }, "opacity": 0.75, "textsrc": "jackp:17660:f37ca0" }, { "uid": "b20cd7", "name": "density", "type": "histogram2dcontour", "xsrc": "jackp:17660:18bf02", "ysrc": "jackp:17660:b365fc", "zmax": 83, "zmin": 0, "xbins": { "end": 2.6, "size": 0.2, "start": -1.8 }, "ybins": { "end": 3.6000000000000005, "size": 0.2, "start": -1.2 }, "contours": { "end": 80.05, "size": 5, "start": 5, "coloring": "fill", "showlines": true }, "ncontours": 20, "showscale": false, "colorscale": [ [ 0, "rgb(8, 29, 88)" ], [ 0.125, "rgb(37, 52, 148)" ], [ 0.25, "rgb(34, 94, 168)" ], [ 0.375, "rgb(29, 145, 192)" ], [ 0.5, "rgb(65, 182, 196)" ], [ 0.625, "rgb(127, 205, 187)" ], [ 0.75, "rgb(199, 233, 180)" ], [ 0.875, "rgb(237, 248, 217)" ], [ 1, "rgb(255, 255, 217)" ] ], "reversescale": false, "autocolorscale": false }, { "uid": "70efa7", "name": "x density", "type": "histogram", "xsrc": "jackp:17660:18bf02", "xbins": { "end": 2.4, "size": 0.1, "start": -1.6 }, "yaxis": "y2", "marker": { "color": "rgb(31, 119, 180)" } }, { "uid": "73ca31", "name": "y density", "type": "histogram", "ysrc": "jackp:17660:b365fc", "xaxis": "x2", "ybins": { "end": 3.4000000000000004, "size": 0.1, "start": -1 }, "marker": { "color": "rgb(33, 113, 181)" } } ], "layout": { "title": "Flights conflicts 2008-2009", "width": 800, "xaxis": { "type": "linear", "range": [ -1.7534109496230226, 2.637431338094243 ], "title": "Latitude", "domain": [ 0, 0.85 ], "showgrid": false, "zeroline": false, "autorange": true }, "yaxis": { "type": "linear", "range": [ -1.2579644756759842, 3.5809532695595134 ], "title": "Longitude", "domain": [ 0, 0.85 ], "showgrid": false, "zeroline": false, "autorange": true }, "bargap": 0, "height": 700, "margin": { "t": 50 }, "xaxis2": { "type": "linear", "range": [ 0, 238.94736842105263 ], "title": "", "domain": [ 0.85, 1 ], "showgrid": false, "zeroline": false, "autorange": true }, "yaxis2": { "type": "linear", "range": [ 0, 170.5263157894737 ], "title": "", "domain": [ 0.85, 1 ], "showgrid": false, "zeroline": false, "autorange": true }, "autosize": false, "hovermode": "closest", "showlegend": false, "plot_bgcolor": "rgb(249, 249, 249)", "paper_bgcolor": "rgb(249, 249, 249)" } }, "height": 700, "width": 800, "user": { "profile_url": "https://plotly.com/~jackp", "avatar_url": "https://storage.googleapis.com/plotly-prod-profiles/NRIGSXBYZT3V46K5Y56OXF8F4QRONJ.jpg", "background_url": "https://storage.googleapis.com/plotly-prod-profiles/bg-5.jpg", "bio": "😎 🌴 🍹", "nickname": "c e o @ plotly", "website": "https://github.com/jackparmer", "stream_tokens": null, "feature_set_id": null, "csrf_token": null, "date_joined": "2012-09-28 19:38:03", "mapbox_access_tokens": null, "has_password": null, "username": "jackp", "email": null, "is_active": null, "readonly": null, "is_dash_creator": null, "dash_created_count": null, "is_chart_creator": null, "charts_created_count": null } } ] }
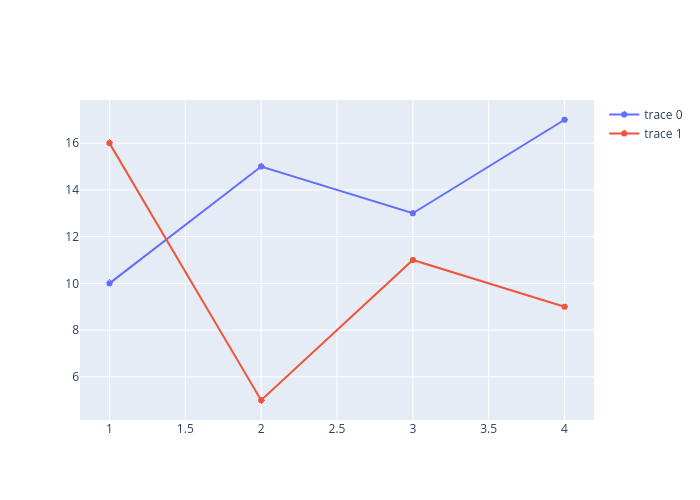
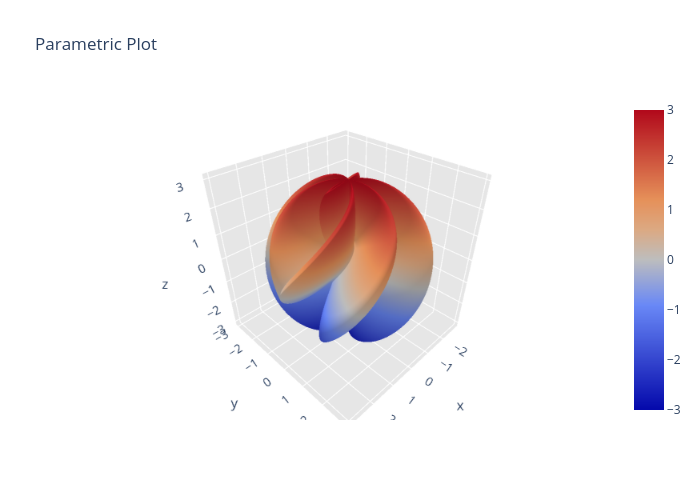
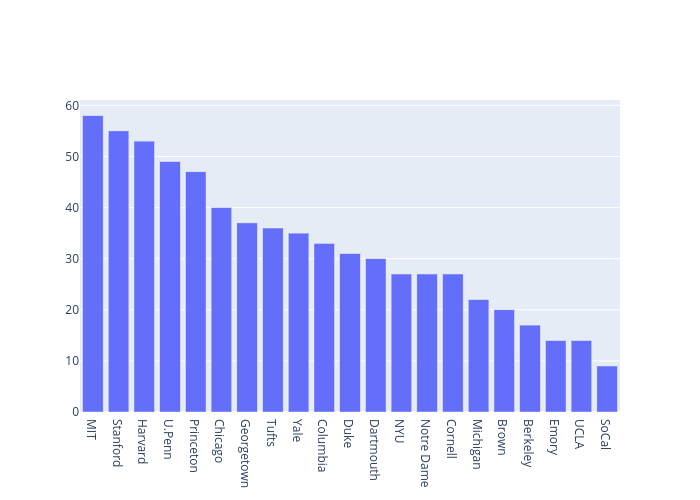
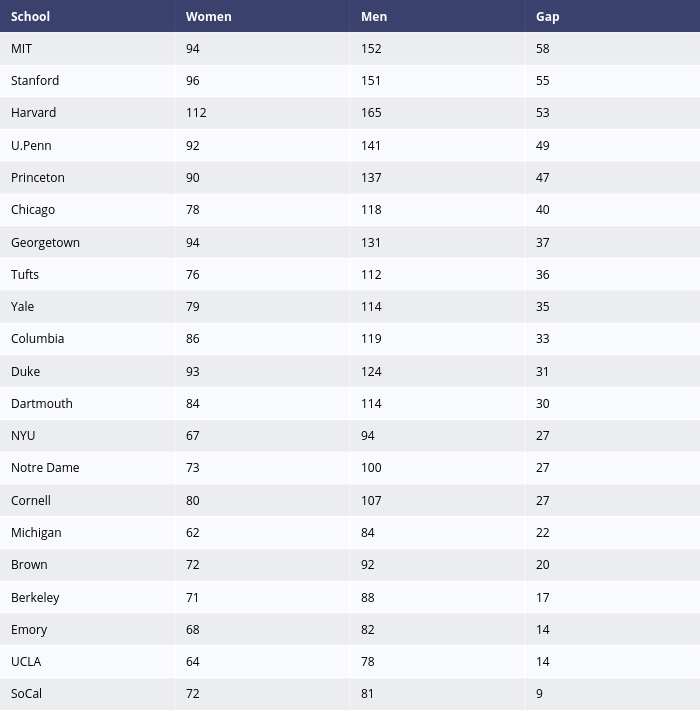