Plots List
Plots
This endpoint handles manipulation of Plotly plot files.
Reference
Authorization
Any user with or without a Plotly account may view public plots. For private plots, see authentication.
Actions
list
Listing all public plots can be done via a GET request to this endpoint.
By default, plots will be listed in order of date created. The order_by
query parameter is accepted at this endpoint. Currently, only ordering by
views is supported. It is possible to filter the plots by quality
with min_quality or max_quality as query parameter.
Example:
// GET https://api.plotly.com/v2/plots/ ---> 200

// GET https://api.plotly.com/v2/plots/?order_by=-views ---> 200

// GET https://api.plotly.com/v2/plots/?min_quality=5 ---> 200

// GET https://api.plotly.com/v2/plots/?max_quality=5 ---> 200
feed
Listing all handpicked feed plots can be done via a GET request to this endpoint. By default, plots will be listed in a random order.
Example:
// GET https://api.plotly.com/v2/plots/feed ---> 200
create
You can create new plot resources here. The only required field is 'figure'. Currently, the figure is restricted to only contain references to grid data. That is, this will fail if raw data arrays are passed in. To create and manipulate underlying grids for plots, see the grids endpoint.
Example:
// This fails because a figure field is required.
// POST https://api.plotly.com/v2/plots ---> 400 Bad Request
{}

// This fails because the figure has raw data
//POST https://api.plotly.com/v2/plots ---> 400 Bad Request
{
    "figure": {"data": [{"y": ['this', 'is', 'raw', 'data']}]}
}

// This succeeds because the figure has src keys, not raw data.
//POST https://api.plotly.com/v2/plots ---> 200 OK
{
    "figure": {"data": [{"ysrc": "sven:88:u8nd62"}]}
}
When creating a grid, you can optionally specify a source_fid to specify where a plot has come from:
- source_fid: the fid of a plot that was copied (and presumably edited) to produce this one
detail
There is a lot of meta information stored about plot files including filename, title, share_url, and content_url to name a few.
This information can only be reached with a GET to this endpoint.
Example:
// GET https://api.plotly.com/v2/plots/iheartgraphs:90
content
The contents of a plot can be downloaded via the content resource. The plot
content contains referenced grid/column data by default. If you wish to
return the raw grid/column data, the inline_data=true query must be included
in the request url. The Content-Type header will be appropriately set for the
response body.
Alternatively, you can set ?map_data=unreadable to append a mapping of
sources to data that belongs to grids which are unreadable for the
requestor. This is useful when you have read access to another users plot,
but that plot contains grid references which you don't have access to.
Examples:
// Returns referenced grid/column data
// GET https://api.plotly.com/v2/plots/iheartgraphs:90/content ---> 200 OK

// Returns full grid/column data
// GET https://api.plotly.com/v2/plots/iheartgraphs:90/content?inline_data=true ---> 200 OK

// Returns full grid/column data when requestor doesn't have permission
// to read the referenced grid.
// GET https://api.plotly.com/v2/plots/iheartgraphs:90/content?map_data=unreadable ---> 200 OK
GET /v2/plots?cursor=cj0xJnA9MjAyNC0wNC0xNiswMiUzQTA0JTNBMzUuMjA5MjkyJTJCMDAlM0EwMA%3D%3D&format=api
{ "next": "https://api.plot.ly/v2/plots?cursor=cD0yMDI0LTA0LTE2KzAyJTNBMjYlM0EwOS4yNjM2NTglMkIwMCUzQTAw&format=api", "previous": "https://api.plot.ly/v2/plots?cursor=cj0xJnA9MjAyNC0wNC0xNiswMiUzQTU5JTNBMzAuNjI5Mjc5JTJCMDAlM0EwMA%3D%3D&format=api", "results": [ { "creation_time": "2024-04-16T02:59:30.629279Z", "comments": { "results": [], "count": 0 }, "parented": true, "embed_url": "https://chart-studio.plotly.com/~asongupup/164.embed", "fid": "asongupup:164", "filename": "CH8_6Hz_150mV", "filetype": "plot", "img_url": "https://storage.googleapis.com/plotly-prod-images/asongupup/164/9_H7O23GHZQ3UY6ZSMCIA792FINS79I7.png", "image_urls": { "default": "https://storage.googleapis.com/plotly-prod-images/asongupup/164/2_1DKX8O4DWEXJ43C4S97CQYU1OMC7U8.png", "block-thumb": "https://storage.googleapis.com/plotly-prod-images/asongupup/164/8_AV5X20MMGAQIV1PP7NLM5MJM0IUX4I.png", "list-thumb": "https://storage.googleapis.com/plotly-prod-images/asongupup/164/9_H7O23GHZQ3UY6ZSMCIA792FINS79I7.png" }, "api_urls": { "files": "https://api.plotly.com/v2/files/asongupup:164", "plots": "https://api.plotly.com/v2/plots/asongupup:164", "parent": "https://api.plotly.com/v2/folders/home?user=asongupup" }, "owner": "asongupup", "parent": -1, "preview": "", "referencers": [], "references": [], "title": "<b></b>", "views": 2, "web_url": "https://chart-studio.plotly.com/~asongupup/164/", "world_readable": true, "date_modified": "2024-04-16T02:59:31.211Z", "stars": { "results": [], "count": 0 }, "collaborators": { "results": [], "count": 0 }, "subfolder_count": null, "refresh_interval": null, "organize_view_url": "https://chart-studio.plotly.com/~asongupup/164/", "current_user_permission": "read", "is_theme": null, "is_template": null, "autosize": false, "caption": "", "figure": { "data": [ { "line": { "dash": "solid", "color": "rgb(0,113.985,188.955)", "width": 0.5 }, "mode": "lines", "name": "", "type": "scatter", "xsrc": "asongupup:165:c24c6f", "ysrc": "asongupup:165:034ecc", "xaxis": "x1", "yaxis": "y1", "marker": { "line": { "width": 0.5 }, "size": 3.6, "color": "rgb(0,113.985,188.955)" }, "visible": true, "showlegend": false }, { "line": { "dash": "solid", "color": "rgb(0,113.985,188.955)", "width": 0.5 }, "mode": "lines", "name": "", "type": "scatter", "xsrc": "asongupup:165:b7d20e", "ysrc": "asongupup:165:d95288", "xaxis": "x2", "yaxis": "y2", "marker": { "line": { "width": 0.5 }, "size": 3.6, "color": "rgb(0,113.985,188.955)" }, "visible": true, "showlegend": false } ], "layout": { "title": "<b></b>", "width": 840, "height": 630, "margin": { "b": 0, "l": 0, "r": 0, "t": 0, "pad": 0 }, "scene1": { "domain": { "x": [ 0.13, 0.905 ], "y": [ 0.583837209302326, 0.925 ] } }, "scene2": { "domain": { "x": [ 0.13, 0.905 ], "y": [ 0.11, 0.451162790697674 ] } }, "xaxis1": { "side": "bottom", "type": "linear", "range": [ 0, 50 ], "ticks": "inside", "title": "Time (s)", "anchor": "y1", "domain": [ 0.13, 0.905 ], "mirror": "ticks", "ticklen": 6.51, "showgrid": false, "showline": true, "tickfont": { "size": 9, "color": "rgb(38.250000,38.250000,38.250000)", "family": "Arial, sans-serif" }, "tickmode": "array", "ticktext": [ "0", "5", "10", "15", "20", "25", "30", "35", "40", "45", "50" ], "tickvals": [ 0, 5, 10, 15, 20, 25, 30, 35, 40, 45, 50 ], "zeroline": false, "autorange": false, "gridcolor": "rgba(38.250000,,38.250000,38.250000,0.150000)", "linecolor": "rgb(38.250000,38.250000,38.250000)", "linewidth": 1, "tickangle": 0, "tickcolor": "rgb(38.250000,38.250000,38.250000)", "tickwidth": 1, "titlefont": { "size": 9.9, "color": "rgb(38.250000,38.250000,38.250000)", "family": "Arial, sans-serif" }, "exponentformat": "none", "showticklabels": true }, "xaxis2": { "side": "bottom", "type": "linear", "range": [ 0, 250 ], "ticks": "inside", "title": "Frequency (Hz)", "anchor": "y2", "domain": [ 0.13, 0.905 ], "mirror": "ticks", "ticklen": 6.51, "showgrid": false, "showline": true, "tickfont": { "size": 9, "color": "rgb(38.250000,38.250000,38.250000)", "family": "Arial, sans-serif" }, "tickmode": "array", "ticktext": [ "0", "50", "100", "150", "200", "250" ], "tickvals": [ 0, 50, 100, 150, 200, 250 ], "zeroline": false, "autorange": false, "gridcolor": "rgba(38.250000,,38.250000,38.250000,0.150000)", "linecolor": "rgb(38.250000,38.250000,38.250000)", "linewidth": 1, "tickangle": 0, "tickcolor": "rgb(38.250000,38.250000,38.250000)", "tickwidth": 1, "titlefont": { "size": 9.9, "color": "rgb(38.250000,38.250000,38.250000)", "family": "Arial, sans-serif" }, "exponentformat": "none", "showticklabels": true }, "yaxis1": { "side": "left", "type": "linear", "range": [ -150000, -148967.800414697 ], "ticks": "inside", "title": "uV", "anchor": "x1", "domain": [ 0.583837209302326, 0.925 ], "mirror": "ticks", "ticklen": 6.51, "showgrid": false, "showline": true, "tickfont": { "size": 9, "color": "rgb(38.250000,38.250000,38.250000)", "family": "Arial, sans-serif" }, "tickmode": "array", "ticktext": [ "-1.5", "-1.495", "-1.49" ], "tickvals": [ -150000, -149500, -149000 ], "zeroline": false, "autorange": false, "gridcolor": "rgba(38.250000,,38.250000,38.250000,0.150000)", "linecolor": "rgb(38.250000,38.250000,38.250000)", "linewidth": 1, "tickangle": 0, "tickcolor": "rgb(38.250000,38.250000,38.250000)", "tickwidth": 1, "titlefont": { "size": 9.9, "color": "rgb(38.250000,38.250000,38.250000)", "family": "Arial, sans-serif" }, "exponentformat": "none", "showticklabels": true }, "yaxis2": { "side": "left", "type": "linear", "range": [ 0, 300000 ], "ticks": "inside", "title": "Amplitude", "anchor": "x2", "domain": [ 0.11, 0.451162790697674 ], "mirror": "ticks", "ticklen": 6.51, "showgrid": false, "showline": true, "tickfont": { "size": 9, "color": "rgb(38.250000,38.250000,38.250000)", "family": "Arial, sans-serif" }, "tickmode": "array", "ticktext": [ "0", "1", "2", "3" ], "tickvals": [ 0, 100000, 200000, 300000 ], "zeroline": false, "autorange": false, "gridcolor": "rgba(38.250000,,38.250000,38.250000,0.150000)", "linecolor": "rgb(38.250000,38.250000,38.250000)", "linewidth": 1, "tickangle": 0, "tickcolor": "rgb(38.250000,38.250000,38.250000)", "tickwidth": 1, "titlefont": { "size": 9.9, "color": "rgb(38.250000,38.250000,38.250000)", "family": "Arial, sans-serif" }, "exponentformat": "none", "showticklabels": true }, "autosize": false, "hovermode": "closest", "titlefont": { "color": "rgba(0,0,0,0)" }, "showlegend": false, "annotations": [ { "x": 0.5175, "y": 0.935, "font": { "size": 9.9, "color": "rgb(0,0,0)", "family": "Arial, sans-serif" }, "text": "<b></b>", "xref": "paper", "yref": "paper", "align": "center", "xanchor": "center", "yanchor": "bottom", "borderpad": 3, "showarrow": false, "textangle": 0, "bordercolor": "rgba(0,0,0,0)", "borderwidth": 0.5 }, { "x": 0.5175, "y": 0.461162790697674, "font": { "size": 9.9, "color": "rgb(0,0,0)", "family": "Arial, sans-serif" }, "text": "$\\text{CH8,CH8}_6\\text{Hz}_1\\text{50mV}$", "xref": "paper", "yref": "paper", "align": "center", "xanchor": "center", "yanchor": "bottom", "borderpad": 3, "showarrow": false, "textangle": 0, "bordercolor": "rgba(0,0,0,0)", "borderwidth": 0.5 }, { "x": 0, "y": 300000, "font": { "size": 9, "color": "rgb(38.250000,38.250000,38.250000)", "family": "Arial, sans-serif" }, "text": "x10^5", "xref": "x2", "yref": "y2", "xanchor": "left", "yanchor": "bottom", "showarrow": false } ], "paper_bgcolor": "rgb(255,255,255)" } }, "height": 630, "width": 840, "user": { "profile_url": "https://chart-studio.plotly.com/~asongupup", "avatar_url": "https://storage.googleapis.com/plotly-prod-profiles/6.jpg", "background_url": "https://storage.googleapis.com/plotly-prod-profiles/bg-5.jpg", "bio": "", "nickname": "", "website": "", "stream_tokens": null, "feature_set_id": null, "csrf_token": null, "date_joined": "2024-02-27 02:46:05", "mapbox_access_tokens": null, "has_password": null, "username": "asongupup", "email": null, "is_active": null, "readonly": null, "is_dash_creator": null, "dash_created_count": null, "is_chart_creator": null, "charts_created_count": null } }, { "creation_time": "2024-04-16T02:57:48.799767Z", "comments": { "results": [], "count": 0 }, "parented": true, "embed_url": "https://chart-studio.plotly.com/~Prashanth.klv/18.embed", "fid": "Prashanth.klv:18", "filename": "7. week_trace", "filetype": "plot", "img_url": "https://storage.googleapis.com/plotly-prod-images/Prashanth.klv/18/9_5S2W3NNLWM1AEUQUKHNZN8YXQD4DQC.png", "image_urls": { "default": "https://storage.googleapis.com/plotly-prod-images/Prashanth.klv/18/2_84A4SIWBKQ7YFXAWR3UB1QJWEK4PXE.png", "block-thumb": "https://storage.googleapis.com/plotly-prod-images/Prashanth.klv/18/8_Y9DQX7X0511V2GD06ARN61GAU9GUU8.png", "list-thumb": "https://storage.googleapis.com/plotly-prod-images/Prashanth.klv/18/9_5S2W3NNLWM1AEUQUKHNZN8YXQD4DQC.png" }, "api_urls": { "files": "https://api.plotly.com/v2/files/Prashanth.klv:18", "plots": "https://api.plotly.com/v2/plots/Prashanth.klv:18", "parent": "https://api.plotly.com/v2/folders/home?user=Prashanth.klv" }, "owner": "Prashanth.klv", "parent": -1, "preview": "", "referencers": [], "references": [], "title": "", "views": 2, "web_url": "https://chart-studio.plotly.com/~Prashanth.klv/18/", "world_readable": true, "date_modified": "2024-04-16T02:57:48.810Z", "stars": { "results": [], "count": 0 }, "collaborators": { "results": [], "count": 0 }, "subfolder_count": null, "refresh_interval": null, "organize_view_url": "https://chart-studio.plotly.com/~Prashanth.klv/18/", "current_user_permission": "read", "is_theme": null, "is_template": null, "autosize": true, "caption": "", "figure": { "data": [ { "line": { "dash": "solid", "color": "#636efa" }, "mode": "markers+lines", "name": "2018", "type": "scatter", "xsrc": "Prashanth.klv:17:1442a6", "ysrc": "Prashanth.klv:17:7ebda6", "xaxis": "x", "yaxis": "y", "marker": { "symbol": "circle" }, "showlegend": true, "legendgroup": "2018", "orientation": "v", "textposition": "bottom right", "customdatasrc": "Prashanth.klv:17:d25979", "hovertemplate": "year=%{customdata[0]}<br>number_of_collisions=%{y}<br>number_of_total_casualties=%{customdata[1]}<br>number_of_cyclist_injured=%{customdata[2]}<br>number_of_cyclist_killed=%{customdata[3]}<br>number_of_motorist_injured=%{customdata[4]}<br>number_of_motorist_killed=%{customdata[5]}<br>number_of_pedestrians_injured=%{customdata[6]}<br>number_of_pedestrians_killed=%{customdata[7]}<br>number_of_persons_injured=%{customdata[8]}<br>number_of_persons_killed=%{customdata[9]}<extra></extra>" }, { "line": { "dash": "solid", "color": "#EF553B" }, "mode": "markers+lines", "name": "2019", "type": "scatter", "xsrc": "Prashanth.klv:17:81225c", "ysrc": "Prashanth.klv:17:a1a251", "xaxis": "x", "yaxis": "y", "marker": { "symbol": "circle" }, "showlegend": true, "legendgroup": "2019", "orientation": "v", "textposition": "bottom right", "customdatasrc": "Prashanth.klv:17:ea4a1d", "hovertemplate": "year=%{customdata[0]}<br>number_of_collisions=%{y}<br>number_of_total_casualties=%{customdata[1]}<br>number_of_cyclist_injured=%{customdata[2]}<br>number_of_cyclist_killed=%{customdata[3]}<br>number_of_motorist_injured=%{customdata[4]}<br>number_of_motorist_killed=%{customdata[5]}<br>number_of_pedestrians_injured=%{customdata[6]}<br>number_of_pedestrians_killed=%{customdata[7]}<br>number_of_persons_injured=%{customdata[8]}<br>number_of_persons_killed=%{customdata[9]}<extra></extra>" }, { "line": { "dash": "solid", "color": "#00cc96" }, "mode": "markers+lines", "name": "2020", "type": "scatter", "xsrc": "Prashanth.klv:17:92d154", "ysrc": "Prashanth.klv:17:bb07bf", "xaxis": "x", "yaxis": "y", "marker": { "symbol": "circle" }, "showlegend": true, "legendgroup": "2020", "orientation": "v", "textposition": "bottom right", "customdatasrc": "Prashanth.klv:17:1c905f", "hovertemplate": "year=%{customdata[0]}<br>number_of_collisions=%{y}<br>number_of_total_casualties=%{customdata[1]}<br>number_of_cyclist_injured=%{customdata[2]}<br>number_of_cyclist_killed=%{customdata[3]}<br>number_of_motorist_injured=%{customdata[4]}<br>number_of_motorist_killed=%{customdata[5]}<br>number_of_pedestrians_injured=%{customdata[6]}<br>number_of_pedestrians_killed=%{customdata[7]}<br>number_of_persons_injured=%{customdata[8]}<br>number_of_persons_killed=%{customdata[9]}<extra></extra>" }, { "line": { "dash": "solid", "color": "#ab63fa" }, "mode": "markers+lines", "name": "2021", "type": "scatter", "xsrc": "Prashanth.klv:17:b7d6dd", "ysrc": "Prashanth.klv:17:46152c", "xaxis": "x", "yaxis": "y", "marker": { "symbol": "circle" }, "showlegend": true, "legendgroup": "2021", "orientation": "v", "textposition": "bottom right", "customdatasrc": "Prashanth.klv:17:37c238", "hovertemplate": "year=%{customdata[0]}<br>number_of_collisions=%{y}<br>number_of_total_casualties=%{customdata[1]}<br>number_of_cyclist_injured=%{customdata[2]}<br>number_of_cyclist_killed=%{customdata[3]}<br>number_of_motorist_injured=%{customdata[4]}<br>number_of_motorist_killed=%{customdata[5]}<br>number_of_pedestrians_injured=%{customdata[6]}<br>number_of_pedestrians_killed=%{customdata[7]}<br>number_of_persons_injured=%{customdata[8]}<br>number_of_persons_killed=%{customdata[9]}<extra></extra>" }, { "line": { "dash": "solid", "color": "#FFA15A" }, "mode": "markers+lines", "name": "2022", "type": "scatter", "xsrc": "Prashanth.klv:17:328407", "ysrc": "Prashanth.klv:17:76524a", "xaxis": "x", "yaxis": "y", "marker": { "symbol": "circle" }, "showlegend": true, "legendgroup": "2022", "orientation": "v", "textposition": "bottom right", "customdatasrc": "Prashanth.klv:17:972d6e", "hovertemplate": "year=%{customdata[0]}<br>number_of_collisions=%{y}<br>number_of_total_casualties=%{customdata[1]}<br>number_of_cyclist_injured=%{customdata[2]}<br>number_of_cyclist_killed=%{customdata[3]}<br>number_of_motorist_injured=%{customdata[4]}<br>number_of_motorist_killed=%{customdata[5]}<br>number_of_pedestrians_injured=%{customdata[6]}<br>number_of_pedestrians_killed=%{customdata[7]}<br>number_of_persons_injured=%{customdata[8]}<br>number_of_persons_killed=%{customdata[9]}<extra></extra>" } ], "layout": { "title": { "x": 0.5, "text": "Number of Collisions on different days of the week for different Calendar Years" }, "xaxis": { "ticks": "outside", "title": { "text": "day_of_the_week_name" }, "anchor": "y", "domain": [ 0.0, 1.0 ], "tickson": "boundaries", "tickvals": [ 0, 1, 2, 3, 4, 5, 6, 7, 8, 9, 10, 11, 12, 13, 14, 15, 16, 17, 18, 19, 20, 21, 22, 23 ] }, "yaxis": { "title": { "text": "number_of_collisions" }, "anchor": "x", "domain": [ 0.0, 1.0 ] }, "legend": { "title": { "text": "year" }, "tracegroupgap": 0 }, "margin": { "t": 60 }, "template": { "data": { "bar": [ { "type": "bar", "marker": { "line": { "color": "rgb(17,17,17)", "width": 0.5 }, "pattern": { "size": 10, "fillmode": "overlay", "solidity": 0.2 } }, "error_x": { "color": "#f2f5fa" }, "error_y": { "color": "#f2f5fa" } } ], "pie": [ { "type": "pie", "automargin": true } ], "table": [ { "type": "table", "cells": { "fill": { "color": "#506784" }, "line": { "color": "rgb(17,17,17)" } }, "header": { "fill": { "color": "#2a3f5f" }, "line": { "color": "rgb(17,17,17)" } } } ], "carpet": [ { "type": "carpet", "aaxis": { "gridcolor": "#506784", "linecolor": "#506784", "endlinecolor": "#A2B1C6", "minorgridcolor": "#506784", "startlinecolor": "#A2B1C6" }, "baxis": { "gridcolor": "#506784", "linecolor": "#506784", "endlinecolor": "#A2B1C6", "minorgridcolor": "#506784", "startlinecolor": "#A2B1C6" } } ], "mesh3d": [ { "type": "mesh3d", "colorbar": { "ticks": "", "outlinewidth": 0 } } ], "contour": [ { "type": "contour", "colorbar": { "ticks": "", "outlinewidth": 0 }, "colorscale": [ [ 0.0, "#0d0887" ], [ 0.1111111111111111, "#46039f" ], [ 0.2222222222222222, "#7201a8" ], [ 0.3333333333333333, "#9c179e" ], [ 0.4444444444444444, "#bd3786" ], [ 0.5555555555555556, "#d8576b" ], [ 0.6666666666666666, "#ed7953" ], [ 0.7777777777777778, "#fb9f3a" ], [ 0.8888888888888888, "#fdca26" ], [ 1.0, "#f0f921" ] ] } ], "heatmap": [ { "type": "heatmap", "colorbar": { "ticks": "", "outlinewidth": 0 }, "colorscale": [ [ 0.0, "#0d0887" ], [ 0.1111111111111111, "#46039f" ], [ 0.2222222222222222, "#7201a8" ], [ 0.3333333333333333, "#9c179e" ], [ 0.4444444444444444, "#bd3786" ], [ 0.5555555555555556, "#d8576b" ], [ 0.6666666666666666, "#ed7953" ], [ 0.7777777777777778, "#fb9f3a" ], [ 0.8888888888888888, "#fdca26" ], [ 1.0, "#f0f921" ] ] } ], "scatter": [ { "type": "scatter", "marker": { "line": { "color": "#283442" } } } ], "surface": [ { "type": "surface", "colorbar": { "ticks": "", "outlinewidth": 0 }, "colorscale": [ [ 0.0, "#0d0887" ], [ 0.1111111111111111, "#46039f" ], [ 0.2222222222222222, "#7201a8" ], [ 0.3333333333333333, "#9c179e" ], [ 0.4444444444444444, "#bd3786" ], [ 0.5555555555555556, "#d8576b" ], [ 0.6666666666666666, "#ed7953" ], [ 0.7777777777777778, "#fb9f3a" ], [ 0.8888888888888888, "#fdca26" ], [ 1.0, "#f0f921" ] ] } ], "barpolar": [ { "type": "barpolar", "marker": { "line": { "color": "rgb(17,17,17)", "width": 0.5 }, "pattern": { "size": 10, "fillmode": "overlay", "solidity": 0.2 } } } ], "heatmapgl": [ { "type": "heatmapgl", "colorbar": { "ticks": "", "outlinewidth": 0 }, "colorscale": [ [ 0.0, "#0d0887" ], [ 0.1111111111111111, "#46039f" ], [ 0.2222222222222222, "#7201a8" ], [ 0.3333333333333333, "#9c179e" ], [ 0.4444444444444444, "#bd3786" ], [ 0.5555555555555556, "#d8576b" ], [ 0.6666666666666666, "#ed7953" ], [ 0.7777777777777778, "#fb9f3a" ], [ 0.8888888888888888, "#fdca26" ], [ 1.0, "#f0f921" ] ] } ], "histogram": [ { "type": "histogram", "marker": { "pattern": { "size": 10, "fillmode": "overlay", "solidity": 0.2 } } } ], "parcoords": [ { "line": { "colorbar": { "ticks": "", "outlinewidth": 0 } }, "type": "parcoords" } ], "scatter3d": [ { "line": { "colorbar": { "ticks": "", "outlinewidth": 0 } }, "type": "scatter3d", "marker": { "colorbar": { "ticks": "", "outlinewidth": 0 } } } ], "scattergl": [ { "type": "scattergl", "marker": { "line": { "color": "#283442" } } } ], "choropleth": [ { "type": "choropleth", "colorbar": { "ticks": "", "outlinewidth": 0 } } ], "scattergeo": [ { "type": "scattergeo", "marker": { "colorbar": { "ticks": "", "outlinewidth": 0 } } } ], "histogram2d": [ { "type": "histogram2d", "colorbar": { "ticks": "", "outlinewidth": 0 }, "colorscale": [ [ 0.0, "#0d0887" ], [ 0.1111111111111111, "#46039f" ], [ 0.2222222222222222, "#7201a8" ], [ 0.3333333333333333, "#9c179e" ], [ 0.4444444444444444, "#bd3786" ], [ 0.5555555555555556, "#d8576b" ], [ 0.6666666666666666, "#ed7953" ], [ 0.7777777777777778, "#fb9f3a" ], [ 0.8888888888888888, "#fdca26" ], [ 1.0, "#f0f921" ] ] } ], "scatterpolar": [ { "type": "scatterpolar", "marker": { "colorbar": { "ticks": "", "outlinewidth": 0 } } } ], "contourcarpet": [ { "type": "contourcarpet", "colorbar": { "ticks": "", "outlinewidth": 0 } } ], "scattercarpet": [ { "type": "scattercarpet", "marker": { "colorbar": { "ticks": "", "outlinewidth": 0 } } } ], "scattermapbox": [ { "type": "scattermapbox", "marker": { "colorbar": { "ticks": "", "outlinewidth": 0 } } } ], "scatterpolargl": [ { "type": "scatterpolargl", "marker": { "colorbar": { "ticks": "", "outlinewidth": 0 } } } ], "scatterternary": [ { "type": "scatterternary", "marker": { "colorbar": { "ticks": "", "outlinewidth": 0 } } } ], "histogram2dcontour": [ { "type": "histogram2dcontour", "colorbar": { "ticks": "", "outlinewidth": 0 }, "colorscale": [ [ 0.0, "#0d0887" ], [ 0.1111111111111111, "#46039f" ], [ 0.2222222222222222, "#7201a8" ], [ 0.3333333333333333, "#9c179e" ], [ 0.4444444444444444, "#bd3786" ], [ 0.5555555555555556, "#d8576b" ], [ 0.6666666666666666, "#ed7953" ], [ 0.7777777777777778, "#fb9f3a" ], [ 0.8888888888888888, "#fdca26" ], [ 1.0, "#f0f921" ] ] } ] }, "layout": { "geo": { "bgcolor": "rgb(17,17,17)", "showland": true, "lakecolor": "rgb(17,17,17)", "landcolor": "rgb(17,17,17)", "showlakes": true, "subunitcolor": "#506784" }, "font": { "color": "#f2f5fa" }, "polar": { "bgcolor": "rgb(17,17,17)", "radialaxis": { "ticks": "", "gridcolor": "#506784", "linecolor": "#506784" }, "angularaxis": { "ticks": "", "gridcolor": "#506784", "linecolor": "#506784" } }, "scene": { "xaxis": { "ticks": "", "gridcolor": "#506784", "gridwidth": 2, "linecolor": "#506784", "zerolinecolor": "#C8D4E3", "showbackground": true, "backgroundcolor": "rgb(17,17,17)" }, "yaxis": { "ticks": "", "gridcolor": "#506784", "gridwidth": 2, "linecolor": "#506784", "zerolinecolor": "#C8D4E3", "showbackground": true, "backgroundcolor": "rgb(17,17,17)" }, "zaxis": { "ticks": "", "gridcolor": "#506784", "gridwidth": 2, "linecolor": "#506784", "zerolinecolor": "#C8D4E3", "showbackground": true, "backgroundcolor": "rgb(17,17,17)" } }, "title": { "x": 0.05 }, "xaxis": { "ticks": "", "title": { "standoff": 15 }, "gridcolor": "#283442", "linecolor": "#506784", "automargin": true, "zerolinecolor": "#283442", "zerolinewidth": 2 }, "yaxis": { "ticks": "", "title": { "standoff": 15 }, "gridcolor": "#283442", "linecolor": "#506784", "automargin": true, "zerolinecolor": "#283442", "zerolinewidth": 2 }, "mapbox": { "style": "dark" }, "ternary": { "aaxis": { "ticks": "", "gridcolor": "#506784", "linecolor": "#506784" }, "baxis": { "ticks": "", "gridcolor": "#506784", "linecolor": "#506784" }, "caxis": { "ticks": "", "gridcolor": "#506784", "linecolor": "#506784" }, "bgcolor": "rgb(17,17,17)" }, "colorway": [ "#636efa", "#EF553B", "#00cc96", "#ab63fa", "#FFA15A", "#19d3f3", "#FF6692", "#B6E880", "#FF97FF", "#FECB52" ], "coloraxis": { "colorbar": { "ticks": "", "outlinewidth": 0 } }, "hovermode": "closest", "colorscale": { "diverging": [ [ 0, "#8e0152" ], [ 0.1, "#c51b7d" ], [ 0.2, "#de77ae" ], [ 0.3, "#f1b6da" ], [ 0.4, "#fde0ef" ], [ 0.5, "#f7f7f7" ], [ 0.6, "#e6f5d0" ], [ 0.7, "#b8e186" ], [ 0.8, "#7fbc41" ], [ 0.9, "#4d9221" ], [ 1, "#276419" ] ], "sequential": [ [ 0.0, "#0d0887" ], [ 0.1111111111111111, "#46039f" ], [ 0.2222222222222222, "#7201a8" ], [ 0.3333333333333333, "#9c179e" ], [ 0.4444444444444444, "#bd3786" ], [ 0.5555555555555556, "#d8576b" ], [ 0.6666666666666666, "#ed7953" ], [ 0.7777777777777778, "#fb9f3a" ], [ 0.8888888888888888, "#fdca26" ], [ 1.0, "#f0f921" ] ], "sequentialminus": [ [ 0.0, "#0d0887" ], [ 0.1111111111111111, "#46039f" ], [ 0.2222222222222222, "#7201a8" ], [ 0.3333333333333333, "#9c179e" ], [ 0.4444444444444444, "#bd3786" ], [ 0.5555555555555556, "#d8576b" ], [ 0.6666666666666666, "#ed7953" ], [ 0.7777777777777778, "#fb9f3a" ], [ 0.8888888888888888, "#fdca26" ], [ 1.0, "#f0f921" ] ] }, "hoverlabel": { "align": "left" }, "plot_bgcolor": "rgb(17,17,17)", "paper_bgcolor": "rgb(17,17,17)", "shapedefaults": { "line": { "color": "#f2f5fa" } }, "sliderdefaults": { "bgcolor": "#C8D4E3", "tickwidth": 0, "bordercolor": "rgb(17,17,17)", "borderwidth": 1 }, "autotypenumbers": "strict", "annotationdefaults": { "arrowhead": 0, "arrowcolor": "#f2f5fa", "arrowwidth": 1 }, "updatemenudefaults": { "bgcolor": "#506784", "borderwidth": 0 } } }, "hoverlabel": { "font": { "size": 12, "family": "Rockwell" }, "bgcolor": "dimgray" } } }, "height": null, "width": null, "user": { "profile_url": "https://chart-studio.plotly.com/~Prashanth.klv", "avatar_url": "https://storage.googleapis.com/plotly-prod-profiles/14.jpg", "background_url": "https://storage.googleapis.com/plotly-prod-profiles/bg-13.jpg", "bio": "", "nickname": "", "website": "", "stream_tokens": null, "feature_set_id": null, "csrf_token": null, "date_joined": "2024-04-13 00:25:15", "mapbox_access_tokens": null, "has_password": null, "username": "Prashanth.klv", "email": null, "is_active": null, "readonly": null, "is_dash_creator": null, "dash_created_count": null, "is_chart_creator": null, "charts_created_count": null } }, { "creation_time": "2024-04-16T02:57:44.181251Z", "comments": { "results": [], "count": 0 }, "parented": true, "embed_url": "https://chart-studio.plotly.com/~asongupup/162.embed", "fid": "asongupup:162", "filename": "CH8_50uV_6Hz", "filetype": "plot", "img_url": "https://storage.googleapis.com/plotly-prod-images/asongupup/162/9_5D38LK49MD9I2I43CU0MAKTL40OQRZ.png", "image_urls": { "default": "https://storage.googleapis.com/plotly-prod-images/asongupup/162/2_2BZLJDCJ8AX12NC9PJ6QKFJ3HULLI5.png", "block-thumb": "https://storage.googleapis.com/plotly-prod-images/asongupup/162/8_37FVPFDIYKH0LX9DICX319P7JAIKYL.png", "list-thumb": "https://storage.googleapis.com/plotly-prod-images/asongupup/162/9_5D38LK49MD9I2I43CU0MAKTL40OQRZ.png" }, "api_urls": { "files": "https://api.plotly.com/v2/files/asongupup:162", "plots": "https://api.plotly.com/v2/plots/asongupup:162", "parent": "https://api.plotly.com/v2/folders/home?user=asongupup" }, "owner": "asongupup", "parent": -1, "preview": "", "referencers": [], "references": [], "title": "<b></b>", "views": 1, "web_url": "https://chart-studio.plotly.com/~asongupup/162/", "world_readable": true, "date_modified": "2024-04-16T02:57:44.883Z", "stars": { "results": [], "count": 0 }, "collaborators": { "results": [], "count": 0 }, "subfolder_count": null, "refresh_interval": null, "organize_view_url": "https://chart-studio.plotly.com/~asongupup/162/", "current_user_permission": "read", "is_theme": null, "is_template": null, "autosize": false, "caption": "", "figure": { "data": [ { "line": { "dash": "solid", "color": "rgb(0,113.985,188.955)", "width": 0.5 }, "mode": "lines", "name": "", "type": "scatter", "xsrc": "asongupup:163:827e1b", "ysrc": "asongupup:163:2c9ecd", "xaxis": "x1", "yaxis": "y1", "marker": { "line": { "width": 0.5 }, "size": 3.6, "color": "rgb(0,113.985,188.955)" }, "visible": true, "showlegend": false }, { "line": { "dash": "solid", "color": "rgb(0,113.985,188.955)", "width": 0.5 }, "mode": "lines", "name": "", "type": "scatter", "xsrc": "asongupup:163:533724", "ysrc": "asongupup:163:29cb47", "xaxis": "x2", "yaxis": "y2", "marker": { "line": { "width": 0.5 }, "size": 3.6, "color": "rgb(0,113.985,188.955)" }, "visible": true, "showlegend": false }, { "line": { "dash": "solid", "color": "rgb(0,113.985,188.955)", "width": 0.5 }, "mode": "lines", "name": "", "type": "scatter", "xsrc": "asongupup:163:533724", "ysrc": "asongupup:163:9b88ae", "xaxis": "x3", "yaxis": "y3", "marker": { "line": { "width": 0.5 }, "size": 3.6, "color": "rgb(0,113.985,188.955)" }, "visible": true, "showlegend": false } ], "layout": { "title": "<b></b>", "width": 840, "height": 630, "margin": { "b": 0, "l": 0, "r": 0, "t": 0, "pad": 0 }, "scene1": { "domain": { "x": [ 0.13, 0.905 ], "y": [ 0.709264705882353, 0.925 ] } }, "scene2": { "domain": { "x": [ 0.13, 0.905 ], "y": [ 0.409632352941176, 0.625367647058824 ] } }, "scene3": { "domain": { "x": [ 0.13, 0.905 ], "y": [ 0.11, 0.325735294117647 ] } }, "xaxis1": { "side": "bottom", "type": "linear", "range": [ 0, 50 ], "ticks": "inside", "title": "Time (s)", "anchor": "y1", "domain": [ 0.13, 0.905 ], "mirror": "ticks", "ticklen": 6.51, "showgrid": false, "showline": true, "tickfont": { "size": 8, "color": "rgb(38.250000,38.250000,38.250000)", "family": "Arial, sans-serif" }, "tickmode": "array", "ticktext": [ "0", "5", "10", "15", "20", "25", "30", "35", "40", "45", "50" ], "tickvals": [ 0, 5, 10, 15, 20, 25, 30, 35, 40, 45, 50 ], "zeroline": false, "autorange": false, "gridcolor": "rgba(38.250000,,38.250000,38.250000,0.150000)", "linecolor": "rgb(38.250000,38.250000,38.250000)", "linewidth": 1, "tickangle": 0, "tickcolor": "rgb(38.250000,38.250000,38.250000)", "tickwidth": 1, "titlefont": { "size": 8.8, "color": "rgb(38.250000,38.250000,38.250000)", "family": "Arial, sans-serif" }, "exponentformat": "none", "showticklabels": true }, "xaxis2": { "side": "bottom", "type": "linear", "range": [ 0, 250 ], "ticks": "inside", "title": "Frequency (Hz)", "anchor": "y2", "domain": [ 0.13, 0.905 ], "mirror": "ticks", "ticklen": 6.51, "showgrid": false, "showline": true, "tickfont": { "size": 8, "color": "rgb(38.250000,38.250000,38.250000)", "family": "Arial, sans-serif" }, "tickmode": "array", "ticktext": [ "0", "50", "100", "150", "200", "250" ], "tickvals": [ 0, 50, 100, 150, 200, 250 ], "zeroline": false, "autorange": false, "gridcolor": "rgba(38.250000,,38.250000,38.250000,0.150000)", "linecolor": "rgb(38.250000,38.250000,38.250000)", "linewidth": 1, "tickangle": 0, "tickcolor": "rgb(38.250000,38.250000,38.250000)", "tickwidth": 1, "titlefont": { "size": 8.8, "color": "rgb(38.250000,38.250000,38.250000)", "family": "Arial, sans-serif" }, "exponentformat": "none", "showticklabels": true }, "xaxis3": { "side": "bottom", "type": "linear", "range": [ 0, 250 ], "ticks": "inside", "title": "Frequency (Hz)", "anchor": "y3", "domain": [ 0.13, 0.905 ], "mirror": "ticks", "ticklen": 6.51, "showgrid": false, "showline": true, "tickfont": { "size": 8, "color": "rgb(38.250000,38.250000,38.250000)", "family": "Arial, sans-serif" }, "tickmode": "array", "ticktext": [ "0", "50", "100", "150", "200", "250" ], "tickvals": [ 0, 50, 100, 150, 200, 250 ], "zeroline": false, "autorange": false, "gridcolor": "rgba(38.250000,,38.250000,38.250000,0.150000)", "linecolor": "rgb(38.250000,38.250000,38.250000)", "linewidth": 1, "tickangle": 0, "tickcolor": "rgb(38.250000,38.250000,38.250000)", "tickwidth": 1, "titlefont": { "size": 8.8, "color": "rgb(38.250000,38.250000,38.250000)", "family": "Arial, sans-serif" }, "exponentformat": "none", "showticklabels": true }, "yaxis1": { "side": "left", "type": "linear", "range": [ 14, 16 ], "ticks": "inside", "title": "uV", "anchor": "x1", "domain": [ 0.709264705882353, 0.925 ], "mirror": "ticks", "ticklen": 6.51, "showgrid": false, "showline": true, "tickfont": { "size": 8, "color": "rgb(38.250000,38.250000,38.250000)", "family": "Arial, sans-serif" }, "tickmode": "array", "ticktext": [ "14", "15", "16" ], "tickvals": [ 14, 15, 16 ], "zeroline": false, "autorange": false, "gridcolor": "rgba(38.250000,,38.250000,38.250000,0.150000)", "linecolor": "rgb(38.250000,38.250000,38.250000)", "linewidth": 1, "tickangle": 0, "tickcolor": "rgb(38.250000,38.250000,38.250000)", "tickwidth": 1, "titlefont": { "size": 8.8, "color": "rgb(38.250000,38.250000,38.250000)", "family": "Arial, sans-serif" }, "exponentformat": "none", "showticklabels": true }, "yaxis2": { "side": "left", "type": "linear", "range": [ 0, 30.1901517837313 ], "ticks": "inside", "title": "Amplitude", "anchor": "x2", "domain": [ 0.409632352941176, 0.625367647058824 ], "mirror": "ticks", "ticklen": 6.51, "showgrid": false, "showline": true, "tickfont": { "size": 8, "color": "rgb(38.250000,38.250000,38.250000)", "family": "Arial, sans-serif" }, "tickmode": "array", "ticktext": [ "0", "10", "20", "30" ], "tickvals": [ 0, 10, 20, 30 ], "zeroline": false, "autorange": false, "gridcolor": "rgba(38.250000,,38.250000,38.250000,0.150000)", "linecolor": "rgb(38.250000,38.250000,38.250000)", "linewidth": 1, "tickangle": 0, "tickcolor": "rgb(38.250000,38.250000,38.250000)", "tickwidth": 1, "titlefont": { "size": 8.8, "color": "rgb(38.250000,38.250000,38.250000)", "family": "Arial, sans-serif" }, "exponentformat": "none", "showticklabels": true }, "yaxis3": { "side": "left", "type": "linear", "range": [ -48.6629528429853, 14.7986529648356 ], "ticks": "inside", "title": "10 * log10(eeg)dB", "anchor": "x3", "domain": [ 0.11, 0.325735294117647 ], "mirror": "ticks", "ticklen": 6.51, "showgrid": false, "showline": true, "tickfont": { "size": 8, "color": "rgb(38.250000,38.250000,38.250000)", "family": "Arial, sans-serif" }, "tickmode": "array", "ticktext": [ "-40", "-20", "0" ], "tickvals": [ -40, -20, 0 ], "zeroline": false, "autorange": false, "gridcolor": "rgba(38.250000,,38.250000,38.250000,0.150000)", "linecolor": "rgb(38.250000,38.250000,38.250000)", "linewidth": 1, "tickangle": 0, "tickcolor": "rgb(38.250000,38.250000,38.250000)", "tickwidth": 1, "titlefont": { "size": 8.8, "color": "rgb(38.250000,38.250000,38.250000)", "family": "Arial, sans-serif" }, "exponentformat": "none", "showticklabels": true }, "autosize": false, "hovermode": "closest", "titlefont": { "color": "rgba(0,0,0,0)" }, "showlegend": false, "annotations": [ { "x": 0.5175, "y": 0.935, "font": { "size": 8.8, "color": "rgb(0,0,0)", "family": "Arial, sans-serif" }, "text": "<b></b>", "xref": "paper", "yref": "paper", "align": "center", "xanchor": "center", "yanchor": "bottom", "borderpad": 3, "showarrow": false, "textangle": 0, "bordercolor": "rgba(0,0,0,0)", "borderwidth": 0.5 }, { "x": 0.5175, "y": 0.635367647058824, "font": { "size": 8.8, "color": "rgb(0,0,0)", "family": "Arial, sans-serif" }, "text": "<b></b>", "xref": "paper", "yref": "paper", "align": "center", "xanchor": "center", "yanchor": "bottom", "borderpad": 3, "showarrow": false, "textangle": 0, "bordercolor": "rgba(0,0,0,0)", "borderwidth": 0.5 }, { "x": 0.5175, "y": 0.335735294117647, "font": { "size": 8.8, "color": "rgb(0,0,0)", "family": "Arial, sans-serif" }, "text": "CH8,11111", "xref": "paper", "yref": "paper", "align": "center", "xanchor": "center", "yanchor": "bottom", "borderpad": 3, "showarrow": false, "textangle": 0, "bordercolor": "rgba(0,0,0,0)", "borderwidth": 0.5 } ], "paper_bgcolor": "rgb(255,255,255)" } }, "height": 630, "width": 840, "user": { "profile_url": "https://chart-studio.plotly.com/~asongupup", "avatar_url": "https://storage.googleapis.com/plotly-prod-profiles/6.jpg", "background_url": "https://storage.googleapis.com/plotly-prod-profiles/bg-5.jpg", "bio": "", "nickname": "", "website": "", "stream_tokens": null, "feature_set_id": null, "csrf_token": null, "date_joined": "2024-02-27 02:46:05", "mapbox_access_tokens": null, "has_password": null, "username": "asongupup", "email": null, "is_active": null, "readonly": null, "is_dash_creator": null, "dash_created_count": null, "is_chart_creator": null, "charts_created_count": null } }, { "creation_time": "2024-04-16T02:54:40.951359Z", "comments": { "results": [], "count": 0 }, "parented": true, "embed_url": "https://chart-studio.plotly.com/~Prashanth.klv/16.embed", "fid": "Prashanth.klv:16", "filename": "6. hourly_trace_sunburst_killed", "filetype": "plot", "img_url": "https://storage.googleapis.com/plotly-prod-images/Prashanth.klv/16/9_39Z6L45QLVXTIARY8DE1PN775RC5XC.png", "image_urls": { "default": "https://storage.googleapis.com/plotly-prod-images/Prashanth.klv/16/2_C0VBQVS5V8A7RJAWIEY0M1IF7P28YR.png", "block-thumb": "https://storage.googleapis.com/plotly-prod-images/Prashanth.klv/16/8_3Q647ACZ5P13RVPZ1TG34PEV64O1OF.png", "list-thumb": "https://storage.googleapis.com/plotly-prod-images/Prashanth.klv/16/9_39Z6L45QLVXTIARY8DE1PN775RC5XC.png" }, "api_urls": { "files": "https://api.plotly.com/v2/files/Prashanth.klv:16", "plots": "https://api.plotly.com/v2/plots/Prashanth.klv:16", "parent": "https://api.plotly.com/v2/folders/home?user=Prashanth.klv" }, "owner": "Prashanth.klv", "parent": -1, "preview": "", "referencers": [], "references": [], "title": "", "views": 11, "web_url": "https://chart-studio.plotly.com/~Prashanth.klv/16/", "world_readable": true, "date_modified": "2024-04-16T02:54:40.961Z", "stars": { "results": [], "count": 0 }, "collaborators": { "results": [], "count": 0 }, "subfolder_count": null, "refresh_interval": null, "organize_view_url": "https://chart-studio.plotly.com/~Prashanth.klv/16/", "current_user_permission": "read", "is_theme": null, "is_template": null, "autosize": true, "caption": "", "figure": { "data": [ { "name": "", "type": "sunburst", "domain": { "x": [ 0.0, 1.0 ], "y": [ 0.0, 1.0 ] }, "idssrc": "Prashanth.klv:15:a59a74", "labelssrc": "Prashanth.klv:15:537eeb", "valuessrc": "Prashanth.klv:15:e3064e", "parentssrc": "Prashanth.klv:15:70fffe", "branchvalues": "total", "hovertemplate": "labels=%{label}<br>number_of_collisions=%{value}<br>parent=%{parent}<br>id=%{id}<extra></extra>" } ], "layout": { "title": { "x": 0.5, "text": "Number of Deaths per vehicle type and corresponding contributing factor during different hours of the day" }, "legend": { "tracegroupgap": 0 }, "margin": { "t": 60 }, "template": { "data": { "bar": [ { "type": "bar", "marker": { "line": { "color": "#E5ECF6", "width": 0.5 }, "pattern": { "size": 10, "fillmode": "overlay", "solidity": 0.2 } }, "error_x": { "color": "#2a3f5f" }, "error_y": { "color": "#2a3f5f" } } ], "pie": [ { "type": "pie", "automargin": true } ], "table": [ { "type": "table", "cells": { "fill": { "color": "#EBF0F8" }, "line": { "color": "white" } }, "header": { "fill": { "color": "#C8D4E3" }, "line": { "color": "white" } } } ], "carpet": [ { "type": "carpet", "aaxis": { "gridcolor": "white", "linecolor": "white", "endlinecolor": "#2a3f5f", "minorgridcolor": "white", "startlinecolor": "#2a3f5f" }, "baxis": { "gridcolor": "white", "linecolor": "white", "endlinecolor": "#2a3f5f", "minorgridcolor": "white", "startlinecolor": "#2a3f5f" } } ], "mesh3d": [ { "type": "mesh3d", "colorbar": { "ticks": "", "outlinewidth": 0 } } ], "contour": [ { "type": "contour", "colorbar": { "ticks": "", "outlinewidth": 0 }, "colorscale": [ [ 0.0, "#0d0887" ], [ 0.1111111111111111, "#46039f" ], [ 0.2222222222222222, "#7201a8" ], [ 0.3333333333333333, "#9c179e" ], [ 0.4444444444444444, "#bd3786" ], [ 0.5555555555555556, "#d8576b" ], [ 0.6666666666666666, "#ed7953" ], [ 0.7777777777777778, "#fb9f3a" ], [ 0.8888888888888888, "#fdca26" ], [ 1.0, "#f0f921" ] ] } ], "heatmap": [ { "type": "heatmap", "colorbar": { "ticks": "", "outlinewidth": 0 }, "colorscale": [ [ 0.0, "#0d0887" ], [ 0.1111111111111111, "#46039f" ], [ 0.2222222222222222, "#7201a8" ], [ 0.3333333333333333, "#9c179e" ], [ 0.4444444444444444, "#bd3786" ], [ 0.5555555555555556, "#d8576b" ], [ 0.6666666666666666, "#ed7953" ], [ 0.7777777777777778, "#fb9f3a" ], [ 0.8888888888888888, "#fdca26" ], [ 1.0, "#f0f921" ] ] } ], "scatter": [ { "type": "scatter", "fillpattern": { "size": 10, "fillmode": "overlay", "solidity": 0.2 } } ], "surface": [ { "type": "surface", "colorbar": { "ticks": "", "outlinewidth": 0 }, "colorscale": [ [ 0.0, "#0d0887" ], [ 0.1111111111111111, "#46039f" ], [ 0.2222222222222222, "#7201a8" ], [ 0.3333333333333333, "#9c179e" ], [ 0.4444444444444444, "#bd3786" ], [ 0.5555555555555556, "#d8576b" ], [ 0.6666666666666666, "#ed7953" ], [ 0.7777777777777778, "#fb9f3a" ], [ 0.8888888888888888, "#fdca26" ], [ 1.0, "#f0f921" ] ] } ], "barpolar": [ { "type": "barpolar", "marker": { "line": { "color": "#E5ECF6", "width": 0.5 }, "pattern": { "size": 10, "fillmode": "overlay", "solidity": 0.2 } } } ], "heatmapgl": [ { "type": "heatmapgl", "colorbar": { "ticks": "", "outlinewidth": 0 }, "colorscale": [ [ 0.0, "#0d0887" ], [ 0.1111111111111111, "#46039f" ], [ 0.2222222222222222, "#7201a8" ], [ 0.3333333333333333, "#9c179e" ], [ 0.4444444444444444, "#bd3786" ], [ 0.5555555555555556, "#d8576b" ], [ 0.6666666666666666, "#ed7953" ], [ 0.7777777777777778, "#fb9f3a" ], [ 0.8888888888888888, "#fdca26" ], [ 1.0, "#f0f921" ] ] } ], "histogram": [ { "type": "histogram", "marker": { "pattern": { "size": 10, "fillmode": "overlay", "solidity": 0.2 } } } ], "parcoords": [ { "line": { "colorbar": { "ticks": "", "outlinewidth": 0 } }, "type": "parcoords" } ], "scatter3d": [ { "line": { "colorbar": { "ticks": "", "outlinewidth": 0 } }, "type": "scatter3d", "marker": { "colorbar": { "ticks": "", "outlinewidth": 0 } } } ], "scattergl": [ { "type": "scattergl", "marker": { "colorbar": { "ticks": "", "outlinewidth": 0 } } } ], "choropleth": [ { "type": "choropleth", "colorbar": { "ticks": "", "outlinewidth": 0 } } ], "scattergeo": [ { "type": "scattergeo", "marker": { "colorbar": { "ticks": "", "outlinewidth": 0 } } } ], "histogram2d": [ { "type": "histogram2d", "colorbar": { "ticks": "", "outlinewidth": 0 }, "colorscale": [ [ 0.0, "#0d0887" ], [ 0.1111111111111111, "#46039f" ], [ 0.2222222222222222, "#7201a8" ], [ 0.3333333333333333, "#9c179e" ], [ 0.4444444444444444, "#bd3786" ], [ 0.5555555555555556, "#d8576b" ], [ 0.6666666666666666, "#ed7953" ], [ 0.7777777777777778, "#fb9f3a" ], [ 0.8888888888888888, "#fdca26" ], [ 1.0, "#f0f921" ] ] } ], "scatterpolar": [ { "type": "scatterpolar", "marker": { "colorbar": { "ticks": "", "outlinewidth": 0 } } } ], "contourcarpet": [ { "type": "contourcarpet", "colorbar": { "ticks": "", "outlinewidth": 0 } } ], "scattercarpet": [ { "type": "scattercarpet", "marker": { "colorbar": { "ticks": "", "outlinewidth": 0 } } } ], "scattermapbox": [ { "type": "scattermapbox", "marker": { "colorbar": { "ticks": "", "outlinewidth": 0 } } } ], "scatterpolargl": [ { "type": "scatterpolargl", "marker": { "colorbar": { "ticks": "", "outlinewidth": 0 } } } ], "scatterternary": [ { "type": "scatterternary", "marker": { "colorbar": { "ticks": "", "outlinewidth": 0 } } } ], "histogram2dcontour": [ { "type": "histogram2dcontour", "colorbar": { "ticks": "", "outlinewidth": 0 }, "colorscale": [ [ 0.0, "#0d0887" ], [ 0.1111111111111111, "#46039f" ], [ 0.2222222222222222, "#7201a8" ], [ 0.3333333333333333, "#9c179e" ], [ 0.4444444444444444, "#bd3786" ], [ 0.5555555555555556, "#d8576b" ], [ 0.6666666666666666, "#ed7953" ], [ 0.7777777777777778, "#fb9f3a" ], [ 0.8888888888888888, "#fdca26" ], [ 1.0, "#f0f921" ] ] } ] }, "layout": { "geo": { "bgcolor": "white", "showland": true, "lakecolor": "white", "landcolor": "#E5ECF6", "showlakes": true, "subunitcolor": "white" }, "font": { "color": "#2a3f5f" }, "polar": { "bgcolor": "#E5ECF6", "radialaxis": { "ticks": "", "gridcolor": "white", "linecolor": "white" }, "angularaxis": { "ticks": "", "gridcolor": "white", "linecolor": "white" } }, "scene": { "xaxis": { "ticks": "", "gridcolor": "white", "gridwidth": 2, "linecolor": "white", "zerolinecolor": "white", "showbackground": true, "backgroundcolor": "#E5ECF6" }, "yaxis": { "ticks": "", "gridcolor": "white", "gridwidth": 2, "linecolor": "white", "zerolinecolor": "white", "showbackground": true, "backgroundcolor": "#E5ECF6" }, "zaxis": { "ticks": "", "gridcolor": "white", "gridwidth": 2, "linecolor": "white", "zerolinecolor": "white", "showbackground": true, "backgroundcolor": "#E5ECF6" } }, "title": { "x": 0.05 }, "xaxis": { "ticks": "", "title": { "standoff": 15 }, "gridcolor": "white", "linecolor": "white", "automargin": true, "zerolinecolor": "white", "zerolinewidth": 2 }, "yaxis": { "ticks": "", "title": { "standoff": 15 }, "gridcolor": "white", "linecolor": "white", "automargin": true, "zerolinecolor": "white", "zerolinewidth": 2 }, "mapbox": { "style": "light" }, "ternary": { "aaxis": { "ticks": "", "gridcolor": "white", "linecolor": "white" }, "baxis": { "ticks": "", "gridcolor": "white", "linecolor": "white" }, "caxis": { "ticks": "", "gridcolor": "white", "linecolor": "white" }, "bgcolor": "#E5ECF6" }, "colorway": [ "#636efa", "#EF553B", "#00cc96", "#ab63fa", "#FFA15A", "#19d3f3", "#FF6692", "#B6E880", "#FF97FF", "#FECB52" ], "coloraxis": { "colorbar": { "ticks": "", "outlinewidth": 0 } }, "hovermode": "closest", "colorscale": { "diverging": [ [ 0, "#8e0152" ], [ 0.1, "#c51b7d" ], [ 0.2, "#de77ae" ], [ 0.3, "#f1b6da" ], [ 0.4, "#fde0ef" ], [ 0.5, "#f7f7f7" ], [ 0.6, "#e6f5d0" ], [ 0.7, "#b8e186" ], [ 0.8, "#7fbc41" ], [ 0.9, "#4d9221" ], [ 1, "#276419" ] ], "sequential": [ [ 0.0, "#0d0887" ], [ 0.1111111111111111, "#46039f" ], [ 0.2222222222222222, "#7201a8" ], [ 0.3333333333333333, "#9c179e" ], [ 0.4444444444444444, "#bd3786" ], [ 0.5555555555555556, "#d8576b" ], [ 0.6666666666666666, "#ed7953" ], [ 0.7777777777777778, "#fb9f3a" ], [ 0.8888888888888888, "#fdca26" ], [ 1.0, "#f0f921" ] ], "sequentialminus": [ [ 0.0, "#0d0887" ], [ 0.1111111111111111, "#46039f" ], [ 0.2222222222222222, "#7201a8" ], [ 0.3333333333333333, "#9c179e" ], [ 0.4444444444444444, "#bd3786" ], [ 0.5555555555555556, "#d8576b" ], [ 0.6666666666666666, "#ed7953" ], [ 0.7777777777777778, "#fb9f3a" ], [ 0.8888888888888888, "#fdca26" ], [ 1.0, "#f0f921" ] ] }, "hoverlabel": { "align": "left" }, "plot_bgcolor": "#E5ECF6", "paper_bgcolor": "white", "shapedefaults": { "line": { "color": "#2a3f5f" } }, "autotypenumbers": "strict", "annotationdefaults": { "arrowhead": 0, "arrowcolor": "#2a3f5f", "arrowwidth": 1 } } } } }, "height": null, "width": null, "user": { "profile_url": "https://chart-studio.plotly.com/~Prashanth.klv", "avatar_url": "https://storage.googleapis.com/plotly-prod-profiles/14.jpg", "background_url": "https://storage.googleapis.com/plotly-prod-profiles/bg-13.jpg", "bio": "", "nickname": "", "website": "", "stream_tokens": null, "feature_set_id": null, "csrf_token": null, "date_joined": "2024-04-13 00:25:15", "mapbox_access_tokens": null, "has_password": null, "username": "Prashanth.klv", "email": null, "is_active": null, "readonly": null, "is_dash_creator": null, "dash_created_count": null, "is_chart_creator": null, "charts_created_count": null } }, { "creation_time": "2024-04-16T02:51:45.240003Z", "comments": { "results": [], "count": 0 }, "parented": true, "embed_url": "https://chart-studio.plotly.com/~a01022883839/3.embed", "fid": "a01022883839:3", "filename": "KoreaEarthQuake_5years", "filetype": "plot", "img_url": "https://storage.googleapis.com/plotly-prod-images/a01022883839/3/9_G9MSEDANUDBZTMCVMPQ0IOQAJQWD04.png", "image_urls": { "default": "https://storage.googleapis.com/plotly-prod-images/a01022883839/3/2_F9W3PH6Q1NY8QPO31U56ORTZX26MLI.png", "block-thumb": "https://storage.googleapis.com/plotly-prod-images/a01022883839/3/8_0H6KFJ23LCKXHVM7F3M5DGEBWR18NC.png", "list-thumb": "https://storage.googleapis.com/plotly-prod-images/a01022883839/3/9_G9MSEDANUDBZTMCVMPQ0IOQAJQWD04.png" }, "api_urls": { "files": "https://api.plotly.com/v2/files/a01022883839:3", "plots": "https://api.plotly.com/v2/plots/a01022883839:3", "parent": "https://api.plotly.com/v2/folders/home?user=a01022883839" }, "owner": "a01022883839", "parent": -1, "preview": "", "referencers": [], "references": [], "title": "", "views": 1, "web_url": "https://chart-studio.plotly.com/~a01022883839/3/", "world_readable": true, "date_modified": "2024-04-25T09:57:47.786Z", "stars": { "results": [], "count": 0 }, "collaborators": { "results": [], "count": 0 }, "subfolder_count": null, "refresh_interval": null, "organize_view_url": "https://chart-studio.plotly.com/~a01022883839/3/", "current_user_permission": "read", "is_theme": null, "is_template": null, "autosize": true, "caption": "", "figure": { "data": [ { "name": "1978-1982", "type": "histogram", "xsrc": "a01022883839:14:79ce20", "xaxis": "x", "yaxis": "y", "marker": { "color": "#636efa", "pattern": { "shape": "" } }, "bingroup": "x", "showlegend": true, "legendgroup": "1978-1982", "offsetgroup": "1978-1982", "orientation": "v", "hovertemplate": "Year_5년 단위=1978-1982<br>Month=%{x}<br>count=%{y}<extra></extra>", "alignmentgroup": "True" }, { "name": "1983-1987", "type": "histogram", "xsrc": "a01022883839:14:e1d6b1", "xaxis": "x", "yaxis": "y", "marker": { "color": "#EF553B", "pattern": { "shape": "" } }, "bingroup": "x", "showlegend": true, "legendgroup": "1983-1987", "offsetgroup": "1983-1987", "orientation": "v", "hovertemplate": "Year_5년 단위=1983-1987<br>Month=%{x}<br>count=%{y}<extra></extra>", "alignmentgroup": "True" }, { "name": "1988-1992", "type": "histogram", "xsrc": "a01022883839:14:5b55b2", "xaxis": "x", "yaxis": "y", "marker": { "color": "#00cc96", "pattern": { "shape": "" } }, "bingroup": "x", "showlegend": true, "legendgroup": "1988-1992", "offsetgroup": "1988-1992", "orientation": "v", "hovertemplate": "Year_5년 단위=1988-1992<br>Month=%{x}<br>count=%{y}<extra></extra>", "alignmentgroup": "True" }, { "name": "1993-1997", "type": "histogram", "xsrc": "a01022883839:14:5ad7b4", "xaxis": "x", "yaxis": "y", "marker": { "color": "#ab63fa", "pattern": { "shape": "" } }, "bingroup": "x", "showlegend": true, "legendgroup": "1993-1997", "offsetgroup": "1993-1997", "orientation": "v", "hovertemplate": "Year_5년 단위=1993-1997<br>Month=%{x}<br>count=%{y}<extra></extra>", "alignmentgroup": "True" }, { "name": "1998-2002", "type": "histogram", "xsrc": "a01022883839:14:6bd0ed", "xaxis": "x", "yaxis": "y", "marker": { "color": "#FFA15A", "pattern": { "shape": "" } }, "bingroup": "x", "showlegend": true, "legendgroup": "1998-2002", "offsetgroup": "1998-2002", "orientation": "v", "hovertemplate": "Year_5년 단위=1998-2002<br>Month=%{x}<br>count=%{y}<extra></extra>", "alignmentgroup": "True" }, { "name": "2003-2007", "type": "histogram", "xsrc": "a01022883839:14:2f985a", "xaxis": "x", "yaxis": "y", "marker": { "color": "#19d3f3", "pattern": { "shape": "" } }, "bingroup": "x", "showlegend": true, "legendgroup": "2003-2007", "offsetgroup": "2003-2007", "orientation": "v", "hovertemplate": "Year_5년 단위=2003-2007<br>Month=%{x}<br>count=%{y}<extra></extra>", "alignmentgroup": "True" }, { "name": "2008-2012", "type": "histogram", "xsrc": "a01022883839:14:867e6e", "xaxis": "x", "yaxis": "y", "marker": { "color": "#FF6692", "pattern": { "shape": "" } }, "bingroup": "x", "showlegend": true, "legendgroup": "2008-2012", "offsetgroup": "2008-2012", "orientation": "v", "hovertemplate": "Year_5년 단위=2008-2012<br>Month=%{x}<br>count=%{y}<extra></extra>", "alignmentgroup": "True" }, { "name": "2013-2017", "type": "histogram", "xsrc": "a01022883839:14:8bd142", "xaxis": "x", "yaxis": "y", "marker": { "color": "#B6E880", "pattern": { "shape": "" } }, "bingroup": "x", "showlegend": true, "legendgroup": "2013-2017", "offsetgroup": "2013-2017", "orientation": "v", "hovertemplate": "Year_5년 단위=2013-2017<br>Month=%{x}<br>count=%{y}<extra></extra>", "alignmentgroup": "True" }, { "name": "2018-2022", "type": "histogram", "xsrc": "a01022883839:14:2d1c71", "xaxis": "x", "yaxis": "y", "marker": { "color": "#FF97FF", "pattern": { "shape": "" } }, "bingroup": "x", "showlegend": true, "legendgroup": "2018-2022", "offsetgroup": "2018-2022", "orientation": "v", "hovertemplate": "Year_5년 단위=2018-2022<br>Month=%{x}<br>count=%{y}<extra></extra>", "alignmentgroup": "True" }, { "name": "2023-2027", "type": "histogram", "xsrc": "a01022883839:14:94307d", "xaxis": "x", "yaxis": "y", "marker": { "color": "#FECB52", "pattern": { "shape": "" } }, "bingroup": "x", "showlegend": true, "legendgroup": "2023-2027", "offsetgroup": "2023-2027", "orientation": "v", "hovertemplate": "Year_5년 단위=2023-2027<br>Month=%{x}<br>count=%{y}<extra></extra>", "alignmentgroup": "True" } ], "layout": { "width": 800, "xaxis": { "title": { "text": "Month" }, "anchor": "y", "domain": [ 0.0, 1.0 ], "categoryarray": [ "January", "February", "March", "April", "May", "June", "July", "August", "September", "October", "November", "December" ], "categoryorder": "array" }, "yaxis": { "title": { "text": "count" }, "anchor": "x", "domain": [ 0.0, 1.0 ] }, "height": 600, "legend": { "title": { "text": "Year_5년 단위" }, "tracegroupgap": 0 }, "margin": { "t": 60 }, "barmode": "stack", "template": { "data": { "bar": [ { "type": "bar", "marker": { "line": { "color": "#E5ECF6", "width": 0.5 }, "pattern": { "size": 10, "fillmode": "overlay", "solidity": 0.2 } }, "error_x": { "color": "#2a3f5f" }, "error_y": { "color": "#2a3f5f" } } ], "pie": [ { "type": "pie", "automargin": true } ], "table": [ { "type": "table", "cells": { "fill": { "color": "#EBF0F8" }, "line": { "color": "white" } }, "header": { "fill": { "color": "#C8D4E3" }, "line": { "color": "white" } } } ], "carpet": [ { "type": "carpet", "aaxis": { "gridcolor": "white", "linecolor": "white", "endlinecolor": "#2a3f5f", "minorgridcolor": "white", "startlinecolor": "#2a3f5f" }, "baxis": { "gridcolor": "white", "linecolor": "white", "endlinecolor": "#2a3f5f", "minorgridcolor": "white", "startlinecolor": "#2a3f5f" } } ], "mesh3d": [ { "type": "mesh3d", "colorbar": { "ticks": "", "outlinewidth": 0 } } ], "contour": [ { "type": "contour", "colorbar": { "ticks": "", "outlinewidth": 0 }, "colorscale": [ [ 0.0, "#0d0887" ], [ 0.1111111111111111, "#46039f" ], [ 0.2222222222222222, "#7201a8" ], [ 0.3333333333333333, "#9c179e" ], [ 0.4444444444444444, "#bd3786" ], [ 0.5555555555555556, "#d8576b" ], [ 0.6666666666666666, "#ed7953" ], [ 0.7777777777777778, "#fb9f3a" ], [ 0.8888888888888888, "#fdca26" ], [ 1.0, "#f0f921" ] ] } ], "heatmap": [ { "type": "heatmap", "colorbar": { "ticks": "", "outlinewidth": 0 }, "colorscale": [ [ 0.0, "#0d0887" ], [ 0.1111111111111111, "#46039f" ], [ 0.2222222222222222, "#7201a8" ], [ 0.3333333333333333, "#9c179e" ], [ 0.4444444444444444, "#bd3786" ], [ 0.5555555555555556, "#d8576b" ], [ 0.6666666666666666, "#ed7953" ], [ 0.7777777777777778, "#fb9f3a" ], [ 0.8888888888888888, "#fdca26" ], [ 1.0, "#f0f921" ] ] } ], "scatter": [ { "type": "scatter", "fillpattern": { "size": 10, "fillmode": "overlay", "solidity": 0.2 } } ], "surface": [ { "type": "surface", "colorbar": { "ticks": "", "outlinewidth": 0 }, "colorscale": [ [ 0.0, "#0d0887" ], [ 0.1111111111111111, "#46039f" ], [ 0.2222222222222222, "#7201a8" ], [ 0.3333333333333333, "#9c179e" ], [ 0.4444444444444444, "#bd3786" ], [ 0.5555555555555556, "#d8576b" ], [ 0.6666666666666666, "#ed7953" ], [ 0.7777777777777778, "#fb9f3a" ], [ 0.8888888888888888, "#fdca26" ], [ 1.0, "#f0f921" ] ] } ], "barpolar": [ { "type": "barpolar", "marker": { "line": { "color": "#E5ECF6", "width": 0.5 }, "pattern": { "size": 10, "fillmode": "overlay", "solidity": 0.2 } } } ], "heatmapgl": [ { "type": "heatmapgl", "colorbar": { "ticks": "", "outlinewidth": 0 }, "colorscale": [ [ 0.0, "#0d0887" ], [ 0.1111111111111111, "#46039f" ], [ 0.2222222222222222, "#7201a8" ], [ 0.3333333333333333, "#9c179e" ], [ 0.4444444444444444, "#bd3786" ], [ 0.5555555555555556, "#d8576b" ], [ 0.6666666666666666, "#ed7953" ], [ 0.7777777777777778, "#fb9f3a" ], [ 0.8888888888888888, "#fdca26" ], [ 1.0, "#f0f921" ] ] } ], "histogram": [ { "type": "histogram", "marker": { "pattern": { "size": 10, "fillmode": "overlay", "solidity": 0.2 } } } ], "parcoords": [ { "line": { "colorbar": { "ticks": "", "outlinewidth": 0 } }, "type": "parcoords" } ], "scatter3d": [ { "line": { "colorbar": { "ticks": "", "outlinewidth": 0 } }, "type": "scatter3d", "marker": { "colorbar": { "ticks": "", "outlinewidth": 0 } } } ], "scattergl": [ { "type": "scattergl", "marker": { "colorbar": { "ticks": "", "outlinewidth": 0 } } } ], "choropleth": [ { "type": "choropleth", "colorbar": { "ticks": "", "outlinewidth": 0 } } ], "scattergeo": [ { "type": "scattergeo", "marker": { "colorbar": { "ticks": "", "outlinewidth": 0 } } } ], "histogram2d": [ { "type": "histogram2d", "colorbar": { "ticks": "", "outlinewidth": 0 }, "colorscale": [ [ 0.0, "#0d0887" ], [ 0.1111111111111111, "#46039f" ], [ 0.2222222222222222, "#7201a8" ], [ 0.3333333333333333, "#9c179e" ], [ 0.4444444444444444, "#bd3786" ], [ 0.5555555555555556, "#d8576b" ], [ 0.6666666666666666, "#ed7953" ], [ 0.7777777777777778, "#fb9f3a" ], [ 0.8888888888888888, "#fdca26" ], [ 1.0, "#f0f921" ] ] } ], "scatterpolar": [ { "type": "scatterpolar", "marker": { "colorbar": { "ticks": "", "outlinewidth": 0 } } } ], "contourcarpet": [ { "type": "contourcarpet", "colorbar": { "ticks": "", "outlinewidth": 0 } } ], "scattercarpet": [ { "type": "scattercarpet", "marker": { "colorbar": { "ticks": "", "outlinewidth": 0 } } } ], "scattermapbox": [ { "type": "scattermapbox", "marker": { "colorbar": { "ticks": "", "outlinewidth": 0 } } } ], "scatterpolargl": [ { "type": "scatterpolargl", "marker": { "colorbar": { "ticks": "", "outlinewidth": 0 } } } ], "scatterternary": [ { "type": "scatterternary", "marker": { "colorbar": { "ticks": "", "outlinewidth": 0 } } } ], "histogram2dcontour": [ { "type": "histogram2dcontour", "colorbar": { "ticks": "", "outlinewidth": 0 }, "colorscale": [ [ 0.0, "#0d0887" ], [ 0.1111111111111111, "#46039f" ], [ 0.2222222222222222, "#7201a8" ], [ 0.3333333333333333, "#9c179e" ], [ 0.4444444444444444, "#bd3786" ], [ 0.5555555555555556, "#d8576b" ], [ 0.6666666666666666, "#ed7953" ], [ 0.7777777777777778, "#fb9f3a" ], [ 0.8888888888888888, "#fdca26" ], [ 1.0, "#f0f921" ] ] } ] }, "layout": { "geo": { "bgcolor": "white", "showland": true, "lakecolor": "white", "landcolor": "#E5ECF6", "showlakes": true, "subunitcolor": "white" }, "font": { "color": "#2a3f5f" }, "polar": { "bgcolor": "#E5ECF6", "radialaxis": { "ticks": "", "gridcolor": "white", "linecolor": "white" }, "angularaxis": { "ticks": "", "gridcolor": "white", "linecolor": "white" } }, "scene": { "xaxis": { "ticks": "", "gridcolor": "white", "gridwidth": 2, "linecolor": "white", "zerolinecolor": "white", "showbackground": true, "backgroundcolor": "#E5ECF6" }, "yaxis": { "ticks": "", "gridcolor": "white", "gridwidth": 2, "linecolor": "white", "zerolinecolor": "white", "showbackground": true, "backgroundcolor": "#E5ECF6" }, "zaxis": { "ticks": "", "gridcolor": "white", "gridwidth": 2, "linecolor": "white", "zerolinecolor": "white", "showbackground": true, "backgroundcolor": "#E5ECF6" } }, "title": { "x": 0.05 }, "xaxis": { "ticks": "", "title": { "standoff": 15 }, "gridcolor": "white", "linecolor": "white", "automargin": true, "zerolinecolor": "white", "zerolinewidth": 2 }, "yaxis": { "ticks": "", "title": { "standoff": 15 }, "gridcolor": "white", "linecolor": "white", "automargin": true, "zerolinecolor": "white", "zerolinewidth": 2 }, "mapbox": { "style": "light" }, "ternary": { "aaxis": { "ticks": "", "gridcolor": "white", "linecolor": "white" }, "baxis": { "ticks": "", "gridcolor": "white", "linecolor": "white" }, "caxis": { "ticks": "", "gridcolor": "white", "linecolor": "white" }, "bgcolor": "#E5ECF6" }, "colorway": [ "#636efa", "#EF553B", "#00cc96", "#ab63fa", "#FFA15A", "#19d3f3", "#FF6692", "#B6E880", "#FF97FF", "#FECB52" ], "coloraxis": { "colorbar": { "ticks": "", "outlinewidth": 0 } }, "hovermode": "closest", "colorscale": { "diverging": [ [ 0, "#8e0152" ], [ 0.1, "#c51b7d" ], [ 0.2, "#de77ae" ], [ 0.3, "#f1b6da" ], [ 0.4, "#fde0ef" ], [ 0.5, "#f7f7f7" ], [ 0.6, "#e6f5d0" ], [ 0.7, "#b8e186" ], [ 0.8, "#7fbc41" ], [ 0.9, "#4d9221" ], [ 1, "#276419" ] ], "sequential": [ [ 0.0, "#0d0887" ], [ 0.1111111111111111, "#46039f" ], [ 0.2222222222222222, "#7201a8" ], [ 0.3333333333333333, "#9c179e" ], [ 0.4444444444444444, "#bd3786" ], [ 0.5555555555555556, "#d8576b" ], [ 0.6666666666666666, "#ed7953" ], [ 0.7777777777777778, "#fb9f3a" ], [ 0.8888888888888888, "#fdca26" ], [ 1.0, "#f0f921" ] ], "sequentialminus": [ [ 0.0, "#0d0887" ], [ 0.1111111111111111, "#46039f" ], [ 0.2222222222222222, "#7201a8" ], [ 0.3333333333333333, "#9c179e" ], [ 0.4444444444444444, "#bd3786" ], [ 0.5555555555555556, "#d8576b" ], [ 0.6666666666666666, "#ed7953" ], [ 0.7777777777777778, "#fb9f3a" ], [ 0.8888888888888888, "#fdca26" ], [ 1.0, "#f0f921" ] ] }, "hoverlabel": { "align": "left" }, "plot_bgcolor": "#E5ECF6", "paper_bgcolor": "white", "shapedefaults": { "line": { "color": "#2a3f5f" } }, "autotypenumbers": "strict", "annotationdefaults": { "arrowhead": 0, "arrowcolor": "#2a3f5f", "arrowwidth": 1 } } } } }, "height": 600, "width": 800, "user": { "profile_url": "https://chart-studio.plotly.com/~a01022883839", "avatar_url": "https://storage.googleapis.com/plotly-prod-profiles/10.jpg", "background_url": "https://storage.googleapis.com/plotly-prod-profiles/bg-14.jpg", "bio": "", "nickname": "", "website": "", "stream_tokens": null, "feature_set_id": null, "csrf_token": null, "date_joined": "2022-06-17 02:44:26", "mapbox_access_tokens": null, "has_password": null, "username": "a01022883839", "email": null, "is_active": null, "readonly": null, "is_dash_creator": null, "dash_created_count": null, "is_chart_creator": null, "charts_created_count": null } }, { "creation_time": "2024-04-16T02:51:30.003988Z", "comments": { "results": [], "count": 0 }, "parented": true, "embed_url": "https://chart-studio.plotly.com/~a01022883839/1.embed", "fid": "a01022883839:1", "filename": "SPY_daily_return", "filetype": "plot", "img_url": "https://storage.googleapis.com/plotly-prod-images/a01022883839/1/9_F7CUSJLLNK13BK827SWDNGK9RUSUWR.png", "image_urls": { "default": "https://storage.googleapis.com/plotly-prod-images/a01022883839/1/2_DCK9JN4UOR0S4OPGAO5R155B0QRXIC.png", "block-thumb": "https://storage.googleapis.com/plotly-prod-images/a01022883839/1/8_LKKMVOSWWODQ7VYT58O9EJC5F2PKH7.png", "list-thumb": "https://storage.googleapis.com/plotly-prod-images/a01022883839/1/9_F7CUSJLLNK13BK827SWDNGK9RUSUWR.png" }, "api_urls": { "files": "https://api.plotly.com/v2/files/a01022883839:1", "plots": "https://api.plotly.com/v2/plots/a01022883839:1", "parent": "https://api.plotly.com/v2/folders/home?user=a01022883839" }, "owner": "a01022883839", "parent": -1, "preview": "", "referencers": [], "references": [], "title": "", "views": 1, "web_url": "https://chart-studio.plotly.com/~a01022883839/1/", "world_readable": true, "date_modified": "2024-04-16T02:51:30.012Z", "stars": { "results": [], "count": 0 }, "collaborators": { "results": [], "count": 0 }, "subfolder_count": null, "refresh_interval": null, "organize_view_url": "https://chart-studio.plotly.com/~a01022883839/1/", "current_user_permission": "read", "is_theme": null, "is_template": null, "autosize": true, "caption": "", "figure": { "data": [ { "name": "1978-1982", "type": "histogram", "xsrc": "a01022883839:0:6565e6", "xaxis": "x", "yaxis": "y", "marker": { "color": "#636efa", "pattern": { "shape": "" } }, "bingroup": "x", "showlegend": true, "legendgroup": "1978-1982", "offsetgroup": "1978-1982", "orientation": "v", "hovertemplate": "Year_5년 단위=1978-1982<br>Month=%{x}<br>count=%{y}<extra></extra>", "alignmentgroup": "True" }, { "name": "1983-1987", "type": "histogram", "xsrc": "a01022883839:0:50ed3d", "xaxis": "x", "yaxis": "y", "marker": { "color": "#EF553B", "pattern": { "shape": "" } }, "bingroup": "x", "showlegend": true, "legendgroup": "1983-1987", "offsetgroup": "1983-1987", "orientation": "v", "hovertemplate": "Year_5년 단위=1983-1987<br>Month=%{x}<br>count=%{y}<extra></extra>", "alignmentgroup": "True" }, { "name": "1988-1992", "type": "histogram", "xsrc": "a01022883839:0:4d4ba4", "xaxis": "x", "yaxis": "y", "marker": { "color": "#00cc96", "pattern": { "shape": "" } }, "bingroup": "x", "showlegend": true, "legendgroup": "1988-1992", "offsetgroup": "1988-1992", "orientation": "v", "hovertemplate": "Year_5년 단위=1988-1992<br>Month=%{x}<br>count=%{y}<extra></extra>", "alignmentgroup": "True" }, { "name": "1993-1997", "type": "histogram", "xsrc": "a01022883839:0:2bd580", "xaxis": "x", "yaxis": "y", "marker": { "color": "#ab63fa", "pattern": { "shape": "" } }, "bingroup": "x", "showlegend": true, "legendgroup": "1993-1997", "offsetgroup": "1993-1997", "orientation": "v", "hovertemplate": "Year_5년 단위=1993-1997<br>Month=%{x}<br>count=%{y}<extra></extra>", "alignmentgroup": "True" }, { "name": "1998-2002", "type": "histogram", "xsrc": "a01022883839:0:b88cd3", "xaxis": "x", "yaxis": "y", "marker": { "color": "#FFA15A", "pattern": { "shape": "" } }, "bingroup": "x", "showlegend": true, "legendgroup": "1998-2002", "offsetgroup": "1998-2002", "orientation": "v", "hovertemplate": "Year_5년 단위=1998-2002<br>Month=%{x}<br>count=%{y}<extra></extra>", "alignmentgroup": "True" }, { "name": "2003-2007", "type": "histogram", "xsrc": "a01022883839:0:c9921d", "xaxis": "x", "yaxis": "y", "marker": { "color": "#19d3f3", "pattern": { "shape": "" } }, "bingroup": "x", "showlegend": true, "legendgroup": "2003-2007", "offsetgroup": "2003-2007", "orientation": "v", "hovertemplate": "Year_5년 단위=2003-2007<br>Month=%{x}<br>count=%{y}<extra></extra>", "alignmentgroup": "True" }, { "name": "2008-2012", "type": "histogram", "xsrc": "a01022883839:0:377631", "xaxis": "x", "yaxis": "y", "marker": { "color": "#FF6692", "pattern": { "shape": "" } }, "bingroup": "x", "showlegend": true, "legendgroup": "2008-2012", "offsetgroup": "2008-2012", "orientation": "v", "hovertemplate": "Year_5년 단위=2008-2012<br>Month=%{x}<br>count=%{y}<extra></extra>", "alignmentgroup": "True" }, { "name": "2013-2017", "type": "histogram", "xsrc": "a01022883839:0:7b6a34", "xaxis": "x", "yaxis": "y", "marker": { "color": "#B6E880", "pattern": { "shape": "" } }, "bingroup": "x", "showlegend": true, "legendgroup": "2013-2017", "offsetgroup": "2013-2017", "orientation": "v", "hovertemplate": "Year_5년 단위=2013-2017<br>Month=%{x}<br>count=%{y}<extra></extra>", "alignmentgroup": "True" }, { "name": "2018-2022", "type": "histogram", "xsrc": "a01022883839:0:336c56", "xaxis": "x", "yaxis": "y", "marker": { "color": "#FF97FF", "pattern": { "shape": "" } }, "bingroup": "x", "showlegend": true, "legendgroup": "2018-2022", "offsetgroup": "2018-2022", "orientation": "v", "hovertemplate": "Year_5년 단위=2018-2022<br>Month=%{x}<br>count=%{y}<extra></extra>", "alignmentgroup": "True" }, { "name": "2023-2027", "type": "histogram", "xsrc": "a01022883839:0:dcce5c", "xaxis": "x", "yaxis": "y", "marker": { "color": "#FECB52", "pattern": { "shape": "" } }, "bingroup": "x", "showlegend": true, "legendgroup": "2023-2027", "offsetgroup": "2023-2027", "orientation": "v", "hovertemplate": "Year_5년 단위=2023-2027<br>Month=%{x}<br>count=%{y}<extra></extra>", "alignmentgroup": "True" } ], "layout": { "width": 800, "xaxis": { "title": { "text": "Month" }, "anchor": "y", "domain": [ 0.0, 1.0 ], "categoryarray": [ "January", "February", "March", "April", "May", "June", "July", "August", "September", "October", "November", "December" ], "categoryorder": "array" }, "yaxis": { "title": { "text": "count" }, "anchor": "x", "domain": [ 0.0, 1.0 ] }, "height": 600, "legend": { "title": { "text": "Year_5년 단위" }, "tracegroupgap": 0 }, "margin": { "t": 60 }, "barmode": "stack", "template": { "data": { "bar": [ { "type": "bar", "marker": { "line": { "color": "#E5ECF6", "width": 0.5 }, "pattern": { "size": 10, "fillmode": "overlay", "solidity": 0.2 } }, "error_x": { "color": "#2a3f5f" }, "error_y": { "color": "#2a3f5f" } } ], "pie": [ { "type": "pie", "automargin": true } ], "table": [ { "type": "table", "cells": { "fill": { "color": "#EBF0F8" }, "line": { "color": "white" } }, "header": { "fill": { "color": "#C8D4E3" }, "line": { "color": "white" } } } ], "carpet": [ { "type": "carpet", "aaxis": { "gridcolor": "white", "linecolor": "white", "endlinecolor": "#2a3f5f", "minorgridcolor": "white", "startlinecolor": "#2a3f5f" }, "baxis": { "gridcolor": "white", "linecolor": "white", "endlinecolor": "#2a3f5f", "minorgridcolor": "white", "startlinecolor": "#2a3f5f" } } ], "mesh3d": [ { "type": "mesh3d", "colorbar": { "ticks": "", "outlinewidth": 0 } } ], "contour": [ { "type": "contour", "colorbar": { "ticks": "", "outlinewidth": 0 }, "colorscale": [ [ 0.0, "#0d0887" ], [ 0.1111111111111111, "#46039f" ], [ 0.2222222222222222, "#7201a8" ], [ 0.3333333333333333, "#9c179e" ], [ 0.4444444444444444, "#bd3786" ], [ 0.5555555555555556, "#d8576b" ], [ 0.6666666666666666, "#ed7953" ], [ 0.7777777777777778, "#fb9f3a" ], [ 0.8888888888888888, "#fdca26" ], [ 1.0, "#f0f921" ] ] } ], "heatmap": [ { "type": "heatmap", "colorbar": { "ticks": "", "outlinewidth": 0 }, "colorscale": [ [ 0.0, "#0d0887" ], [ 0.1111111111111111, "#46039f" ], [ 0.2222222222222222, "#7201a8" ], [ 0.3333333333333333, "#9c179e" ], [ 0.4444444444444444, "#bd3786" ], [ 0.5555555555555556, "#d8576b" ], [ 0.6666666666666666, "#ed7953" ], [ 0.7777777777777778, "#fb9f3a" ], [ 0.8888888888888888, "#fdca26" ], [ 1.0, "#f0f921" ] ] } ], "scatter": [ { "type": "scatter", "fillpattern": { "size": 10, "fillmode": "overlay", "solidity": 0.2 } } ], "surface": [ { "type": "surface", "colorbar": { "ticks": "", "outlinewidth": 0 }, "colorscale": [ [ 0.0, "#0d0887" ], [ 0.1111111111111111, "#46039f" ], [ 0.2222222222222222, "#7201a8" ], [ 0.3333333333333333, "#9c179e" ], [ 0.4444444444444444, "#bd3786" ], [ 0.5555555555555556, "#d8576b" ], [ 0.6666666666666666, "#ed7953" ], [ 0.7777777777777778, "#fb9f3a" ], [ 0.8888888888888888, "#fdca26" ], [ 1.0, "#f0f921" ] ] } ], "barpolar": [ { "type": "barpolar", "marker": { "line": { "color": "#E5ECF6", "width": 0.5 }, "pattern": { "size": 10, "fillmode": "overlay", "solidity": 0.2 } } } ], "heatmapgl": [ { "type": "heatmapgl", "colorbar": { "ticks": "", "outlinewidth": 0 }, "colorscale": [ [ 0.0, "#0d0887" ], [ 0.1111111111111111, "#46039f" ], [ 0.2222222222222222, "#7201a8" ], [ 0.3333333333333333, "#9c179e" ], [ 0.4444444444444444, "#bd3786" ], [ 0.5555555555555556, "#d8576b" ], [ 0.6666666666666666, "#ed7953" ], [ 0.7777777777777778, "#fb9f3a" ], [ 0.8888888888888888, "#fdca26" ], [ 1.0, "#f0f921" ] ] } ], "histogram": [ { "type": "histogram", "marker": { "pattern": { "size": 10, "fillmode": "overlay", "solidity": 0.2 } } } ], "parcoords": [ { "line": { "colorbar": { "ticks": "", "outlinewidth": 0 } }, "type": "parcoords" } ], "scatter3d": [ { "line": { "colorbar": { "ticks": "", "outlinewidth": 0 } }, "type": "scatter3d", "marker": { "colorbar": { "ticks": "", "outlinewidth": 0 } } } ], "scattergl": [ { "type": "scattergl", "marker": { "colorbar": { "ticks": "", "outlinewidth": 0 } } } ], "choropleth": [ { "type": "choropleth", "colorbar": { "ticks": "", "outlinewidth": 0 } } ], "scattergeo": [ { "type": "scattergeo", "marker": { "colorbar": { "ticks": "", "outlinewidth": 0 } } } ], "histogram2d": [ { "type": "histogram2d", "colorbar": { "ticks": "", "outlinewidth": 0 }, "colorscale": [ [ 0.0, "#0d0887" ], [ 0.1111111111111111, "#46039f" ], [ 0.2222222222222222, "#7201a8" ], [ 0.3333333333333333, "#9c179e" ], [ 0.4444444444444444, "#bd3786" ], [ 0.5555555555555556, "#d8576b" ], [ 0.6666666666666666, "#ed7953" ], [ 0.7777777777777778, "#fb9f3a" ], [ 0.8888888888888888, "#fdca26" ], [ 1.0, "#f0f921" ] ] } ], "scatterpolar": [ { "type": "scatterpolar", "marker": { "colorbar": { "ticks": "", "outlinewidth": 0 } } } ], "contourcarpet": [ { "type": "contourcarpet", "colorbar": { "ticks": "", "outlinewidth": 0 } } ], "scattercarpet": [ { "type": "scattercarpet", "marker": { "colorbar": { "ticks": "", "outlinewidth": 0 } } } ], "scattermapbox": [ { "type": "scattermapbox", "marker": { "colorbar": { "ticks": "", "outlinewidth": 0 } } } ], "scatterpolargl": [ { "type": "scatterpolargl", "marker": { "colorbar": { "ticks": "", "outlinewidth": 0 } } } ], "scatterternary": [ { "type": "scatterternary", "marker": { "colorbar": { "ticks": "", "outlinewidth": 0 } } } ], "histogram2dcontour": [ { "type": "histogram2dcontour", "colorbar": { "ticks": "", "outlinewidth": 0 }, "colorscale": [ [ 0.0, "#0d0887" ], [ 0.1111111111111111, "#46039f" ], [ 0.2222222222222222, "#7201a8" ], [ 0.3333333333333333, "#9c179e" ], [ 0.4444444444444444, "#bd3786" ], [ 0.5555555555555556, "#d8576b" ], [ 0.6666666666666666, "#ed7953" ], [ 0.7777777777777778, "#fb9f3a" ], [ 0.8888888888888888, "#fdca26" ], [ 1.0, "#f0f921" ] ] } ] }, "layout": { "geo": { "bgcolor": "white", "showland": true, "lakecolor": "white", "landcolor": "#E5ECF6", "showlakes": true, "subunitcolor": "white" }, "font": { "color": "#2a3f5f" }, "polar": { "bgcolor": "#E5ECF6", "radialaxis": { "ticks": "", "gridcolor": "white", "linecolor": "white" }, "angularaxis": { "ticks": "", "gridcolor": "white", "linecolor": "white" } }, "scene": { "xaxis": { "ticks": "", "gridcolor": "white", "gridwidth": 2, "linecolor": "white", "zerolinecolor": "white", "showbackground": true, "backgroundcolor": "#E5ECF6" }, "yaxis": { "ticks": "", "gridcolor": "white", "gridwidth": 2, "linecolor": "white", "zerolinecolor": "white", "showbackground": true, "backgroundcolor": "#E5ECF6" }, "zaxis": { "ticks": "", "gridcolor": "white", "gridwidth": 2, "linecolor": "white", "zerolinecolor": "white", "showbackground": true, "backgroundcolor": "#E5ECF6" } }, "title": { "x": 0.05 }, "xaxis": { "ticks": "", "title": { "standoff": 15 }, "gridcolor": "white", "linecolor": "white", "automargin": true, "zerolinecolor": "white", "zerolinewidth": 2 }, "yaxis": { "ticks": "", "title": { "standoff": 15 }, "gridcolor": "white", "linecolor": "white", "automargin": true, "zerolinecolor": "white", "zerolinewidth": 2 }, "mapbox": { "style": "light" }, "ternary": { "aaxis": { "ticks": "", "gridcolor": "white", "linecolor": "white" }, "baxis": { "ticks": "", "gridcolor": "white", "linecolor": "white" }, "caxis": { "ticks": "", "gridcolor": "white", "linecolor": "white" }, "bgcolor": "#E5ECF6" }, "colorway": [ "#636efa", "#EF553B", "#00cc96", "#ab63fa", "#FFA15A", "#19d3f3", "#FF6692", "#B6E880", "#FF97FF", "#FECB52" ], "coloraxis": { "colorbar": { "ticks": "", "outlinewidth": 0 } }, "hovermode": "closest", "colorscale": { "diverging": [ [ 0, "#8e0152" ], [ 0.1, "#c51b7d" ], [ 0.2, "#de77ae" ], [ 0.3, "#f1b6da" ], [ 0.4, "#fde0ef" ], [ 0.5, "#f7f7f7" ], [ 0.6, "#e6f5d0" ], [ 0.7, "#b8e186" ], [ 0.8, "#7fbc41" ], [ 0.9, "#4d9221" ], [ 1, "#276419" ] ], "sequential": [ [ 0.0, "#0d0887" ], [ 0.1111111111111111, "#46039f" ], [ 0.2222222222222222, "#7201a8" ], [ 0.3333333333333333, "#9c179e" ], [ 0.4444444444444444, "#bd3786" ], [ 0.5555555555555556, "#d8576b" ], [ 0.6666666666666666, "#ed7953" ], [ 0.7777777777777778, "#fb9f3a" ], [ 0.8888888888888888, "#fdca26" ], [ 1.0, "#f0f921" ] ], "sequentialminus": [ [ 0.0, "#0d0887" ], [ 0.1111111111111111, "#46039f" ], [ 0.2222222222222222, "#7201a8" ], [ 0.3333333333333333, "#9c179e" ], [ 0.4444444444444444, "#bd3786" ], [ 0.5555555555555556, "#d8576b" ], [ 0.6666666666666666, "#ed7953" ], [ 0.7777777777777778, "#fb9f3a" ], [ 0.8888888888888888, "#fdca26" ], [ 1.0, "#f0f921" ] ] }, "hoverlabel": { "align": "left" }, "plot_bgcolor": "#E5ECF6", "paper_bgcolor": "white", "shapedefaults": { "line": { "color": "#2a3f5f" } }, "autotypenumbers": "strict", "annotationdefaults": { "arrowhead": 0, "arrowcolor": "#2a3f5f", "arrowwidth": 1 } } } } }, "height": 600, "width": 800, "user": { "profile_url": "https://chart-studio.plotly.com/~a01022883839", "avatar_url": "https://storage.googleapis.com/plotly-prod-profiles/10.jpg", "background_url": "https://storage.googleapis.com/plotly-prod-profiles/bg-14.jpg", "bio": "", "nickname": "", "website": "", "stream_tokens": null, "feature_set_id": null, "csrf_token": null, "date_joined": "2022-06-17 02:44:26", "mapbox_access_tokens": null, "has_password": null, "username": "a01022883839", "email": null, "is_active": null, "readonly": null, "is_dash_creator": null, "dash_created_count": null, "is_chart_creator": null, "charts_created_count": null } }, { "creation_time": "2024-04-16T02:42:36.726849Z", "comments": { "results": [], "count": 0 }, "parented": true, "embed_url": "https://chart-studio.plotly.com/~Prashanth.klv/14.embed", "fid": "Prashanth.klv:14", "filename": "4. hourly_trace", "filetype": "plot", "img_url": "https://storage.googleapis.com/plotly-prod-images/Prashanth.klv/14/9_ZOXHLKOEPWP2RO175PN0AIWNJWYCRK.png", "image_urls": { "default": "https://storage.googleapis.com/plotly-prod-images/Prashanth.klv/14/2_BYE5MR2W0Y01JKO6MQPOA5TE9N6G9F.png", "block-thumb": "https://storage.googleapis.com/plotly-prod-images/Prashanth.klv/14/8_8ZA2A5IWGE6UAR3WITI31MYBUTCYLN.png", "list-thumb": "https://storage.googleapis.com/plotly-prod-images/Prashanth.klv/14/9_ZOXHLKOEPWP2RO175PN0AIWNJWYCRK.png" }, "api_urls": { "files": "https://api.plotly.com/v2/files/Prashanth.klv:14", "plots": "https://api.plotly.com/v2/plots/Prashanth.klv:14", "parent": "https://api.plotly.com/v2/folders/home?user=Prashanth.klv" }, "owner": "Prashanth.klv", "parent": -1, "preview": "", "referencers": [], "references": [], "title": "", "views": 6, "web_url": "https://chart-studio.plotly.com/~Prashanth.klv/14/", "world_readable": true, "date_modified": "2024-04-16T02:42:36.738Z", "stars": { "results": [], "count": 0 }, "collaborators": { "results": [], "count": 0 }, "subfolder_count": null, "refresh_interval": null, "organize_view_url": "https://chart-studio.plotly.com/~Prashanth.klv/14/", "current_user_permission": "read", "is_theme": null, "is_template": null, "autosize": true, "caption": "", "figure": { "data": [ { "line": { "dash": "solid", "color": "#636efa" }, "mode": "markers+lines", "name": "2018", "type": "scatter", "xsrc": "Prashanth.klv:13:243406", "ysrc": "Prashanth.klv:13:f7465d", "xaxis": "x", "yaxis": "y", "marker": { "symbol": "circle" }, "showlegend": true, "legendgroup": "2018", "orientation": "v", "textposition": "bottom right", "customdatasrc": "Prashanth.klv:13:132d94", "hovertemplate": "year=%{customdata[0]}<br>number_of_collisions=%{y}<br>number_of_total_casualties=%{customdata[1]}<br>number_of_cyclist_injured=%{customdata[2]}<br>number_of_cyclist_killed=%{customdata[3]}<br>number_of_motorist_injured=%{customdata[4]}<br>number_of_motorist_killed=%{customdata[5]}<br>number_of_pedestrians_injured=%{customdata[6]}<br>number_of_pedestrians_killed=%{customdata[7]}<br>number_of_persons_injured=%{customdata[8]}<br>number_of_persons_killed=%{customdata[9]}<extra></extra>" }, { "line": { "dash": "solid", "color": "#EF553B" }, "mode": "markers+lines", "name": "2019", "type": "scatter", "xsrc": "Prashanth.klv:13:b9255e", "ysrc": "Prashanth.klv:13:f18c41", "xaxis": "x", "yaxis": "y", "marker": { "symbol": "circle" }, "showlegend": true, "legendgroup": "2019", "orientation": "v", "textposition": "bottom right", "customdatasrc": "Prashanth.klv:13:eb5cf1", "hovertemplate": "year=%{customdata[0]}<br>number_of_collisions=%{y}<br>number_of_total_casualties=%{customdata[1]}<br>number_of_cyclist_injured=%{customdata[2]}<br>number_of_cyclist_killed=%{customdata[3]}<br>number_of_motorist_injured=%{customdata[4]}<br>number_of_motorist_killed=%{customdata[5]}<br>number_of_pedestrians_injured=%{customdata[6]}<br>number_of_pedestrians_killed=%{customdata[7]}<br>number_of_persons_injured=%{customdata[8]}<br>number_of_persons_killed=%{customdata[9]}<extra></extra>" }, { "line": { "dash": "solid", "color": "#00cc96" }, "mode": "markers+lines", "name": "2020", "type": "scatter", "xsrc": "Prashanth.klv:13:cce595", "ysrc": "Prashanth.klv:13:d51c2e", "xaxis": "x", "yaxis": "y", "marker": { "symbol": "circle" }, "showlegend": true, "legendgroup": "2020", "orientation": "v", "textposition": "bottom right", "customdatasrc": "Prashanth.klv:13:8f05e2", "hovertemplate": "year=%{customdata[0]}<br>number_of_collisions=%{y}<br>number_of_total_casualties=%{customdata[1]}<br>number_of_cyclist_injured=%{customdata[2]}<br>number_of_cyclist_killed=%{customdata[3]}<br>number_of_motorist_injured=%{customdata[4]}<br>number_of_motorist_killed=%{customdata[5]}<br>number_of_pedestrians_injured=%{customdata[6]}<br>number_of_pedestrians_killed=%{customdata[7]}<br>number_of_persons_injured=%{customdata[8]}<br>number_of_persons_killed=%{customdata[9]}<extra></extra>" }, { "line": { "dash": "solid", "color": "#ab63fa" }, "mode": "markers+lines", "name": "2021", "type": "scatter", "xsrc": "Prashanth.klv:13:dc8661", "ysrc": "Prashanth.klv:13:e1cf3b", "xaxis": "x", "yaxis": "y", "marker": { "symbol": "circle" }, "showlegend": true, "legendgroup": "2021", "orientation": "v", "textposition": "bottom right", "customdatasrc": "Prashanth.klv:13:92d173", "hovertemplate": "year=%{customdata[0]}<br>number_of_collisions=%{y}<br>number_of_total_casualties=%{customdata[1]}<br>number_of_cyclist_injured=%{customdata[2]}<br>number_of_cyclist_killed=%{customdata[3]}<br>number_of_motorist_injured=%{customdata[4]}<br>number_of_motorist_killed=%{customdata[5]}<br>number_of_pedestrians_injured=%{customdata[6]}<br>number_of_pedestrians_killed=%{customdata[7]}<br>number_of_persons_injured=%{customdata[8]}<br>number_of_persons_killed=%{customdata[9]}<extra></extra>" }, { "line": { "dash": "solid", "color": "#FFA15A" }, "mode": "markers+lines", "name": "2022", "type": "scatter", "xsrc": "Prashanth.klv:13:3daff6", "ysrc": "Prashanth.klv:13:75fdb9", "xaxis": "x", "yaxis": "y", "marker": { "symbol": "circle" }, "showlegend": true, "legendgroup": "2022", "orientation": "v", "textposition": "bottom right", "customdatasrc": "Prashanth.klv:13:0838ea", "hovertemplate": "year=%{customdata[0]}<br>number_of_collisions=%{y}<br>number_of_total_casualties=%{customdata[1]}<br>number_of_cyclist_injured=%{customdata[2]}<br>number_of_cyclist_killed=%{customdata[3]}<br>number_of_motorist_injured=%{customdata[4]}<br>number_of_motorist_killed=%{customdata[5]}<br>number_of_pedestrians_injured=%{customdata[6]}<br>number_of_pedestrians_killed=%{customdata[7]}<br>number_of_persons_injured=%{customdata[8]}<br>number_of_persons_killed=%{customdata[9]}<extra></extra>" } ], "layout": { "title": { "x": 0.5, "text": "Number of Collisions at different times of the day for different Calendar Years" }, "xaxis": { "ticks": "outside", "title": { "text": "hour_of_the_day" }, "anchor": "y", "domain": [ 0.0, 1.0 ], "tickson": "boundaries", "tickvals": [ 0, 1, 2, 3, 4, 5, 6, 7, 8, 9, 10, 11, 12, 13, 14, 15, 16, 17, 18, 19, 20, 21, 22, 23 ] }, "yaxis": { "title": { "text": "number_of_collisions" }, "anchor": "x", "domain": [ 0.0, 1.0 ] }, "legend": { "title": { "text": "year" }, "tracegroupgap": 0 }, "margin": { "t": 60 }, "template": { "data": { "bar": [ { "type": "bar", "marker": { "line": { "color": "rgb(17,17,17)", "width": 0.5 }, "pattern": { "size": 10, "fillmode": "overlay", "solidity": 0.2 } }, "error_x": { "color": "#f2f5fa" }, "error_y": { "color": "#f2f5fa" } } ], "pie": [ { "type": "pie", "automargin": true } ], "table": [ { "type": "table", "cells": { "fill": { "color": "#506784" }, "line": { "color": "rgb(17,17,17)" } }, "header": { "fill": { "color": "#2a3f5f" }, "line": { "color": "rgb(17,17,17)" } } } ], "carpet": [ { "type": "carpet", "aaxis": { "gridcolor": "#506784", "linecolor": "#506784", "endlinecolor": "#A2B1C6", "minorgridcolor": "#506784", "startlinecolor": "#A2B1C6" }, "baxis": { "gridcolor": "#506784", "linecolor": "#506784", "endlinecolor": "#A2B1C6", "minorgridcolor": "#506784", "startlinecolor": "#A2B1C6" } } ], "mesh3d": [ { "type": "mesh3d", "colorbar": { "ticks": "", "outlinewidth": 0 } } ], "contour": [ { "type": "contour", "colorbar": { "ticks": "", "outlinewidth": 0 }, "colorscale": [ [ 0.0, "#0d0887" ], [ 0.1111111111111111, "#46039f" ], [ 0.2222222222222222, "#7201a8" ], [ 0.3333333333333333, "#9c179e" ], [ 0.4444444444444444, "#bd3786" ], [ 0.5555555555555556, "#d8576b" ], [ 0.6666666666666666, "#ed7953" ], [ 0.7777777777777778, "#fb9f3a" ], [ 0.8888888888888888, "#fdca26" ], [ 1.0, "#f0f921" ] ] } ], "heatmap": [ { "type": "heatmap", "colorbar": { "ticks": "", "outlinewidth": 0 }, "colorscale": [ [ 0.0, "#0d0887" ], [ 0.1111111111111111, "#46039f" ], [ 0.2222222222222222, "#7201a8" ], [ 0.3333333333333333, "#9c179e" ], [ 0.4444444444444444, "#bd3786" ], [ 0.5555555555555556, "#d8576b" ], [ 0.6666666666666666, "#ed7953" ], [ 0.7777777777777778, "#fb9f3a" ], [ 0.8888888888888888, "#fdca26" ], [ 1.0, "#f0f921" ] ] } ], "scatter": [ { "type": "scatter", "marker": { "line": { "color": "#283442" } } } ], "surface": [ { "type": "surface", "colorbar": { "ticks": "", "outlinewidth": 0 }, "colorscale": [ [ 0.0, "#0d0887" ], [ 0.1111111111111111, "#46039f" ], [ 0.2222222222222222, "#7201a8" ], [ 0.3333333333333333, "#9c179e" ], [ 0.4444444444444444, "#bd3786" ], [ 0.5555555555555556, "#d8576b" ], [ 0.6666666666666666, "#ed7953" ], [ 0.7777777777777778, "#fb9f3a" ], [ 0.8888888888888888, "#fdca26" ], [ 1.0, "#f0f921" ] ] } ], "barpolar": [ { "type": "barpolar", "marker": { "line": { "color": "rgb(17,17,17)", "width": 0.5 }, "pattern": { "size": 10, "fillmode": "overlay", "solidity": 0.2 } } } ], "heatmapgl": [ { "type": "heatmapgl", "colorbar": { "ticks": "", "outlinewidth": 0 }, "colorscale": [ [ 0.0, "#0d0887" ], [ 0.1111111111111111, "#46039f" ], [ 0.2222222222222222, "#7201a8" ], [ 0.3333333333333333, "#9c179e" ], [ 0.4444444444444444, "#bd3786" ], [ 0.5555555555555556, "#d8576b" ], [ 0.6666666666666666, "#ed7953" ], [ 0.7777777777777778, "#fb9f3a" ], [ 0.8888888888888888, "#fdca26" ], [ 1.0, "#f0f921" ] ] } ], "histogram": [ { "type": "histogram", "marker": { "pattern": { "size": 10, "fillmode": "overlay", "solidity": 0.2 } } } ], "parcoords": [ { "line": { "colorbar": { "ticks": "", "outlinewidth": 0 } }, "type": "parcoords" } ], "scatter3d": [ { "line": { "colorbar": { "ticks": "", "outlinewidth": 0 } }, "type": "scatter3d", "marker": { "colorbar": { "ticks": "", "outlinewidth": 0 } } } ], "scattergl": [ { "type": "scattergl", "marker": { "line": { "color": "#283442" } } } ], "choropleth": [ { "type": "choropleth", "colorbar": { "ticks": "", "outlinewidth": 0 } } ], "scattergeo": [ { "type": "scattergeo", "marker": { "colorbar": { "ticks": "", "outlinewidth": 0 } } } ], "histogram2d": [ { "type": "histogram2d", "colorbar": { "ticks": "", "outlinewidth": 0 }, "colorscale": [ [ 0.0, "#0d0887" ], [ 0.1111111111111111, "#46039f" ], [ 0.2222222222222222, "#7201a8" ], [ 0.3333333333333333, "#9c179e" ], [ 0.4444444444444444, "#bd3786" ], [ 0.5555555555555556, "#d8576b" ], [ 0.6666666666666666, "#ed7953" ], [ 0.7777777777777778, "#fb9f3a" ], [ 0.8888888888888888, "#fdca26" ], [ 1.0, "#f0f921" ] ] } ], "scatterpolar": [ { "type": "scatterpolar", "marker": { "colorbar": { "ticks": "", "outlinewidth": 0 } } } ], "contourcarpet": [ { "type": "contourcarpet", "colorbar": { "ticks": "", "outlinewidth": 0 } } ], "scattercarpet": [ { "type": "scattercarpet", "marker": { "colorbar": { "ticks": "", "outlinewidth": 0 } } } ], "scattermapbox": [ { "type": "scattermapbox", "marker": { "colorbar": { "ticks": "", "outlinewidth": 0 } } } ], "scatterpolargl": [ { "type": "scatterpolargl", "marker": { "colorbar": { "ticks": "", "outlinewidth": 0 } } } ], "scatterternary": [ { "type": "scatterternary", "marker": { "colorbar": { "ticks": "", "outlinewidth": 0 } } } ], "histogram2dcontour": [ { "type": "histogram2dcontour", "colorbar": { "ticks": "", "outlinewidth": 0 }, "colorscale": [ [ 0.0, "#0d0887" ], [ 0.1111111111111111, "#46039f" ], [ 0.2222222222222222, "#7201a8" ], [ 0.3333333333333333, "#9c179e" ], [ 0.4444444444444444, "#bd3786" ], [ 0.5555555555555556, "#d8576b" ], [ 0.6666666666666666, "#ed7953" ], [ 0.7777777777777778, "#fb9f3a" ], [ 0.8888888888888888, "#fdca26" ], [ 1.0, "#f0f921" ] ] } ] }, "layout": { "geo": { "bgcolor": "rgb(17,17,17)", "showland": true, "lakecolor": "rgb(17,17,17)", "landcolor": "rgb(17,17,17)", "showlakes": true, "subunitcolor": "#506784" }, "font": { "color": "#f2f5fa" }, "polar": { "bgcolor": "rgb(17,17,17)", "radialaxis": { "ticks": "", "gridcolor": "#506784", "linecolor": "#506784" }, "angularaxis": { "ticks": "", "gridcolor": "#506784", "linecolor": "#506784" } }, "scene": { "xaxis": { "ticks": "", "gridcolor": "#506784", "gridwidth": 2, "linecolor": "#506784", "zerolinecolor": "#C8D4E3", "showbackground": true, "backgroundcolor": "rgb(17,17,17)" }, "yaxis": { "ticks": "", "gridcolor": "#506784", "gridwidth": 2, "linecolor": "#506784", "zerolinecolor": "#C8D4E3", "showbackground": true, "backgroundcolor": "rgb(17,17,17)" }, "zaxis": { "ticks": "", "gridcolor": "#506784", "gridwidth": 2, "linecolor": "#506784", "zerolinecolor": "#C8D4E3", "showbackground": true, "backgroundcolor": "rgb(17,17,17)" } }, "title": { "x": 0.05 }, "xaxis": { "ticks": "", "title": { "standoff": 15 }, "gridcolor": "#283442", "linecolor": "#506784", "automargin": true, "zerolinecolor": "#283442", "zerolinewidth": 2 }, "yaxis": { "ticks": "", "title": { "standoff": 15 }, "gridcolor": "#283442", "linecolor": "#506784", "automargin": true, "zerolinecolor": "#283442", "zerolinewidth": 2 }, "mapbox": { "style": "dark" }, "ternary": { "aaxis": { "ticks": "", "gridcolor": "#506784", "linecolor": "#506784" }, "baxis": { "ticks": "", "gridcolor": "#506784", "linecolor": "#506784" }, "caxis": { "ticks": "", "gridcolor": "#506784", "linecolor": "#506784" }, "bgcolor": "rgb(17,17,17)" }, "colorway": [ "#636efa", "#EF553B", "#00cc96", "#ab63fa", "#FFA15A", "#19d3f3", "#FF6692", "#B6E880", "#FF97FF", "#FECB52" ], "coloraxis": { "colorbar": { "ticks": "", "outlinewidth": 0 } }, "hovermode": "closest", "colorscale": { "diverging": [ [ 0, "#8e0152" ], [ 0.1, "#c51b7d" ], [ 0.2, "#de77ae" ], [ 0.3, "#f1b6da" ], [ 0.4, "#fde0ef" ], [ 0.5, "#f7f7f7" ], [ 0.6, "#e6f5d0" ], [ 0.7, "#b8e186" ], [ 0.8, "#7fbc41" ], [ 0.9, "#4d9221" ], [ 1, "#276419" ] ], "sequential": [ [ 0.0, "#0d0887" ], [ 0.1111111111111111, "#46039f" ], [ 0.2222222222222222, "#7201a8" ], [ 0.3333333333333333, "#9c179e" ], [ 0.4444444444444444, "#bd3786" ], [ 0.5555555555555556, "#d8576b" ], [ 0.6666666666666666, "#ed7953" ], [ 0.7777777777777778, "#fb9f3a" ], [ 0.8888888888888888, "#fdca26" ], [ 1.0, "#f0f921" ] ], "sequentialminus": [ [ 0.0, "#0d0887" ], [ 0.1111111111111111, "#46039f" ], [ 0.2222222222222222, "#7201a8" ], [ 0.3333333333333333, "#9c179e" ], [ 0.4444444444444444, "#bd3786" ], [ 0.5555555555555556, "#d8576b" ], [ 0.6666666666666666, "#ed7953" ], [ 0.7777777777777778, "#fb9f3a" ], [ 0.8888888888888888, "#fdca26" ], [ 1.0, "#f0f921" ] ] }, "hoverlabel": { "align": "left" }, "plot_bgcolor": "rgb(17,17,17)", "paper_bgcolor": "rgb(17,17,17)", "shapedefaults": { "line": { "color": "#f2f5fa" } }, "sliderdefaults": { "bgcolor": "#C8D4E3", "tickwidth": 0, "bordercolor": "rgb(17,17,17)", "borderwidth": 1 }, "autotypenumbers": "strict", "annotationdefaults": { "arrowhead": 0, "arrowcolor": "#f2f5fa", "arrowwidth": 1 }, "updatemenudefaults": { "bgcolor": "#506784", "borderwidth": 0 } } }, "hoverlabel": { "font": { "size": 12, "family": "Rockwell" }, "bgcolor": "white" } } }, "height": null, "width": null, "user": { "profile_url": "https://chart-studio.plotly.com/~Prashanth.klv", "avatar_url": "https://storage.googleapis.com/plotly-prod-profiles/14.jpg", "background_url": "https://storage.googleapis.com/plotly-prod-profiles/bg-13.jpg", "bio": "", "nickname": "", "website": "", "stream_tokens": null, "feature_set_id": null, "csrf_token": null, "date_joined": "2024-04-13 00:25:15", "mapbox_access_tokens": null, "has_password": null, "username": "Prashanth.klv", "email": null, "is_active": null, "readonly": null, "is_dash_creator": null, "dash_created_count": null, "is_chart_creator": null, "charts_created_count": null } }, { "creation_time": "2024-04-16T02:36:01.905322Z", "comments": { "results": [], "count": 0 }, "parented": true, "embed_url": "https://chart-studio.plotly.com/~hiteshrane5/6.embed", "fid": "hiteshrane5:6", "filename": "plot from API", "filetype": "plot", "img_url": "https://api.plotly.com/v2/files/hiteshrane5:6/image?image_name=list-thumb", "image_urls": { "default": "https://api.plotly.com/v2/files/hiteshrane5:6/image?image_name=default", "block-thumb": "https://api.plotly.com/v2/files/hiteshrane5:6/image?image_name=block-thumb", "list-thumb": "https://api.plotly.com/v2/files/hiteshrane5:6/image?image_name=list-thumb" }, "api_urls": { "files": "https://api.plotly.com/v2/files/hiteshrane5:6", "plots": "https://api.plotly.com/v2/plots/hiteshrane5:6", "parent": "https://api.plotly.com/v2/folders/home?user=hiteshrane5" }, "owner": "hiteshrane5", "parent": -1, "preview": "", "referencers": [], "references": [], "title": "", "views": 1, "web_url": "https://chart-studio.plotly.com/~hiteshrane5/6/", "world_readable": true, "date_modified": "2024-04-16T02:36:02.888Z", "stars": { "results": [], "count": 0 }, "collaborators": { "results": [], "count": 0 }, "subfolder_count": null, "refresh_interval": null, "organize_view_url": "https://chart-studio.plotly.com/~hiteshrane5/6/", "current_user_permission": "read", "is_theme": null, "is_template": null, "autosize": true, "caption": "", "figure": { "data": [ { "type": "contour", "zsrc": "hiteshrane5:7:", "contours": { "coloring": "heatmap", "labelfont": { "size": 12, "color": "white", "family": "Raleway" }, "showlabels": true } } ], "layout": {} }, "height": null, "width": null, "user": { "profile_url": "https://chart-studio.plotly.com/~hiteshrane5", "avatar_url": "https://storage.googleapis.com/plotly-prod-profiles/57.jpg", "background_url": "https://storage.googleapis.com/plotly-prod-profiles/bg-13.jpg", "bio": "", "nickname": "", "website": "", "stream_tokens": null, "feature_set_id": null, "csrf_token": null, "date_joined": "2024-04-10 03:48:18", "mapbox_access_tokens": null, "has_password": null, "username": "hiteshrane5", "email": null, "is_active": null, "readonly": null, "is_dash_creator": null, "dash_created_count": null, "is_chart_creator": null, "charts_created_count": null } }, { "creation_time": "2024-04-16T02:27:08.295235Z", "comments": { "results": [], "count": 0 }, "parented": true, "embed_url": "https://chart-studio.plotly.com/~yonglijin/1.embed", "fid": "yonglijin:1", "filename": "Sine wave", "filetype": "plot", "img_url": "https://storage.googleapis.com/plotly-prod-images/yonglijin/1/9_9W4J45PTACGBA1857AWRE23RZXI9FD.png", "image_urls": { "default": "https://storage.googleapis.com/plotly-prod-images/yonglijin/1/2_H783Z7MGN8QPDJDPCLP3N3SPYFBJV5.png", "block-thumb": "https://storage.googleapis.com/plotly-prod-images/yonglijin/1/8_XHXPOA2P68XZLGC8ZFGCMYZCQZZKS2.png", "list-thumb": "https://storage.googleapis.com/plotly-prod-images/yonglijin/1/9_9W4J45PTACGBA1857AWRE23RZXI9FD.png" }, "api_urls": { "files": "https://api.plotly.com/v2/files/yonglijin:1", "plots": "https://api.plotly.com/v2/plots/yonglijin:1", "parent": "https://api.plotly.com/v2/folders/home?user=yonglijin" }, "owner": "yonglijin", "parent": -1, "preview": "", "referencers": [], "references": [], "title": "", "views": 1, "web_url": "https://chart-studio.plotly.com/~yonglijin/1/", "world_readable": true, "date_modified": "2024-04-16T02:27:08.305Z", "stars": { "results": [], "count": 0 }, "collaborators": { "results": [], "count": 0 }, "subfolder_count": null, "refresh_interval": null, "organize_view_url": "https://chart-studio.plotly.com/~yonglijin/1/", "current_user_permission": "read", "is_theme": null, "is_template": null, "autosize": true, "caption": "", "figure": { "data": [ { "type": "scatter", "xsrc": "yonglijin:0:44de8c", "ysrc": "yonglijin:0:b32c80" } ], "layout": { "template": { "data": { "bar": [ { "type": "bar", "marker": { "line": { "color": "#E5ECF6", "width": 0.5 }, "pattern": { "size": 10, "fillmode": "overlay", "solidity": 0.2 } }, "error_x": { "color": "#2a3f5f" }, "error_y": { "color": "#2a3f5f" } } ], "pie": [ { "type": "pie", "automargin": true } ], "table": [ { "type": "table", "cells": { "fill": { "color": "#EBF0F8" }, "line": { "color": "white" } }, "header": { "fill": { "color": "#C8D4E3" }, "line": { "color": "white" } } } ], "carpet": [ { "type": "carpet", "aaxis": { "gridcolor": "white", "linecolor": "white", "endlinecolor": "#2a3f5f", "minorgridcolor": "white", "startlinecolor": "#2a3f5f" }, "baxis": { "gridcolor": "white", "linecolor": "white", "endlinecolor": "#2a3f5f", "minorgridcolor": "white", "startlinecolor": "#2a3f5f" } } ], "mesh3d": [ { "type": "mesh3d", "colorbar": { "ticks": "", "outlinewidth": 0 } } ], "contour": [ { "type": "contour", "colorbar": { "ticks": "", "outlinewidth": 0 }, "colorscale": [ [ 0.0, "#0d0887" ], [ 0.1111111111111111, "#46039f" ], [ 0.2222222222222222, "#7201a8" ], [ 0.3333333333333333, "#9c179e" ], [ 0.4444444444444444, "#bd3786" ], [ 0.5555555555555556, "#d8576b" ], [ 0.6666666666666666, "#ed7953" ], [ 0.7777777777777778, "#fb9f3a" ], [ 0.8888888888888888, "#fdca26" ], [ 1.0, "#f0f921" ] ] } ], "heatmap": [ { "type": "heatmap", "colorbar": { "ticks": "", "outlinewidth": 0 }, "colorscale": [ [ 0.0, "#0d0887" ], [ 0.1111111111111111, "#46039f" ], [ 0.2222222222222222, "#7201a8" ], [ 0.3333333333333333, "#9c179e" ], [ 0.4444444444444444, "#bd3786" ], [ 0.5555555555555556, "#d8576b" ], [ 0.6666666666666666, "#ed7953" ], [ 0.7777777777777778, "#fb9f3a" ], [ 0.8888888888888888, "#fdca26" ], [ 1.0, "#f0f921" ] ] } ], "scatter": [ { "type": "scatter", "fillpattern": { "size": 10, "fillmode": "overlay", "solidity": 0.2 } } ], "surface": [ { "type": "surface", "colorbar": { "ticks": "", "outlinewidth": 0 }, "colorscale": [ [ 0.0, "#0d0887" ], [ 0.1111111111111111, "#46039f" ], [ 0.2222222222222222, "#7201a8" ], [ 0.3333333333333333, "#9c179e" ], [ 0.4444444444444444, "#bd3786" ], [ 0.5555555555555556, "#d8576b" ], [ 0.6666666666666666, "#ed7953" ], [ 0.7777777777777778, "#fb9f3a" ], [ 0.8888888888888888, "#fdca26" ], [ 1.0, "#f0f921" ] ] } ], "barpolar": [ { "type": "barpolar", "marker": { "line": { "color": "#E5ECF6", "width": 0.5 }, "pattern": { "size": 10, "fillmode": "overlay", "solidity": 0.2 } } } ], "heatmapgl": [ { "type": "heatmapgl", "colorbar": { "ticks": "", "outlinewidth": 0 }, "colorscale": [ [ 0.0, "#0d0887" ], [ 0.1111111111111111, "#46039f" ], [ 0.2222222222222222, "#7201a8" ], [ 0.3333333333333333, "#9c179e" ], [ 0.4444444444444444, "#bd3786" ], [ 0.5555555555555556, "#d8576b" ], [ 0.6666666666666666, "#ed7953" ], [ 0.7777777777777778, "#fb9f3a" ], [ 0.8888888888888888, "#fdca26" ], [ 1.0, "#f0f921" ] ] } ], "histogram": [ { "type": "histogram", "marker": { "pattern": { "size": 10, "fillmode": "overlay", "solidity": 0.2 } } } ], "parcoords": [ { "line": { "colorbar": { "ticks": "", "outlinewidth": 0 } }, "type": "parcoords" } ], "scatter3d": [ { "line": { "colorbar": { "ticks": "", "outlinewidth": 0 } }, "type": "scatter3d", "marker": { "colorbar": { "ticks": "", "outlinewidth": 0 } } } ], "scattergl": [ { "type": "scattergl", "marker": { "colorbar": { "ticks": "", "outlinewidth": 0 } } } ], "choropleth": [ { "type": "choropleth", "colorbar": { "ticks": "", "outlinewidth": 0 } } ], "scattergeo": [ { "type": "scattergeo", "marker": { "colorbar": { "ticks": "", "outlinewidth": 0 } } } ], "histogram2d": [ { "type": "histogram2d", "colorbar": { "ticks": "", "outlinewidth": 0 }, "colorscale": [ [ 0.0, "#0d0887" ], [ 0.1111111111111111, "#46039f" ], [ 0.2222222222222222, "#7201a8" ], [ 0.3333333333333333, "#9c179e" ], [ 0.4444444444444444, "#bd3786" ], [ 0.5555555555555556, "#d8576b" ], [ 0.6666666666666666, "#ed7953" ], [ 0.7777777777777778, "#fb9f3a" ], [ 0.8888888888888888, "#fdca26" ], [ 1.0, "#f0f921" ] ] } ], "scatterpolar": [ { "type": "scatterpolar", "marker": { "colorbar": { "ticks": "", "outlinewidth": 0 } } } ], "contourcarpet": [ { "type": "contourcarpet", "colorbar": { "ticks": "", "outlinewidth": 0 } } ], "scattercarpet": [ { "type": "scattercarpet", "marker": { "colorbar": { "ticks": "", "outlinewidth": 0 } } } ], "scattermapbox": [ { "type": "scattermapbox", "marker": { "colorbar": { "ticks": "", "outlinewidth": 0 } } } ], "scatterpolargl": [ { "type": "scatterpolargl", "marker": { "colorbar": { "ticks": "", "outlinewidth": 0 } } } ], "scatterternary": [ { "type": "scatterternary", "marker": { "colorbar": { "ticks": "", "outlinewidth": 0 } } } ], "histogram2dcontour": [ { "type": "histogram2dcontour", "colorbar": { "ticks": "", "outlinewidth": 0 }, "colorscale": [ [ 0.0, "#0d0887" ], [ 0.1111111111111111, "#46039f" ], [ 0.2222222222222222, "#7201a8" ], [ 0.3333333333333333, "#9c179e" ], [ 0.4444444444444444, "#bd3786" ], [ 0.5555555555555556, "#d8576b" ], [ 0.6666666666666666, "#ed7953" ], [ 0.7777777777777778, "#fb9f3a" ], [ 0.8888888888888888, "#fdca26" ], [ 1.0, "#f0f921" ] ] } ] }, "layout": { "geo": { "bgcolor": "white", "showland": true, "lakecolor": "white", "landcolor": "#E5ECF6", "showlakes": true, "subunitcolor": "white" }, "font": { "color": "#2a3f5f" }, "polar": { "bgcolor": "#E5ECF6", "radialaxis": { "ticks": "", "gridcolor": "white", "linecolor": "white" }, "angularaxis": { "ticks": "", "gridcolor": "white", "linecolor": "white" } }, "scene": { "xaxis": { "ticks": "", "gridcolor": "white", "gridwidth": 2, "linecolor": "white", "zerolinecolor": "white", "showbackground": true, "backgroundcolor": "#E5ECF6" }, "yaxis": { "ticks": "", "gridcolor": "white", "gridwidth": 2, "linecolor": "white", "zerolinecolor": "white", "showbackground": true, "backgroundcolor": "#E5ECF6" }, "zaxis": { "ticks": "", "gridcolor": "white", "gridwidth": 2, "linecolor": "white", "zerolinecolor": "white", "showbackground": true, "backgroundcolor": "#E5ECF6" } }, "title": { "x": 0.05 }, "xaxis": { "ticks": "", "title": { "standoff": 15 }, "gridcolor": "white", "linecolor": "white", "automargin": true, "zerolinecolor": "white", "zerolinewidth": 2 }, "yaxis": { "ticks": "", "title": { "standoff": 15 }, "gridcolor": "white", "linecolor": "white", "automargin": true, "zerolinecolor": "white", "zerolinewidth": 2 }, "mapbox": { "style": "light" }, "ternary": { "aaxis": { "ticks": "", "gridcolor": "white", "linecolor": "white" }, "baxis": { "ticks": "", "gridcolor": "white", "linecolor": "white" }, "caxis": { "ticks": "", "gridcolor": "white", "linecolor": "white" }, "bgcolor": "#E5ECF6" }, "colorway": [ "#636efa", "#EF553B", "#00cc96", "#ab63fa", "#FFA15A", "#19d3f3", "#FF6692", "#B6E880", "#FF97FF", "#FECB52" ], "coloraxis": { "colorbar": { "ticks": "", "outlinewidth": 0 } }, "hovermode": "closest", "colorscale": { "diverging": [ [ 0, "#8e0152" ], [ 0.1, "#c51b7d" ], [ 0.2, "#de77ae" ], [ 0.3, "#f1b6da" ], [ 0.4, "#fde0ef" ], [ 0.5, "#f7f7f7" ], [ 0.6, "#e6f5d0" ], [ 0.7, "#b8e186" ], [ 0.8, "#7fbc41" ], [ 0.9, "#4d9221" ], [ 1, "#276419" ] ], "sequential": [ [ 0.0, "#0d0887" ], [ 0.1111111111111111, "#46039f" ], [ 0.2222222222222222, "#7201a8" ], [ 0.3333333333333333, "#9c179e" ], [ 0.4444444444444444, "#bd3786" ], [ 0.5555555555555556, "#d8576b" ], [ 0.6666666666666666, "#ed7953" ], [ 0.7777777777777778, "#fb9f3a" ], [ 0.8888888888888888, "#fdca26" ], [ 1.0, "#f0f921" ] ], "sequentialminus": [ [ 0.0, "#0d0887" ], [ 0.1111111111111111, "#46039f" ], [ 0.2222222222222222, "#7201a8" ], [ 0.3333333333333333, "#9c179e" ], [ 0.4444444444444444, "#bd3786" ], [ 0.5555555555555556, "#d8576b" ], [ 0.6666666666666666, "#ed7953" ], [ 0.7777777777777778, "#fb9f3a" ], [ 0.8888888888888888, "#fdca26" ], [ 1.0, "#f0f921" ] ] }, "hoverlabel": { "align": "left" }, "plot_bgcolor": "#E5ECF6", "paper_bgcolor": "white", "shapedefaults": { "line": { "color": "#2a3f5f" } }, "autotypenumbers": "strict", "annotationdefaults": { "arrowhead": 0, "arrowcolor": "#2a3f5f", "arrowwidth": 1 } } } } }, "height": null, "width": null, "user": { "profile_url": "https://chart-studio.plotly.com/~yonglijin", "avatar_url": "https://storage.googleapis.com/plotly-prod-profiles/15.jpg", "background_url": "https://storage.googleapis.com/plotly-prod-profiles/bg-4.jpg", "bio": "", "nickname": "", "website": "", "stream_tokens": null, "feature_set_id": null, "csrf_token": null, "date_joined": "2024-04-16 01:48:30", "mapbox_access_tokens": null, "has_password": null, "username": "yonglijin", "email": null, "is_active": null, "readonly": null, "is_dash_creator": null, "dash_created_count": null, "is_chart_creator": null, "charts_created_count": null } }, { "creation_time": "2024-04-16T02:26:09.263658Z", "comments": { "results": [], "count": 0 }, "parented": true, "embed_url": "https://chart-studio.plotly.com/~drtagkim/3.embed", "fid": "drtagkim:3", "filename": "sample", "filetype": "plot", "img_url": "https://storage.googleapis.com/plotly-prod-images/drtagkim/3/9_6VL31S2W95WMAVOUJ8VF6RAGJ49N9A.png", "image_urls": { "default": "https://storage.googleapis.com/plotly-prod-images/drtagkim/3/2_LE3KS9KUSKQXJ4OXE8P5W5F1LPMTB5.png", "block-thumb": "https://storage.googleapis.com/plotly-prod-images/drtagkim/3/8_097J8E0FDB5KUP8UH8E0OXN9G22EW0.png", "list-thumb": "https://storage.googleapis.com/plotly-prod-images/drtagkim/3/9_6VL31S2W95WMAVOUJ8VF6RAGJ49N9A.png" }, "api_urls": { "files": "https://api.plotly.com/v2/files/drtagkim:3", "plots": "https://api.plotly.com/v2/plots/drtagkim:3", "parent": "https://api.plotly.com/v2/folders/home?user=drtagkim" }, "owner": "drtagkim", "parent": -1, "preview": "", "referencers": [], "references": [], "title": "", "views": 1, "web_url": "https://chart-studio.plotly.com/~drtagkim/3/", "world_readable": true, "date_modified": "2024-04-16T02:26:09.275Z", "stars": { "results": [], "count": 0 }, "collaborators": { "results": [], "count": 0 }, "subfolder_count": null, "refresh_interval": null, "organize_view_url": "https://chart-studio.plotly.com/~drtagkim/3/", "current_user_permission": "read", "is_theme": null, "is_template": false, "autosize": true, "caption": "", "figure": { "data": [ { "meta": { "columnNames": { "z": "value", "text": "locations", "locations": "locations" } }, "mode": "markers", "name": "Some Geo Map", "type": "choropleth", "zsrc": "drtagkim:2:4bbc13", "textsrc": "drtagkim:2:0b23a8", "showscale": false, "colorscale": [ [ 0, "#fcfbfd" ], [ 0.125, "#efedf5" ], [ 0.25, "#dadaeb" ], [ 0.375, "#bcbddc" ], [ 0.5, "#9e9ac8" ], [ 0.625, "#807dba" ], [ 0.75, "#6a51a3" ], [ 0.875, "#54278f" ], [ 1, "#3f007d" ] ], "locationmode": "country names", "locationssrc": "drtagkim:2:0b23a8", "autocolorscale": false }, { "meta": { "columnNames": { "z": "value2", "locations": "locations" } }, "type": "choropleth", "zsrc": "drtagkim:2:05b514", "marker": { "opacity": 0.18 }, "showscale": false, "locationmode": "country names", "locationssrc": "drtagkim:2:0b23a8" } ], "frames": [], "layout": { "geo": {}, "xaxis": { "range": [ -1, 6 ], "autorange": true }, "yaxis": { "range": [ -1, 4 ], "autorange": true }, "autosize": true, "template": { "data": { "bar": [ { "type": "bar", "marker": { "colorbar": { "ticks": "", "outlinewidth": 0 } } } ], "table": [ { "type": "table", "cells": { "fill": { "color": "#EBF0F8" }, "line": { "color": "white" } }, "header": { "fill": { "color": "#C8D4E3" }, "line": { "color": "white" } } } ], "carpet": [ { "type": "carpet", "aaxis": { "gridcolor": "#C8D4E3", "linecolor": "#C8D4E3", "endlinecolor": "#2a3f5f", "minorgridcolor": "#C8D4E3", "startlinecolor": "#2a3f5f" }, "baxis": { "gridcolor": "#C8D4E3", "linecolor": "#C8D4E3", "endlinecolor": "#2a3f5f", "minorgridcolor": "#C8D4E3", "startlinecolor": "#2a3f5f" } } ], "mesh3d": [ { "type": "mesh3d", "colorbar": { "ticks": "", "outlinewidth": 0 } } ], "contour": [ { "type": "contour", "colorbar": { "ticks": "", "outlinewidth": 0 }, "autocolorscale": true } ], "heatmap": [ { "type": "heatmap", "colorbar": { "ticks": "", "outlinewidth": 0 }, "autocolorscale": true } ], "scatter": [ { "type": "scatter", "marker": { "colorbar": { "ticks": "", "outlinewidth": 0 } } } ], "surface": [ { "type": "surface", "colorbar": { "ticks": "", "outlinewidth": 0 } } ], "heatmapgl": [ { "type": "heatmapgl", "colorbar": { "ticks": "", "outlinewidth": 0 } } ], "histogram": [ { "type": "histogram", "marker": { "colorbar": { "ticks": "", "outlinewidth": 0 } } } ], "parcoords": [ { "line": { "colorbar": { "ticks": "", "outlinewidth": 0 } }, "type": "parcoords" } ], "scatter3d": [ { "type": "scatter3d", "marker": { "colorbar": { "ticks": "", "outlinewidth": 0 } } } ], "scattergl": [ { "type": "scattergl", "marker": { "colorbar": { "ticks": "", "outlinewidth": 0 } } } ], "choropleth": [ { "type": "choropleth", "colorbar": { "ticks": "", "outlinewidth": 0 } } ], "scattergeo": [ { "type": "scattergeo", "marker": { "colorbar": { "ticks": "", "outlinewidth": 0 } } } ], "histogram2d": [ { "type": "histogram2d", "colorbar": { "ticks": "", "outlinewidth": 0 }, "autocolorscale": true } ], "scatterpolar": [ { "type": "scatterpolar", "marker": { "colorbar": { "ticks": "", "outlinewidth": 0 } } } ], "contourcarpet": [ { "type": "contourcarpet", "colorbar": { "ticks": "", "outlinewidth": 0 } } ], "scattercarpet": [ { "type": "scattercarpet", "marker": { "colorbar": { "ticks": "", "outlinewidth": 0 } } } ], "scattermapbox": [ { "type": "scattermapbox", "marker": { "colorbar": { "ticks": "", "outlinewidth": 0 } } } ], "scatterpolargl": [ { "type": "scatterpolargl", "marker": { "colorbar": { "ticks": "", "outlinewidth": 0 } } } ], "scatterternary": [ { "type": "scatterternary", "marker": { "colorbar": { "ticks": "", "outlinewidth": 0 } } } ], "histogram2dcontour": [ { "type": "histogram2dcontour", "colorbar": { "ticks": "", "outlinewidth": 0 }, "autocolorscale": true } ] }, "layout": { "geo": { "bgcolor": "white", "showland": true, "lakecolor": "white", "landcolor": "white", "showlakes": true, "subunitcolor": "#C8D4E3" }, "font": { "color": "#2a3f5f" }, "polar": { "bgcolor": "white", "radialaxis": { "ticks": "", "gridcolor": "#EBF0F8", "linecolor": "#EBF0F8" }, "angularaxis": { "ticks": "", "gridcolor": "#EBF0F8", "linecolor": "#EBF0F8" } }, "scene": { "xaxis": { "ticks": "", "gridcolor": "#DFE8F3", "gridwidth": 2, "linecolor": "#EBF0F8", "zerolinecolor": "#EBF0F8", "showbackground": true, "backgroundcolor": "white" }, "yaxis": { "ticks": "", "gridcolor": "#DFE8F3", "gridwidth": 2, "linecolor": "#EBF0F8", "zerolinecolor": "#EBF0F8", "showbackground": true, "backgroundcolor": "white" }, "zaxis": { "ticks": "", "gridcolor": "#DFE8F3", "gridwidth": 2, "linecolor": "#EBF0F8", "zerolinecolor": "#EBF0F8", "showbackground": true, "backgroundcolor": "white" } }, "title": { "x": 0.05 }, "xaxis": { "ticks": "", "gridcolor": "#EBF0F8", "linecolor": "#EBF0F8", "automargin": true, "zerolinecolor": "#EBF0F8", "zerolinewidth": 2 }, "yaxis": { "ticks": "", "gridcolor": "#EBF0F8", "linecolor": "#EBF0F8", "automargin": true, "zerolinecolor": "#EBF0F8", "zerolinewidth": 2 }, "ternary": { "aaxis": { "ticks": "", "gridcolor": "#DFE8F3", "linecolor": "#A2B1C6" }, "baxis": { "ticks": "", "gridcolor": "#DFE8F3", "linecolor": "#A2B1C6" }, "caxis": { "ticks": "", "gridcolor": "#DFE8F3", "linecolor": "#A2B1C6" }, "bgcolor": "white" }, "colorway": [ "#636efa", "#EF553B", "#00cc96", "#ab63fa", "#19d3f3", "#e763fa", "#fecb52", "#ffa15a", "#ff6692", "#b6e880" ], "hovermode": "closest", "colorscale": { "diverging": [ [ 0, "#8e0152" ], [ 0.1, "#c51b7d" ], [ 0.2, "#de77ae" ], [ 0.3, "#f1b6da" ], [ 0.4, "#fde0ef" ], [ 0.5, "#f7f7f7" ], [ 0.6, "#e6f5d0" ], [ 0.7, "#b8e186" ], [ 0.8, "#7fbc41" ], [ 0.9, "#4d9221" ], [ 1, "#276419" ] ], "sequential": [ [ 0, "#0508b8" ], [ 0.0893854748603352, "#1910d8" ], [ 0.1787709497206704, "#3c19f0" ], [ 0.2681564245810056, "#6b1cfb" ], [ 0.3575418994413408, "#981cfd" ], [ 0.44692737430167595, "#bf1cfd" ], [ 0.5363128491620112, "#dd2bfd" ], [ 0.6256983240223464, "#f246fe" ], [ 0.7150837988826816, "#fc67fd" ], [ 0.8044692737430168, "#fe88fc" ], [ 0.8938547486033519, "#fea5fd" ], [ 0.9832402234636871, "#febefe" ], [ 1, "#fec3fe" ] ], "sequentialminus": [ [ 0, "#0508b8" ], [ 0.0893854748603352, "#1910d8" ], [ 0.1787709497206704, "#3c19f0" ], [ 0.2681564245810056, "#6b1cfb" ], [ 0.3575418994413408, "#981cfd" ], [ 0.44692737430167595, "#bf1cfd" ], [ 0.5363128491620112, "#dd2bfd" ], [ 0.6256983240223464, "#f246fe" ], [ 0.7150837988826816, "#fc67fd" ], [ 0.8044692737430168, "#fe88fc" ], [ 0.8938547486033519, "#fea5fd" ], [ 0.9832402234636871, "#febefe" ], [ 1, "#fec3fe" ] ] }, "plot_bgcolor": "white", "paper_bgcolor": "white", "shapedefaults": { "line": { "width": 0 }, "opacity": 0.4, "fillcolor": "#506784" }, "annotationdefaults": { "arrowhead": 0, "arrowcolor": "#506784", "arrowwidth": 1 } }, "themeRef": "PLOTLY_WHITE" } } }, "height": null, "width": null, "user": { "profile_url": "https://chart-studio.plotly.com/~drtagkim", "avatar_url": "https://storage.googleapis.com/plotly-prod-profiles/5.jpg", "background_url": "https://storage.googleapis.com/plotly-prod-profiles/bg-9.jpg", "bio": "", "nickname": "", "website": "", "stream_tokens": null, "feature_set_id": null, "csrf_token": null, "date_joined": "2024-04-15 23:33:31", "mapbox_access_tokens": null, "has_password": null, "username": "drtagkim", "email": null, "is_active": null, "readonly": null, "is_dash_creator": null, "dash_created_count": null, "is_chart_creator": null, "charts_created_count": null } } ] }
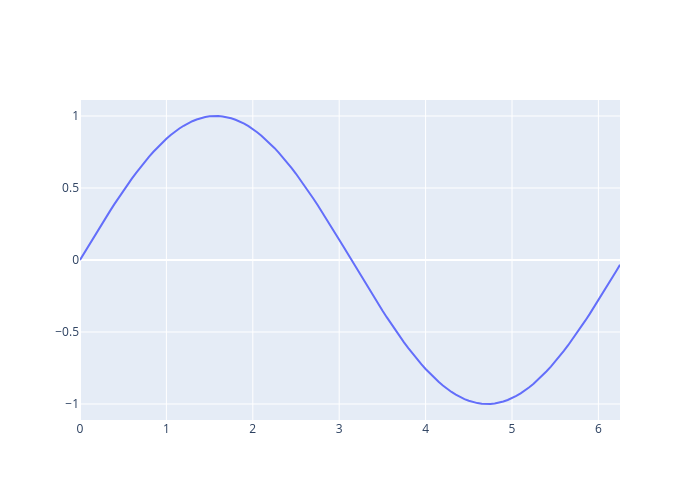