Plots


Jump to API response

This endpoint handles manipulation of Plotly plot files.

Reference

Authorization


Any user with or without a Plotly account may view public plots. For private plots, see authentication.

Actions


list

Listing all public plots can be done via a GET request to this endpoint. By default, plots will be listed in order of date created. The order_by query parameter is accepted at this endpoint. Currently, only ordering by views is supported. It is possible to filter the plots by quality with min_quality or max_quality as query parameter.

Example:

// GET https://api.plotly.com/v2/plots/ ---> 200

// GET https://api.plotly.com/v2/plots/?order_by=-views ---> 200

// GET https://api.plotly.com/v2/plots/?min_quality=5 ---> 200

// GET https://api.plotly.com/v2/plots/?max_quality=5 ---> 200

feed

Listing all handpicked feed plots can be done via a GET request to this endpoint. By default, plots will be listed in a random order.

Example:

// GET https://api.plotly.com/v2/plots/feed ---> 200

create

You can create new plot resources here. The only required field is 'figure'. Currently, the figure is restricted to only contain references to grid data. That is, this will fail if raw data arrays are passed in. To create and manipulate underlying grids for plots, see the grids endpoint.

Example:

// This fails because a figure field is required.
// POST https://api.plotly.com/v2/plots ---> 400 Bad Request
{}

// This fails because the figure has raw data
//POST https://api.plotly.com/v2/plots ---> 400 Bad Request
{
    "figure": {"data": [{"y": ['this', 'is', 'raw', 'data']}]}
}

// This succeeds because the figure has src keys, not raw data.
//POST https://api.plotly.com/v2/plots ---> 200 OK
{
    "figure": {"data": [{"ysrc": "sven:88:u8nd62"}]}
}

When creating a grid, you can optionally specify a source_fid to specify where a plot has come from:

  • source_fid: the fid of a plot that was copied (and presumably edited) to produce this one

detail

There is a lot of meta information stored about plot files including filename, title, share_url, and content_url to name a few.

This information can only be reached with a GET to this endpoint.

Example:

// GET https://api.plotly.com/v2/plots/iheartgraphs:90

content

The contents of a plot can be downloaded via the content resource. The plot content contains referenced grid/column data by default. If you wish to return the raw grid/column data, the inline_data=true query must be included in the request url. The Content-Type header will be appropriately set for the response body.

Alternatively, you can set ?map_data=unreadable to append a mapping of sources to data that belongs to grids which are unreadable for the requestor. This is useful when you have read access to another users plot, but that plot contains grid references which you don't have access to.

Examples:

// Returns referenced grid/column data
// GET https://api.plotly.com/v2/plots/iheartgraphs:90/content ---> 200 OK

// Returns full grid/column data
// GET https://api.plotly.com/v2/plots/iheartgraphs:90/content?inline_data=true ---> 200 OK

// Returns full grid/column data when requestor doesn't have permission
// to read the referenced grid.
// GET https://api.plotly.com/v2/plots/iheartgraphs:90/content?map_data=unreadable ---> 200 OK

GET /v2/plots?cursor=cj0xJnA9MjAyNC0wNC0wNSsxNSUzQTQxJTNBMDUuNDI5MDM3JTJCMDAlM0EwMA%3D%3D&format=api
HTTP 200 OK
Allow: GET, POST, HEAD, OPTIONS
Content-Type: application/json
Vary: Accept

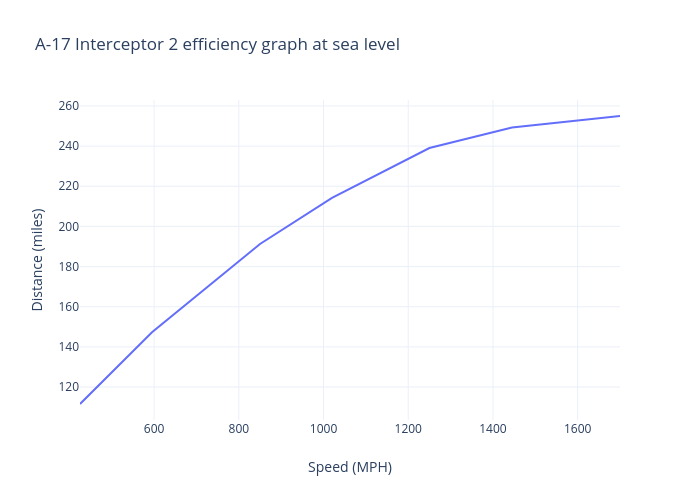
{
    "next": "https://api.plot.ly/v2/plots?cursor=cD0yMDI0LTA0LTA1KzE1JTNBNDMlM0E1NS45NTAyNjElMkIwMCUzQTAw&format=api",
    "previous": "https://api.plot.ly/v2/plots?cursor=cj0xJnA9MjAyNC0wNC0wNSsxNiUzQTMxJTNBMjIuNzY0NTk0JTJCMDAlM0EwMA%3D%3D&format=api",
    "results": [
        {
            "creation_time": "2024-04-05T16:31:22.764594Z",
            "comments": {
                "results": [],
                "count": 0
            },
            "parented": true,
            "embed_url": "https://chart-studio.plotly.com/~emilylaabs/7.embed",
            "fid": "emilylaabs:7",
            "filename": "Plot 5 copy",
            "filetype": "plot",
            "img_url": "https://storage.googleapis.com/plotly-prod-images/emilylaabs/7/9_WFELM3B3RKU1AJPV2G58KKPRG3YLSP.png",
            "image_urls": {
                "default": "https://storage.googleapis.com/plotly-prod-images/emilylaabs/7/2_HFBKBZX63QP6JZFZ6XFIYE8GMM1J70.png",
                "block-thumb": "https://storage.googleapis.com/plotly-prod-images/emilylaabs/7/8_AYD88TPRKMWYA3OGJRHNKC34VT1HDC.png",
                "list-thumb": "https://storage.googleapis.com/plotly-prod-images/emilylaabs/7/9_WFELM3B3RKU1AJPV2G58KKPRG3YLSP.png"
            },
            "api_urls": {
                "files": "https://api.plotly.com/v2/files/emilylaabs:7",
                "plots": "https://api.plotly.com/v2/plots/emilylaabs:7",
                "parent": "https://api.plotly.com/v2/folders/home?user=emilylaabs"
            },
            "owner": "emilylaabs",
            "parent": -1,
            "preview": "",
            "referencers": [],
            "references": [],
            "title": "",
            "views": 3,
            "web_url": "https://chart-studio.plotly.com/~emilylaabs/7/",
            "world_readable": true,
            "date_modified": "2024-04-05T16:31:23.158Z",
            "stars": {
                "results": [],
                "count": 0
            },
            "collaborators": {
                "results": [],
                "count": 0
            },
            "subfolder_count": null,
            "refresh_interval": null,
            "organize_view_url": "https://chart-studio.plotly.com/~emilylaabs/7/",
            "current_user_permission": "read",
            "is_theme": null,
            "is_template": false,
            "autosize": true,
            "caption": "",
            "figure": {
                "data": [
                    {
                        "uid": "9478dd",
                        "meta": {
                            "columnNames": {
                                "x": "Col1",
                                "y": "Col2"
                            }
                        },
                        "mode": "lines",
                        "name": "Col2",
                        "type": "scatter",
                        "xsrc": "emilylaabs:6:41b3ca",
                        "ysrc": "emilylaabs:6:f0c060"
                    }
                ],
                "frames": [],
                "layout": {
                    "title": {
                        "text": "Heating Curve Graph"
                    },
                    "width": 1119,
                    "xaxis": {
                        "type": "linear",
                        "range": [
                            0,
                            30
                        ],
                        "title": {
                            "text": "Time (Minutes)"
                        },
                        "autorange": true
                    },
                    "yaxis": {
                        "type": "linear",
                        "range": [
                            -17.72222222222222,
                            116.72222222222223
                        ],
                        "title": {
                            "text": "Temperature (°C)"
                        },
                        "autorange": true
                    },
                    "height": 547,
                    "autosize": true
                }
            },
            "height": 547,
            "width": 1119,
            "user": {
                "profile_url": "https://chart-studio.plotly.com/~emilylaabs",
                "avatar_url": "https://storage.googleapis.com/plotly-prod-profiles/46.jpg",
                "background_url": "https://storage.googleapis.com/plotly-prod-profiles/bg-2.jpg",
                "bio": "",
                "nickname": "",
                "website": "",
                "stream_tokens": null,
                "feature_set_id": null,
                "csrf_token": null,
                "date_joined": "2024-04-05 15:51:45",
                "mapbox_access_tokens": null,
                "has_password": null,
                "username": "emilylaabs",
                "email": null,
                "is_active": null,
                "readonly": null,
                "is_dash_creator": null,
                "dash_created_count": null,
                "is_chart_creator": null,
                "charts_created_count": null
            }
        },
        {
            "creation_time": "2024-04-05T16:31:04.100358Z",
            "comments": {
                "results": [],
                "count": 0
            },
            "parented": true,
            "embed_url": "https://chart-studio.plotly.com/~emilylaabs/5.embed",
            "fid": "emilylaabs:5",
            "filename": "Plot 5",
            "filetype": "plot",
            "img_url": "https://storage.googleapis.com/plotly-prod-images/emilylaabs/5/9_NU63F2H8S8CQY406EQ5D9TVQN3BREY.png",
            "image_urls": {
                "default": "https://storage.googleapis.com/plotly-prod-images/emilylaabs/5/2_SICWM1GTTO3FG81C8AOVN1QQK9ATG4.png",
                "block-thumb": "https://storage.googleapis.com/plotly-prod-images/emilylaabs/5/8_XV80MGFB1GDYL51UVEKE7V012BD6U3.png",
                "list-thumb": "https://storage.googleapis.com/plotly-prod-images/emilylaabs/5/9_NU63F2H8S8CQY406EQ5D9TVQN3BREY.png"
            },
            "api_urls": {
                "files": "https://api.plotly.com/v2/files/emilylaabs:5",
                "plots": "https://api.plotly.com/v2/plots/emilylaabs:5",
                "parent": "https://api.plotly.com/v2/folders/home?user=emilylaabs"
            },
            "owner": "emilylaabs",
            "parent": -1,
            "preview": "",
            "referencers": [],
            "references": [],
            "title": "",
            "views": 5,
            "web_url": "https://chart-studio.plotly.com/~emilylaabs/5/",
            "world_readable": true,
            "date_modified": "2024-04-05T16:31:04.110Z",
            "stars": {
                "results": [],
                "count": 0
            },
            "collaborators": {
                "results": [],
                "count": 0
            },
            "subfolder_count": null,
            "refresh_interval": null,
            "organize_view_url": "https://chart-studio.plotly.com/~emilylaabs/5/",
            "current_user_permission": "read",
            "is_theme": null,
            "is_template": false,
            "autosize": true,
            "caption": "",
            "figure": {
                "data": [
                    {
                        "uid": "9478dd",
                        "meta": {
                            "columnNames": {
                                "x": "Col1",
                                "y": "Col2"
                            }
                        },
                        "mode": "lines",
                        "name": "Col2",
                        "type": "scatter",
                        "xsrc": "emilylaabs:4:41b3ca",
                        "ysrc": "emilylaabs:4:f0c060"
                    }
                ],
                "frames": [],
                "layout": {
                    "title": {
                        "text": "Heating Curve Graph"
                    },
                    "width": 1119,
                    "xaxis": {
                        "type": "linear",
                        "range": [
                            0,
                            30
                        ],
                        "title": {
                            "text": "Time (Minutes)"
                        },
                        "autorange": true
                    },
                    "yaxis": {
                        "type": "linear",
                        "range": [
                            -17.72222222222222,
                            116.72222222222223
                        ],
                        "title": {
                            "text": "Temperature (°C)"
                        },
                        "autorange": true
                    },
                    "height": 547,
                    "autosize": true
                }
            },
            "height": 547,
            "width": 1119,
            "user": {
                "profile_url": "https://chart-studio.plotly.com/~emilylaabs",
                "avatar_url": "https://storage.googleapis.com/plotly-prod-profiles/46.jpg",
                "background_url": "https://storage.googleapis.com/plotly-prod-profiles/bg-2.jpg",
                "bio": "",
                "nickname": "",
                "website": "",
                "stream_tokens": null,
                "feature_set_id": null,
                "csrf_token": null,
                "date_joined": "2024-04-05 15:51:45",
                "mapbox_access_tokens": null,
                "has_password": null,
                "username": "emilylaabs",
                "email": null,
                "is_active": null,
                "readonly": null,
                "is_dash_creator": null,
                "dash_created_count": null,
                "is_chart_creator": null,
                "charts_created_count": null
            }
        },
        {
            "creation_time": "2024-04-05T16:30:48.893095Z",
            "comments": {
                "results": [],
                "count": 0
            },
            "parented": true,
            "embed_url": "https://chart-studio.plotly.com/~dimabud0424/1.embed",
            "fid": "dimabud0424:1",
            "filename": "Plot 1",
            "filetype": "plot",
            "img_url": "https://storage.googleapis.com/plotly-prod-images/dimabud0424/1/9_2YZMK8T48GCNV1VJK57HNUQ2LYT6RM.png",
            "image_urls": {
                "default": "https://storage.googleapis.com/plotly-prod-images/dimabud0424/1/2_6GASY6NGQJ3CDM9T7M9W5SGA6Y59JZ.png",
                "block-thumb": "https://storage.googleapis.com/plotly-prod-images/dimabud0424/1/8_XTD5PU82KD6LB0L9MZKSEVD95QBTY9.png",
                "list-thumb": "https://storage.googleapis.com/plotly-prod-images/dimabud0424/1/9_2YZMK8T48GCNV1VJK57HNUQ2LYT6RM.png"
            },
            "api_urls": {
                "files": "https://api.plotly.com/v2/files/dimabud0424:1",
                "plots": "https://api.plotly.com/v2/plots/dimabud0424:1",
                "parent": "https://api.plotly.com/v2/folders/home?user=dimabud0424"
            },
            "owner": "dimabud0424",
            "parent": -1,
            "preview": "",
            "referencers": [],
            "references": [],
            "title": "",
            "views": 1,
            "web_url": "https://chart-studio.plotly.com/~dimabud0424/1/",
            "world_readable": true,
            "date_modified": "2024-04-05T16:31:04.633Z",
            "stars": {
                "results": [],
                "count": 0
            },
            "collaborators": {
                "results": [],
                "count": 0
            },
            "subfolder_count": null,
            "refresh_interval": null,
            "organize_view_url": "https://chart-studio.plotly.com/~dimabud0424/1/",
            "current_user_permission": "read",
            "is_theme": null,
            "is_template": false,
            "autosize": true,
            "caption": "",
            "figure": {
                "data": [
                    {
                        "meta": {
                            "columnNames": {
                                "x": "",
                                "y": "Conentración glucosa (promedio)"
                            }
                        },
                        "mode": "markers",
                        "name": "<br>",
                        "type": "box",
                        "ysrc": "dimabud0424:0:fe9055",
                        "boxpoints": false,
                        "orientation": "v"
                    }
                ],
                "frames": [],
                "layout": {
                    "title": {
                        "text": "Variación de\nconcentraciones de glucosa en el tiempo"
                    },
                    "xaxis": {
                        "type": "category",
                        "range": [
                            -0.5,
                            0.5
                        ],
                        "title": {
                            "text": ""
                        },
                        "autorange": true
                    },
                    "yaxis": {
                        "type": "linear",
                        "range": [
                            2.094444444444444,
                            16.205555555555556
                        ],
                        "title": {
                            "text": "Conentración de glucosa "
                        },
                        "autorange": true
                    },
                    "boxmode": "overlay",
                    "autosize": true,
                    "template": {
                        "data": {
                            "bar": [
                                {
                                    "type": "bar",
                                    "marker": {
                                        "colorbar": {
                                            "ticks": "",
                                            "outlinewidth": 0
                                        }
                                    }
                                }
                            ],
                            "table": [
                                {
                                    "type": "table",
                                    "cells": {
                                        "fill": {
                                            "color": "#EBF0F8"
                                        },
                                        "line": {
                                            "color": "white"
                                        }
                                    },
                                    "header": {
                                        "fill": {
                                            "color": "#C8D4E3"
                                        },
                                        "line": {
                                            "color": "white"
                                        }
                                    }
                                }
                            ],
                            "carpet": [
                                {
                                    "type": "carpet",
                                    "aaxis": {
                                        "gridcolor": "#C8D4E3",
                                        "linecolor": "#C8D4E3",
                                        "endlinecolor": "#2a3f5f",
                                        "minorgridcolor": "#C8D4E3",
                                        "startlinecolor": "#2a3f5f"
                                    },
                                    "baxis": {
                                        "gridcolor": "#C8D4E3",
                                        "linecolor": "#C8D4E3",
                                        "endlinecolor": "#2a3f5f",
                                        "minorgridcolor": "#C8D4E3",
                                        "startlinecolor": "#2a3f5f"
                                    }
                                }
                            ],
                            "mesh3d": [
                                {
                                    "type": "mesh3d",
                                    "colorbar": {
                                        "ticks": "",
                                        "outlinewidth": 0
                                    }
                                }
                            ],
                            "contour": [
                                {
                                    "type": "contour",
                                    "colorbar": {
                                        "ticks": "",
                                        "outlinewidth": 0
                                    },
                                    "autocolorscale": true
                                }
                            ],
                            "heatmap": [
                                {
                                    "type": "heatmap",
                                    "colorbar": {
                                        "ticks": "",
                                        "outlinewidth": 0
                                    },
                                    "autocolorscale": true
                                }
                            ],
                            "scatter": [
                                {
                                    "type": "scatter",
                                    "marker": {
                                        "colorbar": {
                                            "ticks": "",
                                            "outlinewidth": 0
                                        }
                                    }
                                }
                            ],
                            "surface": [
                                {
                                    "type": "surface",
                                    "colorbar": {
                                        "ticks": "",
                                        "outlinewidth": 0
                                    }
                                }
                            ],
                            "heatmapgl": [
                                {
                                    "type": "heatmapgl",
                                    "colorbar": {
                                        "ticks": "",
                                        "outlinewidth": 0
                                    }
                                }
                            ],
                            "histogram": [
                                {
                                    "type": "histogram",
                                    "marker": {
                                        "colorbar": {
                                            "ticks": "",
                                            "outlinewidth": 0
                                        }
                                    }
                                }
                            ],
                            "parcoords": [
                                {
                                    "line": {
                                        "colorbar": {
                                            "ticks": "",
                                            "outlinewidth": 0
                                        }
                                    },
                                    "type": "parcoords"
                                }
                            ],
                            "scatter3d": [
                                {
                                    "type": "scatter3d",
                                    "marker": {
                                        "colorbar": {
                                            "ticks": "",
                                            "outlinewidth": 0
                                        }
                                    }
                                }
                            ],
                            "scattergl": [
                                {
                                    "type": "scattergl",
                                    "marker": {
                                        "colorbar": {
                                            "ticks": "",
                                            "outlinewidth": 0
                                        }
                                    }
                                }
                            ],
                            "choropleth": [
                                {
                                    "type": "choropleth",
                                    "colorbar": {
                                        "ticks": "",
                                        "outlinewidth": 0
                                    }
                                }
                            ],
                            "scattergeo": [
                                {
                                    "type": "scattergeo",
                                    "marker": {
                                        "colorbar": {
                                            "ticks": "",
                                            "outlinewidth": 0
                                        }
                                    }
                                }
                            ],
                            "histogram2d": [
                                {
                                    "type": "histogram2d",
                                    "colorbar": {
                                        "ticks": "",
                                        "outlinewidth": 0
                                    },
                                    "autocolorscale": true
                                }
                            ],
                            "scatterpolar": [
                                {
                                    "type": "scatterpolar",
                                    "marker": {
                                        "colorbar": {
                                            "ticks": "",
                                            "outlinewidth": 0
                                        }
                                    }
                                }
                            ],
                            "contourcarpet": [
                                {
                                    "type": "contourcarpet",
                                    "colorbar": {
                                        "ticks": "",
                                        "outlinewidth": 0
                                    }
                                }
                            ],
                            "scattercarpet": [
                                {
                                    "type": "scattercarpet",
                                    "marker": {
                                        "colorbar": {
                                            "ticks": "",
                                            "outlinewidth": 0
                                        }
                                    }
                                }
                            ],
                            "scattermapbox": [
                                {
                                    "type": "scattermapbox",
                                    "marker": {
                                        "colorbar": {
                                            "ticks": "",
                                            "outlinewidth": 0
                                        }
                                    }
                                }
                            ],
                            "scatterpolargl": [
                                {
                                    "type": "scatterpolargl",
                                    "marker": {
                                        "colorbar": {
                                            "ticks": "",
                                            "outlinewidth": 0
                                        }
                                    }
                                }
                            ],
                            "scatterternary": [
                                {
                                    "type": "scatterternary",
                                    "marker": {
                                        "colorbar": {
                                            "ticks": "",
                                            "outlinewidth": 0
                                        }
                                    }
                                }
                            ],
                            "histogram2dcontour": [
                                {
                                    "type": "histogram2dcontour",
                                    "colorbar": {
                                        "ticks": "",
                                        "outlinewidth": 0
                                    },
                                    "autocolorscale": true
                                }
                            ]
                        },
                        "layout": {
                            "geo": {
                                "bgcolor": "white",
                                "showland": true,
                                "lakecolor": "white",
                                "landcolor": "white",
                                "showlakes": true,
                                "subunitcolor": "#C8D4E3"
                            },
                            "font": {
                                "color": "#2a3f5f"
                            },
                            "polar": {
                                "bgcolor": "white",
                                "radialaxis": {
                                    "ticks": "",
                                    "gridcolor": "#EBF0F8",
                                    "linecolor": "#EBF0F8"
                                },
                                "angularaxis": {
                                    "ticks": "",
                                    "gridcolor": "#EBF0F8",
                                    "linecolor": "#EBF0F8"
                                }
                            },
                            "scene": {
                                "xaxis": {
                                    "ticks": "",
                                    "gridcolor": "#DFE8F3",
                                    "gridwidth": 2,
                                    "linecolor": "#EBF0F8",
                                    "zerolinecolor": "#EBF0F8",
                                    "showbackground": true,
                                    "backgroundcolor": "white"
                                },
                                "yaxis": {
                                    "ticks": "",
                                    "gridcolor": "#DFE8F3",
                                    "gridwidth": 2,
                                    "linecolor": "#EBF0F8",
                                    "zerolinecolor": "#EBF0F8",
                                    "showbackground": true,
                                    "backgroundcolor": "white"
                                },
                                "zaxis": {
                                    "ticks": "",
                                    "gridcolor": "#DFE8F3",
                                    "gridwidth": 2,
                                    "linecolor": "#EBF0F8",
                                    "zerolinecolor": "#EBF0F8",
                                    "showbackground": true,
                                    "backgroundcolor": "white"
                                }
                            },
                            "title": {
                                "x": 0.05
                            },
                            "xaxis": {
                                "ticks": "",
                                "gridcolor": "#EBF0F8",
                                "linecolor": "#EBF0F8",
                                "automargin": true,
                                "zerolinecolor": "#EBF0F8",
                                "zerolinewidth": 2
                            },
                            "yaxis": {
                                "ticks": "",
                                "gridcolor": "#EBF0F8",
                                "linecolor": "#EBF0F8",
                                "automargin": true,
                                "zerolinecolor": "#EBF0F8",
                                "zerolinewidth": 2
                            },
                            "ternary": {
                                "aaxis": {
                                    "ticks": "",
                                    "gridcolor": "#DFE8F3",
                                    "linecolor": "#A2B1C6"
                                },
                                "baxis": {
                                    "ticks": "",
                                    "gridcolor": "#DFE8F3",
                                    "linecolor": "#A2B1C6"
                                },
                                "caxis": {
                                    "ticks": "",
                                    "gridcolor": "#DFE8F3",
                                    "linecolor": "#A2B1C6"
                                },
                                "bgcolor": "white"
                            },
                            "colorway": [
                                "#636efa",
                                "#EF553B",
                                "#00cc96",
                                "#ab63fa",
                                "#19d3f3",
                                "#e763fa",
                                "#fecb52",
                                "#ffa15a",
                                "#ff6692",
                                "#b6e880"
                            ],
                            "hovermode": "closest",
                            "colorscale": {
                                "diverging": [
                                    [
                                        0,
                                        "#8e0152"
                                    ],
                                    [
                                        0.1,
                                        "#c51b7d"
                                    ],
                                    [
                                        0.2,
                                        "#de77ae"
                                    ],
                                    [
                                        0.3,
                                        "#f1b6da"
                                    ],
                                    [
                                        0.4,
                                        "#fde0ef"
                                    ],
                                    [
                                        0.5,
                                        "#f7f7f7"
                                    ],
                                    [
                                        0.6,
                                        "#e6f5d0"
                                    ],
                                    [
                                        0.7,
                                        "#b8e186"
                                    ],
                                    [
                                        0.8,
                                        "#7fbc41"
                                    ],
                                    [
                                        0.9,
                                        "#4d9221"
                                    ],
                                    [
                                        1,
                                        "#276419"
                                    ]
                                ],
                                "sequential": [
                                    [
                                        0,
                                        "#0508b8"
                                    ],
                                    [
                                        0.0893854748603352,
                                        "#1910d8"
                                    ],
                                    [
                                        0.1787709497206704,
                                        "#3c19f0"
                                    ],
                                    [
                                        0.2681564245810056,
                                        "#6b1cfb"
                                    ],
                                    [
                                        0.3575418994413408,
                                        "#981cfd"
                                    ],
                                    [
                                        0.44692737430167595,
                                        "#bf1cfd"
                                    ],
                                    [
                                        0.5363128491620112,
                                        "#dd2bfd"
                                    ],
                                    [
                                        0.6256983240223464,
                                        "#f246fe"
                                    ],
                                    [
                                        0.7150837988826816,
                                        "#fc67fd"
                                    ],
                                    [
                                        0.8044692737430168,
                                        "#fe88fc"
                                    ],
                                    [
                                        0.8938547486033519,
                                        "#fea5fd"
                                    ],
                                    [
                                        0.9832402234636871,
                                        "#febefe"
                                    ],
                                    [
                                        1,
                                        "#fec3fe"
                                    ]
                                ],
                                "sequentialminus": [
                                    [
                                        0,
                                        "#0508b8"
                                    ],
                                    [
                                        0.0893854748603352,
                                        "#1910d8"
                                    ],
                                    [
                                        0.1787709497206704,
                                        "#3c19f0"
                                    ],
                                    [
                                        0.2681564245810056,
                                        "#6b1cfb"
                                    ],
                                    [
                                        0.3575418994413408,
                                        "#981cfd"
                                    ],
                                    [
                                        0.44692737430167595,
                                        "#bf1cfd"
                                    ],
                                    [
                                        0.5363128491620112,
                                        "#dd2bfd"
                                    ],
                                    [
                                        0.6256983240223464,
                                        "#f246fe"
                                    ],
                                    [
                                        0.7150837988826816,
                                        "#fc67fd"
                                    ],
                                    [
                                        0.8044692737430168,
                                        "#fe88fc"
                                    ],
                                    [
                                        0.8938547486033519,
                                        "#fea5fd"
                                    ],
                                    [
                                        0.9832402234636871,
                                        "#febefe"
                                    ],
                                    [
                                        1,
                                        "#fec3fe"
                                    ]
                                ]
                            },
                            "plot_bgcolor": "white",
                            "paper_bgcolor": "white",
                            "shapedefaults": {
                                "line": {
                                    "width": 0
                                },
                                "opacity": 0.4,
                                "fillcolor": "#506784"
                            },
                            "annotationdefaults": {
                                "arrowhead": 0,
                                "arrowcolor": "#506784",
                                "arrowwidth": 1
                            }
                        },
                        "themeRef": "PLOTLY_WHITE"
                    }
                }
            },
            "height": null,
            "width": null,
            "user": {
                "profile_url": "https://chart-studio.plotly.com/~dimabud0424",
                "avatar_url": "https://storage.googleapis.com/plotly-prod-profiles/94.jpg",
                "background_url": "https://storage.googleapis.com/plotly-prod-profiles/bg-4.jpg",
                "bio": "",
                "nickname": "",
                "website": "",
                "stream_tokens": null,
                "feature_set_id": null,
                "csrf_token": null,
                "date_joined": "2024-04-05 16:30:16",
                "mapbox_access_tokens": null,
                "has_password": null,
                "username": "dimabud0424",
                "email": null,
                "is_active": null,
                "readonly": null,
                "is_dash_creator": null,
                "dash_created_count": null,
                "is_chart_creator": null,
                "charts_created_count": null
            }
        },
        {
            "creation_time": "2024-04-05T16:08:58.511507Z",
            "comments": {
                "results": [],
                "count": 0
            },
            "parented": true,
            "embed_url": "https://chart-studio.plotly.com/~AlejandroBrena/47.embed",
            "fid": "AlejandroBrena:47",
            "filename": "Proy Sondeo 110524",
            "filetype": "plot",
            "img_url": "https://storage.googleapis.com/plotly-prod-images/AlejandroBrena/47/9_BEY9JBKHFUF544Q7A1FFGI18ZHB274.png",
            "image_urls": {
                "default": "https://storage.googleapis.com/plotly-prod-images/AlejandroBrena/47/2_18U68Z77EXPB14CLEHBZ5QCH5UP0IL.png",
                "block-thumb": "https://storage.googleapis.com/plotly-prod-images/AlejandroBrena/47/8_EF7I3HH03ZKUB0XRQ1D5G0BUDV655Q.png",
                "list-thumb": "https://storage.googleapis.com/plotly-prod-images/AlejandroBrena/47/9_BEY9JBKHFUF544Q7A1FFGI18ZHB274.png"
            },
            "api_urls": {
                "files": "https://api.plotly.com/v2/files/AlejandroBrena:47",
                "plots": "https://api.plotly.com/v2/plots/AlejandroBrena:47",
                "parent": "https://api.plotly.com/v2/folders/home?user=AlejandroBrena"
            },
            "owner": "AlejandroBrena",
            "parent": -1,
            "preview": "",
            "referencers": [],
            "references": [],
            "title": "",
            "views": 16,
            "web_url": "https://chart-studio.plotly.com/~AlejandroBrena/47/",
            "world_readable": true,
            "date_modified": "2024-05-14T21:37:30.997Z",
            "stars": {
                "results": [],
                "count": 0
            },
            "collaborators": {
                "results": [],
                "count": 0
            },
            "subfolder_count": null,
            "refresh_interval": null,
            "organize_view_url": "https://chart-studio.plotly.com/~AlejandroBrena/47/",
            "current_user_permission": "read",
            "is_theme": null,
            "is_template": false,
            "autosize": true,
            "caption": "",
            "figure": {
                "data": [
                    {
                        "line": {
                            "color": "rgb(204, 0, 0)",
                            "width": 5
                        },
                        "meta": {
                            "columnNames": {
                                "x": "_FECHA_",
                                "y": "ZAFRA",
                                "text": "ZAFRA"
                            }
                        },
                        "mode": "lines",
                        "name": "ZAFRA<br>",
                        "type": "scatter",
                        "xsrc": "AlejandroBrena:46:9d58a7",
                        "ysrc": "AlejandroBrena:46:6f2095",
                        "yaxis": "y2",
                        "opacity": 1,
                        "textsrc": "AlejandroBrena:46:6f2095",
                        "hoverinfo": "name",
                        "hoverlabel": {
                            "namelength": 15
                        },
                        "showlegend": false,
                        "legendgroup": 1
                    },
                    {
                        "line": {
                            "color": "rgb(204, 0, 0)",
                            "width": 5
                        },
                        "meta": {
                            "columnNames": {
                                "x": "_FECHA_",
                                "y": "HURACANES"
                            }
                        },
                        "mode": "lines",
                        "name": "HURACANES",
                        "type": "scatter",
                        "xsrc": "AlejandroBrena:46:9d58a7",
                        "ysrc": "AlejandroBrena:46:3ba11a",
                        "yaxis": "y2",
                        "opacity": 1,
                        "hoverinfo": "name",
                        "showlegend": false,
                        "stackgroup": null
                    },
                    {
                        "line": {
                            "color": "rgb(60, 134, 205)",
                            "width": 3
                        },
                        "meta": {
                            "columnNames": {
                                "x": "_FECHA_",
                                "y": "LLUVIA"
                            }
                        },
                        "mode": "lines",
                        "name": "Lluvia",
                        "type": "scatter",
                        "xsrc": "AlejandroBrena:46:9d58a7",
                        "ysrc": "AlejandroBrena:46:895a1f",
                        "yaxis": "y4",
                        "hoverinfo": "name",
                        "showlegend": true,
                        "stackgroup": null,
                        "legendgroup": ""
                    },
                    {
                        "line": {
                            "color": "rgb(204, 0, 0)",
                            "width": 5
                        },
                        "meta": {
                            "columnNames": {
                                "x": "_FECHA_",
                                "y": "INUNDACIONES"
                            }
                        },
                        "mode": "lines",
                        "name": "ZONA<br>BAJA DE<br>\nINUNDACIONES",
                        "type": "scatter",
                        "xsrc": "AlejandroBrena:46:9d58a7",
                        "ysrc": "AlejandroBrena:46:cb6f70",
                        "yaxis": "y2",
                        "opacity": 1,
                        "hoverinfo": "name",
                        "showlegend": false,
                        "stackgroup": null
                    },
                    {
                        "line": {
                            "color": "rgb(238, 150, 70)",
                            "width": 5
                        },
                        "meta": {
                            "columnNames": {
                                "x": "_FECHA_",
                                "y": "PIÑA"
                            }
                        },
                        "mode": "lines",
                        "name": "PIÑA",
                        "type": "scatter",
                        "xsrc": "AlejandroBrena:46:9d58a7",
                        "ysrc": "AlejandroBrena:46:66bdfc",
                        "yaxis": "y2",
                        "hoverinfo": "name",
                        "showlegend": false,
                        "stackgroup": null
                    },
                    {
                        "line": {
                            "color": "rgb(240, 218, 13)",
                            "width": 5
                        },
                        "meta": {
                            "columnNames": {
                                "x": "_FECHA_",
                                "y": "VIENTO"
                            }
                        },
                        "mode": "lines",
                        "name": "VIENTO",
                        "type": "scatter",
                        "xsrc": "AlejandroBrena:46:9d58a7",
                        "ysrc": "AlejandroBrena:46:95e24b",
                        "yaxis": "y2",
                        "hoverinfo": "name",
                        "showlegend": false,
                        "stackgroup": null
                    },
                    {
                        "line": {
                            "color": "rgb(240, 218, 13)",
                            "width": 2
                        },
                        "meta": {
                            "columnNames": {
                                "x": "_FECHA_",
                                "y": "CALOR"
                            }
                        },
                        "mode": "lines",
                        "name": "Calor",
                        "type": "scatter",
                        "xsrc": "AlejandroBrena:46:9d58a7",
                        "ysrc": "AlejandroBrena:46:319e6e",
                        "yaxis": "y3",
                        "hoverinfo": "name",
                        "showlegend": true,
                        "stackgroup": null,
                        "legendgroup": ""
                    },
                    {
                        "line": {
                            "color": "rgb(50, 80, 204)",
                            "width": 6
                        },
                        "meta": {
                            "columnNames": {
                                "x": "_FECHA_",
                                "y": "Acumulado Proy"
                            }
                        },
                        "mode": "lines",
                        "name": "Proyección",
                        "type": "scatter",
                        "xsrc": "AlejandroBrena:46:9d58a7",
                        "ysrc": "AlejandroBrena:46:769427",
                        "legendgroup": 1,
                        "orientation": "v"
                    },
                    {
                        "meta": {
                            "columnNames": {
                                "x": "_FECHA_",
                                "y": "Punto Azul"
                            }
                        },
                        "mode": "markers",
                        "name": "Punto Azul",
                        "type": "scatter",
                        "xsrc": "AlejandroBrena:46:9d58a7",
                        "ysrc": "AlejandroBrena:46:a5dc6e",
                        "marker": {
                            "size": 20,
                            "color": "rgb(50, 80, 204)"
                        },
                        "hoverinfo": "none",
                        "showlegend": false
                    },
                    {
                        "line": {
                            "color": "rgb(50, 209, 17)",
                            "width": 6
                        },
                        "meta": {
                            "columnNames": {
                                "x": "_FECHA_",
                                "y": "Acumulado SE"
                            }
                        },
                        "mode": "lines",
                        "name": "Avance<br>Real",
                        "type": "scatter",
                        "xsrc": "AlejandroBrena:46:9d58a7",
                        "ysrc": "AlejandroBrena:46:428ea7"
                    },
                    {
                        "meta": {
                            "columnNames": {
                                "x": "_FECHA_",
                                "y": "Punto Verde"
                            }
                        },
                        "mode": "markers",
                        "name": "Punto Verde",
                        "type": "scatter",
                        "xsrc": "AlejandroBrena:46:9d58a7",
                        "ysrc": "AlejandroBrena:46:8b3000",
                        "marker": {
                            "size": 20,
                            "color": "rgb(50, 209, 17)",
                            "opacity": 0.75
                        },
                        "hoverinfo": "x+y",
                        "showlegend": false
                    }
                ],
                "frames": [],
                "layout": {
                    "title": {
                        "x": 0.5,
                        "font": {
                            "size": 30
                        },
                        "text": "Avance de Sondeo en el Bloque 3."
                    },
                    "xaxis": {
                        "side": "bottom",
                        "type": "category",
                        "dtick": 2,
                        "range": [
                            0,
                            48
                        ],
                        "ticks": "outside",
                        "title": {
                            "font": {
                                "size": 22
                            },
                            "text": "FECHA"
                        },
                        "anchor": "free",
                        "domain": [
                            0,
                            1
                        ],
                        "showgrid": false,
                        "tickfont": {
                            "size": 20
                        },
                        "tickmode": "linear",
                        "autorange": false,
                        "tickangle": 45,
                        "showspikes": false,
                        "showticklabels": true
                    },
                    "yaxis": {
                        "type": "linear",
                        "range": [
                            0,
                            14500
                        ],
                        "title": {
                            "font": {
                                "size": 22
                            },
                            "text": "Pozos"
                        },
                        "anchor": "x",
                        "domain": [
                            0,
                            0.69
                        ],
                        "tickfont": {
                            "size": 20
                        },
                        "autorange": false,
                        "showspikes": false,
                        "exponentformat": "none"
                    },
                    "bargap": 0.8,
                    "legend": {
                        "x": 1.0047189796118547,
                        "y": 0.7318729989073021,
                        "font": {
                            "size": 20
                        },
                        "valign": "top",
                        "yanchor": "auto",
                        "borderwidth": 0
                    },
                    "margin": {
                        "b": 80,
                        "l": 100,
                        "r": 80,
                        "t": 100,
                        "pad": 0
                    },
                    "yaxis2": {
                        "side": "left",
                        "type": "linear",
                        "range": [
                            2.9,
                            4.8
                        ],
                        "ticks": "",
                        "title": {
                            "font": {
                                "size": 20
                            },
                            "text": "RUTA<br>CRÍTICA"
                        },
                        "anchor": "x",
                        "domain": [
                            0.7,
                            0.875
                        ],
                        "showgrid": false,
                        "zeroline": false,
                        "autorange": false,
                        "overlaying": false,
                        "showspikes": true,
                        "showticklabels": false
                    },
                    "yaxis3": {
                        "side": "right",
                        "type": "linear",
                        "range": [
                            20,
                            45
                        ],
                        "title": {
                            "font": {
                                "size": 17
                            },
                            "text": "Temperatura<br>(°C)"
                        },
                        "domain": [
                            0.75,
                            1
                        ],
                        "showgrid": false,
                        "tickfont": {
                            "size": 14
                        },
                        "autorange": false,
                        "overlaying": "y4"
                    },
                    "yaxis4": {
                        "side": "left",
                        "type": "linear",
                        "range": [
                            0,
                            115
                        ],
                        "title": {
                            "font": {
                                "size": 17
                            },
                            "text": "Precipitación<br>(mm)"
                        },
                        "domain": [
                            0.875,
                            1
                        ],
                        "tickfont": {
                            "size": 14
                        },
                        "autorange": false,
                        "overlaying": false
                    },
                    "autosize": true,
                    "dragmode": "zoom",
                    "template": {
                        "data": {
                            "bar": [
                                {
                                    "type": "bar",
                                    "marker": {
                                        "colorbar": {
                                            "ticks": "",
                                            "outlinewidth": 0
                                        }
                                    }
                                }
                            ],
                            "table": [
                                {
                                    "type": "table",
                                    "cells": {
                                        "fill": {
                                            "color": "#506784"
                                        },
                                        "line": {
                                            "color": "rgb(17,17,17)"
                                        }
                                    },
                                    "header": {
                                        "fill": {
                                            "color": "#2a3f5f"
                                        },
                                        "line": {
                                            "color": "rgb(17,17,17)"
                                        }
                                    }
                                }
                            ],
                            "carpet": [
                                {
                                    "type": "carpet",
                                    "aaxis": {
                                        "gridcolor": "#506784",
                                        "linecolor": "#506784",
                                        "endlinecolor": "#A2B1C6",
                                        "minorgridcolor": "#506784",
                                        "startlinecolor": "#A2B1C6"
                                    },
                                    "baxis": {
                                        "gridcolor": "#506784",
                                        "linecolor": "#506784",
                                        "endlinecolor": "#A2B1C6",
                                        "minorgridcolor": "#506784",
                                        "startlinecolor": "#A2B1C6"
                                    }
                                }
                            ],
                            "mesh3d": [
                                {
                                    "type": "mesh3d",
                                    "colorbar": {
                                        "ticks": "",
                                        "outlinewidth": 0
                                    }
                                }
                            ],
                            "contour": [
                                {
                                    "type": "contour",
                                    "colorbar": {
                                        "ticks": "",
                                        "outlinewidth": 0
                                    },
                                    "autocolorscale": true
                                }
                            ],
                            "heatmap": [
                                {
                                    "type": "heatmap",
                                    "colorbar": {
                                        "ticks": "",
                                        "outlinewidth": 0
                                    },
                                    "autocolorscale": true
                                }
                            ],
                            "scatter": [
                                {
                                    "type": "scatter",
                                    "marker": {
                                        "colorbar": {
                                            "ticks": "",
                                            "outlinewidth": 0
                                        }
                                    }
                                }
                            ],
                            "surface": [
                                {
                                    "type": "surface",
                                    "colorbar": {
                                        "ticks": "",
                                        "outlinewidth": 0
                                    }
                                }
                            ],
                            "heatmapgl": [
                                {
                                    "type": "heatmapgl",
                                    "colorbar": {
                                        "ticks": "",
                                        "outlinewidth": 0
                                    }
                                }
                            ],
                            "histogram": [
                                {
                                    "type": "histogram",
                                    "marker": {
                                        "colorbar": {
                                            "ticks": "",
                                            "outlinewidth": 0
                                        }
                                    }
                                }
                            ],
                            "parcoords": [
                                {
                                    "line": {
                                        "colorbar": {
                                            "ticks": "",
                                            "outlinewidth": 0
                                        }
                                    },
                                    "type": "parcoords"
                                }
                            ],
                            "scatter3d": [
                                {
                                    "type": "scatter3d",
                                    "marker": {
                                        "colorbar": {
                                            "ticks": "",
                                            "outlinewidth": 0
                                        }
                                    }
                                }
                            ],
                            "scattergl": [
                                {
                                    "type": "scattergl",
                                    "marker": {
                                        "colorbar": {
                                            "ticks": "",
                                            "outlinewidth": 0
                                        }
                                    }
                                }
                            ],
                            "choropleth": [
                                {
                                    "type": "choropleth",
                                    "colorbar": {
                                        "ticks": "",
                                        "outlinewidth": 0
                                    }
                                }
                            ],
                            "scattergeo": [
                                {
                                    "type": "scattergeo",
                                    "marker": {
                                        "colorbar": {
                                            "ticks": "",
                                            "outlinewidth": 0
                                        }
                                    }
                                }
                            ],
                            "histogram2d": [
                                {
                                    "type": "histogram2d",
                                    "colorbar": {
                                        "ticks": "",
                                        "outlinewidth": 0
                                    },
                                    "autocolorscale": true
                                }
                            ],
                            "scatterpolar": [
                                {
                                    "type": "scatterpolar",
                                    "marker": {
                                        "colorbar": {
                                            "ticks": "",
                                            "outlinewidth": 0
                                        }
                                    }
                                }
                            ],
                            "contourcarpet": [
                                {
                                    "type": "contourcarpet",
                                    "colorbar": {
                                        "ticks": "",
                                        "outlinewidth": 0
                                    }
                                }
                            ],
                            "scattercarpet": [
                                {
                                    "type": "scattercarpet",
                                    "marker": {
                                        "colorbar": {
                                            "ticks": "",
                                            "outlinewidth": 0
                                        }
                                    }
                                }
                            ],
                            "scattermapbox": [
                                {
                                    "type": "scattermapbox",
                                    "marker": {
                                        "colorbar": {
                                            "ticks": "",
                                            "outlinewidth": 0
                                        }
                                    }
                                }
                            ],
                            "scatterpolargl": [
                                {
                                    "type": "scatterpolargl",
                                    "marker": {
                                        "colorbar": {
                                            "ticks": "",
                                            "outlinewidth": 0
                                        }
                                    }
                                }
                            ],
                            "scatterternary": [
                                {
                                    "type": "scatterternary",
                                    "marker": {
                                        "colorbar": {
                                            "ticks": "",
                                            "outlinewidth": 0
                                        }
                                    }
                                }
                            ],
                            "histogram2dcontour": [
                                {
                                    "type": "histogram2dcontour",
                                    "colorbar": {
                                        "ticks": "",
                                        "outlinewidth": 0
                                    },
                                    "autocolorscale": true
                                }
                            ]
                        },
                        "layout": {
                            "geo": {
                                "bgcolor": "rgb(17,17,17)",
                                "showland": true,
                                "lakecolor": "rgb(17,17,17)",
                                "landcolor": "rgb(17,17,17)",
                                "showlakes": true,
                                "subunitcolor": "#506784"
                            },
                            "font": {
                                "color": "#f2f5fa"
                            },
                            "polar": {
                                "bgcolor": "rgb(17,17,17)",
                                "radialaxis": {
                                    "ticks": "",
                                    "gridcolor": "#506784",
                                    "linecolor": "#506784"
                                },
                                "angularaxis": {
                                    "ticks": "",
                                    "gridcolor": "#506784",
                                    "linecolor": "#506784"
                                }
                            },
                            "scene": {
                                "xaxis": {
                                    "ticks": "",
                                    "gridcolor": "#506784",
                                    "gridwidth": 2,
                                    "linecolor": "#506784",
                                    "zerolinecolor": "#C8D4E3",
                                    "showbackground": true,
                                    "backgroundcolor": "rgb(17,17,17)"
                                },
                                "yaxis": {
                                    "ticks": "",
                                    "gridcolor": "#506784",
                                    "gridwidth": 2,
                                    "linecolor": "#506784",
                                    "zerolinecolor": "#C8D4E3",
                                    "showbackground": true,
                                    "backgroundcolor": "rgb(17,17,17)"
                                },
                                "zaxis": {
                                    "ticks": "",
                                    "gridcolor": "#506784",
                                    "gridwidth": 2,
                                    "linecolor": "#506784",
                                    "zerolinecolor": "#C8D4E3",
                                    "showbackground": true,
                                    "backgroundcolor": "rgb(17,17,17)"
                                }
                            },
                            "title": {
                                "x": 0.05
                            },
                            "xaxis": {
                                "ticks": "",
                                "gridcolor": "#283442",
                                "linecolor": "#506784",
                                "automargin": true,
                                "zerolinecolor": "#283442",
                                "zerolinewidth": 2
                            },
                            "yaxis": {
                                "ticks": "",
                                "gridcolor": "#283442",
                                "linecolor": "#506784",
                                "automargin": true,
                                "zerolinecolor": "#283442",
                                "zerolinewidth": 2
                            },
                            "ternary": {
                                "aaxis": {
                                    "ticks": "",
                                    "gridcolor": "#506784",
                                    "linecolor": "#506784"
                                },
                                "baxis": {
                                    "ticks": "",
                                    "gridcolor": "#506784",
                                    "linecolor": "#506784"
                                },
                                "caxis": {
                                    "ticks": "",
                                    "gridcolor": "#506784",
                                    "linecolor": "#506784"
                                },
                                "bgcolor": "rgb(17,17,17)"
                            },
                            "colorway": [
                                "#636efa",
                                "#EF553B",
                                "#00cc96",
                                "#ab63fa",
                                "#19d3f3",
                                "#e763fa",
                                "#fecb52",
                                "#ffa15a",
                                "#ff6692",
                                "#b6e880"
                            ],
                            "hovermode": "closest",
                            "colorscale": {
                                "diverging": [
                                    [
                                        0,
                                        "#8e0152"
                                    ],
                                    [
                                        0.1,
                                        "#c51b7d"
                                    ],
                                    [
                                        0.2,
                                        "#de77ae"
                                    ],
                                    [
                                        0.3,
                                        "#f1b6da"
                                    ],
                                    [
                                        0.4,
                                        "#fde0ef"
                                    ],
                                    [
                                        0.5,
                                        "#f7f7f7"
                                    ],
                                    [
                                        0.6,
                                        "#e6f5d0"
                                    ],
                                    [
                                        0.7,
                                        "#b8e186"
                                    ],
                                    [
                                        0.8,
                                        "#7fbc41"
                                    ],
                                    [
                                        0.9,
                                        "#4d9221"
                                    ],
                                    [
                                        1,
                                        "#276419"
                                    ]
                                ],
                                "sequential": [
                                    [
                                        0,
                                        "#0508b8"
                                    ],
                                    [
                                        0.0893854748603352,
                                        "#1910d8"
                                    ],
                                    [
                                        0.1787709497206704,
                                        "#3c19f0"
                                    ],
                                    [
                                        0.2681564245810056,
                                        "#6b1cfb"
                                    ],
                                    [
                                        0.3575418994413408,
                                        "#981cfd"
                                    ],
                                    [
                                        0.44692737430167595,
                                        "#bf1cfd"
                                    ],
                                    [
                                        0.5363128491620112,
                                        "#dd2bfd"
                                    ],
                                    [
                                        0.6256983240223464,
                                        "#f246fe"
                                    ],
                                    [
                                        0.7150837988826816,
                                        "#fc67fd"
                                    ],
                                    [
                                        0.8044692737430168,
                                        "#fe88fc"
                                    ],
                                    [
                                        0.8938547486033519,
                                        "#fea5fd"
                                    ],
                                    [
                                        0.9832402234636871,
                                        "#febefe"
                                    ],
                                    [
                                        1,
                                        "#fec3fe"
                                    ]
                                ],
                                "sequentialminus": [
                                    [
                                        0,
                                        "#0508b8"
                                    ],
                                    [
                                        0.0893854748603352,
                                        "#1910d8"
                                    ],
                                    [
                                        0.1787709497206704,
                                        "#3c19f0"
                                    ],
                                    [
                                        0.2681564245810056,
                                        "#6b1cfb"
                                    ],
                                    [
                                        0.3575418994413408,
                                        "#981cfd"
                                    ],
                                    [
                                        0.44692737430167595,
                                        "#bf1cfd"
                                    ],
                                    [
                                        0.5363128491620112,
                                        "#dd2bfd"
                                    ],
                                    [
                                        0.6256983240223464,
                                        "#f246fe"
                                    ],
                                    [
                                        0.7150837988826816,
                                        "#fc67fd"
                                    ],
                                    [
                                        0.8044692737430168,
                                        "#fe88fc"
                                    ],
                                    [
                                        0.8938547486033519,
                                        "#fea5fd"
                                    ],
                                    [
                                        0.9832402234636871,
                                        "#febefe"
                                    ],
                                    [
                                        1,
                                        "#fec3fe"
                                    ]
                                ]
                            },
                            "plot_bgcolor": "rgb(17,17,17)",
                            "paper_bgcolor": "rgb(17,17,17)",
                            "shapedefaults": {
                                "line": {
                                    "width": 0
                                },
                                "opacity": 0.4,
                                "fillcolor": "#f2f5fa"
                            },
                            "sliderdefaults": {
                                "bgcolor": "#C8D4E3",
                                "tickwidth": 0,
                                "bordercolor": "rgb(17,17,17)",
                                "borderwidth": 1
                            },
                            "annotationdefaults": {
                                "arrowhead": 0,
                                "arrowcolor": "#f2f5fa",
                                "arrowwidth": 1
                            },
                            "updatemenudefaults": {
                                "bgcolor": "#506784",
                                "borderwidth": 0
                            }
                        },
                        "themeRef": "PLOTLY_DARK"
                    },
                    "hovermode": "closest",
                    "hoverlabel": {
                        "font": {
                            "size": 20
                        }
                    },
                    "annotations": [
                        {
                            "x": 23.29157360406091,
                            "y": 4.390361445783132,
                            "font": {
                                "size": 20
                            },
                            "text": "ZAFRA",
                            "yref": "y2",
                            "showarrow": false
                        },
                        {
                            "x": 27.268934010152282,
                            "y": 3.7506024096385544,
                            "font": {
                                "size": 20
                            },
                            "text": "PIÑA",
                            "yref": "y2",
                            "showarrow": false
                        },
                        {
                            "x": 27.41342482100238,
                            "y": 3.2233899656589338,
                            "font": {
                                "size": 20
                            },
                            "text": "VIENTO",
                            "yref": "y2",
                            "showarrow": false
                        }
                    ]
                }
            },
            "height": null,
            "width": null,
            "user": {
                "profile_url": "https://chart-studio.plotly.com/~AlejandroBrena",
                "avatar_url": "https://storage.googleapis.com/plotly-prod-profiles/6.jpg",
                "background_url": "https://storage.googleapis.com/plotly-prod-profiles/bg-5.jpg",
                "bio": "",
                "nickname": "Estadístico Jr.",
                "website": "",
                "stream_tokens": null,
                "feature_set_id": null,
                "csrf_token": null,
                "date_joined": "2024-02-29 22:44:57",
                "mapbox_access_tokens": null,
                "has_password": null,
                "username": "AlejandroBrena",
                "email": null,
                "is_active": null,
                "readonly": null,
                "is_dash_creator": null,
                "dash_created_count": null,
                "is_chart_creator": null,
                "charts_created_count": null
            }
        },
        {
            "creation_time": "2024-04-05T16:05:16.740399Z",
            "comments": {
                "results": [],
                "count": 0
            },
            "parented": true,
            "embed_url": "https://chart-studio.plotly.com/~saraashojaeii/8.embed",
            "fid": "saraashojaeii:8",
            "filename": "stock_prediction_rnn",
            "filetype": "plot",
            "img_url": "https://storage.googleapis.com/plotly-prod-images/saraashojaeii/8/9_AW5LUPOD0K5FBDJTBMSFJRK71Q8EC4.png",
            "image_urls": {
                "default": "https://storage.googleapis.com/plotly-prod-images/saraashojaeii/8/2_71ADM2FC6J2151AU3ASOC4ZS8P2KRR.png",
                "block-thumb": "https://storage.googleapis.com/plotly-prod-images/saraashojaeii/8/8_MUKON227YFI0XVQQJR5JAMX868O5QN.png",
                "list-thumb": "https://storage.googleapis.com/plotly-prod-images/saraashojaeii/8/9_AW5LUPOD0K5FBDJTBMSFJRK71Q8EC4.png"
            },
            "api_urls": {
                "files": "https://api.plotly.com/v2/files/saraashojaeii:8",
                "plots": "https://api.plotly.com/v2/plots/saraashojaeii:8",
                "parent": "https://api.plotly.com/v2/folders/home?user=saraashojaeii"
            },
            "owner": "saraashojaeii",
            "parent": -1,
            "preview": "",
            "referencers": [],
            "references": [],
            "title": "",
            "views": 7,
            "web_url": "https://chart-studio.plotly.com/~saraashojaeii/8/",
            "world_readable": true,
            "date_modified": "2024-04-05T16:05:16.749Z",
            "stars": {
                "results": [],
                "count": 0
            },
            "collaborators": {
                "results": [],
                "count": 0
            },
            "subfolder_count": null,
            "refresh_interval": null,
            "organize_view_url": "https://chart-studio.plotly.com/~saraashojaeii/8/",
            "current_user_permission": "read",
            "is_theme": null,
            "is_template": null,
            "autosize": true,
            "caption": "",
            "figure": {
                "data": [
                    {
                        "line": {
                            "color": "blue"
                        },
                        "mode": "lines",
                        "name": "Train prediction",
                        "type": "scatter",
                        "xsrc": "saraashojaeii:7:95ad04",
                        "ysrc": "saraashojaeii:7:d2020a"
                    },
                    {
                        "line": {
                            "color": "magenta"
                        },
                        "mode": "lines",
                        "name": "Test prediction",
                        "type": "scatter",
                        "xsrc": "saraashojaeii:7:ca0851",
                        "ysrc": "saraashojaeii:7:e9bdce"
                    },
                    {
                        "line": {
                            "color": "#7bb8b3"
                        },
                        "mode": "lines",
                        "name": "Actual Value",
                        "type": "scatter",
                        "xsrc": "saraashojaeii:7:b68e6d",
                        "ysrc": "saraashojaeii:7:afc77e"
                    }
                ],
                "layout": {
                    "xaxis": {
                        "showgrid": true,
                        "showline": true,
                        "linecolor": "black",
                        "linewidth": 2,
                        "showticklabels": false
                    },
                    "yaxis": {
                        "range": [
                            9,
                            70
                        ],
                        "ticks": "outside",
                        "title": {
                            "font": {
                                "size": 20,
                                "color": "black",
                                "family": "Rockwell"
                            },
                            "text": "Close (USD)"
                        },
                        "showgrid": true,
                        "showline": true,
                        "tickfont": {
                            "size": 12,
                            "color": "black",
                            "family": "Rockwell"
                        },
                        "linecolor": "black",
                        "linewidth": 2,
                        "showticklabels": true
                    },
                    "template": {
                        "data": {
                            "bar": [
                                {
                                    "type": "bar",
                                    "marker": {
                                        "line": {
                                            "color": "white",
                                            "width": 0.5
                                        },
                                        "pattern": {
                                            "size": 10,
                                            "fillmode": "overlay",
                                            "solidity": 0.2
                                        }
                                    },
                                    "error_x": {
                                        "color": "#2a3f5f"
                                    },
                                    "error_y": {
                                        "color": "#2a3f5f"
                                    }
                                }
                            ],
                            "pie": [
                                {
                                    "type": "pie",
                                    "automargin": true
                                }
                            ],
                            "table": [
                                {
                                    "type": "table",
                                    "cells": {
                                        "fill": {
                                            "color": "#EBF0F8"
                                        },
                                        "line": {
                                            "color": "white"
                                        }
                                    },
                                    "header": {
                                        "fill": {
                                            "color": "#C8D4E3"
                                        },
                                        "line": {
                                            "color": "white"
                                        }
                                    }
                                }
                            ],
                            "carpet": [
                                {
                                    "type": "carpet",
                                    "aaxis": {
                                        "gridcolor": "#C8D4E3",
                                        "linecolor": "#C8D4E3",
                                        "endlinecolor": "#2a3f5f",
                                        "minorgridcolor": "#C8D4E3",
                                        "startlinecolor": "#2a3f5f"
                                    },
                                    "baxis": {
                                        "gridcolor": "#C8D4E3",
                                        "linecolor": "#C8D4E3",
                                        "endlinecolor": "#2a3f5f",
                                        "minorgridcolor": "#C8D4E3",
                                        "startlinecolor": "#2a3f5f"
                                    }
                                }
                            ],
                            "mesh3d": [
                                {
                                    "type": "mesh3d",
                                    "colorbar": {
                                        "ticks": "",
                                        "outlinewidth": 0
                                    }
                                }
                            ],
                            "contour": [
                                {
                                    "type": "contour",
                                    "colorbar": {
                                        "ticks": "",
                                        "outlinewidth": 0
                                    },
                                    "colorscale": [
                                        [
                                            0.0,
                                            "#0d0887"
                                        ],
                                        [
                                            0.1111111111111111,
                                            "#46039f"
                                        ],
                                        [
                                            0.2222222222222222,
                                            "#7201a8"
                                        ],
                                        [
                                            0.3333333333333333,
                                            "#9c179e"
                                        ],
                                        [
                                            0.4444444444444444,
                                            "#bd3786"
                                        ],
                                        [
                                            0.5555555555555556,
                                            "#d8576b"
                                        ],
                                        [
                                            0.6666666666666666,
                                            "#ed7953"
                                        ],
                                        [
                                            0.7777777777777778,
                                            "#fb9f3a"
                                        ],
                                        [
                                            0.8888888888888888,
                                            "#fdca26"
                                        ],
                                        [
                                            1.0,
                                            "#f0f921"
                                        ]
                                    ]
                                }
                            ],
                            "heatmap": [
                                {
                                    "type": "heatmap",
                                    "colorbar": {
                                        "ticks": "",
                                        "outlinewidth": 0
                                    },
                                    "colorscale": [
                                        [
                                            0.0,
                                            "#0d0887"
                                        ],
                                        [
                                            0.1111111111111111,
                                            "#46039f"
                                        ],
                                        [
                                            0.2222222222222222,
                                            "#7201a8"
                                        ],
                                        [
                                            0.3333333333333333,
                                            "#9c179e"
                                        ],
                                        [
                                            0.4444444444444444,
                                            "#bd3786"
                                        ],
                                        [
                                            0.5555555555555556,
                                            "#d8576b"
                                        ],
                                        [
                                            0.6666666666666666,
                                            "#ed7953"
                                        ],
                                        [
                                            0.7777777777777778,
                                            "#fb9f3a"
                                        ],
                                        [
                                            0.8888888888888888,
                                            "#fdca26"
                                        ],
                                        [
                                            1.0,
                                            "#f0f921"
                                        ]
                                    ]
                                }
                            ],
                            "scatter": [
                                {
                                    "type": "scatter",
                                    "fillpattern": {
                                        "size": 10,
                                        "fillmode": "overlay",
                                        "solidity": 0.2
                                    }
                                }
                            ],
                            "surface": [
                                {
                                    "type": "surface",
                                    "colorbar": {
                                        "ticks": "",
                                        "outlinewidth": 0
                                    },
                                    "colorscale": [
                                        [
                                            0.0,
                                            "#0d0887"
                                        ],
                                        [
                                            0.1111111111111111,
                                            "#46039f"
                                        ],
                                        [
                                            0.2222222222222222,
                                            "#7201a8"
                                        ],
                                        [
                                            0.3333333333333333,
                                            "#9c179e"
                                        ],
                                        [
                                            0.4444444444444444,
                                            "#bd3786"
                                        ],
                                        [
                                            0.5555555555555556,
                                            "#d8576b"
                                        ],
                                        [
                                            0.6666666666666666,
                                            "#ed7953"
                                        ],
                                        [
                                            0.7777777777777778,
                                            "#fb9f3a"
                                        ],
                                        [
                                            0.8888888888888888,
                                            "#fdca26"
                                        ],
                                        [
                                            1.0,
                                            "#f0f921"
                                        ]
                                    ]
                                }
                            ],
                            "barpolar": [
                                {
                                    "type": "barpolar",
                                    "marker": {
                                        "line": {
                                            "color": "white",
                                            "width": 0.5
                                        },
                                        "pattern": {
                                            "size": 10,
                                            "fillmode": "overlay",
                                            "solidity": 0.2
                                        }
                                    }
                                }
                            ],
                            "heatmapgl": [
                                {
                                    "type": "heatmapgl",
                                    "colorbar": {
                                        "ticks": "",
                                        "outlinewidth": 0
                                    },
                                    "colorscale": [
                                        [
                                            0.0,
                                            "#0d0887"
                                        ],
                                        [
                                            0.1111111111111111,
                                            "#46039f"
                                        ],
                                        [
                                            0.2222222222222222,
                                            "#7201a8"
                                        ],
                                        [
                                            0.3333333333333333,
                                            "#9c179e"
                                        ],
                                        [
                                            0.4444444444444444,
                                            "#bd3786"
                                        ],
                                        [
                                            0.5555555555555556,
                                            "#d8576b"
                                        ],
                                        [
                                            0.6666666666666666,
                                            "#ed7953"
                                        ],
                                        [
                                            0.7777777777777778,
                                            "#fb9f3a"
                                        ],
                                        [
                                            0.8888888888888888,
                                            "#fdca26"
                                        ],
                                        [
                                            1.0,
                                            "#f0f921"
                                        ]
                                    ]
                                }
                            ],
                            "histogram": [
                                {
                                    "type": "histogram",
                                    "marker": {
                                        "pattern": {
                                            "size": 10,
                                            "fillmode": "overlay",
                                            "solidity": 0.2
                                        }
                                    }
                                }
                            ],
                            "parcoords": [
                                {
                                    "line": {
                                        "colorbar": {
                                            "ticks": "",
                                            "outlinewidth": 0
                                        }
                                    },
                                    "type": "parcoords"
                                }
                            ],
                            "scatter3d": [
                                {
                                    "line": {
                                        "colorbar": {
                                            "ticks": "",
                                            "outlinewidth": 0
                                        }
                                    },
                                    "type": "scatter3d",
                                    "marker": {
                                        "colorbar": {
                                            "ticks": "",
                                            "outlinewidth": 0
                                        }
                                    }
                                }
                            ],
                            "scattergl": [
                                {
                                    "type": "scattergl",
                                    "marker": {
                                        "colorbar": {
                                            "ticks": "",
                                            "outlinewidth": 0
                                        }
                                    }
                                }
                            ],
                            "choropleth": [
                                {
                                    "type": "choropleth",
                                    "colorbar": {
                                        "ticks": "",
                                        "outlinewidth": 0
                                    }
                                }
                            ],
                            "scattergeo": [
                                {
                                    "type": "scattergeo",
                                    "marker": {
                                        "colorbar": {
                                            "ticks": "",
                                            "outlinewidth": 0
                                        }
                                    }
                                }
                            ],
                            "histogram2d": [
                                {
                                    "type": "histogram2d",
                                    "colorbar": {
                                        "ticks": "",
                                        "outlinewidth": 0
                                    },
                                    "colorscale": [
                                        [
                                            0.0,
                                            "#0d0887"
                                        ],
                                        [
                                            0.1111111111111111,
                                            "#46039f"
                                        ],
                                        [
                                            0.2222222222222222,
                                            "#7201a8"
                                        ],
                                        [
                                            0.3333333333333333,
                                            "#9c179e"
                                        ],
                                        [
                                            0.4444444444444444,
                                            "#bd3786"
                                        ],
                                        [
                                            0.5555555555555556,
                                            "#d8576b"
                                        ],
                                        [
                                            0.6666666666666666,
                                            "#ed7953"
                                        ],
                                        [
                                            0.7777777777777778,
                                            "#fb9f3a"
                                        ],
                                        [
                                            0.8888888888888888,
                                            "#fdca26"
                                        ],
                                        [
                                            1.0,
                                            "#f0f921"
                                        ]
                                    ]
                                }
                            ],
                            "scatterpolar": [
                                {
                                    "type": "scatterpolar",
                                    "marker": {
                                        "colorbar": {
                                            "ticks": "",
                                            "outlinewidth": 0
                                        }
                                    }
                                }
                            ],
                            "contourcarpet": [
                                {
                                    "type": "contourcarpet",
                                    "colorbar": {
                                        "ticks": "",
                                        "outlinewidth": 0
                                    }
                                }
                            ],
                            "scattercarpet": [
                                {
                                    "type": "scattercarpet",
                                    "marker": {
                                        "colorbar": {
                                            "ticks": "",
                                            "outlinewidth": 0
                                        }
                                    }
                                }
                            ],
                            "scattermapbox": [
                                {
                                    "type": "scattermapbox",
                                    "marker": {
                                        "colorbar": {
                                            "ticks": "",
                                            "outlinewidth": 0
                                        }
                                    }
                                }
                            ],
                            "scatterpolargl": [
                                {
                                    "type": "scatterpolargl",
                                    "marker": {
                                        "colorbar": {
                                            "ticks": "",
                                            "outlinewidth": 0
                                        }
                                    }
                                }
                            ],
                            "scatterternary": [
                                {
                                    "type": "scatterternary",
                                    "marker": {
                                        "colorbar": {
                                            "ticks": "",
                                            "outlinewidth": 0
                                        }
                                    }
                                }
                            ],
                            "histogram2dcontour": [
                                {
                                    "type": "histogram2dcontour",
                                    "colorbar": {
                                        "ticks": "",
                                        "outlinewidth": 0
                                    },
                                    "colorscale": [
                                        [
                                            0.0,
                                            "#0d0887"
                                        ],
                                        [
                                            0.1111111111111111,
                                            "#46039f"
                                        ],
                                        [
                                            0.2222222222222222,
                                            "#7201a8"
                                        ],
                                        [
                                            0.3333333333333333,
                                            "#9c179e"
                                        ],
                                        [
                                            0.4444444444444444,
                                            "#bd3786"
                                        ],
                                        [
                                            0.5555555555555556,
                                            "#d8576b"
                                        ],
                                        [
                                            0.6666666666666666,
                                            "#ed7953"
                                        ],
                                        [
                                            0.7777777777777778,
                                            "#fb9f3a"
                                        ],
                                        [
                                            0.8888888888888888,
                                            "#fdca26"
                                        ],
                                        [
                                            1.0,
                                            "#f0f921"
                                        ]
                                    ]
                                }
                            ]
                        },
                        "layout": {
                            "geo": {
                                "bgcolor": "white",
                                "showland": true,
                                "lakecolor": "white",
                                "landcolor": "white",
                                "showlakes": true,
                                "subunitcolor": "#C8D4E3"
                            },
                            "font": {
                                "color": "#2a3f5f"
                            },
                            "polar": {
                                "bgcolor": "white",
                                "radialaxis": {
                                    "ticks": "",
                                    "gridcolor": "#EBF0F8",
                                    "linecolor": "#EBF0F8"
                                },
                                "angularaxis": {
                                    "ticks": "",
                                    "gridcolor": "#EBF0F8",
                                    "linecolor": "#EBF0F8"
                                }
                            },
                            "scene": {
                                "xaxis": {
                                    "ticks": "",
                                    "gridcolor": "#DFE8F3",
                                    "gridwidth": 2,
                                    "linecolor": "#EBF0F8",
                                    "zerolinecolor": "#EBF0F8",
                                    "showbackground": true,
                                    "backgroundcolor": "white"
                                },
                                "yaxis": {
                                    "ticks": "",
                                    "gridcolor": "#DFE8F3",
                                    "gridwidth": 2,
                                    "linecolor": "#EBF0F8",
                                    "zerolinecolor": "#EBF0F8",
                                    "showbackground": true,
                                    "backgroundcolor": "white"
                                },
                                "zaxis": {
                                    "ticks": "",
                                    "gridcolor": "#DFE8F3",
                                    "gridwidth": 2,
                                    "linecolor": "#EBF0F8",
                                    "zerolinecolor": "#EBF0F8",
                                    "showbackground": true,
                                    "backgroundcolor": "white"
                                }
                            },
                            "title": {
                                "x": 0.05
                            },
                            "xaxis": {
                                "ticks": "",
                                "title": {
                                    "standoff": 15
                                },
                                "gridcolor": "#EBF0F8",
                                "linecolor": "#EBF0F8",
                                "automargin": true,
                                "zerolinecolor": "#EBF0F8",
                                "zerolinewidth": 2
                            },
                            "yaxis": {
                                "ticks": "",
                                "title": {
                                    "standoff": 15
                                },
                                "gridcolor": "#EBF0F8",
                                "linecolor": "#EBF0F8",
                                "automargin": true,
                                "zerolinecolor": "#EBF0F8",
                                "zerolinewidth": 2
                            },
                            "mapbox": {
                                "style": "light"
                            },
                            "ternary": {
                                "aaxis": {
                                    "ticks": "",
                                    "gridcolor": "#DFE8F3",
                                    "linecolor": "#A2B1C6"
                                },
                                "baxis": {
                                    "ticks": "",
                                    "gridcolor": "#DFE8F3",
                                    "linecolor": "#A2B1C6"
                                },
                                "caxis": {
                                    "ticks": "",
                                    "gridcolor": "#DFE8F3",
                                    "linecolor": "#A2B1C6"
                                },
                                "bgcolor": "white"
                            },
                            "colorway": [
                                "#636efa",
                                "#EF553B",
                                "#00cc96",
                                "#ab63fa",
                                "#FFA15A",
                                "#19d3f3",
                                "#FF6692",
                                "#B6E880",
                                "#FF97FF",
                                "#FECB52"
                            ],
                            "coloraxis": {
                                "colorbar": {
                                    "ticks": "",
                                    "outlinewidth": 0
                                }
                            },
                            "hovermode": "closest",
                            "colorscale": {
                                "diverging": [
                                    [
                                        0,
                                        "#8e0152"
                                    ],
                                    [
                                        0.1,
                                        "#c51b7d"
                                    ],
                                    [
                                        0.2,
                                        "#de77ae"
                                    ],
                                    [
                                        0.3,
                                        "#f1b6da"
                                    ],
                                    [
                                        0.4,
                                        "#fde0ef"
                                    ],
                                    [
                                        0.5,
                                        "#f7f7f7"
                                    ],
                                    [
                                        0.6,
                                        "#e6f5d0"
                                    ],
                                    [
                                        0.7,
                                        "#b8e186"
                                    ],
                                    [
                                        0.8,
                                        "#7fbc41"
                                    ],
                                    [
                                        0.9,
                                        "#4d9221"
                                    ],
                                    [
                                        1,
                                        "#276419"
                                    ]
                                ],
                                "sequential": [
                                    [
                                        0.0,
                                        "#0d0887"
                                    ],
                                    [
                                        0.1111111111111111,
                                        "#46039f"
                                    ],
                                    [
                                        0.2222222222222222,
                                        "#7201a8"
                                    ],
                                    [
                                        0.3333333333333333,
                                        "#9c179e"
                                    ],
                                    [
                                        0.4444444444444444,
                                        "#bd3786"
                                    ],
                                    [
                                        0.5555555555555556,
                                        "#d8576b"
                                    ],
                                    [
                                        0.6666666666666666,
                                        "#ed7953"
                                    ],
                                    [
                                        0.7777777777777778,
                                        "#fb9f3a"
                                    ],
                                    [
                                        0.8888888888888888,
                                        "#fdca26"
                                    ],
                                    [
                                        1.0,
                                        "#f0f921"
                                    ]
                                ],
                                "sequentialminus": [
                                    [
                                        0.0,
                                        "#0d0887"
                                    ],
                                    [
                                        0.1111111111111111,
                                        "#46039f"
                                    ],
                                    [
                                        0.2222222222222222,
                                        "#7201a8"
                                    ],
                                    [
                                        0.3333333333333333,
                                        "#9c179e"
                                    ],
                                    [
                                        0.4444444444444444,
                                        "#bd3786"
                                    ],
                                    [
                                        0.5555555555555556,
                                        "#d8576b"
                                    ],
                                    [
                                        0.6666666666666666,
                                        "#ed7953"
                                    ],
                                    [
                                        0.7777777777777778,
                                        "#fb9f3a"
                                    ],
                                    [
                                        0.8888888888888888,
                                        "#fdca26"
                                    ],
                                    [
                                        1.0,
                                        "#f0f921"
                                    ]
                                ]
                            },
                            "hoverlabel": {
                                "align": "left"
                            },
                            "plot_bgcolor": "white",
                            "paper_bgcolor": "white",
                            "shapedefaults": {
                                "line": {
                                    "color": "#2a3f5f"
                                }
                            },
                            "autotypenumbers": "strict",
                            "annotationdefaults": {
                                "arrowhead": 0,
                                "arrowcolor": "#2a3f5f",
                                "arrowwidth": 1
                            }
                        }
                    },
                    "showlegend": true,
                    "annotations": [
                        {
                            "x": 0.0,
                            "y": 1.05,
                            "font": {
                                "size": 26,
                                "color": "black",
                                "family": "Rockwell"
                            },
                            "text": "Results (RNN)",
                            "xref": "paper",
                            "yref": "paper",
                            "xanchor": "left",
                            "yanchor": "bottom",
                            "showarrow": false
                        }
                    ]
                }
            },
            "height": null,
            "width": null,
            "user": {
                "profile_url": "https://chart-studio.plotly.com/~saraashojaeii",
                "avatar_url": "https://storage.googleapis.com/plotly-prod-profiles/81.jpg",
                "background_url": "https://storage.googleapis.com/plotly-prod-profiles/bg-10.jpg",
                "bio": "",
                "nickname": "",
                "website": "",
                "stream_tokens": null,
                "feature_set_id": null,
                "csrf_token": null,
                "date_joined": "2024-04-02 01:44:27",
                "mapbox_access_tokens": null,
                "has_password": null,
                "username": "saraashojaeii",
                "email": null,
                "is_active": null,
                "readonly": null,
                "is_dash_creator": null,
                "dash_created_count": null,
                "is_chart_creator": null,
                "charts_created_count": null
            }
        },
        {
            "creation_time": "2024-04-05T15:56:45.384715Z",
            "comments": {
                "results": [],
                "count": 0
            },
            "parented": true,
            "embed_url": "https://chart-studio.plotly.com/~sg25950/8.embed",
            "fid": "sg25950:8",
            "filename": "osmosis lab",
            "filetype": "plot",
            "img_url": "https://storage.googleapis.com/plotly-prod-images/sg25950/8/9_3Z03KDSAOV7KPU2HLWUKC9A6M4UOFJ.png",
            "image_urls": {
                "default": "https://storage.googleapis.com/plotly-prod-images/sg25950/8/2_SZ9V50FDIOR4ATMCISO934OY7NWK0J.png",
                "block-thumb": "https://storage.googleapis.com/plotly-prod-images/sg25950/8/8_XK603A0L7AFE0IR713J4CB8F5UZW9R.png",
                "list-thumb": "https://storage.googleapis.com/plotly-prod-images/sg25950/8/9_3Z03KDSAOV7KPU2HLWUKC9A6M4UOFJ.png"
            },
            "api_urls": {
                "files": "https://api.plotly.com/v2/files/sg25950:8",
                "plots": "https://api.plotly.com/v2/plots/sg25950:8",
                "parent": "https://api.plotly.com/v2/folders/home?user=sg25950"
            },
            "owner": "sg25950",
            "parent": -1,
            "preview": "",
            "referencers": [],
            "references": [],
            "title": "",
            "views": 1,
            "web_url": "https://chart-studio.plotly.com/~sg25950/8/",
            "world_readable": true,
            "date_modified": "2024-04-05T16:00:06.635Z",
            "stars": {
                "results": [],
                "count": 0
            },
            "collaborators": {
                "results": [],
                "count": 0
            },
            "subfolder_count": null,
            "refresh_interval": null,
            "organize_view_url": "https://chart-studio.plotly.com/~sg25950/8/",
            "current_user_permission": "read",
            "is_theme": null,
            "is_template": false,
            "autosize": true,
            "caption": "",
            "figure": {
                "data": [
                    {
                        "uid": "b6763a",
                        "meta": {
                            "columnNames": {
                                "x": "A",
                                "y": "B"
                            }
                        },
                        "mode": "markers",
                        "type": "scatter",
                        "xsrc": "sg25950:7:574dc3",
                        "ysrc": "sg25950:7:e90654"
                    },
                    {
                        "uid": "db926f",
                        "transforms": [
                            {
                                "rms": "",
                                "type": "fit",
                                "inputUid": "b6763a",
                                "regressor": "x",
                                "parameters": [
                                    {
                                        "hold": false,
                                        "name": "m",
                                        "error": 3.8808504222656772,
                                        "value": -29.700000000000177
                                    },
                                    {
                                        "hold": false,
                                        "name": "b",
                                        "error": 0.7260406324717402,
                                        "value": 5.955000000000027
                                    }
                                ],
                                "regressand": "y",
                                "correlation": "",
                                "fitfunction": "m*x + b",
                                "inputxrange": [],
                                "outputxrange": [],
                                "interpolation": 50
                            }
                        ]
                    }
                ],
                "frames": [],
                "layout": {
                    "title": {
                        "text": ""
                    },
                    "xaxis": {
                        "range": [
                            -0.018521816562778272,
                            0.3185218165627783
                        ],
                        "title": {
                            "text": "Percent change between before and after submersion "
                        },
                        "autorange": true
                    },
                    "yaxis": {
                        "type": "linear",
                        "range": [
                            -4.214344850609249,
                            6.490228676347884
                        ],
                        "title": {
                            "text": "The percent of Sodium (NaCl) concentrate in the solution"
                        },
                        "autorange": true
                    },
                    "autosize": true,
                    "template": {
                        "data": {
                            "bar": [
                                {
                                    "type": "bar",
                                    "marker": {
                                        "colorbar": {
                                            "ticks": "",
                                            "outlinewidth": 0
                                        }
                                    }
                                }
                            ],
                            "table": [
                                {
                                    "type": "table",
                                    "cells": {
                                        "fill": {
                                            "color": "#EBF0F8"
                                        },
                                        "line": {
                                            "color": "white"
                                        }
                                    },
                                    "header": {
                                        "fill": {
                                            "color": "#C8D4E3"
                                        },
                                        "line": {
                                            "color": "white"
                                        }
                                    }
                                }
                            ],
                            "carpet": [
                                {
                                    "type": "carpet",
                                    "aaxis": {
                                        "gridcolor": "#C8D4E3",
                                        "linecolor": "#C8D4E3",
                                        "endlinecolor": "#2a3f5f",
                                        "minorgridcolor": "#C8D4E3",
                                        "startlinecolor": "#2a3f5f"
                                    },
                                    "baxis": {
                                        "gridcolor": "#C8D4E3",
                                        "linecolor": "#C8D4E3",
                                        "endlinecolor": "#2a3f5f",
                                        "minorgridcolor": "#C8D4E3",
                                        "startlinecolor": "#2a3f5f"
                                    }
                                }
                            ],
                            "mesh3d": [
                                {
                                    "type": "mesh3d",
                                    "colorbar": {
                                        "ticks": "",
                                        "outlinewidth": 0
                                    }
                                }
                            ],
                            "contour": [
                                {
                                    "type": "contour",
                                    "colorbar": {
                                        "ticks": "",
                                        "outlinewidth": 0
                                    },
                                    "autocolorscale": true
                                }
                            ],
                            "heatmap": [
                                {
                                    "type": "heatmap",
                                    "colorbar": {
                                        "ticks": "",
                                        "outlinewidth": 0
                                    },
                                    "autocolorscale": true
                                }
                            ],
                            "scatter": [
                                {
                                    "type": "scatter",
                                    "marker": {
                                        "colorbar": {
                                            "ticks": "",
                                            "outlinewidth": 0
                                        }
                                    }
                                }
                            ],
                            "surface": [
                                {
                                    "type": "surface",
                                    "colorbar": {
                                        "ticks": "",
                                        "outlinewidth": 0
                                    }
                                }
                            ],
                            "heatmapgl": [
                                {
                                    "type": "heatmapgl",
                                    "colorbar": {
                                        "ticks": "",
                                        "outlinewidth": 0
                                    }
                                }
                            ],
                            "histogram": [
                                {
                                    "type": "histogram",
                                    "marker": {
                                        "colorbar": {
                                            "ticks": "",
                                            "outlinewidth": 0
                                        }
                                    }
                                }
                            ],
                            "parcoords": [
                                {
                                    "line": {
                                        "colorbar": {
                                            "ticks": "",
                                            "outlinewidth": 0
                                        }
                                    },
                                    "type": "parcoords"
                                }
                            ],
                            "scatter3d": [
                                {
                                    "type": "scatter3d",
                                    "marker": {
                                        "colorbar": {
                                            "ticks": "",
                                            "outlinewidth": 0
                                        }
                                    }
                                }
                            ],
                            "scattergl": [
                                {
                                    "type": "scattergl",
                                    "marker": {
                                        "colorbar": {
                                            "ticks": "",
                                            "outlinewidth": 0
                                        }
                                    }
                                }
                            ],
                            "choropleth": [
                                {
                                    "type": "choropleth",
                                    "colorbar": {
                                        "ticks": "",
                                        "outlinewidth": 0
                                    }
                                }
                            ],
                            "scattergeo": [
                                {
                                    "type": "scattergeo",
                                    "marker": {
                                        "colorbar": {
                                            "ticks": "",
                                            "outlinewidth": 0
                                        }
                                    }
                                }
                            ],
                            "histogram2d": [
                                {
                                    "type": "histogram2d",
                                    "colorbar": {
                                        "ticks": "",
                                        "outlinewidth": 0
                                    },
                                    "autocolorscale": true
                                }
                            ],
                            "scatterpolar": [
                                {
                                    "type": "scatterpolar",
                                    "marker": {
                                        "colorbar": {
                                            "ticks": "",
                                            "outlinewidth": 0
                                        }
                                    }
                                }
                            ],
                            "contourcarpet": [
                                {
                                    "type": "contourcarpet",
                                    "colorbar": {
                                        "ticks": "",
                                        "outlinewidth": 0
                                    }
                                }
                            ],
                            "scattercarpet": [
                                {
                                    "type": "scattercarpet",
                                    "marker": {
                                        "colorbar": {
                                            "ticks": "",
                                            "outlinewidth": 0
                                        }
                                    }
                                }
                            ],
                            "scattermapbox": [
                                {
                                    "type": "scattermapbox",
                                    "marker": {
                                        "colorbar": {
                                            "ticks": "",
                                            "outlinewidth": 0
                                        }
                                    }
                                }
                            ],
                            "scatterpolargl": [
                                {
                                    "type": "scatterpolargl",
                                    "marker": {
                                        "colorbar": {
                                            "ticks": "",
                                            "outlinewidth": 0
                                        }
                                    }
                                }
                            ],
                            "scatterternary": [
                                {
                                    "type": "scatterternary",
                                    "marker": {
                                        "colorbar": {
                                            "ticks": "",
                                            "outlinewidth": 0
                                        }
                                    }
                                }
                            ],
                            "histogram2dcontour": [
                                {
                                    "type": "histogram2dcontour",
                                    "colorbar": {
                                        "ticks": "",
                                        "outlinewidth": 0
                                    },
                                    "autocolorscale": true
                                }
                            ]
                        },
                        "layout": {
                            "geo": {
                                "bgcolor": "white",
                                "showland": true,
                                "lakecolor": "white",
                                "landcolor": "white",
                                "showlakes": true,
                                "subunitcolor": "#C8D4E3"
                            },
                            "font": {
                                "color": "#2a3f5f"
                            },
                            "polar": {
                                "bgcolor": "white",
                                "radialaxis": {
                                    "ticks": "",
                                    "gridcolor": "#EBF0F8",
                                    "linecolor": "#EBF0F8"
                                },
                                "angularaxis": {
                                    "ticks": "",
                                    "gridcolor": "#EBF0F8",
                                    "linecolor": "#EBF0F8"
                                }
                            },
                            "scene": {
                                "xaxis": {
                                    "ticks": "",
                                    "gridcolor": "#DFE8F3",
                                    "gridwidth": 2,
                                    "linecolor": "#EBF0F8",
                                    "zerolinecolor": "#EBF0F8",
                                    "showbackground": true,
                                    "backgroundcolor": "white"
                                },
                                "yaxis": {
                                    "ticks": "",
                                    "gridcolor": "#DFE8F3",
                                    "gridwidth": 2,
                                    "linecolor": "#EBF0F8",
                                    "zerolinecolor": "#EBF0F8",
                                    "showbackground": true,
                                    "backgroundcolor": "white"
                                },
                                "zaxis": {
                                    "ticks": "",
                                    "gridcolor": "#DFE8F3",
                                    "gridwidth": 2,
                                    "linecolor": "#EBF0F8",
                                    "zerolinecolor": "#EBF0F8",
                                    "showbackground": true,
                                    "backgroundcolor": "white"
                                }
                            },
                            "title": {
                                "x": 0.05
                            },
                            "xaxis": {
                                "ticks": "",
                                "gridcolor": "#EBF0F8",
                                "linecolor": "#EBF0F8",
                                "automargin": true,
                                "zerolinecolor": "#EBF0F8",
                                "zerolinewidth": 2
                            },
                            "yaxis": {
                                "ticks": "",
                                "gridcolor": "#EBF0F8",
                                "linecolor": "#EBF0F8",
                                "automargin": true,
                                "zerolinecolor": "#EBF0F8",
                                "zerolinewidth": 2
                            },
                            "ternary": {
                                "aaxis": {
                                    "ticks": "",
                                    "gridcolor": "#DFE8F3",
                                    "linecolor": "#A2B1C6"
                                },
                                "baxis": {
                                    "ticks": "",
                                    "gridcolor": "#DFE8F3",
                                    "linecolor": "#A2B1C6"
                                },
                                "caxis": {
                                    "ticks": "",
                                    "gridcolor": "#DFE8F3",
                                    "linecolor": "#A2B1C6"
                                },
                                "bgcolor": "white"
                            },
                            "colorway": [
                                "#636efa",
                                "#EF553B",
                                "#00cc96",
                                "#ab63fa",
                                "#19d3f3",
                                "#e763fa",
                                "#fecb52",
                                "#ffa15a",
                                "#ff6692",
                                "#b6e880"
                            ],
                            "hovermode": "closest",
                            "colorscale": {
                                "diverging": [
                                    [
                                        0,
                                        "#8e0152"
                                    ],
                                    [
                                        0.1,
                                        "#c51b7d"
                                    ],
                                    [
                                        0.2,
                                        "#de77ae"
                                    ],
                                    [
                                        0.3,
                                        "#f1b6da"
                                    ],
                                    [
                                        0.4,
                                        "#fde0ef"
                                    ],
                                    [
                                        0.5,
                                        "#f7f7f7"
                                    ],
                                    [
                                        0.6,
                                        "#e6f5d0"
                                    ],
                                    [
                                        0.7,
                                        "#b8e186"
                                    ],
                                    [
                                        0.8,
                                        "#7fbc41"
                                    ],
                                    [
                                        0.9,
                                        "#4d9221"
                                    ],
                                    [
                                        1,
                                        "#276419"
                                    ]
                                ],
                                "sequential": [
                                    [
                                        0,
                                        "#0508b8"
                                    ],
                                    [
                                        0.0893854748603352,
                                        "#1910d8"
                                    ],
                                    [
                                        0.1787709497206704,
                                        "#3c19f0"
                                    ],
                                    [
                                        0.2681564245810056,
                                        "#6b1cfb"
                                    ],
                                    [
                                        0.3575418994413408,
                                        "#981cfd"
                                    ],
                                    [
                                        0.44692737430167595,
                                        "#bf1cfd"
                                    ],
                                    [
                                        0.5363128491620112,
                                        "#dd2bfd"
                                    ],
                                    [
                                        0.6256983240223464,
                                        "#f246fe"
                                    ],
                                    [
                                        0.7150837988826816,
                                        "#fc67fd"
                                    ],
                                    [
                                        0.8044692737430168,
                                        "#fe88fc"
                                    ],
                                    [
                                        0.8938547486033519,
                                        "#fea5fd"
                                    ],
                                    [
                                        0.9832402234636871,
                                        "#febefe"
                                    ],
                                    [
                                        1,
                                        "#fec3fe"
                                    ]
                                ],
                                "sequentialminus": [
                                    [
                                        0,
                                        "#0508b8"
                                    ],
                                    [
                                        0.0893854748603352,
                                        "#1910d8"
                                    ],
                                    [
                                        0.1787709497206704,
                                        "#3c19f0"
                                    ],
                                    [
                                        0.2681564245810056,
                                        "#6b1cfb"
                                    ],
                                    [
                                        0.3575418994413408,
                                        "#981cfd"
                                    ],
                                    [
                                        0.44692737430167595,
                                        "#bf1cfd"
                                    ],
                                    [
                                        0.5363128491620112,
                                        "#dd2bfd"
                                    ],
                                    [
                                        0.6256983240223464,
                                        "#f246fe"
                                    ],
                                    [
                                        0.7150837988826816,
                                        "#fc67fd"
                                    ],
                                    [
                                        0.8044692737430168,
                                        "#fe88fc"
                                    ],
                                    [
                                        0.8938547486033519,
                                        "#fea5fd"
                                    ],
                                    [
                                        0.9832402234636871,
                                        "#febefe"
                                    ],
                                    [
                                        1,
                                        "#fec3fe"
                                    ]
                                ]
                            },
                            "plot_bgcolor": "white",
                            "paper_bgcolor": "white",
                            "shapedefaults": {
                                "line": {
                                    "width": 0
                                },
                                "opacity": 0.4,
                                "fillcolor": "#506784"
                            },
                            "annotationdefaults": {
                                "arrowhead": 0,
                                "arrowcolor": "#506784",
                                "arrowwidth": 1
                            }
                        },
                        "themeRef": "PLOTLY_WHITE"
                    }
                }
            },
            "height": null,
            "width": null,
            "user": {
                "profile_url": "https://chart-studio.plotly.com/~sg25950",
                "avatar_url": "https://storage.googleapis.com/plotly-prod-profiles/91.jpg",
                "background_url": "https://storage.googleapis.com/plotly-prod-profiles/bg-4.jpg",
                "bio": "",
                "nickname": "",
                "website": "",
                "stream_tokens": null,
                "feature_set_id": null,
                "csrf_token": null,
                "date_joined": "2023-09-05 16:25:19",
                "mapbox_access_tokens": null,
                "has_password": null,
                "username": "sg25950",
                "email": null,
                "is_active": null,
                "readonly": null,
                "is_dash_creator": null,
                "dash_created_count": null,
                "is_chart_creator": null,
                "charts_created_count": null
            }
        },
        {
            "creation_time": "2024-04-05T15:55:59.159620Z",
            "comments": {
                "results": [],
                "count": 0
            },
            "parented": true,
            "embed_url": "https://chart-studio.plotly.com/~Quezzo/1.embed",
            "fid": "Quezzo:1",
            "filename": "Plot 1",
            "filetype": "plot",
            "img_url": "https://storage.googleapis.com/plotly-prod-images/Quezzo/1/9_SXNSU3TXTQGJX9RQNIQN1HWCQJP2I6.png",
            "image_urls": {
                "default": "https://storage.googleapis.com/plotly-prod-images/Quezzo/1/2_QFD5RHI6VDJVBDO8VKL5Y9XCZKC1ZI.png",
                "block-thumb": "https://storage.googleapis.com/plotly-prod-images/Quezzo/1/8_8MGRX5S2OJSPOWD6XF3B546VM0ACOC.png",
                "list-thumb": "https://storage.googleapis.com/plotly-prod-images/Quezzo/1/9_SXNSU3TXTQGJX9RQNIQN1HWCQJP2I6.png"
            },
            "api_urls": {
                "files": "https://api.plotly.com/v2/files/Quezzo:1",
                "plots": "https://api.plotly.com/v2/plots/Quezzo:1",
                "parent": "https://api.plotly.com/v2/folders/home?user=Quezzo"
            },
            "owner": "Quezzo",
            "parent": -1,
            "preview": "",
            "referencers": [],
            "references": [],
            "title": "",
            "views": 2,
            "web_url": "https://chart-studio.plotly.com/~Quezzo/1/",
            "world_readable": true,
            "date_modified": "2024-04-05T15:56:35.506Z",
            "stars": {
                "results": [],
                "count": 0
            },
            "collaborators": {
                "results": [],
                "count": 0
            },
            "subfolder_count": null,
            "refresh_interval": null,
            "organize_view_url": "https://chart-studio.plotly.com/~Quezzo/1/",
            "current_user_permission": "read",
            "is_theme": null,
            "is_template": false,
            "autosize": true,
            "caption": "",
            "figure": {
                "data": [
                    {
                        "meta": {
                            "columnNames": {
                                "x": "x",
                                "y": "y",
                                "text": "text"
                            }
                        },
                        "type": "bar",
                        "xsrc": "Quezzo:0:c16344",
                        "ysrc": "Quezzo:0:d6a9a0",
                        "marker": {
                            "line": {
                                "color": "rgb(8,48,107)",
                                "width": 1.5
                            },
                            "color": "rgb(158,202,225)"
                        },
                        "opacity": 0.6,
                        "textsrc": "Quezzo:0:8cea91",
                        "orientation": "v"
                    }
                ],
                "frames": [],
                "layout": {
                    "title": {
                        "text": "My football stats"
                    },
                    "xaxis": {
                        "type": "category",
                        "range": [
                            -0.5,
                            2.5
                        ],
                        "autorange": true
                    },
                    "yaxis": {
                        "type": "linear",
                        "range": [
                            0,
                            9.473684210526315
                        ],
                        "autorange": true
                    },
                    "autosize": true
                }
            },
            "height": null,
            "width": null,
            "user": {
                "profile_url": "https://chart-studio.plotly.com/~Quezzo",
                "avatar_url": "https://storage.googleapis.com/plotly-prod-profiles/34.jpg",
                "background_url": "https://storage.googleapis.com/plotly-prod-profiles/bg-2.jpg",
                "bio": "",
                "nickname": "",
                "website": "",
                "stream_tokens": null,
                "feature_set_id": null,
                "csrf_token": null,
                "date_joined": "2024-04-05 15:30:30",
                "mapbox_access_tokens": null,
                "has_password": null,
                "username": "Quezzo",
                "email": null,
                "is_active": null,
                "readonly": null,
                "is_dash_creator": null,
                "dash_created_count": null,
                "is_chart_creator": null,
                "charts_created_count": null
            }
        },
        {
            "creation_time": "2024-04-05T15:54:35.349321Z",
            "comments": {
                "results": [],
                "count": 0
            },
            "parented": true,
            "embed_url": "https://chart-studio.plotly.com/~emilylaabs/3.embed",
            "fid": "emilylaabs:3",
            "filename": "Heating Curve Graph copy",
            "filetype": "plot",
            "img_url": "https://storage.googleapis.com/plotly-prod-images/emilylaabs/3/9_3Q2RC5NXYGCT3IAWYHKRAF68LOFLPA.png",
            "image_urls": {
                "default": "https://storage.googleapis.com/plotly-prod-images/emilylaabs/3/2_11H9A06PUH39LTJEV540PJ2B747JQF.png",
                "block-thumb": "https://storage.googleapis.com/plotly-prod-images/emilylaabs/3/8_1696YAWR9UZD08SIFIESQG5VF462FR.png",
                "list-thumb": "https://storage.googleapis.com/plotly-prod-images/emilylaabs/3/9_3Q2RC5NXYGCT3IAWYHKRAF68LOFLPA.png"
            },
            "api_urls": {
                "files": "https://api.plotly.com/v2/files/emilylaabs:3",
                "plots": "https://api.plotly.com/v2/plots/emilylaabs:3",
                "parent": "https://api.plotly.com/v2/folders/home?user=emilylaabs"
            },
            "owner": "emilylaabs",
            "parent": -1,
            "preview": "",
            "referencers": [],
            "references": [],
            "title": "",
            "views": 1,
            "web_url": "https://chart-studio.plotly.com/~emilylaabs/3/",
            "world_readable": true,
            "date_modified": "2024-04-05T15:54:35.627Z",
            "stars": {
                "results": [],
                "count": 0
            },
            "collaborators": {
                "results": [],
                "count": 0
            },
            "subfolder_count": null,
            "refresh_interval": null,
            "organize_view_url": "https://chart-studio.plotly.com/~emilylaabs/3/",
            "current_user_permission": "read",
            "is_theme": null,
            "is_template": true,
            "autosize": true,
            "caption": "",
            "figure": {
                "data": [
                    {
                        "uid": "9478dd",
                        "meta": {
                            "columnNames": {
                                "x": "Col1",
                                "y": "Col2"
                            }
                        },
                        "mode": "lines",
                        "name": "Col2",
                        "type": "scatter",
                        "xsrc": "emilylaabs:2:5ee5d0",
                        "ysrc": "emilylaabs:2:38bd5f"
                    }
                ],
                "frames": [],
                "layout": {
                    "title": {
                        "text": "Heating Curve Graph"
                    },
                    "width": 1119,
                    "xaxis": {
                        "type": "linear",
                        "range": [
                            0,
                            30
                        ],
                        "title": {
                            "text": "Time (Minutes)"
                        },
                        "autorange": true
                    },
                    "yaxis": {
                        "type": "linear",
                        "range": [
                            -16.666666666666668,
                            116.66666666666667
                        ],
                        "title": {
                            "text": "Temperature (°C)"
                        },
                        "autorange": true
                    },
                    "height": 547,
                    "autosize": true
                }
            },
            "height": 547,
            "width": 1119,
            "user": {
                "profile_url": "https://chart-studio.plotly.com/~emilylaabs",
                "avatar_url": "https://storage.googleapis.com/plotly-prod-profiles/46.jpg",
                "background_url": "https://storage.googleapis.com/plotly-prod-profiles/bg-2.jpg",
                "bio": "",
                "nickname": "",
                "website": "",
                "stream_tokens": null,
                "feature_set_id": null,
                "csrf_token": null,
                "date_joined": "2024-04-05 15:51:45",
                "mapbox_access_tokens": null,
                "has_password": null,
                "username": "emilylaabs",
                "email": null,
                "is_active": null,
                "readonly": null,
                "is_dash_creator": null,
                "dash_created_count": null,
                "is_chart_creator": null,
                "charts_created_count": null
            }
        },
        {
            "creation_time": "2024-04-05T15:52:42.589265Z",
            "comments": {
                "results": [],
                "count": 0
            },
            "parented": true,
            "embed_url": "https://chart-studio.plotly.com/~emilylaabs/1.embed",
            "fid": "emilylaabs:1",
            "filename": "Heating Curve Graph",
            "filetype": "plot",
            "img_url": "https://storage.googleapis.com/plotly-prod-images/emilylaabs/1/9_861B997BJM8SFL6M0JRO69BTPFUQA2.png",
            "image_urls": {
                "default": "https://storage.googleapis.com/plotly-prod-images/emilylaabs/1/2_OP7CPUR5U374WE6EJ019P93W4KT7NV.png",
                "block-thumb": "https://storage.googleapis.com/plotly-prod-images/emilylaabs/1/8_7R28L41SJ0IC7NW9QG6OQ15JU64CQO.png",
                "list-thumb": "https://storage.googleapis.com/plotly-prod-images/emilylaabs/1/9_861B997BJM8SFL6M0JRO69BTPFUQA2.png"
            },
            "api_urls": {
                "files": "https://api.plotly.com/v2/files/emilylaabs:1",
                "plots": "https://api.plotly.com/v2/plots/emilylaabs:1",
                "parent": "https://api.plotly.com/v2/folders/home?user=emilylaabs"
            },
            "owner": "emilylaabs",
            "parent": -1,
            "preview": "",
            "referencers": [],
            "references": [],
            "title": "",
            "views": 4,
            "web_url": "https://chart-studio.plotly.com/~emilylaabs/1/",
            "world_readable": true,
            "date_modified": "2024-04-05T15:52:42.599Z",
            "stars": {
                "results": [],
                "count": 0
            },
            "collaborators": {
                "results": [],
                "count": 0
            },
            "subfolder_count": null,
            "refresh_interval": null,
            "organize_view_url": "https://chart-studio.plotly.com/~emilylaabs/1/",
            "current_user_permission": "read",
            "is_theme": null,
            "is_template": true,
            "autosize": true,
            "caption": "",
            "figure": {
                "data": [
                    {
                        "uid": "9478dd",
                        "meta": {
                            "columnNames": {
                                "x": "Col1",
                                "y": "Col2"
                            }
                        },
                        "mode": "lines",
                        "name": "Col2",
                        "type": "scatter",
                        "xsrc": "emilylaabs:0:5ee5d0",
                        "ysrc": "emilylaabs:0:38bd5f"
                    }
                ],
                "frames": [],
                "layout": {
                    "title": {
                        "text": "Heating Curve Graph"
                    },
                    "width": 1119,
                    "xaxis": {
                        "type": "linear",
                        "range": [
                            0,
                            30
                        ],
                        "title": {
                            "text": "Time (Minutes)"
                        },
                        "autorange": true
                    },
                    "yaxis": {
                        "type": "linear",
                        "range": [
                            -16.666666666666668,
                            116.66666666666667
                        ],
                        "title": {
                            "text": "Temperature (°C)"
                        },
                        "autorange": true
                    },
                    "height": 547,
                    "autosize": true
                }
            },
            "height": 547,
            "width": 1119,
            "user": {
                "profile_url": "https://chart-studio.plotly.com/~emilylaabs",
                "avatar_url": "https://storage.googleapis.com/plotly-prod-profiles/46.jpg",
                "background_url": "https://storage.googleapis.com/plotly-prod-profiles/bg-2.jpg",
                "bio": "",
                "nickname": "",
                "website": "",
                "stream_tokens": null,
                "feature_set_id": null,
                "csrf_token": null,
                "date_joined": "2024-04-05 15:51:45",
                "mapbox_access_tokens": null,
                "has_password": null,
                "username": "emilylaabs",
                "email": null,
                "is_active": null,
                "readonly": null,
                "is_dash_creator": null,
                "dash_created_count": null,
                "is_chart_creator": null,
                "charts_created_count": null
            }
        },
        {
            "creation_time": "2024-04-05T15:43:55.950261Z",
            "comments": {
                "results": [],
                "count": 0
            },
            "parented": true,
            "embed_url": "https://chart-studio.plotly.com/~jpix/1.embed",
            "fid": "jpix:1",
            "filename": "Plot 1",
            "filetype": "plot",
            "img_url": "https://storage.googleapis.com/plotly-prod-images/jpix/1/9_E61Q0LTE0JSYTTSJVAIDTOTZ1UYWM9.png",
            "image_urls": {
                "default": "https://storage.googleapis.com/plotly-prod-images/jpix/1/2_U6KCV9HVATAVTB3VVQB1V7ANUPUTMY.png",
                "block-thumb": "https://storage.googleapis.com/plotly-prod-images/jpix/1/8_BFQQ3UEZYTIAOQDRFVCOKQBHOWASWI.png",
                "list-thumb": "https://storage.googleapis.com/plotly-prod-images/jpix/1/9_E61Q0LTE0JSYTTSJVAIDTOTZ1UYWM9.png"
            },
            "api_urls": {
                "files": "https://api.plotly.com/v2/files/jpix:1",
                "plots": "https://api.plotly.com/v2/plots/jpix:1",
                "parent": "https://api.plotly.com/v2/folders/home?user=jpix"
            },
            "owner": "jpix",
            "parent": -1,
            "preview": "",
            "referencers": [],
            "references": [],
            "title": "",
            "views": 3,
            "web_url": "https://chart-studio.plotly.com/~jpix/1/",
            "world_readable": true,
            "date_modified": "2024-04-05T15:58:04.792Z",
            "stars": {
                "results": [],
                "count": 0
            },
            "collaborators": {
                "results": [],
                "count": 0
            },
            "subfolder_count": null,
            "refresh_interval": null,
            "organize_view_url": "https://chart-studio.plotly.com/~jpix/1/",
            "current_user_permission": "read",
            "is_theme": null,
            "is_template": false,
            "autosize": true,
            "caption": "",
            "figure": {
                "data": [
                    {
                        "meta": {
                            "columnNames": {
                                "x": "A",
                                "y": "B"
                            }
                        },
                        "mode": "lines",
                        "type": "scatter",
                        "xsrc": "jpix:0:71a7b1",
                        "ysrc": "jpix:0:832fae"
                    }
                ],
                "frames": [],
                "layout": {
                    "title": {
                        "text": "A-17 Interceptor 2 efficiency graph at sea level"
                    },
                    "xaxis": {
                        "type": "linear",
                        "range": [
                            425,
                            1700
                        ],
                        "title": {
                            "text": "Speed (MPH)"
                        },
                        "autorange": true
                    },
                    "yaxis": {
                        "type": "linear",
                        "range": [
                            103.59427777777778,
                            262.9687222222222
                        ],
                        "title": {
                            "text": "Distance (miles)"
                        },
                        "autorange": true
                    },
                    "autosize": true,
                    "template": {
                        "data": {
                            "bar": [
                                {
                                    "type": "bar",
                                    "marker": {
                                        "colorbar": {
                                            "ticks": "",
                                            "outlinewidth": 0
                                        }
                                    }
                                }
                            ],
                            "table": [
                                {
                                    "type": "table",
                                    "cells": {
                                        "fill": {
                                            "color": "#EBF0F8"
                                        },
                                        "line": {
                                            "color": "white"
                                        }
                                    },
                                    "header": {
                                        "fill": {
                                            "color": "#C8D4E3"
                                        },
                                        "line": {
                                            "color": "white"
                                        }
                                    }
                                }
                            ],
                            "carpet": [
                                {
                                    "type": "carpet",
                                    "aaxis": {
                                        "gridcolor": "#C8D4E3",
                                        "linecolor": "#C8D4E3",
                                        "endlinecolor": "#2a3f5f",
                                        "minorgridcolor": "#C8D4E3",
                                        "startlinecolor": "#2a3f5f"
                                    },
                                    "baxis": {
                                        "gridcolor": "#C8D4E3",
                                        "linecolor": "#C8D4E3",
                                        "endlinecolor": "#2a3f5f",
                                        "minorgridcolor": "#C8D4E3",
                                        "startlinecolor": "#2a3f5f"
                                    }
                                }
                            ],
                            "mesh3d": [
                                {
                                    "type": "mesh3d",
                                    "colorbar": {
                                        "ticks": "",
                                        "outlinewidth": 0
                                    }
                                }
                            ],
                            "contour": [
                                {
                                    "type": "contour",
                                    "colorbar": {
                                        "ticks": "",
                                        "outlinewidth": 0
                                    },
                                    "autocolorscale": true
                                }
                            ],
                            "heatmap": [
                                {
                                    "type": "heatmap",
                                    "colorbar": {
                                        "ticks": "",
                                        "outlinewidth": 0
                                    },
                                    "autocolorscale": true
                                }
                            ],
                            "scatter": [
                                {
                                    "type": "scatter",
                                    "marker": {
                                        "colorbar": {
                                            "ticks": "",
                                            "outlinewidth": 0
                                        }
                                    }
                                }
                            ],
                            "surface": [
                                {
                                    "type": "surface",
                                    "colorbar": {
                                        "ticks": "",
                                        "outlinewidth": 0
                                    }
                                }
                            ],
                            "heatmapgl": [
                                {
                                    "type": "heatmapgl",
                                    "colorbar": {
                                        "ticks": "",
                                        "outlinewidth": 0
                                    }
                                }
                            ],
                            "histogram": [
                                {
                                    "type": "histogram",
                                    "marker": {
                                        "colorbar": {
                                            "ticks": "",
                                            "outlinewidth": 0
                                        }
                                    }
                                }
                            ],
                            "parcoords": [
                                {
                                    "line": {
                                        "colorbar": {
                                            "ticks": "",
                                            "outlinewidth": 0
                                        }
                                    },
                                    "type": "parcoords"
                                }
                            ],
                            "scatter3d": [
                                {
                                    "type": "scatter3d",
                                    "marker": {
                                        "colorbar": {
                                            "ticks": "",
                                            "outlinewidth": 0
                                        }
                                    }
                                }
                            ],
                            "scattergl": [
                                {
                                    "type": "scattergl",
                                    "marker": {
                                        "colorbar": {
                                            "ticks": "",
                                            "outlinewidth": 0
                                        }
                                    }
                                }
                            ],
                            "choropleth": [
                                {
                                    "type": "choropleth",
                                    "colorbar": {
                                        "ticks": "",
                                        "outlinewidth": 0
                                    }
                                }
                            ],
                            "scattergeo": [
                                {
                                    "type": "scattergeo",
                                    "marker": {
                                        "colorbar": {
                                            "ticks": "",
                                            "outlinewidth": 0
                                        }
                                    }
                                }
                            ],
                            "histogram2d": [
                                {
                                    "type": "histogram2d",
                                    "colorbar": {
                                        "ticks": "",
                                        "outlinewidth": 0
                                    },
                                    "autocolorscale": true
                                }
                            ],
                            "scatterpolar": [
                                {
                                    "type": "scatterpolar",
                                    "marker": {
                                        "colorbar": {
                                            "ticks": "",
                                            "outlinewidth": 0
                                        }
                                    }
                                }
                            ],
                            "contourcarpet": [
                                {
                                    "type": "contourcarpet",
                                    "colorbar": {
                                        "ticks": "",
                                        "outlinewidth": 0
                                    }
                                }
                            ],
                            "scattercarpet": [
                                {
                                    "type": "scattercarpet",
                                    "marker": {
                                        "colorbar": {
                                            "ticks": "",
                                            "outlinewidth": 0
                                        }
                                    }
                                }
                            ],
                            "scattermapbox": [
                                {
                                    "type": "scattermapbox",
                                    "marker": {
                                        "colorbar": {
                                            "ticks": "",
                                            "outlinewidth": 0
                                        }
                                    }
                                }
                            ],
                            "scatterpolargl": [
                                {
                                    "type": "scatterpolargl",
                                    "marker": {
                                        "colorbar": {
                                            "ticks": "",
                                            "outlinewidth": 0
                                        }
                                    }
                                }
                            ],
                            "scatterternary": [
                                {
                                    "type": "scatterternary",
                                    "marker": {
                                        "colorbar": {
                                            "ticks": "",
                                            "outlinewidth": 0
                                        }
                                    }
                                }
                            ],
                            "histogram2dcontour": [
                                {
                                    "type": "histogram2dcontour",
                                    "colorbar": {
                                        "ticks": "",
                                        "outlinewidth": 0
                                    },
                                    "autocolorscale": true
                                }
                            ]
                        },
                        "layout": {
                            "geo": {
                                "bgcolor": "white",
                                "showland": true,
                                "lakecolor": "white",
                                "landcolor": "white",
                                "showlakes": true,
                                "subunitcolor": "#C8D4E3"
                            },
                            "font": {
                                "color": "#2a3f5f"
                            },
                            "polar": {
                                "bgcolor": "white",
                                "radialaxis": {
                                    "ticks": "",
                                    "gridcolor": "#EBF0F8",
                                    "linecolor": "#EBF0F8"
                                },
                                "angularaxis": {
                                    "ticks": "",
                                    "gridcolor": "#EBF0F8",
                                    "linecolor": "#EBF0F8"
                                }
                            },
                            "scene": {
                                "xaxis": {
                                    "ticks": "",
                                    "gridcolor": "#DFE8F3",
                                    "gridwidth": 2,
                                    "linecolor": "#EBF0F8",
                                    "zerolinecolor": "#EBF0F8",
                                    "showbackground": true,
                                    "backgroundcolor": "white"
                                },
                                "yaxis": {
                                    "ticks": "",
                                    "gridcolor": "#DFE8F3",
                                    "gridwidth": 2,
                                    "linecolor": "#EBF0F8",
                                    "zerolinecolor": "#EBF0F8",
                                    "showbackground": true,
                                    "backgroundcolor": "white"
                                },
                                "zaxis": {
                                    "ticks": "",
                                    "gridcolor": "#DFE8F3",
                                    "gridwidth": 2,
                                    "linecolor": "#EBF0F8",
                                    "zerolinecolor": "#EBF0F8",
                                    "showbackground": true,
                                    "backgroundcolor": "white"
                                }
                            },
                            "title": {
                                "x": 0.05
                            },
                            "xaxis": {
                                "ticks": "",
                                "gridcolor": "#EBF0F8",
                                "linecolor": "#EBF0F8",
                                "automargin": true,
                                "zerolinecolor": "#EBF0F8",
                                "zerolinewidth": 2
                            },
                            "yaxis": {
                                "ticks": "",
                                "gridcolor": "#EBF0F8",
                                "linecolor": "#EBF0F8",
                                "automargin": true,
                                "zerolinecolor": "#EBF0F8",
                                "zerolinewidth": 2
                            },
                            "ternary": {
                                "aaxis": {
                                    "ticks": "",
                                    "gridcolor": "#DFE8F3",
                                    "linecolor": "#A2B1C6"
                                },
                                "baxis": {
                                    "ticks": "",
                                    "gridcolor": "#DFE8F3",
                                    "linecolor": "#A2B1C6"
                                },
                                "caxis": {
                                    "ticks": "",
                                    "gridcolor": "#DFE8F3",
                                    "linecolor": "#A2B1C6"
                                },
                                "bgcolor": "white"
                            },
                            "colorway": [
                                "#636efa",
                                "#EF553B",
                                "#00cc96",
                                "#ab63fa",
                                "#19d3f3",
                                "#e763fa",
                                "#fecb52",
                                "#ffa15a",
                                "#ff6692",
                                "#b6e880"
                            ],
                            "hovermode": "closest",
                            "colorscale": {
                                "diverging": [
                                    [
                                        0,
                                        "#8e0152"
                                    ],
                                    [
                                        0.1,
                                        "#c51b7d"
                                    ],
                                    [
                                        0.2,
                                        "#de77ae"
                                    ],
                                    [
                                        0.3,
                                        "#f1b6da"
                                    ],
                                    [
                                        0.4,
                                        "#fde0ef"
                                    ],
                                    [
                                        0.5,
                                        "#f7f7f7"
                                    ],
                                    [
                                        0.6,
                                        "#e6f5d0"
                                    ],
                                    [
                                        0.7,
                                        "#b8e186"
                                    ],
                                    [
                                        0.8,
                                        "#7fbc41"
                                    ],
                                    [
                                        0.9,
                                        "#4d9221"
                                    ],
                                    [
                                        1,
                                        "#276419"
                                    ]
                                ],
                                "sequential": [
                                    [
                                        0,
                                        "#0508b8"
                                    ],
                                    [
                                        0.0893854748603352,
                                        "#1910d8"
                                    ],
                                    [
                                        0.1787709497206704,
                                        "#3c19f0"
                                    ],
                                    [
                                        0.2681564245810056,
                                        "#6b1cfb"
                                    ],
                                    [
                                        0.3575418994413408,
                                        "#981cfd"
                                    ],
                                    [
                                        0.44692737430167595,
                                        "#bf1cfd"
                                    ],
                                    [
                                        0.5363128491620112,
                                        "#dd2bfd"
                                    ],
                                    [
                                        0.6256983240223464,
                                        "#f246fe"
                                    ],
                                    [
                                        0.7150837988826816,
                                        "#fc67fd"
                                    ],
                                    [
                                        0.8044692737430168,
                                        "#fe88fc"
                                    ],
                                    [
                                        0.8938547486033519,
                                        "#fea5fd"
                                    ],
                                    [
                                        0.9832402234636871,
                                        "#febefe"
                                    ],
                                    [
                                        1,
                                        "#fec3fe"
                                    ]
                                ],
                                "sequentialminus": [
                                    [
                                        0,
                                        "#0508b8"
                                    ],
                                    [
                                        0.0893854748603352,
                                        "#1910d8"
                                    ],
                                    [
                                        0.1787709497206704,
                                        "#3c19f0"
                                    ],
                                    [
                                        0.2681564245810056,
                                        "#6b1cfb"
                                    ],
                                    [
                                        0.3575418994413408,
                                        "#981cfd"
                                    ],
                                    [
                                        0.44692737430167595,
                                        "#bf1cfd"
                                    ],
                                    [
                                        0.5363128491620112,
                                        "#dd2bfd"
                                    ],
                                    [
                                        0.6256983240223464,
                                        "#f246fe"
                                    ],
                                    [
                                        0.7150837988826816,
                                        "#fc67fd"
                                    ],
                                    [
                                        0.8044692737430168,
                                        "#fe88fc"
                                    ],
                                    [
                                        0.8938547486033519,
                                        "#fea5fd"
                                    ],
                                    [
                                        0.9832402234636871,
                                        "#febefe"
                                    ],
                                    [
                                        1,
                                        "#fec3fe"
                                    ]
                                ]
                            },
                            "plot_bgcolor": "white",
                            "paper_bgcolor": "white",
                            "shapedefaults": {
                                "line": {
                                    "width": 0
                                },
                                "opacity": 0.4,
                                "fillcolor": "#506784"
                            },
                            "annotationdefaults": {
                                "arrowhead": 0,
                                "arrowcolor": "#506784",
                                "arrowwidth": 1
                            }
                        },
                        "themeRef": "PLOTLY_WHITE"
                    }
                }
            },
            "height": null,
            "width": null,
            "user": {
                "profile_url": "https://chart-studio.plotly.com/~jpix",
                "avatar_url": "https://storage.googleapis.com/plotly-prod-profiles/18.jpg",
                "background_url": "https://storage.googleapis.com/plotly-prod-profiles/bg-6.jpg",
                "bio": "",
                "nickname": "",
                "website": "",
                "stream_tokens": null,
                "feature_set_id": null,
                "csrf_token": null,
                "date_joined": "2024-04-05 15:43:40",
                "mapbox_access_tokens": null,
                "has_password": null,
                "username": "jpix",
                "email": null,
                "is_active": null,
                "readonly": null,
                "is_dash_creator": null,
                "dash_created_count": null,
                "is_chart_creator": null,
                "charts_created_count": null
            }
        }
    ]
}