Plots List
Plots
This endpoint handles manipulation of Plotly plot files.
Reference
Authorization
Any user with or without a Plotly account may view public plots. For private plots, see authentication.
Actions
list
Listing all public plots can be done via a GET request to this endpoint.
By default, plots will be listed in order of date created. The order_by
query parameter is accepted at this endpoint. Currently, only ordering by
views is supported. It is possible to filter the plots by quality
with min_quality or max_quality as query parameter.
Example:
// GET https://api.plotly.com/v2/plots/ ---> 200

// GET https://api.plotly.com/v2/plots/?order_by=-views ---> 200

// GET https://api.plotly.com/v2/plots/?min_quality=5 ---> 200

// GET https://api.plotly.com/v2/plots/?max_quality=5 ---> 200
feed
Listing all handpicked feed plots can be done via a GET request to this endpoint. By default, plots will be listed in a random order.
Example:
// GET https://api.plotly.com/v2/plots/feed ---> 200
create
You can create new plot resources here. The only required field is 'figure'. Currently, the figure is restricted to only contain references to grid data. That is, this will fail if raw data arrays are passed in. To create and manipulate underlying grids for plots, see the grids endpoint.
Example:
// This fails because a figure field is required.
// POST https://api.plotly.com/v2/plots ---> 400 Bad Request
{}

// This fails because the figure has raw data
//POST https://api.plotly.com/v2/plots ---> 400 Bad Request
{
    "figure": {"data": [{"y": ['this', 'is', 'raw', 'data']}]}
}

// This succeeds because the figure has src keys, not raw data.
//POST https://api.plotly.com/v2/plots ---> 200 OK
{
    "figure": {"data": [{"ysrc": "sven:88:u8nd62"}]}
}
When creating a grid, you can optionally specify a source_fid to specify where a plot has come from:
- source_fid: the fid of a plot that was copied (and presumably edited) to produce this one
detail
There is a lot of meta information stored about plot files including filename, title, share_url, and content_url to name a few.
This information can only be reached with a GET to this endpoint.
Example:
// GET https://api.plotly.com/v2/plots/iheartgraphs:90
content
The contents of a plot can be downloaded via the content resource. The plot
content contains referenced grid/column data by default. If you wish to
return the raw grid/column data, the inline_data=true query must be included
in the request url. The Content-Type header will be appropriately set for the
response body.
Alternatively, you can set ?map_data=unreadable to append a mapping of
sources to data that belongs to grids which are unreadable for the
requestor. This is useful when you have read access to another users plot,
but that plot contains grid references which you don't have access to.
Examples:
// Returns referenced grid/column data
// GET https://api.plotly.com/v2/plots/iheartgraphs:90/content ---> 200 OK

// Returns full grid/column data
// GET https://api.plotly.com/v2/plots/iheartgraphs:90/content?inline_data=true ---> 200 OK

// Returns full grid/column data when requestor doesn't have permission
// to read the referenced grid.
// GET https://api.plotly.com/v2/plots/iheartgraphs:90/content?map_data=unreadable ---> 200 OK
GET /v2/plots?cursor=cj0xJnA9MjAyNC0wNC0wNSsxNCUzQTA4JTNBMzMuMzMwMjk4JTJCMDAlM0EwMA%3D%3D&format=api
{ "next": "https://api.plot.ly/v2/plots?cursor=cD0yMDI0LTA0LTA1KzE0JTNBMTUlM0EyOS42MDU5NDUlMkIwMCUzQTAw&format=api", "previous": "https://api.plot.ly/v2/plots?cursor=cj0xJnA9MjAyNC0wNC0wNSsxNSUzQTQxJTNBMDUuNDI5MDM3JTJCMDAlM0EwMA%3D%3D&format=api", "results": [ { "creation_time": "2024-04-05T15:41:05.429037Z", "comments": { "results": [], "count": 0 }, "parented": true, "embed_url": "https://chart-studio.plotly.com/~Zakharteshukov/2.embed", "fid": "Zakharteshukov:2", "filename": "Plot 2", "filetype": "plot", "img_url": "https://storage.googleapis.com/plotly-prod-images/Zakharteshukov/2/9_Y8VP6MX2BJ80PN3QBH8D82M7OYHCZE.png", "image_urls": { "default": "https://storage.googleapis.com/plotly-prod-images/Zakharteshukov/2/2_EGOUSIZWVVBHY156H4RKFSDCDPU7YI.png", "block-thumb": "https://storage.googleapis.com/plotly-prod-images/Zakharteshukov/2/8_KCBFVLMUJ6K28E2FAW96YL32OZML3O.png", "list-thumb": "https://storage.googleapis.com/plotly-prod-images/Zakharteshukov/2/9_Y8VP6MX2BJ80PN3QBH8D82M7OYHCZE.png" }, "api_urls": { "files": "https://api.plotly.com/v2/files/Zakharteshukov:2", "plots": "https://api.plotly.com/v2/plots/Zakharteshukov:2", "parent": "https://api.plotly.com/v2/folders/home?user=Zakharteshukov" }, "owner": "Zakharteshukov", "parent": -1, "preview": "", "referencers": [], "references": [], "title": "", "views": 2, "web_url": "https://chart-studio.plotly.com/~Zakharteshukov/2/", "world_readable": true, "date_modified": "2024-04-05T15:41:05.440Z", "stars": { "results": [], "count": 0 }, "collaborators": { "results": [], "count": 0 }, "subfolder_count": null, "refresh_interval": null, "organize_view_url": "https://chart-studio.plotly.com/~Zakharteshukov/2/", "current_user_permission": "read", "is_theme": null, "is_template": false, "autosize": true, "caption": "", "figure": { "data": [ { "line": { "color": "black", "width": 3 }, "meta": { "columnNames": { "x": "x", "y": "y", "z": "z" } }, "mode": "markers", "type": "scatter3d", "xsrc": "Zakharteshukov:1:11d7af", "ysrc": "Zakharteshukov:1:82f832", "zsrc": "Zakharteshukov:1:943810", "marker": { "cmax": 12.566370614359172, "cmin": 0, "meta": { "columnNames": { "color": "z" } }, "size": 6, "cauto": true, "colorsrc": "Zakharteshukov:1:943810", "colorscale": [ [ 0, "#2a3f5f" ], [ 0.2, "#A2B1C6" ], [ 0.4, "#0D76BF" ], [ 0.6, "#00cc96" ], [ 0.8, "#e6915a" ], [ 1, "#EF553B" ] ], "reversescale": false, "autocolorscale": false } } ], "frames": [], "layout": { "scene": { "xaxis": { "type": "linear", "dtick": 0.5, "range": [ -1.062371495440084, 1.0624961059224267 ], "tick0": 0, "title": { "font": { "family": "Times New Roman" }, "text": "X" }, "nticks": 0, "showgrid": true, "showline": false, "tickmode": "auto", "zeroline": false, "autorange": true, "rangemode": "normal", "showbackground": false }, "yaxis": { "type": "linear", "dtick": 0.5, "range": [ -1.062466899825041, 1.062466899825041 ], "tick0": 0, "title": { "font": { "family": "Times New Roman" }, "text": "Y" }, "nticks": 0, "showgrid": true, "tickmode": "auto", "zeroline": false, "autorange": true, "rangemode": "normal" }, "zaxis": { "type": "linear", "dtick": 2, "range": [ -0.39269908169872414, 12.959069696057897 ], "tick0": 0, "title": { "font": { "family": "Arial" }, "text": "Z" }, "nticks": 0, "showgrid": true, "tickmode": "auto", "zeroline": false, "autorange": true, "rangemode": "normal" }, "camera": { "up": { "x": 0, "y": 0, "z": 1 }, "eye": { "x": -1.0907367183169072, "y": 0.9428918623104426, "z": 0.9012623944921393 }, "center": { "x": -0.06730366801455621, "y": 0.0031606996392360654, "z": -0.07369645044279095 }, "projection": { "type": "perspective" } }, "aspectmode": "auto", "aspectratio": { "x": 1, "y": 1, "z": 1 } }, "title": { "text": "Helix Curve using 3D Scatter" }, "autosize": true } }, "height": null, "width": null, "user": { "profile_url": "https://chart-studio.plotly.com/~Zakharteshukov", "avatar_url": "https://storage.googleapis.com/plotly-prod-profiles/16.jpg", "background_url": "https://storage.googleapis.com/plotly-prod-profiles/bg-0.jpg", "bio": "", "nickname": "", "website": "", "stream_tokens": null, "feature_set_id": null, "csrf_token": null, "date_joined": "2024-04-05 15:40:00", "mapbox_access_tokens": null, "has_password": null, "username": "Zakharteshukov", "email": null, "is_active": null, "readonly": null, "is_dash_creator": null, "dash_created_count": null, "is_chart_creator": null, "charts_created_count": null } }, { "creation_time": "2024-04-05T15:37:36.366343Z", "comments": { "results": [], "count": 0 }, "parented": true, "embed_url": "https://chart-studio.plotly.com/~nikolapesic17500/4.embed", "fid": "nikolapesic17500:4", "filename": "Plot 4", "filetype": "plot", "img_url": "https://storage.googleapis.com/plotly-prod-images/nikolapesic17500/4/9_RQJSM1YNJU2VZYTDMYFCGELVBNQQZH.png", "image_urls": { "default": "https://storage.googleapis.com/plotly-prod-images/nikolapesic17500/4/2_3XUU77BDES6QEYWH0C0H48N6MS9JIN.png", "block-thumb": "https://storage.googleapis.com/plotly-prod-images/nikolapesic17500/4/8_JKKGH95OO8622811LEPRM5DM3K8SBD.png", "list-thumb": "https://storage.googleapis.com/plotly-prod-images/nikolapesic17500/4/9_RQJSM1YNJU2VZYTDMYFCGELVBNQQZH.png" }, "api_urls": { "files": "https://api.plotly.com/v2/files/nikolapesic17500:4", "plots": "https://api.plotly.com/v2/plots/nikolapesic17500:4", "parent": "https://api.plotly.com/v2/folders/home?user=nikolapesic17500" }, "owner": "nikolapesic17500", "parent": -1, "preview": "", "referencers": [], "references": [], "title": "", "views": 1, "web_url": "https://chart-studio.plotly.com/~nikolapesic17500/4/", "world_readable": true, "date_modified": "2024-04-05T15:37:36.381Z", "stars": { "results": [], "count": 0 }, "collaborators": { "results": [], "count": 0 }, "subfolder_count": null, "refresh_interval": null, "organize_view_url": "https://chart-studio.plotly.com/~nikolapesic17500/4/", "current_user_permission": "read", "is_theme": null, "is_template": false, "autosize": true, "caption": "", "figure": { "data": [ { "meta": { "columnNames": { "y": "3606481" } }, "mode": "lines", "type": "scatter", "ysrc": "nikolapesic17500:3:1c23e1" } ], "frames": [], "layout": { "xaxis": { "range": [ 0, 10570 ], "autorange": true }, "yaxis": { "type": "linear", "range": [ -1025213499.3333335, 19614313067.333332 ], "autorange": true }, "autosize": true, "template": { "data": { "bar": [ { "type": "bar", "marker": { "colorbar": { "ticks": "", "outlinewidth": 0 } } } ], "table": [ { "type": "table", "cells": { "fill": { "color": "#EBF0F8" }, "line": { "color": "white" } }, "header": { "fill": { "color": "#C8D4E3" }, "line": { "color": "white" } } } ], "carpet": [ { "type": "carpet", "aaxis": { "gridcolor": "#C8D4E3", "linecolor": "#C8D4E3", "endlinecolor": "#2a3f5f", "minorgridcolor": "#C8D4E3", "startlinecolor": "#2a3f5f" }, "baxis": { "gridcolor": "#C8D4E3", "linecolor": "#C8D4E3", "endlinecolor": "#2a3f5f", "minorgridcolor": "#C8D4E3", "startlinecolor": "#2a3f5f" } } ], "mesh3d": [ { "type": "mesh3d", "colorbar": { "ticks": "", "outlinewidth": 0 } } ], "contour": [ { "type": "contour", "colorbar": { "ticks": "", "outlinewidth": 0 }, "autocolorscale": true } ], "heatmap": [ { "type": "heatmap", "colorbar": { "ticks": "", "outlinewidth": 0 }, "autocolorscale": true } ], "scatter": [ { "type": "scatter", "marker": { "colorbar": { "ticks": "", "outlinewidth": 0 } } } ], "surface": [ { "type": "surface", "colorbar": { "ticks": "", "outlinewidth": 0 } } ], "heatmapgl": [ { "type": "heatmapgl", "colorbar": { "ticks": "", "outlinewidth": 0 } } ], "histogram": [ { "type": "histogram", "marker": { "colorbar": { "ticks": "", "outlinewidth": 0 } } } ], "parcoords": [ { "line": { "colorbar": { "ticks": "", "outlinewidth": 0 } }, "type": "parcoords" } ], "scatter3d": [ { "type": "scatter3d", "marker": { "colorbar": { "ticks": "", "outlinewidth": 0 } } } ], "scattergl": [ { "type": "scattergl", "marker": { "colorbar": { "ticks": "", "outlinewidth": 0 } } } ], "choropleth": [ { "type": "choropleth", "colorbar": { "ticks": "", "outlinewidth": 0 } } ], "scattergeo": [ { "type": "scattergeo", "marker": { "colorbar": { "ticks": "", "outlinewidth": 0 } } } ], "histogram2d": [ { "type": "histogram2d", "colorbar": { "ticks": "", "outlinewidth": 0 }, "autocolorscale": true } ], "scatterpolar": [ { "type": "scatterpolar", "marker": { "colorbar": { "ticks": "", "outlinewidth": 0 } } } ], "contourcarpet": [ { "type": "contourcarpet", "colorbar": { "ticks": "", "outlinewidth": 0 } } ], "scattercarpet": [ { "type": "scattercarpet", "marker": { "colorbar": { "ticks": "", "outlinewidth": 0 } } } ], "scattermapbox": [ { "type": "scattermapbox", "marker": { "colorbar": { "ticks": "", "outlinewidth": 0 } } } ], "scatterpolargl": [ { "type": "scatterpolargl", "marker": { "colorbar": { "ticks": "", "outlinewidth": 0 } } } ], "scatterternary": [ { "type": "scatterternary", "marker": { "colorbar": { "ticks": "", "outlinewidth": 0 } } } ], "histogram2dcontour": [ { "type": "histogram2dcontour", "colorbar": { "ticks": "", "outlinewidth": 0 }, "autocolorscale": true } ] }, "layout": { "geo": { "bgcolor": "white", "showland": true, "lakecolor": "white", "landcolor": "white", "showlakes": true, "subunitcolor": "#C8D4E3" }, "font": { "color": "#2a3f5f" }, "polar": { "bgcolor": "white", "radialaxis": { "ticks": "", "gridcolor": "#EBF0F8", "linecolor": "#EBF0F8" }, "angularaxis": { "ticks": "", "gridcolor": "#EBF0F8", "linecolor": "#EBF0F8" } }, "scene": { "xaxis": { "ticks": "", "gridcolor": "#DFE8F3", "gridwidth": 2, "linecolor": "#EBF0F8", "zerolinecolor": "#EBF0F8", "showbackground": true, "backgroundcolor": "white" }, "yaxis": { "ticks": "", "gridcolor": "#DFE8F3", "gridwidth": 2, "linecolor": "#EBF0F8", "zerolinecolor": "#EBF0F8", "showbackground": true, "backgroundcolor": "white" }, "zaxis": { "ticks": "", "gridcolor": "#DFE8F3", "gridwidth": 2, "linecolor": "#EBF0F8", "zerolinecolor": "#EBF0F8", "showbackground": true, "backgroundcolor": "white" } }, "title": { "x": 0.05 }, "xaxis": { "ticks": "", "gridcolor": "#EBF0F8", "linecolor": "#EBF0F8", "automargin": true, "zerolinecolor": "#EBF0F8", "zerolinewidth": 2 }, "yaxis": { "ticks": "", "gridcolor": "#EBF0F8", "linecolor": "#EBF0F8", "automargin": true, "zerolinecolor": "#EBF0F8", "zerolinewidth": 2 }, "ternary": { "aaxis": { "ticks": "", "gridcolor": "#DFE8F3", "linecolor": "#A2B1C6" }, "baxis": { "ticks": "", "gridcolor": "#DFE8F3", "linecolor": "#A2B1C6" }, "caxis": { "ticks": "", "gridcolor": "#DFE8F3", "linecolor": "#A2B1C6" }, "bgcolor": "white" }, "colorway": [ "#636efa", "#EF553B", "#00cc96", "#ab63fa", "#19d3f3", "#e763fa", "#fecb52", "#ffa15a", "#ff6692", "#b6e880" ], "hovermode": "closest", "colorscale": { "diverging": [ [ 0, "#8e0152" ], [ 0.1, "#c51b7d" ], [ 0.2, "#de77ae" ], [ 0.3, "#f1b6da" ], [ 0.4, "#fde0ef" ], [ 0.5, "#f7f7f7" ], [ 0.6, "#e6f5d0" ], [ 0.7, "#b8e186" ], [ 0.8, "#7fbc41" ], [ 0.9, "#4d9221" ], [ 1, "#276419" ] ], "sequential": [ [ 0, "#0508b8" ], [ 0.0893854748603352, "#1910d8" ], [ 0.1787709497206704, "#3c19f0" ], [ 0.2681564245810056, "#6b1cfb" ], [ 0.3575418994413408, "#981cfd" ], [ 0.44692737430167595, "#bf1cfd" ], [ 0.5363128491620112, "#dd2bfd" ], [ 0.6256983240223464, "#f246fe" ], [ 0.7150837988826816, "#fc67fd" ], [ 0.8044692737430168, "#fe88fc" ], [ 0.8938547486033519, "#fea5fd" ], [ 0.9832402234636871, "#febefe" ], [ 1, "#fec3fe" ] ], "sequentialminus": [ [ 0, "#0508b8" ], [ 0.0893854748603352, "#1910d8" ], [ 0.1787709497206704, "#3c19f0" ], [ 0.2681564245810056, "#6b1cfb" ], [ 0.3575418994413408, "#981cfd" ], [ 0.44692737430167595, "#bf1cfd" ], [ 0.5363128491620112, "#dd2bfd" ], [ 0.6256983240223464, "#f246fe" ], [ 0.7150837988826816, "#fc67fd" ], [ 0.8044692737430168, "#fe88fc" ], [ 0.8938547486033519, "#fea5fd" ], [ 0.9832402234636871, "#febefe" ], [ 1, "#fec3fe" ] ] }, "plot_bgcolor": "white", "paper_bgcolor": "white", "shapedefaults": { "line": { "width": 0 }, "opacity": 0.4, "fillcolor": "#506784" }, "annotationdefaults": { "arrowhead": 0, "arrowcolor": "#506784", "arrowwidth": 1 } }, "themeRef": "PLOTLY_WHITE" } } }, "height": null, "width": null, "user": { "profile_url": "https://chart-studio.plotly.com/~nikolapesic17500", "avatar_url": "https://storage.googleapis.com/plotly-prod-profiles/84.jpg", "background_url": "https://storage.googleapis.com/plotly-prod-profiles/bg-1.jpg", "bio": "", "nickname": "", "website": "", "stream_tokens": null, "feature_set_id": null, "csrf_token": null, "date_joined": "2023-04-06 15:28:05", "mapbox_access_tokens": null, "has_password": null, "username": "nikolapesic17500", "email": null, "is_active": null, "readonly": null, "is_dash_creator": null, "dash_created_count": null, "is_chart_creator": null, "charts_created_count": null } }, { "creation_time": "2024-04-05T15:36:51.132124Z", "comments": { "results": [], "count": 0 }, "parented": true, "embed_url": "https://chart-studio.plotly.com/~eey575/3.embed", "fid": "eey575:3", "filename": "classifiers", "filetype": "plot", "img_url": "https://storage.googleapis.com/plotly-prod-images/eey575/3/9_QGJGEWK4IR36F7HEM1A9IFPHEUQEQE.png", "image_urls": { "default": "https://storage.googleapis.com/plotly-prod-images/eey575/3/2_NIE5IY0L8QV2L5K62KGEU6WXWGL9BU.png", "block-thumb": "https://storage.googleapis.com/plotly-prod-images/eey575/3/8_V5HHHDD05A4P3E3O5BZU4E7XM0QPMN.png", "list-thumb": "https://storage.googleapis.com/plotly-prod-images/eey575/3/9_QGJGEWK4IR36F7HEM1A9IFPHEUQEQE.png" }, "api_urls": { "files": "https://api.plotly.com/v2/files/eey575:3", "plots": "https://api.plotly.com/v2/plots/eey575:3", "parent": "https://api.plotly.com/v2/folders/home?user=eey575" }, "owner": "eey575", "parent": -1, "preview": "", "referencers": [], "references": [], "title": "", "views": 3, "web_url": "https://chart-studio.plotly.com/~eey575/3/", "world_readable": true, "date_modified": "2024-04-05T15:36:51.144Z", "stars": { "results": [], "count": 0 }, "collaborators": { "results": [], "count": 0 }, "subfolder_count": null, "refresh_interval": null, "organize_view_url": "https://chart-studio.plotly.com/~eey575/3/", "current_user_permission": "read", "is_theme": null, "is_template": false, "autosize": true, "caption": "", "figure": { "data": [ { "meta": { "columnNames": { "labels": "labels", "values": "values" } }, "type": "pie", "labelssrc": "eey575:2:9277f8", "valuessrc": "eey575:2:b9789a" } ], "frames": [], "layout": { "title": { "x": 0.2, "font": { "size": 18, "family": "Arial" }, "text": "Division of classifiers used in different plant species classification methods. " }, "legend": { "x": 0.08000000000000007, "y": 1 }, "margin": { "b": 50, "l": 50, "r": 50, "t": 50 }, "modebar": { "orientation": "h" }, "autosize": true, "dragmode": "zoom", "template": { "data": { "bar": [ { "type": "bar", "marker": { "colorbar": { "ticks": "outside", "ticklen": 8, "tickcolor": "rgb(36,36,36)", "tickwidth": 2, "outlinewidth": 0 } } } ], "table": [ { "type": "table", "cells": { "fill": { "color": "rgb(231,231,240)" }, "line": { "color": "white" } }, "header": { "fill": { "color": "rgb(183,183,191)" }, "line": { "color": "white" } } } ], "carpet": [ { "type": "carpet", "aaxis": { "gridcolor": "white", "linecolor": "white", "endlinecolor": "rgb(36,36,36)", "minorgridcolor": "white", "startlinecolor": "rgb(36,36,36)" }, "baxis": { "gridcolor": "white", "linecolor": "white", "endlinecolor": "rgb(36,36,36)", "minorgridcolor": "white", "startlinecolor": "rgb(36,36,36)" } } ], "mesh3d": [ { "type": "mesh3d", "colorbar": { "ticks": "outside", "ticklen": 8, "tickcolor": "rgb(36,36,36)", "tickwidth": 2, "outlinewidth": 0 } } ], "contour": [ { "type": "contour", "colorbar": { "ticks": "outside", "ticklen": 8, "tickcolor": "rgb(36,36,36)", "tickwidth": 2, "outlinewidth": 0 }, "autocolorscale": true } ], "heatmap": [ { "type": "heatmap", "colorbar": { "ticks": "outside", "ticklen": 8, "tickcolor": "rgb(36,36,36)", "tickwidth": 2, "outlinewidth": 0 }, "autocolorscale": true } ], "scatter": [ { "type": "scatter", "marker": { "colorbar": { "ticks": "outside", "ticklen": 8, "tickcolor": "rgb(36,36,36)", "tickwidth": 2, "outlinewidth": 0 } } } ], "surface": [ { "type": "surface", "colorbar": { "ticks": "outside", "ticklen": 8, "tickcolor": "rgb(36,36,36)", "tickwidth": 2, "outlinewidth": 0 } } ], "heatmapgl": [ { "type": "heatmapgl", "colorbar": { "ticks": "outside", "ticklen": 8, "tickcolor": "rgb(36,36,36)", "tickwidth": 2, "outlinewidth": 0 } } ], "histogram": [ { "type": "histogram", "marker": { "colorbar": { "ticks": "outside", "ticklen": 8, "tickcolor": "rgb(36,36,36)", "tickwidth": 2, "outlinewidth": 0 } } } ], "parcoords": [ { "line": { "colorbar": { "ticks": "outside", "ticklen": 8, "tickcolor": "rgb(36,36,36)", "tickwidth": 2, "outlinewidth": 0 } }, "type": "parcoords" } ], "scatter3d": [ { "type": "scatter3d", "marker": { "colorbar": { "ticks": "outside", "ticklen": 8, "tickcolor": "rgb(36,36,36)", "tickwidth": 2, "outlinewidth": 0 } } } ], "scattergl": [ { "type": "scattergl", "marker": { "colorbar": { "ticks": "outside", "ticklen": 8, "tickcolor": "rgb(36,36,36)", "tickwidth": 2, "outlinewidth": 0 } } } ], "choropleth": [ { "type": "choropleth", "colorbar": { "ticks": "outside", "ticklen": 8, "tickcolor": "rgb(36,36,36)", "tickwidth": 2, "outlinewidth": 0 } } ], "scattergeo": [ { "type": "scattergeo", "marker": { "colorbar": { "ticks": "outside", "ticklen": 8, "tickcolor": "rgb(36,36,36)", "tickwidth": 2, "outlinewidth": 0 } } } ], "histogram2d": [ { "type": "histogram2d", "colorbar": { "ticks": "outside", "ticklen": 8, "tickcolor": "rgb(36,36,36)", "tickwidth": 2, "outlinewidth": 0 }, "autocolorscale": true } ], "scatterpolar": [ { "type": "scatterpolar", "marker": { "colorbar": { "ticks": "outside", "ticklen": 8, "tickcolor": "rgb(36,36,36)", "tickwidth": 2, "outlinewidth": 0 } } } ], "contourcarpet": [ { "type": "contourcarpet", "colorbar": { "ticks": "outside", "ticklen": 8, "tickcolor": "rgb(36,36,36)", "tickwidth": 2, "outlinewidth": 0 } } ], "scattercarpet": [ { "type": "scattercarpet", "marker": { "colorbar": { "ticks": "outside", "ticklen": 8, "tickcolor": "rgb(36,36,36)", "tickwidth": 2, "outlinewidth": 0 } } } ], "scattermapbox": [ { "type": "scattermapbox", "marker": { "colorbar": { "ticks": "outside", "ticklen": 8, "tickcolor": "rgb(36,36,36)", "tickwidth": 2, "outlinewidth": 0 } } } ], "scatterpolargl": [ { "type": "scatterpolargl", "marker": { "colorbar": { "ticks": "outside", "ticklen": 8, "tickcolor": "rgb(36,36,36)", "tickwidth": 2, "outlinewidth": 0 } } } ], "scatterternary": [ { "type": "scatterternary", "marker": { "colorbar": { "ticks": "outside", "ticklen": 8, "tickcolor": "rgb(36,36,36)", "tickwidth": 2, "outlinewidth": 0 } } } ], "histogram2dcontour": [ { "type": "histogram2dcontour", "colorbar": { "ticks": "outside", "ticklen": 8, "tickcolor": "rgb(36,36,36)", "tickwidth": 2, "outlinewidth": 0 }, "autocolorscale": true } ] }, "layout": { "geo": { "bgcolor": "white", "showland": true, "lakecolor": "white", "landcolor": "rgb(234,234,242)", "showlakes": true, "subunitcolor": "white" }, "font": { "color": "rgb(36,36,36)" }, "polar": { "bgcolor": "rgb(234,234,242)", "radialaxis": { "ticks": "", "showgrid": true, "gridcolor": "white", "linecolor": "white" }, "angularaxis": { "ticks": "", "showgrid": true, "gridcolor": "white", "linecolor": "white" } }, "scene": { "xaxis": { "ticks": "", "showgrid": true, "gridcolor": "white", "gridwidth": 2, "linecolor": "white", "zerolinecolor": "white", "showbackground": true, "backgroundcolor": "rgb(234,234,242)" }, "yaxis": { "ticks": "", "showgrid": true, "gridcolor": "white", "gridwidth": 2, "linecolor": "white", "zerolinecolor": "white", "showbackground": true, "backgroundcolor": "rgb(234,234,242)" }, "zaxis": { "ticks": "", "showgrid": true, "gridcolor": "white", "gridwidth": 2, "linecolor": "white", "zerolinecolor": "white", "showbackground": true, "backgroundcolor": "rgb(234,234,242)" } }, "xaxis": { "ticks": "", "showgrid": true, "gridcolor": "white", "linecolor": "white", "automargin": true, "zerolinecolor": "white" }, "yaxis": { "ticks": "", "showgrid": true, "gridcolor": "white", "linecolor": "white", "automargin": true, "zerolinecolor": "white" }, "ternary": { "aaxis": { "ticks": "", "showgrid": true, "gridcolor": "white", "linecolor": "white" }, "baxis": { "ticks": "", "showgrid": true, "gridcolor": "white", "linecolor": "white" }, "caxis": { "ticks": "", "showgrid": true, "gridcolor": "white", "linecolor": "white" }, "bgcolor": "rgb(234,234,242)" }, "colorway": [ "rgb(76,114,176)", "rgb(221,132,82)", "rgb(85,168,104)", "rgb(196,78,82)", "rgb(129,114,179)", "rgb(147,120,96)", "rgb(218,139,195)", "rgb(140,140,140)", "rgb(204,185,116)", "rgb(100,181,205)" ], "hovermode": "closest", "colorscale": { "diverging": [ [ 0, "#67001f" ], [ 0.1, "#b2182b" ], [ 0.2, "#d6604d" ], [ 0.3, "#f4a582" ], [ 0.4, "#fddbc7" ], [ 0.5, "#f7f7f7" ], [ 0.6, "#d1e5f0" ], [ 0.7, "#92c5de" ], [ 0.8, "#4393c3" ], [ 0.9, "#2166ac" ], [ 1, "#053061" ] ], "sequential": [ [ 0, "rgb(2,4,25)" ], [ 0.06274509803921569, "rgb(24,15,41)" ], [ 0.12549019607843137, "rgb(47,23,57)" ], [ 0.18823529411764706, "rgb(71,28,72)" ], [ 0.25098039215686274, "rgb(97,30,82)" ], [ 0.3137254901960784, "rgb(123,30,89)" ], [ 0.3764705882352941, "rgb(150,27,91)" ], [ 0.4392156862745098, "rgb(177,22,88)" ], [ 0.5019607843137255, "rgb(203,26,79)" ], [ 0.5647058823529412, "rgb(223,47,67)" ], [ 0.6274509803921569, "rgb(236,76,61)" ], [ 0.6901960784313725, "rgb(242,107,73)" ], [ 0.7529411764705882, "rgb(244,135,95)" ], [ 0.8156862745098039, "rgb(245,162,122)" ], [ 0.8784313725490196, "rgb(246,188,153)" ], [ 0.9411764705882353, "rgb(247,212,187)" ], [ 1, "rgb(250,234,220)" ] ], "sequentialminus": [ [ 0, "rgb(2,4,25)" ], [ 0.06274509803921569, "rgb(24,15,41)" ], [ 0.12549019607843137, "rgb(47,23,57)" ], [ 0.18823529411764706, "rgb(71,28,72)" ], [ 0.25098039215686274, "rgb(97,30,82)" ], [ 0.3137254901960784, "rgb(123,30,89)" ], [ 0.3764705882352941, "rgb(150,27,91)" ], [ 0.4392156862745098, "rgb(177,22,88)" ], [ 0.5019607843137255, "rgb(203,26,79)" ], [ 0.5647058823529412, "rgb(223,47,67)" ], [ 0.6274509803921569, "rgb(236,76,61)" ], [ 0.6901960784313725, "rgb(242,107,73)" ], [ 0.7529411764705882, "rgb(244,135,95)" ], [ 0.8156862745098039, "rgb(245,162,122)" ], [ 0.8784313725490196, "rgb(246,188,153)" ], [ 0.9411764705882353, "rgb(247,212,187)" ], [ 1, "rgb(250,234,220)" ] ] }, "plot_bgcolor": "rgb(234,234,242)", "paper_bgcolor": "white", "shapedefaults": { "line": { "width": 0 }, "opacity": 0.5, "fillcolor": "rgb(67,103,167)" }, "annotationdefaults": { "arrowcolor": "rgb(67,103,167)" } }, "themeRef": "SEABORN" }, "showlegend": true } }, "height": null, "width": null, "user": { "profile_url": "https://chart-studio.plotly.com/~eey575", "avatar_url": "https://storage.googleapis.com/plotly-prod-profiles/63.jpg", "background_url": "https://storage.googleapis.com/plotly-prod-profiles/bg-4.jpg", "bio": "", "nickname": "", "website": "", "stream_tokens": null, "feature_set_id": null, "csrf_token": null, "date_joined": "2024-04-05 09:08:21", "mapbox_access_tokens": null, "has_password": null, "username": "eey575", "email": null, "is_active": null, "readonly": null, "is_dash_creator": null, "dash_created_count": null, "is_chart_creator": null, "charts_created_count": null } }, { "creation_time": "2024-04-05T15:11:45.038074Z", "comments": { "results": [], "count": 0 }, "parented": true, "embed_url": "https://chart-studio.plotly.com/~lviktor/102.embed", "fid": "lviktor:102", "filename": "Imports 4410 .html", "filetype": "plot", "img_url": "https://storage.googleapis.com/plotly-prod-images/lviktor/102/9_LBL55C6HU91L8PDDB71T3REFMQ26ZK.png", "image_urls": { "default": "https://storage.googleapis.com/plotly-prod-images/lviktor/102/2_J8U72HRYG0U0MOH27KNTYS0XXQWZ48.png", "block-thumb": "https://storage.googleapis.com/plotly-prod-images/lviktor/102/8_T3556B8HMZAHV35GTUNZ13Q4VJ7ND8.png", "list-thumb": "https://storage.googleapis.com/plotly-prod-images/lviktor/102/9_LBL55C6HU91L8PDDB71T3REFMQ26ZK.png" }, "api_urls": { "files": "https://api.plotly.com/v2/files/lviktor:102", "plots": "https://api.plotly.com/v2/plots/lviktor:102", "parent": "https://api.plotly.com/v2/folders/home?user=lviktor" }, "owner": "lviktor", "parent": -1, "preview": "", "referencers": [], "references": [], "title": "", "views": 1, "web_url": "https://chart-studio.plotly.com/~lviktor/102/", "world_readable": true, "date_modified": "2024-04-08T07:49:45.458Z", "stars": { "results": [], "count": 0 }, "collaborators": { "results": [], "count": 0 }, "subfolder_count": null, "refresh_interval": null, "organize_view_url": "https://chart-studio.plotly.com/~lviktor/102/", "current_user_permission": "read", "is_theme": null, "is_template": null, "autosize": true, "caption": "", "figure": { "data": [ { "type": "choropleth", "zsrc": "lviktor:113:8fb362", "geojson": "https://raw.githubusercontent.com/python-visualization/folium/master/examples/data/world-countries.json", "showscale": false, "colorscale": [ [ 0.0, "rgba(228, 26, 28, 0.5)" ], [ 0.022727272727272728, "rgba(55, 126, 184, 0.5)" ], [ 0.045454545454545456, "rgba(77, 175, 74, 0.5)" ], [ 0.06818181818181818, "rgba(255, 127, 0, 0.5)" ], [ 0.09090909090909091, "rgba(152, 78, 163, 0.5)" ], [ 0.11363636363636363, "rgba(255, 255, 51, 0.5)" ], [ 0.13636363636363635, "rgba(166, 86, 40, 0.5)" ], [ 0.1590909090909091, "rgba(247, 129, 191, 0.5)" ], [ 0.18181818181818182, "rgba(153, 153, 153, 0.5)" ], [ 0.20454545454545456, "rgba(102, 194, 165, 0.5)" ], [ 0.22727272727272727, "rgba(140, 86, 75, 0.5)" ], [ 0.25, "rgba(178, 223, 138, 0.5)" ], [ 0.2727272727272727, "rgba(251, 154, 153, 0.5)" ], [ 0.29545454545454547, "rgba(227, 26, 28, 0.5)" ], [ 0.3181818181818182, "rgba(253, 191, 111, 0.5)" ], [ 0.3409090909090909, "rgba(255, 127, 0, 0.5)" ], [ 0.36363636363636365, "rgba(202, 178, 214, 0.5)" ], [ 0.38636363636363635, "rgba(106, 61, 154, 0.5)" ], [ 0.4090909090909091, "rgba(255, 255, 153, 0.5)" ], [ 0.4318181818181818, "rgba(177, 89, 40, 0.5)" ], [ 0.45454545454545453, "rgba(247, 129, 191, 0.5)" ], [ 0.4772727272727273, "rgba(255, 127, 0, 0.5)" ], [ 0.5, "rgba(166, 206, 227, 0.5)" ], [ 0.5227272727272727, "rgba(31, 120, 180, 0.5)" ], [ 0.5454545454545454, "rgba(178, 223, 138, 0.5)" ], [ 0.5681818181818182, "rgba(51, 160, 44, 0.5)" ], [ 0.5909090909090909, "rgba(251, 154, 153, 0.5)" ], [ 0.6136363636363636, "rgba(255, 127, 0, 0.5)" ], [ 0.6363636363636364, "rgba(106, 61, 154, 0.5)" ], [ 0.6590909090909091, "rgba(128, 26, 28, 0.5)" ], [ 0.6818181818181818, "rgba(55, 126, 184, 0.5)" ], [ 0.7045454545454546, "rgba(152, 78, 163, 0.5)" ], [ 0.7272727272727273, "rgba(247, 129, 191, 0.5)" ], [ 0.75, "rgba(255, 127, 0, 0.5)" ], [ 0.7727272727272727, "rgba(255, 255, 255, 0.5)" ], [ 0.7954545454545454, "rgba(253, 191, 111, 0.5)" ], [ 0.8181818181818182, "rgba(178, 223, 138, 0.5)" ], [ 0.8409090909090909, "rgba(255, 127, 0, 0.5)" ], [ 0.8636363636363636, "rgba(202, 178, 214, 0.5)" ], [ 0.8863636363636364, "rgba(102, 194, 165, 0.5)" ], [ 0.9090909090909091, "rgba(255, 127, 0, 0.5)" ], [ 0.9318181818181818, "rgba(140, 86, 75, 0.5)" ], [ 0.9545454545454546, "rgba(177, 89, 40, 0.5)" ], [ 0.9772727272727273, "rgba(106, 61, 154, 0.5)" ], [ 1.0, "rgba(255, 255, 153, 0.5)" ] ], "locationssrc": "lviktor:113:2bb48e" }, { "mode": "markers", "name": "BEL Tot.: 500708 Tons", "text": "BEL Tot.: 500708 Tons", "type": "scattergeo", "latsrc": "lviktor:113:8590af", "lonsrc": "lviktor:113:971a66", "marker": { "line": { "width": 0 }, "size": 5.00708, "color": "rgb(152, 78, 163)", "opacity": 1 }, "hoverinfo": "text", "locationmode": "country names" }, { "mode": "markers", "name": "IRL Tot.: 70488 Tons", "text": "IRL Tot.: 70488 Tons", "type": "scattergeo", "latsrc": "lviktor:113:c361f7", "lonsrc": "lviktor:113:1a96ec", "marker": { "line": { "width": 0 }, "size": 0.7048800000000001, "color": "rgb(255, 255, 153)", "opacity": 1 }, "hoverinfo": "text", "locationmode": "country names" }, { "mode": "markers", "name": "FRA Tot.: 486797 Tons", "text": "FRA Tot.: 486797 Tons", "type": "scattergeo", "latsrc": "lviktor:113:fffb49", "lonsrc": "lviktor:113:e90808", "marker": { "line": { "width": 0 }, "size": 4.867970000000001, "color": "rgb(227, 26, 28)", "opacity": 1 }, "hoverinfo": "text", "locationmode": "country names" }, { "mode": "markers", "name": "LUX Tot.: 41442 Tons", "text": "LUX Tot.: 41442 Tons", "type": "scattergeo", "latsrc": "lviktor:113:eaf8cb", "lonsrc": "lviktor:113:9e5af0", "marker": { "line": { "width": 0 }, "size": 0.41442, "color": "rgb(31, 120, 180)", "opacity": 1 }, "hoverinfo": "text", "locationmode": "country names" }, { "mode": "markers", "name": "GRC Tot.: 129627 Tons", "text": "GRC Tot.: 129627 Tons", "type": "scattergeo", "latsrc": "lviktor:113:57fb1e", "lonsrc": "lviktor:113:fa9d25", "marker": { "line": { "width": 0 }, "size": 1.29627, "color": "rgb(255, 127, 0)", "opacity": 1 }, "hoverinfo": "text", "locationmode": "country names" }, { "mode": "markers", "name": "CYP Tot.: 39095 Tons", "text": "CYP Tot.: 39095 Tons", "type": "scattergeo", "latsrc": "lviktor:113:025111", "lonsrc": "lviktor:113:8ea7f4", "marker": { "line": { "width": 0 }, "size": 0.39095, "color": "rgb(153, 153, 153)", "opacity": 1 }, "hoverinfo": "text", "locationmode": "country names" }, { "mode": "markers", "name": "AUT Tot.: 299852 Tons", "text": "AUT Tot.: 299852 Tons", "type": "scattergeo", "latsrc": "lviktor:113:7edbf3", "lonsrc": "lviktor:113:c48982", "marker": { "line": { "width": 0 }, "size": 2.99852, "color": "rgb(77, 175, 74)", "opacity": 1 }, "hoverinfo": "text", "locationmode": "country names" }, { "mode": "markers", "name": "PRT Tot.: 182196 Tons", "text": "PRT Tot.: 182196 Tons", "type": "scattergeo", "latsrc": "lviktor:113:178cf5", "lonsrc": "lviktor:113:e7ceb3", "marker": { "line": { "width": 0 }, "size": 1.8219600000000002, "color": "rgb(247, 129, 191)", "opacity": 1 }, "hoverinfo": "text", "locationmode": "country names" }, { "mode": "markers", "name": "GBR Tot.: 621053 Tons", "text": "GBR Tot.: 621053 Tons", "type": "scattergeo", "latsrc": "lviktor:113:aeea0c", "lonsrc": "lviktor:113:92d07c", "marker": { "line": { "width": 0 }, "size": 6.21053, "color": "rgb(106, 61, 154)", "opacity": 1 }, "hoverinfo": "text", "locationmode": "country names" }, { "mode": "markers", "name": "BGR Tot.: 130148 Tons", "text": "BGR Tot.: 130148 Tons", "type": "scattergeo", "latsrc": "lviktor:113:165c71", "lonsrc": "lviktor:113:5dcab5", "marker": { "line": { "width": 0 }, "size": 1.3014800000000002, "color": "rgb(166, 86, 40)", "opacity": 1 }, "hoverinfo": "text", "locationmode": "country names" }, { "mode": "markers", "name": "POL Tot.: 1026876 Tons", "text": "POL Tot.: 1026876 Tons", "type": "scattergeo", "latsrc": "lviktor:113:f5109d", "lonsrc": "lviktor:113:32ddad", "marker": { "line": { "width": 0 }, "size": 10.26876, "color": "rgb(152, 78, 163)", "opacity": 1 }, "hoverinfo": "text", "locationmode": "country names" }, { "mode": "markers", "name": "EST Tot.: 75914 Tons", "text": "EST Tot.: 75914 Tons", "type": "scattergeo", "latsrc": "lviktor:113:7a7e4c", "lonsrc": "lviktor:113:077a75", "marker": { "line": { "width": 0 }, "size": 0.75914, "color": "rgb(178, 223, 138)", "opacity": 1 }, "hoverinfo": "text", "locationmode": "country names" }, { "mode": "markers", "name": "NOR Tot.: 58940 Tons", "text": "NOR Tot.: 58940 Tons", "type": "scattergeo", "latsrc": "lviktor:113:19553b", "lonsrc": "lviktor:113:5dd59d", "marker": { "line": { "width": 0 }, "size": 0.5894, "color": "rgb(55, 126, 184)", "opacity": 1 }, "hoverinfo": "text", "locationmode": "country names" }, { "mode": "markers", "name": "SWE Tot.: 346544 Tons", "text": "SWE Tot.: 346544 Tons", "type": "scattergeo", "latsrc": "lviktor:113:4ca5ac", "lonsrc": "lviktor:113:a1871f", "marker": { "line": { "width": 0 }, "size": 3.46544, "color": "rgb(255, 127, 0)", "opacity": 1 }, "hoverinfo": "text", "locationmode": "country names" }, { "mode": "markers", "name": "DNK Tot.: 262631 Tons", "text": "DNK Tot.: 262631 Tons", "type": "scattergeo", "latsrc": "lviktor:113:a81d14", "lonsrc": "lviktor:113:bccc6b", "marker": { "line": { "width": 0 }, "size": 2.62631, "color": "rgb(140, 86, 75)", "opacity": 1 }, "hoverinfo": "text", "locationmode": "country names" }, { "mode": "markers", "name": "SRB Tot.: 148363 Tons", "text": "SRB Tot.: 148363 Tons", "type": "scattergeo", "latsrc": "lviktor:113:9ce5db", "lonsrc": "lviktor:113:ab692a", "marker": { "line": { "width": 0 }, "size": 1.4836300000000002, "color": "rgb(178, 223, 138)", "opacity": 1 }, "hoverinfo": "text", "locationmode": "country names" }, { "mode": "markers", "name": "CHE Tot.: 126094 Tons", "text": "CHE Tot.: 126094 Tons", "type": "scattergeo", "latsrc": "lviktor:113:f948ed", "lonsrc": "lviktor:113:3acd24", "marker": { "line": { "width": 0 }, "size": 1.2609400000000002, "color": "rgb(140, 86, 75)", "opacity": 1 }, "hoverinfo": "text", "locationmode": "country names" }, { "mode": "markers", "name": "LTU Tot.: 310555 Tons", "text": "LTU Tot.: 310555 Tons", "type": "scattergeo", "latsrc": "lviktor:113:c62e9b", "lonsrc": "lviktor:113:6b3e8d", "marker": { "line": { "width": 0 }, "size": 3.10555, "color": "rgb(166, 206, 227)", "opacity": 1 }, "hoverinfo": "text", "locationmode": "country names" }, { "mode": "markers", "name": "SVN Tot.: 113855 Tons", "text": "SVN Tot.: 113855 Tons", "type": "scattergeo", "latsrc": "lviktor:113:adad83", "lonsrc": "lviktor:113:f86a11", "marker": { "line": { "width": 0 }, "size": 1.1385500000000002, "color": "rgb(202, 178, 214)", "opacity": 1 }, "hoverinfo": "text", "locationmode": "country names" }, { "mode": "markers", "name": "DEU Tot.: 1729404 Tons", "text": "DEU Tot.: 1729404 Tons", "type": "scattergeo", "latsrc": "lviktor:113:c1f99f", "lonsrc": "lviktor:113:bceddf", "marker": { "line": { "width": 0 }, "size": 17.294040000000003, "color": "rgb(253, 191, 111)", "opacity": 1 }, "hoverinfo": "text", "locationmode": "country names" }, { "mode": "markers", "name": "FIN Tot.: 90141 Tons", "text": "FIN Tot.: 90141 Tons", "type": "scattergeo", "latsrc": "lviktor:113:aca2d9", "lonsrc": "lviktor:113:039d60", "marker": { "line": { "width": 0 }, "size": 0.90141, "color": "rgb(251, 154, 153)", "opacity": 1 }, "hoverinfo": "text", "locationmode": "country names" }, { "mode": "markers", "name": "SVK Tot.: 161937 Tons", "text": "SVK Tot.: 161937 Tons", "type": "scattergeo", "latsrc": "lviktor:113:d853be", "lonsrc": "lviktor:113:448999", "marker": { "line": { "width": 0 }, "size": 1.6193700000000002, "color": "rgb(255, 127, 0)", "opacity": 1 }, "hoverinfo": "text", "locationmode": "country names" }, { "mode": "markers", "name": "ITA Tot.: 816287 Tons", "text": "ITA Tot.: 816287 Tons", "type": "scattergeo", "latsrc": "lviktor:113:5f24bb", "lonsrc": "lviktor:113:f36fb6", "marker": { "line": { "width": 0 }, "size": 8.16287, "color": "rgb(177, 89, 40)", "opacity": 1 }, "hoverinfo": "text", "locationmode": "country names" }, { "mode": "markers", "name": "LVA Tot.: 90083 Tons", "text": "LVA Tot.: 90083 Tons", "type": "scattergeo", "latsrc": "lviktor:113:e8b802", "lonsrc": "lviktor:113:bb5924", "marker": { "line": { "width": 0 }, "size": 0.90083, "color": "rgb(247, 129, 191)", "opacity": 1 }, "hoverinfo": "text", "locationmode": "country names" }, { "mode": "markers", "name": "NLD Tot.: 837834 Tons", "text": "NLD Tot.: 837834 Tons", "type": "scattergeo", "latsrc": "lviktor:113:e4cf77", "lonsrc": "lviktor:113:ab11bc", "marker": { "line": { "width": 0 }, "size": 8.378340000000001, "color": "rgb(128, 26, 28)", "opacity": 1 }, "hoverinfo": "text", "locationmode": "country names" }, { "mode": "markers", "name": "UKR Tot.: 29440 Tons", "text": "UKR Tot.: 29440 Tons", "type": "scattergeo", "latsrc": "lviktor:113:50754a", "lonsrc": "lviktor:113:f07e0b", "marker": { "line": { "width": 0 }, "size": 0.29440000000000005, "color": "rgb(177, 89, 40)", "opacity": 1 }, "hoverinfo": "text", "locationmode": "country names" }, { "mode": "markers", "name": "ROU Tot.: 222370 Tons", "text": "ROU Tot.: 222370 Tons", "type": "scattergeo", "latsrc": "lviktor:113:4ade06", "lonsrc": "lviktor:113:68bdee", "marker": { "line": { "width": 0 }, "size": 2.2237, "color": "rgb(255, 127, 0)", "opacity": 1 }, "hoverinfo": "text", "locationmode": "country names" }, { "mode": "markers", "name": "HRV Tot.: 107133 Tons", "text": "HRV Tot.: 107133 Tons", "type": "scattergeo", "latsrc": "lviktor:113:2a8369", "lonsrc": "lviktor:113:80f171", "marker": { "line": { "width": 0 }, "size": 1.0713300000000001, "color": "rgb(247, 129, 191)", "opacity": 1 }, "hoverinfo": "text", "locationmode": "country names" }, { "mode": "markers", "name": "BIH Tot.: 116004 Tons", "text": "BIH Tot.: 116004 Tons", "type": "scattergeo", "latsrc": "lviktor:113:8d9d22", "lonsrc": "lviktor:113:2c9b35", "marker": { "line": { "width": 0 }, "size": 1.1600400000000002, "color": "rgb(255, 255, 51)", "opacity": 1 }, "hoverinfo": "text", "locationmode": "country names" }, { "mode": "markers", "name": "CZE Tot.: 298337 Tons", "text": "CZE Tot.: 298337 Tons", "type": "scattergeo", "latsrc": "lviktor:113:e365d0", "lonsrc": "lviktor:113:9115cc", "marker": { "line": { "width": 0 }, "size": 2.9833700000000003, "color": "rgb(102, 194, 165)", "opacity": 1 }, "hoverinfo": "text", "locationmode": "country names" }, { "mode": "markers", "name": "ESP Tot.: 419432 Tons", "text": "ESP Tot.: 419432 Tons", "type": "scattergeo", "latsrc": "lviktor:113:d7c445", "lonsrc": "lviktor:113:6df812", "marker": { "line": { "width": 0 }, "size": 4.19432, "color": "rgb(102, 194, 165)", "opacity": 1 }, "hoverinfo": "text", "locationmode": "country names" }, { "line": { "color": "rgb(152, 78, 163)", "width": 2.6288500000000004 }, "mode": "lines+markers", "name": "BEL to Germany: 262885 Tons", "text": "BEL to Germany: 262885 Tons", "type": "scattergeo", "latsrc": "lviktor:113:0cf909", "lonsrc": "lviktor:113:84e90b", "marker": { "line": { "width": 0 }, "angle": 79.5659832094671, "color": "rgb(152, 78, 163)", "symbol": "circle", "opacity": 1, "sizesrc": "lviktor:113:9f2103" }, "hoverinfo": "text", "locationmode": "country names" }, { "line": { "color": "rgb(152, 78, 163)", "width": 1.37111 }, "mode": "lines+markers", "name": "BEL to France: 137111 Tons", "text": "BEL to France: 137111 Tons", "type": "scattergeo", "latsrc": "lviktor:113:baf6ce", "lonsrc": "lviktor:113:1e4edb", "marker": { "line": { "width": 0 }, "angle": -158.0804610558197, "color": "rgb(152, 78, 163)", "symbol": "circle", "opacity": 1, "sizesrc": "lviktor:113:1155d8" }, "hoverinfo": "text", "locationmode": "country names" }, { "line": { "color": "rgb(227, 26, 28)", "width": 1.7542000000000002 }, "mode": "lines+markers", "name": "FRA to Belgium: 175420 Tons", "text": "FRA to Belgium: 175420 Tons", "type": "scattergeo", "latsrc": "lviktor:113:f4d773", "lonsrc": "lviktor:113:909507", "marker": { "line": { "width": 0 }, "angle": 19.92606228040455, "color": "rgb(227, 26, 28)", "symbol": "circle", "opacity": 1, "sizesrc": "lviktor:113:936bfd" }, "hoverinfo": "text", "locationmode": "country names" }, { "line": { "color": "rgb(227, 26, 28)", "width": 1.17043 }, "mode": "lines+markers", "name": "FRA to Germany: 117043 Tons", "text": "FRA to Germany: 117043 Tons", "type": "scattergeo", "latsrc": "lviktor:113:895326", "lonsrc": "lviktor:113:109c5a", "marker": { "line": { "width": 0 }, "angle": 44.150895851293, "color": "rgb(227, 26, 28)", "symbol": "circle", "opacity": 1, "sizesrc": "lviktor:113:69e68f" }, "hoverinfo": "text", "locationmode": "country names" }, { "line": { "color": "rgb(255, 127, 0)", "width": 0.67622 }, "mode": "lines+markers", "name": "GRC to Bulgaria: 67622 Tons", "text": "GRC to Bulgaria: 67622 Tons", "type": "scattergeo", "latsrc": "lviktor:113:1cd615", "lonsrc": "lviktor:113:5f8a48", "marker": { "line": { "width": 0 }, "angle": 31.746972027673394, "color": "rgb(255, 127, 0)", "symbol": "circle", "opacity": 1, "sizesrc": "lviktor:113:60b4b0" }, "hoverinfo": "text", "locationmode": "country names" }, { "line": { "color": "rgb(77, 175, 74)", "width": 0.9997 }, "mode": "lines+markers", "name": "AUT to Germany: 99970 Tons", "text": "AUT to Germany: 99970 Tons", "type": "scattergeo", "latsrc": "lviktor:113:fdc29c", "lonsrc": "lviktor:113:f59b4c", "marker": { "line": { "width": 0 }, "angle": -32.838568384491424, "color": "rgb(77, 175, 74)", "symbol": "circle", "opacity": 1, "sizesrc": "lviktor:113:cb088d" }, "hoverinfo": "text", "locationmode": "country names" }, { "line": { "color": "rgb(77, 175, 74)", "width": 0.6323700000000001 }, "mode": "lines+markers", "name": "AUT to Czech Republic: 63237 Tons", "text": "AUT to Czech Republic: 63237 Tons", "type": "scattergeo", "latsrc": "lviktor:113:a7648b", "lonsrc": "lviktor:113:63566c", "marker": { "line": { "width": 0 }, "angle": 20.231308838025228, "color": "rgb(77, 175, 74)", "symbol": "circle", "opacity": 1, "sizesrc": "lviktor:113:5b503e" }, "hoverinfo": "text", "locationmode": "country names" }, { "line": { "color": "rgb(247, 129, 191)", "width": 1.2190100000000001 }, "mode": "lines+markers", "name": "PRT to Spain: 121901 Tons", "text": "PRT to Spain: 121901 Tons", "type": "scattergeo", "latsrc": "lviktor:113:e4d150", "lonsrc": "lviktor:113:54868b", "marker": { "line": { "width": 0 }, "angle": 79.49004289093159, "color": "rgb(247, 129, 191)", "symbol": "circle", "opacity": 1, "sizesrc": "lviktor:113:38826e" }, "hoverinfo": "text", "locationmode": "country names" }, { "line": { "color": "rgb(106, 61, 154)", "width": 1.33498 }, "mode": "lines+markers", "name": "GBR to Germany: 133498 Tons", "text": "GBR to Germany: 133498 Tons", "type": "scattergeo", "latsrc": "lviktor:113:5cc530", "lonsrc": "lviktor:113:546d50", "marker": { "line": { "width": 0 }, "angle": 105.50772521887268, "color": "rgb(106, 61, 154)", "symbol": "circle", "opacity": 1, "sizesrc": "lviktor:113:d8c672" }, "hoverinfo": "text", "locationmode": "country names" }, { "line": { "color": "rgb(106, 61, 154)", "width": 1.05228 }, "mode": "lines+markers", "name": "GBR to France: 105228 Tons", "text": "GBR to France: 105228 Tons", "type": "scattergeo", "latsrc": "lviktor:113:8a0104", "lonsrc": "lviktor:113:c83fe5", "marker": { "line": { "width": 0 }, "angle": 160.62647944713524, "color": "rgb(106, 61, 154)", "symbol": "circle", "opacity": 1, "sizesrc": "lviktor:113:9e02ba" }, "hoverinfo": "text", "locationmode": "country names" }, { "line": { "color": "rgb(106, 61, 154)", "width": 0.83311 }, "mode": "lines+markers", "name": "GBR to Ireland: 83311 Tons", "text": "GBR to Ireland: 83311 Tons", "type": "scattergeo", "latsrc": "lviktor:113:dbb847", "lonsrc": "lviktor:113:9de606", "marker": { "line": { "width": 0 }, "angle": -100.27927028869813, "color": "rgb(106, 61, 154)", "symbol": "circle", "opacity": 1, "sizesrc": "lviktor:113:292508" }, "hoverinfo": "text", "locationmode": "country names" }, { "line": { "color": "rgb(106, 61, 154)", "width": 0.60067 }, "mode": "lines+markers", "name": "GBR to Belgium: 60067 Tons", "text": "GBR to Belgium: 60067 Tons", "type": "scattergeo", "latsrc": "lviktor:113:bea018", "lonsrc": "lviktor:113:1c2680", "marker": { "line": { "width": 0 }, "angle": 126.82818229303837, "color": "rgb(106, 61, 154)", "symbol": "circle", "opacity": 1, "sizesrc": "lviktor:113:147bae" }, "hoverinfo": "text", "locationmode": "country names" }, { "line": { "color": "rgb(106, 61, 154)", "width": 0.54869 }, "mode": "lines+markers", "name": "GBR to Portugal: 54869 Tons", "text": "GBR to Portugal: 54869 Tons", "type": "scattergeo", "latsrc": "lviktor:113:37b9b5", "lonsrc": "lviktor:113:320c26", "marker": { "line": { "width": 0 }, "angle": -161.9130644011465, "color": "rgb(106, 61, 154)", "symbol": "circle", "opacity": 1, "sizesrc": "lviktor:113:bbd4de" }, "hoverinfo": "text", "locationmode": "country names" }, { "line": { "color": "rgb(152, 78, 163)", "width": 3.02138 }, "mode": "lines+markers", "name": "POL to Germany: 302138 Tons", "text": "POL to Germany: 302138 Tons", "type": "scattergeo", "latsrc": "lviktor:113:9dc4e5", "lonsrc": "lviktor:113:6680de", "marker": { "line": { "width": 0 }, "angle": -94.24163714076593, "color": "rgb(152, 78, 163)", "symbol": "circle", "opacity": 1, "sizesrc": "lviktor:113:ad1694" }, "hoverinfo": "text", "locationmode": "country names" }, { "line": { "color": "rgb(152, 78, 163)", "width": 1.62515 }, "mode": "lines+markers", "name": "POL to Slovakia: 162515 Tons", "text": "POL to Slovakia: 162515 Tons", "type": "scattergeo", "latsrc": "lviktor:113:f5ff07", "lonsrc": "lviktor:113:148e62", "marker": { "line": { "width": 0 }, "angle": -176.58250611971295, "color": "rgb(152, 78, 163)", "symbol": "circle", "opacity": 1, "sizesrc": "lviktor:113:e17568" }, "hoverinfo": "text", "locationmode": "country names" }, { "line": { "color": "rgb(152, 78, 163)", "width": 1.2936800000000002 }, "mode": "lines+markers", "name": "POL to Belarus: 129368 Tons", "text": "POL to Belarus: 129368 Tons", "type": "scattergeo", "latsrc": "lviktor:113:2a5d60", "lonsrc": "lviktor:113:e3aea2", "marker": { "line": { "width": 0 }, "angle": 69.71666108654608, "color": "rgb(152, 78, 163)", "symbol": "circle", "opacity": 1, "sizesrc": "lviktor:113:6b274d" }, "hoverinfo": "text", "locationmode": "country names" }, { "line": { "color": "rgb(152, 78, 163)", "width": 1.22912 }, "mode": "lines+markers", "name": "POL to Ukraine: 122912 Tons", "text": "POL to Ukraine: 122912 Tons", "type": "scattergeo", "latsrc": "lviktor:113:b12198", "lonsrc": "lviktor:113:f271c2", "marker": { "line": { "width": 0 }, "angle": 106.74469357464972, "color": "rgb(152, 78, 163)", "symbol": "circle", "opacity": 1, "sizesrc": "lviktor:113:9a3d39" }, "hoverinfo": "text", "locationmode": "country names" }, { "line": { "color": "rgb(152, 78, 163)", "width": 0.52466 }, "mode": "lines+markers", "name": "POL to Romania: 52466 Tons", "text": "POL to Romania: 52466 Tons", "type": "scattergeo", "latsrc": "lviktor:113:683340", "lonsrc": "lviktor:113:99a3dd", "marker": { "line": { "width": 0 }, "angle": 149.4176559495575, "color": "rgb(152, 78, 163)", "symbol": "circle", "opacity": 1, "sizesrc": "lviktor:113:afc70b" }, "hoverinfo": "text", "locationmode": "country names" }, { "line": { "color": "rgb(255, 127, 0)", "width": 1.0433400000000002 }, "mode": "lines+markers", "name": "SWE to Germany: 104334 Tons", "text": "SWE to Germany: 104334 Tons", "type": "scattergeo", "latsrc": "lviktor:113:8a32f9", "lonsrc": "lviktor:113:ace5a2", "marker": { "line": { "width": 0 }, "angle": -165.04894798231575, "color": "rgb(255, 127, 0)", "symbol": "circle", "opacity": 1, "sizesrc": "lviktor:113:5304b3" }, "hoverinfo": "text", "locationmode": "country names" }, { "line": { "color": "rgb(255, 127, 0)", "width": 0.92422 }, "mode": "lines+markers", "name": "SWE to Norway: 92422 Tons", "text": "SWE to Norway: 92422 Tons", "type": "scattergeo", "latsrc": "lviktor:113:a9448d", "lonsrc": "lviktor:113:b4feb1", "marker": { "line": { "width": 0 }, "angle": -87.7923223076729, "color": "rgb(255, 127, 0)", "symbol": "circle", "opacity": 1, "sizesrc": "lviktor:113:d337ac" }, "hoverinfo": "text", "locationmode": "country names" }, { "line": { "color": "rgb(140, 86, 75)", "width": 0.8210000000000001 }, "mode": "lines+markers", "name": "DNK to Sweden: 82100 Tons", "text": "DNK to Sweden: 82100 Tons", "type": "scattergeo", "latsrc": "lviktor:113:46a91b", "lonsrc": "lviktor:113:5d2e4c", "marker": { "line": { "width": 0 }, "angle": 21.10539668854898, "color": "rgb(140, 86, 75)", "symbol": "circle", "opacity": 1, "sizesrc": "lviktor:113:5f2889" }, "hoverinfo": "text", "locationmode": "country names" }, { "line": { "color": "rgb(140, 86, 75)", "width": 0.8020900000000001 }, "mode": "lines+markers", "name": "DNK to Germany: 80209 Tons", "text": "DNK to Germany: 80209 Tons", "type": "scattergeo", "latsrc": "lviktor:113:6991ad", "lonsrc": "lviktor:113:ae55c0", "marker": { "line": { "width": 0 }, "angle": 176.6437063879672, "color": "rgb(140, 86, 75)", "symbol": "circle", "opacity": 1, "sizesrc": "lviktor:113:dae9ed" }, "hoverinfo": "text", "locationmode": "country names" }, { "line": { "color": "rgb(178, 223, 138)", "width": 0.7111400000000001 }, "mode": "lines+markers", "name": "SRB to Romania: 71114 Tons", "text": "SRB to Romania: 71114 Tons", "type": "scattergeo", "latsrc": "lviktor:113:e406fc", "lonsrc": "lviktor:113:c75459", "marker": { "line": { "width": 0 }, "angle": 53.333237677976115, "color": "rgb(178, 223, 138)", "symbol": "circle", "opacity": 1, "sizesrc": "lviktor:113:720655" }, "hoverinfo": "text", "locationmode": "country names" }, { "line": { "color": "rgb(140, 86, 75)", "width": 0.69684 }, "mode": "lines+markers", "name": "CHE to Germany: 69684 Tons", "text": "CHE to Germany: 69684 Tons", "type": "scattergeo", "latsrc": "lviktor:113:872752", "lonsrc": "lviktor:113:057349", "marker": { "line": { "width": 0 }, "angle": 20.159198444777843, "color": "rgb(140, 86, 75)", "symbol": "circle", "opacity": 1, "sizesrc": "lviktor:113:988b21" }, "hoverinfo": "text", "locationmode": "country names" }, { "line": { "color": "rgb(166, 206, 227)", "width": 1.22361 }, "mode": "lines+markers", "name": "LTU to Poland: 122361 Tons", "text": "LTU to Poland: 122361 Tons", "type": "scattergeo", "latsrc": "lviktor:113:268751", "lonsrc": "lviktor:113:d69194", "marker": { "line": { "width": 0 }, "angle": -147.91911427835424, "color": "rgb(166, 206, 227)", "symbol": "circle", "opacity": 1, "sizesrc": "lviktor:113:aeb0b2" }, "hoverinfo": "text", "locationmode": "country names" }, { "line": { "color": "rgb(166, 206, 227)", "width": 1.18717 }, "mode": "lines+markers", "name": "LTU to Latvia: 118717 Tons", "text": "LTU to Latvia: 118717 Tons", "type": "scattergeo", "latsrc": "lviktor:113:602f36", "lonsrc": "lviktor:113:8cc1dd", "marker": { "line": { "width": 0 }, "angle": 28.479891232062215, "color": "rgb(166, 206, 227)", "symbol": "circle", "opacity": 1, "sizesrc": "lviktor:113:023b80" }, "hoverinfo": "text", "locationmode": "country names" }, { "line": { "color": "rgb(253, 191, 111)", "width": 5.13354 }, "mode": "lines+markers", "name": "DEU to Czech Republic: 513354 Tons", "text": "DEU to Czech Republic: 513354 Tons", "type": "scattergeo", "latsrc": "lviktor:113:28da05", "lonsrc": "lviktor:113:23ca8a", "marker": { "line": { "width": 0 }, "angle": 110.9293488526323, "color": "rgb(253, 191, 111)", "symbol": "circle", "opacity": 1, "sizesrc": "lviktor:113:8e8404" }, "hoverinfo": "text", "locationmode": "country names" }, { "line": { "color": "rgb(253, 191, 111)", "width": 4.311330000000001 }, "mode": "lines+markers", "name": "DEU to Austria: 431133 Tons", "text": "DEU to Austria: 431133 Tons", "type": "scattergeo", "latsrc": "lviktor:113:aa2b27", "lonsrc": "lviktor:113:4b5bc4", "marker": { "line": { "width": 0 }, "angle": 144.3186194799946, "color": "rgb(253, 191, 111)", "symbol": "circle", "opacity": 1, "sizesrc": "lviktor:113:0da56f" }, "hoverinfo": "text", "locationmode": "country names" }, { "line": { "color": "rgb(253, 191, 111)", "width": 1.60512 }, "mode": "lines+markers", "name": "DEU to France: 160512 Tons", "text": "DEU to France: 160512 Tons", "type": "scattergeo", "latsrc": "lviktor:113:a44036", "lonsrc": "lviktor:113:b75364", "marker": { "line": { "width": 0 }, "angle": -129.49974571106284, "color": "rgb(253, 191, 111)", "symbol": "circle", "opacity": 1, "sizesrc": "lviktor:113:37c1bc" }, "hoverinfo": "text", "locationmode": "country names" }, { "line": { "color": "rgb(253, 191, 111)", "width": 1.4136300000000002 }, "mode": "lines+markers", "name": "DEU to Switzerland: 141363 Tons", "text": "DEU to Switzerland: 141363 Tons", "type": "scattergeo", "latsrc": "lviktor:113:a983fe", "lonsrc": "lviktor:113:c81187", "marker": { "line": { "width": 0 }, "angle": -157.9869614765162, "color": "rgb(253, 191, 111)", "symbol": "circle", "opacity": 1, "sizesrc": "lviktor:113:f160c6" }, "hoverinfo": "text", "locationmode": "country names" }, { "line": { "color": "rgb(253, 191, 111)", "width": 1.2615900000000002 }, "mode": "lines+markers", "name": "DEU to Poland: 126159 Tons", "text": "DEU to Poland: 126159 Tons", "type": "scattergeo", "latsrc": "lviktor:113:a0fccf", "lonsrc": "lviktor:113:e42cf5", "marker": { "line": { "width": 0 }, "angle": 78.27015656162581, "color": "rgb(253, 191, 111)", "symbol": "circle", "opacity": 1, "sizesrc": "lviktor:113:5efaf0" }, "hoverinfo": "text", "locationmode": "country names" }, { "line": { "color": "rgb(253, 191, 111)", "width": 1.26139 }, "mode": "lines+markers", "name": "DEU to Belgium: 126139 Tons", "text": "DEU to Belgium: 126139 Tons", "type": "scattergeo", "latsrc": "lviktor:113:422288", "lonsrc": "lviktor:113:3ec716", "marker": { "line": { "width": 0 }, "angle": -95.94298850401717, "color": "rgb(253, 191, 111)", "symbol": "circle", "opacity": 1, "sizesrc": "lviktor:113:567004" }, "hoverinfo": "text", "locationmode": "country names" }, { "line": { "color": "rgb(253, 191, 111)", "width": 0.6737200000000001 }, "mode": "lines+markers", "name": "DEU to Luxembourg: 67372 Tons", "text": "DEU to Luxembourg: 67372 Tons", "type": "scattergeo", "latsrc": "lviktor:113:7b6c2b", "lonsrc": "lviktor:113:fe37ef", "marker": { "line": { "width": 0 }, "angle": -114.47776826370222, "color": "rgb(253, 191, 111)", "symbol": "circle", "opacity": 1, "sizesrc": "lviktor:113:9f4f85" }, "hoverinfo": "text", "locationmode": "country names" }, { "line": { "color": "rgb(177, 89, 40)", "width": 1.5280500000000001 }, "mode": "lines+markers", "name": "ITA to Austria: 152805 Tons", "text": "ITA to Austria: 152805 Tons", "type": "scattergeo", "latsrc": "lviktor:113:0d7a3e", "lonsrc": "lviktor:113:985cec", "marker": { "line": { "width": 0 }, "angle": 10.929331045355212, "color": "rgb(177, 89, 40)", "symbol": "circle", "opacity": 1, "sizesrc": "lviktor:113:e60b33" }, "hoverinfo": "text", "locationmode": "country names" }, { "line": { "color": "rgb(177, 89, 40)", "width": 1.40144 }, "mode": "lines+markers", "name": "ITA to France: 140144 Tons", "text": "ITA to France: 140144 Tons", "type": "scattergeo", "latsrc": "lviktor:113:910772", "lonsrc": "lviktor:113:faf32e", "marker": { "line": { "width": 0 }, "angle": -64.00765553444117, "color": "rgb(177, 89, 40)", "symbol": "circle", "opacity": 1, "sizesrc": "lviktor:113:72ba37" }, "hoverinfo": "text", "locationmode": "country names" }, { "line": { "color": "rgb(177, 89, 40)", "width": 1.27611 }, "mode": "lines+markers", "name": "ITA to Hungary: 127611 Tons", "text": "ITA to Hungary: 127611 Tons", "type": "scattergeo", "latsrc": "lviktor:113:ddf7e6", "lonsrc": "lviktor:113:5e91f0", "marker": { "line": { "width": 0 }, "angle": 45.130047217220806, "color": "rgb(177, 89, 40)", "symbol": "circle", "opacity": 1, "sizesrc": "lviktor:113:1d1e3d" }, "hoverinfo": "text", "locationmode": "country names" }, { "line": { "color": "rgb(177, 89, 40)", "width": 0.7900600000000001 }, "mode": "lines+markers", "name": "ITA to Romania: 79006 Tons", "text": "ITA to Romania: 79006 Tons", "type": "scattergeo", "latsrc": "lviktor:113:94df55", "lonsrc": "lviktor:113:c0bdd1", "marker": { "line": { "width": 0 }, "angle": 65.78284897894676, "color": "rgb(177, 89, 40)", "symbol": "circle", "opacity": 1, "sizesrc": "lviktor:113:c13290" }, "hoverinfo": "text", "locationmode": "country names" }, { "line": { "color": "rgb(177, 89, 40)", "width": 0.64809 }, "mode": "lines+markers", "name": "ITA to Germany: 64809 Tons", "text": "ITA to Germany: 64809 Tons", "type": "scattergeo", "latsrc": "lviktor:113:847cac", "lonsrc": "lviktor:113:5783a8", "marker": { "line": { "width": 0 }, "angle": -10.169144238747293, "color": "rgb(177, 89, 40)", "symbol": "circle", "opacity": 1, "sizesrc": "lviktor:113:635da0" }, "hoverinfo": "text", "locationmode": "country names" }, { "line": { "color": "rgb(177, 89, 40)", "width": 0.5211 }, "mode": "lines+markers", "name": "ITA to Croatia: 52110 Tons", "text": "ITA to Croatia: 52110 Tons", "type": "scattergeo", "latsrc": "lviktor:113:80d8f0", "lonsrc": "lviktor:113:25ae3a", "marker": { "line": { "width": 0 }, "angle": 36.10870878778337, "color": "rgb(177, 89, 40)", "symbol": "circle", "opacity": 1, "sizesrc": "lviktor:113:ba2392" }, "hoverinfo": "text", "locationmode": "country names" }, { "line": { "color": "rgb(177, 89, 40)", "width": 0.5128900000000001 }, "mode": "lines+markers", "name": "ITA to Slovakia: 51289 Tons", "text": "ITA to Slovakia: 51289 Tons", "type": "scattergeo", "latsrc": "lviktor:113:fa1742", "lonsrc": "lviktor:113:45adec", "marker": { "line": { "width": 0 }, "angle": 36.965893923888075, "color": "rgb(177, 89, 40)", "symbol": "circle", "opacity": 1, "sizesrc": "lviktor:113:22a93e" }, "hoverinfo": "text", "locationmode": "country names" }, { "line": { "color": "rgb(128, 26, 28)", "width": 2.1184000000000003 }, "mode": "lines+markers", "name": "NLD to Poland: 211840 Tons", "text": "NLD to Poland: 211840 Tons", "type": "scattergeo", "latsrc": "lviktor:113:230202", "lonsrc": "lviktor:113:8b89e0", "marker": { "line": { "width": 0 }, "angle": 87.61867297408037, "color": "rgb(128, 26, 28)", "symbol": "circle", "opacity": 1, "sizesrc": "lviktor:113:a22894" }, "hoverinfo": "text", "locationmode": "country names" }, { "line": { "color": "rgb(128, 26, 28)", "width": 1.7187000000000001 }, "mode": "lines+markers", "name": "NLD to Belgium: 171870 Tons", "text": "NLD to Belgium: 171870 Tons", "type": "scattergeo", "latsrc": "lviktor:113:dcd656", "lonsrc": "lviktor:113:369e50", "marker": { "line": { "width": 0 }, "angle": -159.67074541498147, "color": "rgb(128, 26, 28)", "symbol": "circle", "opacity": 1, "sizesrc": "lviktor:113:9810b1" }, "hoverinfo": "text", "locationmode": "country names" }, { "line": { "color": "rgb(128, 26, 28)", "width": 1.43972 }, "mode": "lines+markers", "name": "NLD to United Kingdom: 143972 Tons", "text": "NLD to United Kingdom: 143972 Tons", "type": "scattergeo", "latsrc": "lviktor:113:6a6668", "lonsrc": "lviktor:113:088e62", "marker": { "line": { "width": 0 }, "angle": -68.99369265202876, "color": "rgb(128, 26, 28)", "symbol": "circle", "opacity": 1, "sizesrc": "lviktor:113:5fbb66" }, "hoverinfo": "text", "locationmode": "country names" }, { "line": { "color": "rgb(128, 26, 28)", "width": 0.7450600000000001 }, "mode": "lines+markers", "name": "NLD to Germany: 74506 Tons", "text": "NLD to Germany: 74506 Tons", "type": "scattergeo", "latsrc": "lviktor:113:bb43fe", "lonsrc": "lviktor:113:030bef", "marker": { "line": { "width": 0 }, "angle": 112.80601501357557, "color": "rgb(128, 26, 28)", "symbol": "circle", "opacity": 1, "sizesrc": "lviktor:113:15e0fe" }, "hoverinfo": "text", "locationmode": "country names" }, { "line": { "color": "rgb(255, 127, 0)", "width": 0.6971900000000001 }, "mode": "lines+markers", "name": "ROU to Hungary: 69719 Tons", "text": "ROU to Hungary: 69719 Tons", "type": "scattergeo", "latsrc": "lviktor:113:dd3518", "lonsrc": "lviktor:113:dbcc9d", "marker": { "line": { "width": 0 }, "angle": -70.91236767692764, "color": "rgb(255, 127, 0)", "symbol": "circle", "opacity": 1, "sizesrc": "lviktor:113:3c77bf" }, "hoverinfo": "text", "locationmode": "country names" }, { "line": { "color": "rgb(247, 129, 191)", "width": 0.5129 }, "mode": "lines+markers", "name": "HRV to Austria: 51290 Tons", "text": "HRV to Austria: 51290 Tons", "type": "scattergeo", "latsrc": "lviktor:113:e400b9", "lonsrc": "lviktor:113:07f1df", "marker": { "line": { "width": 0 }, "angle": -15.238206360743504, "color": "rgb(247, 129, 191)", "symbol": "circle", "opacity": 1, "sizesrc": "lviktor:113:a2a25f" }, "hoverinfo": "text", "locationmode": "country names" }, { "line": { "color": "rgb(102, 194, 165)", "width": 1.13653 }, "mode": "lines+markers", "name": "CZE to Austria: 113653 Tons", "text": "CZE to Austria: 113653 Tons", "type": "scattergeo", "latsrc": "lviktor:113:375bc9", "lonsrc": "lviktor:113:38efc7", "marker": { "line": { "width": 0 }, "angle": -158.80805127609625, "color": "rgb(102, 194, 165)", "symbol": "circle", "opacity": 1, "sizesrc": "lviktor:113:f39ba8" }, "hoverinfo": "text", "locationmode": "country names" }, { "line": { "color": "rgb(102, 194, 165)", "width": 0.7540100000000001 }, "mode": "lines+markers", "name": "CZE to Poland: 75401 Tons", "text": "CZE to Poland: 75401 Tons", "type": "scattergeo", "latsrc": "lviktor:113:cd5f79", "lonsrc": "lviktor:113:05c4dd", "marker": { "line": { "width": 0 }, "angle": 50.85800841183817, "color": "rgb(102, 194, 165)", "symbol": "circle", "opacity": 1, "sizesrc": "lviktor:113:fcdea6" }, "hoverinfo": "text", "locationmode": "country names" }, { "line": { "color": "rgb(102, 194, 165)", "width": 0.55462 }, "mode": "lines+markers", "name": "CZE to Germany: 55462 Tons", "text": "CZE to Germany: 55462 Tons", "type": "scattergeo", "latsrc": "lviktor:113:668d92", "lonsrc": "lviktor:113:7c6348", "marker": { "line": { "width": 0 }, "angle": -65.19513481819659, "color": "rgb(102, 194, 165)", "symbol": "circle", "opacity": 1, "sizesrc": "lviktor:113:dfb48d" }, "hoverinfo": "text", "locationmode": "country names" }, { "line": { "color": "rgb(102, 194, 165)", "width": 1.8542100000000001 }, "mode": "lines+markers", "name": "ESP to France: 185421 Tons", "text": "ESP to France: 185421 Tons", "type": "scattergeo", "latsrc": "lviktor:113:97e9c6", "lonsrc": "lviktor:113:3aaabe", "marker": { "line": { "width": 0 }, "angle": 34.16765535979212, "color": "rgb(102, 194, 165)", "symbol": "circle", "opacity": 1, "sizesrc": "lviktor:113:90a686" }, "hoverinfo": "text", "locationmode": "country names" }, { "line": { "color": "rgb(102, 194, 165)", "width": 1.91372 }, "mode": "lines+markers", "name": "ESP to Portugal: 191372 Tons", "text": "ESP to Portugal: 191372 Tons", "type": "scattergeo", "latsrc": "lviktor:113:e88fca", "lonsrc": "lviktor:113:8d8c03", "marker": { "line": { "width": 0 }, "angle": -97.95156255711332, "color": "rgb(102, 194, 165)", "symbol": "circle", "opacity": 1, "sizesrc": "lviktor:113:21faeb" }, "hoverinfo": "text", "locationmode": "country names" } ], "layout": { "geo": { "center": { "lat": 48, "lon": 10 }, "lataxis": { "range": [ 35, 60 ] }, "lonaxis": { "range": [ -5, 25 ] }, "showland": true, "landcolor": "rgb(243, 243, 243)", "showocean": true, "oceancolor": "rgb(215, 230, 250)", "projection": { "type": "equirectangular" }, "countrycolor": "rgb(204, 204, 204)", "showcountries": true }, "title": { "text": "Imports Volume of 4410: for European Countries" }, "template": { "data": { "bar": [ { "type": "bar", "marker": { "line": { "color": "#E5ECF6", "width": 0.5 }, "pattern": { "size": 10, "fillmode": "overlay", "solidity": 0.2 } }, "error_x": { "color": "#2a3f5f" }, "error_y": { "color": "#2a3f5f" } } ], "pie": [ { "type": "pie", "automargin": true } ], "table": [ { "type": "table", "cells": { "fill": { "color": "#EBF0F8" }, "line": { "color": "white" } }, "header": { "fill": { "color": "#C8D4E3" }, "line": { "color": "white" } } } ], "carpet": [ { "type": "carpet", "aaxis": { "gridcolor": "white", "linecolor": "white", "endlinecolor": "#2a3f5f", "minorgridcolor": "white", "startlinecolor": "#2a3f5f" }, "baxis": { "gridcolor": "white", "linecolor": "white", "endlinecolor": "#2a3f5f", "minorgridcolor": "white", "startlinecolor": "#2a3f5f" } } ], "mesh3d": [ { "type": "mesh3d", "colorbar": { "ticks": "", "outlinewidth": 0 } } ], "contour": [ { "type": "contour", "colorbar": { "ticks": "", "outlinewidth": 0 }, "colorscale": [ [ 0.0, "#0d0887" ], [ 0.1111111111111111, "#46039f" ], [ 0.2222222222222222, "#7201a8" ], [ 0.3333333333333333, "#9c179e" ], [ 0.4444444444444444, "#bd3786" ], [ 0.5555555555555556, "#d8576b" ], [ 0.6666666666666666, "#ed7953" ], [ 0.7777777777777778, "#fb9f3a" ], [ 0.8888888888888888, "#fdca26" ], [ 1.0, "#f0f921" ] ] } ], "heatmap": [ { "type": "heatmap", "colorbar": { "ticks": "", "outlinewidth": 0 }, "colorscale": [ [ 0.0, "#0d0887" ], [ 0.1111111111111111, "#46039f" ], [ 0.2222222222222222, "#7201a8" ], [ 0.3333333333333333, "#9c179e" ], [ 0.4444444444444444, "#bd3786" ], [ 0.5555555555555556, "#d8576b" ], [ 0.6666666666666666, "#ed7953" ], [ 0.7777777777777778, "#fb9f3a" ], [ 0.8888888888888888, "#fdca26" ], [ 1.0, "#f0f921" ] ] } ], "scatter": [ { "type": "scatter", "fillpattern": { "size": 10, "fillmode": "overlay", "solidity": 0.2 } } ], "surface": [ { "type": "surface", "colorbar": { "ticks": "", "outlinewidth": 0 }, "colorscale": [ [ 0.0, "#0d0887" ], [ 0.1111111111111111, "#46039f" ], [ 0.2222222222222222, "#7201a8" ], [ 0.3333333333333333, "#9c179e" ], [ 0.4444444444444444, "#bd3786" ], [ 0.5555555555555556, "#d8576b" ], [ 0.6666666666666666, "#ed7953" ], [ 0.7777777777777778, "#fb9f3a" ], [ 0.8888888888888888, "#fdca26" ], [ 1.0, "#f0f921" ] ] } ], "barpolar": [ { "type": "barpolar", "marker": { "line": { "color": "#E5ECF6", "width": 0.5 }, "pattern": { "size": 10, "fillmode": "overlay", "solidity": 0.2 } } } ], "heatmapgl": [ { "type": "heatmapgl", "colorbar": { "ticks": "", "outlinewidth": 0 }, "colorscale": [ [ 0.0, "#0d0887" ], [ 0.1111111111111111, "#46039f" ], [ 0.2222222222222222, "#7201a8" ], [ 0.3333333333333333, "#9c179e" ], [ 0.4444444444444444, "#bd3786" ], [ 0.5555555555555556, "#d8576b" ], [ 0.6666666666666666, "#ed7953" ], [ 0.7777777777777778, "#fb9f3a" ], [ 0.8888888888888888, "#fdca26" ], [ 1.0, "#f0f921" ] ] } ], "histogram": [ { "type": "histogram", "marker": { "pattern": { "size": 10, "fillmode": "overlay", "solidity": 0.2 } } } ], "parcoords": [ { "line": { "colorbar": { "ticks": "", "outlinewidth": 0 } }, "type": "parcoords" } ], "scatter3d": [ { "line": { "colorbar": { "ticks": "", "outlinewidth": 0 } }, "type": "scatter3d", "marker": { "colorbar": { "ticks": "", "outlinewidth": 0 } } } ], "scattergl": [ { "type": "scattergl", "marker": { "colorbar": { "ticks": "", "outlinewidth": 0 } } } ], "choropleth": [ { "type": "choropleth", "colorbar": { "ticks": "", "outlinewidth": 0 } } ], "scattergeo": [ { "type": "scattergeo", "marker": { "colorbar": { "ticks": "", "outlinewidth": 0 } } } ], "histogram2d": [ { "type": "histogram2d", "colorbar": { "ticks": "", "outlinewidth": 0 }, "colorscale": [ [ 0.0, "#0d0887" ], [ 0.1111111111111111, "#46039f" ], [ 0.2222222222222222, "#7201a8" ], [ 0.3333333333333333, "#9c179e" ], [ 0.4444444444444444, "#bd3786" ], [ 0.5555555555555556, "#d8576b" ], [ 0.6666666666666666, "#ed7953" ], [ 0.7777777777777778, "#fb9f3a" ], [ 0.8888888888888888, "#fdca26" ], [ 1.0, "#f0f921" ] ] } ], "scatterpolar": [ { "type": "scatterpolar", "marker": { "colorbar": { "ticks": "", "outlinewidth": 0 } } } ], "contourcarpet": [ { "type": "contourcarpet", "colorbar": { "ticks": "", "outlinewidth": 0 } } ], "scattercarpet": [ { "type": "scattercarpet", "marker": { "colorbar": { "ticks": "", "outlinewidth": 0 } } } ], "scattermapbox": [ { "type": "scattermapbox", "marker": { "colorbar": { "ticks": "", "outlinewidth": 0 } } } ], "scatterpolargl": [ { "type": "scatterpolargl", "marker": { "colorbar": { "ticks": "", "outlinewidth": 0 } } } ], "scatterternary": [ { "type": "scatterternary", "marker": { "colorbar": { "ticks": "", "outlinewidth": 0 } } } ], "histogram2dcontour": [ { "type": "histogram2dcontour", "colorbar": { "ticks": "", "outlinewidth": 0 }, "colorscale": [ [ 0.0, "#0d0887" ], [ 0.1111111111111111, "#46039f" ], [ 0.2222222222222222, "#7201a8" ], [ 0.3333333333333333, "#9c179e" ], [ 0.4444444444444444, "#bd3786" ], [ 0.5555555555555556, "#d8576b" ], [ 0.6666666666666666, "#ed7953" ], [ 0.7777777777777778, "#fb9f3a" ], [ 0.8888888888888888, "#fdca26" ], [ 1.0, "#f0f921" ] ] } ] }, "layout": { "geo": { "bgcolor": "white", "showland": true, "lakecolor": "white", "landcolor": "#E5ECF6", "showlakes": true, "subunitcolor": "white" }, "font": { "color": "#2a3f5f" }, "polar": { "bgcolor": "#E5ECF6", "radialaxis": { "ticks": "", "gridcolor": "white", "linecolor": "white" }, "angularaxis": { "ticks": "", "gridcolor": "white", "linecolor": "white" } }, "scene": { "xaxis": { "ticks": "", "gridcolor": "white", "gridwidth": 2, "linecolor": "white", "zerolinecolor": "white", "showbackground": true, "backgroundcolor": "#E5ECF6" }, "yaxis": { "ticks": "", "gridcolor": "white", "gridwidth": 2, "linecolor": "white", "zerolinecolor": "white", "showbackground": true, "backgroundcolor": "#E5ECF6" }, "zaxis": { "ticks": "", "gridcolor": "white", "gridwidth": 2, "linecolor": "white", "zerolinecolor": "white", "showbackground": true, "backgroundcolor": "#E5ECF6" } }, "title": { "x": 0.05 }, "xaxis": { "ticks": "", "title": { "standoff": 15 }, "gridcolor": "white", "linecolor": "white", "automargin": true, "zerolinecolor": "white", "zerolinewidth": 2 }, "yaxis": { "ticks": "", "title": { "standoff": 15 }, "gridcolor": "white", "linecolor": "white", "automargin": true, "zerolinecolor": "white", "zerolinewidth": 2 }, "mapbox": { "style": "light" }, "ternary": { "aaxis": { "ticks": "", "gridcolor": "white", "linecolor": "white" }, "baxis": { "ticks": "", "gridcolor": "white", "linecolor": "white" }, "caxis": { "ticks": "", "gridcolor": "white", "linecolor": "white" }, "bgcolor": "#E5ECF6" }, "colorway": [ "#636efa", "#EF553B", "#00cc96", "#ab63fa", "#FFA15A", "#19d3f3", "#FF6692", "#B6E880", "#FF97FF", "#FECB52" ], "coloraxis": { "colorbar": { "ticks": "", "outlinewidth": 0 } }, "hovermode": "closest", "colorscale": { "diverging": [ [ 0, "#8e0152" ], [ 0.1, "#c51b7d" ], [ 0.2, "#de77ae" ], [ 0.3, "#f1b6da" ], [ 0.4, "#fde0ef" ], [ 0.5, "#f7f7f7" ], [ 0.6, "#e6f5d0" ], [ 0.7, "#b8e186" ], [ 0.8, "#7fbc41" ], [ 0.9, "#4d9221" ], [ 1, "#276419" ] ], "sequential": [ [ 0.0, "#0d0887" ], [ 0.1111111111111111, "#46039f" ], [ 0.2222222222222222, "#7201a8" ], [ 0.3333333333333333, "#9c179e" ], [ 0.4444444444444444, "#bd3786" ], [ 0.5555555555555556, "#d8576b" ], [ 0.6666666666666666, "#ed7953" ], [ 0.7777777777777778, "#fb9f3a" ], [ 0.8888888888888888, "#fdca26" ], [ 1.0, "#f0f921" ] ], "sequentialminus": [ [ 0.0, "#0d0887" ], [ 0.1111111111111111, "#46039f" ], [ 0.2222222222222222, "#7201a8" ], [ 0.3333333333333333, "#9c179e" ], [ 0.4444444444444444, "#bd3786" ], [ 0.5555555555555556, "#d8576b" ], [ 0.6666666666666666, "#ed7953" ], [ 0.7777777777777778, "#fb9f3a" ], [ 0.8888888888888888, "#fdca26" ], [ 1.0, "#f0f921" ] ] }, "hoverlabel": { "align": "left" }, "plot_bgcolor": "#E5ECF6", "paper_bgcolor": "white", "shapedefaults": { "line": { "color": "#2a3f5f" } }, "autotypenumbers": "strict", "annotationdefaults": { "arrowhead": 0, "arrowcolor": "#2a3f5f", "arrowwidth": 1 } } } } }, "height": null, "width": null, "user": { "profile_url": "https://chart-studio.plotly.com/~lviktor", "avatar_url": "https://storage.googleapis.com/plotly-prod-profiles/21.jpg", "background_url": "https://storage.googleapis.com/plotly-prod-profiles/bg-3.jpg", "bio": "", "nickname": "", "website": "", "stream_tokens": null, "feature_set_id": null, "csrf_token": null, "date_joined": "2024-03-28 14:45:39", "mapbox_access_tokens": null, "has_password": null, "username": "lviktor", "email": null, "is_active": null, "readonly": null, "is_dash_creator": null, "dash_created_count": null, "is_chart_creator": null, "charts_created_count": null } }, { "creation_time": "2024-04-05T15:03:37.285111Z", "comments": { "results": [], "count": 0 }, "parented": true, "embed_url": "https://chart-studio.plotly.com/~minhanh66789/1.embed", "fid": "minhanh66789:1", "filename": "Plot 1", "filetype": "plot", "img_url": "https://storage.googleapis.com/plotly-prod-images/minhanh66789/1/9_I38LWX45YYQ2O891UZWTHI435VSVGO.png", "image_urls": { "default": "https://storage.googleapis.com/plotly-prod-images/minhanh66789/1/2_BTXPOPWV7V83853H27144L67RYABH1.png", "block-thumb": "https://storage.googleapis.com/plotly-prod-images/minhanh66789/1/8_3GZIWIM7UESRYB1IT8FCHUP98V921M.png", "list-thumb": "https://storage.googleapis.com/plotly-prod-images/minhanh66789/1/9_I38LWX45YYQ2O891UZWTHI435VSVGO.png" }, "api_urls": { "files": "https://api.plotly.com/v2/files/minhanh66789:1", "plots": "https://api.plotly.com/v2/plots/minhanh66789:1", "parent": "https://api.plotly.com/v2/folders/home?user=minhanh66789" }, "owner": "minhanh66789", "parent": -1, "preview": "", "referencers": [], "references": [], "title": "", "views": 1, "web_url": "https://chart-studio.plotly.com/~minhanh66789/1/", "world_readable": true, "date_modified": "2024-04-05T15:03:37.295Z", "stars": { "results": [], "count": 0 }, "collaborators": { "results": [], "count": 0 }, "subfolder_count": null, "refresh_interval": null, "organize_view_url": "https://chart-studio.plotly.com/~minhanh66789/1/", "current_user_permission": "read", "is_theme": null, "is_template": false, "autosize": false, "caption": "", "figure": { "data": [ { "uid": "7f2134", "fill": "none", "line": { "dash": "solid", "color": "rgb(19, 27, 88)", "shape": "spline", "width": 2, "smoothing": 1 }, "meta": { "columnNames": { "x": "$x^2 \\frac{d^2 y}{dx^2} + x \\frac{dy}{dx} + (x^2 - \\nu^2)y = 0$", "y": "$J_0$" } }, "mode": "lines", "name": "$J_0$", "type": "scatter", "xsrc": "minhanh66789:0:5cf722", "ysrc": "minhanh66789:0:ef4adc", "xaxis": "x", "yaxis": "y", "marker": { "line": { "color": "white", "width": 6 }, "size": 6, "cauto": true, "color": "rgb(19, 27, 88)", "symbol": "dot", "opacity": 1, "colorscale": [ [ 0, "rgb(5, 10, 172)" ], [ 0.35, "rgb(106, 137, 247)" ], [ 0.5, "rgb(190,190,190)" ], [ 0.6, "rgb(220, 170, 132)" ], [ 0.7, "rgb(230, 145, 90)" ], [ 1, "rgb(178, 10, 28)" ] ], "maxdisplayed": 0 }, "error_x": { "color": "black", "width": "2", "thickness": "1" }, "error_y": { "color": "#1f77b4", "width": 4, "thickness": 2 }, "error_z": {}, "opacity": 1, "visible": true, "textfont": { "size": 12, "color": "#444", "family": "'Open sans', verdana, arial, sans-serif" }, "fillcolor": "rgba(0, 0, 255, 0.5)", "showlegend": true, "textposition": "middle center" }, { "uid": "9cc39f", "fill": "none", "line": { "dash": "solid", "color": "rgb(0, 167, 141)", "shape": "linear", "width": 2, "smoothing": 1 }, "meta": { "columnNames": { "x": "$x^2 \\frac{d^2 y}{dx^2} + x \\frac{dy}{dx} + (x^2 - \\nu^2)y = 0$", "y": "$J_1$" } }, "mode": "lines", "name": "$J_1$", "type": "scatter", "xsrc": "minhanh66789:0:5cf722", "ysrc": "minhanh66789:0:73001a", "xaxis": "x", "yaxis": "y", "marker": { "line": { "color": "white", "width": 6 }, "size": 6, "cauto": true, "color": "rgb(0, 167, 141)", "symbol": "dot", "opacity": 1, "colorscale": [ [ 0, "rgb(5, 10, 172)" ], [ 0.35, "rgb(106, 137, 247)" ], [ 0.5, "rgb(190,190,190)" ], [ 0.6, "rgb(220, 170, 132)" ], [ 0.7, "rgb(230, 145, 90)" ], [ 1, "rgb(178, 10, 28)" ] ], "maxdisplayed": 0 }, "error_x": { "color": "black", "width": "2", "thickness": "1" }, "error_y": { "color": "black", "width": "2", "thickness": "1" }, "error_z": {}, "opacity": 1, "visible": true, "textfont": { "size": 12, "color": "#444", "family": "'Open sans', verdana, arial, sans-serif" }, "fillcolor": "rgba(255, 0, 255, 0.5)", "showlegend": true, "textposition": "middle center" }, { "uid": "21be5d", "fill": "none", "line": { "dash": "solid", "color": "rgb(252, 185, 37)", "shape": "linear", "width": 2, "smoothing": 1 }, "meta": { "columnNames": { "x": "$x^2 \\frac{d^2 y}{dx^2} + x \\frac{dy}{dx} + (x^2 - \\nu^2)y = 0$", "y": "$J_2$" } }, "mode": "lines", "name": "$J_2$", "type": "scatter", "xsrc": "minhanh66789:0:5cf722", "ysrc": "minhanh66789:0:8edc7e", "xaxis": "x", "yaxis": "y", "marker": { "line": { "color": "white", "width": 6 }, "size": 6, "cauto": true, "color": "rgb(252, 185, 37)", "symbol": "dot", "opacity": 1, "colorscale": [ [ 0, "rgb(5, 10, 172)" ], [ 0.35, "rgb(106, 137, 247)" ], [ 0.5, "rgb(190,190,190)" ], [ 0.6, "rgb(220, 170, 132)" ], [ 0.7, "rgb(230, 145, 90)" ], [ 1, "rgb(178, 10, 28)" ] ], "maxdisplayed": 0 }, "error_x": { "color": "black", "width": "2", "thickness": "1" }, "error_y": { "color": "black", "width": "2", "thickness": "1" }, "error_z": {}, "opacity": 1, "visible": true, "textfont": { "size": 12, "color": "#444", "family": "'Open sans', verdana, arial, sans-serif" }, "fillcolor": "rgba(194, 123, 160, 0.5)", "showlegend": true, "textposition": "middle center" }, { "uid": "f24569", "fill": "none", "line": { "dash": "solid", "color": "rgb(236, 51, 48)", "shape": "linear", "width": 2, "smoothing": 1 }, "meta": { "columnNames": { "x": "$x^2 \\frac{d^2 y}{dx^2} + x \\frac{dy}{dx} + (x^2 - \\nu^2)y = 0$", "y": "$J_3$" } }, "mode": "lines", "name": "$J_3$", "type": "scatter", "xsrc": "minhanh66789:0:5cf722", "ysrc": "minhanh66789:0:e774c9", "xaxis": "x", "yaxis": "y", "marker": { "line": { "color": "white", "width": 6 }, "size": 6, "cauto": true, "color": "rgb(236, 51, 48)", "symbol": "dot", "opacity": 1, "colorscale": [ [ 0, "rgb(5, 10, 172)" ], [ 0.35, "rgb(106, 137, 247)" ], [ 0.5, "rgb(190,190,190)" ], [ 0.6, "rgb(220, 170, 132)" ], [ 0.7, "rgb(230, 145, 90)" ], [ 1, "rgb(178, 10, 28)" ] ], "maxdisplayed": 0 }, "error_x": { "color": "black", "width": "2", "thickness": "1" }, "error_y": { "color": "black", "width": "2", "thickness": "1" }, "error_z": {}, "opacity": 1, "visible": true, "textfont": { "size": 12, "color": "#444", "family": "'Open sans', verdana, arial, sans-serif" }, "fillcolor": "rgb(217, 217, 217)", "showlegend": true, "textposition": "middle center" }, { "uid": "75bc5e", "fill": "none", "line": { "dash": "solid", "color": "rgb(193, 105, 166)", "width": 2 }, "meta": { "columnNames": { "x": "$x^2 \\frac{d^2 y}{dx^2} + x \\frac{dy}{dx} + (x^2 - \\nu^2)y = 0$", "y": "$J_4$" } }, "mode": "lines", "name": "$J_4$", "type": "scatter", "xsrc": "minhanh66789:0:5cf722", "ysrc": "minhanh66789:0:7e4cc1", "xaxis": "x", "yaxis": "y", "marker": { "line": { "color": "white", "width": 6 }, "size": 6, "cauto": true, "color": "rgb(193, 105, 166)", "symbol": "dot", "opacity": 1, "colorscale": [ [ 0, "rgb(8, 29, 88)" ], [ 0.125, "rgb(37, 52, 148)" ], [ 0.25, "rgb(34, 94, 168)" ], [ 0.375, "rgb(29, 145, 192)" ], [ 0.5, "rgb(65, 182, 196)" ], [ 0.625, "rgb(127, 205, 187)" ], [ 0.75, "rgb(199, 233, 180)" ], [ 0.875, "rgb(237, 248, 217)" ], [ 1, "rgb(255, 255, 217)" ] ] }, "error_x": { "color": "black", "width": "2", "thickness": "1" }, "error_y": { "color": "black", "width": "2", "thickness": "1" }, "error_z": {}, "opacity": 0.7, "visible": true, "textfont": { "size": 12, "color": "#000", "family": "\"Droid Sans\", sans-serif" }, "fillcolor": "rgba(193, 105, 166, 0.5)", "showlegend": true, "textposition": "middle center" } ], "frames": [], "layout": { "font": { "size": 12, "color": "#444", "family": "\"Droid Sans\", sans-serif" }, "smith": false, "title": { "font": { "size": 0, "color": "", "family": "" }, "text": "<br>Bessel Functions of the First Kind for v = 0,1,2,3,4" }, "width": 600, "xaxis": { "side": "bottom", "type": "linear", "dtick": 5, "range": [ 0, 20 ], "tick0": 0, "ticks": "", "title": { "font": { "size": 0, "color": "", "family": "" }, "text": "$x^2 \\frac{d^2 y}{dx^2} + x \\frac{dy}{dx} + (x^2 - \\nu^2)y = 0$" }, "anchor": "y", "domain": [ 0.13, 0.905 ], "mirror": false, "nticks": 0, "ticklen": 5, "position": 0, "showgrid": false, "showline": false, "tickfont": { "size": 0, "color": "", "family": "" }, "tickmode": "auto", "zeroline": true, "autorange": true, "gridcolor": "#eee", "gridwidth": 1, "linecolor": "#444", "linewidth": 1, "rangemode": "normal", "tickangle": "auto", "tickcolor": "#444", "tickwidth": 1, "overlaying": false, "showexponent": "all", "zerolinecolor": "#444", "zerolinewidth": 1, "exponentformat": "B", "showticklabels": true }, "yaxis": { "side": "left", "type": "linear", "dtick": 0.2, "range": [ -0.48047577777777783, 1.0779197777777778 ], "tick0": 0, "ticks": "", "title": { "font": { "size": 0, "color": "", "family": "" }, "text": "$J_\\nu(X)$" }, "anchor": "x", "domain": [ 0.108706, 0.914118 ], "mirror": false, "nticks": 0, "ticklen": 5, "position": 0, "showgrid": true, "showline": false, "tickfont": { "size": 0, "color": "", "family": "" }, "tickmode": "auto", "zeroline": true, "autorange": true, "gridcolor": "#eee", "gridwidth": 1, "linecolor": "#444", "linewidth": 1, "rangemode": "normal", "tickangle": "auto", "tickcolor": "#444", "tickwidth": 1, "overlaying": false, "showexponent": "all", "zerolinecolor": "#444", "zerolinewidth": 1, "exponentformat": "B", "showticklabels": true }, "bargap": 0.2, "boxgap": 0.3, "height": 550, "legend": { "x": 1.044, "y": 0.9024390243902439, "font": { "size": 0, "color": "", "family": "" }, "bgcolor": "#fff", "xanchor": "right", "yanchor": "top", "traceorder": "normal", "bordercolor": "#444", "borderwidth": 0 }, "margin": { "b": 80, "l": 50, "r": 50, "t": 60, "pad": 0, "autoexpand": true }, "barmode": "group", "boxmode": "overlay", "autosize": false, "dragmode": "zoom", "hovermode": "x", "separators": ".,", "showlegend": true, "annotations": [], "bargroupgap": 0, "boxgroupgap": 0.3, "hidesources": false, "plot_bgcolor": "#fff", "paper_bgcolor": "#fff" } }, "height": 550, "width": 600, "user": { "profile_url": "https://chart-studio.plotly.com/~minhanh66789", "avatar_url": "https://storage.googleapis.com/plotly-prod-profiles/23.jpg", "background_url": "https://storage.googleapis.com/plotly-prod-profiles/bg-0.jpg", "bio": "", "nickname": "", "website": "", "stream_tokens": null, "feature_set_id": null, "csrf_token": null, "date_joined": "2024-04-05 15:02:49", "mapbox_access_tokens": null, "has_password": null, "username": "minhanh66789", "email": null, "is_active": null, "readonly": null, "is_dash_creator": null, "dash_created_count": null, "is_chart_creator": null, "charts_created_count": null } }, { "creation_time": "2024-04-05T14:54:19.845308Z", "comments": { "results": [], "count": 0 }, "parented": true, "embed_url": "https://chart-studio.plotly.com/~studiogeologicotecnico/1.embed", "fid": "studiogeologicotecnico:1", "filename": "Plot 1", "filetype": "plot", "img_url": "https://storage.googleapis.com/plotly-prod-images/studiogeologicotecnico/1/9_V41G7H978Y2M4LEUC6PBBJUIPDRFSA.png", "image_urls": { "default": "https://storage.googleapis.com/plotly-prod-images/studiogeologicotecnico/1/2_M7M18Z00KZ66QJU71EJKGO7HZ1UN2Z.png", "block-thumb": "https://storage.googleapis.com/plotly-prod-images/studiogeologicotecnico/1/8_17RJOK8JNBEOGK1R3SB3EOZIEWRFUZ.png", "list-thumb": "https://storage.googleapis.com/plotly-prod-images/studiogeologicotecnico/1/9_V41G7H978Y2M4LEUC6PBBJUIPDRFSA.png" }, "api_urls": { "files": "https://api.plotly.com/v2/files/studiogeologicotecnico:1", "plots": "https://api.plotly.com/v2/plots/studiogeologicotecnico:1", "parent": "https://api.plotly.com/v2/folders/home?user=studiogeologicotecnico" }, "owner": "studiogeologicotecnico", "parent": -1, "preview": "", "referencers": [], "references": [], "title": "", "views": 2, "web_url": "https://chart-studio.plotly.com/~studiogeologicotecnico/1/", "world_readable": true, "date_modified": "2024-04-05T16:34:02.865Z", "stars": { "results": [], "count": 0 }, "collaborators": { "results": [], "count": 0 }, "subfolder_count": null, "refresh_interval": null, "organize_view_url": "https://chart-studio.plotly.com/~studiogeologicotecnico/1/", "current_user_permission": "read", "is_theme": null, "is_template": true, "autosize": true, "caption": "", "figure": { "data": [ { "uid": "4d0c1d", "meta": { "columnNames": { "x": "A", "y": "B" } }, "mode": "lines", "name": "Radon ", "type": "scatter", "xsrc": "studiogeologicotecnico:0:26168a", "ysrc": "studiogeologicotecnico:0:e9e379", "visible": true }, { "uid": "21e97f", "meta": { "columnNames": { "x": "A", "y": "C" } }, "mode": "lines", "name": "Temperatura", "type": "scatter", "xsrc": "studiogeologicotecnico:0:26168a", "ysrc": "studiogeologicotecnico:0:239a29", "yaxis": "y2", "visible": true, "stackgroup": null }, { "uid": "883554", "meta": { "columnNames": { "x": "A", "y": "D" } }, "mode": "lines", "name": "Umidità", "type": "scatter", "xsrc": "studiogeologicotecnico:0:26168a", "ysrc": "studiogeologicotecnico:0:7b83d1", "yaxis": "y", "error_x": { "type": "percent", "color": "#00cc96", "value": 10, "width": 4, "visible": false, "symmetric": true, "thickness": 2 }, "visible": true, "hoverinfo": "x+y+name", "hoverlabel": { "align": "auto" }, "stackgroup": null } ], "frames": [], "layout": { "title": { "text": " Inizio misura 25/03/2024; Fine misura 05/04/2024; Durata misura 170 ore" }, "xaxis": { "side": "bottom", "type": "category", "range": [ 0, 18 ], "title": { "text": "Tempo di misura" }, "anchor": "y3", "domain": [ 0, 0.875 ], "autorange": true, "showspikes": true }, "yaxis": { "type": "linear", "range": [ 29.555555555555557, 58.44444444444444 ], "title": { "text": "Radon (Bq/mc) - Umidità (%)" }, "anchor": "free", "domain": [ 0, 1 ], "autorange": true }, "yaxis2": { "side": "right", "type": "linear", "range": [ 17.022222222222222, 20.577777777777776 ], "title": { "text": "Temperatuta (C°)" }, "anchor": "x", "domain": [ 0, 1 ], "autorange": true, "overlaying": "y" }, "autosize": true, "dragmode": "pan", "template": { "data": { "bar": [ { "type": "bar", "marker": { "colorbar": { "ticks": "", "outlinewidth": 0 } } } ], "table": [ { "type": "table", "cells": { "fill": { "color": "#EBF0F8" }, "line": { "color": "white" } }, "header": { "fill": { "color": "#C8D4E3" }, "line": { "color": "white" } } } ], "carpet": [ { "type": "carpet", "aaxis": { "gridcolor": "#C8D4E3", "linecolor": "#C8D4E3", "endlinecolor": "#2a3f5f", "minorgridcolor": "#C8D4E3", "startlinecolor": "#2a3f5f" }, "baxis": { "gridcolor": "#C8D4E3", "linecolor": "#C8D4E3", "endlinecolor": "#2a3f5f", "minorgridcolor": "#C8D4E3", "startlinecolor": "#2a3f5f" } } ], "mesh3d": [ { "type": "mesh3d", "colorbar": { "ticks": "", "outlinewidth": 0 } } ], "contour": [ { "type": "contour", "colorbar": { "ticks": "", "outlinewidth": 0 }, "autocolorscale": true } ], "heatmap": [ { "type": "heatmap", "colorbar": { "ticks": "", "outlinewidth": 0 }, "autocolorscale": true } ], "scatter": [ { "type": "scatter", "marker": { "colorbar": { "ticks": "", "outlinewidth": 0 } } } ], "surface": [ { "type": "surface", "colorbar": { "ticks": "", "outlinewidth": 0 } } ], "heatmapgl": [ { "type": "heatmapgl", "colorbar": { "ticks": "", "outlinewidth": 0 } } ], "histogram": [ { "type": "histogram", "marker": { "colorbar": { "ticks": "", "outlinewidth": 0 } } } ], "parcoords": [ { "line": { "colorbar": { "ticks": "", "outlinewidth": 0 } }, "type": "parcoords" } ], "scatter3d": [ { "type": "scatter3d", "marker": { "colorbar": { "ticks": "", "outlinewidth": 0 } } } ], "scattergl": [ { "type": "scattergl", "marker": { "colorbar": { "ticks": "", "outlinewidth": 0 } } } ], "choropleth": [ { "type": "choropleth", "colorbar": { "ticks": "", "outlinewidth": 0 } } ], "scattergeo": [ { "type": "scattergeo", "marker": { "colorbar": { "ticks": "", "outlinewidth": 0 } } } ], "histogram2d": [ { "type": "histogram2d", "colorbar": { "ticks": "", "outlinewidth": 0 }, "autocolorscale": true } ], "scatterpolar": [ { "type": "scatterpolar", "marker": { "colorbar": { "ticks": "", "outlinewidth": 0 } } } ], "contourcarpet": [ { "type": "contourcarpet", "colorbar": { "ticks": "", "outlinewidth": 0 } } ], "scattercarpet": [ { "type": "scattercarpet", "marker": { "colorbar": { "ticks": "", "outlinewidth": 0 } } } ], "scattermapbox": [ { "type": "scattermapbox", "marker": { "colorbar": { "ticks": "", "outlinewidth": 0 } } } ], "scatterpolargl": [ { "type": "scatterpolargl", "marker": { "colorbar": { "ticks": "", "outlinewidth": 0 } } } ], "scatterternary": [ { "type": "scatterternary", "marker": { "colorbar": { "ticks": "", "outlinewidth": 0 } } } ], "histogram2dcontour": [ { "type": "histogram2dcontour", "colorbar": { "ticks": "", "outlinewidth": 0 }, "autocolorscale": true } ] }, "layout": { "geo": { "bgcolor": "white", "showland": true, "lakecolor": "white", "landcolor": "white", "showlakes": true, "subunitcolor": "#C8D4E3" }, "font": { "color": "#2a3f5f" }, "polar": { "bgcolor": "white", "radialaxis": { "ticks": "", "gridcolor": "#EBF0F8", "linecolor": "#EBF0F8" }, "angularaxis": { "ticks": "", "gridcolor": "#EBF0F8", "linecolor": "#EBF0F8" } }, "scene": { "xaxis": { "ticks": "", "gridcolor": "#DFE8F3", "gridwidth": 2, "linecolor": "#EBF0F8", "zerolinecolor": "#EBF0F8", "showbackground": true, "backgroundcolor": "white" }, "yaxis": { "ticks": "", "gridcolor": "#DFE8F3", "gridwidth": 2, "linecolor": "#EBF0F8", "zerolinecolor": "#EBF0F8", "showbackground": true, "backgroundcolor": "white" }, "zaxis": { "ticks": "", "gridcolor": "#DFE8F3", "gridwidth": 2, "linecolor": "#EBF0F8", "zerolinecolor": "#EBF0F8", "showbackground": true, "backgroundcolor": "white" } }, "title": { "x": 0.05 }, "xaxis": { "ticks": "", "gridcolor": "#EBF0F8", "linecolor": "#EBF0F8", "automargin": true, "zerolinecolor": "#EBF0F8", "zerolinewidth": 2 }, "yaxis": { "ticks": "", "gridcolor": "#EBF0F8", "linecolor": "#EBF0F8", "automargin": true, "zerolinecolor": "#EBF0F8", "zerolinewidth": 2 }, "ternary": { "aaxis": { "ticks": "", "gridcolor": "#DFE8F3", "linecolor": "#A2B1C6" }, "baxis": { "ticks": "", "gridcolor": "#DFE8F3", "linecolor": "#A2B1C6" }, "caxis": { "ticks": "", "gridcolor": "#DFE8F3", "linecolor": "#A2B1C6" }, "bgcolor": "white" }, "colorway": [ "#636efa", "#EF553B", "#00cc96", "#ab63fa", "#19d3f3", "#e763fa", "#fecb52", "#ffa15a", "#ff6692", "#b6e880" ], "hovermode": "closest", "colorscale": { "diverging": [ [ 0, "#8e0152" ], [ 0.1, "#c51b7d" ], [ 0.2, "#de77ae" ], [ 0.3, "#f1b6da" ], [ 0.4, "#fde0ef" ], [ 0.5, "#f7f7f7" ], [ 0.6, "#e6f5d0" ], [ 0.7, "#b8e186" ], [ 0.8, "#7fbc41" ], [ 0.9, "#4d9221" ], [ 1, "#276419" ] ], "sequential": [ [ 0, "#0508b8" ], [ 0.0893854748603352, "#1910d8" ], [ 0.1787709497206704, "#3c19f0" ], [ 0.2681564245810056, "#6b1cfb" ], [ 0.3575418994413408, "#981cfd" ], [ 0.44692737430167595, "#bf1cfd" ], [ 0.5363128491620112, "#dd2bfd" ], [ 0.6256983240223464, "#f246fe" ], [ 0.7150837988826816, "#fc67fd" ], [ 0.8044692737430168, "#fe88fc" ], [ 0.8938547486033519, "#fea5fd" ], [ 0.9832402234636871, "#febefe" ], [ 1, "#fec3fe" ] ], "sequentialminus": [ [ 0, "#0508b8" ], [ 0.0893854748603352, "#1910d8" ], [ 0.1787709497206704, "#3c19f0" ], [ 0.2681564245810056, "#6b1cfb" ], [ 0.3575418994413408, "#981cfd" ], [ 0.44692737430167595, "#bf1cfd" ], [ 0.5363128491620112, "#dd2bfd" ], [ 0.6256983240223464, "#f246fe" ], [ 0.7150837988826816, "#fc67fd" ], [ 0.8044692737430168, "#fe88fc" ], [ 0.8938547486033519, "#fea5fd" ], [ 0.9832402234636871, "#febefe" ], [ 1, "#fec3fe" ] ] }, "plot_bgcolor": "white", "paper_bgcolor": "white", "shapedefaults": { "line": { "width": 0 }, "opacity": 0.4, "fillcolor": "#506784" }, "annotationdefaults": { "arrowhead": 0, "arrowcolor": "#506784", "arrowwidth": 1 } }, "themeRef": "PLOTLY_WHITE" }, "annotations": [] } }, "height": null, "width": null, "user": { "profile_url": "https://chart-studio.plotly.com/~studiogeologicotecnico", "avatar_url": "https://storage.googleapis.com/plotly-prod-profiles/67.jpg", "background_url": "https://storage.googleapis.com/plotly-prod-profiles/bg-8.jpg", "bio": "", "nickname": "", "website": "", "stream_tokens": null, "feature_set_id": null, "csrf_token": null, "date_joined": "2024-04-05 14:50:10", "mapbox_access_tokens": null, "has_password": null, "username": "studiogeologicotecnico", "email": null, "is_active": null, "readonly": null, "is_dash_creator": null, "dash_created_count": null, "is_chart_creator": null, "charts_created_count": null } }, { "creation_time": "2024-04-05T14:48:58.361539Z", "comments": { "results": [], "count": 0 }, "parented": true, "embed_url": "https://chart-studio.plotly.com/~bartwojcik/1.embed", "fid": "bartwojcik:1", "filename": "Plot 1", "filetype": "plot", "img_url": "https://storage.googleapis.com/plotly-prod-images/bartwojcik/1/9_HNPR3ICSTSCVB3ZWW4HIP5D48889LE.png", "image_urls": { "default": "https://storage.googleapis.com/plotly-prod-images/bartwojcik/1/2_ZNLX1EKU0I3DJZZQZ3O53ZDIP10K10.png", "block-thumb": "https://storage.googleapis.com/plotly-prod-images/bartwojcik/1/8_CPZQVYI926S4OXXCCER5S4IQL4EI4O.png", "list-thumb": "https://storage.googleapis.com/plotly-prod-images/bartwojcik/1/9_HNPR3ICSTSCVB3ZWW4HIP5D48889LE.png" }, "api_urls": { "files": "https://api.plotly.com/v2/files/bartwojcik:1", "plots": "https://api.plotly.com/v2/plots/bartwojcik:1", "parent": "https://api.plotly.com/v2/folders/home?user=bartwojcik" }, "owner": "bartwojcik", "parent": -1, "preview": "", "referencers": [], "references": [], "title": "", "views": 1, "web_url": "https://chart-studio.plotly.com/~bartwojcik/1/", "world_readable": true, "date_modified": "2024-04-05T14:48:58.373Z", "stars": { "results": [], "count": 0 }, "collaborators": { "results": [], "count": 0 }, "subfolder_count": null, "refresh_interval": null, "organize_view_url": "https://chart-studio.plotly.com/~bartwojcik/1/", "current_user_permission": "read", "is_theme": null, "is_template": false, "autosize": true, "caption": "", "figure": { "data": [ { "meta": { "columnNames": { "x": "A", "y": "B" } }, "mode": "lines", "type": "scatter", "xsrc": "bartwojcik:0:6b36ae", "ysrc": "bartwojcik:0:938766" }, { "meta": { "columnNames": { "x": "A", "y": "C" } }, "mode": "lines", "type": "scatter", "xsrc": "bartwojcik:0:6b36ae", "ysrc": "bartwojcik:0:835134" } ], "frames": [], "layout": { "xaxis": { "type": "linear", "range": [ 1, 8 ], "autorange": true }, "yaxis": { "type": "linear", "range": [ 0.01913322222222222, 0.20374877777777778 ], "autorange": true }, "autosize": true, "template": { "data": { "bar": [ { "type": "bar", "marker": { "colorbar": { "ticks": "", "outlinewidth": 0 } } } ], "table": [ { "type": "table", "cells": { "fill": { "color": "#EBF0F8" }, "line": { "color": "white" } }, "header": { "fill": { "color": "#C8D4E3" }, "line": { "color": "white" } } } ], "carpet": [ { "type": "carpet", "aaxis": { "gridcolor": "#C8D4E3", "linecolor": "#C8D4E3", "endlinecolor": "#2a3f5f", "minorgridcolor": "#C8D4E3", "startlinecolor": "#2a3f5f" }, "baxis": { "gridcolor": "#C8D4E3", "linecolor": "#C8D4E3", "endlinecolor": "#2a3f5f", "minorgridcolor": "#C8D4E3", "startlinecolor": "#2a3f5f" } } ], "mesh3d": [ { "type": "mesh3d", "colorbar": { "ticks": "", "outlinewidth": 0 } } ], "contour": [ { "type": "contour", "colorbar": { "ticks": "", "outlinewidth": 0 }, "autocolorscale": true } ], "heatmap": [ { "type": "heatmap", "colorbar": { "ticks": "", "outlinewidth": 0 }, "autocolorscale": true } ], "scatter": [ { "type": "scatter", "marker": { "colorbar": { "ticks": "", "outlinewidth": 0 } } } ], "surface": [ { "type": "surface", "colorbar": { "ticks": "", "outlinewidth": 0 } } ], "heatmapgl": [ { "type": "heatmapgl", "colorbar": { "ticks": "", "outlinewidth": 0 } } ], "histogram": [ { "type": "histogram", "marker": { "colorbar": { "ticks": "", "outlinewidth": 0 } } } ], "parcoords": [ { "line": { "colorbar": { "ticks": "", "outlinewidth": 0 } }, "type": "parcoords" } ], "scatter3d": [ { "type": "scatter3d", "marker": { "colorbar": { "ticks": "", "outlinewidth": 0 } } } ], "scattergl": [ { "type": "scattergl", "marker": { "colorbar": { "ticks": "", "outlinewidth": 0 } } } ], "choropleth": [ { "type": "choropleth", "colorbar": { "ticks": "", "outlinewidth": 0 } } ], "scattergeo": [ { "type": "scattergeo", "marker": { "colorbar": { "ticks": "", "outlinewidth": 0 } } } ], "histogram2d": [ { "type": "histogram2d", "colorbar": { "ticks": "", "outlinewidth": 0 }, "autocolorscale": true } ], "scatterpolar": [ { "type": "scatterpolar", "marker": { "colorbar": { "ticks": "", "outlinewidth": 0 } } } ], "contourcarpet": [ { "type": "contourcarpet", "colorbar": { "ticks": "", "outlinewidth": 0 } } ], "scattercarpet": [ { "type": "scattercarpet", "marker": { "colorbar": { "ticks": "", "outlinewidth": 0 } } } ], "scattermapbox": [ { "type": "scattermapbox", "marker": { "colorbar": { "ticks": "", "outlinewidth": 0 } } } ], "scatterpolargl": [ { "type": "scatterpolargl", "marker": { "colorbar": { "ticks": "", "outlinewidth": 0 } } } ], "scatterternary": [ { "type": "scatterternary", "marker": { "colorbar": { "ticks": "", "outlinewidth": 0 } } } ], "histogram2dcontour": [ { "type": "histogram2dcontour", "colorbar": { "ticks": "", "outlinewidth": 0 }, "autocolorscale": true } ] }, "layout": { "geo": { "bgcolor": "white", "showland": true, "lakecolor": "white", "landcolor": "white", "showlakes": true, "subunitcolor": "#C8D4E3" }, "font": { "color": "#2a3f5f" }, "polar": { "bgcolor": "white", "radialaxis": { "ticks": "", "gridcolor": "#EBF0F8", "linecolor": "#EBF0F8" }, "angularaxis": { "ticks": "", "gridcolor": "#EBF0F8", "linecolor": "#EBF0F8" } }, "scene": { "xaxis": { "ticks": "", "gridcolor": "#DFE8F3", "gridwidth": 2, "linecolor": "#EBF0F8", "zerolinecolor": "#EBF0F8", "showbackground": true, "backgroundcolor": "white" }, "yaxis": { "ticks": "", "gridcolor": "#DFE8F3", "gridwidth": 2, "linecolor": "#EBF0F8", "zerolinecolor": "#EBF0F8", "showbackground": true, "backgroundcolor": "white" }, "zaxis": { "ticks": "", "gridcolor": "#DFE8F3", "gridwidth": 2, "linecolor": "#EBF0F8", "zerolinecolor": "#EBF0F8", "showbackground": true, "backgroundcolor": "white" } }, "title": { "x": 0.05 }, "xaxis": { "ticks": "", "gridcolor": "#EBF0F8", "linecolor": "#EBF0F8", "automargin": true, "zerolinecolor": "#EBF0F8", "zerolinewidth": 2 }, "yaxis": { "ticks": "", "gridcolor": "#EBF0F8", "linecolor": "#EBF0F8", "automargin": true, "zerolinecolor": "#EBF0F8", "zerolinewidth": 2 }, "ternary": { "aaxis": { "ticks": "", "gridcolor": "#DFE8F3", "linecolor": "#A2B1C6" }, "baxis": { "ticks": "", "gridcolor": "#DFE8F3", "linecolor": "#A2B1C6" }, "caxis": { "ticks": "", "gridcolor": "#DFE8F3", "linecolor": "#A2B1C6" }, "bgcolor": "white" }, "colorway": [ "#636efa", "#EF553B", "#00cc96", "#ab63fa", "#19d3f3", "#e763fa", "#fecb52", "#ffa15a", "#ff6692", "#b6e880" ], "hovermode": "closest", "colorscale": { "diverging": [ [ 0, "#8e0152" ], [ 0.1, "#c51b7d" ], [ 0.2, "#de77ae" ], [ 0.3, "#f1b6da" ], [ 0.4, "#fde0ef" ], [ 0.5, "#f7f7f7" ], [ 0.6, "#e6f5d0" ], [ 0.7, "#b8e186" ], [ 0.8, "#7fbc41" ], [ 0.9, "#4d9221" ], [ 1, "#276419" ] ], "sequential": [ [ 0, "#0508b8" ], [ 0.0893854748603352, "#1910d8" ], [ 0.1787709497206704, "#3c19f0" ], [ 0.2681564245810056, "#6b1cfb" ], [ 0.3575418994413408, "#981cfd" ], [ 0.44692737430167595, "#bf1cfd" ], [ 0.5363128491620112, "#dd2bfd" ], [ 0.6256983240223464, "#f246fe" ], [ 0.7150837988826816, "#fc67fd" ], [ 0.8044692737430168, "#fe88fc" ], [ 0.8938547486033519, "#fea5fd" ], [ 0.9832402234636871, "#febefe" ], [ 1, "#fec3fe" ] ], "sequentialminus": [ [ 0, "#0508b8" ], [ 0.0893854748603352, "#1910d8" ], [ 0.1787709497206704, "#3c19f0" ], [ 0.2681564245810056, "#6b1cfb" ], [ 0.3575418994413408, "#981cfd" ], [ 0.44692737430167595, "#bf1cfd" ], [ 0.5363128491620112, "#dd2bfd" ], [ 0.6256983240223464, "#f246fe" ], [ 0.7150837988826816, "#fc67fd" ], [ 0.8044692737430168, "#fe88fc" ], [ 0.8938547486033519, "#fea5fd" ], [ 0.9832402234636871, "#febefe" ], [ 1, "#fec3fe" ] ] }, "plot_bgcolor": "white", "paper_bgcolor": "white", "shapedefaults": { "line": { "width": 0 }, "opacity": 0.4, "fillcolor": "#506784" }, "annotationdefaults": { "arrowhead": 0, "arrowcolor": "#506784", "arrowwidth": 1 } }, "themeRef": "PLOTLY_WHITE" } } }, "height": null, "width": null, "user": { "profile_url": "https://chart-studio.plotly.com/~bartwojcik", "avatar_url": "https://storage.googleapis.com/plotly-prod-profiles/79.jpg", "background_url": "https://storage.googleapis.com/plotly-prod-profiles/bg-14.jpg", "bio": "", "nickname": "", "website": "", "stream_tokens": null, "feature_set_id": null, "csrf_token": null, "date_joined": "2024-04-05 14:48:24", "mapbox_access_tokens": null, "has_password": null, "username": "bartwojcik", "email": null, "is_active": null, "readonly": null, "is_dash_creator": null, "dash_created_count": null, "is_chart_creator": null, "charts_created_count": null } }, { "creation_time": "2024-04-05T14:39:54.497410Z", "comments": { "results": [], "count": 0 }, "parented": true, "embed_url": "https://chart-studio.plotly.com/~Spyros91/1.embed", "fid": "Spyros91:1", "filename": "Plot 1", "filetype": "plot", "img_url": "https://storage.googleapis.com/plotly-prod-images/Spyros91/1/9_ERLW4MPWTJ2R63WB1SFO7POAI1JK3Q.png", "image_urls": { "default": "https://storage.googleapis.com/plotly-prod-images/Spyros91/1/2_74L08FYEUOVT5AQI9IV5YTT5W2IZ88.png", "block-thumb": "https://storage.googleapis.com/plotly-prod-images/Spyros91/1/8_9FRICMFB3UZTKJV0FQWH2JTZ85TPWW.png", "list-thumb": "https://storage.googleapis.com/plotly-prod-images/Spyros91/1/9_ERLW4MPWTJ2R63WB1SFO7POAI1JK3Q.png" }, "api_urls": { "files": "https://api.plotly.com/v2/files/Spyros91:1", "plots": "https://api.plotly.com/v2/plots/Spyros91:1", "parent": "https://api.plotly.com/v2/folders/home?user=Spyros91" }, "owner": "Spyros91", "parent": -1, "preview": "", "referencers": [], "references": [], "title": "", "views": 4, "web_url": "https://chart-studio.plotly.com/~Spyros91/1/", "world_readable": true, "date_modified": "2024-04-05T14:49:16.488Z", "stars": { "results": [], "count": 0 }, "collaborators": { "results": [], "count": 0 }, "subfolder_count": null, "refresh_interval": null, "organize_view_url": "https://chart-studio.plotly.com/~Spyros91/1/", "current_user_permission": "read", "is_theme": null, "is_template": false, "autosize": true, "caption": "", "figure": { "data": [ { "meta": { "columnNames": { "x": "Trace 0, x; Trace 1, x", "y": "Trace 0, y" } }, "mode": "markers", "name": "20y.Average ", "type": "scatter", "xsrc": "Spyros91:0:c7846b", "ysrc": "Spyros91:0:8afe1f", "xaxis": "x", "yaxis": "y", "marker": { "symbol": "circle" }, "error_y": { "meta": { "columnNames": { "array": "array", "arrayminus": "arrayminus" } }, "type": "data", "visible": true, "arraysrc": "Spyros91:0:ee9d1e", "symmetric": false, "arrayminussrc": "Spyros91:0:15a509" }, "visible": true, "showlegend": true }, { "meta": { "columnNames": { "x": "Trace 0, x; Trace 1, x", "y": "Trace 1, y" } }, "mode": "markers", "name": "Current", "type": "scatter", "xsrc": "Spyros91:0:c7846b", "ysrc": "Spyros91:0:0b3614", "xaxis": "x", "yaxis": "y", "marker": { "symbol": "circle" }, "visible": true, "showlegend": true } ], "frames": [], "layout": { "title": { "font": { "color": "rgba(0, 0, 0, 0)" }, "text": "<b>Error Bar on Scatter Plot</b>" }, "width": 840, "xaxis": { "side": "bottom", "type": "linear", "range": [ 0.854937913426947, 21.145062086573052 ], "title": { "text": "" }, "anchor": "y", "domain": [ 0.13, 0.905 ], "autorange": true }, "yaxis": { "side": "left", "type": "linear", "range": [ 56.25539156330792, 714.9339267598259 ], "title": { "text": "Spread (bps)" }, "anchor": "x", "domain": [ 0.11, 0.925 ], "autorange": true }, "height": 630, "legend": { "x": 0.961891891891892, "y": 0.8857142857142857 }, "margin": { "b": 0, "l": 0, "r": 0, "t": 0, "pad": 0 }, "showlegend": true, "annotations": [ { "x": 0.5175, "y": 0.935, "text": "Spread Distributions", "xref": "paper", "yref": "paper", "align": "center", "xanchor": "center", "yanchor": "bottom", "showarrow": false } ] } }, "height": 630, "width": 840, "user": { "profile_url": "https://chart-studio.plotly.com/~Spyros91", "avatar_url": "https://storage.googleapis.com/plotly-prod-profiles/91.jpg", "background_url": "https://storage.googleapis.com/plotly-prod-profiles/bg-13.jpg", "bio": "", "nickname": "", "website": "", "stream_tokens": null, "feature_set_id": null, "csrf_token": null, "date_joined": "2024-04-05 14:39:37", "mapbox_access_tokens": null, "has_password": null, "username": "Spyros91", "email": null, "is_active": null, "readonly": null, "is_dash_creator": null, "dash_created_count": null, "is_chart_creator": null, "charts_created_count": null } }, { "creation_time": "2024-04-05T14:35:03.553603Z", "comments": { "results": [], "count": 0 }, "parented": true, "embed_url": "https://chart-studio.plotly.com/~AN24706/17.embed", "fid": "AN24706:17", "filename": "Plot 17", "filetype": "plot", "img_url": "https://storage.googleapis.com/plotly-prod-images/AN24706/17/9_8FNE84K4E49WALSIKE4N6AEZ2KTK1B.png", "image_urls": { "default": "https://storage.googleapis.com/plotly-prod-images/AN24706/17/2_YA1M9T9VR44AI1B9NLELK6EK5F0D08.png", "block-thumb": "https://storage.googleapis.com/plotly-prod-images/AN24706/17/8_CFWGBS1BWF4T48GNC47XRA3RGGR7OI.png", "list-thumb": "https://storage.googleapis.com/plotly-prod-images/AN24706/17/9_8FNE84K4E49WALSIKE4N6AEZ2KTK1B.png" }, "api_urls": { "files": "https://api.plotly.com/v2/files/AN24706:17", "plots": "https://api.plotly.com/v2/plots/AN24706:17", "parent": "https://api.plotly.com/v2/folders/home?user=AN24706" }, "owner": "AN24706", "parent": -1, "preview": "", "referencers": [], "references": [], "title": "", "views": 1, "web_url": "https://chart-studio.plotly.com/~AN24706/17/", "world_readable": true, "date_modified": "2024-04-05T14:35:03.579Z", "stars": { "results": [], "count": 0 }, "collaborators": { "results": [], "count": 0 }, "subfolder_count": null, "refresh_interval": null, "organize_view_url": "https://chart-studio.plotly.com/~AN24706/17/", "current_user_permission": "read", "is_theme": null, "is_template": false, "autosize": true, "caption": "", "figure": { "data": [ { "uid": "828376", "meta": { "columnNames": { "x": "A", "y": "B", "error_y": { "array": "C" } } }, "mode": "markers", "type": "scatter", "xsrc": "AN24706:12:365bc8", "ysrc": "AN24706:12:9d6ded", "error_x": { "type": "percent", "color": "#636efa", "value": 10, "width": 4, "visible": false, "symmetric": false, "thickness": 2, "valueminus": 10 }, "error_y": { "meta": { "columnNames": { "array": "C" } }, "type": "data", "color": "#636efa", "value": 10, "width": 4, "visible": true, "arraysrc": "AN24706:12:d61594", "symmetric": true, "thickness": 2, "valueminus": 10 } }, { "uid": "a96c71", "transforms": [ { "rms": "", "type": "fit", "inputUid": "828376", "regressor": "x", "parameters": [ { "hold": false, "name": "m", "error": 3.9728567949635756, "value": -134.6534530999998 }, { "hold": false, "name": "b", "error": 0.7432534486734549, "value": 19.853604289999975 } ], "regressand": "y", "correlation": "", "fitfunction": "m*x + b", "inputxrange": [], "outputxrange": [], "interpolation": 50 } ] } ], "frames": [], "layout": { "xaxis": { "type": "linear", "range": [ -0.018452636090870122, 0.3184526360908701 ], "autorange": true }, "yaxis": { "type": "linear", "range": [ -31.790647327777776, 26.88763322777778 ], "autorange": true }, "autosize": true, "template": { "data": { "bar": [ { "type": "bar", "marker": { "colorbar": { "ticks": "", "outlinewidth": 0 } } } ], "table": [ { "type": "table", "cells": { "fill": { "color": "#EBF0F8" }, "line": { "color": "white" } }, "header": { "fill": { "color": "#C8D4E3" }, "line": { "color": "white" } } } ], "carpet": [ { "type": "carpet", "aaxis": { "gridcolor": "#C8D4E3", "linecolor": "#C8D4E3", "endlinecolor": "#2a3f5f", "minorgridcolor": "#C8D4E3", "startlinecolor": "#2a3f5f" }, "baxis": { "gridcolor": "#C8D4E3", "linecolor": "#C8D4E3", "endlinecolor": "#2a3f5f", "minorgridcolor": "#C8D4E3", "startlinecolor": "#2a3f5f" } } ], "mesh3d": [ { "type": "mesh3d", "colorbar": { "ticks": "", "outlinewidth": 0 } } ], "contour": [ { "type": "contour", "colorbar": { "ticks": "", "outlinewidth": 0 }, "autocolorscale": true } ], "heatmap": [ { "type": "heatmap", "colorbar": { "ticks": "", "outlinewidth": 0 }, "autocolorscale": true } ], "scatter": [ { "type": "scatter", "marker": { "colorbar": { "ticks": "", "outlinewidth": 0 } } } ], "surface": [ { "type": "surface", "colorbar": { "ticks": "", "outlinewidth": 0 } } ], "heatmapgl": [ { "type": "heatmapgl", "colorbar": { "ticks": "", "outlinewidth": 0 } } ], "histogram": [ { "type": "histogram", "marker": { "colorbar": { "ticks": "", "outlinewidth": 0 } } } ], "parcoords": [ { "line": { "colorbar": { "ticks": "", "outlinewidth": 0 } }, "type": "parcoords" } ], "scatter3d": [ { "type": "scatter3d", "marker": { "colorbar": { "ticks": "", "outlinewidth": 0 } } } ], "scattergl": [ { "type": "scattergl", "marker": { "colorbar": { "ticks": "", "outlinewidth": 0 } } } ], "choropleth": [ { "type": "choropleth", "colorbar": { "ticks": "", "outlinewidth": 0 } } ], "scattergeo": [ { "type": "scattergeo", "marker": { "colorbar": { "ticks": "", "outlinewidth": 0 } } } ], "histogram2d": [ { "type": "histogram2d", "colorbar": { "ticks": "", "outlinewidth": 0 }, "autocolorscale": true } ], "scatterpolar": [ { "type": "scatterpolar", "marker": { "colorbar": { "ticks": "", "outlinewidth": 0 } } } ], "contourcarpet": [ { "type": "contourcarpet", "colorbar": { "ticks": "", "outlinewidth": 0 } } ], "scattercarpet": [ { "type": "scattercarpet", "marker": { "colorbar": { "ticks": "", "outlinewidth": 0 } } } ], "scattermapbox": [ { "type": "scattermapbox", "marker": { "colorbar": { "ticks": "", "outlinewidth": 0 } } } ], "scatterpolargl": [ { "type": "scatterpolargl", "marker": { "colorbar": { "ticks": "", "outlinewidth": 0 } } } ], "scatterternary": [ { "type": "scatterternary", "marker": { "colorbar": { "ticks": "", "outlinewidth": 0 } } } ], "histogram2dcontour": [ { "type": "histogram2dcontour", "colorbar": { "ticks": "", "outlinewidth": 0 }, "autocolorscale": true } ] }, "layout": { "geo": { "bgcolor": "white", "showland": true, "lakecolor": "white", "landcolor": "white", "showlakes": true, "subunitcolor": "#C8D4E3" }, "font": { "color": "#2a3f5f" }, "polar": { "bgcolor": "white", "radialaxis": { "ticks": "", "gridcolor": "#EBF0F8", "linecolor": "#EBF0F8" }, "angularaxis": { "ticks": "", "gridcolor": "#EBF0F8", "linecolor": "#EBF0F8" } }, "scene": { "xaxis": { "ticks": "", "gridcolor": "#DFE8F3", "gridwidth": 2, "linecolor": "#EBF0F8", "zerolinecolor": "#EBF0F8", "showbackground": true, "backgroundcolor": "white" }, "yaxis": { "ticks": "", "gridcolor": "#DFE8F3", "gridwidth": 2, "linecolor": "#EBF0F8", "zerolinecolor": "#EBF0F8", "showbackground": true, "backgroundcolor": "white" }, "zaxis": { "ticks": "", "gridcolor": "#DFE8F3", "gridwidth": 2, "linecolor": "#EBF0F8", "zerolinecolor": "#EBF0F8", "showbackground": true, "backgroundcolor": "white" } }, "title": { "x": 0.05 }, "xaxis": { "ticks": "", "gridcolor": "#EBF0F8", "linecolor": "#EBF0F8", "automargin": true, "zerolinecolor": "#EBF0F8", "zerolinewidth": 2 }, "yaxis": { "ticks": "", "gridcolor": "#EBF0F8", "linecolor": "#EBF0F8", "automargin": true, "zerolinecolor": "#EBF0F8", "zerolinewidth": 2 }, "ternary": { "aaxis": { "ticks": "", "gridcolor": "#DFE8F3", "linecolor": "#A2B1C6" }, "baxis": { "ticks": "", "gridcolor": "#DFE8F3", "linecolor": "#A2B1C6" }, "caxis": { "ticks": "", "gridcolor": "#DFE8F3", "linecolor": "#A2B1C6" }, "bgcolor": "white" }, "colorway": [ "#636efa", "#EF553B", "#00cc96", "#ab63fa", "#19d3f3", "#e763fa", "#fecb52", "#ffa15a", "#ff6692", "#b6e880" ], "hovermode": "closest", "colorscale": { "diverging": [ [ 0, "#8e0152" ], [ 0.1, "#c51b7d" ], [ 0.2, "#de77ae" ], [ 0.3, "#f1b6da" ], [ 0.4, "#fde0ef" ], [ 0.5, "#f7f7f7" ], [ 0.6, "#e6f5d0" ], [ 0.7, "#b8e186" ], [ 0.8, "#7fbc41" ], [ 0.9, "#4d9221" ], [ 1, "#276419" ] ], "sequential": [ [ 0, "#0508b8" ], [ 0.0893854748603352, "#1910d8" ], [ 0.1787709497206704, "#3c19f0" ], [ 0.2681564245810056, "#6b1cfb" ], [ 0.3575418994413408, "#981cfd" ], [ 0.44692737430167595, "#bf1cfd" ], [ 0.5363128491620112, "#dd2bfd" ], [ 0.6256983240223464, "#f246fe" ], [ 0.7150837988826816, "#fc67fd" ], [ 0.8044692737430168, "#fe88fc" ], [ 0.8938547486033519, "#fea5fd" ], [ 0.9832402234636871, "#febefe" ], [ 1, "#fec3fe" ] ], "sequentialminus": [ [ 0, "#0508b8" ], [ 0.0893854748603352, "#1910d8" ], [ 0.1787709497206704, "#3c19f0" ], [ 0.2681564245810056, "#6b1cfb" ], [ 0.3575418994413408, "#981cfd" ], [ 0.44692737430167595, "#bf1cfd" ], [ 0.5363128491620112, "#dd2bfd" ], [ 0.6256983240223464, "#f246fe" ], [ 0.7150837988826816, "#fc67fd" ], [ 0.8044692737430168, "#fe88fc" ], [ 0.8938547486033519, "#fea5fd" ], [ 0.9832402234636871, "#febefe" ], [ 1, "#fec3fe" ] ] }, "plot_bgcolor": "white", "paper_bgcolor": "white", "shapedefaults": { "line": { "width": 0 }, "opacity": 0.4, "fillcolor": "#506784" }, "annotationdefaults": { "arrowhead": 0, "arrowcolor": "#506784", "arrowwidth": 1 } }, "themeRef": "PLOTLY_WHITE" } } }, "height": null, "width": null, "user": { "profile_url": "https://chart-studio.plotly.com/~AN24706", "avatar_url": "https://storage.googleapis.com/plotly-prod-profiles/43.jpg", "background_url": "https://storage.googleapis.com/plotly-prod-profiles/bg-13.jpg", "bio": "", "nickname": "", "website": "", "stream_tokens": null, "feature_set_id": null, "csrf_token": null, "date_joined": "2023-09-10 20:02:46", "mapbox_access_tokens": null, "has_password": null, "username": "AN24706", "email": null, "is_active": null, "readonly": null, "is_dash_creator": null, "dash_created_count": null, "is_chart_creator": null, "charts_created_count": null } }, { "creation_time": "2024-04-05T14:15:29.605945Z", "comments": { "results": [], "count": 0 }, "parented": true, "embed_url": "https://chart-studio.plotly.com/~sani21ip21/31.embed", "fid": "sani21ip21:31", "filename": "L_D", "filetype": "plot", "img_url": "https://storage.googleapis.com/plotly-prod-images/sani21ip21/31/9_Z5UBLGDZJ6E0RFPG1FOOEJG2A5V76A.png", "image_urls": { "default": "https://storage.googleapis.com/plotly-prod-images/sani21ip21/31/2_20ITS6X10R7WAU79BQSAOSDRVDVSYT.png", "block-thumb": "https://storage.googleapis.com/plotly-prod-images/sani21ip21/31/8_24SHSA5CQBJVEESCGBB9EFFG5XTEBC.png", "list-thumb": "https://storage.googleapis.com/plotly-prod-images/sani21ip21/31/9_Z5UBLGDZJ6E0RFPG1FOOEJG2A5V76A.png" }, "api_urls": { "files": "https://api.plotly.com/v2/files/sani21ip21:31", "plots": "https://api.plotly.com/v2/plots/sani21ip21:31", "parent": "https://api.plotly.com/v2/folders/home?user=sani21ip21" }, "owner": "sani21ip21", "parent": -1, "preview": "", "referencers": [], "references": [], "title": "", "views": 1, "web_url": "https://chart-studio.plotly.com/~sani21ip21/31/", "world_readable": true, "date_modified": "2024-04-05T14:15:29.617Z", "stars": { "results": [], "count": 0 }, "collaborators": { "results": [], "count": 0 }, "subfolder_count": null, "refresh_interval": null, "organize_view_url": "https://chart-studio.plotly.com/~sani21ip21/31/", "current_user_permission": "read", "is_theme": null, "is_template": false, "autosize": true, "caption": "", "figure": { "data": [ { "meta": { "columnNames": { "x": "A", "y": "B" } }, "mode": "markers+lines", "name": "Force", "type": "scatter", "xsrc": "sani21ip21:30:78a25b", "ysrc": "sani21ip21:30:e6d4f9" }, { "meta": { "columnNames": { "x": "A", "y": "C" } }, "mode": "markers+lines", "name": "Force/S", "type": "scatter", "xsrc": "sani21ip21:30:78a25b", "ysrc": "sani21ip21:30:fa2f1a", "yaxis": "y2", "stackgroup": null } ], "frames": [], "layout": { "xaxis": { "type": "linear", "range": [ 0.024141991924629846, 4.22585800807537 ], "title": { "text": "L/D" }, "showline": true, "autorange": true, "linecolor": "rgb(7, 7, 7)" }, "yaxis": { "type": "linear", "range": [ 0.05820857825590186, 0.38942415884409814 ], "title": { "text": "Force" }, "showline": true, "autorange": true, "linecolor": "rgb(7, 7, 7)" }, "legend": { "x": 1.02, "y": 0.9197651663405088 }, "yaxis2": { "side": "right", "type": "linear", "range": [ 0.00545551282051282, 0.02576448717948718 ], "title": { "text": "Force/S" }, "showline": true, "autorange": true, "linecolor": "rgb(7, 7, 7)", "overlaying": "y" }, "autosize": true, "template": { "data": { "bar": [ { "type": "bar", "marker": { "colorbar": { "ticks": "", "outlinewidth": 0 } } } ], "table": [ { "type": "table", "cells": { "fill": { "color": "#EBF0F8" }, "line": { "color": "white" } }, "header": { "fill": { "color": "#C8D4E3" }, "line": { "color": "white" } } } ], "carpet": [ { "type": "carpet", "aaxis": { "gridcolor": "#C8D4E3", "linecolor": "#C8D4E3", "endlinecolor": "#2a3f5f", "minorgridcolor": "#C8D4E3", "startlinecolor": "#2a3f5f" }, "baxis": { "gridcolor": "#C8D4E3", "linecolor": "#C8D4E3", "endlinecolor": "#2a3f5f", "minorgridcolor": "#C8D4E3", "startlinecolor": "#2a3f5f" } } ], "mesh3d": [ { "type": "mesh3d", "colorbar": { "ticks": "", "outlinewidth": 0 } } ], "contour": [ { "type": "contour", "colorbar": { "ticks": "", "outlinewidth": 0 }, "autocolorscale": true } ], "heatmap": [ { "type": "heatmap", "colorbar": { "ticks": "", "outlinewidth": 0 }, "autocolorscale": true } ], "scatter": [ { "type": "scatter", "marker": { "colorbar": { "ticks": "", "outlinewidth": 0 } } } ], "surface": [ { "type": "surface", "colorbar": { "ticks": "", "outlinewidth": 0 } } ], "heatmapgl": [ { "type": "heatmapgl", "colorbar": { "ticks": "", "outlinewidth": 0 } } ], "histogram": [ { "type": "histogram", "marker": { "colorbar": { "ticks": "", "outlinewidth": 0 } } } ], "parcoords": [ { "line": { "colorbar": { "ticks": "", "outlinewidth": 0 } }, "type": "parcoords" } ], "scatter3d": [ { "type": "scatter3d", "marker": { "colorbar": { "ticks": "", "outlinewidth": 0 } } } ], "scattergl": [ { "type": "scattergl", "marker": { "colorbar": { "ticks": "", "outlinewidth": 0 } } } ], "choropleth": [ { "type": "choropleth", "colorbar": { "ticks": "", "outlinewidth": 0 } } ], "scattergeo": [ { "type": "scattergeo", "marker": { "colorbar": { "ticks": "", "outlinewidth": 0 } } } ], "histogram2d": [ { "type": "histogram2d", "colorbar": { "ticks": "", "outlinewidth": 0 }, "autocolorscale": true } ], "scatterpolar": [ { "type": "scatterpolar", "marker": { "colorbar": { "ticks": "", "outlinewidth": 0 } } } ], "contourcarpet": [ { "type": "contourcarpet", "colorbar": { "ticks": "", "outlinewidth": 0 } } ], "scattercarpet": [ { "type": "scattercarpet", "marker": { "colorbar": { "ticks": "", "outlinewidth": 0 } } } ], "scattermapbox": [ { "type": "scattermapbox", "marker": { "colorbar": { "ticks": "", "outlinewidth": 0 } } } ], "scatterpolargl": [ { "type": "scatterpolargl", "marker": { "colorbar": { "ticks": "", "outlinewidth": 0 } } } ], "scatterternary": [ { "type": "scatterternary", "marker": { "colorbar": { "ticks": "", "outlinewidth": 0 } } } ], "histogram2dcontour": [ { "type": "histogram2dcontour", "colorbar": { "ticks": "", "outlinewidth": 0 }, "autocolorscale": true } ] }, "layout": { "geo": { "bgcolor": "white", "showland": true, "lakecolor": "white", "landcolor": "white", "showlakes": true, "subunitcolor": "#C8D4E3" }, "font": { "color": "#2a3f5f" }, "polar": { "bgcolor": "white", "radialaxis": { "ticks": "", "gridcolor": "#EBF0F8", "linecolor": "#EBF0F8" }, "angularaxis": { "ticks": "", "gridcolor": "#EBF0F8", "linecolor": "#EBF0F8" } }, "scene": { "xaxis": { "ticks": "", "gridcolor": "#DFE8F3", "gridwidth": 2, "linecolor": "#EBF0F8", "zerolinecolor": "#EBF0F8", "showbackground": true, "backgroundcolor": "white" }, "yaxis": { "ticks": "", "gridcolor": "#DFE8F3", "gridwidth": 2, "linecolor": "#EBF0F8", "zerolinecolor": "#EBF0F8", "showbackground": true, "backgroundcolor": "white" }, "zaxis": { "ticks": "", "gridcolor": "#DFE8F3", "gridwidth": 2, "linecolor": "#EBF0F8", "zerolinecolor": "#EBF0F8", "showbackground": true, "backgroundcolor": "white" } }, "title": { "x": 0.05 }, "xaxis": { "ticks": "", "gridcolor": "#EBF0F8", "linecolor": "#EBF0F8", "automargin": true, "zerolinecolor": "#EBF0F8", "zerolinewidth": 2 }, "yaxis": { "ticks": "", "gridcolor": "#EBF0F8", "linecolor": "#EBF0F8", "automargin": true, "zerolinecolor": "#EBF0F8", "zerolinewidth": 2 }, "ternary": { "aaxis": { "ticks": "", "gridcolor": "#DFE8F3", "linecolor": "#A2B1C6" }, "baxis": { "ticks": "", "gridcolor": "#DFE8F3", "linecolor": "#A2B1C6" }, "caxis": { "ticks": "", "gridcolor": "#DFE8F3", "linecolor": "#A2B1C6" }, "bgcolor": "white" }, "colorway": [ "#636efa", "#EF553B", "#00cc96", "#ab63fa", "#19d3f3", "#e763fa", "#fecb52", "#ffa15a", "#ff6692", "#b6e880" ], "hovermode": "closest", "colorscale": { "diverging": [ [ 0, "#8e0152" ], [ 0.1, "#c51b7d" ], [ 0.2, "#de77ae" ], [ 0.3, "#f1b6da" ], [ 0.4, "#fde0ef" ], [ 0.5, "#f7f7f7" ], [ 0.6, "#e6f5d0" ], [ 0.7, "#b8e186" ], [ 0.8, "#7fbc41" ], [ 0.9, "#4d9221" ], [ 1, "#276419" ] ], "sequential": [ [ 0, "#0508b8" ], [ 0.0893854748603352, "#1910d8" ], [ 0.1787709497206704, "#3c19f0" ], [ 0.2681564245810056, "#6b1cfb" ], [ 0.3575418994413408, "#981cfd" ], [ 0.44692737430167595, "#bf1cfd" ], [ 0.5363128491620112, "#dd2bfd" ], [ 0.6256983240223464, "#f246fe" ], [ 0.7150837988826816, "#fc67fd" ], [ 0.8044692737430168, "#fe88fc" ], [ 0.8938547486033519, "#fea5fd" ], [ 0.9832402234636871, "#febefe" ], [ 1, "#fec3fe" ] ], "sequentialminus": [ [ 0, "#0508b8" ], [ 0.0893854748603352, "#1910d8" ], [ 0.1787709497206704, "#3c19f0" ], [ 0.2681564245810056, "#6b1cfb" ], [ 0.3575418994413408, "#981cfd" ], [ 0.44692737430167595, "#bf1cfd" ], [ 0.5363128491620112, "#dd2bfd" ], [ 0.6256983240223464, "#f246fe" ], [ 0.7150837988826816, "#fc67fd" ], [ 0.8044692737430168, "#fe88fc" ], [ 0.8938547486033519, "#fea5fd" ], [ 0.9832402234636871, "#febefe" ], [ 1, "#fec3fe" ] ] }, "plot_bgcolor": "white", "paper_bgcolor": "white", "shapedefaults": { "line": { "width": 0 }, "opacity": 0.4, "fillcolor": "#506784" }, "annotationdefaults": { "arrowhead": 0, "arrowcolor": "#506784", "arrowwidth": 1 } }, "themeRef": "PLOTLY_WHITE" } } }, "height": null, "width": null, "user": { "profile_url": "https://chart-studio.plotly.com/~sani21ip21", "avatar_url": "https://storage.googleapis.com/plotly-prod-profiles/10.jpg", "background_url": "https://storage.googleapis.com/plotly-prod-profiles/bg-3.jpg", "bio": "", "nickname": "", "website": "", "stream_tokens": null, "feature_set_id": null, "csrf_token": null, "date_joined": "2023-12-27 17:14:52", "mapbox_access_tokens": null, "has_password": null, "username": "sani21ip21", "email": null, "is_active": null, "readonly": null, "is_dash_creator": null, "dash_created_count": null, "is_chart_creator": null, "charts_created_count": null } } ] }
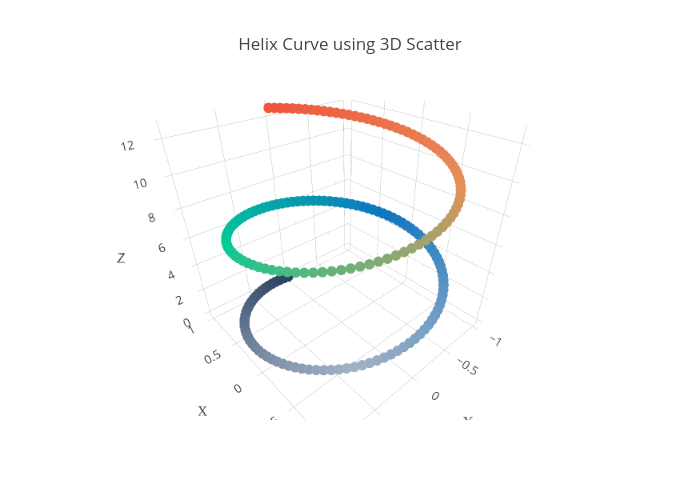