Plots List
Plots
This endpoint handles manipulation of Plotly plot files.
Reference
Authorization
Any user with or without a Plotly account may view public plots. For private plots, see authentication.
Actions
list
Listing all public plots can be done via a GET request to this endpoint.
By default, plots will be listed in order of date created. The order_by
query parameter is accepted at this endpoint. Currently, only ordering by
views is supported. It is possible to filter the plots by quality
with min_quality or max_quality as query parameter.
Example:
// GET https://api.plotly.com/v2/plots/ ---> 200

// GET https://api.plotly.com/v2/plots/?order_by=-views ---> 200

// GET https://api.plotly.com/v2/plots/?min_quality=5 ---> 200

// GET https://api.plotly.com/v2/plots/?max_quality=5 ---> 200
feed
Listing all handpicked feed plots can be done via a GET request to this endpoint. By default, plots will be listed in a random order.
Example:
// GET https://api.plotly.com/v2/plots/feed ---> 200
create
You can create new plot resources here. The only required field is 'figure'. Currently, the figure is restricted to only contain references to grid data. That is, this will fail if raw data arrays are passed in. To create and manipulate underlying grids for plots, see the grids endpoint.
Example:
// This fails because a figure field is required.
// POST https://api.plotly.com/v2/plots ---> 400 Bad Request
{}

// This fails because the figure has raw data
//POST https://api.plotly.com/v2/plots ---> 400 Bad Request
{
    "figure": {"data": [{"y": ['this', 'is', 'raw', 'data']}]}
}

// This succeeds because the figure has src keys, not raw data.
//POST https://api.plotly.com/v2/plots ---> 200 OK
{
    "figure": {"data": [{"ysrc": "sven:88:u8nd62"}]}
}
When creating a grid, you can optionally specify a source_fid to specify where a plot has come from:
- source_fid: the fid of a plot that was copied (and presumably edited) to produce this one
detail
There is a lot of meta information stored about plot files including filename, title, share_url, and content_url to name a few.
This information can only be reached with a GET to this endpoint.
Example:
// GET https://api.plotly.com/v2/plots/iheartgraphs:90
content
The contents of a plot can be downloaded via the content resource. The plot
content contains referenced grid/column data by default. If you wish to
return the raw grid/column data, the inline_data=true query must be included
in the request url. The Content-Type header will be appropriately set for the
response body.
Alternatively, you can set ?map_data=unreadable to append a mapping of
sources to data that belongs to grids which are unreadable for the
requestor. This is useful when you have read access to another users plot,
but that plot contains grid references which you don't have access to.
Examples:
// Returns referenced grid/column data
// GET https://api.plotly.com/v2/plots/iheartgraphs:90/content ---> 200 OK

// Returns full grid/column data
// GET https://api.plotly.com/v2/plots/iheartgraphs:90/content?inline_data=true ---> 200 OK

// Returns full grid/column data when requestor doesn't have permission
// to read the referenced grid.
// GET https://api.plotly.com/v2/plots/iheartgraphs:90/content?map_data=unreadable ---> 200 OK
GET /v2/plots?cursor=cj0xJnA9MjAyNC0wNC0wNCsxOCUzQTU1JTNBMzYuNTA2NTQxJTJCMDAlM0EwMA%3D%3D&format=api
{ "next": "https://api.plot.ly/v2/plots?cursor=cD0yMDI0LTA0LTA0KzE5JTNBMDYlM0E0OC4yMDg2OTUlMkIwMCUzQTAw&format=api", "previous": "https://api.plot.ly/v2/plots?cursor=cj0xJnA9MjAyNC0wNC0wNCsyMSUzQTE5JTNBNDkuMjE1MzEwJTJCMDAlM0EwMA%3D%3D&format=api", "results": [ { "creation_time": "2024-04-04T21:19:49.215310Z", "comments": { "results": [], "count": 0 }, "parented": true, "embed_url": "https://chart-studio.plotly.com/~lmalves/315.embed", "fid": "lmalves:315", "filename": "MeD novo g mestres", "filetype": "plot", "img_url": "https://storage.googleapis.com/plotly-prod-images/lmalves/315/9_SWN6TX9BKO5JPNB5O9ZQ6SHPTSHXRF.png", "image_urls": { "default": "https://storage.googleapis.com/plotly-prod-images/lmalves/315/2_M3QXPUNDY3MJPURVN61XVC9PT76Z68.png", "block-thumb": "https://storage.googleapis.com/plotly-prod-images/lmalves/315/8_J80I978KKMTNN7648AR9Y5LVFMQI2Y.png", "list-thumb": "https://storage.googleapis.com/plotly-prod-images/lmalves/315/9_SWN6TX9BKO5JPNB5O9ZQ6SHPTSHXRF.png" }, "api_urls": { "files": "https://api.plotly.com/v2/files/lmalves:315", "plots": "https://api.plotly.com/v2/plots/lmalves:315", "parent": "https://api.plotly.com/v2/folders/home?user=lmalves" }, "owner": "lmalves", "parent": -1, "preview": "", "referencers": [], "references": [], "title": "", "views": 89, "web_url": "https://chart-studio.plotly.com/~lmalves/315/", "world_readable": true, "date_modified": "2024-05-14T17:30:05.090Z", "stars": { "results": [], "count": 0 }, "collaborators": { "results": [], "count": 0 }, "subfolder_count": null, "refresh_interval": null, "organize_view_url": "https://chart-studio.plotly.com/~lmalves/315/", "current_user_permission": "read", "is_theme": null, "is_template": false, "autosize": false, "caption": "", "figure": { "data": [ { "meta": { "columnNames": { "x": "B", "y": "A" } }, "mode": "markers", "type": "scatter", "xsrc": "lmalves:314:8503cb", "ysrc": "lmalves:314:bed795", "marker": { "line": { "color": "rgb(255, 255, 255)" }, "size": 12, "color": "rgb(255, 255, 255)", "opacity": 0 }, "visible": true, "hoverinfo": "none", "showlegend": false, "legendgroup": 1, "orientation": "v" }, { "meta": { "columnNames": { "x": "B", "y": "A", "text": "D" } }, "mode": "markers", "name": "2009", "type": "scatter", "xsrc": "lmalves:314:8503cb", "ysrc": "lmalves:314:bed795", "marker": { "size": 9, "color": "rgb(226, 88, 34)" }, "opacity": 0.8, "textsrc": "lmalves:314:507605", "visible": true, "hoverinfo": "text", "hoverlabel": { "align": "left" }, "legendgroup": 1 }, { "meta": { "columnNames": { "x": "C", "y": "A", "text": "E" } }, "mode": "markers", "name": "2021", "type": "scatter", "xsrc": "lmalves:314:5ca087", "ysrc": "lmalves:314:bed795", "marker": { "size": 12, "color": "rgb(22, 36, 94)" }, "textsrc": "lmalves:314:d136cb", "visible": true, "hoverinfo": "text", "hoverlabel": { "align": "left" }, "stackgroup": null, "legendgroup": 2 }, { "meta": { "columnNames": { "x": "B", "y": "A" } }, "type": "bar", "xsrc": "lmalves:314:8503cb", "ysrc": "lmalves:314:bed795", "marker": { "color": "rgb(153, 153, 153)" }, "visible": true, "showlegend": false, "legendgroup": 1, "orientation": "h" }, { "meta": { "columnNames": { "x": "C", "y": "A" } }, "mode": "markers", "type": "bar", "xsrc": "lmalves:314:5ca087", "ysrc": "lmalves:314:bed795", "marker": { "color": "rgb(153, 153, 153)" }, "visible": true, "showlegend": false, "stackgroup": null, "legendgroup": 2, "orientation": "h" } ], "frames": [], "layout": { "font": { "size": 13, "family": "Roboto" }, "title": { "text": "<br>" }, "width": 600, "xaxis": { "type": "linear", "dtick": 5, "range": [ -1, 25 ], "ticks": "outside", "title": { "font": { "size": 13 }, "text": "<b>Mestres empregados por mil empregados </b>" }, "tickmode": "linear", "autorange": false, "showticklabels": true }, "yaxis": { "type": "category", "range": [ -1, 27.8 ], "ticks": "", "title": { "font": { "size": 13 }, "text": "" }, "showgrid": true, "autorange": false }, "bargap": 0.998, "height": 701, "legend": { "x": 0.5, "y": -0.15, "valign": "middle", "xanchor": "center", "yanchor": "top", "orientation": "h" }, "margin": { "b": 80, "l": 80, "r": 0, "t": 25 }, "barmode": "overlay", "autosize": false, "template": { "data": { "bar": [ { "type": "bar", "marker": { "colorbar": { "ticks": "", "outlinewidth": 0 } } } ], "table": [ { "type": "table", "cells": { "fill": { "color": "#EBF0F8" }, "line": { "color": "white" } }, "header": { "fill": { "color": "#C8D4E3" }, "line": { "color": "white" } } } ], "carpet": [ { "type": "carpet", "aaxis": { "gridcolor": "#C8D4E3", "linecolor": "#C8D4E3", "endlinecolor": "#2a3f5f", "minorgridcolor": "#C8D4E3", "startlinecolor": "#2a3f5f" }, "baxis": { "gridcolor": "#C8D4E3", "linecolor": "#C8D4E3", "endlinecolor": "#2a3f5f", "minorgridcolor": "#C8D4E3", "startlinecolor": "#2a3f5f" } } ], "mesh3d": [ { "type": "mesh3d", "colorbar": { "ticks": "", "outlinewidth": 0 } } ], "contour": [ { "type": "contour", "colorbar": { "ticks": "", "outlinewidth": 0 }, "autocolorscale": true } ], "heatmap": [ { "type": "heatmap", "colorbar": { "ticks": "", "outlinewidth": 0 }, "autocolorscale": true } ], "scatter": [ { "type": "scatter", "marker": { "colorbar": { "ticks": "", "outlinewidth": 0 } } } ], "surface": [ { "type": "surface", "colorbar": { "ticks": "", "outlinewidth": 0 } } ], "heatmapgl": [ { "type": "heatmapgl", "colorbar": { "ticks": "", "outlinewidth": 0 } } ], "histogram": [ { "type": "histogram", "marker": { "colorbar": { "ticks": "", "outlinewidth": 0 } } } ], "parcoords": [ { "line": { "colorbar": { "ticks": "", "outlinewidth": 0 } }, "type": "parcoords" } ], "scatter3d": [ { "type": "scatter3d", "marker": { "colorbar": { "ticks": "", "outlinewidth": 0 } } } ], "scattergl": [ { "type": "scattergl", "marker": { "colorbar": { "ticks": "", "outlinewidth": 0 } } } ], "choropleth": [ { "type": "choropleth", "colorbar": { "ticks": "", "outlinewidth": 0 } } ], "scattergeo": [ { "type": "scattergeo", "marker": { "colorbar": { "ticks": "", "outlinewidth": 0 } } } ], "histogram2d": [ { "type": "histogram2d", "colorbar": { "ticks": "", "outlinewidth": 0 }, "autocolorscale": true } ], "scatterpolar": [ { "type": "scatterpolar", "marker": { "colorbar": { "ticks": "", "outlinewidth": 0 } } } ], "contourcarpet": [ { "type": "contourcarpet", "colorbar": { "ticks": "", "outlinewidth": 0 } } ], "scattercarpet": [ { "type": "scattercarpet", "marker": { "colorbar": { "ticks": "", "outlinewidth": 0 } } } ], "scattermapbox": [ { "type": "scattermapbox", "marker": { "colorbar": { "ticks": "", "outlinewidth": 0 } } } ], "scatterpolargl": [ { "type": "scatterpolargl", "marker": { "colorbar": { "ticks": "", "outlinewidth": 0 } } } ], "scatterternary": [ { "type": "scatterternary", "marker": { "colorbar": { "ticks": "", "outlinewidth": 0 } } } ], "histogram2dcontour": [ { "type": "histogram2dcontour", "colorbar": { "ticks": "", "outlinewidth": 0 }, "autocolorscale": true } ] }, "layout": { "geo": { "bgcolor": "white", "showland": true, "lakecolor": "white", "landcolor": "white", "showlakes": true, "subunitcolor": "#C8D4E3" }, "font": { "color": "#2a3f5f" }, "polar": { "bgcolor": "white", "radialaxis": { "ticks": "", "gridcolor": "#EBF0F8", "linecolor": "#EBF0F8" }, "angularaxis": { "ticks": "", "gridcolor": "#EBF0F8", "linecolor": "#EBF0F8" } }, "scene": { "xaxis": { "ticks": "", "gridcolor": "#DFE8F3", "gridwidth": 2, "linecolor": "#EBF0F8", "zerolinecolor": "#EBF0F8", "showbackground": true, "backgroundcolor": "white" }, "yaxis": { "ticks": "", "gridcolor": "#DFE8F3", "gridwidth": 2, "linecolor": "#EBF0F8", "zerolinecolor": "#EBF0F8", "showbackground": true, "backgroundcolor": "white" }, "zaxis": { "ticks": "", "gridcolor": "#DFE8F3", "gridwidth": 2, "linecolor": "#EBF0F8", "zerolinecolor": "#EBF0F8", "showbackground": true, "backgroundcolor": "white" } }, "title": { "x": 0.05 }, "xaxis": { "ticks": "", "gridcolor": "#EBF0F8", "linecolor": "#EBF0F8", "automargin": true, "zerolinecolor": "#EBF0F8", "zerolinewidth": 2 }, "yaxis": { "ticks": "", "gridcolor": "#EBF0F8", "linecolor": "#EBF0F8", "automargin": true, "zerolinecolor": "#EBF0F8", "zerolinewidth": 2 }, "ternary": { "aaxis": { "ticks": "", "gridcolor": "#DFE8F3", "linecolor": "#A2B1C6" }, "baxis": { "ticks": "", "gridcolor": "#DFE8F3", "linecolor": "#A2B1C6" }, "caxis": { "ticks": "", "gridcolor": "#DFE8F3", "linecolor": "#A2B1C6" }, "bgcolor": "white" }, "colorway": [ "#636efa", "#EF553B", "#00cc96", "#ab63fa", "#19d3f3", "#e763fa", "#fecb52", "#ffa15a", "#ff6692", "#b6e880" ], "hovermode": "closest", "colorscale": { "diverging": [ [ 0, "#8e0152" ], [ 0.1, "#c51b7d" ], [ 0.2, "#de77ae" ], [ 0.3, "#f1b6da" ], [ 0.4, "#fde0ef" ], [ 0.5, "#f7f7f7" ], [ 0.6, "#e6f5d0" ], [ 0.7, "#b8e186" ], [ 0.8, "#7fbc41" ], [ 0.9, "#4d9221" ], [ 1, "#276419" ] ], "sequential": [ [ 0, "#0508b8" ], [ 0.0893854748603352, "#1910d8" ], [ 0.1787709497206704, "#3c19f0" ], [ 0.2681564245810056, "#6b1cfb" ], [ 0.3575418994413408, "#981cfd" ], [ 0.44692737430167595, "#bf1cfd" ], [ 0.5363128491620112, "#dd2bfd" ], [ 0.6256983240223464, "#f246fe" ], [ 0.7150837988826816, "#fc67fd" ], [ 0.8044692737430168, "#fe88fc" ], [ 0.8938547486033519, "#fea5fd" ], [ 0.9832402234636871, "#febefe" ], [ 1, "#fec3fe" ] ], "sequentialminus": [ [ 0, "#0508b8" ], [ 0.0893854748603352, "#1910d8" ], [ 0.1787709497206704, "#3c19f0" ], [ 0.2681564245810056, "#6b1cfb" ], [ 0.3575418994413408, "#981cfd" ], [ 0.44692737430167595, "#bf1cfd" ], [ 0.5363128491620112, "#dd2bfd" ], [ 0.6256983240223464, "#f246fe" ], [ 0.7150837988826816, "#fc67fd" ], [ 0.8044692737430168, "#fe88fc" ], [ 0.8938547486033519, "#fea5fd" ], [ 0.9832402234636871, "#febefe" ], [ 1, "#fec3fe" ] ] }, "plot_bgcolor": "white", "paper_bgcolor": "white", "shapedefaults": { "line": { "width": 0 }, "opacity": 0.4, "fillcolor": "#506784" }, "annotationdefaults": { "arrowhead": 0, "arrowcolor": "#506784", "arrowwidth": 1 } }, "themeRef": "PLOTLY_WHITE" }, "hoverlabel": { "font": { "family": "Roboto" } } } }, "height": 701, "width": 600, "user": { "profile_url": "https://chart-studio.plotly.com/~lmalves", "avatar_url": "https://storage.googleapis.com/plotly-prod-profiles/69.jpg", "background_url": "https://storage.googleapis.com/plotly-prod-profiles/bg-1.jpg", "bio": "", "nickname": "", "website": "", "stream_tokens": null, "feature_set_id": null, "csrf_token": null, "date_joined": "2019-11-28 13:10:38", "mapbox_access_tokens": null, "has_password": null, "username": "lmalves", "email": null, "is_active": null, "readonly": null, "is_dash_creator": null, "dash_created_count": null, "is_chart_creator": null, "charts_created_count": null } }, { "creation_time": "2024-04-04T20:56:55.147503Z", "comments": { "results": [], "count": 0 }, "parented": true, "embed_url": "https://chart-studio.plotly.com/~pmccarty/3.embed", "fid": "pmccarty:3", "filename": "LOS-GCS", "filetype": "plot", "img_url": "https://storage.googleapis.com/plotly-prod-images/pmccarty/3/9_OL0VVGWDVO58UWED5AIN6S8M24OE1O.png", "image_urls": { "default": "https://storage.googleapis.com/plotly-prod-images/pmccarty/3/2_7ZDWDT6OQ90O7WVOLF2ZXTP7JLU4BR.png", "block-thumb": "https://storage.googleapis.com/plotly-prod-images/pmccarty/3/8_5QI30XNF7N67RAN61O25EG3R3HVLZZ.png", "list-thumb": "https://storage.googleapis.com/plotly-prod-images/pmccarty/3/9_OL0VVGWDVO58UWED5AIN6S8M24OE1O.png" }, "api_urls": { "files": "https://api.plotly.com/v2/files/pmccarty:3", "plots": "https://api.plotly.com/v2/plots/pmccarty:3", "parent": "https://api.plotly.com/v2/folders/home?user=pmccarty" }, "owner": "pmccarty", "parent": -1, "preview": "", "referencers": [], "references": [], "title": "", "views": 2, "web_url": "https://chart-studio.plotly.com/~pmccarty/3/", "world_readable": true, "date_modified": "2024-04-04T20:56:55.157Z", "stars": { "results": [], "count": 0 }, "collaborators": { "results": [], "count": 0 }, "subfolder_count": null, "refresh_interval": null, "organize_view_url": "https://chart-studio.plotly.com/~pmccarty/3/", "current_user_permission": "read", "is_theme": null, "is_template": false, "autosize": true, "caption": "", "figure": { "data": [ { "meta": { "columnNames": { "x": "LOS_daysF", "y": "GCS" } }, "mode": "markers", "type": "scatter", "xsrc": "pmccarty:2:38222c", "ysrc": "pmccarty:2:4940a9", "transforms": [ { "meta": { "columnNames": { "groups": "outcome" } }, "type": "groupby", "styles": [ { "value": { "mode": "markers", "name": "Survived", "marker": { "line": { "width": 1 }, "size": 8, "symbol": "circle-open" } }, "target": "0" }, { "value": { "name": "Died", "marker": { "line": { "width": 1 }, "size": 8, "symbol": "circle-open" }, "stackgroup": "" }, "target": "1" } ], "groupssrc": "pmccarty:2:090d3b" } ] } ], "frames": [], "layout": { "scene": { "aspectmode": "auto", "aspectratio": { "x": 1, "y": 1, "z": 1 } }, "xaxis": { "type": "linear", "range": [ 0.010749123806164107, 72.32442412608607 ], "title": { "font": { "size": 18 }, "text": "Length of stay (days)" }, "domain": [ 0, 0.375 ], "showgrid": false, "showline": true, "tickfont": { "size": 14 }, "autorange": false, "gridwidth": 0, "linewidth": 3 }, "yaxis": { "type": "linear", "range": [ 2.201031950783886, 15.798968049216114 ], "title": { "font": { "size": 18 }, "text": "Glasgow Coma Scale" }, "domain": [ 0, 1 ], "showline": true, "tickfont": { "size": 14 }, "tickmode": "linear", "autorange": true, "gridwidth": 0, "linewidth": 3 }, "legend": { "x": 0.12526121748168026, "y": -0.1198903859328613, "font": { "size": 14 }, "borderwidth": 0, "orientation": "h" }, "mapbox": {}, "boxmode": "group", "autosize": true, "template": { "data": { "bar": [ { "type": "bar", "marker": { "colorbar": { "ticks": "", "outlinewidth": 0 } } } ], "table": [ { "type": "table", "cells": { "fill": { "color": "#EBF0F8" }, "line": { "color": "white" } }, "header": { "fill": { "color": "#C8D4E3" }, "line": { "color": "white" } } } ], "carpet": [ { "type": "carpet", "aaxis": { "gridcolor": "#C8D4E3", "linecolor": "#C8D4E3", "endlinecolor": "#2a3f5f", "minorgridcolor": "#C8D4E3", "startlinecolor": "#2a3f5f" }, "baxis": { "gridcolor": "#C8D4E3", "linecolor": "#C8D4E3", "endlinecolor": "#2a3f5f", "minorgridcolor": "#C8D4E3", "startlinecolor": "#2a3f5f" } } ], "mesh3d": [ { "type": "mesh3d", "colorbar": { "ticks": "", "outlinewidth": 0 } } ], "contour": [ { "type": "contour", "colorbar": { "ticks": "", "outlinewidth": 0 }, "autocolorscale": true } ], "heatmap": [ { "type": "heatmap", "colorbar": { "ticks": "", "outlinewidth": 0 }, "autocolorscale": true } ], "scatter": [ { "type": "scatter", "marker": { "colorbar": { "ticks": "", "outlinewidth": 0 } } } ], "surface": [ { "type": "surface", "colorbar": { "ticks": "", "outlinewidth": 0 } } ], "heatmapgl": [ { "type": "heatmapgl", "colorbar": { "ticks": "", "outlinewidth": 0 } } ], "histogram": [ { "type": "histogram", "marker": { "colorbar": { "ticks": "", "outlinewidth": 0 } } } ], "parcoords": [ { "line": { "colorbar": { "ticks": "", "outlinewidth": 0 } }, "type": "parcoords" } ], "scatter3d": [ { "type": "scatter3d", "marker": { "colorbar": { "ticks": "", "outlinewidth": 0 } } } ], "scattergl": [ { "type": "scattergl", "marker": { "colorbar": { "ticks": "", "outlinewidth": 0 } } } ], "choropleth": [ { "type": "choropleth", "colorbar": { "ticks": "", "outlinewidth": 0 } } ], "scattergeo": [ { "type": "scattergeo", "marker": { "colorbar": { "ticks": "", "outlinewidth": 0 } } } ], "histogram2d": [ { "type": "histogram2d", "colorbar": { "ticks": "", "outlinewidth": 0 }, "autocolorscale": true } ], "scatterpolar": [ { "type": "scatterpolar", "marker": { "colorbar": { "ticks": "", "outlinewidth": 0 } } } ], "contourcarpet": [ { "type": "contourcarpet", "colorbar": { "ticks": "", "outlinewidth": 0 } } ], "scattercarpet": [ { "type": "scattercarpet", "marker": { "colorbar": { "ticks": "", "outlinewidth": 0 } } } ], "scattermapbox": [ { "type": "scattermapbox", "marker": { "colorbar": { "ticks": "", "outlinewidth": 0 } } } ], "scatterpolargl": [ { "type": "scatterpolargl", "marker": { "colorbar": { "ticks": "", "outlinewidth": 0 } } } ], "scatterternary": [ { "type": "scatterternary", "marker": { "colorbar": { "ticks": "", "outlinewidth": 0 } } } ], "histogram2dcontour": [ { "type": "histogram2dcontour", "colorbar": { "ticks": "", "outlinewidth": 0 }, "autocolorscale": true } ] }, "layout": { "geo": { "bgcolor": "white", "showland": true, "lakecolor": "white", "landcolor": "white", "showlakes": true, "subunitcolor": "#C8D4E3" }, "font": { "color": "#2a3f5f" }, "polar": { "bgcolor": "white", "radialaxis": { "ticks": "", "gridcolor": "#EBF0F8", "linecolor": "#EBF0F8" }, "angularaxis": { "ticks": "", "gridcolor": "#EBF0F8", "linecolor": "#EBF0F8" } }, "scene": { "xaxis": { "ticks": "", "gridcolor": "#DFE8F3", "gridwidth": 2, "linecolor": "#EBF0F8", "zerolinecolor": "#EBF0F8", "showbackground": true, "backgroundcolor": "white" }, "yaxis": { "ticks": "", "gridcolor": "#DFE8F3", "gridwidth": 2, "linecolor": "#EBF0F8", "zerolinecolor": "#EBF0F8", "showbackground": true, "backgroundcolor": "white" }, "zaxis": { "ticks": "", "gridcolor": "#DFE8F3", "gridwidth": 2, "linecolor": "#EBF0F8", "zerolinecolor": "#EBF0F8", "showbackground": true, "backgroundcolor": "white" } }, "title": { "x": 0.05 }, "xaxis": { "ticks": "", "gridcolor": "#EBF0F8", "linecolor": "#EBF0F8", "automargin": true, "zerolinecolor": "#EBF0F8", "zerolinewidth": 2 }, "yaxis": { "ticks": "", "gridcolor": "#EBF0F8", "linecolor": "#EBF0F8", "automargin": true, "zerolinecolor": "#EBF0F8", "zerolinewidth": 2 }, "ternary": { "aaxis": { "ticks": "", "gridcolor": "#DFE8F3", "linecolor": "#A2B1C6" }, "baxis": { "ticks": "", "gridcolor": "#DFE8F3", "linecolor": "#A2B1C6" }, "caxis": { "ticks": "", "gridcolor": "#DFE8F3", "linecolor": "#A2B1C6" }, "bgcolor": "white" }, "colorway": [ "#636efa", "#EF553B", "#00cc96", "#ab63fa", "#19d3f3", "#e763fa", "#fecb52", "#ffa15a", "#ff6692", "#b6e880" ], "hovermode": "closest", "colorscale": { "diverging": [ [ 0, "#8e0152" ], [ 0.1, "#c51b7d" ], [ 0.2, "#de77ae" ], [ 0.3, "#f1b6da" ], [ 0.4, "#fde0ef" ], [ 0.5, "#f7f7f7" ], [ 0.6, "#e6f5d0" ], [ 0.7, "#b8e186" ], [ 0.8, "#7fbc41" ], [ 0.9, "#4d9221" ], [ 1, "#276419" ] ], "sequential": [ [ 0, "#0508b8" ], [ 0.0893854748603352, "#1910d8" ], [ 0.1787709497206704, "#3c19f0" ], [ 0.2681564245810056, "#6b1cfb" ], [ 0.3575418994413408, "#981cfd" ], [ 0.44692737430167595, "#bf1cfd" ], [ 0.5363128491620112, "#dd2bfd" ], [ 0.6256983240223464, "#f246fe" ], [ 0.7150837988826816, "#fc67fd" ], [ 0.8044692737430168, "#fe88fc" ], [ 0.8938547486033519, "#fea5fd" ], [ 0.9832402234636871, "#febefe" ], [ 1, "#fec3fe" ] ], "sequentialminus": [ [ 0, "#0508b8" ], [ 0.0893854748603352, "#1910d8" ], [ 0.1787709497206704, "#3c19f0" ], [ 0.2681564245810056, "#6b1cfb" ], [ 0.3575418994413408, "#981cfd" ], [ 0.44692737430167595, "#bf1cfd" ], [ 0.5363128491620112, "#dd2bfd" ], [ 0.6256983240223464, "#f246fe" ], [ 0.7150837988826816, "#fc67fd" ], [ 0.8044692737430168, "#fe88fc" ], [ 0.8938547486033519, "#fea5fd" ], [ 0.9832402234636871, "#febefe" ], [ 1, "#fec3fe" ] ] }, "plot_bgcolor": "white", "paper_bgcolor": "white", "shapedefaults": { "line": { "width": 0 }, "opacity": 0.4, "fillcolor": "#506784" }, "annotationdefaults": { "arrowhead": 0, "arrowcolor": "#506784", "arrowwidth": 1 } }, "themeRef": "PLOTLY_WHITE" }, "showlegend": true } }, "height": null, "width": null, "user": { "profile_url": "https://chart-studio.plotly.com/~pmccarty", "avatar_url": "https://storage.googleapis.com/plotly-prod-profiles/46.jpg", "background_url": "https://storage.googleapis.com/plotly-prod-profiles/bg-2.jpg", "bio": "", "nickname": "", "website": "", "stream_tokens": null, "feature_set_id": null, "csrf_token": null, "date_joined": "2024-04-03 00:33:40", "mapbox_access_tokens": null, "has_password": null, "username": "pmccarty", "email": null, "is_active": null, "readonly": null, "is_dash_creator": null, "dash_created_count": null, "is_chart_creator": null, "charts_created_count": null } }, { "creation_time": "2024-04-04T20:45:20.527997Z", "comments": { "results": [], "count": 0 }, "parented": true, "embed_url": "https://chart-studio.plotly.com/~rsheffner/3.embed", "fid": "rsheffner:3", "filename": "Skin Tones: L'Oreal interpolation", "filetype": "plot", "img_url": "https://storage.googleapis.com/plotly-prod-images/rsheffner/3/9_3RYLSKIY1Q5LDQY9GFR7D48IHH94GD.png", "image_urls": { "default": "https://storage.googleapis.com/plotly-prod-images/rsheffner/3/2_RVJTLE3MP6IE7G4LDQ3JUK18QEGEEG.png", "block-thumb": "https://storage.googleapis.com/plotly-prod-images/rsheffner/3/8_NALAO9CLJ9I9VIIL2EIA2MC2M7SB8N.png", "list-thumb": "https://storage.googleapis.com/plotly-prod-images/rsheffner/3/9_3RYLSKIY1Q5LDQY9GFR7D48IHH94GD.png" }, "api_urls": { "files": "https://api.plotly.com/v2/files/rsheffner:3", "plots": "https://api.plotly.com/v2/plots/rsheffner:3", "parent": "https://api.plotly.com/v2/folders/home?user=rsheffner" }, "owner": "rsheffner", "parent": -1, "preview": "", "referencers": [], "references": [], "title": "", "views": 3, "web_url": "https://chart-studio.plotly.com/~rsheffner/3/", "world_readable": true, "date_modified": "2024-04-12T14:02:57.093Z", "stars": { "results": [], "count": 0 }, "collaborators": { "results": [], "count": 0 }, "subfolder_count": null, "refresh_interval": null, "organize_view_url": "https://chart-studio.plotly.com/~rsheffner/3/", "current_user_permission": "read", "is_theme": null, "is_template": false, "autosize": true, "caption": "", "figure": { "data": [ { "line": { "color": "black", "width": 3 }, "meta": { "columnNames": { "x": "x", "y": "y", "z": "z", "marker": { "color": "x" } } }, "mode": "markers", "type": "scatter3d", "xsrc": "rsheffner:2:d1acbc", "ysrc": "rsheffner:2:48b987", "zsrc": "rsheffner:2:b3a5f5", "marker": { "cmax": 255, "cmin": 0, "meta": { "columnNames": { "color": "x" } }, "size": 6, "cauto": false, "colorsrc": "rsheffner:2:d1acbc", "colorscale": [ [ 0, "#00224e" ], [ 0.1111111111111111, "#123570" ], [ 0.2222222222222222, "#3b496c" ], [ 0.3333333333333333, "#575d6d" ], [ 0.4444444444444444, "#707173" ], [ 0.5555555555555556, "#8a8678" ], [ 0.6666666666666666, "#a59c74" ], [ 0.7777777777777778, "#c3b369" ], [ 0.8888888888888888, "#e1cc55" ], [ 1, "#fee838" ] ], "reversescale": false, "autocolorscale": false }, "autocolorscale": false } ], "frames": [], "layout": { "scene": { "xaxis": { "type": "linear", "dtick": 0.5, "range": [ 0, 255 ], "tick0": 0, "title": { "font": { "family": "Times New Roman" }, "text": "R" }, "nticks": 0, "showgrid": true, "showline": false, "tickmode": "auto", "zeroline": false, "autorange": false, "rangemode": "normal", "showbackground": false }, "yaxis": { "type": "linear", "dtick": 0.5, "range": [ 0, 255 ], "tick0": 0, "title": { "font": { "family": "Times New Roman" }, "text": "G" }, "nticks": 0, "showgrid": true, "tickmode": "auto", "zeroline": false, "autorange": false, "rangemode": "normal" }, "zaxis": { "type": "linear", "dtick": 2, "range": [ 6, 255 ], "tick0": 0, "title": { "font": { "family": "Arial" }, "text": "B" }, "nticks": 0, "showgrid": true, "tickmode": "auto", "zeroline": false, "autorange": false, "rangemode": "normal" }, "camera": { "up": { "x": 0, "y": 0, "z": 1 }, "eye": { "x": -0.06730366801455617, "y": 0.003160699639235976, "z": 1.5684027800646347 }, "center": { "x": -0.06730366801455621, "y": 0.0031606996392360654, "z": -0.07369645044279095 }, "projection": { "type": "perspective" } }, "aspectmode": "auto", "aspectratio": { "x": 1.0194458821483197, "y": 0.9788997391083297, "z": 1.0020689637026097 } }, "title": { "text": "L'Oreal Skin Tones - with interpolation" }, "autosize": true, "colorscale": { "sequential": [ [ 0, "#000004" ], [ 0.1111111111111111, "#1b0c41" ], [ 0.2222222222222222, "#4a0c6b" ], [ 0.3333333333333333, "#781c6d" ], [ 0.4444444444444444, "#a52c60" ], [ 0.5555555555555556, "#cf4446" ], [ 0.6666666666666666, "#ed6925" ], [ 0.7777777777777778, "#fb9b06" ], [ 0.8888888888888888, "#f7d13d" ], [ 1, "#fcffa4" ] ] } } }, "height": null, "width": null, "user": { "profile_url": "https://chart-studio.plotly.com/~rsheffner", "avatar_url": "https://storage.googleapis.com/plotly-prod-profiles/14.jpg", "background_url": "https://storage.googleapis.com/plotly-prod-profiles/bg-4.jpg", "bio": "", "nickname": "", "website": "", "stream_tokens": null, "feature_set_id": null, "csrf_token": null, "date_joined": "2024-04-04 20:38:17", "mapbox_access_tokens": null, "has_password": null, "username": "rsheffner", "email": null, "is_active": null, "readonly": null, "is_dash_creator": null, "dash_created_count": null, "is_chart_creator": null, "charts_created_count": null } }, { "creation_time": "2024-04-04T20:44:42.583818Z", "comments": { "results": [], "count": 0 }, "parented": true, "embed_url": "https://chart-studio.plotly.com/~rsheffner/1.embed", "fid": "rsheffner:1", "filename": "Skin Tones: L'Oreal", "filetype": "plot", "img_url": "https://storage.googleapis.com/plotly-prod-images/rsheffner/1/9_H1PCF6L8CHOE8H81AHP0PNI3G21RAI.png", "image_urls": { "default": "https://storage.googleapis.com/plotly-prod-images/rsheffner/1/2_N2KF2LQIP3SJQUI9KTXLG9XZK6FAU6.png", "block-thumb": "https://storage.googleapis.com/plotly-prod-images/rsheffner/1/8_HC73JGQ6TTMXHFDJ4IR2648CRRSVR1.png", "list-thumb": "https://storage.googleapis.com/plotly-prod-images/rsheffner/1/9_H1PCF6L8CHOE8H81AHP0PNI3G21RAI.png" }, "api_urls": { "files": "https://api.plotly.com/v2/files/rsheffner:1", "plots": "https://api.plotly.com/v2/plots/rsheffner:1", "parent": "https://api.plotly.com/v2/folders/home?user=rsheffner" }, "owner": "rsheffner", "parent": -1, "preview": "", "referencers": [], "references": [], "title": "", "views": 11, "web_url": "https://chart-studio.plotly.com/~rsheffner/1/", "world_readable": true, "date_modified": "2024-04-04T20:44:42.594Z", "stars": { "results": [], "count": 0 }, "collaborators": { "results": [], "count": 0 }, "subfolder_count": null, "refresh_interval": null, "organize_view_url": "https://chart-studio.plotly.com/~rsheffner/1/", "current_user_permission": "read", "is_theme": null, "is_template": false, "autosize": true, "caption": "", "figure": { "data": [ { "line": { "color": "black", "width": 3 }, "meta": { "columnNames": { "x": "x", "y": "y", "z": "z" } }, "mode": "markers", "type": "scatter3d", "xsrc": "rsheffner:0:d1acbc", "ysrc": "rsheffner:0:48b987", "zsrc": "rsheffner:0:b3a5f5", "marker": { "cmax": 12.566370614359172, "cmin": 0, "meta": { "columnNames": { "color": "z" } }, "size": 6, "cauto": true, "colorsrc": "rsheffner:0:b3a5f5", "colorscale": [ [ 0, "#2a3f5f" ], [ 0.2, "#A2B1C6" ], [ 0.4, "#0D76BF" ], [ 0.6, "#00cc96" ], [ 0.8, "#e6915a" ], [ 1, "#EF553B" ] ], "reversescale": false, "autocolorscale": false } } ], "frames": [], "layout": { "scene": { "xaxis": { "type": "linear", "dtick": 0.5, "range": [ -1.062371495440084, 1.0624961059224267 ], "tick0": 0, "title": { "font": { "family": "Times New Roman" }, "text": "X" }, "nticks": 0, "showgrid": true, "showline": false, "tickmode": "auto", "zeroline": false, "autorange": true, "rangemode": "normal", "showbackground": false }, "yaxis": { "type": "linear", "dtick": 0.5, "range": [ -1.062466899825041, 1.062466899825041 ], "tick0": 0, "title": { "font": { "family": "Times New Roman" }, "text": "Y" }, "nticks": 0, "showgrid": true, "tickmode": "auto", "zeroline": false, "autorange": true, "rangemode": "normal" }, "zaxis": { "type": "linear", "dtick": 2, "range": [ -0.39269908169872414, 12.959069696057897 ], "tick0": 0, "title": { "font": { "family": "Arial" }, "text": "Z" }, "nticks": 0, "showgrid": true, "tickmode": "auto", "zeroline": false, "autorange": true, "rangemode": "normal" }, "camera": { "up": { "x": 0, "y": 0, "z": 1 }, "eye": { "x": -1.0907367183169072, "y": 0.9428918623104426, "z": 0.9012623944921393 }, "center": { "x": -0.06730366801455621, "y": 0.0031606996392360654, "z": -0.07369645044279095 } }, "aspectmode": "auto", "aspectratio": { "x": 1.1037160215629795, "y": 0.9770600846623099, "z": 0.9273023951656181 } }, "title": { "text": "Helix Curve using 3D Scatter" }, "autosize": true } }, "height": null, "width": null, "user": { "profile_url": "https://chart-studio.plotly.com/~rsheffner", "avatar_url": "https://storage.googleapis.com/plotly-prod-profiles/14.jpg", "background_url": "https://storage.googleapis.com/plotly-prod-profiles/bg-4.jpg", "bio": "", "nickname": "", "website": "", "stream_tokens": null, "feature_set_id": null, "csrf_token": null, "date_joined": "2024-04-04 20:38:17", "mapbox_access_tokens": null, "has_password": null, "username": "rsheffner", "email": null, "is_active": null, "readonly": null, "is_dash_creator": null, "dash_created_count": null, "is_chart_creator": null, "charts_created_count": null } }, { "creation_time": "2024-04-04T20:27:47.737815Z", "comments": { "results": [], "count": 0 }, "parented": true, "embed_url": "https://chart-studio.plotly.com/~dzorzi/0.embed", "fid": "dzorzi:0", "filename": "lab_temp_hum", "filetype": "plot", "img_url": "https://storage.googleapis.com/plotly-prod-images/dzorzi/0/9_JU9N59JVWTQC2FMW9G1B9YOUXMHFCA.png", "image_urls": { "default": "https://storage.googleapis.com/plotly-prod-images/dzorzi/0/2_RG7CDY0JAPJODNRKH4I4CGAJS1KKU2.png", "block-thumb": "https://storage.googleapis.com/plotly-prod-images/dzorzi/0/8_40W13500HP8TQOA0C38PUT8S9M69V7.png", "list-thumb": "https://storage.googleapis.com/plotly-prod-images/dzorzi/0/9_JU9N59JVWTQC2FMW9G1B9YOUXMHFCA.png" }, "api_urls": { "files": "https://api.plotly.com/v2/files/dzorzi:0", "plots": "https://api.plotly.com/v2/plots/dzorzi:0", "parent": "https://api.plotly.com/v2/folders/home?user=dzorzi" }, "owner": "dzorzi", "parent": -1, "preview": "", "referencers": [], "references": [], "title": "Temperature and humidity in Peter's lab", "views": 2, "web_url": "https://chart-studio.plotly.com/~dzorzi/0/temperature-and-humidity-in-peters-lab/", "world_readable": true, "date_modified": "2024-05-13T09:38:10.562Z", "stars": { "results": [], "count": 0 }, "collaborators": { "results": [], "count": 0 }, "subfolder_count": null, "refresh_interval": null, "organize_view_url": "https://chart-studio.plotly.com/~dzorzi/0/", "current_user_permission": "read", "is_theme": null, "is_template": null, "autosize": true, "caption": "", "figure": { "data": [ { "uid": "0a55b45a-ce51-46c0-9d98-2b1ba6b4fb57", "name": "Temperature", "type": "scatter", "xsrc": "dzorzi:1:901dcf", "ysrc": "dzorzi:1:2b856f" }, { "uid": "c9bc5363-f7f9-4b9c-a725-abef3a618496", "name": "Humidity", "type": "scatter", "xsrc": "dzorzi:1:901dcf", "ysrc": "dzorzi:1:ccd94f", "yaxis": "y2" } ], "layout": { "title": { "text": "Temperature and humidity in Peter's lab" }, "xaxis": { "type": "date", "autorange": true }, "yaxis": { "type": "linear", "title": { "text": "Celsius" }, "autorange": true }, "yaxis2": { "side": "right", "type": "linear", "title": { "text": "Percent" }, "autorange": true, "overlaying": "y" } } }, "height": null, "width": null, "user": { "profile_url": "https://chart-studio.plotly.com/~dzorzi", "avatar_url": "https://storage.googleapis.com/plotly-prod-profiles/70.jpg", "background_url": "https://storage.googleapis.com/plotly-prod-profiles/bg-14.jpg", "bio": "", "nickname": "", "website": "", "stream_tokens": null, "feature_set_id": null, "csrf_token": null, "date_joined": "2024-04-04 19:14:48", "mapbox_access_tokens": null, "has_password": null, "username": "dzorzi", "email": null, "is_active": null, "readonly": null, "is_dash_creator": null, "dash_created_count": null, "is_chart_creator": null, "charts_created_count": null } }, { "creation_time": "2024-04-04T20:15:23.574756Z", "comments": { "results": [], "count": 0 }, "parented": true, "embed_url": "https://chart-studio.plotly.com/~emmamck23/16.embed", "fid": "emmamck23:16", "filename": "Arrival Plot", "filetype": "plot", "img_url": "https://storage.googleapis.com/plotly-prod-images/emmamck23/16/9_D3R51BE49CEQHFHEBFCL84UX2THRWN.png", "image_urls": { "default": "https://storage.googleapis.com/plotly-prod-images/emmamck23/16/2_M4WTL8C6Z7DMRYGZOMYZHEOKWZ8KCT.png", "block-thumb": "https://storage.googleapis.com/plotly-prod-images/emmamck23/16/8_JE6IMQKGYRSIM1RNV1U5PLBA9SU6KP.png", "list-thumb": "https://storage.googleapis.com/plotly-prod-images/emmamck23/16/9_D3R51BE49CEQHFHEBFCL84UX2THRWN.png" }, "api_urls": { "files": "https://api.plotly.com/v2/files/emmamck23:16", "plots": "https://api.plotly.com/v2/plots/emmamck23:16", "parent": "https://api.plotly.com/v2/folders/home?user=emmamck23" }, "owner": "emmamck23", "parent": -1, "preview": "", "referencers": [], "references": [], "title": "", "views": 4, "web_url": "https://chart-studio.plotly.com/~emmamck23/16/", "world_readable": true, "date_modified": "2024-04-04T20:15:23.587Z", "stars": { "results": [], "count": 0 }, "collaborators": { "results": [], "count": 0 }, "subfolder_count": null, "refresh_interval": null, "organize_view_url": "https://chart-studio.plotly.com/~emmamck23/16/", "current_user_permission": "read", "is_theme": null, "is_template": false, "autosize": true, "caption": "", "figure": { "data": [ { "meta": { "columnNames": { "x": "A", "y": "B" } }, "mode": "markers", "name": "PR", "type": "bar", "xsrc": "emmamck23:15:48f13a", "ysrc": "emmamck23:15:64d685", "orientation": "v" }, { "meta": { "columnNames": { "x": "A", "y": "C" } }, "name": "USVI", "type": "bar", "xsrc": "emmamck23:15:48f13a", "ysrc": "emmamck23:15:af5ae6", "visible": true, "orientation": "v" } ], "frames": [], "layout": { "font": { "size": 16 }, "title": { "text": "a) Arrival" }, "xaxis": { "type": "category", "range": [ -0.5, 3.5 ], "title": { "text": "Functional Group" }, "autorange": true }, "yaxis": { "type": "linear", "range": [ 0, 4.421 ], "title": { "text": "Score (1-5)" }, "autorange": false }, "autosize": true, "template": { "data": { "bar": [ { "type": "bar", "marker": { "colorbar": { "ticks": "", "outlinewidth": 0 } } } ], "table": [ { "type": "table", "cells": { "fill": { "color": "#EBF0F8" }, "line": { "color": "white" } }, "header": { "fill": { "color": "#C8D4E3" }, "line": { "color": "white" } } } ], "carpet": [ { "type": "carpet", "aaxis": { "gridcolor": "#C8D4E3", "linecolor": "#C8D4E3", "endlinecolor": "#2a3f5f", "minorgridcolor": "#C8D4E3", "startlinecolor": "#2a3f5f" }, "baxis": { "gridcolor": "#C8D4E3", "linecolor": "#C8D4E3", "endlinecolor": "#2a3f5f", "minorgridcolor": "#C8D4E3", "startlinecolor": "#2a3f5f" } } ], "mesh3d": [ { "type": "mesh3d", "colorbar": { "ticks": "", "outlinewidth": 0 } } ], "contour": [ { "type": "contour", "colorbar": { "ticks": "", "outlinewidth": 0 }, "autocolorscale": true } ], "heatmap": [ { "type": "heatmap", "colorbar": { "ticks": "", "outlinewidth": 0 }, "autocolorscale": true } ], "scatter": [ { "type": "scatter", "marker": { "colorbar": { "ticks": "", "outlinewidth": 0 } } } ], "surface": [ { "type": "surface", "colorbar": { "ticks": "", "outlinewidth": 0 } } ], "heatmapgl": [ { "type": "heatmapgl", "colorbar": { "ticks": "", "outlinewidth": 0 } } ], "histogram": [ { "type": "histogram", "marker": { "colorbar": { "ticks": "", "outlinewidth": 0 } } } ], "parcoords": [ { "line": { "colorbar": { "ticks": "", "outlinewidth": 0 } }, "type": "parcoords" } ], "scatter3d": [ { "type": "scatter3d", "marker": { "colorbar": { "ticks": "", "outlinewidth": 0 } } } ], "scattergl": [ { "type": "scattergl", "marker": { "colorbar": { "ticks": "", "outlinewidth": 0 } } } ], "choropleth": [ { "type": "choropleth", "colorbar": { "ticks": "", "outlinewidth": 0 } } ], "scattergeo": [ { "type": "scattergeo", "marker": { "colorbar": { "ticks": "", "outlinewidth": 0 } } } ], "histogram2d": [ { "type": "histogram2d", "colorbar": { "ticks": "", "outlinewidth": 0 }, "autocolorscale": true } ], "scatterpolar": [ { "type": "scatterpolar", "marker": { "colorbar": { "ticks": "", "outlinewidth": 0 } } } ], "contourcarpet": [ { "type": "contourcarpet", "colorbar": { "ticks": "", "outlinewidth": 0 } } ], "scattercarpet": [ { "type": "scattercarpet", "marker": { "colorbar": { "ticks": "", "outlinewidth": 0 } } } ], "scattermapbox": [ { "type": "scattermapbox", "marker": { "colorbar": { "ticks": "", "outlinewidth": 0 } } } ], "scatterpolargl": [ { "type": "scatterpolargl", "marker": { "colorbar": { "ticks": "", "outlinewidth": 0 } } } ], "scatterternary": [ { "type": "scatterternary", "marker": { "colorbar": { "ticks": "", "outlinewidth": 0 } } } ], "histogram2dcontour": [ { "type": "histogram2dcontour", "colorbar": { "ticks": "", "outlinewidth": 0 }, "autocolorscale": true } ] }, "layout": { "geo": { "bgcolor": "white", "showland": true, "lakecolor": "white", "landcolor": "white", "showlakes": true, "subunitcolor": "#C8D4E3" }, "font": { "color": "#2a3f5f" }, "polar": { "bgcolor": "white", "radialaxis": { "ticks": "", "gridcolor": "#EBF0F8", "linecolor": "#EBF0F8" }, "angularaxis": { "ticks": "", "gridcolor": "#EBF0F8", "linecolor": "#EBF0F8" } }, "scene": { "xaxis": { "ticks": "", "gridcolor": "#DFE8F3", "gridwidth": 2, "linecolor": "#EBF0F8", "zerolinecolor": "#EBF0F8", "showbackground": true, "backgroundcolor": "white" }, "yaxis": { "ticks": "", "gridcolor": "#DFE8F3", "gridwidth": 2, "linecolor": "#EBF0F8", "zerolinecolor": "#EBF0F8", "showbackground": true, "backgroundcolor": "white" }, "zaxis": { "ticks": "", "gridcolor": "#DFE8F3", "gridwidth": 2, "linecolor": "#EBF0F8", "zerolinecolor": "#EBF0F8", "showbackground": true, "backgroundcolor": "white" } }, "title": { "x": 0.05 }, "xaxis": { "ticks": "", "gridcolor": "#EBF0F8", "linecolor": "#EBF0F8", "automargin": true, "zerolinecolor": "#EBF0F8", "zerolinewidth": 2 }, "yaxis": { "ticks": "", "gridcolor": "#EBF0F8", "linecolor": "#EBF0F8", "automargin": true, "zerolinecolor": "#EBF0F8", "zerolinewidth": 2 }, "ternary": { "aaxis": { "ticks": "", "gridcolor": "#DFE8F3", "linecolor": "#A2B1C6" }, "baxis": { "ticks": "", "gridcolor": "#DFE8F3", "linecolor": "#A2B1C6" }, "caxis": { "ticks": "", "gridcolor": "#DFE8F3", "linecolor": "#A2B1C6" }, "bgcolor": "white" }, "colorway": [ "#636efa", "#EF553B", "#00cc96", "#ab63fa", "#19d3f3", "#e763fa", "#fecb52", "#ffa15a", "#ff6692", "#b6e880" ], "hovermode": "closest", "colorscale": { "diverging": [ [ 0, "#8e0152" ], [ 0.1, "#c51b7d" ], [ 0.2, "#de77ae" ], [ 0.3, "#f1b6da" ], [ 0.4, "#fde0ef" ], [ 0.5, "#f7f7f7" ], [ 0.6, "#e6f5d0" ], [ 0.7, "#b8e186" ], [ 0.8, "#7fbc41" ], [ 0.9, "#4d9221" ], [ 1, "#276419" ] ], "sequential": [ [ 0, "#0508b8" ], [ 0.0893854748603352, "#1910d8" ], [ 0.1787709497206704, "#3c19f0" ], [ 0.2681564245810056, "#6b1cfb" ], [ 0.3575418994413408, "#981cfd" ], [ 0.44692737430167595, "#bf1cfd" ], [ 0.5363128491620112, "#dd2bfd" ], [ 0.6256983240223464, "#f246fe" ], [ 0.7150837988826816, "#fc67fd" ], [ 0.8044692737430168, "#fe88fc" ], [ 0.8938547486033519, "#fea5fd" ], [ 0.9832402234636871, "#febefe" ], [ 1, "#fec3fe" ] ], "sequentialminus": [ [ 0, "#0508b8" ], [ 0.0893854748603352, "#1910d8" ], [ 0.1787709497206704, "#3c19f0" ], [ 0.2681564245810056, "#6b1cfb" ], [ 0.3575418994413408, "#981cfd" ], [ 0.44692737430167595, "#bf1cfd" ], [ 0.5363128491620112, "#dd2bfd" ], [ 0.6256983240223464, "#f246fe" ], [ 0.7150837988826816, "#fc67fd" ], [ 0.8044692737430168, "#fe88fc" ], [ 0.8938547486033519, "#fea5fd" ], [ 0.9832402234636871, "#febefe" ], [ 1, "#fec3fe" ] ] }, "plot_bgcolor": "white", "paper_bgcolor": "white", "shapedefaults": { "line": { "width": 0 }, "opacity": 0.4, "fillcolor": "#506784" }, "annotationdefaults": { "arrowhead": 0, "arrowcolor": "#506784", "arrowwidth": 1 } }, "themeRef": "PLOTLY_WHITE" } } }, "height": null, "width": null, "user": { "profile_url": "https://chart-studio.plotly.com/~emmamck23", "avatar_url": "https://storage.googleapis.com/plotly-prod-profiles/45.jpg", "background_url": "https://storage.googleapis.com/plotly-prod-profiles/bg-0.jpg", "bio": "", "nickname": "", "website": "", "stream_tokens": null, "feature_set_id": null, "csrf_token": null, "date_joined": "2024-02-28 18:13:46", "mapbox_access_tokens": null, "has_password": null, "username": "emmamck23", "email": null, "is_active": null, "readonly": null, "is_dash_creator": null, "dash_created_count": null, "is_chart_creator": null, "charts_created_count": null } }, { "creation_time": "2024-04-04T19:52:27.460910Z", "comments": { "results": [], "count": 0 }, "parented": true, "embed_url": "https://chart-studio.plotly.com/~JoshNautes/3.embed", "fid": "JoshNautes:3", "filename": "Plot 3", "filetype": "plot", "img_url": "https://storage.googleapis.com/plotly-prod-images/JoshNautes/3/9_JSQHVUATAD589R4ARFW9SQY9FQXLLQ.png", "image_urls": { "default": "https://storage.googleapis.com/plotly-prod-images/JoshNautes/3/2_92OVKRXHOXZJBLNYXEZU8X2CR0YG37.png", "block-thumb": "https://storage.googleapis.com/plotly-prod-images/JoshNautes/3/8_HPF1LLPDEECRPUMNKESJJOXR340XA8.png", "list-thumb": "https://storage.googleapis.com/plotly-prod-images/JoshNautes/3/9_JSQHVUATAD589R4ARFW9SQY9FQXLLQ.png" }, "api_urls": { "files": "https://api.plotly.com/v2/files/JoshNautes:3", "plots": "https://api.plotly.com/v2/plots/JoshNautes:3", "parent": "https://api.plotly.com/v2/folders/home?user=JoshNautes" }, "owner": "JoshNautes", "parent": -1, "preview": "", "referencers": [], "references": [], "title": "", "views": 24, "web_url": "https://chart-studio.plotly.com/~JoshNautes/3/", "world_readable": true, "date_modified": "2024-04-04T20:20:44.630Z", "stars": { "results": [], "count": 0 }, "collaborators": { "results": [], "count": 0 }, "subfolder_count": null, "refresh_interval": null, "organize_view_url": "https://chart-studio.plotly.com/~JoshNautes/3/", "current_user_permission": "read", "is_theme": null, "is_template": false, "autosize": true, "caption": "", "figure": { "data": [ { "uid": "52e75c", "fill": "none", "meta": { "columnNames": { "x": "AMD Scores", "y": "AMD Prices", "text": "AMD", "marker": { "size": "PRICE-AMD", "color": "PRICE" } } }, "mode": "markers", "name": "AMD GPUs", "type": "scatter", "xsrc": "JoshNautes:2:35666b", "ysrc": "JoshNautes:2:61a408", "xaxis": "x", "marker": { "line": { "color": "rgb(255, 255, 255)", "width": 1 }, "meta": { "columnNames": { "size": "PRICE-AMD", "color": "PRICE" } }, "size": 10, "color": "#FD3216", "symbol": "circle", "sizeref": null, "sizemode": "area", "maxdisplayed": 0 }, "error_x": { "type": "percent", "color": "#FD3216", "value": 10, "width": 4, "visible": false, "symmetric": false, "thickness": 2, "valueminus": 10 }, "error_y": { "type": "percent", "color": "#FD3216", "value": 10, "width": 4, "visible": false, "symmetric": true, "thickness": 2 }, "textsrc": "JoshNautes:2:bec5c8", "hoverinfo": "x+y+text", "cliponaxis": false, "hoverlabel": { "align": "auto" }, "showlegend": true, "stackgroup": null, "transforms": [ { "meta": { "columnNames": { "target": "AMD Prices" } }, "type": "filter", "value": "2000", "enabled": false, "operation": "<", "targetsrc": "JoshNautes:2:61a408" } ], "textposition": "top center", "hovertemplate": "" }, { "uid": "a3dc9c", "meta": { "columnNames": { "x": "NVIDIA Scores", "y": "NVIDIA Prices", "text": "NVIDIA", "marker": { "size": "PRICE" } } }, "mode": "markers", "name": "NVIDIA GPUs", "type": "scatter", "xsrc": "JoshNautes:2:504492", "ysrc": "JoshNautes:2:a12dcb", "marker": { "line": { "color": "rgb(255, 255, 255)", "width": 1 }, "meta": { "columnNames": { "size": "PRICE" } }, "size": 10, "color": "rgb(107, 222, 58)", "sizeref": null, "sizemode": "area" }, "textsrc": "JoshNautes:2:654b7f", "textfont": { "size": 9 }, "hoverinfo": "x+y+text", "showlegend": true, "transforms": [ { "meta": { "columnNames": { "target": "NVIDIA Prices" } }, "type": "filter", "value": "2000", "enabled": false, "operation": "<", "targetsrc": "JoshNautes:2:a12dcb" } ], "textposition": "middle left", "hovertemplate": "" } ], "frames": [], "layout": { "font": { "size": 14, "color": "rgb(255, 255, 255)", "family": "Roboto" }, "title": { "font": { "size": 40 }, "text": "MSRP VS BENCHMARK SCORE OF GPUs" }, "xaxis": { "side": "bottom", "type": "linear", "range": [ -397.0972575133619, 20543.097257513364 ], "ticks": "", "title": { "font": { "size": 20 }, "text": "3DMARK SCORE (TIME SPY EXTREME)" }, "domain": [ 0, 1 ], "mirror": false, "nticks": 0, "showgrid": true, "showline": false, "zeroline": true, "autorange": true, "gridcolor": "rgb(69, 69, 69)", "tickangle": "auto", "tickcolor": "rgb(238, 237, 237)", "automargin": true, "showspikes": false, "tickformat": "", "tickprefix": "", "rangeslider": { "range": [ -397.99885189437396, 20543.998851894376 ], "yaxis": {}, "visible": false, "autorange": true, "borderwidth": 1 }, "zerolinecolor": "rgb(255, 255, 255)", "zerolinewidth": 1, "showticklabels": true, "spikethickness": 3, "separatethousands": true }, "yaxis": { "side": "left", "range": [ -235.19244676576943, 5913.192446765769 ], "ticks": "", "title": { "text": "LAUNCH PRICE (USD)" }, "domain": [ 0, 1 ], "nticks": 0, "showgrid": true, "tickmode": "auto", "zeroline": true, "autorange": true, "gridcolor": "rgb(69, 69, 69)", "tickangle": 45, "tickcolor": "rgb(238, 237, 237)", "automargin": true, "fixedrange": false, "showspikes": false, "tickprefix": "$", "zerolinecolor": "rgb(255, 255, 255)", "zerolinewidth": 1, "exponentformat": "e", "showtickprefix": "all", "spikethickness": 3, "separatethousands": true }, "legend": { "x": 1.02, "y": 1, "valign": "middle", "xanchor": "right", "yanchor": "bottom", "itemsizing": "constant", "traceorder": "normal", "borderwidth": 0 }, "margin": { "b": 100, "l": 90, "r": 50, "t": 100, "pad": 0 }, "metasrc": "JoshNautes:2:61a408", "modebar": { "orientation": "h" }, "autosize": true, "colorway": [ "#FD3216", "#00FE35", "#6A76FC", "#FED4C4", "#FE00CE", "#0DF9FF", "#F6F926", "#FF9616", "#479B55", "#EEA6FB", "#DC587D", "#D626FF", "#6E899C", "#00B5F7", "#B68E00", "#C9FBE5", "#FF0092", "#22FFA7", "#E3EE9E", "#86CE00", "#BC7196", "#7E7DCD", "#FC6955", "#E48F72" ], "dragmode": "pan", "template": { "data": { "bar": [ { "type": "bar", "marker": { "colorbar": { "ticks": "", "outlinewidth": 0 } } } ], "table": [ { "type": "table", "cells": { "fill": { "color": "#506784" }, "line": { "color": "rgb(17,17,17)" } }, "header": { "fill": { "color": "#2a3f5f" }, "line": { "color": "rgb(17,17,17)" } } } ], "carpet": [ { "type": "carpet", "aaxis": { "gridcolor": "#506784", "linecolor": "#506784", "endlinecolor": "#A2B1C6", "minorgridcolor": "#506784", "startlinecolor": "#A2B1C6" }, "baxis": { "gridcolor": "#506784", "linecolor": "#506784", "endlinecolor": "#A2B1C6", "minorgridcolor": "#506784", "startlinecolor": "#A2B1C6" } } ], "mesh3d": [ { "type": "mesh3d", "colorbar": { "ticks": "", "outlinewidth": 0 } } ], "contour": [ { "type": "contour", "colorbar": { "ticks": "", "outlinewidth": 0 }, "autocolorscale": true } ], "heatmap": [ { "type": "heatmap", "colorbar": { "ticks": "", "outlinewidth": 0 }, "autocolorscale": true } ], "scatter": [ { "type": "scatter", "marker": { "colorbar": { "ticks": "", "outlinewidth": 0 } } } ], "surface": [ { "type": "surface", "colorbar": { "ticks": "", "outlinewidth": 0 } } ], "heatmapgl": [ { "type": "heatmapgl", "colorbar": { "ticks": "", "outlinewidth": 0 } } ], "histogram": [ { "type": "histogram", "marker": { "colorbar": { "ticks": "", "outlinewidth": 0 } } } ], "parcoords": [ { "line": { "colorbar": { "ticks": "", "outlinewidth": 0 } }, "type": "parcoords" } ], "scatter3d": [ { "type": "scatter3d", "marker": { "colorbar": { "ticks": "", "outlinewidth": 0 } } } ], "scattergl": [ { "type": "scattergl", "marker": { "colorbar": { "ticks": "", "outlinewidth": 0 } } } ], "choropleth": [ { "type": "choropleth", "colorbar": { "ticks": "", "outlinewidth": 0 } } ], "scattergeo": [ { "type": "scattergeo", "marker": { "colorbar": { "ticks": "", "outlinewidth": 0 } } } ], "histogram2d": [ { "type": "histogram2d", "colorbar": { "ticks": "", "outlinewidth": 0 }, "autocolorscale": true } ], "scatterpolar": [ { "type": "scatterpolar", "marker": { "colorbar": { "ticks": "", "outlinewidth": 0 } } } ], "contourcarpet": [ { "type": "contourcarpet", "colorbar": { "ticks": "", "outlinewidth": 0 } } ], "scattercarpet": [ { "type": "scattercarpet", "marker": { "colorbar": { "ticks": "", "outlinewidth": 0 } } } ], "scattermapbox": [ { "type": "scattermapbox", "marker": { "colorbar": { "ticks": "", "outlinewidth": 0 } } } ], "scatterpolargl": [ { "type": "scatterpolargl", "marker": { "colorbar": { "ticks": "", "outlinewidth": 0 } } } ], "scatterternary": [ { "type": "scatterternary", "marker": { "colorbar": { "ticks": "", "outlinewidth": 0 } } } ], "histogram2dcontour": [ { "type": "histogram2dcontour", "colorbar": { "ticks": "", "outlinewidth": 0 }, "autocolorscale": true } ] }, "layout": { "geo": { "bgcolor": "rgb(17,17,17)", "showland": true, "lakecolor": "rgb(17,17,17)", "landcolor": "rgb(17,17,17)", "showlakes": true, "subunitcolor": "#506784" }, "font": { "color": "#f2f5fa" }, "polar": { "bgcolor": "rgb(17,17,17)", "radialaxis": { "ticks": "", "gridcolor": "#506784", "linecolor": "#506784" }, "angularaxis": { "ticks": "", "gridcolor": "#506784", "linecolor": "#506784" } }, "scene": { "xaxis": { "ticks": "", "gridcolor": "#506784", "gridwidth": 2, "linecolor": "#506784", "zerolinecolor": "#C8D4E3", "showbackground": true, "backgroundcolor": "rgb(17,17,17)" }, "yaxis": { "ticks": "", "gridcolor": "#506784", "gridwidth": 2, "linecolor": "#506784", "zerolinecolor": "#C8D4E3", "showbackground": true, "backgroundcolor": "rgb(17,17,17)" }, "zaxis": { "ticks": "", "gridcolor": "#506784", "gridwidth": 2, "linecolor": "#506784", "zerolinecolor": "#C8D4E3", "showbackground": true, "backgroundcolor": "rgb(17,17,17)" } }, "title": { "x": 0.05 }, "xaxis": { "ticks": "", "gridcolor": "#283442", "linecolor": "#506784", "automargin": true, "zerolinecolor": "#283442", "zerolinewidth": 2 }, "yaxis": { "ticks": "", "gridcolor": "#283442", "linecolor": "#506784", "automargin": true, "zerolinecolor": "#283442", "zerolinewidth": 2 }, "ternary": { "aaxis": { "ticks": "", "gridcolor": "#506784", "linecolor": "#506784" }, "baxis": { "ticks": "", "gridcolor": "#506784", "linecolor": "#506784" }, "caxis": { "ticks": "", "gridcolor": "#506784", "linecolor": "#506784" }, "bgcolor": "rgb(17,17,17)" }, "colorway": [ "#636efa", "#EF553B", "#00cc96", "#ab63fa", "#19d3f3", "#e763fa", "#fecb52", "#ffa15a", "#ff6692", "#b6e880" ], "hovermode": "closest", "colorscale": { "diverging": [ [ 0, "#8e0152" ], [ 0.1, "#c51b7d" ], [ 0.2, "#de77ae" ], [ 0.3, "#f1b6da" ], [ 0.4, "#fde0ef" ], [ 0.5, "#f7f7f7" ], [ 0.6, "#e6f5d0" ], [ 0.7, "#b8e186" ], [ 0.8, "#7fbc41" ], [ 0.9, "#4d9221" ], [ 1, "#276419" ] ], "sequential": [ [ 0, "#0508b8" ], [ 0.0893854748603352, "#1910d8" ], [ 0.1787709497206704, "#3c19f0" ], [ 0.2681564245810056, "#6b1cfb" ], [ 0.3575418994413408, "#981cfd" ], [ 0.44692737430167595, "#bf1cfd" ], [ 0.5363128491620112, "#dd2bfd" ], [ 0.6256983240223464, "#f246fe" ], [ 0.7150837988826816, "#fc67fd" ], [ 0.8044692737430168, "#fe88fc" ], [ 0.8938547486033519, "#fea5fd" ], [ 0.9832402234636871, "#febefe" ], [ 1, "#fec3fe" ] ], "sequentialminus": [ [ 0, "#0508b8" ], [ 0.0893854748603352, "#1910d8" ], [ 0.1787709497206704, "#3c19f0" ], [ 0.2681564245810056, "#6b1cfb" ], [ 0.3575418994413408, "#981cfd" ], [ 0.44692737430167595, "#bf1cfd" ], [ 0.5363128491620112, "#dd2bfd" ], [ 0.6256983240223464, "#f246fe" ], [ 0.7150837988826816, "#fc67fd" ], [ 0.8044692737430168, "#fe88fc" ], [ 0.8938547486033519, "#fea5fd" ], [ 0.9832402234636871, "#febefe" ], [ 1, "#fec3fe" ] ] }, "plot_bgcolor": "rgb(17,17,17)", "paper_bgcolor": "rgb(17,17,17)", "shapedefaults": { "line": { "width": 0 }, "opacity": 0.4, "fillcolor": "#f2f5fa" }, "sliderdefaults": { "bgcolor": "#C8D4E3", "tickwidth": 0, "bordercolor": "rgb(17,17,17)", "borderwidth": 1 }, "annotationdefaults": { "arrowhead": 0, "arrowcolor": "#f2f5fa", "arrowwidth": 1 }, "updatemenudefaults": { "bgcolor": "#506784", "borderwidth": 0 } }, "themeRef": "PLOTLY_DARK" }, "clickmode": "event", "hovermode": "closest", "hoverlabel": { "font": { "size": 22, "family": "Roboto" } }, "showlegend": true, "annotations": [ { "x": 1, "y": 0, "font": { "size": 12, "color": "rgb(184, 184, 184)" }, "text": "Price and Release Date Source: TechPowerUp<br>Benchmark Scores Source: GPU Monkey", "xref": "paper", "yref": "paper", "align": "right", "xanchor": "auto", "yanchor": "auto", "showarrow": false }, { "x": 0.03, "y": 1, "font": { "size": 12, "color": "rgb(173, 173, 173)" }, "text": "All prices are adjusted for inflation using CPI data for all urban consumers in the U.S. (February 2024)", "xref": "paper", "yref": "paper", "xanchor": "auto", "showarrow": false } ], "uniformtext": { "mode": false }, "plot_bgcolor": "rgb(0, 0, 0)", "paper_bgcolor": "rgb(0, 0, 0)" } }, "height": null, "width": null, "user": { "profile_url": "https://chart-studio.plotly.com/~JoshNautes", "avatar_url": "https://storage.googleapis.com/plotly-prod-profiles/99.jpg", "background_url": "https://storage.googleapis.com/plotly-prod-profiles/bg-13.jpg", "bio": "", "nickname": "", "website": "", "stream_tokens": null, "feature_set_id": null, "csrf_token": null, "date_joined": "2024-04-02 13:16:28", "mapbox_access_tokens": null, "has_password": null, "username": "JoshNautes", "email": null, "is_active": null, "readonly": null, "is_dash_creator": null, "dash_created_count": null, "is_chart_creator": null, "charts_created_count": null } }, { "creation_time": "2024-04-04T19:33:27.842300Z", "comments": { "results": [], "count": 0 }, "parented": true, "embed_url": "https://chart-studio.plotly.com/~melsozkal/39.embed", "fid": "melsozkal:39", "filename": "pow", "filetype": "plot", "img_url": "https://storage.googleapis.com/plotly-prod-images/melsozkal/39/9_N9W3EFDFMZU4ELYUK0GHFNNMJ32N8K.png", "image_urls": { "default": "https://storage.googleapis.com/plotly-prod-images/melsozkal/39/2_5POFFGSDOWUW8162NZHNPTJF6J1U3O.png", "block-thumb": "https://storage.googleapis.com/plotly-prod-images/melsozkal/39/8_XB9WJMLGQVHPYFW6S2SGPHC42OBWSI.png", "list-thumb": "https://storage.googleapis.com/plotly-prod-images/melsozkal/39/9_N9W3EFDFMZU4ELYUK0GHFNNMJ32N8K.png" }, "api_urls": { "files": "https://api.plotly.com/v2/files/melsozkal:39", "plots": "https://api.plotly.com/v2/plots/melsozkal:39", "parent": "https://api.plotly.com/v2/folders/home?user=melsozkal" }, "owner": "melsozkal", "parent": -1, "preview": "", "referencers": [], "references": [], "title": "", "views": 5, "web_url": "https://chart-studio.plotly.com/~melsozkal/39/", "world_readable": true, "date_modified": "2024-04-04T19:51:32.202Z", "stars": { "results": [], "count": 0 }, "collaborators": { "results": [], "count": 0 }, "subfolder_count": null, "refresh_interval": null, "organize_view_url": "https://chart-studio.plotly.com/~melsozkal/39/", "current_user_permission": "read", "is_theme": null, "is_template": false, "autosize": true, "caption": "", "figure": { "data": [ { "meta": { "columnNames": { "x": "B", "y": "A" } }, "mode": "lines", "type": "scatter", "xsrc": "melsozkal:38:2463e6", "ysrc": "melsozkal:38:833544", "marker": { "color": "rgb(245, 44, 97)", "opacity": 1 }, "orientation": "v" } ], "frames": [], "layout": { "font": { "family": "Droid Serif" }, "title": { "text": "Power versus Resistance" }, "xaxis": { "type": "linear", "dtick": 50, "range": [ 0, 1000 ], "tick0": 0, "title": { "text": "Resistance (kOhms)" }, "showgrid": true, "tickmode": "linear", "autorange": true, "gridwidth": 1 }, "yaxis": { "type": "linear", "dtick": 0, "range": [ -0.003833333333333334, 0.07283333333333333 ], "tick0": 0, "title": { "text": "Power (mW)" }, "showgrid": true, "showline": true, "tickmode": "linear", "autorange": true }, "autosize": true, "template": { "data": { "bar": [ { "type": "bar", "marker": { "colorbar": { "ticks": "", "outlinewidth": 0 } } } ], "table": [ { "type": "table", "cells": { "fill": { "color": "#EBF0F8" }, "line": { "color": "white" } }, "header": { "fill": { "color": "#C8D4E3" }, "line": { "color": "white" } } } ], "carpet": [ { "type": "carpet", "aaxis": { "gridcolor": "#C8D4E3", "linecolor": "#C8D4E3", "endlinecolor": "#2a3f5f", "minorgridcolor": "#C8D4E3", "startlinecolor": "#2a3f5f" }, "baxis": { "gridcolor": "#C8D4E3", "linecolor": "#C8D4E3", "endlinecolor": "#2a3f5f", "minorgridcolor": "#C8D4E3", "startlinecolor": "#2a3f5f" } } ], "mesh3d": [ { "type": "mesh3d", "colorbar": { "ticks": "", "outlinewidth": 0 } } ], "contour": [ { "type": "contour", "colorbar": { "ticks": "", "outlinewidth": 0 }, "autocolorscale": true } ], "heatmap": [ { "type": "heatmap", "colorbar": { "ticks": "", "outlinewidth": 0 }, "autocolorscale": true } ], "scatter": [ { "type": "scatter", "marker": { "colorbar": { "ticks": "", "outlinewidth": 0 } } } ], "surface": [ { "type": "surface", "colorbar": { "ticks": "", "outlinewidth": 0 } } ], "heatmapgl": [ { "type": "heatmapgl", "colorbar": { "ticks": "", "outlinewidth": 0 } } ], "histogram": [ { "type": "histogram", "marker": { "colorbar": { "ticks": "", "outlinewidth": 0 } } } ], "parcoords": [ { "line": { "colorbar": { "ticks": "", "outlinewidth": 0 } }, "type": "parcoords" } ], "scatter3d": [ { "type": "scatter3d", "marker": { "colorbar": { "ticks": "", "outlinewidth": 0 } } } ], "scattergl": [ { "type": "scattergl", "marker": { "colorbar": { "ticks": "", "outlinewidth": 0 } } } ], "choropleth": [ { "type": "choropleth", "colorbar": { "ticks": "", "outlinewidth": 0 } } ], "scattergeo": [ { "type": "scattergeo", "marker": { "colorbar": { "ticks": "", "outlinewidth": 0 } } } ], "histogram2d": [ { "type": "histogram2d", "colorbar": { "ticks": "", "outlinewidth": 0 }, "autocolorscale": true } ], "scatterpolar": [ { "type": "scatterpolar", "marker": { "colorbar": { "ticks": "", "outlinewidth": 0 } } } ], "contourcarpet": [ { "type": "contourcarpet", "colorbar": { "ticks": "", "outlinewidth": 0 } } ], "scattercarpet": [ { "type": "scattercarpet", "marker": { "colorbar": { "ticks": "", "outlinewidth": 0 } } } ], "scattermapbox": [ { "type": "scattermapbox", "marker": { "colorbar": { "ticks": "", "outlinewidth": 0 } } } ], "scatterpolargl": [ { "type": "scatterpolargl", "marker": { "colorbar": { "ticks": "", "outlinewidth": 0 } } } ], "scatterternary": [ { "type": "scatterternary", "marker": { "colorbar": { "ticks": "", "outlinewidth": 0 } } } ], "histogram2dcontour": [ { "type": "histogram2dcontour", "colorbar": { "ticks": "", "outlinewidth": 0 }, "autocolorscale": true } ] }, "layout": { "geo": { "bgcolor": "white", "showland": true, "lakecolor": "white", "landcolor": "white", "showlakes": true, "subunitcolor": "#C8D4E3" }, "font": { "color": "#2a3f5f" }, "polar": { "bgcolor": "white", "radialaxis": { "ticks": "", "gridcolor": "#EBF0F8", "linecolor": "#EBF0F8" }, "angularaxis": { "ticks": "", "gridcolor": "#EBF0F8", "linecolor": "#EBF0F8" } }, "scene": { "xaxis": { "ticks": "", "gridcolor": "#DFE8F3", "gridwidth": 2, "linecolor": "#EBF0F8", "zerolinecolor": "#EBF0F8", "showbackground": true, "backgroundcolor": "white" }, "yaxis": { "ticks": "", "gridcolor": "#DFE8F3", "gridwidth": 2, "linecolor": "#EBF0F8", "zerolinecolor": "#EBF0F8", "showbackground": true, "backgroundcolor": "white" }, "zaxis": { "ticks": "", "gridcolor": "#DFE8F3", "gridwidth": 2, "linecolor": "#EBF0F8", "zerolinecolor": "#EBF0F8", "showbackground": true, "backgroundcolor": "white" } }, "title": { "x": 0.05 }, "xaxis": { "ticks": "", "gridcolor": "#EBF0F8", "linecolor": "#EBF0F8", "automargin": true, "zerolinecolor": "#EBF0F8", "zerolinewidth": 2 }, "yaxis": { "ticks": "", "gridcolor": "#EBF0F8", "linecolor": "#EBF0F8", "automargin": true, "zerolinecolor": "#EBF0F8", "zerolinewidth": 2 }, "ternary": { "aaxis": { "ticks": "", "gridcolor": "#DFE8F3", "linecolor": "#A2B1C6" }, "baxis": { "ticks": "", "gridcolor": "#DFE8F3", "linecolor": "#A2B1C6" }, "caxis": { "ticks": "", "gridcolor": "#DFE8F3", "linecolor": "#A2B1C6" }, "bgcolor": "white" }, "colorway": [ "#636efa", "#EF553B", "#00cc96", "#ab63fa", "#19d3f3", "#e763fa", "#fecb52", "#ffa15a", "#ff6692", "#b6e880" ], "hovermode": "closest", "colorscale": { "diverging": [ [ 0, "#8e0152" ], [ 0.1, "#c51b7d" ], [ 0.2, "#de77ae" ], [ 0.3, "#f1b6da" ], [ 0.4, "#fde0ef" ], [ 0.5, "#f7f7f7" ], [ 0.6, "#e6f5d0" ], [ 0.7, "#b8e186" ], [ 0.8, "#7fbc41" ], [ 0.9, "#4d9221" ], [ 1, "#276419" ] ], "sequential": [ [ 0, "#0508b8" ], [ 0.0893854748603352, "#1910d8" ], [ 0.1787709497206704, "#3c19f0" ], [ 0.2681564245810056, "#6b1cfb" ], [ 0.3575418994413408, "#981cfd" ], [ 0.44692737430167595, "#bf1cfd" ], [ 0.5363128491620112, "#dd2bfd" ], [ 0.6256983240223464, "#f246fe" ], [ 0.7150837988826816, "#fc67fd" ], [ 0.8044692737430168, "#fe88fc" ], [ 0.8938547486033519, "#fea5fd" ], [ 0.9832402234636871, "#febefe" ], [ 1, "#fec3fe" ] ], "sequentialminus": [ [ 0, "#0508b8" ], [ 0.0893854748603352, "#1910d8" ], [ 0.1787709497206704, "#3c19f0" ], [ 0.2681564245810056, "#6b1cfb" ], [ 0.3575418994413408, "#981cfd" ], [ 0.44692737430167595, "#bf1cfd" ], [ 0.5363128491620112, "#dd2bfd" ], [ 0.6256983240223464, "#f246fe" ], [ 0.7150837988826816, "#fc67fd" ], [ 0.8044692737430168, "#fe88fc" ], [ 0.8938547486033519, "#fea5fd" ], [ 0.9832402234636871, "#febefe" ], [ 1, "#fec3fe" ] ] }, "plot_bgcolor": "white", "paper_bgcolor": "white", "shapedefaults": { "line": { "width": 0 }, "opacity": 0.4, "fillcolor": "#506784" }, "annotationdefaults": { "arrowhead": 0, "arrowcolor": "#506784", "arrowwidth": 1 } }, "themeRef": "PLOTLY_WHITE" }, "colorscale": { "diverging": [ [ 0, "#9e0142" ], [ 0.1, "#d53e4f" ], [ 0.2, "#f46d43" ], [ 0.3, "#fdae61" ], [ 0.4, "#fee08b" ], [ 0.5, "#ffffbf" ], [ 0.6, "#e6f598" ], [ 0.7, "#abdda4" ], [ 0.8, "#66c2a5" ], [ 0.9, "#3288bd" ], [ 1, "#5e4fa2" ] ] }, "plot_bgcolor": "rgb(227, 215, 215)", "paper_bgcolor": "rgb(245, 239, 239)" } }, "height": null, "width": null, "user": { "profile_url": "https://chart-studio.plotly.com/~melsozkal", "avatar_url": "https://storage.googleapis.com/plotly-prod-profiles/62.jpg", "background_url": "https://storage.googleapis.com/plotly-prod-profiles/bg-9.jpg", "bio": "", "nickname": "", "website": "", "stream_tokens": null, "feature_set_id": null, "csrf_token": null, "date_joined": "2023-11-16 13:23:58", "mapbox_access_tokens": null, "has_password": null, "username": "melsozkal", "email": null, "is_active": null, "readonly": null, "is_dash_creator": null, "dash_created_count": null, "is_chart_creator": null, "charts_created_count": null } }, { "creation_time": "2024-04-04T19:25:59.109877Z", "comments": { "results": [], "count": 0 }, "parented": true, "embed_url": "https://chart-studio.plotly.com/~wagers18/2.embed", "fid": "wagers18:2", "filename": "Plot 2", "filetype": "plot", "img_url": "https://storage.googleapis.com/plotly-prod-images/wagers18/2/9_JUQY12QNGLKLE10YYQ5FLBCACN0DV5.png", "image_urls": { "default": "https://storage.googleapis.com/plotly-prod-images/wagers18/2/2_IXNXH2G0A5E9M97FTA2JC9DTYNEGDX.png", "block-thumb": "https://storage.googleapis.com/plotly-prod-images/wagers18/2/8_FYF2VZQMWT3W1R5P4IVUY5FWJU4C4E.png", "list-thumb": "https://storage.googleapis.com/plotly-prod-images/wagers18/2/9_JUQY12QNGLKLE10YYQ5FLBCACN0DV5.png" }, "api_urls": { "files": "https://api.plotly.com/v2/files/wagers18:2", "plots": "https://api.plotly.com/v2/plots/wagers18:2", "parent": "https://api.plotly.com/v2/folders/home?user=wagers18" }, "owner": "wagers18", "parent": -1, "preview": "", "referencers": [], "references": [], "title": "", "views": 4, "web_url": "https://chart-studio.plotly.com/~wagers18/2/", "world_readable": true, "date_modified": "2024-04-24T16:43:39.083Z", "stars": { "results": [], "count": 0 }, "collaborators": { "results": [], "count": 0 }, "subfolder_count": null, "refresh_interval": null, "organize_view_url": "https://chart-studio.plotly.com/~wagers18/2/", "current_user_permission": "read", "is_theme": null, "is_template": false, "autosize": true, "caption": "", "figure": { "data": [ { "meta": { "columnNames": { "x": "A", "y": "B" } }, "mode": "lines", "name": "Tschopp", "type": "scatter", "xsrc": "wagers18:0:d7c463", "ysrc": "wagers18:0:71120c" }, { "meta": { "columnNames": { "x": "A", "y": "B" } }, "mode": "lines", "name": "own calculation", "type": "scatter", "xsrc": "wagers18:1:64679e", "ysrc": "wagers18:1:74d99e" }, { "meta": { "columnNames": { "x": "A", "y": "B" } }, "mode": "markers", "name": "Tschopp", "type": "scatter", "xsrc": "wagers18:0:d7c463", "ysrc": "wagers18:0:71120c", "stackgroup": null }, { "meta": { "columnNames": { "x": "A", "y": "B" } }, "mode": "markers", "name": "Own Calculation", "type": "scatter", "xsrc": "wagers18:1:64679e", "ysrc": "wagers18:1:74d99e", "stackgroup": null } ], "frames": [], "layout": { "title": { "text": "<110> Symmetric Tilt Grain Boundaries" }, "xaxis": { "type": "linear", "range": [ -2.4706293205671255, 182.22959550129482 ], "title": { "text": "misorientation angle" }, "autorange": true }, "yaxis": { "type": "linear", "range": [ 46.50660673297629, 537.1 ], "title": { "text": "Grain Boundary Energy (mJ/m^2)" }, "autorange": false }, "autosize": true, "template": { "data": { "bar": [ { "type": "bar", "marker": { "colorbar": { "ticks": "", "outlinewidth": 0 } } } ], "table": [ { "type": "table", "cells": { "fill": { "color": "#EBF0F8" }, "line": { "color": "white" } }, "header": { "fill": { "color": "#C8D4E3" }, "line": { "color": "white" } } } ], "carpet": [ { "type": "carpet", "aaxis": { "gridcolor": "#C8D4E3", "linecolor": "#C8D4E3", "endlinecolor": "#2a3f5f", "minorgridcolor": "#C8D4E3", "startlinecolor": "#2a3f5f" }, "baxis": { "gridcolor": "#C8D4E3", "linecolor": "#C8D4E3", "endlinecolor": "#2a3f5f", "minorgridcolor": "#C8D4E3", "startlinecolor": "#2a3f5f" } } ], "mesh3d": [ { "type": "mesh3d", "colorbar": { "ticks": "", "outlinewidth": 0 } } ], "contour": [ { "type": "contour", "colorbar": { "ticks": "", "outlinewidth": 0 }, "autocolorscale": true } ], "heatmap": [ { "type": "heatmap", "colorbar": { "ticks": "", "outlinewidth": 0 }, "autocolorscale": true } ], "scatter": [ { "type": "scatter", "marker": { "colorbar": { "ticks": "", "outlinewidth": 0 } } } ], "surface": [ { "type": "surface", "colorbar": { "ticks": "", "outlinewidth": 0 } } ], "heatmapgl": [ { "type": "heatmapgl", "colorbar": { "ticks": "", "outlinewidth": 0 } } ], "histogram": [ { "type": "histogram", "marker": { "colorbar": { "ticks": "", "outlinewidth": 0 } } } ], "parcoords": [ { "line": { "colorbar": { "ticks": "", "outlinewidth": 0 } }, "type": "parcoords" } ], "scatter3d": [ { "type": "scatter3d", "marker": { "colorbar": { "ticks": "", "outlinewidth": 0 } } } ], "scattergl": [ { "type": "scattergl", "marker": { "colorbar": { "ticks": "", "outlinewidth": 0 } } } ], "choropleth": [ { "type": "choropleth", "colorbar": { "ticks": "", "outlinewidth": 0 } } ], "scattergeo": [ { "type": "scattergeo", "marker": { "colorbar": { "ticks": "", "outlinewidth": 0 } } } ], "histogram2d": [ { "type": "histogram2d", "colorbar": { "ticks": "", "outlinewidth": 0 }, "autocolorscale": true } ], "scatterpolar": [ { "type": "scatterpolar", "marker": { "colorbar": { "ticks": "", "outlinewidth": 0 } } } ], "contourcarpet": [ { "type": "contourcarpet", "colorbar": { "ticks": "", "outlinewidth": 0 } } ], "scattercarpet": [ { "type": "scattercarpet", "marker": { "colorbar": { "ticks": "", "outlinewidth": 0 } } } ], "scattermapbox": [ { "type": "scattermapbox", "marker": { "colorbar": { "ticks": "", "outlinewidth": 0 } } } ], "scatterpolargl": [ { "type": "scatterpolargl", "marker": { "colorbar": { "ticks": "", "outlinewidth": 0 } } } ], "scatterternary": [ { "type": "scatterternary", "marker": { "colorbar": { "ticks": "", "outlinewidth": 0 } } } ], "histogram2dcontour": [ { "type": "histogram2dcontour", "colorbar": { "ticks": "", "outlinewidth": 0 }, "autocolorscale": true } ] }, "layout": { "geo": { "bgcolor": "white", "showland": true, "lakecolor": "white", "landcolor": "white", "showlakes": true, "subunitcolor": "#C8D4E3" }, "font": { "color": "#2a3f5f" }, "polar": { "bgcolor": "white", "radialaxis": { "ticks": "", "gridcolor": "#EBF0F8", "linecolor": "#EBF0F8" }, "angularaxis": { "ticks": "", "gridcolor": "#EBF0F8", "linecolor": "#EBF0F8" } }, "scene": { "xaxis": { "ticks": "", "gridcolor": "#DFE8F3", "gridwidth": 2, "linecolor": "#EBF0F8", "zerolinecolor": "#EBF0F8", "showbackground": true, "backgroundcolor": "white" }, "yaxis": { "ticks": "", "gridcolor": "#DFE8F3", "gridwidth": 2, "linecolor": "#EBF0F8", "zerolinecolor": "#EBF0F8", "showbackground": true, "backgroundcolor": "white" }, "zaxis": { "ticks": "", "gridcolor": "#DFE8F3", "gridwidth": 2, "linecolor": "#EBF0F8", "zerolinecolor": "#EBF0F8", "showbackground": true, "backgroundcolor": "white" } }, "title": { "x": 0.05 }, "xaxis": { "ticks": "", "gridcolor": "#EBF0F8", "linecolor": "#EBF0F8", "automargin": true, "zerolinecolor": "#EBF0F8", "zerolinewidth": 2 }, "yaxis": { "ticks": "", "gridcolor": "#EBF0F8", "linecolor": "#EBF0F8", "automargin": true, "zerolinecolor": "#EBF0F8", "zerolinewidth": 2 }, "ternary": { "aaxis": { "ticks": "", "gridcolor": "#DFE8F3", "linecolor": "#A2B1C6" }, "baxis": { "ticks": "", "gridcolor": "#DFE8F3", "linecolor": "#A2B1C6" }, "caxis": { "ticks": "", "gridcolor": "#DFE8F3", "linecolor": "#A2B1C6" }, "bgcolor": "white" }, "colorway": [ "#636efa", "#EF553B", "#00cc96", "#ab63fa", "#19d3f3", "#e763fa", "#fecb52", "#ffa15a", "#ff6692", "#b6e880" ], "hovermode": "closest", "colorscale": { "diverging": [ [ 0, "#8e0152" ], [ 0.1, "#c51b7d" ], [ 0.2, "#de77ae" ], [ 0.3, "#f1b6da" ], [ 0.4, "#fde0ef" ], [ 0.5, "#f7f7f7" ], [ 0.6, "#e6f5d0" ], [ 0.7, "#b8e186" ], [ 0.8, "#7fbc41" ], [ 0.9, "#4d9221" ], [ 1, "#276419" ] ], "sequential": [ [ 0, "#0508b8" ], [ 0.0893854748603352, "#1910d8" ], [ 0.1787709497206704, "#3c19f0" ], [ 0.2681564245810056, "#6b1cfb" ], [ 0.3575418994413408, "#981cfd" ], [ 0.44692737430167595, "#bf1cfd" ], [ 0.5363128491620112, "#dd2bfd" ], [ 0.6256983240223464, "#f246fe" ], [ 0.7150837988826816, "#fc67fd" ], [ 0.8044692737430168, "#fe88fc" ], [ 0.8938547486033519, "#fea5fd" ], [ 0.9832402234636871, "#febefe" ], [ 1, "#fec3fe" ] ], "sequentialminus": [ [ 0, "#0508b8" ], [ 0.0893854748603352, "#1910d8" ], [ 0.1787709497206704, "#3c19f0" ], [ 0.2681564245810056, "#6b1cfb" ], [ 0.3575418994413408, "#981cfd" ], [ 0.44692737430167595, "#bf1cfd" ], [ 0.5363128491620112, "#dd2bfd" ], [ 0.6256983240223464, "#f246fe" ], [ 0.7150837988826816, "#fc67fd" ], [ 0.8044692737430168, "#fe88fc" ], [ 0.8938547486033519, "#fea5fd" ], [ 0.9832402234636871, "#febefe" ], [ 1, "#fec3fe" ] ] }, "plot_bgcolor": "white", "paper_bgcolor": "white", "shapedefaults": { "line": { "width": 0 }, "opacity": 0.4, "fillcolor": "#506784" }, "annotationdefaults": { "arrowhead": 0, "arrowcolor": "#506784", "arrowwidth": 1 } }, "themeRef": "PLOTLY_WHITE" } } }, "height": null, "width": null, "user": { "profile_url": "https://chart-studio.plotly.com/~wagers18", "avatar_url": "https://storage.googleapis.com/plotly-prod-profiles/43.jpg", "background_url": "https://storage.googleapis.com/plotly-prod-profiles/bg-14.jpg", "bio": "", "nickname": "", "website": "", "stream_tokens": null, "feature_set_id": null, "csrf_token": null, "date_joined": "2024-04-04 19:23:40", "mapbox_access_tokens": null, "has_password": null, "username": "wagers18", "email": null, "is_active": null, "readonly": null, "is_dash_creator": null, "dash_created_count": null, "is_chart_creator": null, "charts_created_count": null } }, { "creation_time": "2024-04-04T19:06:48.208695Z", "comments": { "results": [], "count": 0 }, "parented": true, "embed_url": "https://chart-studio.plotly.com/~RubenJC/1.embed", "fid": "RubenJC:1", "filename": "GantChart", "filetype": "plot", "img_url": "https://storage.googleapis.com/plotly-prod-images/RubenJC/1/9_1GG9IUVUJG68U46OPEYNS966ESR4ND.png", "image_urls": { "default": "https://storage.googleapis.com/plotly-prod-images/RubenJC/1/2_CUS1K6VD2BAR1IEY211OH5C2DVU4HT.png", "block-thumb": "https://storage.googleapis.com/plotly-prod-images/RubenJC/1/8_UVHDCIN8CVR59GHG25TPFOG1HBQ9K2.png", "list-thumb": "https://storage.googleapis.com/plotly-prod-images/RubenJC/1/9_1GG9IUVUJG68U46OPEYNS966ESR4ND.png" }, "api_urls": { "files": "https://api.plotly.com/v2/files/RubenJC:1", "plots": "https://api.plotly.com/v2/plots/RubenJC:1", "parent": "https://api.plotly.com/v2/folders/home?user=RubenJC" }, "owner": "RubenJC", "parent": -1, "preview": "", "referencers": [], "references": [], "title": "", "views": 17, "web_url": "https://chart-studio.plotly.com/~RubenJC/1/", "world_readable": true, "date_modified": "2025-04-14T14:27:13.575Z", "stars": { "results": [], "count": 0 }, "collaborators": { "results": [], "count": 0 }, "subfolder_count": null, "refresh_interval": null, "organize_view_url": "https://chart-studio.plotly.com/~RubenJC/1/", "current_user_permission": "read", "is_theme": null, "is_template": null, "autosize": true, "caption": "", "figure": { "data": [ { "name": "", "type": "bar", "xsrc": "RubenJC:24:6e5928", "ysrc": "RubenJC:24:bcbf77", "xaxis": "x", "yaxis": "y", "marker": { "line": { "color": "black", "width": 0.1 }, "color": { "bdata": "AAAAAAAA", "dtype": "i1" }, "pattern": { "shape": "" }, "coloraxis": "coloraxis" }, "basesrc": "RubenJC:24:1d68db", "showlegend": false, "legendgroup": "", "orientation": "h", "textposition": "auto", "customdatasrc": "RubenJC:24:a1288f", "hovertemplate": "<b>%{y}</b><br>Start: %{customdata[0]}<br>Finish: %{customdata[1]}<br>Completion: %{marker.color}%<br>Description:<br>%{customdata[2]}<br>Duration: %{customdata[3]} weeks<extra></extra>" } ], "layout": { "xaxis": { "type": "date", "title": { "font": { "size": 14, "family": "Times New Roman" } }, "anchor": "y", "domain": [ 0.0, 1.0 ], "showline": true, "tickfont": { "size": 20, "family": "Times New Roman" }, "linecolor": "black", "linewidth": 2 }, "yaxis": { "title": { "font": { "size": 14, "family": "Times New Roman" }, "text": "" }, "anchor": "x", "domain": [ 0.0, 1.0 ], "showline": true, "tickfont": { "size": 20, "family": "Times New Roman" }, "linecolor": "black", "linewidth": 2 }, "legend": { "tracegroupgap": 0 }, "margin": { "t": 60 }, "barmode": "overlay", "template": { "data": { "bar": [ { "type": "bar", "marker": { "line": { "color": "white", "width": 0.5 }, "pattern": { "size": 10, "fillmode": "overlay", "solidity": 0.2 } }, "error_x": { "color": "#2a3f5f" }, "error_y": { "color": "#2a3f5f" } } ], "pie": [ { "type": "pie", "automargin": true } ], "table": [ { "type": "table", "cells": { "fill": { "color": "#EBF0F8" }, "line": { "color": "white" } }, "header": { "fill": { "color": "#C8D4E3" }, "line": { "color": "white" } } } ], "carpet": [ { "type": "carpet", "aaxis": { "gridcolor": "#C8D4E3", "linecolor": "#C8D4E3", "endlinecolor": "#2a3f5f", "minorgridcolor": "#C8D4E3", "startlinecolor": "#2a3f5f" }, "baxis": { "gridcolor": "#C8D4E3", "linecolor": "#C8D4E3", "endlinecolor": "#2a3f5f", "minorgridcolor": "#C8D4E3", "startlinecolor": "#2a3f5f" } } ], "mesh3d": [ { "type": "mesh3d", "colorbar": { "ticks": "", "outlinewidth": 0 } } ], "contour": [ { "type": "contour", "colorbar": { "ticks": "", "outlinewidth": 0 }, "colorscale": [ [ 0.0, "#0d0887" ], [ 0.1111111111111111, "#46039f" ], [ 0.2222222222222222, "#7201a8" ], [ 0.3333333333333333, "#9c179e" ], [ 0.4444444444444444, "#bd3786" ], [ 0.5555555555555556, "#d8576b" ], [ 0.6666666666666666, "#ed7953" ], [ 0.7777777777777778, "#fb9f3a" ], [ 0.8888888888888888, "#fdca26" ], [ 1.0, "#f0f921" ] ] } ], "heatmap": [ { "type": "heatmap", "colorbar": { "ticks": "", "outlinewidth": 0 }, "colorscale": [ [ 0.0, "#0d0887" ], [ 0.1111111111111111, "#46039f" ], [ 0.2222222222222222, "#7201a8" ], [ 0.3333333333333333, "#9c179e" ], [ 0.4444444444444444, "#bd3786" ], [ 0.5555555555555556, "#d8576b" ], [ 0.6666666666666666, "#ed7953" ], [ 0.7777777777777778, "#fb9f3a" ], [ 0.8888888888888888, "#fdca26" ], [ 1.0, "#f0f921" ] ] } ], "scatter": [ { "type": "scatter", "fillpattern": { "size": 10, "fillmode": "overlay", "solidity": 0.2 } } ], "surface": [ { "type": "surface", "colorbar": { "ticks": "", "outlinewidth": 0 }, "colorscale": [ [ 0.0, "#0d0887" ], [ 0.1111111111111111, "#46039f" ], [ 0.2222222222222222, "#7201a8" ], [ 0.3333333333333333, "#9c179e" ], [ 0.4444444444444444, "#bd3786" ], [ 0.5555555555555556, "#d8576b" ], [ 0.6666666666666666, "#ed7953" ], [ 0.7777777777777778, "#fb9f3a" ], [ 0.8888888888888888, "#fdca26" ], [ 1.0, "#f0f921" ] ] } ], "barpolar": [ { "type": "barpolar", "marker": { "line": { "color": "white", "width": 0.5 }, "pattern": { "size": 10, "fillmode": "overlay", "solidity": 0.2 } } } ], "histogram": [ { "type": "histogram", "marker": { "pattern": { "size": 10, "fillmode": "overlay", "solidity": 0.2 } } } ], "parcoords": [ { "line": { "colorbar": { "ticks": "", "outlinewidth": 0 } }, "type": "parcoords" } ], "scatter3d": [ { "line": { "colorbar": { "ticks": "", "outlinewidth": 0 } }, "type": "scatter3d", "marker": { "colorbar": { "ticks": "", "outlinewidth": 0 } } } ], "scattergl": [ { "type": "scattergl", "marker": { "colorbar": { "ticks": "", "outlinewidth": 0 } } } ], "choropleth": [ { "type": "choropleth", "colorbar": { "ticks": "", "outlinewidth": 0 } } ], "scattergeo": [ { "type": "scattergeo", "marker": { "colorbar": { "ticks": "", "outlinewidth": 0 } } } ], "scattermap": [ { "type": "scattermap", "marker": { "colorbar": { "ticks": "", "outlinewidth": 0 } } } ], "histogram2d": [ { "type": "histogram2d", "colorbar": { "ticks": "", "outlinewidth": 0 }, "colorscale": [ [ 0.0, "#0d0887" ], [ 0.1111111111111111, "#46039f" ], [ 0.2222222222222222, "#7201a8" ], [ 0.3333333333333333, "#9c179e" ], [ 0.4444444444444444, "#bd3786" ], [ 0.5555555555555556, "#d8576b" ], [ 0.6666666666666666, "#ed7953" ], [ 0.7777777777777778, "#fb9f3a" ], [ 0.8888888888888888, "#fdca26" ], [ 1.0, "#f0f921" ] ] } ], "scatterpolar": [ { "type": "scatterpolar", "marker": { "colorbar": { "ticks": "", "outlinewidth": 0 } } } ], "contourcarpet": [ { "type": "contourcarpet", "colorbar": { "ticks": "", "outlinewidth": 0 } } ], "scattercarpet": [ { "type": "scattercarpet", "marker": { "colorbar": { "ticks": "", "outlinewidth": 0 } } } ], "scattermapbox": [ { "type": "scattermapbox", "marker": { "colorbar": { "ticks": "", "outlinewidth": 0 } } } ], "scatterpolargl": [ { "type": "scatterpolargl", "marker": { "colorbar": { "ticks": "", "outlinewidth": 0 } } } ], "scatterternary": [ { "type": "scatterternary", "marker": { "colorbar": { "ticks": "", "outlinewidth": 0 } } } ], "histogram2dcontour": [ { "type": "histogram2dcontour", "colorbar": { "ticks": "", "outlinewidth": 0 }, "colorscale": [ [ 0.0, "#0d0887" ], [ 0.1111111111111111, "#46039f" ], [ 0.2222222222222222, "#7201a8" ], [ 0.3333333333333333, "#9c179e" ], [ 0.4444444444444444, "#bd3786" ], [ 0.5555555555555556, "#d8576b" ], [ 0.6666666666666666, "#ed7953" ], [ 0.7777777777777778, "#fb9f3a" ], [ 0.8888888888888888, "#fdca26" ], [ 1.0, "#f0f921" ] ] } ] }, "layout": { "geo": { "bgcolor": "white", "showland": true, "lakecolor": "white", "landcolor": "white", "showlakes": true, "subunitcolor": "#C8D4E3" }, "font": { "color": "#2a3f5f" }, "polar": { "bgcolor": "white", "radialaxis": { "ticks": "", "gridcolor": "#EBF0F8", "linecolor": "#EBF0F8" }, "angularaxis": { "ticks": "", "gridcolor": "#EBF0F8", "linecolor": "#EBF0F8" } }, "scene": { "xaxis": { "ticks": "", "gridcolor": "#DFE8F3", "gridwidth": 2, "linecolor": "#EBF0F8", "zerolinecolor": "#EBF0F8", "showbackground": true, "backgroundcolor": "white" }, "yaxis": { "ticks": "", "gridcolor": "#DFE8F3", "gridwidth": 2, "linecolor": "#EBF0F8", "zerolinecolor": "#EBF0F8", "showbackground": true, "backgroundcolor": "white" }, "zaxis": { "ticks": "", "gridcolor": "#DFE8F3", "gridwidth": 2, "linecolor": "#EBF0F8", "zerolinecolor": "#EBF0F8", "showbackground": true, "backgroundcolor": "white" } }, "title": { "x": 0.05 }, "xaxis": { "ticks": "", "title": { "standoff": 15 }, "gridcolor": "#EBF0F8", "linecolor": "#EBF0F8", "automargin": true, "zerolinecolor": "#EBF0F8", "zerolinewidth": 2 }, "yaxis": { "ticks": "", "title": { "standoff": 15 }, "gridcolor": "#EBF0F8", "linecolor": "#EBF0F8", "automargin": true, "zerolinecolor": "#EBF0F8", "zerolinewidth": 2 }, "mapbox": { "style": "light" }, "ternary": { "aaxis": { "ticks": "", "gridcolor": "#DFE8F3", "linecolor": "#A2B1C6" }, "baxis": { "ticks": "", "gridcolor": "#DFE8F3", "linecolor": "#A2B1C6" }, "caxis": { "ticks": "", "gridcolor": "#DFE8F3", "linecolor": "#A2B1C6" }, "bgcolor": "white" }, "colorway": [ "#636efa", "#EF553B", "#00cc96", "#ab63fa", "#FFA15A", "#19d3f3", "#FF6692", "#B6E880", "#FF97FF", "#FECB52" ], "coloraxis": { "colorbar": { "ticks": "", "outlinewidth": 0 } }, "hovermode": "closest", "colorscale": { "diverging": [ [ 0, "#8e0152" ], [ 0.1, "#c51b7d" ], [ 0.2, "#de77ae" ], [ 0.3, "#f1b6da" ], [ 0.4, "#fde0ef" ], [ 0.5, "#f7f7f7" ], [ 0.6, "#e6f5d0" ], [ 0.7, "#b8e186" ], [ 0.8, "#7fbc41" ], [ 0.9, "#4d9221" ], [ 1, "#276419" ] ], "sequential": [ [ 0.0, "#0d0887" ], [ 0.1111111111111111, "#46039f" ], [ 0.2222222222222222, "#7201a8" ], [ 0.3333333333333333, "#9c179e" ], [ 0.4444444444444444, "#bd3786" ], [ 0.5555555555555556, "#d8576b" ], [ 0.6666666666666666, "#ed7953" ], [ 0.7777777777777778, "#fb9f3a" ], [ 0.8888888888888888, "#fdca26" ], [ 1.0, "#f0f921" ] ], "sequentialminus": [ [ 0.0, "#0d0887" ], [ 0.1111111111111111, "#46039f" ], [ 0.2222222222222222, "#7201a8" ], [ 0.3333333333333333, "#9c179e" ], [ 0.4444444444444444, "#bd3786" ], [ 0.5555555555555556, "#d8576b" ], [ 0.6666666666666666, "#ed7953" ], [ 0.7777777777777778, "#fb9f3a" ], [ 0.8888888888888888, "#fdca26" ], [ 1.0, "#f0f921" ] ] }, "hoverlabel": { "align": "left" }, "plot_bgcolor": "white", "paper_bgcolor": "white", "shapedefaults": { "line": { "color": "#2a3f5f" } }, "autotypenumbers": "strict", "annotationdefaults": { "arrowhead": 0, "arrowcolor": "#2a3f5f", "arrowwidth": 1 } } }, "coloraxis": { "colorbar": { "title": { "font": { "size": 18, "family": "Times New Roman" }, "text": "% of Completion" }, "tickfont": { "size": 16 } }, "colorscale": [ [ 0.0, "rgb(196, 230, 195)" ], [ 0.16666666666666666, "rgb(150, 210, 164)" ], [ 0.3333333333333333, "rgb(109, 188, 144)" ], [ 0.5, "rgb(77, 162, 132)" ], [ 0.6666666666666666, "rgb(54, 135, 122)" ], [ 0.8333333333333334, "rgb(38, 107, 110)" ], [ 1.0, "rgb(29, 79, 96)" ] ] } } }, "height": null, "width": null, "user": { "profile_url": "https://chart-studio.plotly.com/~RubenJC", "avatar_url": "https://storage.googleapis.com/plotly-prod-profiles/16.jpg", "background_url": "https://storage.googleapis.com/plotly-prod-profiles/bg-1.jpg", "bio": "", "nickname": "", "website": "", "stream_tokens": null, "feature_set_id": null, "csrf_token": null, "date_joined": "2024-04-04 19:03:38", "mapbox_access_tokens": null, "has_password": null, "username": "RubenJC", "email": null, "is_active": null, "readonly": null, "is_dash_creator": null, "dash_created_count": null, "is_chart_creator": null, "charts_created_count": null } } ] }
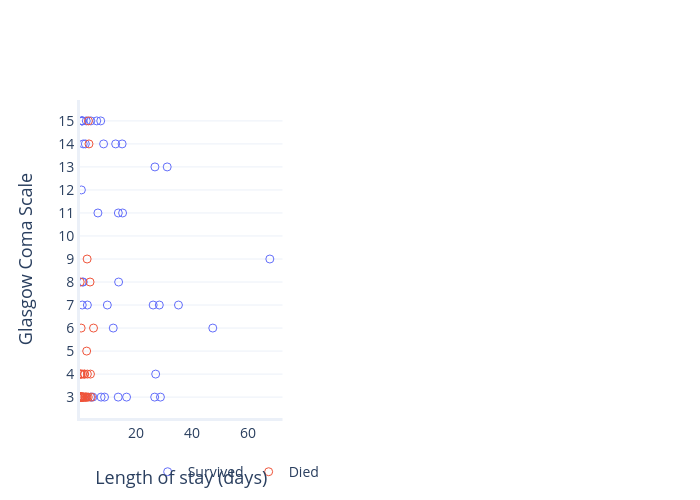
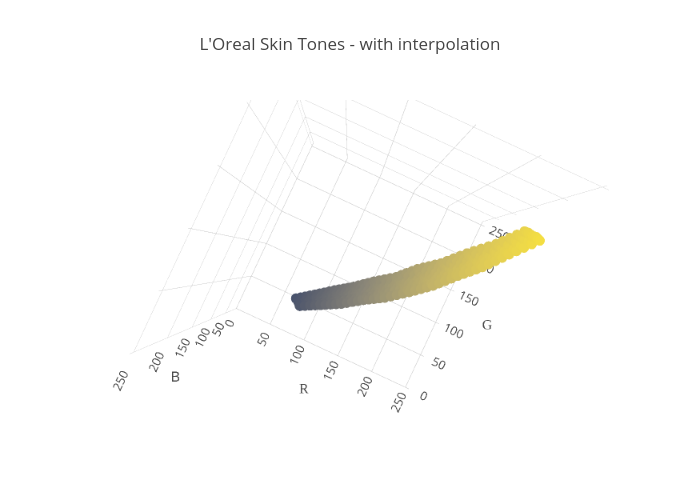
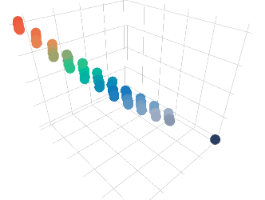
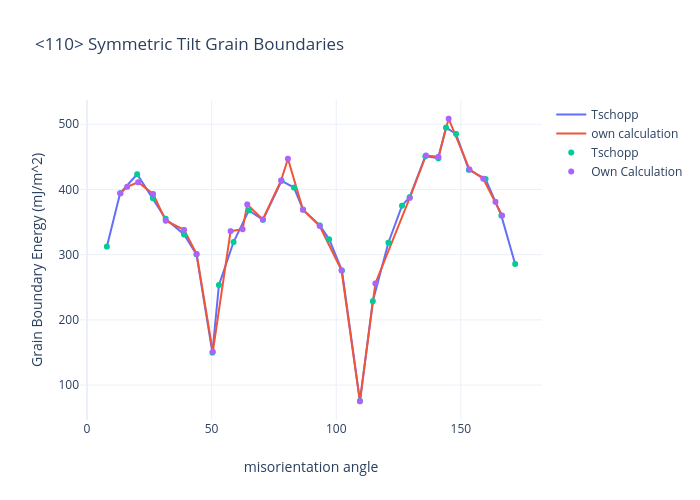