Plots List
Plots
This endpoint handles manipulation of Plotly plot files.
Reference
Authorization
Any user with or without a Plotly account may view public plots. For private plots, see authentication.
Actions
list
Listing all public plots can be done via a GET request to this endpoint.
By default, plots will be listed in order of date created. The order_by
query parameter is accepted at this endpoint. Currently, only ordering by
views is supported. It is possible to filter the plots by quality
with min_quality or max_quality as query parameter.
Example:
// GET https://api.plotly.com/v2/plots/ ---> 200

// GET https://api.plotly.com/v2/plots/?order_by=-views ---> 200

// GET https://api.plotly.com/v2/plots/?min_quality=5 ---> 200

// GET https://api.plotly.com/v2/plots/?max_quality=5 ---> 200
feed
Listing all handpicked feed plots can be done via a GET request to this endpoint. By default, plots will be listed in a random order.
Example:
// GET https://api.plotly.com/v2/plots/feed ---> 200
create
You can create new plot resources here. The only required field is 'figure'. Currently, the figure is restricted to only contain references to grid data. That is, this will fail if raw data arrays are passed in. To create and manipulate underlying grids for plots, see the grids endpoint.
Example:
// This fails because a figure field is required.
// POST https://api.plotly.com/v2/plots ---> 400 Bad Request
{}

// This fails because the figure has raw data
//POST https://api.plotly.com/v2/plots ---> 400 Bad Request
{
    "figure": {"data": [{"y": ['this', 'is', 'raw', 'data']}]}
}

// This succeeds because the figure has src keys, not raw data.
//POST https://api.plotly.com/v2/plots ---> 200 OK
{
    "figure": {"data": [{"ysrc": "sven:88:u8nd62"}]}
}
When creating a grid, you can optionally specify a source_fid to specify where a plot has come from:
- source_fid: the fid of a plot that was copied (and presumably edited) to produce this one
detail
There is a lot of meta information stored about plot files including filename, title, share_url, and content_url to name a few.
This information can only be reached with a GET to this endpoint.
Example:
// GET https://api.plotly.com/v2/plots/iheartgraphs:90
content
The contents of a plot can be downloaded via the content resource. The plot
content contains referenced grid/column data by default. If you wish to
return the raw grid/column data, the inline_data=true query must be included
in the request url. The Content-Type header will be appropriately set for the
response body.
Alternatively, you can set ?map_data=unreadable to append a mapping of
sources to data that belongs to grids which are unreadable for the
requestor. This is useful when you have read access to another users plot,
but that plot contains grid references which you don't have access to.
Examples:
// Returns referenced grid/column data
// GET https://api.plotly.com/v2/plots/iheartgraphs:90/content ---> 200 OK

// Returns full grid/column data
// GET https://api.plotly.com/v2/plots/iheartgraphs:90/content?inline_data=true ---> 200 OK

// Returns full grid/column data when requestor doesn't have permission
// to read the referenced grid.
// GET https://api.plotly.com/v2/plots/iheartgraphs:90/content?map_data=unreadable ---> 200 OK
GET /v2/plots?cursor=cj0xJnA9MjAyNC0wNC0wNCsxMyUzQTQxJTNBMTYuODgwNDIzJTJCMDAlM0EwMA%3D%3D&format=api
{ "next": "https://api.plot.ly/v2/plots?cursor=cD0yMDI0LTA0LTA0KzEzJTNBNDElM0E0OC42Mzk2ODAlMkIwMCUzQTAw&format=api", "previous": "https://api.plot.ly/v2/plots?cursor=cj0xJnA9MjAyNC0wNC0wNCsxNCUzQTE1JTNBMTIuOTI0NTcwJTJCMDAlM0EwMA%3D%3D&format=api", "results": [ { "creation_time": "2024-04-04T14:15:12.924570Z", "comments": { "results": [], "count": 0 }, "parented": true, "embed_url": "https://chart-studio.plotly.com/~timvansteenbergen/1.embed", "fid": "timvansteenbergen:1", "filename": "Plot 1", "filetype": "plot", "img_url": "https://storage.googleapis.com/plotly-prod-images/timvansteenbergen/1/9_NW5JX0TDF3QDFU70NYX6XN9E7XULGK.png", "image_urls": { "default": "https://storage.googleapis.com/plotly-prod-images/timvansteenbergen/1/2_WV3XRK3FZ6BIVJ3NCMXJIJOUZMZ1FG.png", "block-thumb": "https://storage.googleapis.com/plotly-prod-images/timvansteenbergen/1/8_OUN33TJNMCQA39CCVBCA0TVCVR60PQ.png", "list-thumb": "https://storage.googleapis.com/plotly-prod-images/timvansteenbergen/1/9_NW5JX0TDF3QDFU70NYX6XN9E7XULGK.png" }, "api_urls": { "files": "https://api.plotly.com/v2/files/timvansteenbergen:1", "plots": "https://api.plotly.com/v2/plots/timvansteenbergen:1", "parent": "https://api.plotly.com/v2/folders/home?user=timvansteenbergen" }, "owner": "timvansteenbergen", "parent": -1, "preview": "", "referencers": [], "references": [], "title": "", "views": 2, "web_url": "https://chart-studio.plotly.com/~timvansteenbergen/1/", "world_readable": true, "date_modified": "2024-04-04T14:15:12.934Z", "stars": { "results": [], "count": 0 }, "collaborators": { "results": [], "count": 0 }, "subfolder_count": null, "refresh_interval": null, "organize_view_url": "https://chart-studio.plotly.com/~timvansteenbergen/1/", "current_user_permission": "read", "is_theme": null, "is_template": false, "autosize": true, "caption": "", "figure": { "data": [ { "meta": { "columnNames": { "x": "A", "y": "B" } }, "mode": "markers", "type": "scatter", "xsrc": "timvansteenbergen:0:5f118a", "ysrc": "timvansteenbergen:0:d3c5bb" } ], "frames": [], "layout": { "xaxis": { "type": "linear", "range": [ 0.8225556130367304, 4.17744438696327 ], "autorange": true }, "yaxis": { "type": "linear", "range": [ 21.570621468926554, 46.429378531073446 ], "autorange": true }, "autosize": true, "template": { "data": { "bar": [ { "type": "bar", "marker": { "colorbar": { "ticks": "", "outlinewidth": 0 } } } ], "table": [ { "type": "table", "cells": { "fill": { "color": "#EBF0F8" }, "line": { "color": "white" } }, "header": { "fill": { "color": "#C8D4E3" }, "line": { "color": "white" } } } ], "carpet": [ { "type": "carpet", "aaxis": { "gridcolor": "#C8D4E3", "linecolor": "#C8D4E3", "endlinecolor": "#2a3f5f", "minorgridcolor": "#C8D4E3", "startlinecolor": "#2a3f5f" }, "baxis": { "gridcolor": "#C8D4E3", "linecolor": "#C8D4E3", "endlinecolor": "#2a3f5f", "minorgridcolor": "#C8D4E3", "startlinecolor": "#2a3f5f" } } ], "mesh3d": [ { "type": "mesh3d", "colorbar": { "ticks": "", "outlinewidth": 0 } } ], "contour": [ { "type": "contour", "colorbar": { "ticks": "", "outlinewidth": 0 }, "autocolorscale": true } ], "heatmap": [ { "type": "heatmap", "colorbar": { "ticks": "", "outlinewidth": 0 }, "autocolorscale": true } ], "scatter": [ { "type": "scatter", "marker": { "colorbar": { "ticks": "", "outlinewidth": 0 } } } ], "surface": [ { "type": "surface", "colorbar": { "ticks": "", "outlinewidth": 0 } } ], "heatmapgl": [ { "type": "heatmapgl", "colorbar": { "ticks": "", "outlinewidth": 0 } } ], "histogram": [ { "type": "histogram", "marker": { "colorbar": { "ticks": "", "outlinewidth": 0 } } } ], "parcoords": [ { "line": { "colorbar": { "ticks": "", "outlinewidth": 0 } }, "type": "parcoords" } ], "scatter3d": [ { "type": "scatter3d", "marker": { "colorbar": { "ticks": "", "outlinewidth": 0 } } } ], "scattergl": [ { "type": "scattergl", "marker": { "colorbar": { "ticks": "", "outlinewidth": 0 } } } ], "choropleth": [ { "type": "choropleth", "colorbar": { "ticks": "", "outlinewidth": 0 } } ], "scattergeo": [ { "type": "scattergeo", "marker": { "colorbar": { "ticks": "", "outlinewidth": 0 } } } ], "histogram2d": [ { "type": "histogram2d", "colorbar": { "ticks": "", "outlinewidth": 0 }, "autocolorscale": true } ], "scatterpolar": [ { "type": "scatterpolar", "marker": { "colorbar": { "ticks": "", "outlinewidth": 0 } } } ], "contourcarpet": [ { "type": "contourcarpet", "colorbar": { "ticks": "", "outlinewidth": 0 } } ], "scattercarpet": [ { "type": "scattercarpet", "marker": { "colorbar": { "ticks": "", "outlinewidth": 0 } } } ], "scattermapbox": [ { "type": "scattermapbox", "marker": { "colorbar": { "ticks": "", "outlinewidth": 0 } } } ], "scatterpolargl": [ { "type": "scatterpolargl", "marker": { "colorbar": { "ticks": "", "outlinewidth": 0 } } } ], "scatterternary": [ { "type": "scatterternary", "marker": { "colorbar": { "ticks": "", "outlinewidth": 0 } } } ], "histogram2dcontour": [ { "type": "histogram2dcontour", "colorbar": { "ticks": "", "outlinewidth": 0 }, "autocolorscale": true } ] }, "layout": { "geo": { "bgcolor": "white", "showland": true, "lakecolor": "white", "landcolor": "white", "showlakes": true, "subunitcolor": "#C8D4E3" }, "font": { "color": "#2a3f5f" }, "polar": { "bgcolor": "white", "radialaxis": { "ticks": "", "gridcolor": "#EBF0F8", "linecolor": "#EBF0F8" }, "angularaxis": { "ticks": "", "gridcolor": "#EBF0F8", "linecolor": "#EBF0F8" } }, "scene": { "xaxis": { "ticks": "", "gridcolor": "#DFE8F3", "gridwidth": 2, "linecolor": "#EBF0F8", "zerolinecolor": "#EBF0F8", "showbackground": true, "backgroundcolor": "white" }, "yaxis": { "ticks": "", "gridcolor": "#DFE8F3", "gridwidth": 2, "linecolor": "#EBF0F8", "zerolinecolor": "#EBF0F8", "showbackground": true, "backgroundcolor": "white" }, "zaxis": { "ticks": "", "gridcolor": "#DFE8F3", "gridwidth": 2, "linecolor": "#EBF0F8", "zerolinecolor": "#EBF0F8", "showbackground": true, "backgroundcolor": "white" } }, "title": { "x": 0.05 }, "xaxis": { "ticks": "", "gridcolor": "#EBF0F8", "linecolor": "#EBF0F8", "automargin": true, "zerolinecolor": "#EBF0F8", "zerolinewidth": 2 }, "yaxis": { "ticks": "", "gridcolor": "#EBF0F8", "linecolor": "#EBF0F8", "automargin": true, "zerolinecolor": "#EBF0F8", "zerolinewidth": 2 }, "ternary": { "aaxis": { "ticks": "", "gridcolor": "#DFE8F3", "linecolor": "#A2B1C6" }, "baxis": { "ticks": "", "gridcolor": "#DFE8F3", "linecolor": "#A2B1C6" }, "caxis": { "ticks": "", "gridcolor": "#DFE8F3", "linecolor": "#A2B1C6" }, "bgcolor": "white" }, "colorway": [ "#636efa", "#EF553B", "#00cc96", "#ab63fa", "#19d3f3", "#e763fa", "#fecb52", "#ffa15a", "#ff6692", "#b6e880" ], "hovermode": "closest", "colorscale": { "diverging": [ [ 0, "#8e0152" ], [ 0.1, "#c51b7d" ], [ 0.2, "#de77ae" ], [ 0.3, "#f1b6da" ], [ 0.4, "#fde0ef" ], [ 0.5, "#f7f7f7" ], [ 0.6, "#e6f5d0" ], [ 0.7, "#b8e186" ], [ 0.8, "#7fbc41" ], [ 0.9, "#4d9221" ], [ 1, "#276419" ] ], "sequential": [ [ 0, "#0508b8" ], [ 0.0893854748603352, "#1910d8" ], [ 0.1787709497206704, "#3c19f0" ], [ 0.2681564245810056, "#6b1cfb" ], [ 0.3575418994413408, "#981cfd" ], [ 0.44692737430167595, "#bf1cfd" ], [ 0.5363128491620112, "#dd2bfd" ], [ 0.6256983240223464, "#f246fe" ], [ 0.7150837988826816, "#fc67fd" ], [ 0.8044692737430168, "#fe88fc" ], [ 0.8938547486033519, "#fea5fd" ], [ 0.9832402234636871, "#febefe" ], [ 1, "#fec3fe" ] ], "sequentialminus": [ [ 0, "#0508b8" ], [ 0.0893854748603352, "#1910d8" ], [ 0.1787709497206704, "#3c19f0" ], [ 0.2681564245810056, "#6b1cfb" ], [ 0.3575418994413408, "#981cfd" ], [ 0.44692737430167595, "#bf1cfd" ], [ 0.5363128491620112, "#dd2bfd" ], [ 0.6256983240223464, "#f246fe" ], [ 0.7150837988826816, "#fc67fd" ], [ 0.8044692737430168, "#fe88fc" ], [ 0.8938547486033519, "#fea5fd" ], [ 0.9832402234636871, "#febefe" ], [ 1, "#fec3fe" ] ] }, "plot_bgcolor": "white", "paper_bgcolor": "white", "shapedefaults": { "line": { "width": 0 }, "opacity": 0.4, "fillcolor": "#506784" }, "annotationdefaults": { "arrowhead": 0, "arrowcolor": "#506784", "arrowwidth": 1 } }, "themeRef": "PLOTLY_WHITE" } } }, "height": null, "width": null, "user": { "profile_url": "https://chart-studio.plotly.com/~timvansteenbergen", "avatar_url": "https://storage.googleapis.com/plotly-prod-profiles/24.jpg", "background_url": "https://storage.googleapis.com/plotly-prod-profiles/bg-2.jpg", "bio": "", "nickname": "", "website": "", "stream_tokens": null, "feature_set_id": null, "csrf_token": null, "date_joined": "2019-08-20 10:12:17", "mapbox_access_tokens": null, "has_password": null, "username": "timvansteenbergen", "email": null, "is_active": null, "readonly": null, "is_dash_creator": null, "dash_created_count": null, "is_chart_creator": null, "charts_created_count": null } }, { "creation_time": "2024-04-04T14:09:32.417610Z", "comments": { "results": [], "count": 0 }, "parented": true, "embed_url": "https://chart-studio.plotly.com/~Kayla_lola/1.embed", "fid": "Kayla_lola:1", "filename": "Vigna Radiata 1.0", "filetype": "plot", "img_url": "https://storage.googleapis.com/plotly-prod-images/Kayla_lola/1/9_IZUNOJNUGU2X8LSS7LSEMW5E1MRZFR.png", "image_urls": { "default": "https://storage.googleapis.com/plotly-prod-images/Kayla_lola/1/2_49PTR208WKOV7NUEYGKF3B1LK5E92F.png", "block-thumb": "https://storage.googleapis.com/plotly-prod-images/Kayla_lola/1/8_Y9R0K2984D4RVO1ER7XN2LUB4TZJ20.png", "list-thumb": "https://storage.googleapis.com/plotly-prod-images/Kayla_lola/1/9_IZUNOJNUGU2X8LSS7LSEMW5E1MRZFR.png" }, "api_urls": { "files": "https://api.plotly.com/v2/files/Kayla_lola:1", "plots": "https://api.plotly.com/v2/plots/Kayla_lola:1", "parent": "https://api.plotly.com/v2/folders/home?user=Kayla_lola" }, "owner": "Kayla_lola", "parent": -1, "preview": "", "referencers": [], "references": [], "title": "", "views": 2, "web_url": "https://chart-studio.plotly.com/~Kayla_lola/1/", "world_readable": true, "date_modified": "2024-04-04T14:32:19.488Z", "stars": { "results": [], "count": 0 }, "collaborators": { "results": [], "count": 0 }, "subfolder_count": null, "refresh_interval": null, "organize_view_url": "https://chart-studio.plotly.com/~Kayla_lola/1/", "current_user_permission": "read", "is_theme": null, "is_template": false, "autosize": true, "caption": "", "figure": { "data": [ { "meta": { "columnNames": { "x": "A", "y": "B" } }, "mode": "markers", "name": "trace 0", "type": "bar", "xsrc": "Kayla_lola:0:303181", "ysrc": "Kayla_lola:0:f2a9e0", "marker": { "line": { "width": 0 }, "color": "rgb(9, 105, 172)", "opacity": 1 }, "orientation": "v" } ], "frames": [], "layout": { "font": { "size": 13, "family": "Old Standard TT" }, "title": { "x": 0.88, "font": { "size": 16 }, "text": "Average Root length of Vigna Radiata with varying concentrations of Sulfuric acid on 3/18/2024" }, "xaxis": { "type": "category", "range": [ 0.5931174089068827, 10.593117408906883 ], "title": { "text": "Percent of Sulfuric Acid Concentration (6M)" }, "domain": [ 0, 1 ], "autorange": false, "showspikes": false }, "yaxis": { "type": "linear", "range": [ 0, 0.836 ], "title": { "text": "Average Root Length (cm)" }, "autorange": false, "showspikes": false }, "bargap": 0.5, "margin": { "b": 80, "l": 80, "t": 100, "pad": 0 }, "barmode": "overlay", "modebar": { "color": "rgba(227, 207, 207, 0.3)" }, "autosize": true, "colorway": [ "#1f77b4", "#ff7f0e", "#2ca02c", "#d62728", "#9467bd", "#8c564b", "#e377c2", "#7f7f7f", "#bcbd22", "#17becf" ], "dragmode": "select", "template": { "data": { "bar": [ { "type": "bar", "marker": { "colorbar": { "ticks": "outside", "ticklen": 8, "tickcolor": "rgb(36,36,36)", "tickwidth": 2, "outlinewidth": 0 } } } ], "table": [ { "type": "table", "cells": { "fill": { "color": "rgb(231,231,240)" }, "line": { "color": "white" } }, "header": { "fill": { "color": "rgb(183,183,191)" }, "line": { "color": "white" } } } ], "carpet": [ { "type": "carpet", "aaxis": { "gridcolor": "white", "linecolor": "white", "endlinecolor": "rgb(36,36,36)", "minorgridcolor": "white", "startlinecolor": "rgb(36,36,36)" }, "baxis": { "gridcolor": "white", "linecolor": "white", "endlinecolor": "rgb(36,36,36)", "minorgridcolor": "white", "startlinecolor": "rgb(36,36,36)" } } ], "mesh3d": [ { "type": "mesh3d", "colorbar": { "ticks": "outside", "ticklen": 8, "tickcolor": "rgb(36,36,36)", "tickwidth": 2, "outlinewidth": 0 } } ], "contour": [ { "type": "contour", "colorbar": { "ticks": "outside", "ticklen": 8, "tickcolor": "rgb(36,36,36)", "tickwidth": 2, "outlinewidth": 0 }, "autocolorscale": true } ], "heatmap": [ { "type": "heatmap", "colorbar": { "ticks": "outside", "ticklen": 8, "tickcolor": "rgb(36,36,36)", "tickwidth": 2, "outlinewidth": 0 }, "autocolorscale": true } ], "scatter": [ { "type": "scatter", "marker": { "colorbar": { "ticks": "outside", "ticklen": 8, "tickcolor": "rgb(36,36,36)", "tickwidth": 2, "outlinewidth": 0 } } } ], "surface": [ { "type": "surface", "colorbar": { "ticks": "outside", "ticklen": 8, "tickcolor": "rgb(36,36,36)", "tickwidth": 2, "outlinewidth": 0 } } ], "heatmapgl": [ { "type": "heatmapgl", "colorbar": { "ticks": "outside", "ticklen": 8, "tickcolor": "rgb(36,36,36)", "tickwidth": 2, "outlinewidth": 0 } } ], "histogram": [ { "type": "histogram", "marker": { "colorbar": { "ticks": "outside", "ticklen": 8, "tickcolor": "rgb(36,36,36)", "tickwidth": 2, "outlinewidth": 0 } } } ], "parcoords": [ { "line": { "colorbar": { "ticks": "outside", "ticklen": 8, "tickcolor": "rgb(36,36,36)", "tickwidth": 2, "outlinewidth": 0 } }, "type": "parcoords" } ], "scatter3d": [ { "type": "scatter3d", "marker": { "colorbar": { "ticks": "outside", "ticklen": 8, "tickcolor": "rgb(36,36,36)", "tickwidth": 2, "outlinewidth": 0 } } } ], "scattergl": [ { "type": "scattergl", "marker": { "colorbar": { "ticks": "outside", "ticklen": 8, "tickcolor": "rgb(36,36,36)", "tickwidth": 2, "outlinewidth": 0 } } } ], "choropleth": [ { "type": "choropleth", "colorbar": { "ticks": "outside", "ticklen": 8, "tickcolor": "rgb(36,36,36)", "tickwidth": 2, "outlinewidth": 0 } } ], "scattergeo": [ { "type": "scattergeo", "marker": { "colorbar": { "ticks": "outside", "ticklen": 8, "tickcolor": "rgb(36,36,36)", "tickwidth": 2, "outlinewidth": 0 } } } ], "histogram2d": [ { "type": "histogram2d", "colorbar": { "ticks": "outside", "ticklen": 8, "tickcolor": "rgb(36,36,36)", "tickwidth": 2, "outlinewidth": 0 }, "autocolorscale": true } ], "scatterpolar": [ { "type": "scatterpolar", "marker": { "colorbar": { "ticks": "outside", "ticklen": 8, "tickcolor": "rgb(36,36,36)", "tickwidth": 2, "outlinewidth": 0 } } } ], "contourcarpet": [ { "type": "contourcarpet", "colorbar": { "ticks": "outside", "ticklen": 8, "tickcolor": "rgb(36,36,36)", "tickwidth": 2, "outlinewidth": 0 } } ], "scattercarpet": [ { "type": "scattercarpet", "marker": { "colorbar": { "ticks": "outside", "ticklen": 8, "tickcolor": "rgb(36,36,36)", "tickwidth": 2, "outlinewidth": 0 } } } ], "scattermapbox": [ { "type": "scattermapbox", "marker": { "colorbar": { "ticks": "outside", "ticklen": 8, "tickcolor": "rgb(36,36,36)", "tickwidth": 2, "outlinewidth": 0 } } } ], "scatterpolargl": [ { "type": "scatterpolargl", "marker": { "colorbar": { "ticks": "outside", "ticklen": 8, "tickcolor": "rgb(36,36,36)", "tickwidth": 2, "outlinewidth": 0 } } } ], "scatterternary": [ { "type": "scatterternary", "marker": { "colorbar": { "ticks": "outside", "ticklen": 8, "tickcolor": "rgb(36,36,36)", "tickwidth": 2, "outlinewidth": 0 } } } ], "histogram2dcontour": [ { "type": "histogram2dcontour", "colorbar": { "ticks": "outside", "ticklen": 8, "tickcolor": "rgb(36,36,36)", "tickwidth": 2, "outlinewidth": 0 }, "autocolorscale": true } ] }, "layout": { "geo": { "bgcolor": "white", "showland": true, "lakecolor": "white", "landcolor": "rgb(234,234,242)", "showlakes": true, "subunitcolor": "white" }, "font": { "color": "rgb(36,36,36)" }, "polar": { "bgcolor": "rgb(234,234,242)", "radialaxis": { "ticks": "", "showgrid": true, "gridcolor": "white", "linecolor": "white" }, "angularaxis": { "ticks": "", "showgrid": true, "gridcolor": "white", "linecolor": "white" } }, "scene": { "xaxis": { "ticks": "", "showgrid": true, "gridcolor": "white", "gridwidth": 2, "linecolor": "white", "zerolinecolor": "white", "showbackground": true, "backgroundcolor": "rgb(234,234,242)" }, "yaxis": { "ticks": "", "showgrid": true, "gridcolor": "white", "gridwidth": 2, "linecolor": "white", "zerolinecolor": "white", "showbackground": true, "backgroundcolor": "rgb(234,234,242)" }, "zaxis": { "ticks": "", "showgrid": true, "gridcolor": "white", "gridwidth": 2, "linecolor": "white", "zerolinecolor": "white", "showbackground": true, "backgroundcolor": "rgb(234,234,242)" } }, "xaxis": { "ticks": "", "showgrid": true, "gridcolor": "white", "linecolor": "white", "automargin": true, "zerolinecolor": "white" }, "yaxis": { "ticks": "", "showgrid": true, "gridcolor": "white", "linecolor": "white", "automargin": true, "zerolinecolor": "white" }, "ternary": { "aaxis": { "ticks": "", "showgrid": true, "gridcolor": "white", "linecolor": "white" }, "baxis": { "ticks": "", "showgrid": true, "gridcolor": "white", "linecolor": "white" }, "caxis": { "ticks": "", "showgrid": true, "gridcolor": "white", "linecolor": "white" }, "bgcolor": "rgb(234,234,242)" }, "colorway": [ "rgb(76,114,176)", "rgb(221,132,82)", "rgb(85,168,104)", "rgb(196,78,82)", "rgb(129,114,179)", "rgb(147,120,96)", "rgb(218,139,195)", "rgb(140,140,140)", "rgb(204,185,116)", "rgb(100,181,205)" ], "hovermode": "closest", "colorscale": { "diverging": [ [ 0, "#67001f" ], [ 0.1, "#b2182b" ], [ 0.2, "#d6604d" ], [ 0.3, "#f4a582" ], [ 0.4, "#fddbc7" ], [ 0.5, "#f7f7f7" ], [ 0.6, "#d1e5f0" ], [ 0.7, "#92c5de" ], [ 0.8, "#4393c3" ], [ 0.9, "#2166ac" ], [ 1, "#053061" ] ], "sequential": [ [ 0, "rgb(2,4,25)" ], [ 0.06274509803921569, "rgb(24,15,41)" ], [ 0.12549019607843137, "rgb(47,23,57)" ], [ 0.18823529411764706, "rgb(71,28,72)" ], [ 0.25098039215686274, "rgb(97,30,82)" ], [ 0.3137254901960784, "rgb(123,30,89)" ], [ 0.3764705882352941, "rgb(150,27,91)" ], [ 0.4392156862745098, "rgb(177,22,88)" ], [ 0.5019607843137255, "rgb(203,26,79)" ], [ 0.5647058823529412, "rgb(223,47,67)" ], [ 0.6274509803921569, "rgb(236,76,61)" ], [ 0.6901960784313725, "rgb(242,107,73)" ], [ 0.7529411764705882, "rgb(244,135,95)" ], [ 0.8156862745098039, "rgb(245,162,122)" ], [ 0.8784313725490196, "rgb(246,188,153)" ], [ 0.9411764705882353, "rgb(247,212,187)" ], [ 1, "rgb(250,234,220)" ] ], "sequentialminus": [ [ 0, "rgb(2,4,25)" ], [ 0.06274509803921569, "rgb(24,15,41)" ], [ 0.12549019607843137, "rgb(47,23,57)" ], [ 0.18823529411764706, "rgb(71,28,72)" ], [ 0.25098039215686274, "rgb(97,30,82)" ], [ 0.3137254901960784, "rgb(123,30,89)" ], [ 0.3764705882352941, "rgb(150,27,91)" ], [ 0.4392156862745098, "rgb(177,22,88)" ], [ 0.5019607843137255, "rgb(203,26,79)" ], [ 0.5647058823529412, "rgb(223,47,67)" ], [ 0.6274509803921569, "rgb(236,76,61)" ], [ 0.6901960784313725, "rgb(242,107,73)" ], [ 0.7529411764705882, "rgb(244,135,95)" ], [ 0.8156862745098039, "rgb(245,162,122)" ], [ 0.8784313725490196, "rgb(246,188,153)" ], [ 0.9411764705882353, "rgb(247,212,187)" ], [ 1, "rgb(250,234,220)" ] ] }, "plot_bgcolor": "rgb(234,234,242)", "paper_bgcolor": "white", "shapedefaults": { "line": { "width": 0 }, "opacity": 0.5, "fillcolor": "rgb(67,103,167)" }, "annotationdefaults": { "arrowcolor": "rgb(67,103,167)" } }, "themeRef": "SEABORN" }, "clickmode": "event", "hovermode": "closest", "colorscale": { "diverging": [ [ 0, "#40004b" ], [ 0.1, "#762a83" ], [ 0.2, "#9970ab" ], [ 0.3, "#c2a5cf" ], [ 0.4, "#e7d4e8" ], [ 0.5, "#f7f7f7" ], [ 0.6, "#d9f0d3" ], [ 0.7, "#a6dba0" ], [ 0.8, "#5aae61" ], [ 0.9, "#1b7837" ], [ 1, "#00441b" ] ] }, "hoverlabel": { "align": "auto" }, "bargroupgap": 0, "paper_bgcolor": "rgb(251, 251, 251)", "selectdirection": "h" } }, "height": null, "width": null, "user": { "profile_url": "https://chart-studio.plotly.com/~Kayla_lola", "avatar_url": "https://storage.googleapis.com/plotly-prod-profiles/99.jpg", "background_url": "https://storage.googleapis.com/plotly-prod-profiles/bg-8.jpg", "bio": "", "nickname": "", "website": "", "stream_tokens": null, "feature_set_id": null, "csrf_token": null, "date_joined": "2024-04-04 14:09:16", "mapbox_access_tokens": null, "has_password": null, "username": "Kayla_lola", "email": null, "is_active": null, "readonly": null, "is_dash_creator": null, "dash_created_count": null, "is_chart_creator": null, "charts_created_count": null } }, { "creation_time": "2024-04-04T14:02:52.966654Z", "comments": { "results": [], "count": 0 }, "parented": true, "embed_url": "https://chart-studio.plotly.com/~Alexgurl/1.embed", "fid": "Alexgurl:1", "filename": "Plot 1", "filetype": "plot", "img_url": "https://storage.googleapis.com/plotly-prod-images/Alexgurl/1/9_1267L61MQKXZ1AZ231XCGGGGH4FEXD.png", "image_urls": { "default": "https://storage.googleapis.com/plotly-prod-images/Alexgurl/1/2_G3LPSEL16SQ6TNDFO0YMLZ70NQPIP7.png", "block-thumb": "https://storage.googleapis.com/plotly-prod-images/Alexgurl/1/8_V3DHN8ARZ9LNK6JCIBKYM5WWU3AO61.png", "list-thumb": "https://storage.googleapis.com/plotly-prod-images/Alexgurl/1/9_1267L61MQKXZ1AZ231XCGGGGH4FEXD.png" }, "api_urls": { "files": "https://api.plotly.com/v2/files/Alexgurl:1", "plots": "https://api.plotly.com/v2/plots/Alexgurl:1", "parent": "https://api.plotly.com/v2/folders/home?user=Alexgurl" }, "owner": "Alexgurl", "parent": -1, "preview": "", "referencers": [], "references": [], "title": "", "views": 4, "web_url": "https://chart-studio.plotly.com/~Alexgurl/1/", "world_readable": true, "date_modified": "2024-04-11T21:27:03.001Z", "stars": { "results": [], "count": 0 }, "collaborators": { "results": [], "count": 0 }, "subfolder_count": null, "refresh_interval": null, "organize_view_url": "https://chart-studio.plotly.com/~Alexgurl/1/", "current_user_permission": "read", "is_theme": null, "is_template": false, "autosize": true, "caption": "", "figure": { "data": [ { "uid": "26bb88", "meta": { "columnNames": { "x": "A", "y": "Velocity Squared", "error_y": { "array": "D" } } }, "mode": "markers", "name": "Average Velocity Squared", "type": "scatter", "xsrc": "Alexgurl:0:3e6efd", "ysrc": "Alexgurl:0:558dda", "error_x": { "type": "percent", "value": 10, "visible": false, "symmetric": true, "copy_ystyle": true }, "error_y": { "meta": { "columnNames": { "array": "D" } }, "type": "data", "value": 0.03308, "width": 4, "visible": true, "arraysrc": "Alexgurl:0:293f64", "symmetric": true, "thickness": 2 }, "visible": true }, { "uid": "0c38e3", "meta": { "columnNames": { "x": "A", "y": "Avg Velocity", "error_y": { "array": "D" } } }, "mode": "markers", "name": "Average Velocity", "type": "scatter", "xsrc": "Alexgurl:0:3e6efd", "ysrc": "Alexgurl:0:1cf046", "error_y": { "meta": { "columnNames": { "array": "D" } }, "type": "data", "visible": true, "arraysrc": "Alexgurl:0:293f64", "symmetric": true }, "stackgroup": null }, { "uid": "21a828", "visible": false, "transforms": [ { "rms": 0.032279694467615395, "type": "fit", "xmid": 0.5500000000000004, "ymid": 0.530784210526316, "inputUid": "0c38e3", "regressor": "x", "parameters": [ { "hold": false, "name": "m", "error": 0.027040952372443076, "value": 0.5010947368421076 }, { "hold": false, "name": "b", "error": 0.01661423929093163, "value": 0.2551821052631566 } ], "regressand": "y", "correlation": 0.976129968411968, "fitfunction": "m*x + b", "inputxrange": [], "outputxrange": [], "interpolation": 50 } ] }, { "uid": "1922a3", "transforms": [ { "rms": "", "type": "fit", "inputUid": "0c38e3", "regressor": "x", "parameters": [ { "hold": false, "name": "m", "error": 0.02704095237244268, "value": 0.5010947368420968 }, { "hold": false, "name": "b", "error": 0.01661423929093208, "value": 0.25518210526316304 } ], "regressand": "y", "correlation": "", "fitfunction": "m*x + b", "inputxrange": [], "outputxrange": [], "interpolation": 50 } ] }, { "uid": "65dfa6", "transforms": [ { "rms": "", "type": "fit", "inputUid": "26bb88", "regressor": "x", "parameters": [ { "hold": false, "name": "m", "error": 0.01654471651933024, "value": 0.5074912280701951 }, { "hold": false, "name": "b", "error": 0.010165244014592695, "value": 0.022348245614021302 } ], "regressand": "y", "correlation": "", "fitfunction": "m*x + b", "inputxrange": [], "outputxrange": [], "interpolation": 50 } ] } ], "frames": [], "layout": { "title": { "text": "The Effect of Distance on Velocity on an Air Track" }, "xaxis": { "type": "linear", "range": [ 0.04408703878902555, 1.0559129612109746 ], "title": { "text": "Seperation Distance (m)" }, "autorange": true, "showspikes": false }, "yaxis": { "type": "linear", "range": [ 0.007173508771929987, 0.7957033333333301 ], "title": { "text": "Velocity (m/s)" }, "autorange": true, "showspikes": false }, "autosize": true, "template": { "data": { "bar": [ { "type": "bar", "marker": { "colorbar": { "ticks": "", "outlinewidth": 0 } } } ], "table": [ { "type": "table", "cells": { "fill": { "color": "#EBF0F8" }, "line": { "color": "white" } }, "header": { "fill": { "color": "#C8D4E3" }, "line": { "color": "white" } } } ], "carpet": [ { "type": "carpet", "aaxis": { "gridcolor": "#C8D4E3", "linecolor": "#C8D4E3", "endlinecolor": "#2a3f5f", "minorgridcolor": "#C8D4E3", "startlinecolor": "#2a3f5f" }, "baxis": { "gridcolor": "#C8D4E3", "linecolor": "#C8D4E3", "endlinecolor": "#2a3f5f", "minorgridcolor": "#C8D4E3", "startlinecolor": "#2a3f5f" } } ], "mesh3d": [ { "type": "mesh3d", "colorbar": { "ticks": "", "outlinewidth": 0 } } ], "contour": [ { "type": "contour", "colorbar": { "ticks": "", "outlinewidth": 0 }, "autocolorscale": true } ], "heatmap": [ { "type": "heatmap", "colorbar": { "ticks": "", "outlinewidth": 0 }, "autocolorscale": true } ], "scatter": [ { "type": "scatter", "marker": { "colorbar": { "ticks": "", "outlinewidth": 0 } } } ], "surface": [ { "type": "surface", "colorbar": { "ticks": "", "outlinewidth": 0 } } ], "heatmapgl": [ { "type": "heatmapgl", "colorbar": { "ticks": "", "outlinewidth": 0 } } ], "histogram": [ { "type": "histogram", "marker": { "colorbar": { "ticks": "", "outlinewidth": 0 } } } ], "parcoords": [ { "line": { "colorbar": { "ticks": "", "outlinewidth": 0 } }, "type": "parcoords" } ], "scatter3d": [ { "type": "scatter3d", "marker": { "colorbar": { "ticks": "", "outlinewidth": 0 } } } ], "scattergl": [ { "type": "scattergl", "marker": { "colorbar": { "ticks": "", "outlinewidth": 0 } } } ], "choropleth": [ { "type": "choropleth", "colorbar": { "ticks": "", "outlinewidth": 0 } } ], "scattergeo": [ { "type": "scattergeo", "marker": { "colorbar": { "ticks": "", "outlinewidth": 0 } } } ], "histogram2d": [ { "type": "histogram2d", "colorbar": { "ticks": "", "outlinewidth": 0 }, "autocolorscale": true } ], "scatterpolar": [ { "type": "scatterpolar", "marker": { "colorbar": { "ticks": "", "outlinewidth": 0 } } } ], "contourcarpet": [ { "type": "contourcarpet", "colorbar": { "ticks": "", "outlinewidth": 0 } } ], "scattercarpet": [ { "type": "scattercarpet", "marker": { "colorbar": { "ticks": "", "outlinewidth": 0 } } } ], "scattermapbox": [ { "type": "scattermapbox", "marker": { "colorbar": { "ticks": "", "outlinewidth": 0 } } } ], "scatterpolargl": [ { "type": "scatterpolargl", "marker": { "colorbar": { "ticks": "", "outlinewidth": 0 } } } ], "scatterternary": [ { "type": "scatterternary", "marker": { "colorbar": { "ticks": "", "outlinewidth": 0 } } } ], "histogram2dcontour": [ { "type": "histogram2dcontour", "colorbar": { "ticks": "", "outlinewidth": 0 }, "autocolorscale": true } ] }, "layout": { "geo": { "bgcolor": "white", "showland": true, "lakecolor": "white", "landcolor": "white", "showlakes": true, "subunitcolor": "#C8D4E3" }, "font": { "color": "#2a3f5f" }, "polar": { "bgcolor": "white", "radialaxis": { "ticks": "", "gridcolor": "#EBF0F8", "linecolor": "#EBF0F8" }, "angularaxis": { "ticks": "", "gridcolor": "#EBF0F8", "linecolor": "#EBF0F8" } }, "scene": { "xaxis": { "ticks": "", "gridcolor": "#DFE8F3", "gridwidth": 2, "linecolor": "#EBF0F8", "zerolinecolor": "#EBF0F8", "showbackground": true, "backgroundcolor": "white" }, "yaxis": { "ticks": "", "gridcolor": "#DFE8F3", "gridwidth": 2, "linecolor": "#EBF0F8", "zerolinecolor": "#EBF0F8", "showbackground": true, "backgroundcolor": "white" }, "zaxis": { "ticks": "", "gridcolor": "#DFE8F3", "gridwidth": 2, "linecolor": "#EBF0F8", "zerolinecolor": "#EBF0F8", "showbackground": true, "backgroundcolor": "white" } }, "title": { "x": 0.05 }, "xaxis": { "ticks": "", "gridcolor": "#EBF0F8", "linecolor": "#EBF0F8", "automargin": true, "zerolinecolor": "#EBF0F8", "zerolinewidth": 2 }, "yaxis": { "ticks": "", "gridcolor": "#EBF0F8", "linecolor": "#EBF0F8", "automargin": true, "zerolinecolor": "#EBF0F8", "zerolinewidth": 2 }, "ternary": { "aaxis": { "ticks": "", "gridcolor": "#DFE8F3", "linecolor": "#A2B1C6" }, "baxis": { "ticks": "", "gridcolor": "#DFE8F3", "linecolor": "#A2B1C6" }, "caxis": { "ticks": "", "gridcolor": "#DFE8F3", "linecolor": "#A2B1C6" }, "bgcolor": "white" }, "colorway": [ "#636efa", "#EF553B", "#00cc96", "#ab63fa", "#19d3f3", "#e763fa", "#fecb52", "#ffa15a", "#ff6692", "#b6e880" ], "hovermode": "closest", "colorscale": { "diverging": [ [ 0, "#8e0152" ], [ 0.1, "#c51b7d" ], [ 0.2, "#de77ae" ], [ 0.3, "#f1b6da" ], [ 0.4, "#fde0ef" ], [ 0.5, "#f7f7f7" ], [ 0.6, "#e6f5d0" ], [ 0.7, "#b8e186" ], [ 0.8, "#7fbc41" ], [ 0.9, "#4d9221" ], [ 1, "#276419" ] ], "sequential": [ [ 0, "#0508b8" ], [ 0.0893854748603352, "#1910d8" ], [ 0.1787709497206704, "#3c19f0" ], [ 0.2681564245810056, "#6b1cfb" ], [ 0.3575418994413408, "#981cfd" ], [ 0.44692737430167595, "#bf1cfd" ], [ 0.5363128491620112, "#dd2bfd" ], [ 0.6256983240223464, "#f246fe" ], [ 0.7150837988826816, "#fc67fd" ], [ 0.8044692737430168, "#fe88fc" ], [ 0.8938547486033519, "#fea5fd" ], [ 0.9832402234636871, "#febefe" ], [ 1, "#fec3fe" ] ], "sequentialminus": [ [ 0, "#0508b8" ], [ 0.0893854748603352, "#1910d8" ], [ 0.1787709497206704, "#3c19f0" ], [ 0.2681564245810056, "#6b1cfb" ], [ 0.3575418994413408, "#981cfd" ], [ 0.44692737430167595, "#bf1cfd" ], [ 0.5363128491620112, "#dd2bfd" ], [ 0.6256983240223464, "#f246fe" ], [ 0.7150837988826816, "#fc67fd" ], [ 0.8044692737430168, "#fe88fc" ], [ 0.8938547486033519, "#fea5fd" ], [ 0.9832402234636871, "#febefe" ], [ 1, "#fec3fe" ] ] }, "plot_bgcolor": "white", "paper_bgcolor": "white", "shapedefaults": { "line": { "width": 0 }, "opacity": 0.4, "fillcolor": "#506784" }, "annotationdefaults": { "arrowhead": 0, "arrowcolor": "#506784", "arrowwidth": 1 } }, "themeRef": "PLOTLY_WHITE" } } }, "height": null, "width": null, "user": { "profile_url": "https://chart-studio.plotly.com/~Alexgurl", "avatar_url": "https://storage.googleapis.com/plotly-prod-profiles/67.jpg", "background_url": "https://storage.googleapis.com/plotly-prod-profiles/bg-5.jpg", "bio": "", "nickname": "", "website": "", "stream_tokens": null, "feature_set_id": null, "csrf_token": null, "date_joined": "2024-04-04 14:02:19", "mapbox_access_tokens": null, "has_password": null, "username": "Alexgurl", "email": null, "is_active": null, "readonly": null, "is_dash_creator": null, "dash_created_count": null, "is_chart_creator": null, "charts_created_count": null } }, { "creation_time": "2024-04-04T14:01:55.430952Z", "comments": { "results": [], "count": 0 }, "parented": true, "embed_url": "https://chart-studio.plotly.com/~btadams01/1.embed", "fid": "btadams01:1", "filename": "Plot 1", "filetype": "plot", "img_url": "https://storage.googleapis.com/plotly-prod-images/btadams01/1/9_ZK8HUMVQCAXUDS6HBHB16GYSVEDCNI.png", "image_urls": { "default": "https://storage.googleapis.com/plotly-prod-images/btadams01/1/2_NGBOGM0U5EA1NXXQDEKKGUSXVQNQRL.png", "block-thumb": "https://storage.googleapis.com/plotly-prod-images/btadams01/1/8_YUWUUZ1P9JEL0YGZHZBB0XE3C23HBD.png", "list-thumb": "https://storage.googleapis.com/plotly-prod-images/btadams01/1/9_ZK8HUMVQCAXUDS6HBHB16GYSVEDCNI.png" }, "api_urls": { "files": "https://api.plotly.com/v2/files/btadams01:1", "plots": "https://api.plotly.com/v2/plots/btadams01:1", "parent": "https://api.plotly.com/v2/folders/home?user=btadams01" }, "owner": "btadams01", "parent": -1, "preview": "", "referencers": [], "references": [], "title": "", "views": 1, "web_url": "https://chart-studio.plotly.com/~btadams01/1/", "world_readable": true, "date_modified": "2024-04-04T14:01:55.440Z", "stars": { "results": [], "count": 0 }, "collaborators": { "results": [], "count": 0 }, "subfolder_count": null, "refresh_interval": null, "organize_view_url": "https://chart-studio.plotly.com/~btadams01/1/", "current_user_permission": "read", "is_theme": null, "is_template": false, "autosize": true, "caption": "", "figure": { "data": [ { "uid": "8e192a", "meta": { "columnNames": { "x": "A", "y": "B" } }, "mode": "lines", "type": "scatter", "xsrc": "btadams01:0:789dc4", "ysrc": "btadams01:0:6a596b" }, { "uid": "7904e2", "transforms": [ { "rms": 0.06549516480946145, "type": "fit", "xmid": 1.2500000000000007, "ymid": 2.3015095846645375, "inputUid": "8e192a", "regressor": "x", "parameters": [ { "hold": false, "name": "m", "error": 0.05853384792212378, "value": 0.9509584664536891 }, { "hold": false, "name": "b", "error": 0.07826918869130074, "value": 1.1128115015974256 } ], "regressand": "y", "correlation": 0.9943649305202333, "fitfunction": "m*x + b", "inputxrange": [], "outputxrange": [], "interpolation": 50 } ] } ], "frames": [], "layout": { "xaxis": { "type": "linear", "range": [ 0.9190579317812673, 1.2593394694098543 ], "autorange": false }, "yaxis": { "type": "linear", "range": [ 2.342514057670089, 2.5873322926848337 ], "autorange": false }, "autosize": true, "template": { "data": { "bar": [ { "type": "bar", "marker": { "colorbar": { "ticks": "", "outlinewidth": 0 } } } ], "table": [ { "type": "table", "cells": { "fill": { "color": "#EBF0F8" }, "line": { "color": "white" } }, "header": { "fill": { "color": "#C8D4E3" }, "line": { "color": "white" } } } ], "carpet": [ { "type": "carpet", "aaxis": { "gridcolor": "#C8D4E3", "linecolor": "#C8D4E3", "endlinecolor": "#2a3f5f", "minorgridcolor": "#C8D4E3", "startlinecolor": "#2a3f5f" }, "baxis": { "gridcolor": "#C8D4E3", "linecolor": "#C8D4E3", "endlinecolor": "#2a3f5f", "minorgridcolor": "#C8D4E3", "startlinecolor": "#2a3f5f" } } ], "mesh3d": [ { "type": "mesh3d", "colorbar": { "ticks": "", "outlinewidth": 0 } } ], "contour": [ { "type": "contour", "colorbar": { "ticks": "", "outlinewidth": 0 }, "autocolorscale": true } ], "heatmap": [ { "type": "heatmap", "colorbar": { "ticks": "", "outlinewidth": 0 }, "autocolorscale": true } ], "scatter": [ { "type": "scatter", "marker": { "colorbar": { "ticks": "", "outlinewidth": 0 } } } ], "surface": [ { "type": "surface", "colorbar": { "ticks": "", "outlinewidth": 0 } } ], "heatmapgl": [ { "type": "heatmapgl", "colorbar": { "ticks": "", "outlinewidth": 0 } } ], "histogram": [ { "type": "histogram", "marker": { "colorbar": { "ticks": "", "outlinewidth": 0 } } } ], "parcoords": [ { "line": { "colorbar": { "ticks": "", "outlinewidth": 0 } }, "type": "parcoords" } ], "scatter3d": [ { "type": "scatter3d", "marker": { "colorbar": { "ticks": "", "outlinewidth": 0 } } } ], "scattergl": [ { "type": "scattergl", "marker": { "colorbar": { "ticks": "", "outlinewidth": 0 } } } ], "choropleth": [ { "type": "choropleth", "colorbar": { "ticks": "", "outlinewidth": 0 } } ], "scattergeo": [ { "type": "scattergeo", "marker": { "colorbar": { "ticks": "", "outlinewidth": 0 } } } ], "histogram2d": [ { "type": "histogram2d", "colorbar": { "ticks": "", "outlinewidth": 0 }, "autocolorscale": true } ], "scatterpolar": [ { "type": "scatterpolar", "marker": { "colorbar": { "ticks": "", "outlinewidth": 0 } } } ], "contourcarpet": [ { "type": "contourcarpet", "colorbar": { "ticks": "", "outlinewidth": 0 } } ], "scattercarpet": [ { "type": "scattercarpet", "marker": { "colorbar": { "ticks": "", "outlinewidth": 0 } } } ], "scattermapbox": [ { "type": "scattermapbox", "marker": { "colorbar": { "ticks": "", "outlinewidth": 0 } } } ], "scatterpolargl": [ { "type": "scatterpolargl", "marker": { "colorbar": { "ticks": "", "outlinewidth": 0 } } } ], "scatterternary": [ { "type": "scatterternary", "marker": { "colorbar": { "ticks": "", "outlinewidth": 0 } } } ], "histogram2dcontour": [ { "type": "histogram2dcontour", "colorbar": { "ticks": "", "outlinewidth": 0 }, "autocolorscale": true } ] }, "layout": { "geo": { "bgcolor": "white", "showland": true, "lakecolor": "white", "landcolor": "white", "showlakes": true, "subunitcolor": "#C8D4E3" }, "font": { "color": "#2a3f5f" }, "polar": { "bgcolor": "white", "radialaxis": { "ticks": "", "gridcolor": "#EBF0F8", "linecolor": "#EBF0F8" }, "angularaxis": { "ticks": "", "gridcolor": "#EBF0F8", "linecolor": "#EBF0F8" } }, "scene": { "xaxis": { "ticks": "", "gridcolor": "#DFE8F3", "gridwidth": 2, "linecolor": "#EBF0F8", "zerolinecolor": "#EBF0F8", "showbackground": true, "backgroundcolor": "white" }, "yaxis": { "ticks": "", "gridcolor": "#DFE8F3", "gridwidth": 2, "linecolor": "#EBF0F8", "zerolinecolor": "#EBF0F8", "showbackground": true, "backgroundcolor": "white" }, "zaxis": { "ticks": "", "gridcolor": "#DFE8F3", "gridwidth": 2, "linecolor": "#EBF0F8", "zerolinecolor": "#EBF0F8", "showbackground": true, "backgroundcolor": "white" } }, "title": { "x": 0.05 }, "xaxis": { "ticks": "", "gridcolor": "#EBF0F8", "linecolor": "#EBF0F8", "automargin": true, "zerolinecolor": "#EBF0F8", "zerolinewidth": 2 }, "yaxis": { "ticks": "", "gridcolor": "#EBF0F8", "linecolor": "#EBF0F8", "automargin": true, "zerolinecolor": "#EBF0F8", "zerolinewidth": 2 }, "ternary": { "aaxis": { "ticks": "", "gridcolor": "#DFE8F3", "linecolor": "#A2B1C6" }, "baxis": { "ticks": "", "gridcolor": "#DFE8F3", "linecolor": "#A2B1C6" }, "caxis": { "ticks": "", "gridcolor": "#DFE8F3", "linecolor": "#A2B1C6" }, "bgcolor": "white" }, "colorway": [ "#636efa", "#EF553B", "#00cc96", "#ab63fa", "#19d3f3", "#e763fa", "#fecb52", "#ffa15a", "#ff6692", "#b6e880" ], "hovermode": "closest", "colorscale": { "diverging": [ [ 0, "#8e0152" ], [ 0.1, "#c51b7d" ], [ 0.2, "#de77ae" ], [ 0.3, "#f1b6da" ], [ 0.4, "#fde0ef" ], [ 0.5, "#f7f7f7" ], [ 0.6, "#e6f5d0" ], [ 0.7, "#b8e186" ], [ 0.8, "#7fbc41" ], [ 0.9, "#4d9221" ], [ 1, "#276419" ] ], "sequential": [ [ 0, "#0508b8" ], [ 0.0893854748603352, "#1910d8" ], [ 0.1787709497206704, "#3c19f0" ], [ 0.2681564245810056, "#6b1cfb" ], [ 0.3575418994413408, "#981cfd" ], [ 0.44692737430167595, "#bf1cfd" ], [ 0.5363128491620112, "#dd2bfd" ], [ 0.6256983240223464, "#f246fe" ], [ 0.7150837988826816, "#fc67fd" ], [ 0.8044692737430168, "#fe88fc" ], [ 0.8938547486033519, "#fea5fd" ], [ 0.9832402234636871, "#febefe" ], [ 1, "#fec3fe" ] ], "sequentialminus": [ [ 0, "#0508b8" ], [ 0.0893854748603352, "#1910d8" ], [ 0.1787709497206704, "#3c19f0" ], [ 0.2681564245810056, "#6b1cfb" ], [ 0.3575418994413408, "#981cfd" ], [ 0.44692737430167595, "#bf1cfd" ], [ 0.5363128491620112, "#dd2bfd" ], [ 0.6256983240223464, "#f246fe" ], [ 0.7150837988826816, "#fc67fd" ], [ 0.8044692737430168, "#fe88fc" ], [ 0.8938547486033519, "#fea5fd" ], [ 0.9832402234636871, "#febefe" ], [ 1, "#fec3fe" ] ] }, "plot_bgcolor": "white", "paper_bgcolor": "white", "shapedefaults": { "line": { "width": 0 }, "opacity": 0.4, "fillcolor": "#506784" }, "annotationdefaults": { "arrowhead": 0, "arrowcolor": "#506784", "arrowwidth": 1 } }, "themeRef": "PLOTLY_WHITE" } } }, "height": null, "width": null, "user": { "profile_url": "https://chart-studio.plotly.com/~btadams01", "avatar_url": "https://storage.googleapis.com/plotly-prod-profiles/40.jpg", "background_url": "https://storage.googleapis.com/plotly-prod-profiles/bg-6.jpg", "bio": "", "nickname": "", "website": "", "stream_tokens": null, "feature_set_id": null, "csrf_token": null, "date_joined": "2024-04-04 14:01:44", "mapbox_access_tokens": null, "has_password": null, "username": "btadams01", "email": null, "is_active": null, "readonly": null, "is_dash_creator": null, "dash_created_count": null, "is_chart_creator": null, "charts_created_count": null } }, { "creation_time": "2024-04-04T14:00:07.443379Z", "comments": { "results": [], "count": 0 }, "parented": true, "embed_url": "https://chart-studio.plotly.com/~mouree2011/1.embed", "fid": "mouree2011:1", "filename": "Curriculum Effectiveness VS Mentee Learning", "filetype": "plot", "img_url": "https://storage.googleapis.com/plotly-prod-images/mouree2011/1/9_JK8N46HL88BZ6FXMVZB1ZGFAFFZVWN.png", "image_urls": { "default": "https://storage.googleapis.com/plotly-prod-images/mouree2011/1/2_PZ41QV8GFQ1T9N0RV3I06LHLM8VO0V.png", "block-thumb": "https://storage.googleapis.com/plotly-prod-images/mouree2011/1/8_JZCR2C4PS54YAPWJTDGD3B5RFFRUSE.png", "list-thumb": "https://storage.googleapis.com/plotly-prod-images/mouree2011/1/9_JK8N46HL88BZ6FXMVZB1ZGFAFFZVWN.png" }, "api_urls": { "files": "https://api.plotly.com/v2/files/mouree2011:1", "plots": "https://api.plotly.com/v2/plots/mouree2011:1", "parent": "https://api.plotly.com/v2/folders/home?user=mouree2011" }, "owner": "mouree2011", "parent": -1, "preview": "", "referencers": [], "references": [], "title": "", "views": 1, "web_url": "https://chart-studio.plotly.com/~mouree2011/1/", "world_readable": true, "date_modified": "2024-04-04T14:00:07.453Z", "stars": { "results": [], "count": 0 }, "collaborators": { "results": [], "count": 0 }, "subfolder_count": null, "refresh_interval": null, "organize_view_url": "https://chart-studio.plotly.com/~mouree2011/1/", "current_user_permission": "read", "is_theme": null, "is_template": false, "autosize": true, "caption": "", "figure": { "data": [ { "meta": { "columnNames": { "x": "B", "y": "C", "marker": { "size": "" } } }, "mode": "markers", "type": "scatter", "xsrc": "mouree2011:0:163150", "ysrc": "mouree2011:0:b2aea5", "marker": { "meta": { "columnNames": { "size": "B" } }, "color": "rgb(99, 139, 250)", "symbol": "circle", "sizemin": 6, "sizeref": null, "sizemode": "area", "maxdisplayed": 0 }, "hoverinfo": "x+y", "stackgaps": "interpolate", "stackgroup": "", "transforms": [ { "meta": { "columnNames": { "groups": "C" } }, "type": "aggregate", "enabled": false, "groupssrc": "mouree2011:0:b2aea5", "aggregations": [ { "func": "count", "target": "x", "enabled": true }, { "func": "count", "target": "y", "enabled": true } ] } ], "orientation": "h" } ], "frames": [], "layout": { "title": { "text": "Curriculum Effectiveness VS Mentee Learning" }, "xaxis": { "side": "bottom", "type": "category", "range": [ -0.6814831874712115, 11.681483187471212 ], "title": { "text": "Authors" }, "anchor": "free", "mirror": false, "showline": true, "autorange": true, "fixedrange": false, "showspikes": false, "rangeslider": { "range": [ -1, 6 ], "yaxis": {}, "yaxis2": {}, "visible": false, "autorange": true } }, "yaxis": { "type": "category", "range": [ -0.3659052453468698, 5.36590524534687 ], "title": { "text": "Objective Measures" }, "anchor": "free", "autorange": true }, "images": [], "autosize": true, "template": { "data": { "bar": [ { "type": "bar", "marker": { "colorbar": { "ticks": "", "outlinewidth": 0 } } } ], "table": [ { "type": "table", "cells": { "fill": { "color": "#EBF0F8" }, "line": { "color": "white" } }, "header": { "fill": { "color": "#C8D4E3" }, "line": { "color": "white" } } } ], "carpet": [ { "type": "carpet", "aaxis": { "gridcolor": "#C8D4E3", "linecolor": "#C8D4E3", "endlinecolor": "#2a3f5f", "minorgridcolor": "#C8D4E3", "startlinecolor": "#2a3f5f" }, "baxis": { "gridcolor": "#C8D4E3", "linecolor": "#C8D4E3", "endlinecolor": "#2a3f5f", "minorgridcolor": "#C8D4E3", "startlinecolor": "#2a3f5f" } } ], "mesh3d": [ { "type": "mesh3d", "colorbar": { "ticks": "", "outlinewidth": 0 } } ], "contour": [ { "type": "contour", "colorbar": { "ticks": "", "outlinewidth": 0 }, "autocolorscale": true } ], "heatmap": [ { "type": "heatmap", "colorbar": { "ticks": "", "outlinewidth": 0 }, "autocolorscale": true } ], "scatter": [ { "type": "scatter", "marker": { "colorbar": { "ticks": "", "outlinewidth": 0 } } } ], "surface": [ { "type": "surface", "colorbar": { "ticks": "", "outlinewidth": 0 } } ], "heatmapgl": [ { "type": "heatmapgl", "colorbar": { "ticks": "", "outlinewidth": 0 } } ], "histogram": [ { "type": "histogram", "marker": { "colorbar": { "ticks": "", "outlinewidth": 0 } } } ], "parcoords": [ { "line": { "colorbar": { "ticks": "", "outlinewidth": 0 } }, "type": "parcoords" } ], "scatter3d": [ { "type": "scatter3d", "marker": { "colorbar": { "ticks": "", "outlinewidth": 0 } } } ], "scattergl": [ { "type": "scattergl", "marker": { "colorbar": { "ticks": "", "outlinewidth": 0 } } } ], "choropleth": [ { "type": "choropleth", "colorbar": { "ticks": "", "outlinewidth": 0 } } ], "scattergeo": [ { "type": "scattergeo", "marker": { "colorbar": { "ticks": "", "outlinewidth": 0 } } } ], "histogram2d": [ { "type": "histogram2d", "colorbar": { "ticks": "", "outlinewidth": 0 }, "autocolorscale": true } ], "scatterpolar": [ { "type": "scatterpolar", "marker": { "colorbar": { "ticks": "", "outlinewidth": 0 } } } ], "contourcarpet": [ { "type": "contourcarpet", "colorbar": { "ticks": "", "outlinewidth": 0 } } ], "scattercarpet": [ { "type": "scattercarpet", "marker": { "colorbar": { "ticks": "", "outlinewidth": 0 } } } ], "scattermapbox": [ { "type": "scattermapbox", "marker": { "colorbar": { "ticks": "", "outlinewidth": 0 } } } ], "scatterpolargl": [ { "type": "scatterpolargl", "marker": { "colorbar": { "ticks": "", "outlinewidth": 0 } } } ], "scatterternary": [ { "type": "scatterternary", "marker": { "colorbar": { "ticks": "", "outlinewidth": 0 } } } ], "histogram2dcontour": [ { "type": "histogram2dcontour", "colorbar": { "ticks": "", "outlinewidth": 0 }, "autocolorscale": true } ] }, "layout": { "geo": { "bgcolor": "white", "showland": true, "lakecolor": "white", "landcolor": "white", "showlakes": true, "subunitcolor": "#C8D4E3" }, "font": { "color": "#2a3f5f" }, "polar": { "bgcolor": "white", "radialaxis": { "ticks": "", "gridcolor": "#EBF0F8", "linecolor": "#EBF0F8" }, "angularaxis": { "ticks": "", "gridcolor": "#EBF0F8", "linecolor": "#EBF0F8" } }, "scene": { "xaxis": { "ticks": "", "gridcolor": "#DFE8F3", "gridwidth": 2, "linecolor": "#EBF0F8", "zerolinecolor": "#EBF0F8", "showbackground": true, "backgroundcolor": "white" }, "yaxis": { "ticks": "", "gridcolor": "#DFE8F3", "gridwidth": 2, "linecolor": "#EBF0F8", "zerolinecolor": "#EBF0F8", "showbackground": true, "backgroundcolor": "white" }, "zaxis": { "ticks": "", "gridcolor": "#DFE8F3", "gridwidth": 2, "linecolor": "#EBF0F8", "zerolinecolor": "#EBF0F8", "showbackground": true, "backgroundcolor": "white" } }, "title": { "x": 0.05 }, "xaxis": { "ticks": "", "gridcolor": "#EBF0F8", "linecolor": "#EBF0F8", "automargin": true, "zerolinecolor": "#EBF0F8", "zerolinewidth": 2 }, "yaxis": { "ticks": "", "gridcolor": "#EBF0F8", "linecolor": "#EBF0F8", "automargin": true, "zerolinecolor": "#EBF0F8", "zerolinewidth": 2 }, "ternary": { "aaxis": { "ticks": "", "gridcolor": "#DFE8F3", "linecolor": "#A2B1C6" }, "baxis": { "ticks": "", "gridcolor": "#DFE8F3", "linecolor": "#A2B1C6" }, "caxis": { "ticks": "", "gridcolor": "#DFE8F3", "linecolor": "#A2B1C6" }, "bgcolor": "white" }, "colorway": [ "#636efa", "#EF553B", "#00cc96", "#ab63fa", "#19d3f3", "#e763fa", "#fecb52", "#ffa15a", "#ff6692", "#b6e880" ], "hovermode": "closest", "colorscale": { "diverging": [ [ 0, "#8e0152" ], [ 0.1, "#c51b7d" ], [ 0.2, "#de77ae" ], [ 0.3, "#f1b6da" ], [ 0.4, "#fde0ef" ], [ 0.5, "#f7f7f7" ], [ 0.6, "#e6f5d0" ], [ 0.7, "#b8e186" ], [ 0.8, "#7fbc41" ], [ 0.9, "#4d9221" ], [ 1, "#276419" ] ], "sequential": [ [ 0, "#0508b8" ], [ 0.0893854748603352, "#1910d8" ], [ 0.1787709497206704, "#3c19f0" ], [ 0.2681564245810056, "#6b1cfb" ], [ 0.3575418994413408, "#981cfd" ], [ 0.44692737430167595, "#bf1cfd" ], [ 0.5363128491620112, "#dd2bfd" ], [ 0.6256983240223464, "#f246fe" ], [ 0.7150837988826816, "#fc67fd" ], [ 0.8044692737430168, "#fe88fc" ], [ 0.8938547486033519, "#fea5fd" ], [ 0.9832402234636871, "#febefe" ], [ 1, "#fec3fe" ] ], "sequentialminus": [ [ 0, "#0508b8" ], [ 0.0893854748603352, "#1910d8" ], [ 0.1787709497206704, "#3c19f0" ], [ 0.2681564245810056, "#6b1cfb" ], [ 0.3575418994413408, "#981cfd" ], [ 0.44692737430167595, "#bf1cfd" ], [ 0.5363128491620112, "#dd2bfd" ], [ 0.6256983240223464, "#f246fe" ], [ 0.7150837988826816, "#fc67fd" ], [ 0.8044692737430168, "#fe88fc" ], [ 0.8938547486033519, "#fea5fd" ], [ 0.9832402234636871, "#febefe" ], [ 1, "#fec3fe" ] ] }, "plot_bgcolor": "white", "paper_bgcolor": "white", "shapedefaults": { "line": { "width": 0 }, "opacity": 0.4, "fillcolor": "#506784" }, "annotationdefaults": { "arrowhead": 0, "arrowcolor": "#506784", "arrowwidth": 1 } }, "themeRef": "PLOTLY_WHITE" } } }, "height": null, "width": null, "user": { "profile_url": "https://chart-studio.plotly.com/~mouree2011", "avatar_url": "https://storage.googleapis.com/plotly-prod-profiles/68.jpg", "background_url": "https://storage.googleapis.com/plotly-prod-profiles/bg-1.jpg", "bio": "", "nickname": "", "website": "", "stream_tokens": null, "feature_set_id": null, "csrf_token": null, "date_joined": "2024-04-04 13:25:54", "mapbox_access_tokens": null, "has_password": null, "username": "mouree2011", "email": null, "is_active": null, "readonly": null, "is_dash_creator": null, "dash_created_count": null, "is_chart_creator": null, "charts_created_count": null } }, { "creation_time": "2024-04-04T13:56:46.368384Z", "comments": { "results": [], "count": 0 }, "parented": true, "embed_url": "https://chart-studio.plotly.com/~Luftmesser/109.embed", "fid": "Luftmesser:109", "filename": "Plot_Schadstoffe_Oktober 2023", "filetype": "plot", "img_url": "https://storage.googleapis.com/plotly-prod-images/Luftmesser/109/9_F90401WRWG8LC7FB1416XTJW9H2AHR.png", "image_urls": { "default": "https://storage.googleapis.com/plotly-prod-images/Luftmesser/109/2_DBDHOUN3AQD7T5J6HAM5TRFYRT0OBB.png", "block-thumb": "https://storage.googleapis.com/plotly-prod-images/Luftmesser/109/8_10HPK6EH4XQQYL22T8NJ2C08Q2IPP8.png", "list-thumb": "https://storage.googleapis.com/plotly-prod-images/Luftmesser/109/9_F90401WRWG8LC7FB1416XTJW9H2AHR.png" }, "api_urls": { "files": "https://api.plotly.com/v2/files/Luftmesser:109", "plots": "https://api.plotly.com/v2/plots/Luftmesser:109", "parent": "https://api.plotly.com/v2/folders/home?user=Luftmesser" }, "owner": "Luftmesser", "parent": -1, "preview": "", "referencers": [], "references": [], "title": "", "views": 7, "web_url": "https://chart-studio.plotly.com/~Luftmesser/109/", "world_readable": true, "date_modified": "2024-04-04T14:07:10.296Z", "stars": { "results": [], "count": 0 }, "collaborators": { "results": [], "count": 0 }, "subfolder_count": null, "refresh_interval": null, "organize_view_url": "https://chart-studio.plotly.com/~Luftmesser/109/", "current_user_permission": "read", "is_theme": null, "is_template": false, "autosize": true, "caption": "", "figure": { "data": [ { "line": { "color": "rgb(190, 193, 196)" }, "meta": { "columnNames": { "x": "time", "y": "NO2_verkehr" } }, "mode": "markers+lines", "type": "scatter", "xsrc": "Luftmesser:108:2a1382", "ysrc": "Luftmesser:108:5bd905", "marker": { "color": "rgb(248, 5, 5)" }, "showlegend": false }, { "line": { "color": "rgb(190, 193, 196)" }, "meta": { "columnNames": { "x": "time", "y": "NO2_hintergrund" } }, "mode": "markers+lines", "type": "scatter", "xsrc": "Luftmesser:108:2a1382", "ysrc": "Luftmesser:108:c413d6", "xaxis": "x", "yaxis": "y", "marker": { "color": "rgb(22, 7, 245)" }, "showlegend": false }, { "line": { "color": "rgb(190, 193, 196)" }, "meta": { "columnNames": { "x": "time", "y": "NO2_rand" } }, "mode": "markers+lines", "type": "scatter", "xsrc": "Luftmesser:108:2a1382", "ysrc": "Luftmesser:108:739138", "marker": { "color": "rgb(37, 157, 37)" }, "showlegend": false, "stackgroup": null }, { "line": { "color": "rgb(190, 193, 196)" }, "meta": { "columnNames": { "x": "time", "y": "PM10_verkehr" } }, "mode": "markers+lines", "type": "scatter", "xsrc": "Luftmesser:108:2a1382", "ysrc": "Luftmesser:108:6c3ff3", "xaxis": "x2", "yaxis": "y2", "marker": { "color": "rgb(248, 5, 5)" }, "showlegend": false, "stackgroup": null }, { "line": { "color": "rgb(190, 193, 196)" }, "meta": { "columnNames": { "x": "time", "y": "PM10_hintergrund" } }, "mode": "markers+lines", "type": "scatter", "xsrc": "Luftmesser:108:2a1382", "ysrc": "Luftmesser:108:058818", "xaxis": "x2", "yaxis": "y2", "marker": { "color": "rgb(22, 7, 245)" }, "showlegend": false, "stackgroup": null }, { "line": { "color": "rgb(190, 193, 196)" }, "meta": { "columnNames": { "x": "time", "y": "PM10_rand" } }, "mode": "markers+lines", "type": "scatter", "xsrc": "Luftmesser:108:2a1382", "ysrc": "Luftmesser:108:c30adf", "xaxis": "x2", "yaxis": "y2", "marker": { "color": "rgb(37, 157, 37)" }, "showlegend": false, "stackgroup": null }, { "line": { "color": "rgb(190, 193, 196)" }, "meta": { "columnNames": { "x": "time", "y": "O3" } }, "mode": "markers+lines", "type": "scatter", "xsrc": "Luftmesser:108:2a1382", "ysrc": "Luftmesser:108:2acf86", "xaxis": "x3", "yaxis": "y3", "marker": { "color": "rgb(179, 15, 185)" }, "showlegend": false, "stackgroup": null }, { "meta": { "columnNames": { "x": "time", "y": "NO2_verkehr" } }, "mode": "markers", "name": "Verkehr", "type": "histogram", "xsrc": "Luftmesser:108:2a1382", "ysrc": "Luftmesser:108:5bd905", "xaxis": "x4", "yaxis": "y4", "ybins": { "size": 5 }, "marker": { "color": "rgb(248, 5, 5)" }, "opacity": 1, "histfunc": "count", "histnorm": "", "stackgroup": null, "orientation": "h" }, { "meta": { "columnNames": { "x": "time", "y": "NO2_hintergrund" } }, "name": "Innenstadt", "type": "histogram", "xsrc": "Luftmesser:108:2a1382", "ysrc": "Luftmesser:108:c413d6", "xaxis": "x4", "yaxis": "y4", "marker": { "color": "rgb(22, 7, 245)" }, "orientation": "h" }, { "meta": { "columnNames": { "x": "time", "y": "NO2_rand" } }, "name": "Stadtrand", "type": "histogram", "xsrc": "Luftmesser:108:2a1382", "ysrc": "Luftmesser:108:739138", "xaxis": "x4", "yaxis": "y4", "marker": { "color": "rgb(37, 157, 37)" }, "orientation": "h" }, { "meta": { "columnNames": { "x": "time", "y": "PM10_verkehr" } }, "type": "histogram", "xsrc": "Luftmesser:108:2a1382", "ysrc": "Luftmesser:108:6c3ff3", "xaxis": "x5", "yaxis": "y5", "ybins": { "size": 4 }, "marker": { "color": "rgb(248, 5, 5)" }, "showlegend": false, "orientation": "h" }, { "meta": { "columnNames": { "x": "time", "y": "PM10_hintergrund" } }, "type": "histogram", "xsrc": "Luftmesser:108:2a1382", "ysrc": "Luftmesser:108:058818", "xaxis": "x5", "yaxis": "y5", "marker": { "color": "rgb(22, 7, 245)" }, "showlegend": false, "orientation": "h" }, { "meta": { "columnNames": { "x": "time", "y": "PM10_rand" } }, "type": "histogram", "xsrc": "Luftmesser:108:2a1382", "ysrc": "Luftmesser:108:c30adf", "xaxis": "x5", "yaxis": "y5", "marker": { "color": "rgb(37, 157, 37)" }, "hoverinfo": "x+y+name", "showlegend": false, "orientation": "h" }, { "meta": { "columnNames": { "x": "time", "y": "O3" } }, "name": "gemischt", "type": "histogram", "xsrc": "Luftmesser:108:2a1382", "ysrc": "Luftmesser:108:2acf86", "xaxis": "x6", "yaxis": "y6", "ybins": { "size": 4 }, "marker": { "color": "rgb(179, 15, 185)" }, "orientation": "h" } ], "frames": [], "layout": { "title": { "font": { "size": 27 }, "text": "NO<sub>2</sub>, PM<sub>10</sub> und O<sub>3</sub> Monatsmittelwerte für Oktober" }, "xaxis": { "side": "bottom", "type": "linear", "dtick": 2, "range": [ 1992, 2023.5 ], "ticks": "", "anchor": "y", "domain": [ 0, 0.87 ], "mirror": "ticks", "showgrid": true, "showline": true, "tickfont": { "size": 18 }, "tickmode": "linear", "zeroline": false, "autorange": false, "fixedrange": false }, "yaxis": { "type": "linear", "range": [ 1.1658669574700111, 69.43413304253 ], "title": { "font": { "size": 21 }, "text": "NO<sub>2</sub> in µg/m³" }, "anchor": "x", "domain": [ 0.75, 1 ], "mirror": "ticks", "showline": true, "tickfont": { "size": 18 }, "zeroline": false, "autorange": true }, "bargap": 0.24, "legend": { "x": 0.01000000000000002, "y": 1.03, "font": { "size": 22 }, "title": { "font": { "size": 1 }, "text": "<br>" }, "valign": "middle", "bgcolor": "rgba(255, 255, 255, 0.01)", "xanchor": "auto", "yanchor": "middle", "traceorder": "normal", "bordercolor": "rgb(255, 255, 255)", "borderwidth": 0, "orientation": "h" }, "xaxis2": { "side": "bottom", "type": "linear", "dtick": 2, "range": [ 1992, 2023.5 ], "tick0": 0, "anchor": "y2", "domain": [ 0, 0.87 ], "mirror": "ticks", "showline": true, "tickfont": { "size": 18 }, "tickmode": "linear", "zeroline": false, "autorange": false, "overlaying": false }, "xaxis3": { "side": "bottom", "type": "linear", "dtick": 2, "range": [ 1992, 2023.5 ], "title": { "font": { "size": 25 }, "text": "Jahr" }, "anchor": "y3", "domain": [ 0, 0.87 ], "mirror": "ticks", "showline": true, "tickfont": { "size": 18 }, "tickmode": "linear", "zeroline": false, "autorange": false, "overlaying": false }, "xaxis4": { "side": "bottom", "type": "linear", "range": [ 0.1, 21.05263157894737 ], "anchor": "y4", "domain": [ 0.875, 1 ], "mirror": "ticks", "showgrid": true, "showline": true, "tickfont": { "size": 16 }, "zeroline": false, "autorange": false, "overlaying": false }, "xaxis5": { "side": "bottom", "type": "linear", "range": [ 0.1, 18.94736842105263 ], "anchor": "y5", "domain": [ 0.875, 1 ], "mirror": "ticks", "showline": true, "tickfont": { "size": 16 }, "autorange": false, "overlaying": false }, "xaxis6": { "side": "bottom", "type": "linear", "range": [ 0.1, 14.736842105263158 ], "title": { "font": { "size": 25 }, "text": "Anzahl" }, "anchor": "y6", "domain": [ 0.875, 1 ], "mirror": "ticks", "showline": true, "tickfont": { "size": 16 }, "autorange": false, "overlaying": false }, "yaxis2": { "side": "left", "type": "linear", "range": [ 10, 50 ], "title": { "font": { "size": 21 }, "text": "PM<sub>10</sub> in µg/m³" }, "anchor": "x2", "domain": [ 0.375, 0.625 ], "mirror": "ticks", "showline": true, "tickfont": { "size": 18 }, "zeroline": false, "autorange": false, "overlaying": false }, "yaxis3": { "side": "left", "type": "linear", "range": [ 20, 40 ], "title": { "font": { "size": 21 }, "text": "O<sub>3</sub> in µg/m³" }, "anchor": "x3", "domain": [ 0, 0.25 ], "mirror": "ticks", "showline": true, "tickfont": { "size": 18 }, "zeroline": false, "autorange": false, "overlaying": false }, "yaxis4": { "side": "right", "type": "linear", "range": [ 5, 65 ], "anchor": "x4", "domain": [ 0.75, 1 ], "mirror": "ticks", "showgrid": true, "showline": true, "tickfont": { "size": 18 }, "tickmode": "auto", "autorange": true, "overlaying": false }, "yaxis5": { "side": "right", "type": "linear", "range": [ 12, 48 ], "anchor": "x5", "domain": [ 0.375, 0.625 ], "mirror": "ticks", "showgrid": true, "showline": true, "tickfont": { "size": 18 }, "autorange": true, "overlaying": false }, "yaxis6": { "side": "right", "type": "linear", "range": [ 20, 40 ], "anchor": "x6", "domain": [ 0, 0.25 ], "mirror": "ticks", "showgrid": true, "showline": true, "tickfont": { "size": 18 }, "autorange": true, "overlaying": false }, "barmode": "stack", "barnorm": "", "autosize": true, "showlegend": true, "bargroupgap": 0 } }, "height": null, "width": null, "user": { "profile_url": "https://chart-studio.plotly.com/~Luftmesser", "avatar_url": "https://storage.googleapis.com/plotly-prod-profiles/42.jpg", "background_url": "https://storage.googleapis.com/plotly-prod-profiles/bg-2.jpg", "bio": "", "nickname": "", "website": "", "stream_tokens": null, "feature_set_id": null, "csrf_token": null, "date_joined": "2022-01-04 16:23:42", "mapbox_access_tokens": null, "has_password": null, "username": "Luftmesser", "email": null, "is_active": null, "readonly": null, "is_dash_creator": null, "dash_created_count": null, "is_chart_creator": null, "charts_created_count": null } }, { "creation_time": "2024-04-04T13:56:23.642792Z", "comments": { "results": [], "count": 0 }, "parented": true, "embed_url": "https://chart-studio.plotly.com/~Luftmesser/107.embed", "fid": "Luftmesser:107", "filename": "Plot_Wetter_Oktober_2023", "filetype": "plot", "img_url": "https://storage.googleapis.com/plotly-prod-images/Luftmesser/107/9_BGOZYL8ILW1I6UBVID8RO7OK1I7WEW.png", "image_urls": { "default": "https://storage.googleapis.com/plotly-prod-images/Luftmesser/107/2_FPJHPCDH7WZTA8XCW3M92165ZNQN3X.png", "block-thumb": "https://storage.googleapis.com/plotly-prod-images/Luftmesser/107/8_2HQ52MSVMLC7YSNAOTQEC87TBKTD1M.png", "list-thumb": "https://storage.googleapis.com/plotly-prod-images/Luftmesser/107/9_BGOZYL8ILW1I6UBVID8RO7OK1I7WEW.png" }, "api_urls": { "files": "https://api.plotly.com/v2/files/Luftmesser:107", "plots": "https://api.plotly.com/v2/plots/Luftmesser:107", "parent": "https://api.plotly.com/v2/folders/home?user=Luftmesser" }, "owner": "Luftmesser", "parent": -1, "preview": "", "referencers": [], "references": [], "title": "", "views": 6, "web_url": "https://chart-studio.plotly.com/~Luftmesser/107/", "world_readable": true, "date_modified": "2024-04-04T14:01:11.964Z", "stars": { "results": [], "count": 0 }, "collaborators": { "results": [], "count": 0 }, "subfolder_count": null, "refresh_interval": null, "organize_view_url": "https://chart-studio.plotly.com/~Luftmesser/107/", "current_user_permission": "read", "is_theme": null, "is_template": false, "autosize": true, "caption": "", "figure": { "data": [ { "line": { "color": "rgb(190, 193, 196)" }, "meta": { "columnNames": { "x": "year", "y": "Temperature" } }, "mode": "markers+lines", "name": "trace 0", "type": "scatter", "xsrc": "Luftmesser:106:10719e", "ysrc": "Luftmesser:106:da7ef7", "marker": { "cmax": 8, "cmin": 2, "cauto": true, "color": "rgb(253, 8, 8)", "showscale": false, "autocolorscale": false } }, { "line": { "color": "rgb(190, 193, 196)" }, "meta": { "columnNames": { "x": "year", "y": "sunshine" } }, "mode": "markers+lines", "type": "scatter", "xsrc": "Luftmesser:106:10719e", "ysrc": "Luftmesser:106:d5cb5f", "xaxis": "x2", "yaxis": "y2", "marker": { "cmax": 7, "cmin": 0, "cauto": true, "color": "#ff7f0e", "autocolorscale": false }, "hoverinfo": "x+y+name", "stackgroup": null }, { "line": { "color": "rgb(190, 193, 196)" }, "meta": { "columnNames": { "x": "year", "y": "precipitation" } }, "mode": "markers+lines", "type": "scatter", "xsrc": "Luftmesser:106:10719e", "ysrc": "Luftmesser:106:75d420", "xaxis": "x3", "yaxis": "y3", "marker": { "cmax": 9, "cmin": 2, "cauto": true, "color": "rgb(9, 9, 245)", "autocolorscale": false }, "stackgroup": null }, { "meta": { "columnNames": { "x": "year", "y": "Temperature" } }, "mode": "markers", "type": "histogram", "xsrc": "Luftmesser:106:10719e", "ysrc": "Luftmesser:106:da7ef7", "xaxis": "x4", "yaxis": "y4", "stackgroup": null, "orientation": "h" }, { "meta": { "columnNames": { "x": "year", "y": "sunshine" } }, "type": "histogram", "xsrc": "Luftmesser:106:10719e", "ysrc": "Luftmesser:106:d5cb5f", "xaxis": "x5", "yaxis": "y5", "marker": { "color": "rgb(255, 127, 14)" }, "orientation": "h" }, { "meta": { "columnNames": { "x": "year", "y": "precipitation" } }, "type": "histogram", "xsrc": "Luftmesser:106:10719e", "ysrc": "Luftmesser:106:75d420", "xaxis": "x6", "yaxis": "y6", "marker": { "color": "rgb(9, 9, 245)" }, "orientation": "h" }, { "line": { "dash": "dash", "color": "rgb(253, 8, 8)" }, "meta": { "columnNames": { "x": "year", "y": "E" } }, "mode": "lines", "type": "scatter", "xsrc": "Luftmesser:106:10719e", "ysrc": "Luftmesser:106:390418" }, { "line": { "color": "rgb(253, 8, 8)" }, "meta": { "columnNames": { "x": "year", "y": "F" } }, "mode": "lines", "type": "scatter", "xsrc": "Luftmesser:106:10719e", "ysrc": "Luftmesser:106:49bae8" }, { "line": { "dash": "dash", "color": "rgb(255, 127, 14)" }, "meta": { "columnNames": { "x": "year", "y": "G" } }, "mode": "lines", "type": "scatter", "xsrc": "Luftmesser:106:10719e", "ysrc": "Luftmesser:106:5b852e", "xaxis": "x2", "yaxis": "y2", "stackgroup": null }, { "line": { "color": "rgb(255, 127, 14)" }, "meta": { "columnNames": { "x": "year", "y": "H" } }, "mode": "lines", "type": "scatter", "xsrc": "Luftmesser:106:10719e", "ysrc": "Luftmesser:106:84ffe1", "xaxis": "x2", "yaxis": "y2", "stackgroup": null }, { "line": { "dash": "dash", "color": "rgb(9, 9, 245)" }, "meta": { "columnNames": { "x": "year", "y": "I" } }, "mode": "lines", "type": "scatter", "xsrc": "Luftmesser:106:10719e", "ysrc": "Luftmesser:106:1eee1b", "xaxis": "x3", "yaxis": "y3", "stackgroup": null }, { "line": { "color": "rgb(9, 9, 245)" }, "meta": { "columnNames": { "x": "year", "y": "J" } }, "mode": "lines", "type": "scatter", "xsrc": "Luftmesser:106:10719e", "ysrc": "Luftmesser:106:6742e7", "xaxis": "x3", "yaxis": "y3", "stackgroup": null } ], "frames": [], "layout": { "font": { "size": 15 }, "title": { "font": { "size": 27 }, "text": "Meteorologische Mittelwerte in Berlin (Dahlem) - Oktober" }, "xaxis": { "side": "bottom", "type": "linear", "range": [ 1949.5, 2023.5 ], "ticks": "", "title": { "font": { "size": 25 }, "text": "<br>" }, "anchor": "y", "domain": [ 0, 0.87 ], "mirror": "ticks", "showgrid": true, "showline": true, "tickfont": { "size": 18 }, "zeroline": false, "autorange": false, "showticklabels": true }, "yaxis": { "side": "left", "type": "linear", "range": [ 5, 15 ], "title": { "font": { "size": 21 }, "text": "Temperatur in °C" }, "domain": [ 0.75, 1 ], "mirror": "ticks", "showgrid": true, "showline": true, "tickfont": { "size": 18 }, "zeroline": false, "autorange": false }, "xaxis2": { "side": "bottom", "type": "linear", "range": [ 1949.5, 2023.5 ], "anchor": "y2", "domain": [ 0, 0.87 ], "mirror": "ticks", "showgrid": true, "showline": true, "tickfont": { "size": 18 }, "zeroline": false, "autorange": false, "overlaying": false }, "xaxis3": { "side": "bottom", "type": "linear", "range": [ 1949.5, 2023.5 ], "title": { "font": { "size": 25 }, "text": "Jahr" }, "anchor": "y3", "domain": [ 0, 0.87 ], "mirror": "ticks", "showgrid": true, "showline": true, "tickfont": { "size": 18 }, "zeroline": false, "autorange": false, "overlaying": false }, "xaxis4": { "side": "bottom", "type": "linear", "range": [ 0.1, 18.94736842105263 ], "ticks": "", "anchor": "y4", "domain": [ 0.875, 1 ], "mirror": "ticks", "showgrid": true, "showline": true, "tickfont": { "size": 16 }, "tickmode": "auto", "zeroline": false, "autorange": false, "tickangle": "auto", "automargin": false, "overlaying": false, "showticklabels": true }, "xaxis5": { "side": "bottom", "type": "linear", "range": [ 0, 24.210526315789473 ], "anchor": "y5", "domain": [ 0.875, 1 ], "mirror": "ticks", "showgrid": true, "showline": true, "tickfont": { "size": 16 }, "zeroline": false, "autorange": true, "tickangle": "auto", "overlaying": false, "showticklabels": true }, "xaxis6": { "side": "bottom", "type": "linear", "range": [ 0.1, 14.736842105263158 ], "title": { "font": { "size": 25 }, "text": "Anzahl" }, "anchor": "y6", "domain": [ 0.875, 1 ], "mirror": "ticks", "showgrid": true, "showline": true, "tickfont": { "size": 16 }, "zeroline": false, "autorange": false, "overlaying": false }, "yaxis2": { "side": "left", "type": "linear", "range": [ 30, 250 ], "title": { "font": { "size": 21 }, "text": "Sonnenschein in h" }, "domain": [ 0.375, 0.625 ], "mirror": "ticks", "showgrid": true, "showline": true, "tickfont": { "size": 18 }, "zeroline": false, "autorange": false, "overlaying": false }, "yaxis3": { "side": "left", "type": "linear", "range": [ 0, 160 ], "title": { "font": { "size": 21 }, "text": "Niederschlag in l/m²" }, "anchor": "x3", "domain": [ 0, 0.25 ], "mirror": "ticks", "showgrid": true, "showline": true, "tickfont": { "size": 18 }, "zeroline": false, "autorange": false, "overlaying": false }, "yaxis4": { "side": "right", "type": "linear", "range": [ 5, 13 ], "title": { "text": "Click to enter Y axis title" }, "anchor": "x4", "domain": [ 0.75, 1 ], "mirror": "ticks", "showgrid": true, "showline": true, "tickfont": { "size": 18 }, "autorange": true, "overlaying": false }, "yaxis5": { "side": "right", "type": "linear", "range": [ 40, 220 ], "anchor": "x5", "domain": [ 0.375, 0.625 ], "mirror": "ticks", "showgrid": true, "showline": true, "tickfont": { "size": 18 }, "autorange": true, "overlaying": false }, "yaxis6": { "side": "right", "type": "linear", "range": [ 0, 140 ], "anchor": "x6", "domain": [ 0, 0.25 ], "mirror": "ticks", "showgrid": true, "showline": true, "tickfont": { "size": 18 }, "autorange": true, "overlaying": false }, "autosize": true, "showlegend": false } }, "height": null, "width": null, "user": { "profile_url": "https://chart-studio.plotly.com/~Luftmesser", "avatar_url": "https://storage.googleapis.com/plotly-prod-profiles/42.jpg", "background_url": "https://storage.googleapis.com/plotly-prod-profiles/bg-2.jpg", "bio": "", "nickname": "", "website": "", "stream_tokens": null, "feature_set_id": null, "csrf_token": null, "date_joined": "2022-01-04 16:23:42", "mapbox_access_tokens": null, "has_password": null, "username": "Luftmesser", "email": null, "is_active": null, "readonly": null, "is_dash_creator": null, "dash_created_count": null, "is_chart_creator": null, "charts_created_count": null } }, { "creation_time": "2024-04-04T13:52:14.455593Z", "comments": { "results": [], "count": 0 }, "parented": true, "embed_url": "https://chart-studio.plotly.com/~ASCIVOLETTO/67.embed", "fid": "ASCIVOLETTO:67", "filename": "NOPEVCTOPEANNUAL", "filetype": "plot", "img_url": "https://storage.googleapis.com/plotly-prod-images/ASCIVOLETTO/67/9_2X6UW50J4P099ICZQUZQIR5WCRFJSI.png", "image_urls": { "default": "https://storage.googleapis.com/plotly-prod-images/ASCIVOLETTO/67/2_T4YZHIS1E0QOHM0TEKG3S1Y80BIMQJ.png", "block-thumb": "https://storage.googleapis.com/plotly-prod-images/ASCIVOLETTO/67/8_YCH6TVZ1DY1VYWVBQMGU2GP7QVKB2G.png", "list-thumb": "https://storage.googleapis.com/plotly-prod-images/ASCIVOLETTO/67/9_2X6UW50J4P099ICZQUZQIR5WCRFJSI.png" }, "api_urls": { "files": "https://api.plotly.com/v2/files/ASCIVOLETTO:67", "plots": "https://api.plotly.com/v2/plots/ASCIVOLETTO:67", "parent": "https://api.plotly.com/v2/folders/home?user=ASCIVOLETTO" }, "owner": "ASCIVOLETTO", "parent": -1, "preview": "", "referencers": [], "references": [], "title": "", "views": 5, "web_url": "https://chart-studio.plotly.com/~ASCIVOLETTO/67/", "world_readable": true, "date_modified": "2024-04-04T13:52:14.465Z", "stars": { "results": [], "count": 0 }, "collaborators": { "results": [], "count": 0 }, "subfolder_count": null, "refresh_interval": null, "organize_view_url": "https://chart-studio.plotly.com/~ASCIVOLETTO/67/", "current_user_permission": "read", "is_theme": null, "is_template": false, "autosize": true, "caption": "", "figure": { "data": [ { "box": { "visible": false }, "uid": "1824af", "line": { "dash": "solid", "color": "rgb(6, 6, 6)", "shape": "linear", "width": 1 }, "meta": { "columnNames": { "x": "A", "y": "C" } }, "mode": "lines", "name": "Coef Trend", "side": "both", "type": "violin", "xsrc": "ASCIVOLETTO:66:4b8d6e", "ysrc": "ASCIVOLETTO:66:019208", "marker": { "line": { "color": "rgb(6, 6, 6)", "width": 0 }, "size": 1, "color": "rgb(6, 6, 6)", "symbol": "circle", "opacity": 1 }, "opacity": 1, "visible": true, "meanline": { "visible": false }, "spanmode": "soft", "bandwidth": 0, "boxpoints": false, "fillcolor": "rgba(2, 2, 2, 0.5)", "scalemode": "width", "showlegend": false, "orientation": "v" }, { "uid": "0cbf81", "fill": "tonexty", "line": { "color": "rgb(6, 6, 6)", "width": 1 }, "meta": { "columnNames": { "x": "A", "y": "D" } }, "mode": "lines", "type": "box", "xsrc": "ASCIVOLETTO:66:4b8d6e", "ysrc": "ASCIVOLETTO:66:1db131", "width": 0, "jitter": 0, "boxmean": false, "hoveron": "boxes+points", "notched": true, "opacity": 1, "boxpoints": false, "fillcolor": "rgb(230, 236, 254)", "hoverinfo": "x+y+name", "hoverlabel": { "namelength": 15 }, "notchwidth": 0.10000000000000003, "showlegend": false, "stackgroup": null, "connectgaps": true, "whiskerwidth": 0.2, "hovertemplate": "" }, { "uid": "12ee11", "meta": { "columnNames": { "x": "E", "y": "F" } }, "mode": "markers", "name": "Pre", "type": "scatter", "xsrc": "ASCIVOLETTO:66:d4aa2c", "ysrc": "ASCIVOLETTO:66:cf0015", "marker": { "line": { "color": "rgb(18, 18, 18)", "width": 1 }, "size": 8, "color": "rgb(85, 160, 231)", "symbol": "circle", "maxdisplayed": 18 }, "visible": true, "boxpoints": false, "showlegend": true }, { "uid": "30e82f", "meta": { "columnNames": { "x": "G", "y": "H" } }, "mode": "markers", "name": "Post", "type": "scatter", "xsrc": "ASCIVOLETTO:66:17584a", "ysrc": "ASCIVOLETTO:66:de50ff", "marker": { "line": { "color": "rgb(5, 5, 5)", "width": 1 }, "size": 8, "color": "rgb(53, 211, 36)" }, "visible": true, "stackgroup": null } ], "frames": [], "layout": { "font": { "size": 14, "color": "rgb(10, 9, 9)", "family": "Times New Roman" }, "title": { "x": 0.5, "font": { "size": 17 }, "text": "No PE/VC to PE" }, "xaxis": { "side": "bottom", "type": "linear", "range": [ -3.25, 3.25 ], "title": { "text": "Years to Transaction" }, "domain": [ 0, 1 ], "nticks": 10, "showgrid": true, "showline": true, "zeroline": false, "autorange": false, "gridwidth": 1, "linewidth": 1, "showspikes": false, "rangeslider": { "range": [ 1, 10 ], "yaxis": {}, "visible": false, "autorange": true }, "zerolinecolor": "rgb(92, 129, 189)", "zerolinewidth": 13 }, "yaxis": { "side": "left", "type": "linear", "range": [ -0.7, 0.7 ], "ticks": "outside", "title": { "text": "Score" }, "domain": [ 0.0071532231178051036, 1 ], "nticks": 9, "ticklen": 4, "showline": true, "autorange": false, "tickwidth": 1 }, "boxgap": 0.88, "legend": { "x": 0.8813699856242904, "y": 0.919567286597765, "font": { "size": 12 }, "title": { "font": { "size": 14 }, "text": "Legend:" }, "valign": "top", "bgcolor": "rgb(248, 252, 255)", "xanchor": "center", "yanchor": "middle", "itemsizing": "trace", "traceorder": "normal", "bordercolor": "rgb(3, 0, 0)", "borderwidth": 1, "orientation": "v" }, "shapes": [ { "x0": 0, "x1": 0.001, "y0": 1, "y1": -1, "line": { "dash": "dot", "color": "rgb(247, 1, 1)", "width": 1 }, "type": "rect", "opacity": 1, "fillcolor": "rgb(0, 0, 0)" }, { "x0": -3, "x1": -3.0001, "y0": -0.1977904, "y1": -0.0161341, "line": { "color": "#444444", "width": 1 }, "opacity": 1, "fillcolor": "rgb(68, 68, 68)" }, { "x0": -2, "x1": -2.0001, "y0": -0.1950852, "y1": -0.0315884, "line": { "color": "#444444", "width": 1 }, "opacity": 1, "fillcolor": "rgb(68, 68, 68)" }, { "x0": -1, "x1": -1.0001, "y0": -0.1395185, "y1": 0.0165809, "line": { "color": "#444444", "width": 1 }, "opacity": 1, "fillcolor": "rgb(68, 68, 68)" }, { "x0": 1, "x1": 1.0001, "y0": -0.3804019, "y1": -0.2363647, "line": { "color": "#444444", "width": 1 }, "opacity": 1, "fillcolor": "rgb(68, 68, 68)" }, { "x0": 2, "x1": 2.0001, "y0": -0.2798572, "y1": -0.0921188, "line": { "color": "#444444", "width": 1 }, "opacity": 1, "fillcolor": "rgb(68, 68, 68)" }, { "x0": 3, "x1": 3.0001, "y0": -0.3919131, "y1": -0.1623664, "line": { "color": "#444444", "width": 1 }, "opacity": 1, "fillcolor": "rgb(68, 68, 68)" }, { "x0": -3.25, "x1": 3.25, "y0": -0.7, "y1": -0.6999, "line": { "color": "rgb(0, 0, 0)", "width": 2 }, "opacity": 1, "fillcolor": "rgb(8, 8, 8)" }, { "x0": -12.5, "x1": -12.5001, "y0": -0.7, "y1": 0.7, "line": { "color": "rgb(5, 5, 5)", "width": 2 }, "opacity": 1, "fillcolor": "rgb(8, 8, 8)" }, { "x0": -3.5, "x1": 3.5, "y0": 0, "y1": 0.001, "line": { "color": "rgb(3, 3, 3)", "width": 1 }, "opacity": 1, "fillcolor": "rgb(0, 0, 0)" }, { "x0": -3.25, "x1": -3.2499, "y0": -0.7, "y1": 0.7, "line": { "color": "rgb(0, 0, 0)", "width": 1 }, "opacity": 1, "fillcolor": "rgb(0, 0, 0)" } ], "boxmode": "overlay", "modebar": { "color": "rgba(98, 15, 15, 0.3)", "bgcolor": "rgba(144, 81, 81, 0.5)", "activecolor": "rgba(227, 178, 178, 0.7)", "orientation": "v" }, "autosize": true, "dragmode": "lasso", "template": { "data": { "bar": [ { "type": "bar", "marker": { "colorbar": { "ticks": "", "outlinewidth": 0 } } } ], "table": [ { "type": "table", "cells": { "fill": { "color": "#EBF0F8" }, "line": { "color": "white" } }, "header": { "fill": { "color": "#C8D4E3" }, "line": { "color": "white" } } } ], "carpet": [ { "type": "carpet", "aaxis": { "gridcolor": "#C8D4E3", "linecolor": "#C8D4E3", "endlinecolor": "#2a3f5f", "minorgridcolor": "#C8D4E3", "startlinecolor": "#2a3f5f" }, "baxis": { "gridcolor": "#C8D4E3", "linecolor": "#C8D4E3", "endlinecolor": "#2a3f5f", "minorgridcolor": "#C8D4E3", "startlinecolor": "#2a3f5f" } } ], "mesh3d": [ { "type": "mesh3d", "colorbar": { "ticks": "", "outlinewidth": 0 } } ], "contour": [ { "type": "contour", "colorbar": { "ticks": "", "outlinewidth": 0 }, "autocolorscale": true } ], "heatmap": [ { "type": "heatmap", "colorbar": { "ticks": "", "outlinewidth": 0 }, "autocolorscale": true } ], "scatter": [ { "type": "scatter", "marker": { "colorbar": { "ticks": "", "outlinewidth": 0 } } } ], "surface": [ { "type": "surface", "colorbar": { "ticks": "", "outlinewidth": 0 } } ], "heatmapgl": [ { "type": "heatmapgl", "colorbar": { "ticks": "", "outlinewidth": 0 } } ], "histogram": [ { "type": "histogram", "marker": { "colorbar": { "ticks": "", "outlinewidth": 0 } } } ], "parcoords": [ { "line": { "colorbar": { "ticks": "", "outlinewidth": 0 } }, "type": "parcoords" } ], "scatter3d": [ { "type": "scatter3d", "marker": { "colorbar": { "ticks": "", "outlinewidth": 0 } } } ], "scattergl": [ { "type": "scattergl", "marker": { "colorbar": { "ticks": "", "outlinewidth": 0 } } } ], "choropleth": [ { "type": "choropleth", "colorbar": { "ticks": "", "outlinewidth": 0 } } ], "scattergeo": [ { "type": "scattergeo", "marker": { "colorbar": { "ticks": "", "outlinewidth": 0 } } } ], "histogram2d": [ { "type": "histogram2d", "colorbar": { "ticks": "", "outlinewidth": 0 }, "autocolorscale": true } ], "scatterpolar": [ { "type": "scatterpolar", "marker": { "colorbar": { "ticks": "", "outlinewidth": 0 } } } ], "contourcarpet": [ { "type": "contourcarpet", "colorbar": { "ticks": "", "outlinewidth": 0 } } ], "scattercarpet": [ { "type": "scattercarpet", "marker": { "colorbar": { "ticks": "", "outlinewidth": 0 } } } ], "scattermapbox": [ { "type": "scattermapbox", "marker": { "colorbar": { "ticks": "", "outlinewidth": 0 } } } ], "scatterpolargl": [ { "type": "scatterpolargl", "marker": { "colorbar": { "ticks": "", "outlinewidth": 0 } } } ], "scatterternary": [ { "type": "scatterternary", "marker": { "colorbar": { "ticks": "", "outlinewidth": 0 } } } ], "histogram2dcontour": [ { "type": "histogram2dcontour", "colorbar": { "ticks": "", "outlinewidth": 0 }, "autocolorscale": true } ] }, "layout": { "geo": { "bgcolor": "white", "showland": true, "lakecolor": "white", "landcolor": "white", "showlakes": true, "subunitcolor": "#C8D4E3" }, "font": { "color": "#2a3f5f" }, "polar": { "bgcolor": "white", "radialaxis": { "ticks": "", "gridcolor": "#EBF0F8", "linecolor": "#EBF0F8" }, "angularaxis": { "ticks": "", "gridcolor": "#EBF0F8", "linecolor": "#EBF0F8" } }, "scene": { "xaxis": { "ticks": "", "gridcolor": "#DFE8F3", "gridwidth": 2, "linecolor": "#EBF0F8", "zerolinecolor": "#EBF0F8", "showbackground": true, "backgroundcolor": "white" }, "yaxis": { "ticks": "", "gridcolor": "#DFE8F3", "gridwidth": 2, "linecolor": "#EBF0F8", "zerolinecolor": "#EBF0F8", "showbackground": true, "backgroundcolor": "white" }, "zaxis": { "ticks": "", "gridcolor": "#DFE8F3", "gridwidth": 2, "linecolor": "#EBF0F8", "zerolinecolor": "#EBF0F8", "showbackground": true, "backgroundcolor": "white" } }, "title": { "x": 0.05 }, "xaxis": { "ticks": "", "gridcolor": "#EBF0F8", "linecolor": "#EBF0F8", "automargin": true, "zerolinecolor": "#EBF0F8", "zerolinewidth": 2 }, "yaxis": { "ticks": "", "gridcolor": "#EBF0F8", "linecolor": "#EBF0F8", "automargin": true, "zerolinecolor": "#EBF0F8", "zerolinewidth": 2 }, "ternary": { "aaxis": { "ticks": "", "gridcolor": "#DFE8F3", "linecolor": "#A2B1C6" }, "baxis": { "ticks": "", "gridcolor": "#DFE8F3", "linecolor": "#A2B1C6" }, "caxis": { "ticks": "", "gridcolor": "#DFE8F3", "linecolor": "#A2B1C6" }, "bgcolor": "white" }, "colorway": [ "#636efa", "#EF553B", "#00cc96", "#ab63fa", "#19d3f3", "#e763fa", "#fecb52", "#ffa15a", "#ff6692", "#b6e880" ], "hovermode": "closest", "colorscale": { "diverging": [ [ 0, "#8e0152" ], [ 0.1, "#c51b7d" ], [ 0.2, "#de77ae" ], [ 0.3, "#f1b6da" ], [ 0.4, "#fde0ef" ], [ 0.5, "#f7f7f7" ], [ 0.6, "#e6f5d0" ], [ 0.7, "#b8e186" ], [ 0.8, "#7fbc41" ], [ 0.9, "#4d9221" ], [ 1, "#276419" ] ], "sequential": [ [ 0, "#0508b8" ], [ 0.0893854748603352, "#1910d8" ], [ 0.1787709497206704, "#3c19f0" ], [ 0.2681564245810056, "#6b1cfb" ], [ 0.3575418994413408, "#981cfd" ], [ 0.44692737430167595, "#bf1cfd" ], [ 0.5363128491620112, "#dd2bfd" ], [ 0.6256983240223464, "#f246fe" ], [ 0.7150837988826816, "#fc67fd" ], [ 0.8044692737430168, "#fe88fc" ], [ 0.8938547486033519, "#fea5fd" ], [ 0.9832402234636871, "#febefe" ], [ 1, "#fec3fe" ] ], "sequentialminus": [ [ 0, "#0508b8" ], [ 0.0893854748603352, "#1910d8" ], [ 0.1787709497206704, "#3c19f0" ], [ 0.2681564245810056, "#6b1cfb" ], [ 0.3575418994413408, "#981cfd" ], [ 0.44692737430167595, "#bf1cfd" ], [ 0.5363128491620112, "#dd2bfd" ], [ 0.6256983240223464, "#f246fe" ], [ 0.7150837988826816, "#fc67fd" ], [ 0.8044692737430168, "#fe88fc" ], [ 0.8938547486033519, "#fea5fd" ], [ 0.9832402234636871, "#febefe" ], [ 1, "#fec3fe" ] ] }, "plot_bgcolor": "white", "paper_bgcolor": "white", "shapedefaults": { "line": { "width": 0 }, "opacity": 0.4, "fillcolor": "#506784" }, "annotationdefaults": { "arrowhead": 0, "arrowcolor": "#506784", "arrowwidth": 1 } }, "themeRef": "PLOTLY_WHITE" }, "hovermode": "x", "violingap": 0.88, "colorscale": { "sequential": [ [ 0, "#00224e" ], [ 0.1111111111111111, "#123570" ], [ 0.2222222222222222, "#3b496c" ], [ 0.3333333333333333, "#575d6d" ], [ 0.4444444444444444, "#707173" ], [ 0.5555555555555556, "#8a8678" ], [ 0.6666666666666666, "#a59c74" ], [ 0.7777777777777778, "#c3b369" ], [ 0.8888888888888888, "#e1cc55" ], [ 1, "#fee838" ] ] }, "hoverlabel": { "font": { "size": 14 } }, "showlegend": true, "boxgroupgap": 0.12, "uniformtext": { "mode": false }, "plot_bgcolor": "rgb(255, 255, 255)", "paper_bgcolor": "rgb(255, 255, 255)", "violingroupgap": 0.12 } }, "height": null, "width": null, "user": { "profile_url": "https://chart-studio.plotly.com/~ASCIVOLETTO", "avatar_url": "https://storage.googleapis.com/plotly-prod-profiles/96.jpg", "background_url": "https://storage.googleapis.com/plotly-prod-profiles/bg-7.jpg", "bio": "", "nickname": "", "website": "", "stream_tokens": null, "feature_set_id": null, "csrf_token": null, "date_joined": "2023-03-30 13:28:23", "mapbox_access_tokens": null, "has_password": null, "username": "ASCIVOLETTO", "email": null, "is_active": null, "readonly": null, "is_dash_creator": null, "dash_created_count": null, "is_chart_creator": null, "charts_created_count": null } }, { "creation_time": "2024-04-04T13:43:41.119920Z", "comments": { "results": [], "count": 0 }, "parented": true, "embed_url": "https://chart-studio.plotly.com/~arnold123/25.embed", "fid": "arnold123:25", "filename": "20240403 - Kappa + Breakdown + Summary-based selection + No Low confidence + Visible GGB + Skip", "filetype": "plot", "img_url": "https://storage.googleapis.com/plotly-prod-images/arnold123/25/9_XQEG7Z323APE05SVZWYKXFWO7QL4WZ.png", "image_urls": { "default": "https://storage.googleapis.com/plotly-prod-images/arnold123/25/2_6I3397LT6ILQ2JQBRV1SED5LNID67M.png", "block-thumb": "https://storage.googleapis.com/plotly-prod-images/arnold123/25/8_9CPR89HEA9IVNC9V24RYTA6HG46WX6.png", "list-thumb": "https://storage.googleapis.com/plotly-prod-images/arnold123/25/9_XQEG7Z323APE05SVZWYKXFWO7QL4WZ.png" }, "api_urls": { "files": "https://api.plotly.com/v2/files/arnold123:25", "plots": "https://api.plotly.com/v2/plots/arnold123:25", "parent": "https://api.plotly.com/v2/folders/home?user=arnold123" }, "owner": "arnold123", "parent": -1, "preview": "", "referencers": [], "references": [], "title": "", "views": 3, "web_url": "https://chart-studio.plotly.com/~arnold123/25/", "world_readable": true, "date_modified": "2024-04-05T21:31:43.533Z", "stars": { "results": [], "count": 0 }, "collaborators": { "results": [], "count": 0 }, "subfolder_count": null, "refresh_interval": null, "organize_view_url": "https://chart-studio.plotly.com/~arnold123/25/", "current_user_permission": "read", "is_theme": null, "is_template": false, "autosize": true, "caption": "", "figure": { "data": [ { "meta": { "columnNames": { "x": "id - label", "y": "kappa", "text": "samples" } }, "name": "Kappa", "type": "bar", "xsrc": "arnold123:24:d8e0e5,be9f3e*", "ysrc": "arnold123:24:0c60ad", "marker": { "color": "rgb(31, 119, 180)" }, "textsrc": "arnold123:24:079eeb", "hoverlabel": { "align": "auto", "namelength": 15 }, "orientation": "v", "textposition": "none", "constraintext": "both", "hovertemplate": "" }, { "meta": { "columnNames": { "x": "id - label", "y": "accuracy", "text": "samples" } }, "name": "Accuracy", "type": "bar", "xsrc": "arnold123:24:d8e0e5,be9f3e*", "ysrc": "arnold123:24:f08c89", "marker": { "color": "rgb(210, 148, 230)" }, "textsrc": "arnold123:24:079eeb", "visible": true, "hoverinfo": "x+y+text+name", "orientation": "v", "textposition": "outside" }, { "meta": { "columnNames": { "x": "id - label", "y": "accuracyByConfidence[67]", "text": "samplesByConfidence[67]" } }, "name": "67%", "type": "bar", "xsrc": "arnold123:24:d8e0e5,be9f3e*", "ysrc": "arnold123:24:9a2b6a", "opacity": 1, "textsrc": "arnold123:24:05f916", "visible": "legendonly", "hoverinfo": "y+text", "orientation": "v", "textposition": "outside", "constraintext": "both", "hovertemplate": "" }, { "meta": { "columnNames": { "x": "id - label", "y": "accuracyByConfidence[100]", "text": "samplesByConfidence[100]" } }, "name": "100%", "type": "bar", "xsrc": "arnold123:24:d8e0e5,be9f3e*", "ysrc": "arnold123:24:b97781", "opacity": 1, "textsrc": "arnold123:24:41c8c6", "visible": "legendonly", "hoverinfo": "y+text", "orientation": "v", "textposition": "outside", "texttemplate": "" } ], "frames": [], "layout": { "scene": { "camera": { "up": { "x": 0, "y": 0, "z": 1 }, "eye": { "x": 1.8493807433651352, "y": 0.644325361967722, "z": 0.4667046631750106 }, "center": { "x": 0, "y": 0, "z": 0 }, "projection": { "type": "perspective" } }, "aspectmode": "auto", "aspectratio": { "x": 1, "y": 1, "z": 1 } }, "title": { "text": "GPT Task Classification 2024/04/03 - Kappa + Accuracy Breakdown + Summary-based selection + Low confidence Removal + All fields iteration + Visible GGB Fields + Skip fields without tagging" }, "xaxis": { "type": "multicategory", "dtick": 1, "range": [ -1.0196199882469479, 39.88025659755775 ], "ticks": "", "title": { "font": { "size": 12 }, "text": "Task Property" }, "domain": [ 0, 1 ], "mirror": false, "tickson": "boundaries", "showgrid": true, "showline": true, "tickfont": { "size": 12, "family": "Open Sans" }, "tickmode": "auto", "autorange": false, "linewidth": 1, "tickangle": 45, "automargin": true, "showspikes": false, "tickformat": "", "tickprefix": "", "rangeslider": { "range": [ -0.5, 31.5 ], "yaxis": {}, "yaxis2": {}, "visible": false, "autorange": true, "thickness": 0.4 }, "dividercolor": "rgba(68, 68, 68, 0.5)", "showdividers": true, "spikethickness": 3 }, "yaxis": { "type": "linear", "range": [ -0.5, 1.2 ], "title": { "text": "Reliability" }, "domain": [ 0, 1 ], "showline": false, "autorange": false, "showspikes": false }, "bargap": 0.12, "legend": { "x": 0.9916504257319263, "y": 0.25600722364760986 }, "shapes": [ { "x0": 0, "x1": 100, "y0": 0.8, "y1": 0.8, "line": { "dash": "dot", "color": "rgb(1, 233, 35)", "width": 2 }, "type": "line", "xref": "x", "opacity": 0.38, "fillcolor": "#7f7f7f" }, { "x0": -9.322602453034369, "x1": 90.67768841700648, "y0": 0.6000070057447104, "y1": 0.6000070057447104, "line": { "dash": "dot", "color": "rgb(27, 136, 215)", "width": 2 }, "type": "line", "opacity": 0.38, "fillcolor": "rgb(68, 68, 68)" }, { "x0": 0, "x1": 100, "y0": 0.4, "y1": 0.4, "line": { "dash": "dot", "color": "rgb(205, 154, 28)", "width": 2 }, "type": "line", "opacity": 0.3, "fillcolor": "#7f7f7f" }, { "x0": 0, "x1": 100, "y0": 0.2, "y1": 0.2, "line": { "dash": "dot", "color": "rgb(238, 96, 96)", "width": 2 }, "type": "line", "opacity": 0.3, "fillcolor": "#7f7f7f" } ], "barmode": "group", "barnorm": "", "autosize": true, "dragmode": "pan", "template": { "data": { "bar": [ { "type": "bar", "marker": { "colorbar": { "ticks": "", "outlinewidth": 0 } } } ], "table": [ { "type": "table", "cells": { "fill": { "color": "#EBF0F8" }, "line": { "color": "white" } }, "header": { "fill": { "color": "#C8D4E3" }, "line": { "color": "white" } } } ], "carpet": [ { "type": "carpet", "aaxis": { "gridcolor": "#C8D4E3", "linecolor": "#C8D4E3", "endlinecolor": "#2a3f5f", "minorgridcolor": "#C8D4E3", "startlinecolor": "#2a3f5f" }, "baxis": { "gridcolor": "#C8D4E3", "linecolor": "#C8D4E3", "endlinecolor": "#2a3f5f", "minorgridcolor": "#C8D4E3", "startlinecolor": "#2a3f5f" } } ], "mesh3d": [ { "type": "mesh3d", "colorbar": { "ticks": "", "outlinewidth": 0 } } ], "contour": [ { "type": "contour", "colorbar": { "ticks": "", "outlinewidth": 0 }, "autocolorscale": true } ], "heatmap": [ { "type": "heatmap", "colorbar": { "ticks": "", "outlinewidth": 0 }, "autocolorscale": true } ], "scatter": [ { "type": "scatter", "marker": { "colorbar": { "ticks": "", "outlinewidth": 0 } } } ], "surface": [ { "type": "surface", "colorbar": { "ticks": "", "outlinewidth": 0 } } ], "heatmapgl": [ { "type": "heatmapgl", "colorbar": { "ticks": "", "outlinewidth": 0 } } ], "histogram": [ { "type": "histogram", "marker": { "colorbar": { "ticks": "", "outlinewidth": 0 } } } ], "parcoords": [ { "line": { "colorbar": { "ticks": "", "outlinewidth": 0 } }, "type": "parcoords" } ], "scatter3d": [ { "type": "scatter3d", "marker": { "colorbar": { "ticks": "", "outlinewidth": 0 } } } ], "scattergl": [ { "type": "scattergl", "marker": { "colorbar": { "ticks": "", "outlinewidth": 0 } } } ], "choropleth": [ { "type": "choropleth", "colorbar": { "ticks": "", "outlinewidth": 0 } } ], "scattergeo": [ { "type": "scattergeo", "marker": { "colorbar": { "ticks": "", "outlinewidth": 0 } } } ], "histogram2d": [ { "type": "histogram2d", "colorbar": { "ticks": "", "outlinewidth": 0 }, "autocolorscale": true } ], "scatterpolar": [ { "type": "scatterpolar", "marker": { "colorbar": { "ticks": "", "outlinewidth": 0 } } } ], "contourcarpet": [ { "type": "contourcarpet", "colorbar": { "ticks": "", "outlinewidth": 0 } } ], "scattercarpet": [ { "type": "scattercarpet", "marker": { "colorbar": { "ticks": "", "outlinewidth": 0 } } } ], "scattermapbox": [ { "type": "scattermapbox", "marker": { "colorbar": { "ticks": "", "outlinewidth": 0 } } } ], "scatterpolargl": [ { "type": "scatterpolargl", "marker": { "colorbar": { "ticks": "", "outlinewidth": 0 } } } ], "scatterternary": [ { "type": "scatterternary", "marker": { "colorbar": { "ticks": "", "outlinewidth": 0 } } } ], "histogram2dcontour": [ { "type": "histogram2dcontour", "colorbar": { "ticks": "", "outlinewidth": 0 }, "autocolorscale": true } ] }, "layout": { "geo": { "bgcolor": "white", "showland": true, "lakecolor": "white", "landcolor": "white", "showlakes": true, "subunitcolor": "#C8D4E3" }, "font": { "color": "#2a3f5f" }, "polar": { "bgcolor": "white", "radialaxis": { "ticks": "", "gridcolor": "#EBF0F8", "linecolor": "#EBF0F8" }, "angularaxis": { "ticks": "", "gridcolor": "#EBF0F8", "linecolor": "#EBF0F8" } }, "scene": { "xaxis": { "ticks": "", "gridcolor": "#DFE8F3", "gridwidth": 2, "linecolor": "#EBF0F8", "zerolinecolor": "#EBF0F8", "showbackground": true, "backgroundcolor": "white" }, "yaxis": { "ticks": "", "gridcolor": "#DFE8F3", "gridwidth": 2, "linecolor": "#EBF0F8", "zerolinecolor": "#EBF0F8", "showbackground": true, "backgroundcolor": "white" }, "zaxis": { "ticks": "", "gridcolor": "#DFE8F3", "gridwidth": 2, "linecolor": "#EBF0F8", "zerolinecolor": "#EBF0F8", "showbackground": true, "backgroundcolor": "white" } }, "title": { "x": 0.05 }, "xaxis": { "ticks": "", "gridcolor": "#EBF0F8", "linecolor": "#EBF0F8", "automargin": true, "zerolinecolor": "#EBF0F8", "zerolinewidth": 2 }, "yaxis": { "ticks": "", "gridcolor": "#EBF0F8", "linecolor": "#EBF0F8", "automargin": true, "zerolinecolor": "#EBF0F8", "zerolinewidth": 2 }, "ternary": { "aaxis": { "ticks": "", "gridcolor": "#DFE8F3", "linecolor": "#A2B1C6" }, "baxis": { "ticks": "", "gridcolor": "#DFE8F3", "linecolor": "#A2B1C6" }, "caxis": { "ticks": "", "gridcolor": "#DFE8F3", "linecolor": "#A2B1C6" }, "bgcolor": "white" }, "colorway": [ "#636efa", "#EF553B", "#00cc96", "#ab63fa", "#19d3f3", "#e763fa", "#fecb52", "#ffa15a", "#ff6692", "#b6e880" ], "hovermode": "closest", "colorscale": { "diverging": [ [ 0, "#8e0152" ], [ 0.1, "#c51b7d" ], [ 0.2, "#de77ae" ], [ 0.3, "#f1b6da" ], [ 0.4, "#fde0ef" ], [ 0.5, "#f7f7f7" ], [ 0.6, "#e6f5d0" ], [ 0.7, "#b8e186" ], [ 0.8, "#7fbc41" ], [ 0.9, "#4d9221" ], [ 1, "#276419" ] ], "sequential": [ [ 0, "#0508b8" ], [ 0.0893854748603352, "#1910d8" ], [ 0.1787709497206704, "#3c19f0" ], [ 0.2681564245810056, "#6b1cfb" ], [ 0.3575418994413408, "#981cfd" ], [ 0.44692737430167595, "#bf1cfd" ], [ 0.5363128491620112, "#dd2bfd" ], [ 0.6256983240223464, "#f246fe" ], [ 0.7150837988826816, "#fc67fd" ], [ 0.8044692737430168, "#fe88fc" ], [ 0.8938547486033519, "#fea5fd" ], [ 0.9832402234636871, "#febefe" ], [ 1, "#fec3fe" ] ], "sequentialminus": [ [ 0, "#0508b8" ], [ 0.0893854748603352, "#1910d8" ], [ 0.1787709497206704, "#3c19f0" ], [ 0.2681564245810056, "#6b1cfb" ], [ 0.3575418994413408, "#981cfd" ], [ 0.44692737430167595, "#bf1cfd" ], [ 0.5363128491620112, "#dd2bfd" ], [ 0.6256983240223464, "#f246fe" ], [ 0.7150837988826816, "#fc67fd" ], [ 0.8044692737430168, "#fe88fc" ], [ 0.8938547486033519, "#fea5fd" ], [ 0.9832402234636871, "#febefe" ], [ 1, "#fec3fe" ] ] }, "plot_bgcolor": "white", "paper_bgcolor": "white", "shapedefaults": { "line": { "width": 0 }, "opacity": 0.4, "fillcolor": "#506784" }, "annotationdefaults": { "arrowhead": 0, "arrowcolor": "#506784", "arrowwidth": 1 } }, "themeRef": "PLOTLY_WHITE" }, "showlegend": true, "bargroupgap": 22 } }, "height": null, "width": null, "user": { "profile_url": "https://chart-studio.plotly.com/~arnold123", "avatar_url": "https://storage.googleapis.com/plotly-prod-profiles/55.jpg", "background_url": "https://storage.googleapis.com/plotly-prod-profiles/bg-7.jpg", "bio": "", "nickname": "", "website": "", "stream_tokens": null, "feature_set_id": null, "csrf_token": null, "date_joined": "2024-01-31 14:02:50", "mapbox_access_tokens": null, "has_password": null, "username": "arnold123", "email": null, "is_active": null, "readonly": null, "is_dash_creator": null, "dash_created_count": null, "is_chart_creator": null, "charts_created_count": null } }, { "creation_time": "2024-04-04T13:41:48.639680Z", "comments": { "results": [], "count": 0 }, "parented": true, "embed_url": "https://chart-studio.plotly.com/~Arun12/1.embed", "fid": "Arun12:1", "filename": "efficiency_load", "filetype": "plot", "img_url": "https://api.plotly.com/v2/files/Arun12:1/image?image_name=list-thumb", "image_urls": { "default": "https://api.plotly.com/v2/files/Arun12:1/image?image_name=default", "block-thumb": "https://storage.googleapis.com/plotly-prod-images/Arun12/1/8_MTEZRF888JPKPGGX2HFN9QJK1FWPKY.png", "list-thumb": "https://api.plotly.com/v2/files/Arun12:1/image?image_name=list-thumb" }, "api_urls": { "files": "https://api.plotly.com/v2/files/Arun12:1", "plots": "https://api.plotly.com/v2/plots/Arun12:1", "parent": "https://api.plotly.com/v2/folders/home?user=Arun12" }, "owner": "Arun12", "parent": -1, "preview": "", "referencers": [], "references": [], "title": "", "views": 1, "web_url": "https://chart-studio.plotly.com/~Arun12/1/", "world_readable": true, "date_modified": "2024-07-08T14:35:33.689Z", "stars": { "results": [], "count": 0 }, "collaborators": { "results": [], "count": 0 }, "subfolder_count": null, "refresh_interval": null, "organize_view_url": "https://chart-studio.plotly.com/~Arun12/1/", "current_user_permission": "read", "is_theme": null, "is_template": false, "autosize": true, "caption": "", "figure": { "data": [ { "meta": { "columnNames": { "x": "A", "y": "B" } }, "mode": "lines", "name": "Cascaded 2:1", "type": "scatter", "xsrc": "Arun12:0:e462f3", "ysrc": "Arun12:0:0801cf" }, { "meta": { "columnNames": { "x": "A", "y": "C" } }, "mode": "lines", "name": "4:1", "type": "scatter", "xsrc": "Arun12:0:e462f3", "ysrc": "Arun12:0:8e461a" } ], "frames": [], "layout": { "font": { "size": 17 }, "title": { "text": "Efficiency vs Load Current" }, "xaxis": { "type": "log", "range": [ -2.9999999999999996, 2.9999999999999996 ], "title": { "font": { "size": 20 }, "text": "Load current (mA)" }, "tickmode": "linear", "autorange": true, "gridcolor": "rgb(179, 179, 179)", "showticklabels": true }, "yaxis": { "type": "linear", "range": [ 29.522222222222222, 91.07777777777778 ], "title": { "font": { "size": 20 }, "text": "Efficiency (%)" }, "autorange": true, "gridcolor": "rgb(179, 179, 179)" }, "autosize": true, "template": { "data": { "bar": [ { "type": "bar", "marker": { "colorbar": { "ticks": "", "outlinewidth": 0 } } } ], "table": [ { "type": "table", "cells": { "fill": { "color": "#EBF0F8" }, "line": { "color": "white" } }, "header": { "fill": { "color": "#C8D4E3" }, "line": { "color": "white" } } } ], "carpet": [ { "type": "carpet", "aaxis": { "gridcolor": "#C8D4E3", "linecolor": "#C8D4E3", "endlinecolor": "#2a3f5f", "minorgridcolor": "#C8D4E3", "startlinecolor": "#2a3f5f" }, "baxis": { "gridcolor": "#C8D4E3", "linecolor": "#C8D4E3", "endlinecolor": "#2a3f5f", "minorgridcolor": "#C8D4E3", "startlinecolor": "#2a3f5f" } } ], "mesh3d": [ { "type": "mesh3d", "colorbar": { "ticks": "", "outlinewidth": 0 } } ], "contour": [ { "type": "contour", "colorbar": { "ticks": "", "outlinewidth": 0 }, "autocolorscale": true } ], "heatmap": [ { "type": "heatmap", "colorbar": { "ticks": "", "outlinewidth": 0 }, "autocolorscale": true } ], "scatter": [ { "type": "scatter", "marker": { "colorbar": { "ticks": "", "outlinewidth": 0 } } } ], "surface": [ { "type": "surface", "colorbar": { "ticks": "", "outlinewidth": 0 } } ], "heatmapgl": [ { "type": "heatmapgl", "colorbar": { "ticks": "", "outlinewidth": 0 } } ], "histogram": [ { "type": "histogram", "marker": { "colorbar": { "ticks": "", "outlinewidth": 0 } } } ], "parcoords": [ { "line": { "colorbar": { "ticks": "", "outlinewidth": 0 } }, "type": "parcoords" } ], "scatter3d": [ { "type": "scatter3d", "marker": { "colorbar": { "ticks": "", "outlinewidth": 0 } } } ], "scattergl": [ { "type": "scattergl", "marker": { "colorbar": { "ticks": "", "outlinewidth": 0 } } } ], "choropleth": [ { "type": "choropleth", "colorbar": { "ticks": "", "outlinewidth": 0 } } ], "scattergeo": [ { "type": "scattergeo", "marker": { "colorbar": { "ticks": "", "outlinewidth": 0 } } } ], "histogram2d": [ { "type": "histogram2d", "colorbar": { "ticks": "", "outlinewidth": 0 }, "autocolorscale": true } ], "scatterpolar": [ { "type": "scatterpolar", "marker": { "colorbar": { "ticks": "", "outlinewidth": 0 } } } ], "contourcarpet": [ { "type": "contourcarpet", "colorbar": { "ticks": "", "outlinewidth": 0 } } ], "scattercarpet": [ { "type": "scattercarpet", "marker": { "colorbar": { "ticks": "", "outlinewidth": 0 } } } ], "scattermapbox": [ { "type": "scattermapbox", "marker": { "colorbar": { "ticks": "", "outlinewidth": 0 } } } ], "scatterpolargl": [ { "type": "scatterpolargl", "marker": { "colorbar": { "ticks": "", "outlinewidth": 0 } } } ], "scatterternary": [ { "type": "scatterternary", "marker": { "colorbar": { "ticks": "", "outlinewidth": 0 } } } ], "histogram2dcontour": [ { "type": "histogram2dcontour", "colorbar": { "ticks": "", "outlinewidth": 0 }, "autocolorscale": true } ] }, "layout": { "geo": { "bgcolor": "white", "showland": true, "lakecolor": "white", "landcolor": "white", "showlakes": true, "subunitcolor": "#C8D4E3" }, "font": { "color": "#2a3f5f" }, "polar": { "bgcolor": "white", "radialaxis": { "ticks": "", "gridcolor": "#EBF0F8", "linecolor": "#EBF0F8" }, "angularaxis": { "ticks": "", "gridcolor": "#EBF0F8", "linecolor": "#EBF0F8" } }, "scene": { "xaxis": { "ticks": "", "gridcolor": "#DFE8F3", "gridwidth": 2, "linecolor": "#EBF0F8", "zerolinecolor": "#EBF0F8", "showbackground": true, "backgroundcolor": "white" }, "yaxis": { "ticks": "", "gridcolor": "#DFE8F3", "gridwidth": 2, "linecolor": "#EBF0F8", "zerolinecolor": "#EBF0F8", "showbackground": true, "backgroundcolor": "white" }, "zaxis": { "ticks": "", "gridcolor": "#DFE8F3", "gridwidth": 2, "linecolor": "#EBF0F8", "zerolinecolor": "#EBF0F8", "showbackground": true, "backgroundcolor": "white" } }, "title": { "x": 0.05 }, "xaxis": { "ticks": "", "gridcolor": "#EBF0F8", "linecolor": "#EBF0F8", "automargin": true, "zerolinecolor": "#EBF0F8", "zerolinewidth": 2 }, "yaxis": { "ticks": "", "gridcolor": "#EBF0F8", "linecolor": "#EBF0F8", "automargin": true, "zerolinecolor": "#EBF0F8", "zerolinewidth": 2 }, "ternary": { "aaxis": { "ticks": "", "gridcolor": "#DFE8F3", "linecolor": "#A2B1C6" }, "baxis": { "ticks": "", "gridcolor": "#DFE8F3", "linecolor": "#A2B1C6" }, "caxis": { "ticks": "", "gridcolor": "#DFE8F3", "linecolor": "#A2B1C6" }, "bgcolor": "white" }, "colorway": [ "#636efa", "#EF553B", "#00cc96", "#ab63fa", "#19d3f3", "#e763fa", "#fecb52", "#ffa15a", "#ff6692", "#b6e880" ], "hovermode": "closest", "colorscale": { "diverging": [ [ 0, "#8e0152" ], [ 0.1, "#c51b7d" ], [ 0.2, "#de77ae" ], [ 0.3, "#f1b6da" ], [ 0.4, "#fde0ef" ], [ 0.5, "#f7f7f7" ], [ 0.6, "#e6f5d0" ], [ 0.7, "#b8e186" ], [ 0.8, "#7fbc41" ], [ 0.9, "#4d9221" ], [ 1, "#276419" ] ], "sequential": [ [ 0, "#0508b8" ], [ 0.0893854748603352, "#1910d8" ], [ 0.1787709497206704, "#3c19f0" ], [ 0.2681564245810056, "#6b1cfb" ], [ 0.3575418994413408, "#981cfd" ], [ 0.44692737430167595, "#bf1cfd" ], [ 0.5363128491620112, "#dd2bfd" ], [ 0.6256983240223464, "#f246fe" ], [ 0.7150837988826816, "#fc67fd" ], [ 0.8044692737430168, "#fe88fc" ], [ 0.8938547486033519, "#fea5fd" ], [ 0.9832402234636871, "#febefe" ], [ 1, "#fec3fe" ] ], "sequentialminus": [ [ 0, "#0508b8" ], [ 0.0893854748603352, "#1910d8" ], [ 0.1787709497206704, "#3c19f0" ], [ 0.2681564245810056, "#6b1cfb" ], [ 0.3575418994413408, "#981cfd" ], [ 0.44692737430167595, "#bf1cfd" ], [ 0.5363128491620112, "#dd2bfd" ], [ 0.6256983240223464, "#f246fe" ], [ 0.7150837988826816, "#fc67fd" ], [ 0.8044692737430168, "#fe88fc" ], [ 0.8938547486033519, "#fea5fd" ], [ 0.9832402234636871, "#febefe" ], [ 1, "#fec3fe" ] ] }, "plot_bgcolor": "white", "paper_bgcolor": "white", "shapedefaults": { "line": { "width": 0 }, "opacity": 0.4, "fillcolor": "#506784" }, "annotationdefaults": { "arrowhead": 0, "arrowcolor": "#506784", "arrowwidth": 1 } }, "themeRef": "PLOTLY_WHITE" } } }, "height": null, "width": null, "user": { "profile_url": "https://chart-studio.plotly.com/~Arun12", "avatar_url": "https://storage.googleapis.com/plotly-prod-profiles/94.jpg", "background_url": "https://storage.googleapis.com/plotly-prod-profiles/bg-2.jpg", "bio": "", "nickname": "", "website": "", "stream_tokens": null, "feature_set_id": null, "csrf_token": null, "date_joined": "2024-04-04 13:41:18", "mapbox_access_tokens": null, "has_password": null, "username": "Arun12", "email": null, "is_active": null, "readonly": null, "is_dash_creator": null, "dash_created_count": null, "is_chart_creator": null, "charts_created_count": null } } ] }
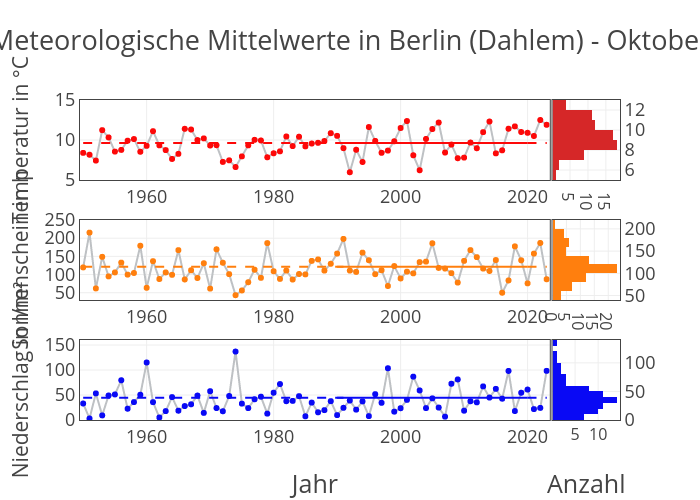