Plots List
Plots
This endpoint handles manipulation of Plotly plot files.
Reference
Authorization
Any user with or without a Plotly account may view public plots. For private plots, see authentication.
Actions
list
Listing all public plots can be done via a GET request to this endpoint.
By default, plots will be listed in order of date created. The order_by
query parameter is accepted at this endpoint. Currently, only ordering by
views is supported. It is possible to filter the plots by quality
with min_quality or max_quality as query parameter.
Example:
// GET https://api.plotly.com/v2/plots/ ---> 200

// GET https://api.plotly.com/v2/plots/?order_by=-views ---> 200

// GET https://api.plotly.com/v2/plots/?min_quality=5 ---> 200

// GET https://api.plotly.com/v2/plots/?max_quality=5 ---> 200
feed
Listing all handpicked feed plots can be done via a GET request to this endpoint. By default, plots will be listed in a random order.
Example:
// GET https://api.plotly.com/v2/plots/feed ---> 200
create
You can create new plot resources here. The only required field is 'figure'. Currently, the figure is restricted to only contain references to grid data. That is, this will fail if raw data arrays are passed in. To create and manipulate underlying grids for plots, see the grids endpoint.
Example:
// This fails because a figure field is required.
// POST https://api.plotly.com/v2/plots ---> 400 Bad Request
{}

// This fails because the figure has raw data
//POST https://api.plotly.com/v2/plots ---> 400 Bad Request
{
    "figure": {"data": [{"y": ['this', 'is', 'raw', 'data']}]}
}

// This succeeds because the figure has src keys, not raw data.
//POST https://api.plotly.com/v2/plots ---> 200 OK
{
    "figure": {"data": [{"ysrc": "sven:88:u8nd62"}]}
}
When creating a grid, you can optionally specify a source_fid to specify where a plot has come from:
- source_fid: the fid of a plot that was copied (and presumably edited) to produce this one
detail
There is a lot of meta information stored about plot files including filename, title, share_url, and content_url to name a few.
This information can only be reached with a GET to this endpoint.
Example:
// GET https://api.plotly.com/v2/plots/iheartgraphs:90
content
The contents of a plot can be downloaded via the content resource. The plot
content contains referenced grid/column data by default. If you wish to
return the raw grid/column data, the inline_data=true query must be included
in the request url. The Content-Type header will be appropriately set for the
response body.
Alternatively, you can set ?map_data=unreadable to append a mapping of
sources to data that belongs to grids which are unreadable for the
requestor. This is useful when you have read access to another users plot,
but that plot contains grid references which you don't have access to.
Examples:
// Returns referenced grid/column data
// GET https://api.plotly.com/v2/plots/iheartgraphs:90/content ---> 200 OK

// Returns full grid/column data
// GET https://api.plotly.com/v2/plots/iheartgraphs:90/content?inline_data=true ---> 200 OK

// Returns full grid/column data when requestor doesn't have permission
// to read the referenced grid.
// GET https://api.plotly.com/v2/plots/iheartgraphs:90/content?map_data=unreadable ---> 200 OK
GET /v2/plots?cursor=cj0xJnA9MjAyNC0wNC0wNCsxMCUzQTQ1JTNBMTguODU5ODk5JTJCMDAlM0EwMA%3D%3D&format=api
{ "next": "https://api.plot.ly/v2/plots?cursor=cD0yMDI0LTA0LTA0KzEwJTNBNDUlM0EyMC42NDE0ODIlMkIwMCUzQTAw&format=api", "previous": "https://api.plot.ly/v2/plots?cursor=cj0xJnA9MjAyNC0wNC0wNCsxMSUzQTQ4JTNBMjIuNzgxMDczJTJCMDAlM0EwMA%3D%3D&format=api", "results": [ { "creation_time": "2024-04-04T11:48:22.781073Z", "comments": { "results": [], "count": 0 }, "parented": true, "embed_url": "https://chart-studio.plotly.com/~arindam112/3.embed", "fid": "arindam112:3", "filename": "Plot 3", "filetype": "plot", "img_url": "https://storage.googleapis.com/plotly-prod-images/arindam112/3/9_0IIJBEG7S18RCKY2T9VJWNZIG1NMY9.png", "image_urls": { "default": "https://storage.googleapis.com/plotly-prod-images/arindam112/3/2_ZRKX4OR01E4BWTG8RL98UPQXGCJEZA.png", "block-thumb": "https://storage.googleapis.com/plotly-prod-images/arindam112/3/8_B83QJGER9Z8O06PTAROAMWOZ34MJFL.png", "list-thumb": "https://storage.googleapis.com/plotly-prod-images/arindam112/3/9_0IIJBEG7S18RCKY2T9VJWNZIG1NMY9.png" }, "api_urls": { "files": "https://api.plotly.com/v2/files/arindam112:3", "plots": "https://api.plotly.com/v2/plots/arindam112:3", "parent": "https://api.plotly.com/v2/folders/home?user=arindam112" }, "owner": "arindam112", "parent": -1, "preview": "", "referencers": [], "references": [], "title": "", "views": 2, "web_url": "https://chart-studio.plotly.com/~arindam112/3/", "world_readable": true, "date_modified": "2024-04-04T11:48:22.792Z", "stars": { "results": [], "count": 0 }, "collaborators": { "results": [], "count": 0 }, "subfolder_count": null, "refresh_interval": null, "organize_view_url": "https://chart-studio.plotly.com/~arindam112/3/", "current_user_permission": "read", "is_theme": null, "is_template": false, "autosize": true, "caption": "", "figure": { "data": [ { "line": { "shape": "spline", "width": 3 }, "meta": { "columnNames": { "x": "TIME", "y": "Terminal Voltage (kV)" } }, "mode": "lines", "name": "Terminal Voltage (kV)", "type": "scatter", "xsrc": "arindam112:2:300fdf", "ysrc": "arindam112:2:ffa619" }, { "line": { "shape": "linear", "smoothing": 0.9 }, "meta": { "columnNames": { "x": "TIME", "y": "[GVM] Tank Pressure (Bar)" } }, "mode": "lines", "name": "[GVM] Tank Pressure (Bar)", "type": "scatter", "xsrc": "arindam112:2:300fdf", "ysrc": "arindam112:2:642dd6", "yaxis": "y2", "stackgroup": null, "connectgaps": true } ], "frames": [], "layout": { "title": { "text": "Accelerator Terminal Volatage Vs Tank Pressure (SF<sub>6</sub>)" }, "xaxis": { "type": "category", "range": [ 0, 183 ], "ticks": "inside", "title": { "text": "Time (Hours)" }, "mirror": "ticks", "nticks": 10, "showline": true, "autorange": true, "gridwidth": 0, "linecolor": "rgb(15, 23, 35)", "linewidth": 2 }, "yaxis": { "range": [ 2199, 2201 ], "ticks": "inside", "title": { "text": "Accelerator Terminal Voltage (kV)" }, "mirror": "ticks", "nticks": 10, "showline": true, "autorange": true, "gridcolor": "rgb(210, 220, 234)", "gridwidth": 1, "linecolor": "rgb(15, 19, 25)", "linewidth": 2 }, "legend": { "x": 0.030635811126694716, "y": 0.9541547277936963 }, "yaxis2": { "side": "right", "type": "linear", "range": [ 5.944444444444445, 6.055555555555555 ], "ticks": "inside", "title": { "text": "SF<sub>6</sub> Tank Pressure (Bar)" }, "autorange": true, "overlaying": "y" }, "autosize": true, "colorway": [ "#636efa", "#EF553B", "#00cc96", "#ab63fa", "#19d3f3", "#e763fa", "#fecb52", "#ffa15a", "#ff6692", "#b6e880" ], "template": { "data": { "bar": [ { "type": "bar", "marker": { "colorbar": { "ticks": "", "outlinewidth": 0 } } } ], "table": [ { "type": "table", "cells": { "fill": { "color": "#EBF0F8" }, "line": { "color": "white" } }, "header": { "fill": { "color": "#C8D4E3" }, "line": { "color": "white" } } } ], "carpet": [ { "type": "carpet", "aaxis": { "gridcolor": "#C8D4E3", "linecolor": "#C8D4E3", "endlinecolor": "#2a3f5f", "minorgridcolor": "#C8D4E3", "startlinecolor": "#2a3f5f" }, "baxis": { "gridcolor": "#C8D4E3", "linecolor": "#C8D4E3", "endlinecolor": "#2a3f5f", "minorgridcolor": "#C8D4E3", "startlinecolor": "#2a3f5f" } } ], "mesh3d": [ { "type": "mesh3d", "colorbar": { "ticks": "", "outlinewidth": 0 } } ], "contour": [ { "type": "contour", "colorbar": { "ticks": "", "outlinewidth": 0 }, "autocolorscale": true } ], "heatmap": [ { "type": "heatmap", "colorbar": { "ticks": "", "outlinewidth": 0 }, "autocolorscale": true } ], "scatter": [ { "type": "scatter", "marker": { "colorbar": { "ticks": "", "outlinewidth": 0 } } } ], "surface": [ { "type": "surface", "colorbar": { "ticks": "", "outlinewidth": 0 } } ], "heatmapgl": [ { "type": "heatmapgl", "colorbar": { "ticks": "", "outlinewidth": 0 } } ], "histogram": [ { "type": "histogram", "marker": { "colorbar": { "ticks": "", "outlinewidth": 0 } } } ], "parcoords": [ { "line": { "colorbar": { "ticks": "", "outlinewidth": 0 } }, "type": "parcoords" } ], "scatter3d": [ { "type": "scatter3d", "marker": { "colorbar": { "ticks": "", "outlinewidth": 0 } } } ], "scattergl": [ { "type": "scattergl", "marker": { "colorbar": { "ticks": "", "outlinewidth": 0 } } } ], "choropleth": [ { "type": "choropleth", "colorbar": { "ticks": "", "outlinewidth": 0 } } ], "scattergeo": [ { "type": "scattergeo", "marker": { "colorbar": { "ticks": "", "outlinewidth": 0 } } } ], "histogram2d": [ { "type": "histogram2d", "colorbar": { "ticks": "", "outlinewidth": 0 }, "autocolorscale": true } ], "scatterpolar": [ { "type": "scatterpolar", "marker": { "colorbar": { "ticks": "", "outlinewidth": 0 } } } ], "contourcarpet": [ { "type": "contourcarpet", "colorbar": { "ticks": "", "outlinewidth": 0 } } ], "scattercarpet": [ { "type": "scattercarpet", "marker": { "colorbar": { "ticks": "", "outlinewidth": 0 } } } ], "scattermapbox": [ { "type": "scattermapbox", "marker": { "colorbar": { "ticks": "", "outlinewidth": 0 } } } ], "scatterpolargl": [ { "type": "scatterpolargl", "marker": { "colorbar": { "ticks": "", "outlinewidth": 0 } } } ], "scatterternary": [ { "type": "scatterternary", "marker": { "colorbar": { "ticks": "", "outlinewidth": 0 } } } ], "histogram2dcontour": [ { "type": "histogram2dcontour", "colorbar": { "ticks": "", "outlinewidth": 0 }, "autocolorscale": true } ] }, "layout": { "geo": { "bgcolor": "white", "showland": true, "lakecolor": "white", "landcolor": "white", "showlakes": true, "subunitcolor": "#C8D4E3" }, "font": { "color": "#2a3f5f" }, "polar": { "bgcolor": "white", "radialaxis": { "ticks": "", "gridcolor": "#EBF0F8", "linecolor": "#EBF0F8" }, "angularaxis": { "ticks": "", "gridcolor": "#EBF0F8", "linecolor": "#EBF0F8" } }, "scene": { "xaxis": { "ticks": "", "gridcolor": "#DFE8F3", "gridwidth": 2, "linecolor": "#EBF0F8", "zerolinecolor": "#EBF0F8", "showbackground": true, "backgroundcolor": "white" }, "yaxis": { "ticks": "", "gridcolor": "#DFE8F3", "gridwidth": 2, "linecolor": "#EBF0F8", "zerolinecolor": "#EBF0F8", "showbackground": true, "backgroundcolor": "white" }, "zaxis": { "ticks": "", "gridcolor": "#DFE8F3", "gridwidth": 2, "linecolor": "#EBF0F8", "zerolinecolor": "#EBF0F8", "showbackground": true, "backgroundcolor": "white" } }, "title": { "x": 0.05 }, "xaxis": { "ticks": "", "gridcolor": "#EBF0F8", "linecolor": "#EBF0F8", "automargin": true, "zerolinecolor": "#EBF0F8", "zerolinewidth": 2 }, "yaxis": { "ticks": "", "gridcolor": "#EBF0F8", "linecolor": "#EBF0F8", "automargin": true, "zerolinecolor": "#EBF0F8", "zerolinewidth": 2 }, "ternary": { "aaxis": { "ticks": "", "gridcolor": "#DFE8F3", "linecolor": "#A2B1C6" }, "baxis": { "ticks": "", "gridcolor": "#DFE8F3", "linecolor": "#A2B1C6" }, "caxis": { "ticks": "", "gridcolor": "#DFE8F3", "linecolor": "#A2B1C6" }, "bgcolor": "white" }, "colorway": [ "#636efa", "#EF553B", "#00cc96", "#ab63fa", "#19d3f3", "#e763fa", "#fecb52", "#ffa15a", "#ff6692", "#b6e880" ], "hovermode": "closest", "colorscale": { "diverging": [ [ 0, "#8e0152" ], [ 0.1, "#c51b7d" ], [ 0.2, "#de77ae" ], [ 0.3, "#f1b6da" ], [ 0.4, "#fde0ef" ], [ 0.5, "#f7f7f7" ], [ 0.6, "#e6f5d0" ], [ 0.7, "#b8e186" ], [ 0.8, "#7fbc41" ], [ 0.9, "#4d9221" ], [ 1, "#276419" ] ], "sequential": [ [ 0, "#0508b8" ], [ 0.0893854748603352, "#1910d8" ], [ 0.1787709497206704, "#3c19f0" ], [ 0.2681564245810056, "#6b1cfb" ], [ 0.3575418994413408, "#981cfd" ], [ 0.44692737430167595, "#bf1cfd" ], [ 0.5363128491620112, "#dd2bfd" ], [ 0.6256983240223464, "#f246fe" ], [ 0.7150837988826816, "#fc67fd" ], [ 0.8044692737430168, "#fe88fc" ], [ 0.8938547486033519, "#fea5fd" ], [ 0.9832402234636871, "#febefe" ], [ 1, "#fec3fe" ] ], "sequentialminus": [ [ 0, "#0508b8" ], [ 0.0893854748603352, "#1910d8" ], [ 0.1787709497206704, "#3c19f0" ], [ 0.2681564245810056, "#6b1cfb" ], [ 0.3575418994413408, "#981cfd" ], [ 0.44692737430167595, "#bf1cfd" ], [ 0.5363128491620112, "#dd2bfd" ], [ 0.6256983240223464, "#f246fe" ], [ 0.7150837988826816, "#fc67fd" ], [ 0.8044692737430168, "#fe88fc" ], [ 0.8938547486033519, "#fea5fd" ], [ 0.9832402234636871, "#febefe" ], [ 1, "#fec3fe" ] ] }, "plot_bgcolor": "white", "paper_bgcolor": "white", "shapedefaults": { "line": { "width": 0 }, "opacity": 0.4, "fillcolor": "#506784" }, "annotationdefaults": { "arrowhead": 0, "arrowcolor": "#506784", "arrowwidth": 1 } }, "themeRef": "PLOTLY_WHITE" } } }, "height": null, "width": null, "user": { "profile_url": "https://chart-studio.plotly.com/~arindam112", "avatar_url": "https://storage.googleapis.com/plotly-prod-profiles/44.jpg", "background_url": "https://storage.googleapis.com/plotly-prod-profiles/bg-0.jpg", "bio": "", "nickname": "", "website": "", "stream_tokens": null, "feature_set_id": null, "csrf_token": null, "date_joined": "2024-04-04 06:47:14", "mapbox_access_tokens": null, "has_password": null, "username": "arindam112", "email": null, "is_active": null, "readonly": null, "is_dash_creator": null, "dash_created_count": null, "is_chart_creator": null, "charts_created_count": null } }, { "creation_time": "2024-04-04T11:47:57.155831Z", "comments": { "results": [], "count": 0 }, "parented": true, "embed_url": "https://chart-studio.plotly.com/~ASCIVOLETTO/65.embed", "fid": "ASCIVOLETTO:65", "filename": "VC2TRADEANNUAL", "filetype": "plot", "img_url": "https://storage.googleapis.com/plotly-prod-images/ASCIVOLETTO/65/9_FMM8PRJJJ3ALIB75ETPIR3IZZ7TDE0.png", "image_urls": { "default": "https://storage.googleapis.com/plotly-prod-images/ASCIVOLETTO/65/2_1OCEA0MTNHRM7057YOLNXQCKRLOYOZ.png", "block-thumb": "https://storage.googleapis.com/plotly-prod-images/ASCIVOLETTO/65/8_274S5I4KXM166DGN12LORWVWXXN23P.png", "list-thumb": "https://storage.googleapis.com/plotly-prod-images/ASCIVOLETTO/65/9_FMM8PRJJJ3ALIB75ETPIR3IZZ7TDE0.png" }, "api_urls": { "files": "https://api.plotly.com/v2/files/ASCIVOLETTO:65", "plots": "https://api.plotly.com/v2/plots/ASCIVOLETTO:65", "parent": "https://api.plotly.com/v2/folders/home?user=ASCIVOLETTO" }, "owner": "ASCIVOLETTO", "parent": -1, "preview": "", "referencers": [], "references": [], "title": "", "views": 2, "web_url": "https://chart-studio.plotly.com/~ASCIVOLETTO/65/", "world_readable": true, "date_modified": "2024-04-04T11:47:57.167Z", "stars": { "results": [], "count": 0 }, "collaborators": { "results": [], "count": 0 }, "subfolder_count": null, "refresh_interval": null, "organize_view_url": "https://chart-studio.plotly.com/~ASCIVOLETTO/65/", "current_user_permission": "read", "is_theme": null, "is_template": false, "autosize": true, "caption": "", "figure": { "data": [ { "box": { "visible": false }, "uid": "1824af", "line": { "dash": "solid", "color": "rgb(6, 6, 6)", "shape": "linear", "width": 1 }, "meta": { "columnNames": { "x": "A", "y": "C" } }, "mode": "lines", "name": "Coef Trend", "side": "both", "type": "violin", "xsrc": "ASCIVOLETTO:64:92025b", "ysrc": "ASCIVOLETTO:64:3c36fe", "marker": { "line": { "color": "rgb(6, 6, 6)", "width": 0 }, "size": 1, "color": "rgb(6, 6, 6)", "symbol": "circle", "opacity": 1 }, "opacity": 1, "visible": true, "meanline": { "visible": false }, "spanmode": "soft", "bandwidth": 0, "boxpoints": false, "fillcolor": "rgba(2, 2, 2, 0.5)", "scalemode": "width", "showlegend": false, "orientation": "v" }, { "uid": "0cbf81", "fill": "tonexty", "line": { "color": "rgb(6, 6, 6)", "width": 1 }, "meta": { "columnNames": { "x": "A", "y": "D" } }, "mode": "lines", "type": "box", "xsrc": "ASCIVOLETTO:64:92025b", "ysrc": "ASCIVOLETTO:64:f789c5", "width": 0, "jitter": 0, "boxmean": false, "hoveron": "boxes+points", "notched": true, "opacity": 1, "boxpoints": false, "fillcolor": "rgb(230, 236, 254)", "hoverinfo": "x+y+name", "hoverlabel": { "namelength": 15 }, "notchwidth": 0.10000000000000003, "showlegend": false, "stackgroup": null, "connectgaps": true, "whiskerwidth": 0.2, "hovertemplate": "" }, { "uid": "12ee11", "meta": { "columnNames": { "x": "E", "y": "F" } }, "mode": "markers", "name": "Pre", "type": "scatter", "xsrc": "ASCIVOLETTO:64:2dee6a", "ysrc": "ASCIVOLETTO:64:5255c5", "marker": { "line": { "color": "rgb(18, 18, 18)", "width": 1 }, "size": 8, "color": "rgb(85, 160, 231)", "symbol": "circle", "maxdisplayed": 18 }, "visible": true, "boxpoints": false, "showlegend": true }, { "uid": "30e82f", "meta": { "columnNames": { "x": "G", "y": "H" } }, "mode": "markers", "name": "Post", "type": "scatter", "xsrc": "ASCIVOLETTO:64:936f9f", "ysrc": "ASCIVOLETTO:64:8e3298", "marker": { "line": { "color": "rgb(5, 5, 5)", "width": 1 }, "size": 8, "color": "rgb(53, 211, 36)" }, "visible": true, "stackgroup": null } ], "frames": [], "layout": { "font": { "size": 14, "color": "rgb(10, 9, 9)", "family": "Times New Roman" }, "title": { "x": 0.5, "font": { "size": 17 }, "text": "VC to Trade" }, "xaxis": { "side": "bottom", "type": "linear", "range": [ -3.25, 3.25 ], "title": { "text": "Years to Transaction" }, "domain": [ 0, 1 ], "nticks": 10, "showgrid": true, "showline": true, "zeroline": false, "autorange": false, "gridwidth": 1, "linewidth": 1, "showspikes": false, "rangeslider": { "range": [ 1, 10 ], "yaxis": {}, "visible": false, "autorange": true }, "zerolinecolor": "rgb(92, 129, 189)", "zerolinewidth": 13 }, "yaxis": { "side": "left", "type": "linear", "range": [ -0.7, 0.7 ], "ticks": "outside", "title": { "text": "Score" }, "domain": [ 0.0071532231178051036, 1 ], "nticks": 9, "ticklen": 4, "showline": true, "autorange": false, "tickwidth": 1 }, "boxgap": 0.88, "legend": { "x": 0.8813699856242904, "y": 0.919567286597765, "font": { "size": 12 }, "title": { "font": { "size": 14 }, "text": "Legend:" }, "valign": "top", "bgcolor": "rgb(248, 252, 255)", "xanchor": "center", "yanchor": "middle", "itemsizing": "trace", "traceorder": "normal", "bordercolor": "rgb(3, 0, 0)", "borderwidth": 1, "orientation": "v" }, "shapes": [ { "x0": 0, "x1": 0.001, "y0": 1, "y1": -1, "line": { "dash": "dot", "color": "rgb(247, 1, 1)", "width": 1 }, "type": "rect", "opacity": 1, "fillcolor": "rgb(0, 0, 0)" }, { "x0": -3, "x1": -3.0001, "y0": 0.0382775, "y1": 0.4598089, "line": { "color": "#444444", "width": 1 }, "opacity": 1, "fillcolor": "rgb(68, 68, 68)" }, { "x0": -2, "x1": -2.0001, "y0": 0.0204538, "y1": 0.4576942, "line": { "color": "#444444", "width": 1 }, "opacity": 1, "fillcolor": "rgb(68, 68, 68)" }, { "x0": -1, "x1": -1.0001, "y0": -0.057222, "y1": 0.3399534, "line": { "color": "#444444", "width": 1 }, "opacity": 1, "fillcolor": "rgb(68, 68, 68)" }, { "x0": 1, "x1": 1.0001, "y0": -0.2818087, "y1": 0.1971803, "line": { "color": "#444444", "width": 1 }, "opacity": 1, "fillcolor": "rgb(68, 68, 68)" }, { "x0": 2, "x1": 2.0001, "y0": -0.145943, "y1": 0.4270223, "line": { "color": "#444444", "width": 1 }, "opacity": 1, "fillcolor": "rgb(68, 68, 68)" }, { "x0": 3, "x1": 3.0001, "y0": -0.3326033, "y1": 0.2698974, "line": { "color": "#444444", "width": 1 }, "opacity": 1, "fillcolor": "rgb(68, 68, 68)" }, { "x0": -3.25, "x1": 3.25, "y0": -0.7, "y1": -0.6999, "line": { "color": "rgb(0, 0, 0)", "width": 2 }, "opacity": 1, "fillcolor": "rgb(8, 8, 8)" }, { "x0": -12.5, "x1": -12.5001, "y0": -0.7, "y1": 0.7, "line": { "color": "rgb(5, 5, 5)", "width": 2 }, "opacity": 1, "fillcolor": "rgb(8, 8, 8)" }, { "x0": -3.5, "x1": 3.5, "y0": 0, "y1": 0.001, "line": { "color": "rgb(3, 3, 3)", "width": 1 }, "opacity": 1, "fillcolor": "rgb(0, 0, 0)" }, { "x0": -3.25, "x1": -3.2499, "y0": -0.7, "y1": 0.7, "line": { "color": "rgb(0, 0, 0)", "width": 1 }, "opacity": 1, "fillcolor": "rgb(0, 0, 0)" } ], "boxmode": "overlay", "modebar": { "color": "rgba(98, 15, 15, 0.3)", "bgcolor": "rgba(144, 81, 81, 0.5)", "activecolor": "rgba(227, 178, 178, 0.7)", "orientation": "v" }, "autosize": true, "dragmode": "lasso", "template": { "data": { "bar": [ { "type": "bar", "marker": { "colorbar": { "ticks": "", "outlinewidth": 0 } } } ], "table": [ { "type": "table", "cells": { "fill": { "color": "#EBF0F8" }, "line": { "color": "white" } }, "header": { "fill": { "color": "#C8D4E3" }, "line": { "color": "white" } } } ], "carpet": [ { "type": "carpet", "aaxis": { "gridcolor": "#C8D4E3", "linecolor": "#C8D4E3", "endlinecolor": "#2a3f5f", "minorgridcolor": "#C8D4E3", "startlinecolor": "#2a3f5f" }, "baxis": { "gridcolor": "#C8D4E3", "linecolor": "#C8D4E3", "endlinecolor": "#2a3f5f", "minorgridcolor": "#C8D4E3", "startlinecolor": "#2a3f5f" } } ], "mesh3d": [ { "type": "mesh3d", "colorbar": { "ticks": "", "outlinewidth": 0 } } ], "contour": [ { "type": "contour", "colorbar": { "ticks": "", "outlinewidth": 0 }, "autocolorscale": true } ], "heatmap": [ { "type": "heatmap", "colorbar": { "ticks": "", "outlinewidth": 0 }, "autocolorscale": true } ], "scatter": [ { "type": "scatter", "marker": { "colorbar": { "ticks": "", "outlinewidth": 0 } } } ], "surface": [ { "type": "surface", "colorbar": { "ticks": "", "outlinewidth": 0 } } ], "heatmapgl": [ { "type": "heatmapgl", "colorbar": { "ticks": "", "outlinewidth": 0 } } ], "histogram": [ { "type": "histogram", "marker": { "colorbar": { "ticks": "", "outlinewidth": 0 } } } ], "parcoords": [ { "line": { "colorbar": { "ticks": "", "outlinewidth": 0 } }, "type": "parcoords" } ], "scatter3d": [ { "type": "scatter3d", "marker": { "colorbar": { "ticks": "", "outlinewidth": 0 } } } ], "scattergl": [ { "type": "scattergl", "marker": { "colorbar": { "ticks": "", "outlinewidth": 0 } } } ], "choropleth": [ { "type": "choropleth", "colorbar": { "ticks": "", "outlinewidth": 0 } } ], "scattergeo": [ { "type": "scattergeo", "marker": { "colorbar": { "ticks": "", "outlinewidth": 0 } } } ], "histogram2d": [ { "type": "histogram2d", "colorbar": { "ticks": "", "outlinewidth": 0 }, "autocolorscale": true } ], "scatterpolar": [ { "type": "scatterpolar", "marker": { "colorbar": { "ticks": "", "outlinewidth": 0 } } } ], "contourcarpet": [ { "type": "contourcarpet", "colorbar": { "ticks": "", "outlinewidth": 0 } } ], "scattercarpet": [ { "type": "scattercarpet", "marker": { "colorbar": { "ticks": "", "outlinewidth": 0 } } } ], "scattermapbox": [ { "type": "scattermapbox", "marker": { "colorbar": { "ticks": "", "outlinewidth": 0 } } } ], "scatterpolargl": [ { "type": "scatterpolargl", "marker": { "colorbar": { "ticks": "", "outlinewidth": 0 } } } ], "scatterternary": [ { "type": "scatterternary", "marker": { "colorbar": { "ticks": "", "outlinewidth": 0 } } } ], "histogram2dcontour": [ { "type": "histogram2dcontour", "colorbar": { "ticks": "", "outlinewidth": 0 }, "autocolorscale": true } ] }, "layout": { "geo": { "bgcolor": "white", "showland": true, "lakecolor": "white", "landcolor": "white", "showlakes": true, "subunitcolor": "#C8D4E3" }, "font": { "color": "#2a3f5f" }, "polar": { "bgcolor": "white", "radialaxis": { "ticks": "", "gridcolor": "#EBF0F8", "linecolor": "#EBF0F8" }, "angularaxis": { "ticks": "", "gridcolor": "#EBF0F8", "linecolor": "#EBF0F8" } }, "scene": { "xaxis": { "ticks": "", "gridcolor": "#DFE8F3", "gridwidth": 2, "linecolor": "#EBF0F8", "zerolinecolor": "#EBF0F8", "showbackground": true, "backgroundcolor": "white" }, "yaxis": { "ticks": "", "gridcolor": "#DFE8F3", "gridwidth": 2, "linecolor": "#EBF0F8", "zerolinecolor": "#EBF0F8", "showbackground": true, "backgroundcolor": "white" }, "zaxis": { "ticks": "", "gridcolor": "#DFE8F3", "gridwidth": 2, "linecolor": "#EBF0F8", "zerolinecolor": "#EBF0F8", "showbackground": true, "backgroundcolor": "white" } }, "title": { "x": 0.05 }, "xaxis": { "ticks": "", "gridcolor": "#EBF0F8", "linecolor": "#EBF0F8", "automargin": true, "zerolinecolor": "#EBF0F8", "zerolinewidth": 2 }, "yaxis": { "ticks": "", "gridcolor": "#EBF0F8", "linecolor": "#EBF0F8", "automargin": true, "zerolinecolor": "#EBF0F8", "zerolinewidth": 2 }, "ternary": { "aaxis": { "ticks": "", "gridcolor": "#DFE8F3", "linecolor": "#A2B1C6" }, "baxis": { "ticks": "", "gridcolor": "#DFE8F3", "linecolor": "#A2B1C6" }, "caxis": { "ticks": "", "gridcolor": "#DFE8F3", "linecolor": "#A2B1C6" }, "bgcolor": "white" }, "colorway": [ "#636efa", "#EF553B", "#00cc96", "#ab63fa", "#19d3f3", "#e763fa", "#fecb52", "#ffa15a", "#ff6692", "#b6e880" ], "hovermode": "closest", "colorscale": { "diverging": [ [ 0, "#8e0152" ], [ 0.1, "#c51b7d" ], [ 0.2, "#de77ae" ], [ 0.3, "#f1b6da" ], [ 0.4, "#fde0ef" ], [ 0.5, "#f7f7f7" ], [ 0.6, "#e6f5d0" ], [ 0.7, "#b8e186" ], [ 0.8, "#7fbc41" ], [ 0.9, "#4d9221" ], [ 1, "#276419" ] ], "sequential": [ [ 0, "#0508b8" ], [ 0.0893854748603352, "#1910d8" ], [ 0.1787709497206704, "#3c19f0" ], [ 0.2681564245810056, "#6b1cfb" ], [ 0.3575418994413408, "#981cfd" ], [ 0.44692737430167595, "#bf1cfd" ], [ 0.5363128491620112, "#dd2bfd" ], [ 0.6256983240223464, "#f246fe" ], [ 0.7150837988826816, "#fc67fd" ], [ 0.8044692737430168, "#fe88fc" ], [ 0.8938547486033519, "#fea5fd" ], [ 0.9832402234636871, "#febefe" ], [ 1, "#fec3fe" ] ], "sequentialminus": [ [ 0, "#0508b8" ], [ 0.0893854748603352, "#1910d8" ], [ 0.1787709497206704, "#3c19f0" ], [ 0.2681564245810056, "#6b1cfb" ], [ 0.3575418994413408, "#981cfd" ], [ 0.44692737430167595, "#bf1cfd" ], [ 0.5363128491620112, "#dd2bfd" ], [ 0.6256983240223464, "#f246fe" ], [ 0.7150837988826816, "#fc67fd" ], [ 0.8044692737430168, "#fe88fc" ], [ 0.8938547486033519, "#fea5fd" ], [ 0.9832402234636871, "#febefe" ], [ 1, "#fec3fe" ] ] }, "plot_bgcolor": "white", "paper_bgcolor": "white", "shapedefaults": { "line": { "width": 0 }, "opacity": 0.4, "fillcolor": "#506784" }, "annotationdefaults": { "arrowhead": 0, "arrowcolor": "#506784", "arrowwidth": 1 } }, "themeRef": "PLOTLY_WHITE" }, "hovermode": "x", "violingap": 0.88, "colorscale": { "sequential": [ [ 0, "#00224e" ], [ 0.1111111111111111, "#123570" ], [ 0.2222222222222222, "#3b496c" ], [ 0.3333333333333333, "#575d6d" ], [ 0.4444444444444444, "#707173" ], [ 0.5555555555555556, "#8a8678" ], [ 0.6666666666666666, "#a59c74" ], [ 0.7777777777777778, "#c3b369" ], [ 0.8888888888888888, "#e1cc55" ], [ 1, "#fee838" ] ] }, "hoverlabel": { "font": { "size": 14 } }, "showlegend": true, "boxgroupgap": 0.12, "uniformtext": { "mode": false }, "plot_bgcolor": "rgb(255, 255, 255)", "paper_bgcolor": "rgb(255, 255, 255)", "violingroupgap": 0.12 } }, "height": null, "width": null, "user": { "profile_url": "https://chart-studio.plotly.com/~ASCIVOLETTO", "avatar_url": "https://storage.googleapis.com/plotly-prod-profiles/96.jpg", "background_url": "https://storage.googleapis.com/plotly-prod-profiles/bg-7.jpg", "bio": "", "nickname": "", "website": "", "stream_tokens": null, "feature_set_id": null, "csrf_token": null, "date_joined": "2023-03-30 13:28:23", "mapbox_access_tokens": null, "has_password": null, "username": "ASCIVOLETTO", "email": null, "is_active": null, "readonly": null, "is_dash_creator": null, "dash_created_count": null, "is_chart_creator": null, "charts_created_count": null } }, { "creation_time": "2024-04-04T11:45:22.770834Z", "comments": { "results": [], "count": 0 }, "parented": true, "embed_url": "https://chart-studio.plotly.com/~ASCIVOLETTO/63.embed", "fid": "ASCIVOLETTO:63", "filename": "VC2PEANNUAL", "filetype": "plot", "img_url": "https://storage.googleapis.com/plotly-prod-images/ASCIVOLETTO/63/9_6MEFKVR9YAZ85OTGANY3IMJM4FA7OV.png", "image_urls": { "default": "https://storage.googleapis.com/plotly-prod-images/ASCIVOLETTO/63/2_I4QWG3HTC2GOTOQICV83H3I01CUMNT.png", "block-thumb": "https://storage.googleapis.com/plotly-prod-images/ASCIVOLETTO/63/8_YRFR45K2BXE265H2KX2567JSVPTY9P.png", "list-thumb": "https://storage.googleapis.com/plotly-prod-images/ASCIVOLETTO/63/9_6MEFKVR9YAZ85OTGANY3IMJM4FA7OV.png" }, "api_urls": { "files": "https://api.plotly.com/v2/files/ASCIVOLETTO:63", "plots": "https://api.plotly.com/v2/plots/ASCIVOLETTO:63", "parent": "https://api.plotly.com/v2/folders/home?user=ASCIVOLETTO" }, "owner": "ASCIVOLETTO", "parent": -1, "preview": "", "referencers": [], "references": [], "title": "", "views": 2, "web_url": "https://chart-studio.plotly.com/~ASCIVOLETTO/63/", "world_readable": true, "date_modified": "2024-04-04T11:45:22.781Z", "stars": { "results": [], "count": 0 }, "collaborators": { "results": [], "count": 0 }, "subfolder_count": null, "refresh_interval": null, "organize_view_url": "https://chart-studio.plotly.com/~ASCIVOLETTO/63/", "current_user_permission": "read", "is_theme": null, "is_template": false, "autosize": true, "caption": "", "figure": { "data": [ { "box": { "visible": false }, "uid": "1824af", "line": { "dash": "solid", "color": "rgb(6, 6, 6)", "shape": "linear", "width": 1 }, "meta": { "columnNames": { "x": "A", "y": "C" } }, "mode": "lines", "name": "Coef Trend", "side": "both", "type": "violin", "xsrc": "ASCIVOLETTO:62:57a171", "ysrc": "ASCIVOLETTO:62:b40187", "marker": { "line": { "color": "rgb(6, 6, 6)", "width": 0 }, "size": 1, "color": "rgb(6, 6, 6)", "symbol": "circle", "opacity": 1 }, "opacity": 1, "visible": true, "meanline": { "visible": false }, "spanmode": "soft", "bandwidth": 0, "boxpoints": false, "fillcolor": "rgba(2, 2, 2, 0.5)", "scalemode": "width", "showlegend": false, "orientation": "v" }, { "uid": "0cbf81", "fill": "tonexty", "line": { "color": "rgb(6, 6, 6)", "width": 1 }, "meta": { "columnNames": { "x": "A", "y": "D" } }, "mode": "lines", "type": "box", "xsrc": "ASCIVOLETTO:62:57a171", "ysrc": "ASCIVOLETTO:62:035039", "width": 0, "jitter": 0, "boxmean": false, "hoveron": "boxes+points", "notched": true, "opacity": 1, "boxpoints": false, "fillcolor": "rgb(230, 236, 254)", "hoverinfo": "x+y+name", "hoverlabel": { "namelength": 15 }, "notchwidth": 0.10000000000000003, "showlegend": false, "stackgroup": null, "connectgaps": true, "whiskerwidth": 0.2, "hovertemplate": "" }, { "uid": "12ee11", "meta": { "columnNames": { "x": "E", "y": "F" } }, "mode": "markers", "name": "Pre", "type": "scatter", "xsrc": "ASCIVOLETTO:62:20fb56", "ysrc": "ASCIVOLETTO:62:dd8096", "marker": { "line": { "color": "rgb(18, 18, 18)", "width": 1 }, "size": 8, "color": "rgb(85, 160, 231)", "symbol": "circle", "maxdisplayed": 18 }, "visible": true, "boxpoints": false, "showlegend": true }, { "uid": "30e82f", "meta": { "columnNames": { "x": "G", "y": "H" } }, "mode": "markers", "name": "Post", "type": "scatter", "xsrc": "ASCIVOLETTO:62:25f378", "ysrc": "ASCIVOLETTO:62:52c9d1", "marker": { "line": { "color": "rgb(5, 5, 5)", "width": 1 }, "size": 8, "color": "rgb(53, 211, 36)" }, "visible": true, "stackgroup": null } ], "frames": [], "layout": { "font": { "size": 14, "color": "rgb(10, 9, 9)", "family": "Times New Roman" }, "title": { "x": 0.5, "font": { "size": 17 }, "text": "VC to PE" }, "xaxis": { "side": "bottom", "type": "linear", "range": [ -3.25, 3.25 ], "title": { "text": "Years to Transaction" }, "domain": [ 0, 1 ], "nticks": 10, "showgrid": true, "showline": true, "zeroline": false, "autorange": false, "gridwidth": 1, "linewidth": 1, "showspikes": false, "rangeslider": { "range": [ 1, 10 ], "yaxis": {}, "visible": false, "autorange": true }, "zerolinecolor": "rgb(92, 129, 189)", "zerolinewidth": 13 }, "yaxis": { "side": "left", "type": "linear", "range": [ -0.7, 0.7 ], "ticks": "outside", "title": { "text": "Score" }, "domain": [ 0.0071532231178051036, 1 ], "nticks": 9, "ticklen": 4, "showline": true, "autorange": false, "tickwidth": 1 }, "boxgap": 0.88, "legend": { "x": 0.8813699856242904, "y": 0.919567286597765, "font": { "size": 12 }, "title": { "font": { "size": 14 }, "text": "Legend:" }, "valign": "top", "bgcolor": "rgb(248, 252, 255)", "xanchor": "center", "yanchor": "middle", "itemsizing": "trace", "traceorder": "normal", "bordercolor": "rgb(3, 0, 0)", "borderwidth": 1, "orientation": "v" }, "shapes": [ { "x0": 0, "x1": 0.001, "y0": 1, "y1": -1, "line": { "dash": "dot", "color": "rgb(247, 1, 1)", "width": 1 }, "type": "rect", "opacity": 1, "fillcolor": "rgb(0, 0, 0)" }, { "x0": -3, "x1": -3.0001, "y0": 0.1677572, "y1": 0.590294, "line": { "color": "#444444", "width": 1 }, "opacity": 1, "fillcolor": "rgb(68, 68, 68)" }, { "x0": -2, "x1": -2.0001, "y0": 0.0466017, "y1": 0.4833607, "line": { "color": "#444444", "width": 1 }, "opacity": 1, "fillcolor": "rgb(68, 68, 68)" }, { "x0": -1, "x1": -1.0001, "y0": -0.0818638, "y1": 0.154642, "line": { "color": "#444444", "width": 1 }, "opacity": 1, "fillcolor": "rgb(68, 68, 68)" }, { "x0": 1, "x1": 1.0001, "y0": -0.4353971, "y1": -0.1256572, "line": { "color": "#444444", "width": 1 }, "opacity": 1, "fillcolor": "rgb(68, 68, 68)" }, { "x0": 2, "x1": 2.0001, "y0": -0.2177656, "y1": 0.0881246, "line": { "color": "#444444", "width": 1 }, "opacity": 1, "fillcolor": "rgb(68, 68, 68)" }, { "x0": 3, "x1": 3.0001, "y0": -0.117052, "y1": 0.1334605, "line": { "color": "#444444", "width": 1 }, "opacity": 1, "fillcolor": "rgb(68, 68, 68)" }, { "x0": -3.25, "x1": 3.25, "y0": -0.7, "y1": -0.6999, "line": { "color": "rgb(0, 0, 0)", "width": 2 }, "opacity": 1, "fillcolor": "rgb(8, 8, 8)" }, { "x0": -12.5, "x1": -12.5001, "y0": -0.7, "y1": 0.7, "line": { "color": "rgb(5, 5, 5)", "width": 2 }, "opacity": 1, "fillcolor": "rgb(8, 8, 8)" }, { "x0": -3.5, "x1": 3.5, "y0": 0, "y1": 0.001, "line": { "color": "rgb(3, 3, 3)", "width": 1 }, "opacity": 1, "fillcolor": "rgb(0, 0, 0)" }, { "x0": -3.25, "x1": -3.2499, "y0": -0.7, "y1": 0.7, "line": { "color": "rgb(0, 0, 0)", "width": 1 }, "opacity": 1, "fillcolor": "rgb(0, 0, 0)" } ], "boxmode": "overlay", "modebar": { "color": "rgba(98, 15, 15, 0.3)", "bgcolor": "rgba(144, 81, 81, 0.5)", "activecolor": "rgba(227, 178, 178, 0.7)", "orientation": "v" }, "autosize": true, "dragmode": "lasso", "template": { "data": { "bar": [ { "type": "bar", "marker": { "colorbar": { "ticks": "", "outlinewidth": 0 } } } ], "table": [ { "type": "table", "cells": { "fill": { "color": "#EBF0F8" }, "line": { "color": "white" } }, "header": { "fill": { "color": "#C8D4E3" }, "line": { "color": "white" } } } ], "carpet": [ { "type": "carpet", "aaxis": { "gridcolor": "#C8D4E3", "linecolor": "#C8D4E3", "endlinecolor": "#2a3f5f", "minorgridcolor": "#C8D4E3", "startlinecolor": "#2a3f5f" }, "baxis": { "gridcolor": "#C8D4E3", "linecolor": "#C8D4E3", "endlinecolor": "#2a3f5f", "minorgridcolor": "#C8D4E3", "startlinecolor": "#2a3f5f" } } ], "mesh3d": [ { "type": "mesh3d", "colorbar": { "ticks": "", "outlinewidth": 0 } } ], "contour": [ { "type": "contour", "colorbar": { "ticks": "", "outlinewidth": 0 }, "autocolorscale": true } ], "heatmap": [ { "type": "heatmap", "colorbar": { "ticks": "", "outlinewidth": 0 }, "autocolorscale": true } ], "scatter": [ { "type": "scatter", "marker": { "colorbar": { "ticks": "", "outlinewidth": 0 } } } ], "surface": [ { "type": "surface", "colorbar": { "ticks": "", "outlinewidth": 0 } } ], "heatmapgl": [ { "type": "heatmapgl", "colorbar": { "ticks": "", "outlinewidth": 0 } } ], "histogram": [ { "type": "histogram", "marker": { "colorbar": { "ticks": "", "outlinewidth": 0 } } } ], "parcoords": [ { "line": { "colorbar": { "ticks": "", "outlinewidth": 0 } }, "type": "parcoords" } ], "scatter3d": [ { "type": "scatter3d", "marker": { "colorbar": { "ticks": "", "outlinewidth": 0 } } } ], "scattergl": [ { "type": "scattergl", "marker": { "colorbar": { "ticks": "", "outlinewidth": 0 } } } ], "choropleth": [ { "type": "choropleth", "colorbar": { "ticks": "", "outlinewidth": 0 } } ], "scattergeo": [ { "type": "scattergeo", "marker": { "colorbar": { "ticks": "", "outlinewidth": 0 } } } ], "histogram2d": [ { "type": "histogram2d", "colorbar": { "ticks": "", "outlinewidth": 0 }, "autocolorscale": true } ], "scatterpolar": [ { "type": "scatterpolar", "marker": { "colorbar": { "ticks": "", "outlinewidth": 0 } } } ], "contourcarpet": [ { "type": "contourcarpet", "colorbar": { "ticks": "", "outlinewidth": 0 } } ], "scattercarpet": [ { "type": "scattercarpet", "marker": { "colorbar": { "ticks": "", "outlinewidth": 0 } } } ], "scattermapbox": [ { "type": "scattermapbox", "marker": { "colorbar": { "ticks": "", "outlinewidth": 0 } } } ], "scatterpolargl": [ { "type": "scatterpolargl", "marker": { "colorbar": { "ticks": "", "outlinewidth": 0 } } } ], "scatterternary": [ { "type": "scatterternary", "marker": { "colorbar": { "ticks": "", "outlinewidth": 0 } } } ], "histogram2dcontour": [ { "type": "histogram2dcontour", "colorbar": { "ticks": "", "outlinewidth": 0 }, "autocolorscale": true } ] }, "layout": { "geo": { "bgcolor": "white", "showland": true, "lakecolor": "white", "landcolor": "white", "showlakes": true, "subunitcolor": "#C8D4E3" }, "font": { "color": "#2a3f5f" }, "polar": { "bgcolor": "white", "radialaxis": { "ticks": "", "gridcolor": "#EBF0F8", "linecolor": "#EBF0F8" }, "angularaxis": { "ticks": "", "gridcolor": "#EBF0F8", "linecolor": "#EBF0F8" } }, "scene": { "xaxis": { "ticks": "", "gridcolor": "#DFE8F3", "gridwidth": 2, "linecolor": "#EBF0F8", "zerolinecolor": "#EBF0F8", "showbackground": true, "backgroundcolor": "white" }, "yaxis": { "ticks": "", "gridcolor": "#DFE8F3", "gridwidth": 2, "linecolor": "#EBF0F8", "zerolinecolor": "#EBF0F8", "showbackground": true, "backgroundcolor": "white" }, "zaxis": { "ticks": "", "gridcolor": "#DFE8F3", "gridwidth": 2, "linecolor": "#EBF0F8", "zerolinecolor": "#EBF0F8", "showbackground": true, "backgroundcolor": "white" } }, "title": { "x": 0.05 }, "xaxis": { "ticks": "", "gridcolor": "#EBF0F8", "linecolor": "#EBF0F8", "automargin": true, "zerolinecolor": "#EBF0F8", "zerolinewidth": 2 }, "yaxis": { "ticks": "", "gridcolor": "#EBF0F8", "linecolor": "#EBF0F8", "automargin": true, "zerolinecolor": "#EBF0F8", "zerolinewidth": 2 }, "ternary": { "aaxis": { "ticks": "", "gridcolor": "#DFE8F3", "linecolor": "#A2B1C6" }, "baxis": { "ticks": "", "gridcolor": "#DFE8F3", "linecolor": "#A2B1C6" }, "caxis": { "ticks": "", "gridcolor": "#DFE8F3", "linecolor": "#A2B1C6" }, "bgcolor": "white" }, "colorway": [ "#636efa", "#EF553B", "#00cc96", "#ab63fa", "#19d3f3", "#e763fa", "#fecb52", "#ffa15a", "#ff6692", "#b6e880" ], "hovermode": "closest", "colorscale": { "diverging": [ [ 0, "#8e0152" ], [ 0.1, "#c51b7d" ], [ 0.2, "#de77ae" ], [ 0.3, "#f1b6da" ], [ 0.4, "#fde0ef" ], [ 0.5, "#f7f7f7" ], [ 0.6, "#e6f5d0" ], [ 0.7, "#b8e186" ], [ 0.8, "#7fbc41" ], [ 0.9, "#4d9221" ], [ 1, "#276419" ] ], "sequential": [ [ 0, "#0508b8" ], [ 0.0893854748603352, "#1910d8" ], [ 0.1787709497206704, "#3c19f0" ], [ 0.2681564245810056, "#6b1cfb" ], [ 0.3575418994413408, "#981cfd" ], [ 0.44692737430167595, "#bf1cfd" ], [ 0.5363128491620112, "#dd2bfd" ], [ 0.6256983240223464, "#f246fe" ], [ 0.7150837988826816, "#fc67fd" ], [ 0.8044692737430168, "#fe88fc" ], [ 0.8938547486033519, "#fea5fd" ], [ 0.9832402234636871, "#febefe" ], [ 1, "#fec3fe" ] ], "sequentialminus": [ [ 0, "#0508b8" ], [ 0.0893854748603352, "#1910d8" ], [ 0.1787709497206704, "#3c19f0" ], [ 0.2681564245810056, "#6b1cfb" ], [ 0.3575418994413408, "#981cfd" ], [ 0.44692737430167595, "#bf1cfd" ], [ 0.5363128491620112, "#dd2bfd" ], [ 0.6256983240223464, "#f246fe" ], [ 0.7150837988826816, "#fc67fd" ], [ 0.8044692737430168, "#fe88fc" ], [ 0.8938547486033519, "#fea5fd" ], [ 0.9832402234636871, "#febefe" ], [ 1, "#fec3fe" ] ] }, "plot_bgcolor": "white", "paper_bgcolor": "white", "shapedefaults": { "line": { "width": 0 }, "opacity": 0.4, "fillcolor": "#506784" }, "annotationdefaults": { "arrowhead": 0, "arrowcolor": "#506784", "arrowwidth": 1 } }, "themeRef": "PLOTLY_WHITE" }, "hovermode": "x", "violingap": 0.88, "colorscale": { "sequential": [ [ 0, "#00224e" ], [ 0.1111111111111111, "#123570" ], [ 0.2222222222222222, "#3b496c" ], [ 0.3333333333333333, "#575d6d" ], [ 0.4444444444444444, "#707173" ], [ 0.5555555555555556, "#8a8678" ], [ 0.6666666666666666, "#a59c74" ], [ 0.7777777777777778, "#c3b369" ], [ 0.8888888888888888, "#e1cc55" ], [ 1, "#fee838" ] ] }, "hoverlabel": { "font": { "size": 14 } }, "showlegend": true, "boxgroupgap": 0.12, "uniformtext": { "mode": false }, "plot_bgcolor": "rgb(255, 255, 255)", "paper_bgcolor": "rgb(255, 255, 255)", "violingroupgap": 0.12 } }, "height": null, "width": null, "user": { "profile_url": "https://chart-studio.plotly.com/~ASCIVOLETTO", "avatar_url": "https://storage.googleapis.com/plotly-prod-profiles/96.jpg", "background_url": "https://storage.googleapis.com/plotly-prod-profiles/bg-7.jpg", "bio": "", "nickname": "", "website": "", "stream_tokens": null, "feature_set_id": null, "csrf_token": null, "date_joined": "2023-03-30 13:28:23", "mapbox_access_tokens": null, "has_password": null, "username": "ASCIVOLETTO", "email": null, "is_active": null, "readonly": null, "is_dash_creator": null, "dash_created_count": null, "is_chart_creator": null, "charts_created_count": null } }, { "creation_time": "2024-04-04T11:41:46.105508Z", "comments": { "results": [], "count": 0 }, "parented": true, "embed_url": "https://chart-studio.plotly.com/~DaAb/1.embed", "fid": "DaAb:1", "filename": "Metacells", "filetype": "plot", "img_url": "https://storage.googleapis.com/plotly-prod-images/DaAb/1/9_IASURVK9TZDOMLV64XP46XAOERRN10.png", "image_urls": { "default": "https://storage.googleapis.com/plotly-prod-images/DaAb/1/2_QMZH1IG2Y3DAUOSTOC95OJKN6BPO23.png", "block-thumb": "https://storage.googleapis.com/plotly-prod-images/DaAb/1/8_GXA6A3I4QGTJ22NALYF08WQ0KMT9SI.png", "list-thumb": "https://storage.googleapis.com/plotly-prod-images/DaAb/1/9_IASURVK9TZDOMLV64XP46XAOERRN10.png" }, "api_urls": { "files": "https://api.plotly.com/v2/files/DaAb:1", "plots": "https://api.plotly.com/v2/plots/DaAb:1", "parent": "https://api.plotly.com/v2/folders/home?user=DaAb" }, "owner": "DaAb", "parent": -1, "preview": "", "referencers": [], "references": [], "title": "", "views": 2, "web_url": "https://chart-studio.plotly.com/~DaAb/1/", "world_readable": true, "date_modified": "2024-04-04T11:59:16.234Z", "stars": { "results": [], "count": 0 }, "collaborators": { "results": [], "count": 0 }, "subfolder_count": null, "refresh_interval": null, "organize_view_url": "https://chart-studio.plotly.com/~DaAb/1/", "current_user_permission": "read", "is_theme": null, "is_template": false, "autosize": true, "caption": "", "figure": { "data": [ { "meta": { "columnNames": { "x": "0", "y": "1", "z": "2", "marker": { "color": "Annotation_color" } } }, "mode": "markers", "type": "scatter3d", "xsrc": "DaAb:0:c2c14c", "ysrc": "DaAb:0:4cdcb0", "zsrc": "DaAb:0:82437f", "marker": { "meta": { "columnNames": { "color": "Annotation_color" } }, "size": 3, "colorsrc": "DaAb:0:542124" } } ], "frames": [], "layout": { "scene": { "camera": { "up": { "x": 0, "y": 0, "z": 1 }, "eye": { "x": 1.6271200875158511, "y": -0.3486654811922436, "z": 1.3850677250688468 }, "center": { "x": 0, "y": 0, "z": 0 }, "projection": { "type": "perspective" } }, "aspectmode": "auto", "aspectratio": { "x": 1.285088521544768, "y": 1.0958943626581268, "z": 0.7100652556665304 } }, "title": { "text": "Metacells 3D UMAP" }, "xaxis": { "type": "linear", "range": [ -7.109212253357438, 15.619227253357439 ], "autorange": true }, "yaxis": { "type": "linear", "range": [ -3.8937960689265534, 15.690566868926553 ], "autorange": true }, "autosize": true, "template": { "data": { "bar": [ { "type": "bar", "marker": { "colorbar": { "ticks": "", "outlinewidth": 0 } } } ], "table": [ { "type": "table", "cells": { "fill": { "color": "#EBF0F8" }, "line": { "color": "white" } }, "header": { "fill": { "color": "#C8D4E3" }, "line": { "color": "white" } } } ], "carpet": [ { "type": "carpet", "aaxis": { "gridcolor": "#C8D4E3", "linecolor": "#C8D4E3", "endlinecolor": "#2a3f5f", "minorgridcolor": "#C8D4E3", "startlinecolor": "#2a3f5f" }, "baxis": { "gridcolor": "#C8D4E3", "linecolor": "#C8D4E3", "endlinecolor": "#2a3f5f", "minorgridcolor": "#C8D4E3", "startlinecolor": "#2a3f5f" } } ], "mesh3d": [ { "type": "mesh3d", "colorbar": { "ticks": "", "outlinewidth": 0 } } ], "contour": [ { "type": "contour", "colorbar": { "ticks": "", "outlinewidth": 0 }, "autocolorscale": true } ], "heatmap": [ { "type": "heatmap", "colorbar": { "ticks": "", "outlinewidth": 0 }, "autocolorscale": true } ], "scatter": [ { "type": "scatter", "marker": { "colorbar": { "ticks": "", "outlinewidth": 0 } } } ], "surface": [ { "type": "surface", "colorbar": { "ticks": "", "outlinewidth": 0 } } ], "heatmapgl": [ { "type": "heatmapgl", "colorbar": { "ticks": "", "outlinewidth": 0 } } ], "histogram": [ { "type": "histogram", "marker": { "colorbar": { "ticks": "", "outlinewidth": 0 } } } ], "parcoords": [ { "line": { "colorbar": { "ticks": "", "outlinewidth": 0 } }, "type": "parcoords" } ], "scatter3d": [ { "type": "scatter3d", "marker": { "colorbar": { "ticks": "", "outlinewidth": 0 } } } ], "scattergl": [ { "type": "scattergl", "marker": { "colorbar": { "ticks": "", "outlinewidth": 0 } } } ], "choropleth": [ { "type": "choropleth", "colorbar": { "ticks": "", "outlinewidth": 0 } } ], "scattergeo": [ { "type": "scattergeo", "marker": { "colorbar": { "ticks": "", "outlinewidth": 0 } } } ], "histogram2d": [ { "type": "histogram2d", "colorbar": { "ticks": "", "outlinewidth": 0 }, "autocolorscale": true } ], "scatterpolar": [ { "type": "scatterpolar", "marker": { "colorbar": { "ticks": "", "outlinewidth": 0 } } } ], "contourcarpet": [ { "type": "contourcarpet", "colorbar": { "ticks": "", "outlinewidth": 0 } } ], "scattercarpet": [ { "type": "scattercarpet", "marker": { "colorbar": { "ticks": "", "outlinewidth": 0 } } } ], "scattermapbox": [ { "type": "scattermapbox", "marker": { "colorbar": { "ticks": "", "outlinewidth": 0 } } } ], "scatterpolargl": [ { "type": "scatterpolargl", "marker": { "colorbar": { "ticks": "", "outlinewidth": 0 } } } ], "scatterternary": [ { "type": "scatterternary", "marker": { "colorbar": { "ticks": "", "outlinewidth": 0 } } } ], "histogram2dcontour": [ { "type": "histogram2dcontour", "colorbar": { "ticks": "", "outlinewidth": 0 }, "autocolorscale": true } ] }, "layout": { "geo": { "bgcolor": "white", "showland": true, "lakecolor": "white", "landcolor": "white", "showlakes": true, "subunitcolor": "#C8D4E3" }, "font": { "color": "#2a3f5f" }, "polar": { "bgcolor": "white", "radialaxis": { "ticks": "", "gridcolor": "#EBF0F8", "linecolor": "#EBF0F8" }, "angularaxis": { "ticks": "", "gridcolor": "#EBF0F8", "linecolor": "#EBF0F8" } }, "scene": { "xaxis": { "ticks": "", "gridcolor": "#DFE8F3", "gridwidth": 2, "linecolor": "#EBF0F8", "zerolinecolor": "#EBF0F8", "showbackground": true, "backgroundcolor": "white" }, "yaxis": { "ticks": "", "gridcolor": "#DFE8F3", "gridwidth": 2, "linecolor": "#EBF0F8", "zerolinecolor": "#EBF0F8", "showbackground": true, "backgroundcolor": "white" }, "zaxis": { "ticks": "", "gridcolor": "#DFE8F3", "gridwidth": 2, "linecolor": "#EBF0F8", "zerolinecolor": "#EBF0F8", "showbackground": true, "backgroundcolor": "white" } }, "title": { "x": 0.05 }, "xaxis": { "ticks": "", "gridcolor": "#EBF0F8", "linecolor": "#EBF0F8", "automargin": true, "zerolinecolor": "#EBF0F8", "zerolinewidth": 2 }, "yaxis": { "ticks": "", "gridcolor": "#EBF0F8", "linecolor": "#EBF0F8", "automargin": true, "zerolinecolor": "#EBF0F8", "zerolinewidth": 2 }, "ternary": { "aaxis": { "ticks": "", "gridcolor": "#DFE8F3", "linecolor": "#A2B1C6" }, "baxis": { "ticks": "", "gridcolor": "#DFE8F3", "linecolor": "#A2B1C6" }, "caxis": { "ticks": "", "gridcolor": "#DFE8F3", "linecolor": "#A2B1C6" }, "bgcolor": "white" }, "colorway": [ "#636efa", "#EF553B", "#00cc96", "#ab63fa", "#19d3f3", "#e763fa", "#fecb52", "#ffa15a", "#ff6692", "#b6e880" ], "hovermode": "closest", "colorscale": { "diverging": [ [ 0, "#8e0152" ], [ 0.1, "#c51b7d" ], [ 0.2, "#de77ae" ], [ 0.3, "#f1b6da" ], [ 0.4, "#fde0ef" ], [ 0.5, "#f7f7f7" ], [ 0.6, "#e6f5d0" ], [ 0.7, "#b8e186" ], [ 0.8, "#7fbc41" ], [ 0.9, "#4d9221" ], [ 1, "#276419" ] ], "sequential": [ [ 0, "#0508b8" ], [ 0.0893854748603352, "#1910d8" ], [ 0.1787709497206704, "#3c19f0" ], [ 0.2681564245810056, "#6b1cfb" ], [ 0.3575418994413408, "#981cfd" ], [ 0.44692737430167595, "#bf1cfd" ], [ 0.5363128491620112, "#dd2bfd" ], [ 0.6256983240223464, "#f246fe" ], [ 0.7150837988826816, "#fc67fd" ], [ 0.8044692737430168, "#fe88fc" ], [ 0.8938547486033519, "#fea5fd" ], [ 0.9832402234636871, "#febefe" ], [ 1, "#fec3fe" ] ], "sequentialminus": [ [ 0, "#0508b8" ], [ 0.0893854748603352, "#1910d8" ], [ 0.1787709497206704, "#3c19f0" ], [ 0.2681564245810056, "#6b1cfb" ], [ 0.3575418994413408, "#981cfd" ], [ 0.44692737430167595, "#bf1cfd" ], [ 0.5363128491620112, "#dd2bfd" ], [ 0.6256983240223464, "#f246fe" ], [ 0.7150837988826816, "#fc67fd" ], [ 0.8044692737430168, "#fe88fc" ], [ 0.8938547486033519, "#fea5fd" ], [ 0.9832402234636871, "#febefe" ], [ 1, "#fec3fe" ] ] }, "plot_bgcolor": "white", "paper_bgcolor": "white", "shapedefaults": { "line": { "width": 0 }, "opacity": 0.4, "fillcolor": "#506784" }, "annotationdefaults": { "arrowhead": 0, "arrowcolor": "#506784", "arrowwidth": 1 } }, "themeRef": "PLOTLY_WHITE" }, "showlegend": true } }, "height": null, "width": null, "user": { "profile_url": "https://chart-studio.plotly.com/~DaAb", "avatar_url": "https://storage.googleapis.com/plotly-prod-profiles/20.jpg", "background_url": "https://storage.googleapis.com/plotly-prod-profiles/bg-12.jpg", "bio": "", "nickname": "", "website": "", "stream_tokens": null, "feature_set_id": null, "csrf_token": null, "date_joined": "2024-04-04 11:41:16", "mapbox_access_tokens": null, "has_password": null, "username": "DaAb", "email": null, "is_active": null, "readonly": null, "is_dash_creator": null, "dash_created_count": null, "is_chart_creator": null, "charts_created_count": null } }, { "creation_time": "2024-04-04T11:40:49.932751Z", "comments": { "results": [], "count": 0 }, "parented": true, "embed_url": "https://chart-studio.plotly.com/~ASCIVOLETTO/61.embed", "fid": "ASCIVOLETTO:61", "filename": "VC2IPOANNUAL", "filetype": "plot", "img_url": "https://storage.googleapis.com/plotly-prod-images/ASCIVOLETTO/61/9_BEJ0BOH0LOM99FJ892QCHO6O7AL2RS.png", "image_urls": { "default": "https://storage.googleapis.com/plotly-prod-images/ASCIVOLETTO/61/2_0IJDS3QH6OHHRQPJHXIIEL1Z3O53BO.png", "block-thumb": "https://storage.googleapis.com/plotly-prod-images/ASCIVOLETTO/61/8_8SU0LGZD0O4C7RJ3XMJOTFF7L4J7EK.png", "list-thumb": "https://storage.googleapis.com/plotly-prod-images/ASCIVOLETTO/61/9_BEJ0BOH0LOM99FJ892QCHO6O7AL2RS.png" }, "api_urls": { "files": "https://api.plotly.com/v2/files/ASCIVOLETTO:61", "plots": "https://api.plotly.com/v2/plots/ASCIVOLETTO:61", "parent": "https://api.plotly.com/v2/folders/home?user=ASCIVOLETTO" }, "owner": "ASCIVOLETTO", "parent": -1, "preview": "", "referencers": [], "references": [], "title": "", "views": 1, "web_url": "https://chart-studio.plotly.com/~ASCIVOLETTO/61/", "world_readable": true, "date_modified": "2024-04-04T11:40:49.943Z", "stars": { "results": [], "count": 0 }, "collaborators": { "results": [], "count": 0 }, "subfolder_count": null, "refresh_interval": null, "organize_view_url": "https://chart-studio.plotly.com/~ASCIVOLETTO/61/", "current_user_permission": "read", "is_theme": null, "is_template": false, "autosize": true, "caption": "", "figure": { "data": [ { "box": { "visible": false }, "uid": "1824af", "line": { "dash": "solid", "color": "rgb(6, 6, 6)", "shape": "linear", "width": 1 }, "meta": { "columnNames": { "x": "A", "y": "C" } }, "mode": "lines", "name": "Coef Trend", "side": "both", "type": "violin", "xsrc": "ASCIVOLETTO:60:27a813", "ysrc": "ASCIVOLETTO:60:a8f9da", "marker": { "line": { "color": "rgb(6, 6, 6)", "width": 0 }, "size": 1, "color": "rgb(6, 6, 6)", "symbol": "circle", "opacity": 1 }, "opacity": 1, "visible": true, "meanline": { "visible": false }, "spanmode": "soft", "bandwidth": 0, "boxpoints": false, "fillcolor": "rgba(2, 2, 2, 0.5)", "scalemode": "width", "showlegend": false, "orientation": "v" }, { "uid": "0cbf81", "fill": "tonexty", "line": { "color": "rgb(6, 6, 6)", "width": 1 }, "meta": { "columnNames": { "x": "A", "y": "D" } }, "mode": "lines", "type": "box", "xsrc": "ASCIVOLETTO:60:27a813", "ysrc": "ASCIVOLETTO:60:07467c", "width": 0, "jitter": 0, "boxmean": false, "hoveron": "boxes+points", "notched": true, "opacity": 1, "boxpoints": false, "fillcolor": "rgb(230, 236, 254)", "hoverinfo": "x+y+name", "hoverlabel": { "namelength": 15 }, "notchwidth": 0.10000000000000003, "showlegend": false, "stackgroup": null, "connectgaps": true, "whiskerwidth": 0.2, "hovertemplate": "" }, { "uid": "12ee11", "meta": { "columnNames": { "x": "E", "y": "F" } }, "mode": "markers", "name": "Pre", "type": "scatter", "xsrc": "ASCIVOLETTO:60:b0ba07", "ysrc": "ASCIVOLETTO:60:1b1e2b", "marker": { "line": { "color": "rgb(18, 18, 18)", "width": 1 }, "size": 8, "color": "rgb(85, 160, 231)", "symbol": "circle", "maxdisplayed": 18 }, "visible": true, "boxpoints": false, "showlegend": true }, { "uid": "30e82f", "meta": { "columnNames": { "x": "G", "y": "H" } }, "mode": "markers", "name": "Post", "type": "scatter", "xsrc": "ASCIVOLETTO:60:c10c28", "ysrc": "ASCIVOLETTO:60:e05761", "marker": { "line": { "color": "rgb(5, 5, 5)", "width": 1 }, "size": 8, "color": "rgb(53, 211, 36)" }, "visible": true, "stackgroup": null } ], "frames": [], "layout": { "font": { "size": 14, "color": "rgb(10, 9, 9)", "family": "Times New Roman" }, "title": { "x": 0.5, "font": { "size": 17 }, "text": "VC to PE" }, "xaxis": { "side": "bottom", "type": "linear", "range": [ -3.25, 3.25 ], "title": { "text": "Years to Transaction" }, "domain": [ 0, 1 ], "nticks": 10, "showgrid": true, "showline": true, "zeroline": false, "autorange": false, "gridwidth": 1, "linewidth": 1, "showspikes": false, "rangeslider": { "range": [ 1, 10 ], "yaxis": {}, "visible": false, "autorange": true }, "zerolinecolor": "rgb(92, 129, 189)", "zerolinewidth": 13 }, "yaxis": { "side": "left", "type": "linear", "range": [ -0.7, 0.7 ], "ticks": "outside", "title": { "text": "Score" }, "domain": [ 0.0071532231178051036, 1 ], "nticks": 9, "ticklen": 4, "showline": true, "autorange": false, "tickwidth": 1 }, "boxgap": 0.88, "legend": { "x": 0.8813699856242904, "y": 0.919567286597765, "font": { "size": 12 }, "title": { "font": { "size": 14 }, "text": "Legend:" }, "valign": "top", "bgcolor": "rgb(248, 252, 255)", "xanchor": "center", "yanchor": "middle", "itemsizing": "trace", "traceorder": "normal", "bordercolor": "rgb(3, 0, 0)", "borderwidth": 1, "orientation": "v" }, "shapes": [ { "x0": 0, "x1": 0.001, "y0": 1, "y1": -1, "line": { "dash": "dot", "color": "rgb(247, 1, 1)", "width": 1 }, "type": "rect", "opacity": 1, "fillcolor": "rgb(0, 0, 0)" }, { "x0": -3, "x1": -3.0001, "y0": 0.2297742, "y1": 0.5128147, "line": { "color": "#444444", "width": 1 }, "opacity": 1, "fillcolor": "rgb(68, 68, 68)" }, { "x0": -2, "x1": -2.0001, "y0": 0.1574465, "y1": 0.5864746, "line": { "color": "#444444", "width": 1 }, "opacity": 1, "fillcolor": "rgb(68, 68, 68)" }, { "x0": -1, "x1": -1.0001, "y0": 0.2296531, "y1": 0.6021103, "line": { "color": "#444444", "width": 1 }, "opacity": 1, "fillcolor": "rgb(68, 68, 68)" }, { "x0": 1, "x1": 1.0001, "y0": 0.0822063, "y1": 0.3883198, "line": { "color": "#444444", "width": 1 }, "opacity": 1, "fillcolor": "rgb(68, 68, 68)" }, { "x0": 2, "x1": 2.0001, "y0": 0.0207443, "y1": 0.2720137, "line": { "color": "#444444", "width": 1 }, "opacity": 1, "fillcolor": "rgb(68, 68, 68)" }, { "x0": 3, "x1": 3.0001, "y0": -0.0905517, "y1": 0.1879493, "line": { "color": "#444444", "width": 1 }, "opacity": 1, "fillcolor": "rgb(68, 68, 68)" }, { "x0": -3.25, "x1": 3.25, "y0": -0.7, "y1": -0.6999, "line": { "color": "rgb(0, 0, 0)", "width": 2 }, "opacity": 1, "fillcolor": "rgb(8, 8, 8)" }, { "x0": -12.5, "x1": -12.5001, "y0": -0.7, "y1": 0.7, "line": { "color": "rgb(5, 5, 5)", "width": 2 }, "opacity": 1, "fillcolor": "rgb(8, 8, 8)" }, { "x0": -3.5, "x1": 3.5, "y0": 0, "y1": 0.001, "line": { "color": "rgb(3, 3, 3)", "width": 1 }, "opacity": 1, "fillcolor": "rgb(0, 0, 0)" }, { "x0": -3.25, "x1": -3.2499, "y0": -0.7, "y1": 0.7, "line": { "color": "rgb(0, 0, 0)", "width": 1 }, "opacity": 1, "fillcolor": "rgb(0, 0, 0)" } ], "boxmode": "overlay", "modebar": { "color": "rgba(98, 15, 15, 0.3)", "bgcolor": "rgba(144, 81, 81, 0.5)", "activecolor": "rgba(227, 178, 178, 0.7)", "orientation": "v" }, "autosize": true, "dragmode": "lasso", "template": { "data": { "bar": [ { "type": "bar", "marker": { "colorbar": { "ticks": "", "outlinewidth": 0 } } } ], "table": [ { "type": "table", "cells": { "fill": { "color": "#EBF0F8" }, "line": { "color": "white" } }, "header": { "fill": { "color": "#C8D4E3" }, "line": { "color": "white" } } } ], "carpet": [ { "type": "carpet", "aaxis": { "gridcolor": "#C8D4E3", "linecolor": "#C8D4E3", "endlinecolor": "#2a3f5f", "minorgridcolor": "#C8D4E3", "startlinecolor": "#2a3f5f" }, "baxis": { "gridcolor": "#C8D4E3", "linecolor": "#C8D4E3", "endlinecolor": "#2a3f5f", "minorgridcolor": "#C8D4E3", "startlinecolor": "#2a3f5f" } } ], "mesh3d": [ { "type": "mesh3d", "colorbar": { "ticks": "", "outlinewidth": 0 } } ], "contour": [ { "type": "contour", "colorbar": { "ticks": "", "outlinewidth": 0 }, "autocolorscale": true } ], "heatmap": [ { "type": "heatmap", "colorbar": { "ticks": "", "outlinewidth": 0 }, "autocolorscale": true } ], "scatter": [ { "type": "scatter", "marker": { "colorbar": { "ticks": "", "outlinewidth": 0 } } } ], "surface": [ { "type": "surface", "colorbar": { "ticks": "", "outlinewidth": 0 } } ], "heatmapgl": [ { "type": "heatmapgl", "colorbar": { "ticks": "", "outlinewidth": 0 } } ], "histogram": [ { "type": "histogram", "marker": { "colorbar": { "ticks": "", "outlinewidth": 0 } } } ], "parcoords": [ { "line": { "colorbar": { "ticks": "", "outlinewidth": 0 } }, "type": "parcoords" } ], "scatter3d": [ { "type": "scatter3d", "marker": { "colorbar": { "ticks": "", "outlinewidth": 0 } } } ], "scattergl": [ { "type": "scattergl", "marker": { "colorbar": { "ticks": "", "outlinewidth": 0 } } } ], "choropleth": [ { "type": "choropleth", "colorbar": { "ticks": "", "outlinewidth": 0 } } ], "scattergeo": [ { "type": "scattergeo", "marker": { "colorbar": { "ticks": "", "outlinewidth": 0 } } } ], "histogram2d": [ { "type": "histogram2d", "colorbar": { "ticks": "", "outlinewidth": 0 }, "autocolorscale": true } ], "scatterpolar": [ { "type": "scatterpolar", "marker": { "colorbar": { "ticks": "", "outlinewidth": 0 } } } ], "contourcarpet": [ { "type": "contourcarpet", "colorbar": { "ticks": "", "outlinewidth": 0 } } ], "scattercarpet": [ { "type": "scattercarpet", "marker": { "colorbar": { "ticks": "", "outlinewidth": 0 } } } ], "scattermapbox": [ { "type": "scattermapbox", "marker": { "colorbar": { "ticks": "", "outlinewidth": 0 } } } ], "scatterpolargl": [ { "type": "scatterpolargl", "marker": { "colorbar": { "ticks": "", "outlinewidth": 0 } } } ], "scatterternary": [ { "type": "scatterternary", "marker": { "colorbar": { "ticks": "", "outlinewidth": 0 } } } ], "histogram2dcontour": [ { "type": "histogram2dcontour", "colorbar": { "ticks": "", "outlinewidth": 0 }, "autocolorscale": true } ] }, "layout": { "geo": { "bgcolor": "white", "showland": true, "lakecolor": "white", "landcolor": "white", "showlakes": true, "subunitcolor": "#C8D4E3" }, "font": { "color": "#2a3f5f" }, "polar": { "bgcolor": "white", "radialaxis": { "ticks": "", "gridcolor": "#EBF0F8", "linecolor": "#EBF0F8" }, "angularaxis": { "ticks": "", "gridcolor": "#EBF0F8", "linecolor": "#EBF0F8" } }, "scene": { "xaxis": { "ticks": "", "gridcolor": "#DFE8F3", "gridwidth": 2, "linecolor": "#EBF0F8", "zerolinecolor": "#EBF0F8", "showbackground": true, "backgroundcolor": "white" }, "yaxis": { "ticks": "", "gridcolor": "#DFE8F3", "gridwidth": 2, "linecolor": "#EBF0F8", "zerolinecolor": "#EBF0F8", "showbackground": true, "backgroundcolor": "white" }, "zaxis": { "ticks": "", "gridcolor": "#DFE8F3", "gridwidth": 2, "linecolor": "#EBF0F8", "zerolinecolor": "#EBF0F8", "showbackground": true, "backgroundcolor": "white" } }, "title": { "x": 0.05 }, "xaxis": { "ticks": "", "gridcolor": "#EBF0F8", "linecolor": "#EBF0F8", "automargin": true, "zerolinecolor": "#EBF0F8", "zerolinewidth": 2 }, "yaxis": { "ticks": "", "gridcolor": "#EBF0F8", "linecolor": "#EBF0F8", "automargin": true, "zerolinecolor": "#EBF0F8", "zerolinewidth": 2 }, "ternary": { "aaxis": { "ticks": "", "gridcolor": "#DFE8F3", "linecolor": "#A2B1C6" }, "baxis": { "ticks": "", "gridcolor": "#DFE8F3", "linecolor": "#A2B1C6" }, "caxis": { "ticks": "", "gridcolor": "#DFE8F3", "linecolor": "#A2B1C6" }, "bgcolor": "white" }, "colorway": [ "#636efa", "#EF553B", "#00cc96", "#ab63fa", "#19d3f3", "#e763fa", "#fecb52", "#ffa15a", "#ff6692", "#b6e880" ], "hovermode": "closest", "colorscale": { "diverging": [ [ 0, "#8e0152" ], [ 0.1, "#c51b7d" ], [ 0.2, "#de77ae" ], [ 0.3, "#f1b6da" ], [ 0.4, "#fde0ef" ], [ 0.5, "#f7f7f7" ], [ 0.6, "#e6f5d0" ], [ 0.7, "#b8e186" ], [ 0.8, "#7fbc41" ], [ 0.9, "#4d9221" ], [ 1, "#276419" ] ], "sequential": [ [ 0, "#0508b8" ], [ 0.0893854748603352, "#1910d8" ], [ 0.1787709497206704, "#3c19f0" ], [ 0.2681564245810056, "#6b1cfb" ], [ 0.3575418994413408, "#981cfd" ], [ 0.44692737430167595, "#bf1cfd" ], [ 0.5363128491620112, "#dd2bfd" ], [ 0.6256983240223464, "#f246fe" ], [ 0.7150837988826816, "#fc67fd" ], [ 0.8044692737430168, "#fe88fc" ], [ 0.8938547486033519, "#fea5fd" ], [ 0.9832402234636871, "#febefe" ], [ 1, "#fec3fe" ] ], "sequentialminus": [ [ 0, "#0508b8" ], [ 0.0893854748603352, "#1910d8" ], [ 0.1787709497206704, "#3c19f0" ], [ 0.2681564245810056, "#6b1cfb" ], [ 0.3575418994413408, "#981cfd" ], [ 0.44692737430167595, "#bf1cfd" ], [ 0.5363128491620112, "#dd2bfd" ], [ 0.6256983240223464, "#f246fe" ], [ 0.7150837988826816, "#fc67fd" ], [ 0.8044692737430168, "#fe88fc" ], [ 0.8938547486033519, "#fea5fd" ], [ 0.9832402234636871, "#febefe" ], [ 1, "#fec3fe" ] ] }, "plot_bgcolor": "white", "paper_bgcolor": "white", "shapedefaults": { "line": { "width": 0 }, "opacity": 0.4, "fillcolor": "#506784" }, "annotationdefaults": { "arrowhead": 0, "arrowcolor": "#506784", "arrowwidth": 1 } }, "themeRef": "PLOTLY_WHITE" }, "hovermode": "x", "violingap": 0.88, "colorscale": { "sequential": [ [ 0, "#00224e" ], [ 0.1111111111111111, "#123570" ], [ 0.2222222222222222, "#3b496c" ], [ 0.3333333333333333, "#575d6d" ], [ 0.4444444444444444, "#707173" ], [ 0.5555555555555556, "#8a8678" ], [ 0.6666666666666666, "#a59c74" ], [ 0.7777777777777778, "#c3b369" ], [ 0.8888888888888888, "#e1cc55" ], [ 1, "#fee838" ] ] }, "hoverlabel": { "font": { "size": 14 } }, "showlegend": true, "boxgroupgap": 0.12, "uniformtext": { "mode": false }, "plot_bgcolor": "rgb(255, 255, 255)", "paper_bgcolor": "rgb(255, 255, 255)", "violingroupgap": 0.12 } }, "height": null, "width": null, "user": { "profile_url": "https://chart-studio.plotly.com/~ASCIVOLETTO", "avatar_url": "https://storage.googleapis.com/plotly-prod-profiles/96.jpg", "background_url": "https://storage.googleapis.com/plotly-prod-profiles/bg-7.jpg", "bio": "", "nickname": "", "website": "", "stream_tokens": null, "feature_set_id": null, "csrf_token": null, "date_joined": "2023-03-30 13:28:23", "mapbox_access_tokens": null, "has_password": null, "username": "ASCIVOLETTO", "email": null, "is_active": null, "readonly": null, "is_dash_creator": null, "dash_created_count": null, "is_chart_creator": null, "charts_created_count": null } }, { "creation_time": "2024-04-04T11:33:29.704108Z", "comments": { "results": [], "count": 0 }, "parented": true, "embed_url": "https://chart-studio.plotly.com/~arnold123/20.embed", "fid": "arnold123:20", "filename": "20240403 - Kappa + Breakdown + Summary-based selection + Low confidence Removal + Visible GGB Fields", "filetype": "plot", "img_url": "https://storage.googleapis.com/plotly-prod-images/arnold123/20/9_2CMOW42PDH7A7PB4IHMGX9EPZIOX32.png", "image_urls": { "default": "https://storage.googleapis.com/plotly-prod-images/arnold123/20/2_06WNEQMDXRI8IS86QGNIUREZQTATTQ.png", "block-thumb": "https://storage.googleapis.com/plotly-prod-images/arnold123/20/8_N8R4J51ZNESCVZ1DM2HCA3UZR8I85L.png", "list-thumb": "https://storage.googleapis.com/plotly-prod-images/arnold123/20/9_2CMOW42PDH7A7PB4IHMGX9EPZIOX32.png" }, "api_urls": { "files": "https://api.plotly.com/v2/files/arnold123:20", "plots": "https://api.plotly.com/v2/plots/arnold123:20", "parent": "https://api.plotly.com/v2/folders/home?user=arnold123" }, "owner": "arnold123", "parent": -1, "preview": "", "referencers": [], "references": [], "title": "", "views": 1, "web_url": "https://chart-studio.plotly.com/~arnold123/20/", "world_readable": true, "date_modified": "2024-04-04T11:33:29.716Z", "stars": { "results": [], "count": 0 }, "collaborators": { "results": [], "count": 0 }, "subfolder_count": null, "refresh_interval": null, "organize_view_url": "https://chart-studio.plotly.com/~arnold123/20/", "current_user_permission": "read", "is_theme": null, "is_template": false, "autosize": true, "caption": "", "figure": { "data": [ { "meta": { "columnNames": { "x": "id - label", "y": "kappa", "text": "samples" } }, "name": "Kappa", "type": "bar", "xsrc": "arnold123:19:b2df6a,3f6979*", "ysrc": "arnold123:19:411a8b", "marker": { "color": "rgb(31, 119, 180)" }, "textsrc": "arnold123:19:f74404", "hoverlabel": { "align": "auto", "namelength": 15 }, "orientation": "v", "textposition": "none", "constraintext": "both", "hovertemplate": "" }, { "meta": { "columnNames": { "x": "id - label", "y": "accuracy", "text": "samples" } }, "name": "Accuracy", "type": "bar", "xsrc": "arnold123:19:b2df6a,3f6979*", "ysrc": "arnold123:19:133428", "marker": { "color": "rgb(210, 148, 230)" }, "textsrc": "arnold123:19:f74404", "visible": true, "hoverinfo": "x+y+text+name", "orientation": "v", "textposition": "outside" }, { "meta": { "columnNames": { "x": "id - label", "y": "accuracyByConfidence[67]", "text": "samplesByConfidence[67]" } }, "name": "67%", "type": "bar", "xsrc": "arnold123:19:b2df6a,3f6979*", "ysrc": "arnold123:19:ff14e2", "opacity": 1, "textsrc": "arnold123:19:2fbe1c", "visible": "legendonly", "hoverinfo": "y+text", "orientation": "v", "textposition": "outside", "constraintext": "both", "hovertemplate": "" }, { "meta": { "columnNames": { "x": "id - label", "y": "accuracyByConfidence[100]", "text": "samplesByConfidence[100]" } }, "name": "100%", "type": "bar", "xsrc": "arnold123:19:b2df6a,3f6979*", "ysrc": "arnold123:19:48c551", "opacity": 1, "textsrc": "arnold123:19:025ab4", "visible": "legendonly", "hoverinfo": "y+text", "orientation": "v", "textposition": "outside", "texttemplate": "" } ], "frames": [], "layout": { "scene": { "camera": { "up": { "x": 0, "y": 0, "z": 1 }, "eye": { "x": 1.8493807433651352, "y": 0.644325361967722, "z": 0.4667046631750106 }, "center": { "x": 0, "y": 0, "z": 0 }, "projection": { "type": "perspective" } }, "aspectmode": "auto", "aspectratio": { "x": 1, "y": 1, "z": 1 } }, "title": { "text": "GPT Task Classification 2024/04/03 - Kappa + Accuracy Breakdown + Summary-based selection + Low confidence Removal + All fields iteration + Visible GGB Fields" }, "xaxis": { "type": "multicategory", "dtick": 1, "range": [ -1.0196199882469479, 39.88025659755775 ], "ticks": "", "title": { "font": { "size": 12 }, "text": "Task Property" }, "domain": [ 0, 1 ], "mirror": false, "tickson": "boundaries", "showgrid": true, "showline": true, "tickfont": { "size": 12, "family": "Open Sans" }, "tickmode": "auto", "autorange": false, "linewidth": 1, "tickangle": 45, "automargin": true, "showspikes": false, "tickformat": "", "tickprefix": "", "rangeslider": { "range": [ -0.5, 31.5 ], "yaxis": {}, "yaxis2": {}, "visible": false, "autorange": true, "thickness": 0.4 }, "dividercolor": "rgba(68, 68, 68, 0.5)", "showdividers": true, "spikethickness": 3 }, "yaxis": { "type": "linear", "range": [ -0.2850241545893719, 1.067632850241546 ], "title": { "text": "Reliability" }, "domain": [ 0, 1 ], "showline": false, "autorange": true, "showspikes": false }, "bargap": 0.12, "legend": { "x": 0.9916504257319263, "y": 0.25600722364760986 }, "shapes": [ { "x0": 0, "x1": 100, "y0": 0.8, "y1": 0.8, "line": { "dash": "dot", "color": "rgb(1, 233, 35)", "width": 2 }, "type": "line", "xref": "x", "opacity": 0.38, "fillcolor": "#7f7f7f" }, { "x0": -9.322602453034369, "x1": 90.67768841700648, "y0": 0.6000070057447104, "y1": 0.6000070057447104, "line": { "dash": "dot", "color": "rgb(27, 136, 215)", "width": 2 }, "type": "line", "opacity": 0.38, "fillcolor": "rgb(68, 68, 68)" }, { "x0": 0, "x1": 100, "y0": 0.4, "y1": 0.4, "line": { "dash": "dot", "color": "rgb(205, 154, 28)", "width": 2 }, "type": "line", "opacity": 0.3, "fillcolor": "#7f7f7f" }, { "x0": 0, "x1": 100, "y0": 0.2, "y1": 0.2, "line": { "dash": "dot", "color": "rgb(238, 96, 96)", "width": 2 }, "type": "line", "opacity": 0.3, "fillcolor": "#7f7f7f" } ], "barmode": "group", "barnorm": "", "autosize": true, "dragmode": "pan", "template": { "data": { "bar": [ { "type": "bar", "marker": { "colorbar": { "ticks": "", "outlinewidth": 0 } } } ], "table": [ { "type": "table", "cells": { "fill": { "color": "#EBF0F8" }, "line": { "color": "white" } }, "header": { "fill": { "color": "#C8D4E3" }, "line": { "color": "white" } } } ], "carpet": [ { "type": "carpet", "aaxis": { "gridcolor": "#C8D4E3", "linecolor": "#C8D4E3", "endlinecolor": "#2a3f5f", "minorgridcolor": "#C8D4E3", "startlinecolor": "#2a3f5f" }, "baxis": { "gridcolor": "#C8D4E3", "linecolor": "#C8D4E3", "endlinecolor": "#2a3f5f", "minorgridcolor": "#C8D4E3", "startlinecolor": "#2a3f5f" } } ], "mesh3d": [ { "type": "mesh3d", "colorbar": { "ticks": "", "outlinewidth": 0 } } ], "contour": [ { "type": "contour", "colorbar": { "ticks": "", "outlinewidth": 0 }, "autocolorscale": true } ], "heatmap": [ { "type": "heatmap", "colorbar": { "ticks": "", "outlinewidth": 0 }, "autocolorscale": true } ], "scatter": [ { "type": "scatter", "marker": { "colorbar": { "ticks": "", "outlinewidth": 0 } } } ], "surface": [ { "type": "surface", "colorbar": { "ticks": "", "outlinewidth": 0 } } ], "heatmapgl": [ { "type": "heatmapgl", "colorbar": { "ticks": "", "outlinewidth": 0 } } ], "histogram": [ { "type": "histogram", "marker": { "colorbar": { "ticks": "", "outlinewidth": 0 } } } ], "parcoords": [ { "line": { "colorbar": { "ticks": "", "outlinewidth": 0 } }, "type": "parcoords" } ], "scatter3d": [ { "type": "scatter3d", "marker": { "colorbar": { "ticks": "", "outlinewidth": 0 } } } ], "scattergl": [ { "type": "scattergl", "marker": { "colorbar": { "ticks": "", "outlinewidth": 0 } } } ], "choropleth": [ { "type": "choropleth", "colorbar": { "ticks": "", "outlinewidth": 0 } } ], "scattergeo": [ { "type": "scattergeo", "marker": { "colorbar": { "ticks": "", "outlinewidth": 0 } } } ], "histogram2d": [ { "type": "histogram2d", "colorbar": { "ticks": "", "outlinewidth": 0 }, "autocolorscale": true } ], "scatterpolar": [ { "type": "scatterpolar", "marker": { "colorbar": { "ticks": "", "outlinewidth": 0 } } } ], "contourcarpet": [ { "type": "contourcarpet", "colorbar": { "ticks": "", "outlinewidth": 0 } } ], "scattercarpet": [ { "type": "scattercarpet", "marker": { "colorbar": { "ticks": "", "outlinewidth": 0 } } } ], "scattermapbox": [ { "type": "scattermapbox", "marker": { "colorbar": { "ticks": "", "outlinewidth": 0 } } } ], "scatterpolargl": [ { "type": "scatterpolargl", "marker": { "colorbar": { "ticks": "", "outlinewidth": 0 } } } ], "scatterternary": [ { "type": "scatterternary", "marker": { "colorbar": { "ticks": "", "outlinewidth": 0 } } } ], "histogram2dcontour": [ { "type": "histogram2dcontour", "colorbar": { "ticks": "", "outlinewidth": 0 }, "autocolorscale": true } ] }, "layout": { "geo": { "bgcolor": "white", "showland": true, "lakecolor": "white", "landcolor": "white", "showlakes": true, "subunitcolor": "#C8D4E3" }, "font": { "color": "#2a3f5f" }, "polar": { "bgcolor": "white", "radialaxis": { "ticks": "", "gridcolor": "#EBF0F8", "linecolor": "#EBF0F8" }, "angularaxis": { "ticks": "", "gridcolor": "#EBF0F8", "linecolor": "#EBF0F8" } }, "scene": { "xaxis": { "ticks": "", "gridcolor": "#DFE8F3", "gridwidth": 2, "linecolor": "#EBF0F8", "zerolinecolor": "#EBF0F8", "showbackground": true, "backgroundcolor": "white" }, "yaxis": { "ticks": "", "gridcolor": "#DFE8F3", "gridwidth": 2, "linecolor": "#EBF0F8", "zerolinecolor": "#EBF0F8", "showbackground": true, "backgroundcolor": "white" }, "zaxis": { "ticks": "", "gridcolor": "#DFE8F3", "gridwidth": 2, "linecolor": "#EBF0F8", "zerolinecolor": "#EBF0F8", "showbackground": true, "backgroundcolor": "white" } }, "title": { "x": 0.05 }, "xaxis": { "ticks": "", "gridcolor": "#EBF0F8", "linecolor": "#EBF0F8", "automargin": true, "zerolinecolor": "#EBF0F8", "zerolinewidth": 2 }, "yaxis": { "ticks": "", "gridcolor": "#EBF0F8", "linecolor": "#EBF0F8", "automargin": true, "zerolinecolor": "#EBF0F8", "zerolinewidth": 2 }, "ternary": { "aaxis": { "ticks": "", "gridcolor": "#DFE8F3", "linecolor": "#A2B1C6" }, "baxis": { "ticks": "", "gridcolor": "#DFE8F3", "linecolor": "#A2B1C6" }, "caxis": { "ticks": "", "gridcolor": "#DFE8F3", "linecolor": "#A2B1C6" }, "bgcolor": "white" }, "colorway": [ "#636efa", "#EF553B", "#00cc96", "#ab63fa", "#19d3f3", "#e763fa", "#fecb52", "#ffa15a", "#ff6692", "#b6e880" ], "hovermode": "closest", "colorscale": { "diverging": [ [ 0, "#8e0152" ], [ 0.1, "#c51b7d" ], [ 0.2, "#de77ae" ], [ 0.3, "#f1b6da" ], [ 0.4, "#fde0ef" ], [ 0.5, "#f7f7f7" ], [ 0.6, "#e6f5d0" ], [ 0.7, "#b8e186" ], [ 0.8, "#7fbc41" ], [ 0.9, "#4d9221" ], [ 1, "#276419" ] ], "sequential": [ [ 0, "#0508b8" ], [ 0.0893854748603352, "#1910d8" ], [ 0.1787709497206704, "#3c19f0" ], [ 0.2681564245810056, "#6b1cfb" ], [ 0.3575418994413408, "#981cfd" ], [ 0.44692737430167595, "#bf1cfd" ], [ 0.5363128491620112, "#dd2bfd" ], [ 0.6256983240223464, "#f246fe" ], [ 0.7150837988826816, "#fc67fd" ], [ 0.8044692737430168, "#fe88fc" ], [ 0.8938547486033519, "#fea5fd" ], [ 0.9832402234636871, "#febefe" ], [ 1, "#fec3fe" ] ], "sequentialminus": [ [ 0, "#0508b8" ], [ 0.0893854748603352, "#1910d8" ], [ 0.1787709497206704, "#3c19f0" ], [ 0.2681564245810056, "#6b1cfb" ], [ 0.3575418994413408, "#981cfd" ], [ 0.44692737430167595, "#bf1cfd" ], [ 0.5363128491620112, "#dd2bfd" ], [ 0.6256983240223464, "#f246fe" ], [ 0.7150837988826816, "#fc67fd" ], [ 0.8044692737430168, "#fe88fc" ], [ 0.8938547486033519, "#fea5fd" ], [ 0.9832402234636871, "#febefe" ], [ 1, "#fec3fe" ] ] }, "plot_bgcolor": "white", "paper_bgcolor": "white", "shapedefaults": { "line": { "width": 0 }, "opacity": 0.4, "fillcolor": "#506784" }, "annotationdefaults": { "arrowhead": 0, "arrowcolor": "#506784", "arrowwidth": 1 } }, "themeRef": "PLOTLY_WHITE" }, "showlegend": true, "bargroupgap": 22 } }, "height": null, "width": null, "user": { "profile_url": "https://chart-studio.plotly.com/~arnold123", "avatar_url": "https://storage.googleapis.com/plotly-prod-profiles/55.jpg", "background_url": "https://storage.googleapis.com/plotly-prod-profiles/bg-7.jpg", "bio": "", "nickname": "", "website": "", "stream_tokens": null, "feature_set_id": null, "csrf_token": null, "date_joined": "2024-01-31 14:02:50", "mapbox_access_tokens": null, "has_password": null, "username": "arnold123", "email": null, "is_active": null, "readonly": null, "is_dash_creator": null, "dash_created_count": null, "is_chart_creator": null, "charts_created_count": null } }, { "creation_time": "2024-04-04T11:32:14.899239Z", "comments": { "results": [], "count": 0 }, "parented": true, "embed_url": "https://chart-studio.plotly.com/~ASCIVOLETTO/59.embed", "fid": "ASCIVOLETTO:59", "filename": "VCBACKEDYEARLY", "filetype": "plot", "img_url": "https://storage.googleapis.com/plotly-prod-images/ASCIVOLETTO/59/9_BM39TNVXZDESTTK8N7ALGVOX4XY7TY.png", "image_urls": { "default": "https://storage.googleapis.com/plotly-prod-images/ASCIVOLETTO/59/2_BLJJTM65H62C573V1LMA61OXU5I4VP.png", "block-thumb": "https://storage.googleapis.com/plotly-prod-images/ASCIVOLETTO/59/8_08HLCVRTDUQDHZNO12L00B9WEBZLZO.png", "list-thumb": "https://storage.googleapis.com/plotly-prod-images/ASCIVOLETTO/59/9_BM39TNVXZDESTTK8N7ALGVOX4XY7TY.png" }, "api_urls": { "files": "https://api.plotly.com/v2/files/ASCIVOLETTO:59", "plots": "https://api.plotly.com/v2/plots/ASCIVOLETTO:59", "parent": "https://api.plotly.com/v2/folders/home?user=ASCIVOLETTO" }, "owner": "ASCIVOLETTO", "parent": -1, "preview": "", "referencers": [], "references": [], "title": "", "views": 1, "web_url": "https://chart-studio.plotly.com/~ASCIVOLETTO/59/", "world_readable": true, "date_modified": "2024-04-04T11:49:07.837Z", "stars": { "results": [], "count": 0 }, "collaborators": { "results": [], "count": 0 }, "subfolder_count": null, "refresh_interval": null, "organize_view_url": "https://chart-studio.plotly.com/~ASCIVOLETTO/59/", "current_user_permission": "read", "is_theme": null, "is_template": false, "autosize": true, "caption": "", "figure": { "data": [ { "box": { "visible": false }, "uid": "1824af", "line": { "dash": "solid", "color": "rgb(6, 6, 6)", "shape": "linear", "width": 1 }, "meta": { "columnNames": { "x": "A", "y": "C" } }, "mode": "lines", "name": "Coef Trend", "side": "both", "type": "violin", "xsrc": "ASCIVOLETTO:58:6fe431", "ysrc": "ASCIVOLETTO:58:81cd87", "marker": { "line": { "color": "rgb(6, 6, 6)", "width": 0 }, "size": 1, "color": "rgb(6, 6, 6)", "symbol": "circle", "opacity": 1 }, "opacity": 1, "visible": true, "meanline": { "visible": false }, "spanmode": "soft", "bandwidth": 0, "boxpoints": false, "fillcolor": "rgba(2, 2, 2, 0.5)", "scalemode": "width", "showlegend": false, "orientation": "v" }, { "uid": "0cbf81", "fill": "tonexty", "line": { "color": "rgb(6, 6, 6)", "width": 1 }, "meta": { "columnNames": { "x": "A", "y": "D" } }, "mode": "lines", "type": "box", "xsrc": "ASCIVOLETTO:58:6fe431", "ysrc": "ASCIVOLETTO:58:b6c067", "width": 0, "jitter": 0, "boxmean": false, "hoveron": "boxes+points", "notched": true, "opacity": 1, "boxpoints": false, "fillcolor": "rgb(230, 236, 254)", "hoverinfo": "x+y+name", "hoverlabel": { "namelength": 15 }, "notchwidth": 0.10000000000000003, "showlegend": false, "stackgroup": null, "connectgaps": true, "whiskerwidth": 0.2, "hovertemplate": "" }, { "uid": "12ee11", "meta": { "columnNames": { "x": "E", "y": "F" } }, "mode": "markers", "name": "Pre", "type": "scatter", "xsrc": "ASCIVOLETTO:58:48ddcf", "ysrc": "ASCIVOLETTO:58:632511", "marker": { "line": { "color": "rgb(18, 18, 18)", "width": 1 }, "size": 8, "color": "rgb(85, 160, 231)", "symbol": "circle", "maxdisplayed": 18 }, "visible": true, "boxpoints": false, "showlegend": true }, { "uid": "30e82f", "meta": { "columnNames": { "x": "G", "y": "H" } }, "mode": "markers", "name": "Post", "type": "scatter", "xsrc": "ASCIVOLETTO:58:f02154", "ysrc": "ASCIVOLETTO:58:07f1a7", "marker": { "line": { "color": "rgb(5, 5, 5)", "width": 1 }, "size": 8, "color": "rgb(53, 211, 36)" }, "visible": true, "stackgroup": null } ], "frames": [], "layout": { "font": { "size": 14, "color": "rgb(10, 9, 9)", "family": "Times New Roman" }, "title": { "x": 0.5, "font": { "size": 17 }, "text": "VC Backed" }, "xaxis": { "side": "bottom", "type": "linear", "range": [ -3.25, 3.25 ], "title": { "text": "Years to Transaction" }, "domain": [ 0, 1 ], "nticks": 10, "showgrid": true, "showline": true, "zeroline": false, "autorange": false, "gridwidth": 1, "linewidth": 1, "showspikes": false, "rangeslider": { "range": [ 1, 10 ], "yaxis": {}, "visible": false, "autorange": true }, "zerolinecolor": "rgb(92, 129, 189)", "zerolinewidth": 13 }, "yaxis": { "side": "left", "type": "linear", "range": [ -0.7, 0.7 ], "ticks": "outside", "title": { "text": "Score" }, "domain": [ 0.0071532231178051036, 1 ], "nticks": 9, "ticklen": 4, "showline": true, "autorange": false, "tickwidth": 1 }, "boxgap": 0.88, "legend": { "x": 0.8813699856242904, "y": 0.919567286597765, "font": { "size": 12 }, "title": { "font": { "size": 14 }, "text": "Legend:" }, "valign": "top", "bgcolor": "rgb(248, 252, 255)", "xanchor": "center", "yanchor": "middle", "itemsizing": "trace", "traceorder": "normal", "bordercolor": "rgb(3, 0, 0)", "borderwidth": 1, "orientation": "v" }, "shapes": [ { "x0": 0, "x1": 0.001, "y0": 1, "y1": -1, "line": { "dash": "dot", "color": "rgb(247, 1, 1)", "width": 1 }, "type": "rect", "opacity": 1, "fillcolor": "rgb(0, 0, 0)" }, { "x0": -3, "x1": -3.0001, "y0": 0.2526737, "y1": 0.4883048, "line": { "color": "#444444", "width": 1 }, "opacity": 1, "fillcolor": "rgb(68, 68, 68)" }, { "x0": -2, "x1": -2.0001, "y0": 0.2001019, "y1": 0.4830157, "line": { "color": "#444444", "width": 1 }, "opacity": 1, "fillcolor": "rgb(68, 68, 68)" }, { "x0": -1, "x1": -1.0001, "y0": 0.1889529, "y1": 0.4239996, "line": { "color": "#444444", "width": 1 }, "opacity": 1, "fillcolor": "rgb(68, 68, 68)" }, { "x0": 1, "x1": 1.0001, "y0": -0.0144255, "y1": 0.2028293, "line": { "color": "#444444", "width": 1 }, "opacity": 1, "fillcolor": "rgb(68, 68, 68)" }, { "x0": 2, "x1": 2.0001, "y0": 0.011333, "y1": 0.2116058, "line": { "color": "#444444", "width": 1 }, "opacity": 1, "fillcolor": "rgb(68, 68, 68)" }, { "x0": 3, "x1": 3.0001, "y0": -0.0569688, "y1": 0.1388258, "line": { "color": "#444444", "width": 1 }, "opacity": 1, "fillcolor": "rgb(68, 68, 68)" }, { "x0": -12.5, "x1": 12.5, "y0": -0.7, "y1": -0.6999, "line": { "color": "rgb(0, 0, 0)", "width": 2 }, "opacity": 1, "fillcolor": "rgb(8, 8, 8)" }, { "x0": -12.5, "x1": -12.5001, "y0": -0.7, "y1": 0.7, "line": { "color": "rgb(5, 5, 5)", "width": 2 }, "opacity": 1, "fillcolor": "rgb(8, 8, 8)" }, { "x0": -3.5, "x1": 3.5, "y0": 0, "y1": 0.001, "line": { "color": "rgb(3, 3, 3)", "width": 1 }, "opacity": 1, "fillcolor": "rgb(0, 0, 0)" } ], "boxmode": "overlay", "modebar": { "color": "rgba(98, 15, 15, 0.3)", "bgcolor": "rgba(144, 81, 81, 0.5)", "activecolor": "rgba(227, 178, 178, 0.7)", "orientation": "v" }, "autosize": true, "dragmode": "lasso", "template": { "data": { "bar": [ { "type": "bar", "marker": { "colorbar": { "ticks": "", "outlinewidth": 0 } } } ], "table": [ { "type": "table", "cells": { "fill": { "color": "#EBF0F8" }, "line": { "color": "white" } }, "header": { "fill": { "color": "#C8D4E3" }, "line": { "color": "white" } } } ], "carpet": [ { "type": "carpet", "aaxis": { "gridcolor": "#C8D4E3", "linecolor": "#C8D4E3", "endlinecolor": "#2a3f5f", "minorgridcolor": "#C8D4E3", "startlinecolor": "#2a3f5f" }, "baxis": { "gridcolor": "#C8D4E3", "linecolor": "#C8D4E3", "endlinecolor": "#2a3f5f", "minorgridcolor": "#C8D4E3", "startlinecolor": "#2a3f5f" } } ], "mesh3d": [ { "type": "mesh3d", "colorbar": { "ticks": "", "outlinewidth": 0 } } ], "contour": [ { "type": "contour", "colorbar": { "ticks": "", "outlinewidth": 0 }, "autocolorscale": true } ], "heatmap": [ { "type": "heatmap", "colorbar": { "ticks": "", "outlinewidth": 0 }, "autocolorscale": true } ], "scatter": [ { "type": "scatter", "marker": { "colorbar": { "ticks": "", "outlinewidth": 0 } } } ], "surface": [ { "type": "surface", "colorbar": { "ticks": "", "outlinewidth": 0 } } ], "heatmapgl": [ { "type": "heatmapgl", "colorbar": { "ticks": "", "outlinewidth": 0 } } ], "histogram": [ { "type": "histogram", "marker": { "colorbar": { "ticks": "", "outlinewidth": 0 } } } ], "parcoords": [ { "line": { "colorbar": { "ticks": "", "outlinewidth": 0 } }, "type": "parcoords" } ], "scatter3d": [ { "type": "scatter3d", "marker": { "colorbar": { "ticks": "", "outlinewidth": 0 } } } ], "scattergl": [ { "type": "scattergl", "marker": { "colorbar": { "ticks": "", "outlinewidth": 0 } } } ], "choropleth": [ { "type": "choropleth", "colorbar": { "ticks": "", "outlinewidth": 0 } } ], "scattergeo": [ { "type": "scattergeo", "marker": { "colorbar": { "ticks": "", "outlinewidth": 0 } } } ], "histogram2d": [ { "type": "histogram2d", "colorbar": { "ticks": "", "outlinewidth": 0 }, "autocolorscale": true } ], "scatterpolar": [ { "type": "scatterpolar", "marker": { "colorbar": { "ticks": "", "outlinewidth": 0 } } } ], "contourcarpet": [ { "type": "contourcarpet", "colorbar": { "ticks": "", "outlinewidth": 0 } } ], "scattercarpet": [ { "type": "scattercarpet", "marker": { "colorbar": { "ticks": "", "outlinewidth": 0 } } } ], "scattermapbox": [ { "type": "scattermapbox", "marker": { "colorbar": { "ticks": "", "outlinewidth": 0 } } } ], "scatterpolargl": [ { "type": "scatterpolargl", "marker": { "colorbar": { "ticks": "", "outlinewidth": 0 } } } ], "scatterternary": [ { "type": "scatterternary", "marker": { "colorbar": { "ticks": "", "outlinewidth": 0 } } } ], "histogram2dcontour": [ { "type": "histogram2dcontour", "colorbar": { "ticks": "", "outlinewidth": 0 }, "autocolorscale": true } ] }, "layout": { "geo": { "bgcolor": "white", "showland": true, "lakecolor": "white", "landcolor": "white", "showlakes": true, "subunitcolor": "#C8D4E3" }, "font": { "color": "#2a3f5f" }, "polar": { "bgcolor": "white", "radialaxis": { "ticks": "", "gridcolor": "#EBF0F8", "linecolor": "#EBF0F8" }, "angularaxis": { "ticks": "", "gridcolor": "#EBF0F8", "linecolor": "#EBF0F8" } }, "scene": { "xaxis": { "ticks": "", "gridcolor": "#DFE8F3", "gridwidth": 2, "linecolor": "#EBF0F8", "zerolinecolor": "#EBF0F8", "showbackground": true, "backgroundcolor": "white" }, "yaxis": { "ticks": "", "gridcolor": "#DFE8F3", "gridwidth": 2, "linecolor": "#EBF0F8", "zerolinecolor": "#EBF0F8", "showbackground": true, "backgroundcolor": "white" }, "zaxis": { "ticks": "", "gridcolor": "#DFE8F3", "gridwidth": 2, "linecolor": "#EBF0F8", "zerolinecolor": "#EBF0F8", "showbackground": true, "backgroundcolor": "white" } }, "title": { "x": 0.05 }, "xaxis": { "ticks": "", "gridcolor": "#EBF0F8", "linecolor": "#EBF0F8", "automargin": true, "zerolinecolor": "#EBF0F8", "zerolinewidth": 2 }, "yaxis": { "ticks": "", "gridcolor": "#EBF0F8", "linecolor": "#EBF0F8", "automargin": true, "zerolinecolor": "#EBF0F8", "zerolinewidth": 2 }, "ternary": { "aaxis": { "ticks": "", "gridcolor": "#DFE8F3", "linecolor": "#A2B1C6" }, "baxis": { "ticks": "", "gridcolor": "#DFE8F3", "linecolor": "#A2B1C6" }, "caxis": { "ticks": "", "gridcolor": "#DFE8F3", "linecolor": "#A2B1C6" }, "bgcolor": "white" }, "colorway": [ "#636efa", "#EF553B", "#00cc96", "#ab63fa", "#19d3f3", "#e763fa", "#fecb52", "#ffa15a", "#ff6692", "#b6e880" ], "hovermode": "closest", "colorscale": { "diverging": [ [ 0, "#8e0152" ], [ 0.1, "#c51b7d" ], [ 0.2, "#de77ae" ], [ 0.3, "#f1b6da" ], [ 0.4, "#fde0ef" ], [ 0.5, "#f7f7f7" ], [ 0.6, "#e6f5d0" ], [ 0.7, "#b8e186" ], [ 0.8, "#7fbc41" ], [ 0.9, "#4d9221" ], [ 1, "#276419" ] ], "sequential": [ [ 0, "#0508b8" ], [ 0.0893854748603352, "#1910d8" ], [ 0.1787709497206704, "#3c19f0" ], [ 0.2681564245810056, "#6b1cfb" ], [ 0.3575418994413408, "#981cfd" ], [ 0.44692737430167595, "#bf1cfd" ], [ 0.5363128491620112, "#dd2bfd" ], [ 0.6256983240223464, "#f246fe" ], [ 0.7150837988826816, "#fc67fd" ], [ 0.8044692737430168, "#fe88fc" ], [ 0.8938547486033519, "#fea5fd" ], [ 0.9832402234636871, "#febefe" ], [ 1, "#fec3fe" ] ], "sequentialminus": [ [ 0, "#0508b8" ], [ 0.0893854748603352, "#1910d8" ], [ 0.1787709497206704, "#3c19f0" ], [ 0.2681564245810056, "#6b1cfb" ], [ 0.3575418994413408, "#981cfd" ], [ 0.44692737430167595, "#bf1cfd" ], [ 0.5363128491620112, "#dd2bfd" ], [ 0.6256983240223464, "#f246fe" ], [ 0.7150837988826816, "#fc67fd" ], [ 0.8044692737430168, "#fe88fc" ], [ 0.8938547486033519, "#fea5fd" ], [ 0.9832402234636871, "#febefe" ], [ 1, "#fec3fe" ] ] }, "plot_bgcolor": "white", "paper_bgcolor": "white", "shapedefaults": { "line": { "width": 0 }, "opacity": 0.4, "fillcolor": "#506784" }, "annotationdefaults": { "arrowhead": 0, "arrowcolor": "#506784", "arrowwidth": 1 } }, "themeRef": "PLOTLY_WHITE" }, "hovermode": "x", "violingap": 0.88, "colorscale": { "sequential": [ [ 0, "#00224e" ], [ 0.1111111111111111, "#123570" ], [ 0.2222222222222222, "#3b496c" ], [ 0.3333333333333333, "#575d6d" ], [ 0.4444444444444444, "#707173" ], [ 0.5555555555555556, "#8a8678" ], [ 0.6666666666666666, "#a59c74" ], [ 0.7777777777777778, "#c3b369" ], [ 0.8888888888888888, "#e1cc55" ], [ 1, "#fee838" ] ] }, "hoverlabel": { "font": { "size": 14 } }, "showlegend": true, "boxgroupgap": 0.12, "uniformtext": { "mode": false }, "plot_bgcolor": "rgb(255, 255, 255)", "paper_bgcolor": "rgb(255, 255, 255)", "violingroupgap": 0.12 } }, "height": null, "width": null, "user": { "profile_url": "https://chart-studio.plotly.com/~ASCIVOLETTO", "avatar_url": "https://storage.googleapis.com/plotly-prod-profiles/96.jpg", "background_url": "https://storage.googleapis.com/plotly-prod-profiles/bg-7.jpg", "bio": "", "nickname": "", "website": "", "stream_tokens": null, "feature_set_id": null, "csrf_token": null, "date_joined": "2023-03-30 13:28:23", "mapbox_access_tokens": null, "has_password": null, "username": "ASCIVOLETTO", "email": null, "is_active": null, "readonly": null, "is_dash_creator": null, "dash_created_count": null, "is_chart_creator": null, "charts_created_count": null } }, { "creation_time": "2024-04-04T11:29:53.706064Z", "comments": { "results": [], "count": 0 }, "parented": true, "embed_url": "https://chart-studio.plotly.com/~Luscombebmx/3.embed", "fid": "Luscombebmx:3", "filename": "1.2 Charging a capacitor", "filetype": "plot", "img_url": "https://storage.googleapis.com/plotly-prod-images/Luscombebmx/3/9_3FYZMWLV4OBIND2WKEYK3I8DGF55F4.png", "image_urls": { "default": "https://storage.googleapis.com/plotly-prod-images/Luscombebmx/3/2_E5LOBR7JI7MG8YD2TGJ479P109S193.png", "block-thumb": "https://storage.googleapis.com/plotly-prod-images/Luscombebmx/3/8_ALXR7TZ6CFKWI9WJXWHAQZPKKCRXJI.png", "list-thumb": "https://storage.googleapis.com/plotly-prod-images/Luscombebmx/3/9_3FYZMWLV4OBIND2WKEYK3I8DGF55F4.png" }, "api_urls": { "files": "https://api.plotly.com/v2/files/Luscombebmx:3", "plots": "https://api.plotly.com/v2/plots/Luscombebmx:3", "parent": "https://api.plotly.com/v2/folders/home?user=Luscombebmx" }, "owner": "Luscombebmx", "parent": -1, "preview": "", "referencers": [], "references": [], "title": "", "views": 3, "web_url": "https://chart-studio.plotly.com/~Luscombebmx/3/", "world_readable": true, "date_modified": "2024-04-04T11:29:53.716Z", "stars": { "results": [], "count": 0 }, "collaborators": { "results": [], "count": 0 }, "subfolder_count": null, "refresh_interval": null, "organize_view_url": "https://chart-studio.plotly.com/~Luscombebmx/3/", "current_user_permission": "read", "is_theme": null, "is_template": false, "autosize": true, "caption": "", "figure": { "data": [ { "meta": { "columnNames": { "x": "A", "y": "B" } }, "mode": "markers", "name": "Exp. current (mA)", "type": "scatter", "xsrc": "Luscombebmx:2:325c59", "ysrc": "Luscombebmx:2:4dc20f" }, { "meta": { "columnNames": { "x": "A", "y": "C" } }, "mode": "markers", "name": "Theory current (mA)", "type": "scatter", "xsrc": "Luscombebmx:2:325c59", "ysrc": "Luscombebmx:2:62d8a3", "stackgroup": null } ], "frames": [], "layout": { "title": { "text": "1.2 Charging a Capacitor (current only)" }, "xaxis": { "type": "linear", "range": [ -1, 122.32173122872781 ], "title": { "text": "Time (seconds)" }, "autorange": false }, "yaxis": { "type": "linear", "range": [ -0.0192720490797546, 0.2945329758768647 ], "title": { "text": "Current (mA)" }, "autorange": false }, "autosize": true, "template": { "data": { "bar": [ { "type": "bar", "marker": { "colorbar": { "ticks": "", "outlinewidth": 0 } } } ], "table": [ { "type": "table", "cells": { "fill": { "color": "#EBF0F8" }, "line": { "color": "white" } }, "header": { "fill": { "color": "#C8D4E3" }, "line": { "color": "white" } } } ], "carpet": [ { "type": "carpet", "aaxis": { "gridcolor": "#C8D4E3", "linecolor": "#C8D4E3", "endlinecolor": "#2a3f5f", "minorgridcolor": "#C8D4E3", "startlinecolor": "#2a3f5f" }, "baxis": { "gridcolor": "#C8D4E3", "linecolor": "#C8D4E3", "endlinecolor": "#2a3f5f", "minorgridcolor": "#C8D4E3", "startlinecolor": "#2a3f5f" } } ], "mesh3d": [ { "type": "mesh3d", "colorbar": { "ticks": "", "outlinewidth": 0 } } ], "contour": [ { "type": "contour", "colorbar": { "ticks": "", "outlinewidth": 0 }, "autocolorscale": true } ], "heatmap": [ { "type": "heatmap", "colorbar": { "ticks": "", "outlinewidth": 0 }, "autocolorscale": true } ], "scatter": [ { "type": "scatter", "marker": { "colorbar": { "ticks": "", "outlinewidth": 0 } } } ], "surface": [ { "type": "surface", "colorbar": { "ticks": "", "outlinewidth": 0 } } ], "heatmapgl": [ { "type": "heatmapgl", "colorbar": { "ticks": "", "outlinewidth": 0 } } ], "histogram": [ { "type": "histogram", "marker": { "colorbar": { "ticks": "", "outlinewidth": 0 } } } ], "parcoords": [ { "line": { "colorbar": { "ticks": "", "outlinewidth": 0 } }, "type": "parcoords" } ], "scatter3d": [ { "type": "scatter3d", "marker": { "colorbar": { "ticks": "", "outlinewidth": 0 } } } ], "scattergl": [ { "type": "scattergl", "marker": { "colorbar": { "ticks": "", "outlinewidth": 0 } } } ], "choropleth": [ { "type": "choropleth", "colorbar": { "ticks": "", "outlinewidth": 0 } } ], "scattergeo": [ { "type": "scattergeo", "marker": { "colorbar": { "ticks": "", "outlinewidth": 0 } } } ], "histogram2d": [ { "type": "histogram2d", "colorbar": { "ticks": "", "outlinewidth": 0 }, "autocolorscale": true } ], "scatterpolar": [ { "type": "scatterpolar", "marker": { "colorbar": { "ticks": "", "outlinewidth": 0 } } } ], "contourcarpet": [ { "type": "contourcarpet", "colorbar": { "ticks": "", "outlinewidth": 0 } } ], "scattercarpet": [ { "type": "scattercarpet", "marker": { "colorbar": { "ticks": "", "outlinewidth": 0 } } } ], "scattermapbox": [ { "type": "scattermapbox", "marker": { "colorbar": { "ticks": "", "outlinewidth": 0 } } } ], "scatterpolargl": [ { "type": "scatterpolargl", "marker": { "colorbar": { "ticks": "", "outlinewidth": 0 } } } ], "scatterternary": [ { "type": "scatterternary", "marker": { "colorbar": { "ticks": "", "outlinewidth": 0 } } } ], "histogram2dcontour": [ { "type": "histogram2dcontour", "colorbar": { "ticks": "", "outlinewidth": 0 }, "autocolorscale": true } ] }, "layout": { "geo": { "bgcolor": "white", "showland": true, "lakecolor": "white", "landcolor": "white", "showlakes": true, "subunitcolor": "#C8D4E3" }, "font": { "color": "#2a3f5f" }, "polar": { "bgcolor": "white", "radialaxis": { "ticks": "", "gridcolor": "#EBF0F8", "linecolor": "#EBF0F8" }, "angularaxis": { "ticks": "", "gridcolor": "#EBF0F8", "linecolor": "#EBF0F8" } }, "scene": { "xaxis": { "ticks": "", "gridcolor": "#DFE8F3", "gridwidth": 2, "linecolor": "#EBF0F8", "zerolinecolor": "#EBF0F8", "showbackground": true, "backgroundcolor": "white" }, "yaxis": { "ticks": "", "gridcolor": "#DFE8F3", "gridwidth": 2, "linecolor": "#EBF0F8", "zerolinecolor": "#EBF0F8", "showbackground": true, "backgroundcolor": "white" }, "zaxis": { "ticks": "", "gridcolor": "#DFE8F3", "gridwidth": 2, "linecolor": "#EBF0F8", "zerolinecolor": "#EBF0F8", "showbackground": true, "backgroundcolor": "white" } }, "title": { "x": 0.05 }, "xaxis": { "ticks": "", "gridcolor": "#EBF0F8", "linecolor": "#EBF0F8", "automargin": true, "zerolinecolor": "#EBF0F8", "zerolinewidth": 2 }, "yaxis": { "ticks": "", "gridcolor": "#EBF0F8", "linecolor": "#EBF0F8", "automargin": true, "zerolinecolor": "#EBF0F8", "zerolinewidth": 2 }, "ternary": { "aaxis": { "ticks": "", "gridcolor": "#DFE8F3", "linecolor": "#A2B1C6" }, "baxis": { "ticks": "", "gridcolor": "#DFE8F3", "linecolor": "#A2B1C6" }, "caxis": { "ticks": "", "gridcolor": "#DFE8F3", "linecolor": "#A2B1C6" }, "bgcolor": "white" }, "colorway": [ "#636efa", "#EF553B", "#00cc96", "#ab63fa", "#19d3f3", "#e763fa", "#fecb52", "#ffa15a", "#ff6692", "#b6e880" ], "hovermode": "closest", "colorscale": { "diverging": [ [ 0, "#8e0152" ], [ 0.1, "#c51b7d" ], [ 0.2, "#de77ae" ], [ 0.3, "#f1b6da" ], [ 0.4, "#fde0ef" ], [ 0.5, "#f7f7f7" ], [ 0.6, "#e6f5d0" ], [ 0.7, "#b8e186" ], [ 0.8, "#7fbc41" ], [ 0.9, "#4d9221" ], [ 1, "#276419" ] ], "sequential": [ [ 0, "#0508b8" ], [ 0.0893854748603352, "#1910d8" ], [ 0.1787709497206704, "#3c19f0" ], [ 0.2681564245810056, "#6b1cfb" ], [ 0.3575418994413408, "#981cfd" ], [ 0.44692737430167595, "#bf1cfd" ], [ 0.5363128491620112, "#dd2bfd" ], [ 0.6256983240223464, "#f246fe" ], [ 0.7150837988826816, "#fc67fd" ], [ 0.8044692737430168, "#fe88fc" ], [ 0.8938547486033519, "#fea5fd" ], [ 0.9832402234636871, "#febefe" ], [ 1, "#fec3fe" ] ], "sequentialminus": [ [ 0, "#0508b8" ], [ 0.0893854748603352, "#1910d8" ], [ 0.1787709497206704, "#3c19f0" ], [ 0.2681564245810056, "#6b1cfb" ], [ 0.3575418994413408, "#981cfd" ], [ 0.44692737430167595, "#bf1cfd" ], [ 0.5363128491620112, "#dd2bfd" ], [ 0.6256983240223464, "#f246fe" ], [ 0.7150837988826816, "#fc67fd" ], [ 0.8044692737430168, "#fe88fc" ], [ 0.8938547486033519, "#fea5fd" ], [ 0.9832402234636871, "#febefe" ], [ 1, "#fec3fe" ] ] }, "plot_bgcolor": "white", "paper_bgcolor": "white", "shapedefaults": { "line": { "width": 0 }, "opacity": 0.4, "fillcolor": "#506784" }, "annotationdefaults": { "arrowhead": 0, "arrowcolor": "#506784", "arrowwidth": 1 } }, "themeRef": "PLOTLY_WHITE" } } }, "height": null, "width": null, "user": { "profile_url": "https://chart-studio.plotly.com/~Luscombebmx", "avatar_url": "https://storage.googleapis.com/plotly-prod-profiles/14.jpg", "background_url": "https://storage.googleapis.com/plotly-prod-profiles/bg-7.jpg", "bio": "", "nickname": "", "website": "", "stream_tokens": null, "feature_set_id": null, "csrf_token": null, "date_joined": "2024-04-04 09:03:44", "mapbox_access_tokens": null, "has_password": null, "username": "Luscombebmx", "email": null, "is_active": null, "readonly": null, "is_dash_creator": null, "dash_created_count": null, "is_chart_creator": null, "charts_created_count": null } }, { "creation_time": "2024-04-04T10:58:45.967183Z", "comments": { "results": [], "count": 0 }, "parented": true, "embed_url": "https://chart-studio.plotly.com/~drivingplus607/68.embed", "fid": "drivingplus607:68", "filename": "Plot 68", "filetype": "plot", "img_url": "https://storage.googleapis.com/plotly-prod-images/drivingplus607/68/9_G9YBBCYTWXDOOX88NNEHP39M7TX6Y0.png", "image_urls": { "default": "https://storage.googleapis.com/plotly-prod-images/drivingplus607/68/2_05Z9B07I6V1TH5JHEERSHFMWAENI20.png", "block-thumb": "https://storage.googleapis.com/plotly-prod-images/drivingplus607/68/8_Y6I0U0PDCTV1048I2JA2Z8D2HAKINK.png", "list-thumb": "https://storage.googleapis.com/plotly-prod-images/drivingplus607/68/9_G9YBBCYTWXDOOX88NNEHP39M7TX6Y0.png" }, "api_urls": { "files": "https://api.plotly.com/v2/files/drivingplus607:68", "plots": "https://api.plotly.com/v2/plots/drivingplus607:68", "parent": "https://api.plotly.com/v2/folders/home?user=drivingplus607" }, "owner": "drivingplus607", "parent": -1, "preview": "", "referencers": [], "references": [], "title": "", "views": 3, "web_url": "https://chart-studio.plotly.com/~drivingplus607/68/", "world_readable": true, "date_modified": "2024-04-04T15:51:11.096Z", "stars": { "results": [], "count": 0 }, "collaborators": { "results": [], "count": 0 }, "subfolder_count": null, "refresh_interval": null, "organize_view_url": "https://chart-studio.plotly.com/~drivingplus607/68/", "current_user_permission": "read", "is_theme": null, "is_template": false, "autosize": true, "caption": "", "figure": { "data": [ { "meta": { "columnNames": { "x": "A", "y": "B" } }, "mode": "lines", "name": "Duration event", "type": "scatter", "xsrc": "drivingplus607:69:e5a361", "ysrc": "drivingplus607:69:13ab12" }, { "meta": { "columnNames": { "x": "A", "y": "B" } }, "mode": "lines", "name": "Count event", "type": "scatter", "xsrc": "drivingplus607:70:85ed1b", "ysrc": "drivingplus607:70:e002ab" } ], "frames": [], "layout": { "title": { "x": 0.02, "font": { "size": 13 }, "text": "Variation of score vs two classes of events for a 1 hr trip (duration events = over-speeding, night-driving; count events = rapid acceleration, sudden stop, sharp turn)" }, "xaxis": { "type": "linear", "range": [ -4.182509505703422, 203.67553865652724 ], "title": { "text": "Duration-event duration (in minutes)/ Count-event count" }, "autorange": false }, "yaxis": { "type": "linear", "range": [ 73.44777673791957, 101.21814710828993 ], "title": { "text": "Score" }, "autorange": false }, "autosize": true, "template": { "data": { "bar": [ { "type": "bar", "marker": { "colorbar": { "ticks": "", "outlinewidth": 0 } } } ], "table": [ { "type": "table", "cells": { "fill": { "color": "#EBF0F8" }, "line": { "color": "white" } }, "header": { "fill": { "color": "#C8D4E3" }, "line": { "color": "white" } } } ], "carpet": [ { "type": "carpet", "aaxis": { "gridcolor": "#C8D4E3", "linecolor": "#C8D4E3", "endlinecolor": "#2a3f5f", "minorgridcolor": "#C8D4E3", "startlinecolor": "#2a3f5f" }, "baxis": { "gridcolor": "#C8D4E3", "linecolor": "#C8D4E3", "endlinecolor": "#2a3f5f", "minorgridcolor": "#C8D4E3", "startlinecolor": "#2a3f5f" } } ], "mesh3d": [ { "type": "mesh3d", "colorbar": { "ticks": "", "outlinewidth": 0 } } ], "contour": [ { "type": "contour", "colorbar": { "ticks": "", "outlinewidth": 0 }, "autocolorscale": true } ], "heatmap": [ { "type": "heatmap", "colorbar": { "ticks": "", "outlinewidth": 0 }, "autocolorscale": true } ], "scatter": [ { "type": "scatter", "marker": { "colorbar": { "ticks": "", "outlinewidth": 0 } } } ], "surface": [ { "type": "surface", "colorbar": { "ticks": "", "outlinewidth": 0 } } ], "heatmapgl": [ { "type": "heatmapgl", "colorbar": { "ticks": "", "outlinewidth": 0 } } ], "histogram": [ { "type": "histogram", "marker": { "colorbar": { "ticks": "", "outlinewidth": 0 } } } ], "parcoords": [ { "line": { "colorbar": { "ticks": "", "outlinewidth": 0 } }, "type": "parcoords" } ], "scatter3d": [ { "type": "scatter3d", "marker": { "colorbar": { "ticks": "", "outlinewidth": 0 } } } ], "scattergl": [ { "type": "scattergl", "marker": { "colorbar": { "ticks": "", "outlinewidth": 0 } } } ], "choropleth": [ { "type": "choropleth", "colorbar": { "ticks": "", "outlinewidth": 0 } } ], "scattergeo": [ { "type": "scattergeo", "marker": { "colorbar": { "ticks": "", "outlinewidth": 0 } } } ], "histogram2d": [ { "type": "histogram2d", "colorbar": { "ticks": "", "outlinewidth": 0 }, "autocolorscale": true } ], "scatterpolar": [ { "type": "scatterpolar", "marker": { "colorbar": { "ticks": "", "outlinewidth": 0 } } } ], "contourcarpet": [ { "type": "contourcarpet", "colorbar": { "ticks": "", "outlinewidth": 0 } } ], "scattercarpet": [ { "type": "scattercarpet", "marker": { "colorbar": { "ticks": "", "outlinewidth": 0 } } } ], "scattermapbox": [ { "type": "scattermapbox", "marker": { "colorbar": { "ticks": "", "outlinewidth": 0 } } } ], "scatterpolargl": [ { "type": "scatterpolargl", "marker": { "colorbar": { "ticks": "", "outlinewidth": 0 } } } ], "scatterternary": [ { "type": "scatterternary", "marker": { "colorbar": { "ticks": "", "outlinewidth": 0 } } } ], "histogram2dcontour": [ { "type": "histogram2dcontour", "colorbar": { "ticks": "", "outlinewidth": 0 }, "autocolorscale": true } ] }, "layout": { "geo": { "bgcolor": "white", "showland": true, "lakecolor": "white", "landcolor": "white", "showlakes": true, "subunitcolor": "#C8D4E3" }, "font": { "color": "#2a3f5f" }, "polar": { "bgcolor": "white", "radialaxis": { "ticks": "", "gridcolor": "#EBF0F8", "linecolor": "#EBF0F8" }, "angularaxis": { "ticks": "", "gridcolor": "#EBF0F8", "linecolor": "#EBF0F8" } }, "scene": { "xaxis": { "ticks": "", "gridcolor": "#DFE8F3", "gridwidth": 2, "linecolor": "#EBF0F8", "zerolinecolor": "#EBF0F8", "showbackground": true, "backgroundcolor": "white" }, "yaxis": { "ticks": "", "gridcolor": "#DFE8F3", "gridwidth": 2, "linecolor": "#EBF0F8", "zerolinecolor": "#EBF0F8", "showbackground": true, "backgroundcolor": "white" }, "zaxis": { "ticks": "", "gridcolor": "#DFE8F3", "gridwidth": 2, "linecolor": "#EBF0F8", "zerolinecolor": "#EBF0F8", "showbackground": true, "backgroundcolor": "white" } }, "title": { "x": 0.05 }, "xaxis": { "ticks": "", "gridcolor": "#EBF0F8", "linecolor": "#EBF0F8", "automargin": true, "zerolinecolor": "#EBF0F8", "zerolinewidth": 2 }, "yaxis": { "ticks": "", "gridcolor": "#EBF0F8", "linecolor": "#EBF0F8", "automargin": true, "zerolinecolor": "#EBF0F8", "zerolinewidth": 2 }, "ternary": { "aaxis": { "ticks": "", "gridcolor": "#DFE8F3", "linecolor": "#A2B1C6" }, "baxis": { "ticks": "", "gridcolor": "#DFE8F3", "linecolor": "#A2B1C6" }, "caxis": { "ticks": "", "gridcolor": "#DFE8F3", "linecolor": "#A2B1C6" }, "bgcolor": "white" }, "colorway": [ "#636efa", "#EF553B", "#00cc96", "#ab63fa", "#19d3f3", "#e763fa", "#fecb52", "#ffa15a", "#ff6692", "#b6e880" ], "hovermode": "closest", "colorscale": { "diverging": [ [ 0, "#8e0152" ], [ 0.1, "#c51b7d" ], [ 0.2, "#de77ae" ], [ 0.3, "#f1b6da" ], [ 0.4, "#fde0ef" ], [ 0.5, "#f7f7f7" ], [ 0.6, "#e6f5d0" ], [ 0.7, "#b8e186" ], [ 0.8, "#7fbc41" ], [ 0.9, "#4d9221" ], [ 1, "#276419" ] ], "sequential": [ [ 0, "#0508b8" ], [ 0.0893854748603352, "#1910d8" ], [ 0.1787709497206704, "#3c19f0" ], [ 0.2681564245810056, "#6b1cfb" ], [ 0.3575418994413408, "#981cfd" ], [ 0.44692737430167595, "#bf1cfd" ], [ 0.5363128491620112, "#dd2bfd" ], [ 0.6256983240223464, "#f246fe" ], [ 0.7150837988826816, "#fc67fd" ], [ 0.8044692737430168, "#fe88fc" ], [ 0.8938547486033519, "#fea5fd" ], [ 0.9832402234636871, "#febefe" ], [ 1, "#fec3fe" ] ], "sequentialminus": [ [ 0, "#0508b8" ], [ 0.0893854748603352, "#1910d8" ], [ 0.1787709497206704, "#3c19f0" ], [ 0.2681564245810056, "#6b1cfb" ], [ 0.3575418994413408, "#981cfd" ], [ 0.44692737430167595, "#bf1cfd" ], [ 0.5363128491620112, "#dd2bfd" ], [ 0.6256983240223464, "#f246fe" ], [ 0.7150837988826816, "#fc67fd" ], [ 0.8044692737430168, "#fe88fc" ], [ 0.8938547486033519, "#fea5fd" ], [ 0.9832402234636871, "#febefe" ], [ 1, "#fec3fe" ] ] }, "plot_bgcolor": "white", "paper_bgcolor": "white", "shapedefaults": { "line": { "width": 0 }, "opacity": 0.4, "fillcolor": "#506784" }, "annotationdefaults": { "arrowhead": 0, "arrowcolor": "#506784", "arrowwidth": 1 } }, "themeRef": "PLOTLY_WHITE" }, "annotations": [] } }, "height": null, "width": null, "user": { "profile_url": "https://chart-studio.plotly.com/~drivingplus607", "avatar_url": "https://storage.googleapis.com/plotly-prod-profiles/3.jpg", "background_url": "https://storage.googleapis.com/plotly-prod-profiles/bg-0.jpg", "bio": "", "nickname": "", "website": "", "stream_tokens": null, "feature_set_id": null, "csrf_token": null, "date_joined": "2024-01-18 10:56:39", "mapbox_access_tokens": null, "has_password": null, "username": "drivingplus607", "email": null, "is_active": null, "readonly": null, "is_dash_creator": null, "dash_created_count": null, "is_chart_creator": null, "charts_created_count": null } }, { "creation_time": "2024-04-04T10:45:20.641482Z", "comments": { "results": [], "count": 0 }, "parented": true, "embed_url": "https://chart-studio.plotly.com/~d.gribanov/3.embed", "fid": "d.gribanov:3", "filename": "Plot 3", "filetype": "plot", "img_url": "https://storage.googleapis.com/plotly-prod-images/d.gribanov/3/9_78ZF2SFBXU8Z0NW8XVYOEIGSEGBTUJ.png", "image_urls": { "default": "https://storage.googleapis.com/plotly-prod-images/d.gribanov/3/2_MAZRXKXZPM0FJI98FT1DIOH8W0VHR6.png", "block-thumb": "https://storage.googleapis.com/plotly-prod-images/d.gribanov/3/8_AN4VQO6AARA28V4XUDJ96RQXL6RH93.png", "list-thumb": "https://storage.googleapis.com/plotly-prod-images/d.gribanov/3/9_78ZF2SFBXU8Z0NW8XVYOEIGSEGBTUJ.png" }, "api_urls": { "files": "https://api.plotly.com/v2/files/d.gribanov:3", "plots": "https://api.plotly.com/v2/plots/d.gribanov:3", "parent": "https://api.plotly.com/v2/folders/home?user=d.gribanov" }, "owner": "d.gribanov", "parent": -1, "preview": "", "referencers": [], "references": [], "title": "", "views": 2, "web_url": "https://chart-studio.plotly.com/~d.gribanov/3/", "world_readable": true, "date_modified": "2024-04-04T11:00:11.331Z", "stars": { "results": [], "count": 0 }, "collaborators": { "results": [], "count": 0 }, "subfolder_count": null, "refresh_interval": null, "organize_view_url": "https://chart-studio.plotly.com/~d.gribanov/3/", "current_user_permission": "read", "is_theme": null, "is_template": false, "autosize": true, "caption": "", "figure": { "data": [ { "meta": { "columnNames": { "x": "Trainings", "y": "", "text": "", "marker": { "color": "Group" } } }, "mode": "markers", "name": "Keep subscription", "type": "histogram", "xsrc": "d.gribanov:0:8a7220", "xaxis": "x2", "xbins": { "size": 1 }, "yaxis": "y2", "marker": { "meta": { "columnNames": { "color": "Group" } }, "color": "rgb(7, 201, 65)" }, "transforms": [ { "meta": { "columnNames": { "target": "Group" } }, "type": "filter", "value": "Keep subscription", "targetsrc": "d.gribanov:0:62c59d" } ], "orientation": "v" }, { "meta": { "columnNames": { "x": "Trainings" } }, "name": "Canceled subscription", "type": "histogram", "xsrc": "d.gribanov:0:8a7220", "xbins": { "size": 1 }, "marker": { "color": "rgb(56, 52, 55)" }, "transforms": [ { "meta": { "columnNames": { "target": "Group" } }, "type": "filter", "value": "Canceled subscription", "targetsrc": "d.gribanov:0:62c59d" } ] } ], "frames": [], "layout": { "title": { "text": "Распределение пользователей по количеству тренировок за первые 3 дня после регистрации" }, "xaxis": { "side": "bottom", "type": "linear", "range": [ -0.5, 48.5 ], "title": { "text": "Количество тренировок" }, "anchor": "y", "domain": [ 0.625, 1 ], "autorange": true }, "yaxis": { "side": "left", "range": [ 0, 16.842105263157894 ], "title": { "text": "Количество пользователей" }, "anchor": "x", "domain": [ 0, 1 ], "autorange": true }, "xaxis2": { "side": "bottom", "type": "linear", "range": [ -0.5, 49.5 ], "title": { "text": "Количество тренировок" }, "anchor": "y", "domain": [ 0, 0.375 ], "autorange": true, "overlaying": false }, "yaxis2": { "side": "left", "range": [ 0, 74.73684210526316 ], "title": { "text": "Количество пользователей" }, "anchor": "free", "domain": [ 0, 1 ], "autorange": true, "overlaying": false }, "autosize": true, "template": { "data": { "bar": [ { "type": "bar", "marker": { "colorbar": { "ticks": "", "outlinewidth": 0 } } } ], "table": [ { "type": "table", "cells": { "fill": { "color": "#EBF0F8" }, "line": { "color": "white" } }, "header": { "fill": { "color": "#C8D4E3" }, "line": { "color": "white" } } } ], "carpet": [ { "type": "carpet", "aaxis": { "gridcolor": "#C8D4E3", "linecolor": "#C8D4E3", "endlinecolor": "#2a3f5f", "minorgridcolor": "#C8D4E3", "startlinecolor": "#2a3f5f" }, "baxis": { "gridcolor": "#C8D4E3", "linecolor": "#C8D4E3", "endlinecolor": "#2a3f5f", "minorgridcolor": "#C8D4E3", "startlinecolor": "#2a3f5f" } } ], "mesh3d": [ { "type": "mesh3d", "colorbar": { "ticks": "", "outlinewidth": 0 } } ], "contour": [ { "type": "contour", "colorbar": { "ticks": "", "outlinewidth": 0 }, "autocolorscale": true } ], "heatmap": [ { "type": "heatmap", "colorbar": { "ticks": "", "outlinewidth": 0 }, "autocolorscale": true } ], "scatter": [ { "type": "scatter", "marker": { "colorbar": { "ticks": "", "outlinewidth": 0 } } } ], "surface": [ { "type": "surface", "colorbar": { "ticks": "", "outlinewidth": 0 } } ], "heatmapgl": [ { "type": "heatmapgl", "colorbar": { "ticks": "", "outlinewidth": 0 } } ], "histogram": [ { "type": "histogram", "marker": { "colorbar": { "ticks": "", "outlinewidth": 0 } } } ], "parcoords": [ { "line": { "colorbar": { "ticks": "", "outlinewidth": 0 } }, "type": "parcoords" } ], "scatter3d": [ { "type": "scatter3d", "marker": { "colorbar": { "ticks": "", "outlinewidth": 0 } } } ], "scattergl": [ { "type": "scattergl", "marker": { "colorbar": { "ticks": "", "outlinewidth": 0 } } } ], "choropleth": [ { "type": "choropleth", "colorbar": { "ticks": "", "outlinewidth": 0 } } ], "scattergeo": [ { "type": "scattergeo", "marker": { "colorbar": { "ticks": "", "outlinewidth": 0 } } } ], "histogram2d": [ { "type": "histogram2d", "colorbar": { "ticks": "", "outlinewidth": 0 }, "autocolorscale": true } ], "scatterpolar": [ { "type": "scatterpolar", "marker": { "colorbar": { "ticks": "", "outlinewidth": 0 } } } ], "contourcarpet": [ { "type": "contourcarpet", "colorbar": { "ticks": "", "outlinewidth": 0 } } ], "scattercarpet": [ { "type": "scattercarpet", "marker": { "colorbar": { "ticks": "", "outlinewidth": 0 } } } ], "scattermapbox": [ { "type": "scattermapbox", "marker": { "colorbar": { "ticks": "", "outlinewidth": 0 } } } ], "scatterpolargl": [ { "type": "scatterpolargl", "marker": { "colorbar": { "ticks": "", "outlinewidth": 0 } } } ], "scatterternary": [ { "type": "scatterternary", "marker": { "colorbar": { "ticks": "", "outlinewidth": 0 } } } ], "histogram2dcontour": [ { "type": "histogram2dcontour", "colorbar": { "ticks": "", "outlinewidth": 0 }, "autocolorscale": true } ] }, "layout": { "geo": { "bgcolor": "white", "showland": true, "lakecolor": "white", "landcolor": "white", "showlakes": true, "subunitcolor": "#C8D4E3" }, "font": { "color": "#2a3f5f" }, "polar": { "bgcolor": "white", "radialaxis": { "ticks": "", "gridcolor": "#EBF0F8", "linecolor": "#EBF0F8" }, "angularaxis": { "ticks": "", "gridcolor": "#EBF0F8", "linecolor": "#EBF0F8" } }, "scene": { "xaxis": { "ticks": "", "gridcolor": "#DFE8F3", "gridwidth": 2, "linecolor": "#EBF0F8", "zerolinecolor": "#EBF0F8", "showbackground": true, "backgroundcolor": "white" }, "yaxis": { "ticks": "", "gridcolor": "#DFE8F3", "gridwidth": 2, "linecolor": "#EBF0F8", "zerolinecolor": "#EBF0F8", "showbackground": true, "backgroundcolor": "white" }, "zaxis": { "ticks": "", "gridcolor": "#DFE8F3", "gridwidth": 2, "linecolor": "#EBF0F8", "zerolinecolor": "#EBF0F8", "showbackground": true, "backgroundcolor": "white" } }, "title": { "x": 0.05 }, "xaxis": { "ticks": "", "gridcolor": "#EBF0F8", "linecolor": "#EBF0F8", "automargin": true, "zerolinecolor": "#EBF0F8", "zerolinewidth": 2 }, "yaxis": { "ticks": "", "gridcolor": "#EBF0F8", "linecolor": "#EBF0F8", "automargin": true, "zerolinecolor": "#EBF0F8", "zerolinewidth": 2 }, "ternary": { "aaxis": { "ticks": "", "gridcolor": "#DFE8F3", "linecolor": "#A2B1C6" }, "baxis": { "ticks": "", "gridcolor": "#DFE8F3", "linecolor": "#A2B1C6" }, "caxis": { "ticks": "", "gridcolor": "#DFE8F3", "linecolor": "#A2B1C6" }, "bgcolor": "white" }, "colorway": [ "#636efa", "#EF553B", "#00cc96", "#ab63fa", "#19d3f3", "#e763fa", "#fecb52", "#ffa15a", "#ff6692", "#b6e880" ], "hovermode": "closest", "colorscale": { "diverging": [ [ 0, "#8e0152" ], [ 0.1, "#c51b7d" ], [ 0.2, "#de77ae" ], [ 0.3, "#f1b6da" ], [ 0.4, "#fde0ef" ], [ 0.5, "#f7f7f7" ], [ 0.6, "#e6f5d0" ], [ 0.7, "#b8e186" ], [ 0.8, "#7fbc41" ], [ 0.9, "#4d9221" ], [ 1, "#276419" ] ], "sequential": [ [ 0, "#0508b8" ], [ 0.0893854748603352, "#1910d8" ], [ 0.1787709497206704, "#3c19f0" ], [ 0.2681564245810056, "#6b1cfb" ], [ 0.3575418994413408, "#981cfd" ], [ 0.44692737430167595, "#bf1cfd" ], [ 0.5363128491620112, "#dd2bfd" ], [ 0.6256983240223464, "#f246fe" ], [ 0.7150837988826816, "#fc67fd" ], [ 0.8044692737430168, "#fe88fc" ], [ 0.8938547486033519, "#fea5fd" ], [ 0.9832402234636871, "#febefe" ], [ 1, "#fec3fe" ] ], "sequentialminus": [ [ 0, "#0508b8" ], [ 0.0893854748603352, "#1910d8" ], [ 0.1787709497206704, "#3c19f0" ], [ 0.2681564245810056, "#6b1cfb" ], [ 0.3575418994413408, "#981cfd" ], [ 0.44692737430167595, "#bf1cfd" ], [ 0.5363128491620112, "#dd2bfd" ], [ 0.6256983240223464, "#f246fe" ], [ 0.7150837988826816, "#fc67fd" ], [ 0.8044692737430168, "#fe88fc" ], [ 0.8938547486033519, "#fea5fd" ], [ 0.9832402234636871, "#febefe" ], [ 1, "#fec3fe" ] ] }, "plot_bgcolor": "white", "paper_bgcolor": "white", "shapedefaults": { "line": { "width": 0 }, "opacity": 0.4, "fillcolor": "#506784" }, "annotationdefaults": { "arrowhead": 0, "arrowcolor": "#506784", "arrowwidth": 1 } }, "themeRef": "PLOTLY_WHITE" } } }, "height": null, "width": null, "user": { "profile_url": "https://chart-studio.plotly.com/~d.gribanov", "avatar_url": "https://storage.googleapis.com/plotly-prod-profiles/50.jpg", "background_url": "https://storage.googleapis.com/plotly-prod-profiles/bg-5.jpg", "bio": "", "nickname": "", "website": "", "stream_tokens": null, "feature_set_id": null, "csrf_token": null, "date_joined": "2024-04-04 10:44:52", "mapbox_access_tokens": null, "has_password": null, "username": "d.gribanov", "email": null, "is_active": null, "readonly": null, "is_dash_creator": null, "dash_created_count": null, "is_chart_creator": null, "charts_created_count": null } } ] }
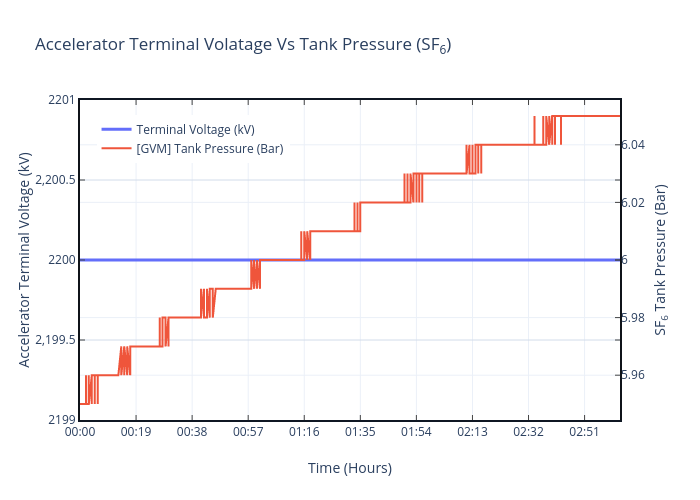
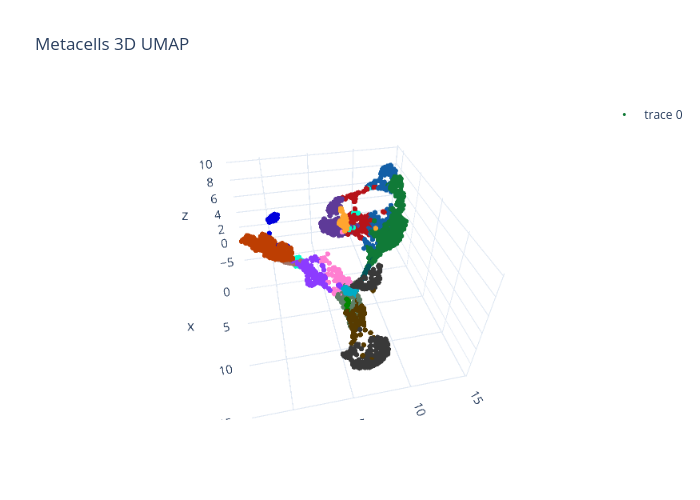
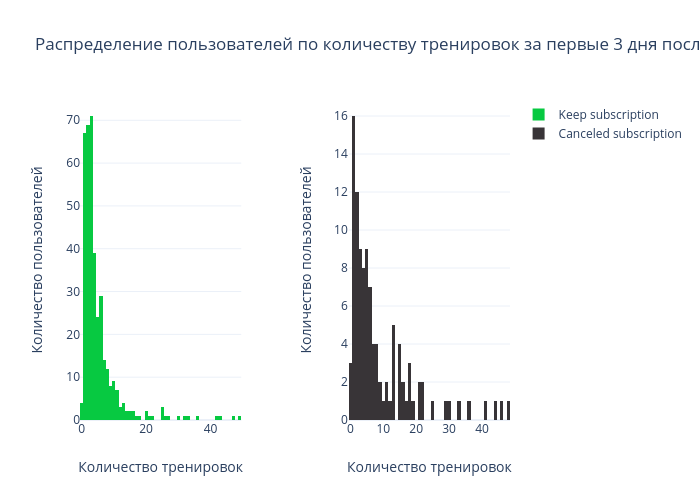