Plots List
Plots
This endpoint handles manipulation of Plotly plot files.
Reference
Authorization
Any user with or without a Plotly account may view public plots. For private plots, see authentication.
Actions
list
Listing all public plots can be done via a GET request to this endpoint.
By default, plots will be listed in order of date created. The order_by
query parameter is accepted at this endpoint. Currently, only ordering by
views is supported. It is possible to filter the plots by quality
with min_quality or max_quality as query parameter.
Example:
// GET https://api.plotly.com/v2/plots/ ---> 200

// GET https://api.plotly.com/v2/plots/?order_by=-views ---> 200

// GET https://api.plotly.com/v2/plots/?min_quality=5 ---> 200

// GET https://api.plotly.com/v2/plots/?max_quality=5 ---> 200
feed
Listing all handpicked feed plots can be done via a GET request to this endpoint. By default, plots will be listed in a random order.
Example:
// GET https://api.plotly.com/v2/plots/feed ---> 200
create
You can create new plot resources here. The only required field is 'figure'. Currently, the figure is restricted to only contain references to grid data. That is, this will fail if raw data arrays are passed in. To create and manipulate underlying grids for plots, see the grids endpoint.
Example:
// This fails because a figure field is required.
// POST https://api.plotly.com/v2/plots ---> 400 Bad Request
{}

// This fails because the figure has raw data
//POST https://api.plotly.com/v2/plots ---> 400 Bad Request
{
    "figure": {"data": [{"y": ['this', 'is', 'raw', 'data']}]}
}

// This succeeds because the figure has src keys, not raw data.
//POST https://api.plotly.com/v2/plots ---> 200 OK
{
    "figure": {"data": [{"ysrc": "sven:88:u8nd62"}]}
}
When creating a grid, you can optionally specify a source_fid to specify where a plot has come from:
- source_fid: the fid of a plot that was copied (and presumably edited) to produce this one
detail
There is a lot of meta information stored about plot files including filename, title, share_url, and content_url to name a few.
This information can only be reached with a GET to this endpoint.
Example:
// GET https://api.plotly.com/v2/plots/iheartgraphs:90
content
The contents of a plot can be downloaded via the content resource. The plot
content contains referenced grid/column data by default. If you wish to
return the raw grid/column data, the inline_data=true query must be included
in the request url. The Content-Type header will be appropriately set for the
response body.
Alternatively, you can set ?map_data=unreadable to append a mapping of
sources to data that belongs to grids which are unreadable for the
requestor. This is useful when you have read access to another users plot,
but that plot contains grid references which you don't have access to.
Examples:
// Returns referenced grid/column data
// GET https://api.plotly.com/v2/plots/iheartgraphs:90/content ---> 200 OK

// Returns full grid/column data
// GET https://api.plotly.com/v2/plots/iheartgraphs:90/content?inline_data=true ---> 200 OK

// Returns full grid/column data when requestor doesn't have permission
// to read the referenced grid.
// GET https://api.plotly.com/v2/plots/iheartgraphs:90/content?map_data=unreadable ---> 200 OK
GET /v2/plots?cursor=cj0xJnA9MjAyNC0wNC0wMysyMyUzQTQ1JTNBMTEuMDMyMTc1JTJCMDAlM0EwMA%3D%3D&format=api
{ "next": "https://api.plot.ly/v2/plots?cursor=cD0yMDI0LTA0LTAzKzIzJTNBNTclM0E0NC41MDI4OTIlMkIwMCUzQTAw&format=api", "previous": "https://api.plot.ly/v2/plots?cursor=cj0xJnA9MjAyNC0wNC0wNCswMCUzQTQ4JTNBMDcuODYwOTA5JTJCMDAlM0EwMA%3D%3D&format=api", "results": [ { "creation_time": "2024-04-04T00:48:07.860909Z", "comments": { "results": [], "count": 0 }, "parented": true, "embed_url": "https://chart-studio.plotly.com/~mjhawkins84/5.embed", "fid": "mjhawkins84:5", "filename": "Plot 5", "filetype": "plot", "img_url": "https://storage.googleapis.com/plotly-prod-images/mjhawkins84/5/9_DT3E9T0SJ3C3ZHOOGIBTFLD4OI3Y4P.png", "image_urls": { "default": "https://storage.googleapis.com/plotly-prod-images/mjhawkins84/5/2_VJU6A9BD836KWIMJ2K95ABIT7NTOCL.png", "block-thumb": "https://storage.googleapis.com/plotly-prod-images/mjhawkins84/5/8_CYUBWPM8UWJ57DA3D31FIOKKGXU8RS.png", "list-thumb": "https://storage.googleapis.com/plotly-prod-images/mjhawkins84/5/9_DT3E9T0SJ3C3ZHOOGIBTFLD4OI3Y4P.png" }, "api_urls": { "files": "https://api.plotly.com/v2/files/mjhawkins84:5", "plots": "https://api.plotly.com/v2/plots/mjhawkins84:5", "parent": "https://api.plotly.com/v2/folders/home?user=mjhawkins84" }, "owner": "mjhawkins84", "parent": -1, "preview": "", "referencers": [], "references": [], "title": "", "views": 1, "web_url": "https://chart-studio.plotly.com/~mjhawkins84/5/", "world_readable": true, "date_modified": "2024-04-22T01:24:45.623Z", "stars": { "results": [], "count": 0 }, "collaborators": { "results": [], "count": 0 }, "subfolder_count": null, "refresh_interval": null, "organize_view_url": "https://chart-studio.plotly.com/~mjhawkins84/5/", "current_user_permission": "read", "is_theme": null, "is_template": false, "autosize": true, "caption": "", "figure": { "data": [ { "line": { "color": "rgb(33, 181, 178)", "shape": "spline", "width": 4, "smoothing": 1 }, "meta": { "columnNames": { "x": "A", "y": "B", "text": "" } }, "mode": "lines", "name": "Transaction spend", "type": "bar", "xsrc": "mjhawkins84:4:8a8123", "ysrc": "mjhawkins84:4:d21273", "xaxis": "x", "visible": true, "hoverinfo": "y+name", "hoverlabel": { "namelength": -1 }, "showlegend": true, "orientation": "v", "hovertemplate": "" }, { "line": { "color": "rgb(0, 0, 0)", "shape": "spline", "width": 4, "smoothing": 1 }, "meta": { "columnNames": { "x": "A", "y": "C" } }, "mode": "lines", "name": "HGS Credits", "type": "scatter", "xsrc": "mjhawkins84:4:8a8123", "ysrc": "mjhawkins84:4:243b0b", "xaxis": "x", "yaxis": "y2", "visible": true, "hoverinfo": "y+name", "hoverlabel": { "namelength": -1 }, "stackgroup": null }, { "line": { "width": 4 }, "meta": { "columnNames": { "x": "A", "y": "D" } }, "mode": "lines", "name": "Tresury Balance", "type": "scatter", "xsrc": "mjhawkins84:4:8a8123", "ysrc": "mjhawkins84:4:f4f34b", "yaxis": "y2", "stackgroup": null }, { "line": { "dash": "solid", "width": 4 }, "meta": { "columnNames": { "x": "A", "y": "E" } }, "mode": "lines", "name": "Reserve Balance", "type": "scatter", "xsrc": "mjhawkins84:4:8a8123", "ysrc": "mjhawkins84:4:76b821", "yaxis": "y2", "stackgroup": null } ], "frames": [], "layout": { "title": { "x": 0.06 }, "xaxis": { "type": "category", "range": [ -0.5, 2.5 ], "ticks": "", "title": { "text": "<br>" }, "domain": [ 0, 1 ], "tickson": "labels", "showgrid": false, "showline": false, "autorange": true, "gridcolor": "#EBF0F8", "gridwidth": 0, "fixedrange": false, "rangeslider": { "range": [ 0, 10 ], "yaxis": {}, "yaxis2": {}, "yaxis3": {}, "visible": false, "autorange": true }, "showexponent": "none", "exponentformat": "none", "showticklabels": true }, "yaxis": { "side": "left", "type": "linear", "range": [ 0, 0.001182105263157895 ], "ticks": "", "title": { "text": "<br>" }, "domain": [ 0, 1 ], "showgrid": false, "zeroline": true, "autorange": true, "tickangle": "auto", "automargin": true, "tickprefix": "$", "ticksuffix": "", "exponentformat": "none", "showticklabels": true, "separatethousands": false }, "legend": { "x": 1.02, "y": 1.1, "xanchor": "right", "orientation": "h" }, "yaxis2": { "side": "right", "type": "linear", "range": [ 13.72111111111111, 99.29888888888888 ], "title": { "text": "HGS Credits" }, "zeroline": true, "autorange": true, "overlaying": "y" }, "modebar": { "orientation": "h" }, "autosize": true, "template": { "data": { "bar": [ { "type": "bar", "marker": { "colorbar": { "ticks": "", "outlinewidth": 0 } } } ], "table": [ { "type": "table", "cells": { "fill": { "color": "#EBF0F8" }, "line": { "color": "white" } }, "header": { "fill": { "color": "#C8D4E3" }, "line": { "color": "white" } } } ], "carpet": [ { "type": "carpet", "aaxis": { "gridcolor": "#C8D4E3", "linecolor": "#C8D4E3", "endlinecolor": "#2a3f5f", "minorgridcolor": "#C8D4E3", "startlinecolor": "#2a3f5f" }, "baxis": { "gridcolor": "#C8D4E3", "linecolor": "#C8D4E3", "endlinecolor": "#2a3f5f", "minorgridcolor": "#C8D4E3", "startlinecolor": "#2a3f5f" } } ], "mesh3d": [ { "type": "mesh3d", "colorbar": { "ticks": "", "outlinewidth": 0 } } ], "contour": [ { "type": "contour", "colorbar": { "ticks": "", "outlinewidth": 0 }, "autocolorscale": true } ], "heatmap": [ { "type": "heatmap", "colorbar": { "ticks": "", "outlinewidth": 0 }, "autocolorscale": true } ], "scatter": [ { "type": "scatter", "marker": { "colorbar": { "ticks": "", "outlinewidth": 0 } } } ], "surface": [ { "type": "surface", "colorbar": { "ticks": "", "outlinewidth": 0 } } ], "heatmapgl": [ { "type": "heatmapgl", "colorbar": { "ticks": "", "outlinewidth": 0 } } ], "histogram": [ { "type": "histogram", "marker": { "colorbar": { "ticks": "", "outlinewidth": 0 } } } ], "parcoords": [ { "line": { "colorbar": { "ticks": "", "outlinewidth": 0 } }, "type": "parcoords" } ], "scatter3d": [ { "type": "scatter3d", "marker": { "colorbar": { "ticks": "", "outlinewidth": 0 } } } ], "scattergl": [ { "type": "scattergl", "marker": { "colorbar": { "ticks": "", "outlinewidth": 0 } } } ], "choropleth": [ { "type": "choropleth", "colorbar": { "ticks": "", "outlinewidth": 0 } } ], "scattergeo": [ { "type": "scattergeo", "marker": { "colorbar": { "ticks": "", "outlinewidth": 0 } } } ], "histogram2d": [ { "type": "histogram2d", "colorbar": { "ticks": "", "outlinewidth": 0 }, "autocolorscale": true } ], "scatterpolar": [ { "type": "scatterpolar", "marker": { "colorbar": { "ticks": "", "outlinewidth": 0 } } } ], "contourcarpet": [ { "type": "contourcarpet", "colorbar": { "ticks": "", "outlinewidth": 0 } } ], "scattercarpet": [ { "type": "scattercarpet", "marker": { "colorbar": { "ticks": "", "outlinewidth": 0 } } } ], "scattermapbox": [ { "type": "scattermapbox", "marker": { "colorbar": { "ticks": "", "outlinewidth": 0 } } } ], "scatterpolargl": [ { "type": "scatterpolargl", "marker": { "colorbar": { "ticks": "", "outlinewidth": 0 } } } ], "scatterternary": [ { "type": "scatterternary", "marker": { "colorbar": { "ticks": "", "outlinewidth": 0 } } } ], "histogram2dcontour": [ { "type": "histogram2dcontour", "colorbar": { "ticks": "", "outlinewidth": 0 }, "autocolorscale": true } ] }, "layout": { "geo": { "bgcolor": "white", "showland": true, "lakecolor": "white", "landcolor": "white", "showlakes": true, "subunitcolor": "#C8D4E3" }, "font": { "color": "#2a3f5f" }, "polar": { "bgcolor": "white", "radialaxis": { "ticks": "", "gridcolor": "#EBF0F8", "linecolor": "#EBF0F8" }, "angularaxis": { "ticks": "", "gridcolor": "#EBF0F8", "linecolor": "#EBF0F8" } }, "scene": { "xaxis": { "ticks": "", "gridcolor": "#DFE8F3", "gridwidth": 2, "linecolor": "#EBF0F8", "zerolinecolor": "#EBF0F8", "showbackground": true, "backgroundcolor": "white" }, "yaxis": { "ticks": "", "gridcolor": "#DFE8F3", "gridwidth": 2, "linecolor": "#EBF0F8", "zerolinecolor": "#EBF0F8", "showbackground": true, "backgroundcolor": "white" }, "zaxis": { "ticks": "", "gridcolor": "#DFE8F3", "gridwidth": 2, "linecolor": "#EBF0F8", "zerolinecolor": "#EBF0F8", "showbackground": true, "backgroundcolor": "white" } }, "title": { "x": 0.05 }, "xaxis": { "ticks": "", "gridcolor": "#EBF0F8", "linecolor": "#EBF0F8", "automargin": true, "zerolinecolor": "#EBF0F8", "zerolinewidth": 2 }, "yaxis": { "ticks": "", "gridcolor": "#EBF0F8", "linecolor": "#EBF0F8", "automargin": true, "zerolinecolor": "#EBF0F8", "zerolinewidth": 2 }, "ternary": { "aaxis": { "ticks": "", "gridcolor": "#DFE8F3", "linecolor": "#A2B1C6" }, "baxis": { "ticks": "", "gridcolor": "#DFE8F3", "linecolor": "#A2B1C6" }, "caxis": { "ticks": "", "gridcolor": "#DFE8F3", "linecolor": "#A2B1C6" }, "bgcolor": "white" }, "colorway": [ "#636efa", "#EF553B", "#00cc96", "#ab63fa", "#19d3f3", "#e763fa", "#fecb52", "#ffa15a", "#ff6692", "#b6e880" ], "hovermode": "closest", "colorscale": { "diverging": [ [ 0, "#8e0152" ], [ 0.1, "#c51b7d" ], [ 0.2, "#de77ae" ], [ 0.3, "#f1b6da" ], [ 0.4, "#fde0ef" ], [ 0.5, "#f7f7f7" ], [ 0.6, "#e6f5d0" ], [ 0.7, "#b8e186" ], [ 0.8, "#7fbc41" ], [ 0.9, "#4d9221" ], [ 1, "#276419" ] ], "sequential": [ [ 0, "#0508b8" ], [ 0.0893854748603352, "#1910d8" ], [ 0.1787709497206704, "#3c19f0" ], [ 0.2681564245810056, "#6b1cfb" ], [ 0.3575418994413408, "#981cfd" ], [ 0.44692737430167595, "#bf1cfd" ], [ 0.5363128491620112, "#dd2bfd" ], [ 0.6256983240223464, "#f246fe" ], [ 0.7150837988826816, "#fc67fd" ], [ 0.8044692737430168, "#fe88fc" ], [ 0.8938547486033519, "#fea5fd" ], [ 0.9832402234636871, "#febefe" ], [ 1, "#fec3fe" ] ], "sequentialminus": [ [ 0, "#0508b8" ], [ 0.0893854748603352, "#1910d8" ], [ 0.1787709497206704, "#3c19f0" ], [ 0.2681564245810056, "#6b1cfb" ], [ 0.3575418994413408, "#981cfd" ], [ 0.44692737430167595, "#bf1cfd" ], [ 0.5363128491620112, "#dd2bfd" ], [ 0.6256983240223464, "#f246fe" ], [ 0.7150837988826816, "#fc67fd" ], [ 0.8044692737430168, "#fe88fc" ], [ 0.8938547486033519, "#fea5fd" ], [ 0.9832402234636871, "#febefe" ], [ 1, "#fec3fe" ] ] }, "plot_bgcolor": "white", "paper_bgcolor": "white", "shapedefaults": { "line": { "width": 0 }, "opacity": 0.4, "fillcolor": "#506784" }, "annotationdefaults": { "arrowhead": 0, "arrowcolor": "#506784", "arrowwidth": 1 } }, "themeRef": "PLOTLY_WHITE" }, "hoverlabel": { "font": { "size": 14 } }, "showlegend": true } }, "height": null, "width": null, "user": { "profile_url": "https://chart-studio.plotly.com/~mjhawkins84", "avatar_url": "https://storage.googleapis.com/plotly-prod-profiles/66.jpg", "background_url": "https://storage.googleapis.com/plotly-prod-profiles/bg-1.jpg", "bio": "", "nickname": "", "website": "", "stream_tokens": null, "feature_set_id": null, "csrf_token": null, "date_joined": "2023-10-26 03:53:53", "mapbox_access_tokens": null, "has_password": null, "username": "mjhawkins84", "email": null, "is_active": null, "readonly": null, "is_dash_creator": null, "dash_created_count": null, "is_chart_creator": null, "charts_created_count": null } }, { "creation_time": "2024-04-04T00:47:09.299940Z", "comments": { "results": [], "count": 0 }, "parented": true, "embed_url": "https://chart-studio.plotly.com/~DORITOS12/68.embed", "fid": "DORITOS12:68", "filename": "IRA ST T MED MAX MIN 1", "filetype": "plot", "img_url": "https://storage.googleapis.com/plotly-prod-images/DORITOS12/68/9_5DU3ARJ29G8XXVI5CPM0P8WEYHALHI.png", "image_urls": { "default": "https://storage.googleapis.com/plotly-prod-images/DORITOS12/68/2_ZBGUCLYQFLDIIO1PVGLRVX1DK9E6AJ.png", "block-thumb": "https://storage.googleapis.com/plotly-prod-images/DORITOS12/68/8_HXSLJ8UV1SNO24L3F77H02RHHE10FN.png", "list-thumb": "https://storage.googleapis.com/plotly-prod-images/DORITOS12/68/9_5DU3ARJ29G8XXVI5CPM0P8WEYHALHI.png" }, "api_urls": { "files": "https://api.plotly.com/v2/files/DORITOS12:68", "plots": "https://api.plotly.com/v2/plots/DORITOS12:68", "parent": "https://api.plotly.com/v2/folders/home?user=DORITOS12" }, "owner": "DORITOS12", "parent": -1, "preview": "", "referencers": [], "references": [], "title": "", "views": 1, "web_url": "https://chart-studio.plotly.com/~DORITOS12/68/", "world_readable": true, "date_modified": "2024-04-11T00:06:08.583Z", "stars": { "results": [], "count": 0 }, "collaborators": { "results": [], "count": 0 }, "subfolder_count": null, "refresh_interval": null, "organize_view_url": "https://chart-studio.plotly.com/~DORITOS12/68/", "current_user_permission": "read", "is_theme": null, "is_template": false, "autosize": true, "caption": "", "figure": { "data": [ { "line": { "color": "rgb(54, 79, 113)", "width": 2 }, "meta": { "columnNames": { "x": "month", "y": "T media" } }, "mode": "lines", "name": "T Media", "type": "scatter", "xsrc": "DORITOS12:67:8b2352", "ysrc": "DORITOS12:67:a0cc2e" }, { "line": { "color": "rgb(233, 14, 64)" }, "meta": { "columnNames": { "x": "", "y": "T máxima" } }, "mode": "lines", "name": "T Máxima", "type": "scatter", "ysrc": "DORITOS12:67:56ca10", "stackgroup": null }, { "line": { "color": "rgb(14, 37, 219)" }, "meta": { "columnNames": { "y": "T mínima" } }, "mode": "lines", "name": "T Mínima", "type": "scatter", "ysrc": "DORITOS12:67:64fe32", "stackgroup": null } ], "frames": [], "layout": { "font": { "size": 20 }, "title": { "font": { "size": 17 }, "text": "" }, "xaxis": { "side": "bottom", "type": "linear", "range": [ 0, 228 ], "ticks": "", "title": { "text": "Meses" }, "domain": [ 0, 1 ], "showline": false, "autorange": true, "automargin": true, "showspikes": false, "showticklabels": true }, "yaxis": { "type": "linear", "range": [ 27, 31 ], "title": { "text": "Temperatura °C" }, "domain": [ 0, 1 ], "autorange": false }, "legend": { "x": 0.5, "y": -0.3, "valign": "top", "xanchor": "center", "yanchor": "auto", "orientation": "h" }, "margin": { "b": 50, "l": 31, "r": 30, "t": 16 }, "autosize": true, "dragmode": "pan", "template": { "data": { "bar": [ { "type": "bar", "marker": { "colorbar": { "ticks": "outside", "ticklen": 8, "tickcolor": "rgb(36,36,36)", "tickwidth": 2, "outlinewidth": 0 } } } ], "table": [ { "type": "table", "cells": { "fill": { "color": "rgb(231,231,240)" }, "line": { "color": "white" } }, "header": { "fill": { "color": "rgb(183,183,191)" }, "line": { "color": "white" } } } ], "carpet": [ { "type": "carpet", "aaxis": { "gridcolor": "white", "linecolor": "white", "endlinecolor": "rgb(36,36,36)", "minorgridcolor": "white", "startlinecolor": "rgb(36,36,36)" }, "baxis": { "gridcolor": "white", "linecolor": "white", "endlinecolor": "rgb(36,36,36)", "minorgridcolor": "white", "startlinecolor": "rgb(36,36,36)" } } ], "mesh3d": [ { "type": "mesh3d", "colorbar": { "ticks": "outside", "ticklen": 8, "tickcolor": "rgb(36,36,36)", "tickwidth": 2, "outlinewidth": 0 } } ], "contour": [ { "type": "contour", "colorbar": { "ticks": "outside", "ticklen": 8, "tickcolor": "rgb(36,36,36)", "tickwidth": 2, "outlinewidth": 0 }, "autocolorscale": true } ], "heatmap": [ { "type": "heatmap", "colorbar": { "ticks": "outside", "ticklen": 8, "tickcolor": "rgb(36,36,36)", "tickwidth": 2, "outlinewidth": 0 }, "autocolorscale": true } ], "scatter": [ { "type": "scatter", "marker": { "colorbar": { "ticks": "outside", "ticklen": 8, "tickcolor": "rgb(36,36,36)", "tickwidth": 2, "outlinewidth": 0 } } } ], "surface": [ { "type": "surface", "colorbar": { "ticks": "outside", "ticklen": 8, "tickcolor": "rgb(36,36,36)", "tickwidth": 2, "outlinewidth": 0 } } ], "heatmapgl": [ { "type": "heatmapgl", "colorbar": { "ticks": "outside", "ticklen": 8, "tickcolor": "rgb(36,36,36)", "tickwidth": 2, "outlinewidth": 0 } } ], "histogram": [ { "type": "histogram", "marker": { "colorbar": { "ticks": "outside", "ticklen": 8, "tickcolor": "rgb(36,36,36)", "tickwidth": 2, "outlinewidth": 0 } } } ], "parcoords": [ { "line": { "colorbar": { "ticks": "outside", "ticklen": 8, "tickcolor": "rgb(36,36,36)", "tickwidth": 2, "outlinewidth": 0 } }, "type": "parcoords" } ], "scatter3d": [ { "type": "scatter3d", "marker": { "colorbar": { "ticks": "outside", "ticklen": 8, "tickcolor": "rgb(36,36,36)", "tickwidth": 2, "outlinewidth": 0 } } } ], "scattergl": [ { "type": "scattergl", "marker": { "colorbar": { "ticks": "outside", "ticklen": 8, "tickcolor": "rgb(36,36,36)", "tickwidth": 2, "outlinewidth": 0 } } } ], "choropleth": [ { "type": "choropleth", "colorbar": { "ticks": "outside", "ticklen": 8, "tickcolor": "rgb(36,36,36)", "tickwidth": 2, "outlinewidth": 0 } } ], "scattergeo": [ { "type": "scattergeo", "marker": { "colorbar": { "ticks": "outside", "ticklen": 8, "tickcolor": "rgb(36,36,36)", "tickwidth": 2, "outlinewidth": 0 } } } ], "histogram2d": [ { "type": "histogram2d", "colorbar": { "ticks": "outside", "ticklen": 8, "tickcolor": "rgb(36,36,36)", "tickwidth": 2, "outlinewidth": 0 }, "autocolorscale": true } ], "scatterpolar": [ { "type": "scatterpolar", "marker": { "colorbar": { "ticks": "outside", "ticklen": 8, "tickcolor": "rgb(36,36,36)", "tickwidth": 2, "outlinewidth": 0 } } } ], "contourcarpet": [ { "type": "contourcarpet", "colorbar": { "ticks": "outside", "ticklen": 8, "tickcolor": "rgb(36,36,36)", "tickwidth": 2, "outlinewidth": 0 } } ], "scattercarpet": [ { "type": "scattercarpet", "marker": { "colorbar": { "ticks": "outside", "ticklen": 8, "tickcolor": "rgb(36,36,36)", "tickwidth": 2, "outlinewidth": 0 } } } ], "scattermapbox": [ { "type": "scattermapbox", "marker": { "colorbar": { "ticks": "outside", "ticklen": 8, "tickcolor": "rgb(36,36,36)", "tickwidth": 2, "outlinewidth": 0 } } } ], "scatterpolargl": [ { "type": "scatterpolargl", "marker": { "colorbar": { "ticks": "outside", "ticklen": 8, "tickcolor": "rgb(36,36,36)", "tickwidth": 2, "outlinewidth": 0 } } } ], "scatterternary": [ { "type": "scatterternary", "marker": { "colorbar": { "ticks": "outside", "ticklen": 8, "tickcolor": "rgb(36,36,36)", "tickwidth": 2, "outlinewidth": 0 } } } ], "histogram2dcontour": [ { "type": "histogram2dcontour", "colorbar": { "ticks": "outside", "ticklen": 8, "tickcolor": "rgb(36,36,36)", "tickwidth": 2, "outlinewidth": 0 }, "autocolorscale": true } ] }, "layout": { "geo": { "bgcolor": "white", "showland": true, "lakecolor": "white", "landcolor": "rgb(234,234,242)", "showlakes": true, "subunitcolor": "white" }, "font": { "color": "rgb(36,36,36)" }, "polar": { "bgcolor": "rgb(234,234,242)", "radialaxis": { "ticks": "", "showgrid": true, "gridcolor": "white", "linecolor": "white" }, "angularaxis": { "ticks": "", "showgrid": true, "gridcolor": "white", "linecolor": "white" } }, "scene": { "xaxis": { "ticks": "", "showgrid": true, "gridcolor": "white", "gridwidth": 2, "linecolor": "white", "zerolinecolor": "white", "showbackground": true, "backgroundcolor": "rgb(234,234,242)" }, "yaxis": { "ticks": "", "showgrid": true, "gridcolor": "white", "gridwidth": 2, "linecolor": "white", "zerolinecolor": "white", "showbackground": true, "backgroundcolor": "rgb(234,234,242)" }, "zaxis": { "ticks": "", "showgrid": true, "gridcolor": "white", "gridwidth": 2, "linecolor": "white", "zerolinecolor": "white", "showbackground": true, "backgroundcolor": "rgb(234,234,242)" } }, "xaxis": { "ticks": "", "showgrid": true, "gridcolor": "white", "linecolor": "white", "automargin": true, "zerolinecolor": "white" }, "yaxis": { "ticks": "", "showgrid": true, "gridcolor": "white", "linecolor": "white", "automargin": true, "zerolinecolor": "white" }, "ternary": { "aaxis": { "ticks": "", "showgrid": true, "gridcolor": "white", "linecolor": "white" }, "baxis": { "ticks": "", "showgrid": true, "gridcolor": "white", "linecolor": "white" }, "caxis": { "ticks": "", "showgrid": true, "gridcolor": "white", "linecolor": "white" }, "bgcolor": "rgb(234,234,242)" }, "colorway": [ "rgb(76,114,176)", "rgb(221,132,82)", "rgb(85,168,104)", "rgb(196,78,82)", "rgb(129,114,179)", "rgb(147,120,96)", "rgb(218,139,195)", "rgb(140,140,140)", "rgb(204,185,116)", "rgb(100,181,205)" ], "hovermode": "closest", "colorscale": { "diverging": [ [ 0, "#67001f" ], [ 0.1, "#b2182b" ], [ 0.2, "#d6604d" ], [ 0.3, "#f4a582" ], [ 0.4, "#fddbc7" ], [ 0.5, "#f7f7f7" ], [ 0.6, "#d1e5f0" ], [ 0.7, "#92c5de" ], [ 0.8, "#4393c3" ], [ 0.9, "#2166ac" ], [ 1, "#053061" ] ], "sequential": [ [ 0, "rgb(2,4,25)" ], [ 0.06274509803921569, "rgb(24,15,41)" ], [ 0.12549019607843137, "rgb(47,23,57)" ], [ 0.18823529411764706, "rgb(71,28,72)" ], [ 0.25098039215686274, "rgb(97,30,82)" ], [ 0.3137254901960784, "rgb(123,30,89)" ], [ 0.3764705882352941, "rgb(150,27,91)" ], [ 0.4392156862745098, "rgb(177,22,88)" ], [ 0.5019607843137255, "rgb(203,26,79)" ], [ 0.5647058823529412, "rgb(223,47,67)" ], [ 0.6274509803921569, "rgb(236,76,61)" ], [ 0.6901960784313725, "rgb(242,107,73)" ], [ 0.7529411764705882, "rgb(244,135,95)" ], [ 0.8156862745098039, "rgb(245,162,122)" ], [ 0.8784313725490196, "rgb(246,188,153)" ], [ 0.9411764705882353, "rgb(247,212,187)" ], [ 1, "rgb(250,234,220)" ] ], "sequentialminus": [ [ 0, "rgb(2,4,25)" ], [ 0.06274509803921569, "rgb(24,15,41)" ], [ 0.12549019607843137, "rgb(47,23,57)" ], [ 0.18823529411764706, "rgb(71,28,72)" ], [ 0.25098039215686274, "rgb(97,30,82)" ], [ 0.3137254901960784, "rgb(123,30,89)" ], [ 0.3764705882352941, "rgb(150,27,91)" ], [ 0.4392156862745098, "rgb(177,22,88)" ], [ 0.5019607843137255, "rgb(203,26,79)" ], [ 0.5647058823529412, "rgb(223,47,67)" ], [ 0.6274509803921569, "rgb(236,76,61)" ], [ 0.6901960784313725, "rgb(242,107,73)" ], [ 0.7529411764705882, "rgb(244,135,95)" ], [ 0.8156862745098039, "rgb(245,162,122)" ], [ 0.8784313725490196, "rgb(246,188,153)" ], [ 0.9411764705882353, "rgb(247,212,187)" ], [ 1, "rgb(250,234,220)" ] ] }, "plot_bgcolor": "rgb(234,234,242)", "paper_bgcolor": "white", "shapedefaults": { "line": { "width": 0 }, "opacity": 0.5, "fillcolor": "rgb(67,103,167)" }, "annotationdefaults": { "arrowcolor": "rgb(67,103,167)" } }, "themeRef": "SEABORN" }, "annotations": [ { "x": 5, "y": 30.8, "text": "d)", "showarrow": false } ], "plot_bgcolor": "rgb(227, 227, 234)" } }, "height": null, "width": null, "user": { "profile_url": "https://chart-studio.plotly.com/~DORITOS12", "avatar_url": "https://storage.googleapis.com/plotly-prod-profiles/50.jpg", "background_url": "https://storage.googleapis.com/plotly-prod-profiles/bg-2.jpg", "bio": "", "nickname": "", "website": "", "stream_tokens": null, "feature_set_id": null, "csrf_token": null, "date_joined": "2024-02-24 22:37:07", "mapbox_access_tokens": null, "has_password": null, "username": "DORITOS12", "email": null, "is_active": null, "readonly": null, "is_dash_creator": null, "dash_created_count": null, "is_chart_creator": null, "charts_created_count": null } }, { "creation_time": "2024-04-04T00:44:19.701213Z", "comments": { "results": [], "count": 0 }, "parented": true, "embed_url": "https://chart-studio.plotly.com/~DORITOS12/65.embed", "fid": "DORITOS12:65", "filename": "IRA ST NDVI 1", "filetype": "plot", "img_url": "https://storage.googleapis.com/plotly-prod-images/DORITOS12/65/9_0GHFHV1EJKAO5KOMDHLZGBGU0GRNE7.png", "image_urls": { "default": "https://storage.googleapis.com/plotly-prod-images/DORITOS12/65/2_L8T7MAXV7LC65UJXY7AD18X9JJQ9UM.png", "block-thumb": "https://storage.googleapis.com/plotly-prod-images/DORITOS12/65/8_83ON16LL8MTXU9PUPN25K4ZP5GRRWE.png", "list-thumb": "https://storage.googleapis.com/plotly-prod-images/DORITOS12/65/9_0GHFHV1EJKAO5KOMDHLZGBGU0GRNE7.png" }, "api_urls": { "files": "https://api.plotly.com/v2/files/DORITOS12:65", "plots": "https://api.plotly.com/v2/plots/DORITOS12:65", "parent": "https://api.plotly.com/v2/folders/home?user=DORITOS12" }, "owner": "DORITOS12", "parent": -1, "preview": "", "referencers": [], "references": [], "title": "", "views": 2, "web_url": "https://chart-studio.plotly.com/~DORITOS12/65/", "world_readable": true, "date_modified": "2024-04-04T00:46:29.112Z", "stars": { "results": [], "count": 0 }, "collaborators": { "results": [], "count": 0 }, "subfolder_count": null, "refresh_interval": null, "organize_view_url": "https://chart-studio.plotly.com/~DORITOS12/65/", "current_user_permission": "read", "is_theme": null, "is_template": false, "autosize": true, "caption": "", "figure": { "data": [ { "line": { "color": "rgb(55, 110, 45)" }, "meta": { "columnNames": { "x": "month", "y": "NDVI" } }, "mode": "lines", "name": "Albedo NIR", "type": "scatter", "xsrc": "DORITOS12:66:1efb9f", "ysrc": "DORITOS12:66:064424" } ], "frames": [], "layout": { "font": { "color": "rgb(28, 27, 27)" }, "title": { "font": { "size": 17 }, "text": "" }, "xaxis": { "type": "linear", "range": [ 1, 228 ], "title": { "text": "Meses" }, "domain": [ 0.125, 0.875 ], "autorange": true }, "yaxis": { "type": "linear", "range": [ 0.07673333333333332, 0.8240666666666666 ], "title": { "text": "NDVI" }, "domain": [ 0, 1 ], "autorange": true }, "legend": { "x": 0.8776051779935277, "y": 0.6766467065868264 }, "margin": { "b": 39, "l": 60, "r": 68, "t": 40 }, "autosize": true, "dragmode": "pan", "template": { "data": { "bar": [ { "type": "bar", "marker": { "colorbar": { "ticks": "outside", "ticklen": 8, "tickcolor": "rgb(36,36,36)", "tickwidth": 2, "outlinewidth": 0 } } } ], "table": [ { "type": "table", "cells": { "fill": { "color": "rgb(231,231,240)" }, "line": { "color": "white" } }, "header": { "fill": { "color": "rgb(183,183,191)" }, "line": { "color": "white" } } } ], "carpet": [ { "type": "carpet", "aaxis": { "gridcolor": "white", "linecolor": "white", "endlinecolor": "rgb(36,36,36)", "minorgridcolor": "white", "startlinecolor": "rgb(36,36,36)" }, "baxis": { "gridcolor": "white", "linecolor": "white", "endlinecolor": "rgb(36,36,36)", "minorgridcolor": "white", "startlinecolor": "rgb(36,36,36)" } } ], "mesh3d": [ { "type": "mesh3d", "colorbar": { "ticks": "outside", "ticklen": 8, "tickcolor": "rgb(36,36,36)", "tickwidth": 2, "outlinewidth": 0 } } ], "contour": [ { "type": "contour", "colorbar": { "ticks": "outside", "ticklen": 8, "tickcolor": "rgb(36,36,36)", "tickwidth": 2, "outlinewidth": 0 }, "autocolorscale": true } ], "heatmap": [ { "type": "heatmap", "colorbar": { "ticks": "outside", "ticklen": 8, "tickcolor": "rgb(36,36,36)", "tickwidth": 2, "outlinewidth": 0 }, "autocolorscale": true } ], "scatter": [ { "type": "scatter", "marker": { "colorbar": { "ticks": "outside", "ticklen": 8, "tickcolor": "rgb(36,36,36)", "tickwidth": 2, "outlinewidth": 0 } } } ], "surface": [ { "type": "surface", "colorbar": { "ticks": "outside", "ticklen": 8, "tickcolor": "rgb(36,36,36)", "tickwidth": 2, "outlinewidth": 0 } } ], "heatmapgl": [ { "type": "heatmapgl", "colorbar": { "ticks": "outside", "ticklen": 8, "tickcolor": "rgb(36,36,36)", "tickwidth": 2, "outlinewidth": 0 } } ], "histogram": [ { "type": "histogram", "marker": { "colorbar": { "ticks": "outside", "ticklen": 8, "tickcolor": "rgb(36,36,36)", "tickwidth": 2, "outlinewidth": 0 } } } ], "parcoords": [ { "line": { "colorbar": { "ticks": "outside", "ticklen": 8, "tickcolor": "rgb(36,36,36)", "tickwidth": 2, "outlinewidth": 0 } }, "type": "parcoords" } ], "scatter3d": [ { "type": "scatter3d", "marker": { "colorbar": { "ticks": "outside", "ticklen": 8, "tickcolor": "rgb(36,36,36)", "tickwidth": 2, "outlinewidth": 0 } } } ], "scattergl": [ { "type": "scattergl", "marker": { "colorbar": { "ticks": "outside", "ticklen": 8, "tickcolor": "rgb(36,36,36)", "tickwidth": 2, "outlinewidth": 0 } } } ], "choropleth": [ { "type": "choropleth", "colorbar": { "ticks": "outside", "ticklen": 8, "tickcolor": "rgb(36,36,36)", "tickwidth": 2, "outlinewidth": 0 } } ], "scattergeo": [ { "type": "scattergeo", "marker": { "colorbar": { "ticks": "outside", "ticklen": 8, "tickcolor": "rgb(36,36,36)", "tickwidth": 2, "outlinewidth": 0 } } } ], "histogram2d": [ { "type": "histogram2d", "colorbar": { "ticks": "outside", "ticklen": 8, "tickcolor": "rgb(36,36,36)", "tickwidth": 2, "outlinewidth": 0 }, "autocolorscale": true } ], "scatterpolar": [ { "type": "scatterpolar", "marker": { "colorbar": { "ticks": "outside", "ticklen": 8, "tickcolor": "rgb(36,36,36)", "tickwidth": 2, "outlinewidth": 0 } } } ], "contourcarpet": [ { "type": "contourcarpet", "colorbar": { "ticks": "outside", "ticklen": 8, "tickcolor": "rgb(36,36,36)", "tickwidth": 2, "outlinewidth": 0 } } ], "scattercarpet": [ { "type": "scattercarpet", "marker": { "colorbar": { "ticks": "outside", "ticklen": 8, "tickcolor": "rgb(36,36,36)", "tickwidth": 2, "outlinewidth": 0 } } } ], "scattermapbox": [ { "type": "scattermapbox", "marker": { "colorbar": { "ticks": "outside", "ticklen": 8, "tickcolor": "rgb(36,36,36)", "tickwidth": 2, "outlinewidth": 0 } } } ], "scatterpolargl": [ { "type": "scatterpolargl", "marker": { "colorbar": { "ticks": "outside", "ticklen": 8, "tickcolor": "rgb(36,36,36)", "tickwidth": 2, "outlinewidth": 0 } } } ], "scatterternary": [ { "type": "scatterternary", "marker": { "colorbar": { "ticks": "outside", "ticklen": 8, "tickcolor": "rgb(36,36,36)", "tickwidth": 2, "outlinewidth": 0 } } } ], "histogram2dcontour": [ { "type": "histogram2dcontour", "colorbar": { "ticks": "outside", "ticklen": 8, "tickcolor": "rgb(36,36,36)", "tickwidth": 2, "outlinewidth": 0 }, "autocolorscale": true } ] }, "layout": { "geo": { "bgcolor": "white", "showland": true, "lakecolor": "white", "landcolor": "rgb(234,234,242)", "showlakes": true, "subunitcolor": "white" }, "font": { "color": "rgb(36,36,36)" }, "polar": { "bgcolor": "rgb(234,234,242)", "radialaxis": { "ticks": "", "showgrid": true, "gridcolor": "white", "linecolor": "white" }, "angularaxis": { "ticks": "", "showgrid": true, "gridcolor": "white", "linecolor": "white" } }, "scene": { "xaxis": { "ticks": "", "showgrid": true, "gridcolor": "white", "gridwidth": 2, "linecolor": "white", "zerolinecolor": "white", "showbackground": true, "backgroundcolor": "rgb(234,234,242)" }, "yaxis": { "ticks": "", "showgrid": true, "gridcolor": "white", "gridwidth": 2, "linecolor": "white", "zerolinecolor": "white", "showbackground": true, "backgroundcolor": "rgb(234,234,242)" }, "zaxis": { "ticks": "", "showgrid": true, "gridcolor": "white", "gridwidth": 2, "linecolor": "white", "zerolinecolor": "white", "showbackground": true, "backgroundcolor": "rgb(234,234,242)" } }, "xaxis": { "ticks": "", "showgrid": true, "gridcolor": "white", "linecolor": "white", "automargin": true, "zerolinecolor": "white" }, "yaxis": { "ticks": "", "showgrid": true, "gridcolor": "white", "linecolor": "white", "automargin": true, "zerolinecolor": "white" }, "ternary": { "aaxis": { "ticks": "", "showgrid": true, "gridcolor": "white", "linecolor": "white" }, "baxis": { "ticks": "", "showgrid": true, "gridcolor": "white", "linecolor": "white" }, "caxis": { "ticks": "", "showgrid": true, "gridcolor": "white", "linecolor": "white" }, "bgcolor": "rgb(234,234,242)" }, "colorway": [ "rgb(76,114,176)", "rgb(221,132,82)", "rgb(85,168,104)", "rgb(196,78,82)", "rgb(129,114,179)", "rgb(147,120,96)", "rgb(218,139,195)", "rgb(140,140,140)", "rgb(204,185,116)", "rgb(100,181,205)" ], "hovermode": "closest", "colorscale": { "diverging": [ [ 0, "#67001f" ], [ 0.1, "#b2182b" ], [ 0.2, "#d6604d" ], [ 0.3, "#f4a582" ], [ 0.4, "#fddbc7" ], [ 0.5, "#f7f7f7" ], [ 0.6, "#d1e5f0" ], [ 0.7, "#92c5de" ], [ 0.8, "#4393c3" ], [ 0.9, "#2166ac" ], [ 1, "#053061" ] ], "sequential": [ [ 0, "rgb(2,4,25)" ], [ 0.06274509803921569, "rgb(24,15,41)" ], [ 0.12549019607843137, "rgb(47,23,57)" ], [ 0.18823529411764706, "rgb(71,28,72)" ], [ 0.25098039215686274, "rgb(97,30,82)" ], [ 0.3137254901960784, "rgb(123,30,89)" ], [ 0.3764705882352941, "rgb(150,27,91)" ], [ 0.4392156862745098, "rgb(177,22,88)" ], [ 0.5019607843137255, "rgb(203,26,79)" ], [ 0.5647058823529412, "rgb(223,47,67)" ], [ 0.6274509803921569, "rgb(236,76,61)" ], [ 0.6901960784313725, "rgb(242,107,73)" ], [ 0.7529411764705882, "rgb(244,135,95)" ], [ 0.8156862745098039, "rgb(245,162,122)" ], [ 0.8784313725490196, "rgb(246,188,153)" ], [ 0.9411764705882353, "rgb(247,212,187)" ], [ 1, "rgb(250,234,220)" ] ], "sequentialminus": [ [ 0, "rgb(2,4,25)" ], [ 0.06274509803921569, "rgb(24,15,41)" ], [ 0.12549019607843137, "rgb(47,23,57)" ], [ 0.18823529411764706, "rgb(71,28,72)" ], [ 0.25098039215686274, "rgb(97,30,82)" ], [ 0.3137254901960784, "rgb(123,30,89)" ], [ 0.3764705882352941, "rgb(150,27,91)" ], [ 0.4392156862745098, "rgb(177,22,88)" ], [ 0.5019607843137255, "rgb(203,26,79)" ], [ 0.5647058823529412, "rgb(223,47,67)" ], [ 0.6274509803921569, "rgb(236,76,61)" ], [ 0.6901960784313725, "rgb(242,107,73)" ], [ 0.7529411764705882, "rgb(244,135,95)" ], [ 0.8156862745098039, "rgb(245,162,122)" ], [ 0.8784313725490196, "rgb(246,188,153)" ], [ 0.9411764705882353, "rgb(247,212,187)" ], [ 1, "rgb(250,234,220)" ] ] }, "plot_bgcolor": "rgb(234,234,242)", "paper_bgcolor": "white", "shapedefaults": { "line": { "width": 0 }, "opacity": 0.5, "fillcolor": "rgb(67,103,167)" }, "annotationdefaults": { "arrowcolor": "rgb(67,103,167)" } }, "themeRef": "SEABORN" }, "plot_bgcolor": "rgb(227, 227, 234)" } }, "height": null, "width": null, "user": { "profile_url": "https://chart-studio.plotly.com/~DORITOS12", "avatar_url": "https://storage.googleapis.com/plotly-prod-profiles/50.jpg", "background_url": "https://storage.googleapis.com/plotly-prod-profiles/bg-2.jpg", "bio": "", "nickname": "", "website": "", "stream_tokens": null, "feature_set_id": null, "csrf_token": null, "date_joined": "2024-02-24 22:37:07", "mapbox_access_tokens": null, "has_password": null, "username": "DORITOS12", "email": null, "is_active": null, "readonly": null, "is_dash_creator": null, "dash_created_count": null, "is_chart_creator": null, "charts_created_count": null } }, { "creation_time": "2024-04-04T00:39:59.434728Z", "comments": { "results": [], "count": 0 }, "parented": true, "embed_url": "https://chart-studio.plotly.com/~Aleix406/1.embed", "fid": "Aleix406:1", "filename": "body-fat-percent", "filetype": "plot", "img_url": "https://storage.googleapis.com/plotly-prod-images/Aleix406/1/9_I6JQKPSV4YD4S2FW12XL40ATPV3JKO.png", "image_urls": { "default": "https://storage.googleapis.com/plotly-prod-images/Aleix406/1/2_J69I0WN772MPTSQNO4JEW5CXY7ZJBT.png", "block-thumb": "https://storage.googleapis.com/plotly-prod-images/Aleix406/1/8_47NPQF92UXR1SXFJAIK83L71Y73QYJ.png", "list-thumb": "https://storage.googleapis.com/plotly-prod-images/Aleix406/1/9_I6JQKPSV4YD4S2FW12XL40ATPV3JKO.png" }, "api_urls": { "files": "https://api.plotly.com/v2/files/Aleix406:1", "plots": "https://api.plotly.com/v2/plots/Aleix406:1", "parent": "https://api.plotly.com/v2/folders/home?user=Aleix406" }, "owner": "Aleix406", "parent": -1, "preview": "", "referencers": [], "references": [], "title": "", "views": 1, "web_url": "https://chart-studio.plotly.com/~Aleix406/1/", "world_readable": true, "date_modified": "2024-04-04T00:42:02.019Z", "stars": { "results": [], "count": 0 }, "collaborators": { "results": [], "count": 0 }, "subfolder_count": null, "refresh_interval": null, "organize_view_url": "https://chart-studio.plotly.com/~Aleix406/1/", "current_user_permission": "read", "is_theme": null, "is_template": false, "autosize": true, "caption": "", "figure": { "data": [ { "meta": { "columnNames": { "x": "data.1.x", "y": "data.1.y", "text": "data.1.text", "hoverinfo": "data.1.hoverinfo" } }, "mode": "markers", "type": "scatter", "xsrc": "Aleix406:0:d1b2dd", "ysrc": "Aleix406:0:252ab2", "frame": null, "xaxis": "x", "yaxis": "y", "marker": { "cmax": 262.75, "cmin": 118.5, "line": { "cmax": 262.75, "cmin": 118.5, "meta": { "columnNames": { "color": "data.1.marker.line.color" } }, "colorbar": { "title": "", "ticklen": 2 }, "colorsrc": "Aleix406:0:092740", "showscale": false, "colorscale": [ [ "0", "rgba(165,0,38,1)" ], [ "0.0416666666666667", "rgba(186,25,39,1)" ], [ "0.0833333333333334", "rgba(207,42,39,1)" ], [ "0.125", "rgba(222,66,46,1)" ], [ "0.166666666666667", "rgba(235,91,57,1)" ], [ "0.208333333333333", "rgba(245,115,69,1)" ], [ "0.25", "rgba(249,143,82,1)" ], [ "0.291666666666667", "rgba(253,169,94,1)" ], [ "0.333333333333333", "rgba(254,191,112,1)" ], [ "0.375", "rgba(254,212,132,1)" ], [ "0.416666666666667", "rgba(254,229,152,1)" ], [ "0.458333333333333", "rgba(255,242,171,1)" ], [ "0.5", "rgba(255,255,191,1)" ], [ "0.541666666666667", "rgba(244,250,215,1)" ], [ "0.583333333333333", "rgba(230,245,239,1)" ], [ "0.625", "rgba(211,236,244,1)" ], [ "0.666666666666667", "rgba(189,226,238,1)" ], [ "0.708333333333333", "rgba(167,213,231,1)" ], [ "0.75", "rgba(144,195,221,1)" ], [ "0.791666666666667", "rgba(121,177,211,1)" ], [ "0.833333333333333", "rgba(101,154,199,1)" ], [ "0.875", "rgba(82,131,187,1)" ], [ "0.916666666666667", "rgba(67,106,175,1)" ], [ "0.958333333333334", "rgba(59,80,162,1)" ], [ "1", "rgba(49,54,149,1)" ] ] }, "meta": { "columnNames": { "size": "data.1.marker.size", "color": "data.1.marker.color" } }, "sizesrc": "Aleix406:0:c9f8ef", "colorbar": { "title": { "text": "Weight" }, "ticklen": 2 }, "colorsrc": "Aleix406:0:30c496", "sizemode": "area", "showscale": false, "colorscale": [ [ "0", "rgba(165,0,38,1)" ], [ "0.0416666666666667", "rgba(186,25,39,1)" ], [ "0.0833333333333334", "rgba(207,42,39,1)" ], [ "0.125", "rgba(222,66,46,1)" ], [ "0.166666666666667", "rgba(235,91,57,1)" ], [ "0.208333333333333", "rgba(245,115,69,1)" ], [ "0.25", "rgba(249,143,82,1)" ], [ "0.291666666666667", "rgba(253,169,94,1)" ], [ "0.333333333333333", "rgba(254,191,112,1)" ], [ "0.375", "rgba(254,212,132,1)" ], [ "0.416666666666667", "rgba(254,229,152,1)" ], [ "0.458333333333333", "rgba(255,242,171,1)" ], [ "0.5", "rgba(255,255,191,1)" ], [ "0.541666666666667", "rgba(244,250,215,1)" ], [ "0.583333333333333", "rgba(230,245,239,1)" ], [ "0.625", "rgba(211,236,244,1)" ], [ "0.666666666666667", "rgba(189,226,238,1)" ], [ "0.708333333333333", "rgba(167,213,231,1)" ], [ "0.75", "rgba(144,195,221,1)" ], [ "0.791666666666667", "rgba(121,177,211,1)" ], [ "0.833333333333333", "rgba(101,154,199,1)" ], [ "0.875", "rgba(82,131,187,1)" ], [ "0.916666666666667", "rgba(67,106,175,1)" ], [ "0.958333333333334", "rgba(59,80,162,1)" ], [ "1", "rgba(49,54,149,1)" ] ] }, "error_x": { "width": [] }, "error_y": { "width": [] }, "textsrc": "Aleix406:0:8af343", "textfont": { "meta": { "columnNames": { "size": "data.1.textfont.size" } }, "sizesrc": "Aleix406:0:c7f66f" }, "hoverinfosrc": "Aleix406:0:09dfcb" }, { "meta": { "columnNames": { "x": "data.2.x", "y": "data.2.y" } }, "mode": "markers", "type": "scatter", "xsrc": "Aleix406:0:d45656", "ysrc": "Aleix406:0:51d15a", "frame": null, "xaxis": "x", "yaxis": "y", "marker": { "cmax": 262.75, "cmin": 118.5, "line": { "color": "rgba(255,127,14,1)" }, "meta": { "columnNames": { "color": "data.2.marker.color" } }, "colorbar": { "x": 1.02, "y": 1, "len": 0.5, "title": { "text": "Weight" }, "lenmode": "fraction", "ticklen": 2, "yanchor": "top" }, "colorsrc": "Aleix406:0:e6ca15", "showscale": true, "colorscale": [ [ "0", "rgba(165,0,38,1)" ], [ "0.0416666666666667", "rgba(186,25,39,1)" ], [ "0.0833333333333334", "rgba(207,42,39,1)" ], [ "0.125", "rgba(222,66,46,1)" ], [ "0.166666666666667", "rgba(235,91,57,1)" ], [ "0.208333333333333", "rgba(245,115,69,1)" ], [ "0.25", "rgba(249,143,82,1)" ], [ "0.291666666666667", "rgba(253,169,94,1)" ], [ "0.333333333333333", "rgba(254,191,112,1)" ], [ "0.375", "rgba(254,212,132,1)" ], [ "0.416666666666667", "rgba(254,229,152,1)" ], [ "0.458333333333333", "rgba(255,242,171,1)" ], [ "0.5", "rgba(255,255,191,1)" ], [ "0.541666666666667", "rgba(244,250,215,1)" ], [ "0.583333333333333", "rgba(230,245,239,1)" ], [ "0.625", "rgba(211,236,244,1)" ], [ "0.666666666666667", "rgba(189,226,238,1)" ], [ "0.708333333333333", "rgba(167,213,231,1)" ], [ "0.75", "rgba(144,195,221,1)" ], [ "0.791666666666667", "rgba(121,177,211,1)" ], [ "0.833333333333333", "rgba(101,154,199,1)" ], [ "0.875", "rgba(82,131,187,1)" ], [ "0.916666666666667", "rgba(67,106,175,1)" ], [ "0.958333333333334", "rgba(59,80,162,1)" ], [ "1", "rgba(49,54,149,1)" ] ] }, "opacity": 0, "hoverinfo": "none", "showlegend": false } ], "frames": [], "layout": { "title": { "text": "Body Fat Percentage by Abdomen, Weight and Age (point size)" }, "xaxis": { "type": "linear", "range": [ 65.86760201209133, 129.7651698331843 ], "title": { "text": "Abdomen Circumference (in)" }, "domain": [ 0, 1 ], "zeroline": false, "autorange": true, "automargin": true }, "yaxis": { "type": "linear", "range": [ -3.349839697449871, 50.97862195731481 ], "title": { "text": "Body Fat % (Siri Method)" }, "domain": [ 0, 1 ], "zeroline": false, "autorange": true, "automargin": true }, "legend": { "y": 0.5, "yanchor": "top" }, "margin": { "b": 40, "l": 60, "r": 10, "t": 25 }, "template": { "data": { "bar": [ { "type": "bar", "marker": { "colorbar": { "ticks": "", "outlinewidth": 0 } } } ], "table": [ { "type": "table", "cells": { "fill": { "color": "#506784" }, "line": { "color": "rgb(17,17,17)" } }, "header": { "fill": { "color": "#2a3f5f" }, "line": { "color": "rgb(17,17,17)" } } } ], "carpet": [ { "type": "carpet", "aaxis": { "gridcolor": "#506784", "linecolor": "#506784", "endlinecolor": "#A2B1C6", "minorgridcolor": "#506784", "startlinecolor": "#A2B1C6" }, "baxis": { "gridcolor": "#506784", "linecolor": "#506784", "endlinecolor": "#A2B1C6", "minorgridcolor": "#506784", "startlinecolor": "#A2B1C6" } } ], "mesh3d": [ { "type": "mesh3d", "colorbar": { "ticks": "", "outlinewidth": 0 } } ], "contour": [ { "type": "contour", "colorbar": { "ticks": "", "outlinewidth": 0 }, "autocolorscale": true } ], "heatmap": [ { "type": "heatmap", "colorbar": { "ticks": "", "outlinewidth": 0 }, "autocolorscale": true } ], "scatter": [ { "type": "scatter", "marker": { "colorbar": { "ticks": "", "outlinewidth": 0 } } } ], "surface": [ { "type": "surface", "colorbar": { "ticks": "", "outlinewidth": 0 } } ], "heatmapgl": [ { "type": "heatmapgl", "colorbar": { "ticks": "", "outlinewidth": 0 } } ], "histogram": [ { "type": "histogram", "marker": { "colorbar": { "ticks": "", "outlinewidth": 0 } } } ], "parcoords": [ { "line": { "colorbar": { "ticks": "", "outlinewidth": 0 } }, "type": "parcoords" } ], "scatter3d": [ { "type": "scatter3d", "marker": { "colorbar": { "ticks": "", "outlinewidth": 0 } } } ], "scattergl": [ { "type": "scattergl", "marker": { "colorbar": { "ticks": "", "outlinewidth": 0 } } } ], "choropleth": [ { "type": "choropleth", "colorbar": { "ticks": "", "outlinewidth": 0 } } ], "scattergeo": [ { "type": "scattergeo", "marker": { "colorbar": { "ticks": "", "outlinewidth": 0 } } } ], "histogram2d": [ { "type": "histogram2d", "colorbar": { "ticks": "", "outlinewidth": 0 }, "autocolorscale": true } ], "scatterpolar": [ { "type": "scatterpolar", "marker": { "colorbar": { "ticks": "", "outlinewidth": 0 } } } ], "contourcarpet": [ { "type": "contourcarpet", "colorbar": { "ticks": "", "outlinewidth": 0 } } ], "scattercarpet": [ { "type": "scattercarpet", "marker": { "colorbar": { "ticks": "", "outlinewidth": 0 } } } ], "scattermapbox": [ { "type": "scattermapbox", "marker": { "colorbar": { "ticks": "", "outlinewidth": 0 } } } ], "scatterpolargl": [ { "type": "scatterpolargl", "marker": { "colorbar": { "ticks": "", "outlinewidth": 0 } } } ], "scatterternary": [ { "type": "scatterternary", "marker": { "colorbar": { "ticks": "", "outlinewidth": 0 } } } ], "histogram2dcontour": [ { "type": "histogram2dcontour", "colorbar": { "ticks": "", "outlinewidth": 0 }, "autocolorscale": true } ] }, "layout": { "geo": { "bgcolor": "rgb(17,17,17)", "showland": true, "lakecolor": "rgb(17,17,17)", "landcolor": "rgb(17,17,17)", "showlakes": true, "subunitcolor": "#506784" }, "font": { "color": "#f2f5fa" }, "polar": { "bgcolor": "rgb(17,17,17)", "radialaxis": { "ticks": "", "gridcolor": "#506784", "linecolor": "#506784" }, "angularaxis": { "ticks": "", "gridcolor": "#506784", "linecolor": "#506784" } }, "scene": { "xaxis": { "ticks": "", "gridcolor": "#506784", "gridwidth": 2, "linecolor": "#506784", "zerolinecolor": "#C8D4E3", "showbackground": true, "backgroundcolor": "rgb(17,17,17)" }, "yaxis": { "ticks": "", "gridcolor": "#506784", "gridwidth": 2, "linecolor": "#506784", "zerolinecolor": "#C8D4E3", "showbackground": true, "backgroundcolor": "rgb(17,17,17)" }, "zaxis": { "ticks": "", "gridcolor": "#506784", "gridwidth": 2, "linecolor": "#506784", "zerolinecolor": "#C8D4E3", "showbackground": true, "backgroundcolor": "rgb(17,17,17)" } }, "title": { "x": 0.05 }, "xaxis": { "ticks": "", "gridcolor": "#283442", "linecolor": "#506784", "automargin": true, "zerolinecolor": "#283442", "zerolinewidth": 2 }, "yaxis": { "ticks": "", "gridcolor": "#283442", "linecolor": "#506784", "automargin": true, "zerolinecolor": "#283442", "zerolinewidth": 2 }, "ternary": { "aaxis": { "ticks": "", "gridcolor": "#506784", "linecolor": "#506784" }, "baxis": { "ticks": "", "gridcolor": "#506784", "linecolor": "#506784" }, "caxis": { "ticks": "", "gridcolor": "#506784", "linecolor": "#506784" }, "bgcolor": "rgb(17,17,17)" }, "colorway": [ "#636efa", "#EF553B", "#00cc96", "#ab63fa", "#19d3f3", "#e763fa", "#fecb52", "#ffa15a", "#ff6692", "#b6e880" ], "hovermode": "closest", "colorscale": { "diverging": [ [ 0, "#8e0152" ], [ 0.1, "#c51b7d" ], [ 0.2, "#de77ae" ], [ 0.3, "#f1b6da" ], [ 0.4, "#fde0ef" ], [ 0.5, "#f7f7f7" ], [ 0.6, "#e6f5d0" ], [ 0.7, "#b8e186" ], [ 0.8, "#7fbc41" ], [ 0.9, "#4d9221" ], [ 1, "#276419" ] ], "sequential": [ [ 0, "#0508b8" ], [ 0.0893854748603352, "#1910d8" ], [ 0.1787709497206704, "#3c19f0" ], [ 0.2681564245810056, "#6b1cfb" ], [ 0.3575418994413408, "#981cfd" ], [ 0.44692737430167595, "#bf1cfd" ], [ 0.5363128491620112, "#dd2bfd" ], [ 0.6256983240223464, "#f246fe" ], [ 0.7150837988826816, "#fc67fd" ], [ 0.8044692737430168, "#fe88fc" ], [ 0.8938547486033519, "#fea5fd" ], [ 0.9832402234636871, "#febefe" ], [ 1, "#fec3fe" ] ], "sequentialminus": [ [ 0, "#0508b8" ], [ 0.0893854748603352, "#1910d8" ], [ 0.1787709497206704, "#3c19f0" ], [ 0.2681564245810056, "#6b1cfb" ], [ 0.3575418994413408, "#981cfd" ], [ 0.44692737430167595, "#bf1cfd" ], [ 0.5363128491620112, "#dd2bfd" ], [ 0.6256983240223464, "#f246fe" ], [ 0.7150837988826816, "#fc67fd" ], [ 0.8044692737430168, "#fe88fc" ], [ 0.8938547486033519, "#fea5fd" ], [ 0.9832402234636871, "#febefe" ], [ 1, "#fec3fe" ] ] }, "plot_bgcolor": "rgb(17,17,17)", "paper_bgcolor": "rgb(17,17,17)", "shapedefaults": { "line": { "width": 0 }, "opacity": 0.4, "fillcolor": "#f2f5fa" }, "sliderdefaults": { "bgcolor": "#C8D4E3", "tickwidth": 0, "bordercolor": "rgb(17,17,17)", "borderwidth": 1 }, "annotationdefaults": { "arrowhead": 0, "arrowcolor": "#f2f5fa", "arrowwidth": 1 }, "updatemenudefaults": { "bgcolor": "#506784", "borderwidth": 0 } }, "themeRef": "PLOTLY_DARK" }, "hovermode": "closest", "showlegend": false } }, "height": null, "width": null, "user": { "profile_url": "https://chart-studio.plotly.com/~Aleix406", "avatar_url": "https://storage.googleapis.com/plotly-prod-profiles/83.jpg", "background_url": "https://storage.googleapis.com/plotly-prod-profiles/bg-7.jpg", "bio": "", "nickname": "Aleix", "website": "", "stream_tokens": null, "feature_set_id": null, "csrf_token": null, "date_joined": "2024-04-04 00:14:04", "mapbox_access_tokens": null, "has_password": null, "username": "Aleix406", "email": null, "is_active": null, "readonly": null, "is_dash_creator": null, "dash_created_count": null, "is_chart_creator": null, "charts_created_count": null } }, { "creation_time": "2024-04-04T00:39:24.282963Z", "comments": { "results": [], "count": 0 }, "parented": true, "embed_url": "https://chart-studio.plotly.com/~DORITOS12/62.embed", "fid": "DORITOS12:62", "filename": "IRA ST Albedo 1", "filetype": "plot", "img_url": "https://storage.googleapis.com/plotly-prod-images/DORITOS12/62/9_RL65SAEFGJ5FSXQ5QU124O2K1W33B3.png", "image_urls": { "default": "https://storage.googleapis.com/plotly-prod-images/DORITOS12/62/2_YBFZAL1A1YBVN00E1A49X35DIE4CDB.png", "block-thumb": "https://storage.googleapis.com/plotly-prod-images/DORITOS12/62/8_W9ERO0SIGY9Q5FZIPVVKV23LY3U0Y0.png", "list-thumb": "https://storage.googleapis.com/plotly-prod-images/DORITOS12/62/9_RL65SAEFGJ5FSXQ5QU124O2K1W33B3.png" }, "api_urls": { "files": "https://api.plotly.com/v2/files/DORITOS12:62", "plots": "https://api.plotly.com/v2/plots/DORITOS12:62", "parent": "https://api.plotly.com/v2/folders/home?user=DORITOS12" }, "owner": "DORITOS12", "parent": -1, "preview": "", "referencers": [], "references": [], "title": "", "views": 1, "web_url": "https://chart-studio.plotly.com/~DORITOS12/62/", "world_readable": true, "date_modified": "2024-04-10T23:59:35.595Z", "stars": { "results": [], "count": 0 }, "collaborators": { "results": [], "count": 0 }, "subfolder_count": null, "refresh_interval": null, "organize_view_url": "https://chart-studio.plotly.com/~DORITOS12/62/", "current_user_permission": "read", "is_theme": null, "is_template": false, "autosize": true, "caption": "", "figure": { "data": [ { "line": { "color": "rgb(96, 33, 118)", "width": 2 }, "meta": { "columnNames": { "x": "month", "y": "Albedo NIR" } }, "mode": "lines", "name": "NIR", "type": "scatter", "xsrc": "DORITOS12:63:5773a7", "ysrc": "DORITOS12:63:d6dac2", "visible": true }, { "meta": { "columnNames": { "x": "", "y": "Albedo VIS" } }, "mode": "lines", "name": "VIS", "type": "scatter", "ysrc": "DORITOS12:63:006ea8", "visible": true, "stackgroup": null } ], "frames": [], "layout": { "font": { "size": 20 }, "title": { "font": { "size": 17 }, "text": "" }, "xaxis": { "type": "linear", "range": [ 0, 228 ], "title": { "text": "Meses" }, "domain": [ 0, 1 ], "autorange": true }, "yaxis": { "type": "linear", "range": [ 0.01, 0.3 ], "title": { "text": "Albedo" }, "domain": [ 0, 1 ], "autorange": false }, "legend": { "x": 0.5, "y": -0.3, "xanchor": "center", "yanchor": "auto", "traceorder": "reversed", "orientation": "h" }, "margin": { "b": 39, "l": 26, "r": 52, "t": 16 }, "autosize": true, "dragmode": "pan", "template": { "data": { "bar": [ { "type": "bar", "marker": { "colorbar": { "ticks": "outside", "ticklen": 8, "tickcolor": "rgb(36,36,36)", "tickwidth": 2, "outlinewidth": 0 } } } ], "table": [ { "type": "table", "cells": { "fill": { "color": "rgb(231,231,240)" }, "line": { "color": "white" } }, "header": { "fill": { "color": "rgb(183,183,191)" }, "line": { "color": "white" } } } ], "carpet": [ { "type": "carpet", "aaxis": { "gridcolor": "white", "linecolor": "white", "endlinecolor": "rgb(36,36,36)", "minorgridcolor": "white", "startlinecolor": "rgb(36,36,36)" }, "baxis": { "gridcolor": "white", "linecolor": "white", "endlinecolor": "rgb(36,36,36)", "minorgridcolor": "white", "startlinecolor": "rgb(36,36,36)" } } ], "mesh3d": [ { "type": "mesh3d", "colorbar": { "ticks": "outside", "ticklen": 8, "tickcolor": "rgb(36,36,36)", "tickwidth": 2, "outlinewidth": 0 } } ], "contour": [ { "type": "contour", "colorbar": { "ticks": "outside", "ticklen": 8, "tickcolor": "rgb(36,36,36)", "tickwidth": 2, "outlinewidth": 0 }, "autocolorscale": true } ], "heatmap": [ { "type": "heatmap", "colorbar": { "ticks": "outside", "ticklen": 8, "tickcolor": "rgb(36,36,36)", "tickwidth": 2, "outlinewidth": 0 }, "autocolorscale": true } ], "scatter": [ { "type": "scatter", "marker": { "colorbar": { "ticks": "outside", "ticklen": 8, "tickcolor": "rgb(36,36,36)", "tickwidth": 2, "outlinewidth": 0 } } } ], "surface": [ { "type": "surface", "colorbar": { "ticks": "outside", "ticklen": 8, "tickcolor": "rgb(36,36,36)", "tickwidth": 2, "outlinewidth": 0 } } ], "heatmapgl": [ { "type": "heatmapgl", "colorbar": { "ticks": "outside", "ticklen": 8, "tickcolor": "rgb(36,36,36)", "tickwidth": 2, "outlinewidth": 0 } } ], "histogram": [ { "type": "histogram", "marker": { "colorbar": { "ticks": "outside", "ticklen": 8, "tickcolor": "rgb(36,36,36)", "tickwidth": 2, "outlinewidth": 0 } } } ], "parcoords": [ { "line": { "colorbar": { "ticks": "outside", "ticklen": 8, "tickcolor": "rgb(36,36,36)", "tickwidth": 2, "outlinewidth": 0 } }, "type": "parcoords" } ], "scatter3d": [ { "type": "scatter3d", "marker": { "colorbar": { "ticks": "outside", "ticklen": 8, "tickcolor": "rgb(36,36,36)", "tickwidth": 2, "outlinewidth": 0 } } } ], "scattergl": [ { "type": "scattergl", "marker": { "colorbar": { "ticks": "outside", "ticklen": 8, "tickcolor": "rgb(36,36,36)", "tickwidth": 2, "outlinewidth": 0 } } } ], "choropleth": [ { "type": "choropleth", "colorbar": { "ticks": "outside", "ticklen": 8, "tickcolor": "rgb(36,36,36)", "tickwidth": 2, "outlinewidth": 0 } } ], "scattergeo": [ { "type": "scattergeo", "marker": { "colorbar": { "ticks": "outside", "ticklen": 8, "tickcolor": "rgb(36,36,36)", "tickwidth": 2, "outlinewidth": 0 } } } ], "histogram2d": [ { "type": "histogram2d", "colorbar": { "ticks": "outside", "ticklen": 8, "tickcolor": "rgb(36,36,36)", "tickwidth": 2, "outlinewidth": 0 }, "autocolorscale": true } ], "scatterpolar": [ { "type": "scatterpolar", "marker": { "colorbar": { "ticks": "outside", "ticklen": 8, "tickcolor": "rgb(36,36,36)", "tickwidth": 2, "outlinewidth": 0 } } } ], "contourcarpet": [ { "type": "contourcarpet", "colorbar": { "ticks": "outside", "ticklen": 8, "tickcolor": "rgb(36,36,36)", "tickwidth": 2, "outlinewidth": 0 } } ], "scattercarpet": [ { "type": "scattercarpet", "marker": { "colorbar": { "ticks": "outside", "ticklen": 8, "tickcolor": "rgb(36,36,36)", "tickwidth": 2, "outlinewidth": 0 } } } ], "scattermapbox": [ { "type": "scattermapbox", "marker": { "colorbar": { "ticks": "outside", "ticklen": 8, "tickcolor": "rgb(36,36,36)", "tickwidth": 2, "outlinewidth": 0 } } } ], "scatterpolargl": [ { "type": "scatterpolargl", "marker": { "colorbar": { "ticks": "outside", "ticklen": 8, "tickcolor": "rgb(36,36,36)", "tickwidth": 2, "outlinewidth": 0 } } } ], "scatterternary": [ { "type": "scatterternary", "marker": { "colorbar": { "ticks": "outside", "ticklen": 8, "tickcolor": "rgb(36,36,36)", "tickwidth": 2, "outlinewidth": 0 } } } ], "histogram2dcontour": [ { "type": "histogram2dcontour", "colorbar": { "ticks": "outside", "ticklen": 8, "tickcolor": "rgb(36,36,36)", "tickwidth": 2, "outlinewidth": 0 }, "autocolorscale": true } ] }, "layout": { "geo": { "bgcolor": "white", "showland": true, "lakecolor": "white", "landcolor": "rgb(234,234,242)", "showlakes": true, "subunitcolor": "white" }, "font": { "color": "rgb(36,36,36)" }, "polar": { "bgcolor": "rgb(234,234,242)", "radialaxis": { "ticks": "", "showgrid": true, "gridcolor": "white", "linecolor": "white" }, "angularaxis": { "ticks": "", "showgrid": true, "gridcolor": "white", "linecolor": "white" } }, "scene": { "xaxis": { "ticks": "", "showgrid": true, "gridcolor": "white", "gridwidth": 2, "linecolor": "white", "zerolinecolor": "white", "showbackground": true, "backgroundcolor": "rgb(234,234,242)" }, "yaxis": { "ticks": "", "showgrid": true, "gridcolor": "white", "gridwidth": 2, "linecolor": "white", "zerolinecolor": "white", "showbackground": true, "backgroundcolor": "rgb(234,234,242)" }, "zaxis": { "ticks": "", "showgrid": true, "gridcolor": "white", "gridwidth": 2, "linecolor": "white", "zerolinecolor": "white", "showbackground": true, "backgroundcolor": "rgb(234,234,242)" } }, "xaxis": { "ticks": "", "showgrid": true, "gridcolor": "white", "linecolor": "white", "automargin": true, "zerolinecolor": "white" }, "yaxis": { "ticks": "", "showgrid": true, "gridcolor": "white", "linecolor": "white", "automargin": true, "zerolinecolor": "white" }, "ternary": { "aaxis": { "ticks": "", "showgrid": true, "gridcolor": "white", "linecolor": "white" }, "baxis": { "ticks": "", "showgrid": true, "gridcolor": "white", "linecolor": "white" }, "caxis": { "ticks": "", "showgrid": true, "gridcolor": "white", "linecolor": "white" }, "bgcolor": "rgb(234,234,242)" }, "colorway": [ "rgb(76,114,176)", "rgb(221,132,82)", "rgb(85,168,104)", "rgb(196,78,82)", "rgb(129,114,179)", "rgb(147,120,96)", "rgb(218,139,195)", "rgb(140,140,140)", "rgb(204,185,116)", "rgb(100,181,205)" ], "hovermode": "closest", "colorscale": { "diverging": [ [ 0, "#67001f" ], [ 0.1, "#b2182b" ], [ 0.2, "#d6604d" ], [ 0.3, "#f4a582" ], [ 0.4, "#fddbc7" ], [ 0.5, "#f7f7f7" ], [ 0.6, "#d1e5f0" ], [ 0.7, "#92c5de" ], [ 0.8, "#4393c3" ], [ 0.9, "#2166ac" ], [ 1, "#053061" ] ], "sequential": [ [ 0, "rgb(2,4,25)" ], [ 0.06274509803921569, "rgb(24,15,41)" ], [ 0.12549019607843137, "rgb(47,23,57)" ], [ 0.18823529411764706, "rgb(71,28,72)" ], [ 0.25098039215686274, "rgb(97,30,82)" ], [ 0.3137254901960784, "rgb(123,30,89)" ], [ 0.3764705882352941, "rgb(150,27,91)" ], [ 0.4392156862745098, "rgb(177,22,88)" ], [ 0.5019607843137255, "rgb(203,26,79)" ], [ 0.5647058823529412, "rgb(223,47,67)" ], [ 0.6274509803921569, "rgb(236,76,61)" ], [ 0.6901960784313725, "rgb(242,107,73)" ], [ 0.7529411764705882, "rgb(244,135,95)" ], [ 0.8156862745098039, "rgb(245,162,122)" ], [ 0.8784313725490196, "rgb(246,188,153)" ], [ 0.9411764705882353, "rgb(247,212,187)" ], [ 1, "rgb(250,234,220)" ] ], "sequentialminus": [ [ 0, "rgb(2,4,25)" ], [ 0.06274509803921569, "rgb(24,15,41)" ], [ 0.12549019607843137, "rgb(47,23,57)" ], [ 0.18823529411764706, "rgb(71,28,72)" ], [ 0.25098039215686274, "rgb(97,30,82)" ], [ 0.3137254901960784, "rgb(123,30,89)" ], [ 0.3764705882352941, "rgb(150,27,91)" ], [ 0.4392156862745098, "rgb(177,22,88)" ], [ 0.5019607843137255, "rgb(203,26,79)" ], [ 0.5647058823529412, "rgb(223,47,67)" ], [ 0.6274509803921569, "rgb(236,76,61)" ], [ 0.6901960784313725, "rgb(242,107,73)" ], [ 0.7529411764705882, "rgb(244,135,95)" ], [ 0.8156862745098039, "rgb(245,162,122)" ], [ 0.8784313725490196, "rgb(246,188,153)" ], [ 0.9411764705882353, "rgb(247,212,187)" ], [ 1, "rgb(250,234,220)" ] ] }, "plot_bgcolor": "rgb(234,234,242)", "paper_bgcolor": "white", "shapedefaults": { "line": { "width": 0 }, "opacity": 0.5, "fillcolor": "rgb(67,103,167)" }, "annotationdefaults": { "arrowcolor": "rgb(67,103,167)" } }, "themeRef": "SEABORN" }, "showlegend": true, "annotations": [ { "x": 225, "y": 0.285, "font": { "size": 20 }, "text": "c)", "showarrow": false } ], "plot_bgcolor": "rgb(227, 227, 234)" } }, "height": null, "width": null, "user": { "profile_url": "https://chart-studio.plotly.com/~DORITOS12", "avatar_url": "https://storage.googleapis.com/plotly-prod-profiles/50.jpg", "background_url": "https://storage.googleapis.com/plotly-prod-profiles/bg-2.jpg", "bio": "", "nickname": "", "website": "", "stream_tokens": null, "feature_set_id": null, "csrf_token": null, "date_joined": "2024-02-24 22:37:07", "mapbox_access_tokens": null, "has_password": null, "username": "DORITOS12", "email": null, "is_active": null, "readonly": null, "is_dash_creator": null, "dash_created_count": null, "is_chart_creator": null, "charts_created_count": null } }, { "creation_time": "2024-04-04T00:32:08.543700Z", "comments": { "results": [], "count": 0 }, "parented": true, "embed_url": "https://chart-studio.plotly.com/~DORITOS12/59.embed", "fid": "DORITOS12:59", "filename": "IRA ST VV 1", "filetype": "plot", "img_url": "https://storage.googleapis.com/plotly-prod-images/DORITOS12/59/9_HXCWT2R7286N3DS9KNO9QCZOWXHJXB.png", "image_urls": { "default": "https://storage.googleapis.com/plotly-prod-images/DORITOS12/59/2_6IPAG3XSDATGI0C8S10DVX2BCCEQMG.png", "block-thumb": "https://storage.googleapis.com/plotly-prod-images/DORITOS12/59/8_6YB458WPDLZ5TCELVZ7N0PTZ3MXT0B.png", "list-thumb": "https://storage.googleapis.com/plotly-prod-images/DORITOS12/59/9_HXCWT2R7286N3DS9KNO9QCZOWXHJXB.png" }, "api_urls": { "files": "https://api.plotly.com/v2/files/DORITOS12:59", "plots": "https://api.plotly.com/v2/plots/DORITOS12:59", "parent": "https://api.plotly.com/v2/folders/home?user=DORITOS12" }, "owner": "DORITOS12", "parent": -1, "preview": "", "referencers": [], "references": [], "title": "", "views": 2, "web_url": "https://chart-studio.plotly.com/~DORITOS12/59/", "world_readable": true, "date_modified": "2024-04-09T21:28:06.201Z", "stars": { "results": [], "count": 0 }, "collaborators": { "results": [], "count": 0 }, "subfolder_count": null, "refresh_interval": null, "organize_view_url": "https://chart-studio.plotly.com/~DORITOS12/59/", "current_user_permission": "read", "is_theme": null, "is_template": false, "autosize": true, "caption": "", "figure": { "data": [ { "line": { "color": "rgb(19, 227, 234)" }, "meta": { "columnNames": { "x": "month", "y": "Velocidad del Viento" } }, "mode": "lines", "name": "Velocidad del viento<br>", "type": "scatter", "xsrc": "DORITOS12:60:24c61c", "ysrc": "DORITOS12:60:17db13" } ], "frames": [], "layout": { "font": { "size": 20 }, "title": { "font": { "size": 17, "color": "rgb(7, 7, 7)" }, "text": "" }, "xaxis": { "type": "linear", "range": [ 1, 228 ], "title": { "text": "Meses" }, "domain": [ 0, 1 ], "autorange": true }, "yaxis": { "type": "linear", "range": [ 2.5666666666666664, 5.533333333333334 ], "title": { "text": "m/2" }, "domain": [ 0, 1 ], "autorange": true }, "legend": { "x": 0.5, "y": -0.4, "valign": "top", "xanchor": "center", "yanchor": "auto", "traceorder": "normal", "orientation": "h" }, "margin": { "b": 50, "l": 67, "r": 68, "t": 48 }, "autosize": true, "dragmode": "pan", "template": { "data": { "bar": [ { "type": "bar", "marker": { "colorbar": { "ticks": "outside", "ticklen": 8, "tickcolor": "rgb(36,36,36)", "tickwidth": 2, "outlinewidth": 0 } } } ], "table": [ { "type": "table", "cells": { "fill": { "color": "rgb(231,231,240)" }, "line": { "color": "white" } }, "header": { "fill": { "color": "rgb(183,183,191)" }, "line": { "color": "white" } } } ], "carpet": [ { "type": "carpet", "aaxis": { "gridcolor": "white", "linecolor": "white", "endlinecolor": "rgb(36,36,36)", "minorgridcolor": "white", "startlinecolor": "rgb(36,36,36)" }, "baxis": { "gridcolor": "white", "linecolor": "white", "endlinecolor": "rgb(36,36,36)", "minorgridcolor": "white", "startlinecolor": "rgb(36,36,36)" } } ], "mesh3d": [ { "type": "mesh3d", "colorbar": { "ticks": "outside", "ticklen": 8, "tickcolor": "rgb(36,36,36)", "tickwidth": 2, "outlinewidth": 0 } } ], "contour": [ { "type": "contour", "colorbar": { "ticks": "outside", "ticklen": 8, "tickcolor": "rgb(36,36,36)", "tickwidth": 2, "outlinewidth": 0 }, "autocolorscale": true } ], "heatmap": [ { "type": "heatmap", "colorbar": { "ticks": "outside", "ticklen": 8, "tickcolor": "rgb(36,36,36)", "tickwidth": 2, "outlinewidth": 0 }, "autocolorscale": true } ], "scatter": [ { "type": "scatter", "marker": { "colorbar": { "ticks": "outside", "ticklen": 8, "tickcolor": "rgb(36,36,36)", "tickwidth": 2, "outlinewidth": 0 } } } ], "surface": [ { "type": "surface", "colorbar": { "ticks": "outside", "ticklen": 8, "tickcolor": "rgb(36,36,36)", "tickwidth": 2, "outlinewidth": 0 } } ], "heatmapgl": [ { "type": "heatmapgl", "colorbar": { "ticks": "outside", "ticklen": 8, "tickcolor": "rgb(36,36,36)", "tickwidth": 2, "outlinewidth": 0 } } ], "histogram": [ { "type": "histogram", "marker": { "colorbar": { "ticks": "outside", "ticklen": 8, "tickcolor": "rgb(36,36,36)", "tickwidth": 2, "outlinewidth": 0 } } } ], "parcoords": [ { "line": { "colorbar": { "ticks": "outside", "ticklen": 8, "tickcolor": "rgb(36,36,36)", "tickwidth": 2, "outlinewidth": 0 } }, "type": "parcoords" } ], "scatter3d": [ { "type": "scatter3d", "marker": { "colorbar": { "ticks": "outside", "ticklen": 8, "tickcolor": "rgb(36,36,36)", "tickwidth": 2, "outlinewidth": 0 } } } ], "scattergl": [ { "type": "scattergl", "marker": { "colorbar": { "ticks": "outside", "ticklen": 8, "tickcolor": "rgb(36,36,36)", "tickwidth": 2, "outlinewidth": 0 } } } ], "choropleth": [ { "type": "choropleth", "colorbar": { "ticks": "outside", "ticklen": 8, "tickcolor": "rgb(36,36,36)", "tickwidth": 2, "outlinewidth": 0 } } ], "scattergeo": [ { "type": "scattergeo", "marker": { "colorbar": { "ticks": "outside", "ticklen": 8, "tickcolor": "rgb(36,36,36)", "tickwidth": 2, "outlinewidth": 0 } } } ], "histogram2d": [ { "type": "histogram2d", "colorbar": { "ticks": "outside", "ticklen": 8, "tickcolor": "rgb(36,36,36)", "tickwidth": 2, "outlinewidth": 0 }, "autocolorscale": true } ], "scatterpolar": [ { "type": "scatterpolar", "marker": { "colorbar": { "ticks": "outside", "ticklen": 8, "tickcolor": "rgb(36,36,36)", "tickwidth": 2, "outlinewidth": 0 } } } ], "contourcarpet": [ { "type": "contourcarpet", "colorbar": { "ticks": "outside", "ticklen": 8, "tickcolor": "rgb(36,36,36)", "tickwidth": 2, "outlinewidth": 0 } } ], "scattercarpet": [ { "type": "scattercarpet", "marker": { "colorbar": { "ticks": "outside", "ticklen": 8, "tickcolor": "rgb(36,36,36)", "tickwidth": 2, "outlinewidth": 0 } } } ], "scattermapbox": [ { "type": "scattermapbox", "marker": { "colorbar": { "ticks": "outside", "ticklen": 8, "tickcolor": "rgb(36,36,36)", "tickwidth": 2, "outlinewidth": 0 } } } ], "scatterpolargl": [ { "type": "scatterpolargl", "marker": { "colorbar": { "ticks": "outside", "ticklen": 8, "tickcolor": "rgb(36,36,36)", "tickwidth": 2, "outlinewidth": 0 } } } ], "scatterternary": [ { "type": "scatterternary", "marker": { "colorbar": { "ticks": "outside", "ticklen": 8, "tickcolor": "rgb(36,36,36)", "tickwidth": 2, "outlinewidth": 0 } } } ], "histogram2dcontour": [ { "type": "histogram2dcontour", "colorbar": { "ticks": "outside", "ticklen": 8, "tickcolor": "rgb(36,36,36)", "tickwidth": 2, "outlinewidth": 0 }, "autocolorscale": true } ] }, "layout": { "geo": { "bgcolor": "white", "showland": true, "lakecolor": "white", "landcolor": "rgb(234,234,242)", "showlakes": true, "subunitcolor": "white" }, "font": { "color": "rgb(36,36,36)" }, "polar": { "bgcolor": "rgb(234,234,242)", "radialaxis": { "ticks": "", "showgrid": true, "gridcolor": "white", "linecolor": "white" }, "angularaxis": { "ticks": "", "showgrid": true, "gridcolor": "white", "linecolor": "white" } }, "scene": { "xaxis": { "ticks": "", "showgrid": true, "gridcolor": "white", "gridwidth": 2, "linecolor": "white", "zerolinecolor": "white", "showbackground": true, "backgroundcolor": "rgb(234,234,242)" }, "yaxis": { "ticks": "", "showgrid": true, "gridcolor": "white", "gridwidth": 2, "linecolor": "white", "zerolinecolor": "white", "showbackground": true, "backgroundcolor": "rgb(234,234,242)" }, "zaxis": { "ticks": "", "showgrid": true, "gridcolor": "white", "gridwidth": 2, "linecolor": "white", "zerolinecolor": "white", "showbackground": true, "backgroundcolor": "rgb(234,234,242)" } }, "xaxis": { "ticks": "", "showgrid": true, "gridcolor": "white", "linecolor": "white", "automargin": true, "zerolinecolor": "white" }, "yaxis": { "ticks": "", "showgrid": true, "gridcolor": "white", "linecolor": "white", "automargin": true, "zerolinecolor": "white" }, "ternary": { "aaxis": { "ticks": "", "showgrid": true, "gridcolor": "white", "linecolor": "white" }, "baxis": { "ticks": "", "showgrid": true, "gridcolor": "white", "linecolor": "white" }, "caxis": { "ticks": "", "showgrid": true, "gridcolor": "white", "linecolor": "white" }, "bgcolor": "rgb(234,234,242)" }, "colorway": [ "rgb(76,114,176)", "rgb(221,132,82)", "rgb(85,168,104)", "rgb(196,78,82)", "rgb(129,114,179)", "rgb(147,120,96)", "rgb(218,139,195)", "rgb(140,140,140)", "rgb(204,185,116)", "rgb(100,181,205)" ], "hovermode": "closest", "colorscale": { "diverging": [ [ 0, "#67001f" ], [ 0.1, "#b2182b" ], [ 0.2, "#d6604d" ], [ 0.3, "#f4a582" ], [ 0.4, "#fddbc7" ], [ 0.5, "#f7f7f7" ], [ 0.6, "#d1e5f0" ], [ 0.7, "#92c5de" ], [ 0.8, "#4393c3" ], [ 0.9, "#2166ac" ], [ 1, "#053061" ] ], "sequential": [ [ 0, "rgb(2,4,25)" ], [ 0.06274509803921569, "rgb(24,15,41)" ], [ 0.12549019607843137, "rgb(47,23,57)" ], [ 0.18823529411764706, "rgb(71,28,72)" ], [ 0.25098039215686274, "rgb(97,30,82)" ], [ 0.3137254901960784, "rgb(123,30,89)" ], [ 0.3764705882352941, "rgb(150,27,91)" ], [ 0.4392156862745098, "rgb(177,22,88)" ], [ 0.5019607843137255, "rgb(203,26,79)" ], [ 0.5647058823529412, "rgb(223,47,67)" ], [ 0.6274509803921569, "rgb(236,76,61)" ], [ 0.6901960784313725, "rgb(242,107,73)" ], [ 0.7529411764705882, "rgb(244,135,95)" ], [ 0.8156862745098039, "rgb(245,162,122)" ], [ 0.8784313725490196, "rgb(246,188,153)" ], [ 0.9411764705882353, "rgb(247,212,187)" ], [ 1, "rgb(250,234,220)" ] ], "sequentialminus": [ [ 0, "rgb(2,4,25)" ], [ 0.06274509803921569, "rgb(24,15,41)" ], [ 0.12549019607843137, "rgb(47,23,57)" ], [ 0.18823529411764706, "rgb(71,28,72)" ], [ 0.25098039215686274, "rgb(97,30,82)" ], [ 0.3137254901960784, "rgb(123,30,89)" ], [ 0.3764705882352941, "rgb(150,27,91)" ], [ 0.4392156862745098, "rgb(177,22,88)" ], [ 0.5019607843137255, "rgb(203,26,79)" ], [ 0.5647058823529412, "rgb(223,47,67)" ], [ 0.6274509803921569, "rgb(236,76,61)" ], [ 0.6901960784313725, "rgb(242,107,73)" ], [ 0.7529411764705882, "rgb(244,135,95)" ], [ 0.8156862745098039, "rgb(245,162,122)" ], [ 0.8784313725490196, "rgb(246,188,153)" ], [ 0.9411764705882353, "rgb(247,212,187)" ], [ 1, "rgb(250,234,220)" ] ] }, "plot_bgcolor": "rgb(234,234,242)", "paper_bgcolor": "white", "shapedefaults": { "line": { "width": 0 }, "opacity": 0.5, "fillcolor": "rgb(67,103,167)" }, "annotationdefaults": { "arrowcolor": "rgb(67,103,167)" } }, "themeRef": "SEABORN" }, "showlegend": true, "annotations": [ { "x": 5, "y": 5.4, "font": { "size": 20 }, "text": "b)", "yanchor": "auto", "showarrow": false } ], "plot_bgcolor": "rgb(227, 227, 234)" } }, "height": null, "width": null, "user": { "profile_url": "https://chart-studio.plotly.com/~DORITOS12", "avatar_url": "https://storage.googleapis.com/plotly-prod-profiles/50.jpg", "background_url": "https://storage.googleapis.com/plotly-prod-profiles/bg-2.jpg", "bio": "", "nickname": "", "website": "", "stream_tokens": null, "feature_set_id": null, "csrf_token": null, "date_joined": "2024-02-24 22:37:07", "mapbox_access_tokens": null, "has_password": null, "username": "DORITOS12", "email": null, "is_active": null, "readonly": null, "is_dash_creator": null, "dash_created_count": null, "is_chart_creator": null, "charts_created_count": null } }, { "creation_time": "2024-04-04T00:28:23.112956Z", "comments": { "results": [], "count": 0 }, "parented": true, "embed_url": "https://chart-studio.plotly.com/~DORITOS12/56.embed", "fid": "DORITOS12:56", "filename": "IRA ST HR_Final", "filetype": "plot", "img_url": "https://storage.googleapis.com/plotly-prod-images/DORITOS12/56/9_5C97UOJJKTSY1XMPV5IIVN14OTWSGH.png", "image_urls": { "default": "https://storage.googleapis.com/plotly-prod-images/DORITOS12/56/2_O1C4HFZCF0IBF6HINPOR9BJ6U8Y3LA.png", "block-thumb": "https://storage.googleapis.com/plotly-prod-images/DORITOS12/56/8_DYZVZPZWI4B7O4R45EOQ2H7ZFAQVCK.png", "list-thumb": "https://storage.googleapis.com/plotly-prod-images/DORITOS12/56/9_5C97UOJJKTSY1XMPV5IIVN14OTWSGH.png" }, "api_urls": { "files": "https://api.plotly.com/v2/files/DORITOS12:56", "plots": "https://api.plotly.com/v2/plots/DORITOS12:56", "parent": "https://api.plotly.com/v2/folders/home?user=DORITOS12" }, "owner": "DORITOS12", "parent": -1, "preview": "", "referencers": [], "references": [], "title": "", "views": 1, "web_url": "https://chart-studio.plotly.com/~DORITOS12/56/", "world_readable": true, "date_modified": "2024-04-10T23:52:08.085Z", "stars": { "results": [], "count": 0 }, "collaborators": { "results": [], "count": 0 }, "subfolder_count": null, "refresh_interval": null, "organize_view_url": "https://chart-studio.plotly.com/~DORITOS12/56/", "current_user_permission": "read", "is_theme": null, "is_template": false, "autosize": true, "caption": "", "figure": { "data": [ { "line": { "dash": "solid", "color": "rgb(42, 40, 189)", "shape": "linear" }, "meta": { "columnNames": { "x": "month", "y": "Humedad relativa" } }, "mode": "lines", "name": "Humedad relativa", "type": "scatter", "xsrc": "DORITOS12:57:5aff4f", "ysrc": "DORITOS12:57:08f2ca" } ], "frames": [], "layout": { "font": { "size": 20 }, "title": { "text": "" }, "xaxis": { "side": "bottom", "type": "linear", "range": [ 1, 230.224808575804 ], "title": { "text": "Meses" }, "anchor": "free", "domain": [ 0, 1 ], "showgrid": true, "showline": false, "tickmode": "auto", "autorange": false, "automargin": true, "showspikes": false, "rangeslider": { "range": [ 1, 230.224808575804 ], "yaxis": {}, "visible": false, "autorange": true }, "showticklabels": true }, "yaxis": { "type": "linear", "range": [ 55, 80 ], "title": { "text": "%" }, "domain": [ 0, 1 ], "autorange": false }, "legend": { "x": 0.5, "y": -0.3, "xanchor": "center", "yanchor": "bottom", "orientation": "h" }, "margin": { "b": 60, "l": 55, "r": 89, "t": 48, "pad": 0 }, "autosize": true, "colorway": [ "#3366cc", "#dc3912", "#ff9900", "#109618", "#990099", "#0099c6", "#dd4477", "#66aa00", "#b82e2e", "#316395" ], "template": { "data": { "bar": [ { "type": "bar", "marker": { "colorbar": { "ticks": "outside", "ticklen": 8, "tickcolor": "rgb(36,36,36)", "tickwidth": 2, "outlinewidth": 0 } } } ], "table": [ { "type": "table", "cells": { "fill": { "color": "rgb(231,231,240)" }, "line": { "color": "white" } }, "header": { "fill": { "color": "rgb(183,183,191)" }, "line": { "color": "white" } } } ], "carpet": [ { "type": "carpet", "aaxis": { "gridcolor": "white", "linecolor": "white", "endlinecolor": "rgb(36,36,36)", "minorgridcolor": "white", "startlinecolor": "rgb(36,36,36)" }, "baxis": { "gridcolor": "white", "linecolor": "white", "endlinecolor": "rgb(36,36,36)", "minorgridcolor": "white", "startlinecolor": "rgb(36,36,36)" } } ], "mesh3d": [ { "type": "mesh3d", "colorbar": { "ticks": "outside", "ticklen": 8, "tickcolor": "rgb(36,36,36)", "tickwidth": 2, "outlinewidth": 0 } } ], "contour": [ { "type": "contour", "colorbar": { "ticks": "outside", "ticklen": 8, "tickcolor": "rgb(36,36,36)", "tickwidth": 2, "outlinewidth": 0 }, "autocolorscale": true } ], "heatmap": [ { "type": "heatmap", "colorbar": { "ticks": "outside", "ticklen": 8, "tickcolor": "rgb(36,36,36)", "tickwidth": 2, "outlinewidth": 0 }, "autocolorscale": true } ], "scatter": [ { "type": "scatter", "marker": { "colorbar": { "ticks": "outside", "ticklen": 8, "tickcolor": "rgb(36,36,36)", "tickwidth": 2, "outlinewidth": 0 } } } ], "surface": [ { "type": "surface", "colorbar": { "ticks": "outside", "ticklen": 8, "tickcolor": "rgb(36,36,36)", "tickwidth": 2, "outlinewidth": 0 } } ], "heatmapgl": [ { "type": "heatmapgl", "colorbar": { "ticks": "outside", "ticklen": 8, "tickcolor": "rgb(36,36,36)", "tickwidth": 2, "outlinewidth": 0 } } ], "histogram": [ { "type": "histogram", "marker": { "colorbar": { "ticks": "outside", "ticklen": 8, "tickcolor": "rgb(36,36,36)", "tickwidth": 2, "outlinewidth": 0 } } } ], "parcoords": [ { "line": { "colorbar": { "ticks": "outside", "ticklen": 8, "tickcolor": "rgb(36,36,36)", "tickwidth": 2, "outlinewidth": 0 } }, "type": "parcoords" } ], "scatter3d": [ { "type": "scatter3d", "marker": { "colorbar": { "ticks": "outside", "ticklen": 8, "tickcolor": "rgb(36,36,36)", "tickwidth": 2, "outlinewidth": 0 } } } ], "scattergl": [ { "type": "scattergl", "marker": { "colorbar": { "ticks": "outside", "ticklen": 8, "tickcolor": "rgb(36,36,36)", "tickwidth": 2, "outlinewidth": 0 } } } ], "choropleth": [ { "type": "choropleth", "colorbar": { "ticks": "outside", "ticklen": 8, "tickcolor": "rgb(36,36,36)", "tickwidth": 2, "outlinewidth": 0 } } ], "scattergeo": [ { "type": "scattergeo", "marker": { "colorbar": { "ticks": "outside", "ticklen": 8, "tickcolor": "rgb(36,36,36)", "tickwidth": 2, "outlinewidth": 0 } } } ], "histogram2d": [ { "type": "histogram2d", "colorbar": { "ticks": "outside", "ticklen": 8, "tickcolor": "rgb(36,36,36)", "tickwidth": 2, "outlinewidth": 0 }, "autocolorscale": true } ], "scatterpolar": [ { "type": "scatterpolar", "marker": { "colorbar": { "ticks": "outside", "ticklen": 8, "tickcolor": "rgb(36,36,36)", "tickwidth": 2, "outlinewidth": 0 } } } ], "contourcarpet": [ { "type": "contourcarpet", "colorbar": { "ticks": "outside", "ticklen": 8, "tickcolor": "rgb(36,36,36)", "tickwidth": 2, "outlinewidth": 0 } } ], "scattercarpet": [ { "type": "scattercarpet", "marker": { "colorbar": { "ticks": "outside", "ticklen": 8, "tickcolor": "rgb(36,36,36)", "tickwidth": 2, "outlinewidth": 0 } } } ], "scattermapbox": [ { "type": "scattermapbox", "marker": { "colorbar": { "ticks": "outside", "ticklen": 8, "tickcolor": "rgb(36,36,36)", "tickwidth": 2, "outlinewidth": 0 } } } ], "scatterpolargl": [ { "type": "scatterpolargl", "marker": { "colorbar": { "ticks": "outside", "ticklen": 8, "tickcolor": "rgb(36,36,36)", "tickwidth": 2, "outlinewidth": 0 } } } ], "scatterternary": [ { "type": "scatterternary", "marker": { "colorbar": { "ticks": "outside", "ticklen": 8, "tickcolor": "rgb(36,36,36)", "tickwidth": 2, "outlinewidth": 0 } } } ], "histogram2dcontour": [ { "type": "histogram2dcontour", "colorbar": { "ticks": "outside", "ticklen": 8, "tickcolor": "rgb(36,36,36)", "tickwidth": 2, "outlinewidth": 0 }, "autocolorscale": true } ] }, "layout": { "geo": { "bgcolor": "white", "showland": true, "lakecolor": "white", "landcolor": "rgb(234,234,242)", "showlakes": true, "subunitcolor": "white" }, "font": { "color": "rgb(36,36,36)" }, "polar": { "bgcolor": "rgb(234,234,242)", "radialaxis": { "ticks": "", "showgrid": true, "gridcolor": "white", "linecolor": "white" }, "angularaxis": { "ticks": "", "showgrid": true, "gridcolor": "white", "linecolor": "white" } }, "scene": { "xaxis": { "ticks": "", "showgrid": true, "gridcolor": "white", "gridwidth": 2, "linecolor": "white", "zerolinecolor": "white", "showbackground": true, "backgroundcolor": "rgb(234,234,242)" }, "yaxis": { "ticks": "", "showgrid": true, "gridcolor": "white", "gridwidth": 2, "linecolor": "white", "zerolinecolor": "white", "showbackground": true, "backgroundcolor": "rgb(234,234,242)" }, "zaxis": { "ticks": "", "showgrid": true, "gridcolor": "white", "gridwidth": 2, "linecolor": "white", "zerolinecolor": "white", "showbackground": true, "backgroundcolor": "rgb(234,234,242)" } }, "xaxis": { "ticks": "", "showgrid": true, "gridcolor": "white", "linecolor": "white", "automargin": true, "zerolinecolor": "white" }, "yaxis": { "ticks": "", "showgrid": true, "gridcolor": "white", "linecolor": "white", "automargin": true, "zerolinecolor": "white" }, "ternary": { "aaxis": { "ticks": "", "showgrid": true, "gridcolor": "white", "linecolor": "white" }, "baxis": { "ticks": "", "showgrid": true, "gridcolor": "white", "linecolor": "white" }, "caxis": { "ticks": "", "showgrid": true, "gridcolor": "white", "linecolor": "white" }, "bgcolor": "rgb(234,234,242)" }, "colorway": [ "rgb(76,114,176)", "rgb(221,132,82)", "rgb(85,168,104)", "rgb(196,78,82)", "rgb(129,114,179)", "rgb(147,120,96)", "rgb(218,139,195)", "rgb(140,140,140)", "rgb(204,185,116)", "rgb(100,181,205)" ], "hovermode": "closest", "colorscale": { "diverging": [ [ 0, "#67001f" ], [ 0.1, "#b2182b" ], [ 0.2, "#d6604d" ], [ 0.3, "#f4a582" ], [ 0.4, "#fddbc7" ], [ 0.5, "#f7f7f7" ], [ 0.6, "#d1e5f0" ], [ 0.7, "#92c5de" ], [ 0.8, "#4393c3" ], [ 0.9, "#2166ac" ], [ 1, "#053061" ] ], "sequential": [ [ 0, "rgb(2,4,25)" ], [ 0.06274509803921569, "rgb(24,15,41)" ], [ 0.12549019607843137, "rgb(47,23,57)" ], [ 0.18823529411764706, "rgb(71,28,72)" ], [ 0.25098039215686274, "rgb(97,30,82)" ], [ 0.3137254901960784, "rgb(123,30,89)" ], [ 0.3764705882352941, "rgb(150,27,91)" ], [ 0.4392156862745098, "rgb(177,22,88)" ], [ 0.5019607843137255, "rgb(203,26,79)" ], [ 0.5647058823529412, "rgb(223,47,67)" ], [ 0.6274509803921569, "rgb(236,76,61)" ], [ 0.6901960784313725, "rgb(242,107,73)" ], [ 0.7529411764705882, "rgb(244,135,95)" ], [ 0.8156862745098039, "rgb(245,162,122)" ], [ 0.8784313725490196, "rgb(246,188,153)" ], [ 0.9411764705882353, "rgb(247,212,187)" ], [ 1, "rgb(250,234,220)" ] ], "sequentialminus": [ [ 0, "rgb(2,4,25)" ], [ 0.06274509803921569, "rgb(24,15,41)" ], [ 0.12549019607843137, "rgb(47,23,57)" ], [ 0.18823529411764706, "rgb(71,28,72)" ], [ 0.25098039215686274, "rgb(97,30,82)" ], [ 0.3137254901960784, "rgb(123,30,89)" ], [ 0.3764705882352941, "rgb(150,27,91)" ], [ 0.4392156862745098, "rgb(177,22,88)" ], [ 0.5019607843137255, "rgb(203,26,79)" ], [ 0.5647058823529412, "rgb(223,47,67)" ], [ 0.6274509803921569, "rgb(236,76,61)" ], [ 0.6901960784313725, "rgb(242,107,73)" ], [ 0.7529411764705882, "rgb(244,135,95)" ], [ 0.8156862745098039, "rgb(245,162,122)" ], [ 0.8784313725490196, "rgb(246,188,153)" ], [ 0.9411764705882353, "rgb(247,212,187)" ], [ 1, "rgb(250,234,220)" ] ] }, "plot_bgcolor": "rgb(234,234,242)", "paper_bgcolor": "white", "shapedefaults": { "line": { "width": 0 }, "opacity": 0.5, "fillcolor": "rgb(67,103,167)" }, "annotationdefaults": { "arrowcolor": "rgb(67,103,167)" } }, "themeRef": "SEABORN" }, "colorscale": { "diverging": [ [ 0, "#9e0142" ], [ 0.1, "#d53e4f" ], [ 0.2, "#f46d43" ], [ 0.3, "#fdae61" ], [ 0.4, "#fee08b" ], [ 0.5, "#ffffbf" ], [ 0.6, "#e6f598" ], [ 0.7, "#abdda4" ], [ 0.8, "#66c2a5" ], [ 0.9, "#3288bd" ], [ 1, "#5e4fa2" ] ], "sequentialminus": [ [ 0, "#020419" ], [ 0.0625, "#180f29" ], [ 0.125, "#2f1739" ], [ 0.1875, "#471c48" ], [ 0.25, "#611e52" ], [ 0.3125, "#7b1e59" ], [ 0.375, "#961b5b" ], [ 0.4375, "#b11658" ], [ 0.5, "#cb1a4f" ], [ 0.5625, "#df2f43" ], [ 0.625, "#ec4c3d" ], [ 0.6875, "#f26b49" ], [ 0.75, "#f4875f" ], [ 0.8125, "#f5a27a" ], [ 0.875, "#f6bc99" ], [ 0.9375, "#f7d4bb" ], [ 1, "#faeadc" ] ] }, "showlegend": true, "annotations": [ { "x": 225, "y": 78, "font": { "size": 20 }, "text": "a)", "showarrow": false } ] } }, "height": null, "width": null, "user": { "profile_url": "https://chart-studio.plotly.com/~DORITOS12", "avatar_url": "https://storage.googleapis.com/plotly-prod-profiles/50.jpg", "background_url": "https://storage.googleapis.com/plotly-prod-profiles/bg-2.jpg", "bio": "", "nickname": "", "website": "", "stream_tokens": null, "feature_set_id": null, "csrf_token": null, "date_joined": "2024-02-24 22:37:07", "mapbox_access_tokens": null, "has_password": null, "username": "DORITOS12", "email": null, "is_active": null, "readonly": null, "is_dash_creator": null, "dash_created_count": null, "is_chart_creator": null, "charts_created_count": null } }, { "creation_time": "2024-04-04T00:16:54.182165Z", "comments": { "results": [], "count": 0 }, "parented": true, "embed_url": "https://chart-studio.plotly.com/~viggi_ravi_uri/11.embed", "fid": "viggi_ravi_uri:11", "filename": "Glove wearing time plot", "filetype": "plot", "img_url": "https://storage.googleapis.com/plotly-prod-images/viggi_ravi_uri/11/9_ITZ0DKSIYICGKO8NOY75SNB2M6CYGK.png", "image_urls": { "default": "https://storage.googleapis.com/plotly-prod-images/viggi_ravi_uri/11/2_2VFHJ3EAU9I9026U0I5QMRQK41JZJ6.png", "block-thumb": "https://storage.googleapis.com/plotly-prod-images/viggi_ravi_uri/11/8_VDTDN9CWG3G664LH1ESTYXLPNNZ1VZ.png", "list-thumb": "https://storage.googleapis.com/plotly-prod-images/viggi_ravi_uri/11/9_ITZ0DKSIYICGKO8NOY75SNB2M6CYGK.png" }, "api_urls": { "files": "https://api.plotly.com/v2/files/viggi_ravi_uri:11", "plots": "https://api.plotly.com/v2/plots/viggi_ravi_uri:11", "parent": "https://api.plotly.com/v2/folders/home?user=viggi_ravi_uri" }, "owner": "viggi_ravi_uri", "parent": -1, "preview": "", "referencers": [], "references": [], "title": "", "views": 4, "web_url": "https://chart-studio.plotly.com/~viggi_ravi_uri/11/", "world_readable": true, "date_modified": "2024-04-04T00:16:54.202Z", "stars": { "results": [], "count": 0 }, "collaborators": { "results": [], "count": 0 }, "subfolder_count": null, "refresh_interval": null, "organize_view_url": "https://chart-studio.plotly.com/~viggi_ravi_uri/11/", "current_user_permission": "read", "is_theme": null, "is_template": false, "autosize": true, "caption": "", "figure": { "data": [ { "meta": { "columnNames": { "x": "", "y": "FC-V (On)" } }, "mode": "markers", "name": "FC-V (On)", "type": "box", "ysrc": "viggi_ravi_uri:10:86a7f3", "boxpoints": false, "orientation": "v" }, { "meta": { "columnNames": { "y": "FC-Z (On)" } }, "name": "FC-Z (On)", "type": "box", "ysrc": "viggi_ravi_uri:10:98d871", "boxpoints": false }, { "meta": { "columnNames": { "y": "Peekaboo V1 (On)" } }, "name": "Peekaboo V1 (On)", "type": "box", "ysrc": "viggi_ravi_uri:10:98670f", "boxpoints": false }, { "meta": { "columnNames": { "y": "Peekaboo V2 (On)" } }, "name": "Peekaboo V2 (On)", "type": "box", "ysrc": "viggi_ravi_uri:10:aa692a", "boxpoints": false } ], "frames": [], "layout": { "font": { "size": 28 }, "title": { "x": 0.5, "text": "Time taken to put on gloves" }, "xaxis": { "type": "category", "range": [ -0.5, 3.5 ], "title": { "text": "Type of glove" }, "autorange": true }, "yaxis": { "type": "linear", "range": [ -2.7777777777777803, 252.77777777777777 ], "title": { "text": "Time Taken (s)" }, "autorange": true }, "legend": { "x": 0.9199999999999999, "y": 1.08, "xanchor": "auto", "orientation": "h" }, "autosize": true, "template": { "data": { "bar": [ { "type": "bar", "marker": { "colorbar": { "ticks": "", "outlinewidth": 0 } } } ], "table": [ { "type": "table", "cells": { "fill": { "color": "#EBF0F8" }, "line": { "color": "white" } }, "header": { "fill": { "color": "#C8D4E3" }, "line": { "color": "white" } } } ], "carpet": [ { "type": "carpet", "aaxis": { "gridcolor": "#C8D4E3", "linecolor": "#C8D4E3", "endlinecolor": "#2a3f5f", "minorgridcolor": "#C8D4E3", "startlinecolor": "#2a3f5f" }, "baxis": { "gridcolor": "#C8D4E3", "linecolor": "#C8D4E3", "endlinecolor": "#2a3f5f", "minorgridcolor": "#C8D4E3", "startlinecolor": "#2a3f5f" } } ], "mesh3d": [ { "type": "mesh3d", "colorbar": { "ticks": "", "outlinewidth": 0 } } ], "contour": [ { "type": "contour", "colorbar": { "ticks": "", "outlinewidth": 0 }, "autocolorscale": true } ], "heatmap": [ { "type": "heatmap", "colorbar": { "ticks": "", "outlinewidth": 0 }, "autocolorscale": true } ], "scatter": [ { "type": "scatter", "marker": { "colorbar": { "ticks": "", "outlinewidth": 0 } } } ], "surface": [ { "type": "surface", "colorbar": { "ticks": "", "outlinewidth": 0 } } ], "heatmapgl": [ { "type": "heatmapgl", "colorbar": { "ticks": "", "outlinewidth": 0 } } ], "histogram": [ { "type": "histogram", "marker": { "colorbar": { "ticks": "", "outlinewidth": 0 } } } ], "parcoords": [ { "line": { "colorbar": { "ticks": "", "outlinewidth": 0 } }, "type": "parcoords" } ], "scatter3d": [ { "type": "scatter3d", "marker": { "colorbar": { "ticks": "", "outlinewidth": 0 } } } ], "scattergl": [ { "type": "scattergl", "marker": { "colorbar": { "ticks": "", "outlinewidth": 0 } } } ], "choropleth": [ { "type": "choropleth", "colorbar": { "ticks": "", "outlinewidth": 0 } } ], "scattergeo": [ { "type": "scattergeo", "marker": { "colorbar": { "ticks": "", "outlinewidth": 0 } } } ], "histogram2d": [ { "type": "histogram2d", "colorbar": { "ticks": "", "outlinewidth": 0 }, "autocolorscale": true } ], "scatterpolar": [ { "type": "scatterpolar", "marker": { "colorbar": { "ticks": "", "outlinewidth": 0 } } } ], "contourcarpet": [ { "type": "contourcarpet", "colorbar": { "ticks": "", "outlinewidth": 0 } } ], "scattercarpet": [ { "type": "scattercarpet", "marker": { "colorbar": { "ticks": "", "outlinewidth": 0 } } } ], "scattermapbox": [ { "type": "scattermapbox", "marker": { "colorbar": { "ticks": "", "outlinewidth": 0 } } } ], "scatterpolargl": [ { "type": "scatterpolargl", "marker": { "colorbar": { "ticks": "", "outlinewidth": 0 } } } ], "scatterternary": [ { "type": "scatterternary", "marker": { "colorbar": { "ticks": "", "outlinewidth": 0 } } } ], "histogram2dcontour": [ { "type": "histogram2dcontour", "colorbar": { "ticks": "", "outlinewidth": 0 }, "autocolorscale": true } ] }, "layout": { "geo": { "bgcolor": "white", "showland": true, "lakecolor": "white", "landcolor": "white", "showlakes": true, "subunitcolor": "#C8D4E3" }, "font": { "color": "#2a3f5f" }, "polar": { "bgcolor": "white", "radialaxis": { "ticks": "", "gridcolor": "#EBF0F8", "linecolor": "#EBF0F8" }, "angularaxis": { "ticks": "", "gridcolor": "#EBF0F8", "linecolor": "#EBF0F8" } }, "scene": { "xaxis": { "ticks": "", "gridcolor": "#DFE8F3", "gridwidth": 2, "linecolor": "#EBF0F8", "zerolinecolor": "#EBF0F8", "showbackground": true, "backgroundcolor": "white" }, "yaxis": { "ticks": "", "gridcolor": "#DFE8F3", "gridwidth": 2, "linecolor": "#EBF0F8", "zerolinecolor": "#EBF0F8", "showbackground": true, "backgroundcolor": "white" }, "zaxis": { "ticks": "", "gridcolor": "#DFE8F3", "gridwidth": 2, "linecolor": "#EBF0F8", "zerolinecolor": "#EBF0F8", "showbackground": true, "backgroundcolor": "white" } }, "title": { "x": 0.05 }, "xaxis": { "ticks": "", "gridcolor": "#EBF0F8", "linecolor": "#EBF0F8", "automargin": true, "zerolinecolor": "#EBF0F8", "zerolinewidth": 2 }, "yaxis": { "ticks": "", "gridcolor": "#EBF0F8", "linecolor": "#EBF0F8", "automargin": true, "zerolinecolor": "#EBF0F8", "zerolinewidth": 2 }, "ternary": { "aaxis": { "ticks": "", "gridcolor": "#DFE8F3", "linecolor": "#A2B1C6" }, "baxis": { "ticks": "", "gridcolor": "#DFE8F3", "linecolor": "#A2B1C6" }, "caxis": { "ticks": "", "gridcolor": "#DFE8F3", "linecolor": "#A2B1C6" }, "bgcolor": "white" }, "colorway": [ "#636efa", "#EF553B", "#00cc96", "#ab63fa", "#19d3f3", "#e763fa", "#fecb52", "#ffa15a", "#ff6692", "#b6e880" ], "hovermode": "closest", "colorscale": { "diverging": [ [ 0, "#8e0152" ], [ 0.1, "#c51b7d" ], [ 0.2, "#de77ae" ], [ 0.3, "#f1b6da" ], [ 0.4, "#fde0ef" ], [ 0.5, "#f7f7f7" ], [ 0.6, "#e6f5d0" ], [ 0.7, "#b8e186" ], [ 0.8, "#7fbc41" ], [ 0.9, "#4d9221" ], [ 1, "#276419" ] ], "sequential": [ [ 0, "#0508b8" ], [ 0.0893854748603352, "#1910d8" ], [ 0.1787709497206704, "#3c19f0" ], [ 0.2681564245810056, "#6b1cfb" ], [ 0.3575418994413408, "#981cfd" ], [ 0.44692737430167595, "#bf1cfd" ], [ 0.5363128491620112, "#dd2bfd" ], [ 0.6256983240223464, "#f246fe" ], [ 0.7150837988826816, "#fc67fd" ], [ 0.8044692737430168, "#fe88fc" ], [ 0.8938547486033519, "#fea5fd" ], [ 0.9832402234636871, "#febefe" ], [ 1, "#fec3fe" ] ], "sequentialminus": [ [ 0, "#0508b8" ], [ 0.0893854748603352, "#1910d8" ], [ 0.1787709497206704, "#3c19f0" ], [ 0.2681564245810056, "#6b1cfb" ], [ 0.3575418994413408, "#981cfd" ], [ 0.44692737430167595, "#bf1cfd" ], [ 0.5363128491620112, "#dd2bfd" ], [ 0.6256983240223464, "#f246fe" ], [ 0.7150837988826816, "#fc67fd" ], [ 0.8044692737430168, "#fe88fc" ], [ 0.8938547486033519, "#fea5fd" ], [ 0.9832402234636871, "#febefe" ], [ 1, "#fec3fe" ] ] }, "plot_bgcolor": "white", "paper_bgcolor": "white", "shapedefaults": { "line": { "width": 0 }, "opacity": 0.4, "fillcolor": "#506784" }, "annotationdefaults": { "arrowhead": 0, "arrowcolor": "#506784", "arrowwidth": 1 } }, "themeRef": "PLOTLY_WHITE" }, "uniformtext": { "mode": "show", "minsize": 28 } } }, "height": null, "width": null, "user": { "profile_url": "https://chart-studio.plotly.com/~viggi_ravi_uri", "avatar_url": "https://storage.googleapis.com/plotly-prod-profiles/25.jpg", "background_url": "https://storage.googleapis.com/plotly-prod-profiles/bg-11.jpg", "bio": "", "nickname": "", "website": "", "stream_tokens": null, "feature_set_id": null, "csrf_token": null, "date_joined": "2022-12-08 23:32:46", "mapbox_access_tokens": null, "has_password": null, "username": "viggi_ravi_uri", "email": null, "is_active": null, "readonly": null, "is_dash_creator": null, "dash_created_count": null, "is_chart_creator": null, "charts_created_count": null } }, { "creation_time": "2024-04-04T00:00:10.126127Z", "comments": { "results": [], "count": 0 }, "parented": true, "embed_url": "https://chart-studio.plotly.com/~genoshistoria2/45.embed", "fid": "genoshistoria2:45", "filename": "PCA 4 3 24", "filetype": "plot", "img_url": "https://storage.googleapis.com/plotly-prod-images/genoshistoria2/45/9_40UMEMXPXJG1K6ISZQTNMQ6LAGWWQX.png", "image_urls": { "default": "https://storage.googleapis.com/plotly-prod-images/genoshistoria2/45/2_FOE6X2Q2KVFX2VFF8QURSNCVJRTX6F.png", "block-thumb": "https://storage.googleapis.com/plotly-prod-images/genoshistoria2/45/8_K0X8MIK1P6XPPGRUMP548OPOE4I1HU.png", "list-thumb": "https://storage.googleapis.com/plotly-prod-images/genoshistoria2/45/9_40UMEMXPXJG1K6ISZQTNMQ6LAGWWQX.png" }, "api_urls": { "files": "https://api.plotly.com/v2/files/genoshistoria2:45", "plots": "https://api.plotly.com/v2/plots/genoshistoria2:45", "parent": "https://api.plotly.com/v2/folders/home?user=genoshistoria2" }, "owner": "genoshistoria2", "parent": -1, "preview": "", "referencers": [], "references": [], "title": "", "views": 1, "web_url": "https://chart-studio.plotly.com/~genoshistoria2/45/", "world_readable": true, "date_modified": "2024-04-04T20:23:30.730Z", "stars": { "results": [], "count": 0 }, "collaborators": { "results": [], "count": 0 }, "subfolder_count": null, "refresh_interval": null, "organize_view_url": "https://chart-studio.plotly.com/~genoshistoria2/45/", "current_user_permission": "read", "is_theme": null, "is_template": false, "autosize": true, "caption": "", "figure": { "data": [ { "meta": { "columnNames": { "x": "PC 1 BigThree", "y": "PC 2 BigThree", "text": "BigThree" } }, "mode": "markers", "name": "Neolithic SW Asia", "type": "scatter", "xsrc": "genoshistoria2:43:0ee3e5", "ysrc": "genoshistoria2:43:064d26", "marker": { "line": { "width": 2 }, "size": 20 }, "textsrc": "genoshistoria2:43:0fc253", "stackgroup": null }, { "meta": { "columnNames": { "x": "PC 1 Epi", "y": "PC 2 Epi", "text": "Epi" } }, "mode": "markers", "name": "Epi SW Asia", "type": "scatter", "xsrc": "genoshistoria2:41:4341ff", "ysrc": "genoshistoria2:41:4a7223", "marker": { "line": { "width": 2 }, "size": 30, "color": "rgb(0, 204, 150)" }, "textsrc": "genoshistoria2:41:857470", "stackgroup": null }, { "meta": { "columnNames": { "x": "PC1 Steppe", "y": "PC2 Steppe", "text": "Steppe" } }, "mode": "none", "name": "Steppe", "type": "scatter", "xsrc": "genoshistoria2:44:9d7f28", "ysrc": "genoshistoria2:44:cdca43", "marker": { "line": { "width": 1 }, "size": 10, "color": "rgb(243, 221, 25)" }, "textsrc": "genoshistoria2:44:75287b", "stackgroup": null }, { "meta": { "columnNames": { "x": "PC1 Russia Meso ish", "y": "PC2 Russia Meso ish", "text": "Russia Meso ish" } }, "mode": "markers", "name": "Russia Meso", "type": "scatter", "xsrc": "genoshistoria2:46:a16218", "ysrc": "genoshistoria2:46:538488", "marker": { "line": { "width": 2 }, "size": 10, "color": "rgb(241, 12, 12)" }, "textsrc": "genoshistoria2:46:ea98d6", "stackgroup": null }, { "meta": { "columnNames": { "x": "PC1 Latvia Meso", "y": "PC2 Latvia Meso", "text": "Latvia Meso" } }, "mode": "markers", "name": "Latvia Meso", "type": "scatter", "xsrc": "genoshistoria2:46:e2c137", "ysrc": "genoshistoria2:46:509398", "marker": { "line": { "width": 1 }, "size": 10, "color": "rgb(255, 128, 87)", "symbol": "square" }, "textsrc": "genoshistoria2:46:33ea70", "stackgroup": null }, { "meta": { "columnNames": { "x": "PC 1 Balkan Meso", "y": "PC 2 Balkan Meso", "text": "Balkan Meso" } }, "mode": "markers", "name": "Balkan meso", "type": "scatter", "xsrc": "genoshistoria2:46:82cea8", "ysrc": "genoshistoria2:46:b4513d", "marker": { "line": { "width": 1 }, "size": 10, "color": "rgb(250, 210, 99)" }, "textsrc": "genoshistoria2:46:b77647", "stackgroup": null }, { "meta": { "columnNames": { "x": "PC 1 Northwest Meso", "y": "PC 2 Northwest Meso", "text": "Northwest Meso" } }, "mode": "markers", "name": "Northwest Meso", "type": "scatter", "xsrc": "genoshistoria2:46:e895ac", "ysrc": "genoshistoria2:46:7fdfce", "marker": { "line": { "width": 2 }, "size": 20, "color": "rgb(232, 254, 82)", "symbol": "square" }, "textsrc": "genoshistoria2:46:fb175a", "stackgroup": null }, { "meta": { "columnNames": { "x": "PC 1 Iberia Meso", "y": "PC 2 Iberia Meso", "text": "Iberia Meso" } }, "mode": "none", "name": "Iberia Meso", "type": "scatter", "xsrc": "genoshistoria2:46:0385fc", "ysrc": "genoshistoria2:46:ad96a5", "marker": { "line": { "width": 1 }, "size": 10, "color": "rgb(174, 253, 32)" }, "textsrc": "genoshistoria2:46:81db16", "stackgroup": null }, { "meta": { "columnNames": { "x": "PC 1 Italy meso", "y": "PC 2 Italy meso", "text": "Italy meso" } }, "mode": "markers", "name": "Italy Meso", "type": "scatter", "xsrc": "genoshistoria2:46:39bb00", "ysrc": "genoshistoria2:46:f31231", "marker": { "line": { "width": 2 }, "size": 20, "color": "rgb(232, 254, 82)" }, "textsrc": "genoshistoria2:46:39e5ba", "stackgroup": null }, { "meta": { "columnNames": { "x": "PC 1 Scandinavia Meso", "y": "PC 2 Scandinavia Meso", "text": "Scandinavia Meso" } }, "mode": "markers", "name": "Scandinavia Meso", "type": "scatter", "xsrc": "genoshistoria2:46:369bd0", "ysrc": "genoshistoria2:46:4a441b", "marker": { "line": { "width": 1 }, "size": 10, "color": "rgb(232, 184, 128)", "symbol": "diamond" }, "textsrc": "genoshistoria2:46:6e46d8", "stackgroup": null }, { "meta": { "columnNames": { "x": "PC 1 ANE", "y": "PC 2 ANE", "text": "ANE" } }, "mode": "markers", "name": "ANE", "type": "scatter", "xsrc": "genoshistoria2:47:94fd95", "ysrc": "genoshistoria2:47:69c8e3", "marker": { "line": { "width": 2 }, "size": 20, "color": "rgb(18, 230, 77)" }, "textsrc": "genoshistoria2:47:6f272c", "stackgroup": null }, { "meta": { "columnNames": { "x": "PC1 Epigravvitean", "y": "PC2 Epigravvitean", "text": "Epigravvitean" } }, "mode": "markers", "name": "Epigrav", "type": "scatter", "xsrc": "genoshistoria2:47:fdbb15", "ysrc": "genoshistoria2:47:0e27c0", "marker": { "line": { "width": 2 }, "size": 20, "color": "rgb(18, 230, 77)", "symbol": "square" }, "textsrc": "genoshistoria2:47:2dc3fc", "stackgroup": null }, { "meta": { "columnNames": { "x": "PC 1 Magdelnain", "y": "PC 2 Magdelnain", "text": "Magdelnain" } }, "mode": "markers", "name": "Magdelnian", "type": "scatter", "xsrc": "genoshistoria2:47:837b77", "ysrc": "genoshistoria2:47:5794e3", "marker": { "line": { "width": 2 }, "size": 20, "color": "rgb(77, 204, 0)", "symbol": "diamond" }, "textsrc": "genoshistoria2:47:c59e29", "stackgroup": null }, { "meta": { "columnNames": { "x": "PC 1 Greece Neolithic", "y": "PC 2 Greece Neolithic", "text": "Greece Neolithic" } }, "mode": "markers", "name": "Greece Neo", "type": "scatter", "xsrc": "genoshistoria2:48:9b6c91", "ysrc": "genoshistoria2:48:0b1e8d", "marker": { "line": { "width": 2 }, "size": 20, "color": "rgb(25, 243, 228)", "symbol": "square" }, "textsrc": "genoshistoria2:48:47167a", "stackgroup": null }, { "meta": { "columnNames": { "x": "PC 1 Balkans Neo", "y": "PC 2 Balkans Neo", "text": "Balkans Neo" } }, "mode": "none", "name": "Balkan Neo", "type": "scatter", "xsrc": "genoshistoria2:48:de86b2", "ysrc": "genoshistoria2:48:a26df7", "marker": { "line": { "width": 1 }, "size": 10, "color": "rgb(25, 243, 49)" }, "textsrc": "genoshistoria2:48:670368", "stackgroup": null }, { "meta": { "columnNames": { "x": "PC 1 Sardinia Neo", "y": "PC 2 Sardinia Neo", "text": "Sardinia Neo" } }, "mode": "none", "name": "Sardinia Neo", "type": "scatter", "xsrc": "genoshistoria2:48:9349f2", "ysrc": "genoshistoria2:48:ffc936", "marker": { "line": { "width": 1 }, "size": 15, "color": "rgb(253, 20, 192)", "symbol": "diamond" }, "textsrc": "genoshistoria2:48:ad8e0c", "stackgroup": null }, { "meta": { "columnNames": { "x": "PC 1 Italy Neo", "y": "PC 2 Italy Neo", "text": "Italy Neo" } }, "mode": "none", "name": "Italy neo", "type": "scatter", "xsrc": "genoshistoria2:48:e7e3eb", "ysrc": "genoshistoria2:48:d5249d", "marker": { "line": { "width": 2 }, "size": 20, "color": "rgb(234, 123, 36)", "opacity": 1 }, "textsrc": "genoshistoria2:48:3f7d3b", "stackgroup": null }, { "meta": { "columnNames": { "x": "PC 1 LBK ish", "y": "PC 2 LBK ish", "text": "LBK ish" } }, "mode": "none", "name": "LBK ish", "type": "scatter", "xsrc": "genoshistoria2:48:943625", "ysrc": "genoshistoria2:48:4620f1", "marker": { "line": { "width": 1 }, "size": 20, "color": "rgb(172, 243, 25)", "symbol": "square" }, "textsrc": "genoshistoria2:48:430207", "stackgroup": null }, { "meta": { "columnNames": { "x": "PC 1 France Neo ish", "y": "PC 2 France Neo ish", "text": "France Neo ish" } }, "mode": "markers", "name": "France Neo ish", "type": "scatter", "xsrc": "genoshistoria2:48:0ceb9f", "ysrc": "genoshistoria2:48:5e06e0", "marker": { "line": { "width": 1 }, "size": 20, "color": "rgb(254, 0, 29)" }, "textsrc": "genoshistoria2:48:eb6167", "stackgroup": null }, { "meta": { "columnNames": { "x": "PC 1 Funnel Beaker ish", "y": "PC 2 Funnel Beaker ish", "text": "Funnel Beaker ish" } }, "mode": "none", "name": "Funnel Beaker ish", "type": "scatter", "xsrc": "genoshistoria2:48:51a58e", "ysrc": "genoshistoria2:48:83d260", "marker": { "line": { "width": 1 }, "size": 15, "color": "rgb(253, 168, 20)", "symbol": "square" }, "textsrc": "genoshistoria2:48:c8d286", "stackgroup": null }, { "meta": { "columnNames": { "x": "PC 1 Iberia Neo", "y": "PC 2 Iberia Neo", "text": "Iberia Neo" } }, "mode": "none", "name": "Iberia Neolithic", "type": "scatter", "xsrc": "genoshistoria2:49:0ff10c", "ysrc": "genoshistoria2:49:5a27b9", "marker": { "line": { "width": 1 }, "size": 25, "color": "rgb(250, 99, 240)" }, "textsrc": "genoshistoria2:49:a1cdca", "stackgroup": null } ], "frames": [], "layout": { "xaxis": { "type": "linear", "range": [ 0.08530562546708823, 0.20881417964932444 ], "autorange": false }, "yaxis": { "type": "linear", "range": [ -0.072709518501171, 0.0743992402810304 ], "autorange": false }, "shapes": [ { "x0": 0.17273527747612405, "x1": 0.11943360082984589, "y0": 0.002320852103044515, "y1": 0.06263299139110072, "line": { "color": "#444444", "width": 20 }, "type": "line", "opacity": 0.75, "fillcolor": "#7f7f7f" }, { "x0": 0.12597470139142258, "x1": 0.18276848571735158, "y0": 0.06792155126932085, "y1": 0.0033309989133489667, "line": { "color": "#444444", "width": 20 }, "type": "line", "opacity": 0.75, "fillcolor": "#7f7f7f" } ], "autosize": true, "dragmode": "pan", "template": { "data": { "bar": [ { "type": "bar", "marker": { "colorbar": { "ticks": "", "outlinewidth": 0 } } } ], "table": [ { "type": "table", "cells": { "fill": { "color": "#EBF0F8" }, "line": { "color": "white" } }, "header": { "fill": { "color": "#C8D4E3" }, "line": { "color": "white" } } } ], "carpet": [ { "type": "carpet", "aaxis": { "gridcolor": "#C8D4E3", "linecolor": "#C8D4E3", "endlinecolor": "#2a3f5f", "minorgridcolor": "#C8D4E3", "startlinecolor": "#2a3f5f" }, "baxis": { "gridcolor": "#C8D4E3", "linecolor": "#C8D4E3", "endlinecolor": "#2a3f5f", "minorgridcolor": "#C8D4E3", "startlinecolor": "#2a3f5f" } } ], "mesh3d": [ { "type": "mesh3d", "colorbar": { "ticks": "", "outlinewidth": 0 } } ], "contour": [ { "type": "contour", "colorbar": { "ticks": "", "outlinewidth": 0 }, "autocolorscale": true } ], "heatmap": [ { "type": "heatmap", "colorbar": { "ticks": "", "outlinewidth": 0 }, "autocolorscale": true } ], "scatter": [ { "type": "scatter", "marker": { "colorbar": { "ticks": "", "outlinewidth": 0 } } } ], "surface": [ { "type": "surface", "colorbar": { "ticks": "", "outlinewidth": 0 } } ], "heatmapgl": [ { "type": "heatmapgl", "colorbar": { "ticks": "", "outlinewidth": 0 } } ], "histogram": [ { "type": "histogram", "marker": { "colorbar": { "ticks": "", "outlinewidth": 0 } } } ], "parcoords": [ { "line": { "colorbar": { "ticks": "", "outlinewidth": 0 } }, "type": "parcoords" } ], "scatter3d": [ { "type": "scatter3d", "marker": { "colorbar": { "ticks": "", "outlinewidth": 0 } } } ], "scattergl": [ { "type": "scattergl", "marker": { "colorbar": { "ticks": "", "outlinewidth": 0 } } } ], "choropleth": [ { "type": "choropleth", "colorbar": { "ticks": "", "outlinewidth": 0 } } ], "scattergeo": [ { "type": "scattergeo", "marker": { "colorbar": { "ticks": "", "outlinewidth": 0 } } } ], "histogram2d": [ { "type": "histogram2d", "colorbar": { "ticks": "", "outlinewidth": 0 }, "autocolorscale": true } ], "scatterpolar": [ { "type": "scatterpolar", "marker": { "colorbar": { "ticks": "", "outlinewidth": 0 } } } ], "contourcarpet": [ { "type": "contourcarpet", "colorbar": { "ticks": "", "outlinewidth": 0 } } ], "scattercarpet": [ { "type": "scattercarpet", "marker": { "colorbar": { "ticks": "", "outlinewidth": 0 } } } ], "scattermapbox": [ { "type": "scattermapbox", "marker": { "colorbar": { "ticks": "", "outlinewidth": 0 } } } ], "scatterpolargl": [ { "type": "scatterpolargl", "marker": { "colorbar": { "ticks": "", "outlinewidth": 0 } } } ], "scatterternary": [ { "type": "scatterternary", "marker": { "colorbar": { "ticks": "", "outlinewidth": 0 } } } ], "histogram2dcontour": [ { "type": "histogram2dcontour", "colorbar": { "ticks": "", "outlinewidth": 0 }, "autocolorscale": true } ] }, "layout": { "geo": { "bgcolor": "white", "showland": true, "lakecolor": "white", "landcolor": "white", "showlakes": true, "subunitcolor": "#C8D4E3" }, "font": { "color": "#2a3f5f" }, "polar": { "bgcolor": "white", "radialaxis": { "ticks": "", "gridcolor": "#EBF0F8", "linecolor": "#EBF0F8" }, "angularaxis": { "ticks": "", "gridcolor": "#EBF0F8", "linecolor": "#EBF0F8" } }, "scene": { "xaxis": { "ticks": "", "gridcolor": "#DFE8F3", "gridwidth": 2, "linecolor": "#EBF0F8", "zerolinecolor": "#EBF0F8", "showbackground": true, "backgroundcolor": "white" }, "yaxis": { "ticks": "", "gridcolor": "#DFE8F3", "gridwidth": 2, "linecolor": "#EBF0F8", "zerolinecolor": "#EBF0F8", "showbackground": true, "backgroundcolor": "white" }, "zaxis": { "ticks": "", "gridcolor": "#DFE8F3", "gridwidth": 2, "linecolor": "#EBF0F8", "zerolinecolor": "#EBF0F8", "showbackground": true, "backgroundcolor": "white" } }, "title": { "x": 0.05 }, "xaxis": { "ticks": "", "gridcolor": "#EBF0F8", "linecolor": "#EBF0F8", "automargin": true, "zerolinecolor": "#EBF0F8", "zerolinewidth": 2 }, "yaxis": { "ticks": "", "gridcolor": "#EBF0F8", "linecolor": "#EBF0F8", "automargin": true, "zerolinecolor": "#EBF0F8", "zerolinewidth": 2 }, "ternary": { "aaxis": { "ticks": "", "gridcolor": "#DFE8F3", "linecolor": "#A2B1C6" }, "baxis": { "ticks": "", "gridcolor": "#DFE8F3", "linecolor": "#A2B1C6" }, "caxis": { "ticks": "", "gridcolor": "#DFE8F3", "linecolor": "#A2B1C6" }, "bgcolor": "white" }, "colorway": [ "#636efa", "#EF553B", "#00cc96", "#ab63fa", "#19d3f3", "#e763fa", "#fecb52", "#ffa15a", "#ff6692", "#b6e880" ], "hovermode": "closest", "colorscale": { "diverging": [ [ 0, "#8e0152" ], [ 0.1, "#c51b7d" ], [ 0.2, "#de77ae" ], [ 0.3, "#f1b6da" ], [ 0.4, "#fde0ef" ], [ 0.5, "#f7f7f7" ], [ 0.6, "#e6f5d0" ], [ 0.7, "#b8e186" ], [ 0.8, "#7fbc41" ], [ 0.9, "#4d9221" ], [ 1, "#276419" ] ], "sequential": [ [ 0, "#0508b8" ], [ 0.0893854748603352, "#1910d8" ], [ 0.1787709497206704, "#3c19f0" ], [ 0.2681564245810056, "#6b1cfb" ], [ 0.3575418994413408, "#981cfd" ], [ 0.44692737430167595, "#bf1cfd" ], [ 0.5363128491620112, "#dd2bfd" ], [ 0.6256983240223464, "#f246fe" ], [ 0.7150837988826816, "#fc67fd" ], [ 0.8044692737430168, "#fe88fc" ], [ 0.8938547486033519, "#fea5fd" ], [ 0.9832402234636871, "#febefe" ], [ 1, "#fec3fe" ] ], "sequentialminus": [ [ 0, "#0508b8" ], [ 0.0893854748603352, "#1910d8" ], [ 0.1787709497206704, "#3c19f0" ], [ 0.2681564245810056, "#6b1cfb" ], [ 0.3575418994413408, "#981cfd" ], [ 0.44692737430167595, "#bf1cfd" ], [ 0.5363128491620112, "#dd2bfd" ], [ 0.6256983240223464, "#f246fe" ], [ 0.7150837988826816, "#fc67fd" ], [ 0.8044692737430168, "#fe88fc" ], [ 0.8938547486033519, "#fea5fd" ], [ 0.9832402234636871, "#febefe" ], [ 1, "#fec3fe" ] ] }, "plot_bgcolor": "white", "paper_bgcolor": "white", "shapedefaults": { "line": { "width": 0 }, "opacity": 0.4, "fillcolor": "#506784" }, "annotationdefaults": { "arrowhead": 0, "arrowcolor": "#506784", "arrowwidth": 1 } }, "themeRef": "PLOTLY_WHITE" } } }, "height": null, "width": null, "user": { "profile_url": "https://chart-studio.plotly.com/~genoshistoria2", "avatar_url": "https://storage.googleapis.com/plotly-prod-profiles/65.jpg", "background_url": "https://storage.googleapis.com/plotly-prod-profiles/bg-12.jpg", "bio": "", "nickname": "", "website": "", "stream_tokens": null, "feature_set_id": null, "csrf_token": null, "date_joined": "2024-02-03 04:01:41", "mapbox_access_tokens": null, "has_password": null, "username": "genoshistoria2", "email": null, "is_active": null, "readonly": null, "is_dash_creator": null, "dash_created_count": null, "is_chart_creator": null, "charts_created_count": null } }, { "creation_time": "2024-04-03T23:57:44.502892Z", "comments": { "results": [], "count": 0 }, "parented": true, "embed_url": "https://chart-studio.plotly.com/~Hugo86/7.embed", "fid": "Hugo86:7", "filename": "Plot 7", "filetype": "plot", "img_url": "https://storage.googleapis.com/plotly-prod-images/Hugo86/7/9_7HT4JBN2JNJO3BUH1T6A1I0T7B3UBY.png", "image_urls": { "default": "https://storage.googleapis.com/plotly-prod-images/Hugo86/7/2_CPAI1KOMHVFSPZE7USQPZITI25DEEL.png", "block-thumb": "https://storage.googleapis.com/plotly-prod-images/Hugo86/7/8_CTX4EBXEBM0DY8DPL8JZDM0X9Z1GTR.png", "list-thumb": "https://storage.googleapis.com/plotly-prod-images/Hugo86/7/9_7HT4JBN2JNJO3BUH1T6A1I0T7B3UBY.png" }, "api_urls": { "files": "https://api.plotly.com/v2/files/Hugo86:7", "plots": "https://api.plotly.com/v2/plots/Hugo86:7", "parent": "https://api.plotly.com/v2/folders/home?user=Hugo86" }, "owner": "Hugo86", "parent": -1, "preview": "", "referencers": [], "references": [], "title": "", "views": 2, "web_url": "https://chart-studio.plotly.com/~Hugo86/7/", "world_readable": true, "date_modified": "2024-04-04T00:03:06.689Z", "stars": { "results": [], "count": 0 }, "collaborators": { "results": [], "count": 0 }, "subfolder_count": null, "refresh_interval": null, "organize_view_url": "https://chart-studio.plotly.com/~Hugo86/7/", "current_user_permission": "read", "is_theme": null, "is_template": false, "autosize": true, "caption": "", "figure": { "data": [ { "box": { "visible": true }, "line": { "color": "#8dd3c7", "fillcolor": "rgba(255,127,14,1)" }, "meta": { "columnNames": { "x": "data.2.x", "y": "data.2.y" } }, "name": "Amphibians", "side": "negative", "type": "violin", "xsrc": "Hugo86:6:8563a6", "ysrc": "Hugo86:6:027419", "frame": null, "xaxis": "x", "yaxis": "y", "jitter": 0.15, "marker": { "line": { "color": "#8dd3c7", "width": 1 }, "size": 4, "symbol": "circle" }, "points": "outliers", "hoveron": "points+kde", "meanline": { "visible": true }, "pointpos": -1.4, "spanmode": "soft", "scalemode": "count", "scalegroup": "M", "showlegend": true, "legendgroup": "M" }, { "box": { "visible": true }, "line": { "color": "#bebada", "fillcolor": "rgba(44,160,44,1)" }, "meta": { "columnNames": { "x": "data.3.x", "y": "data.3.y" } }, "name": "Vertebrates (non-amphibians)", "side": "positive", "type": "violin", "xsrc": "Hugo86:6:c23b7d", "ysrc": "Hugo86:6:c11655", "frame": null, "xaxis": "x", "yaxis": "y", "jitter": 0.15, "marker": { "line": { "color": "#bebada", "width": 1 }, "size": 4, "symbol": "circle" }, "points": "outliers", "hoveron": "points+kde", "meanline": { "visible": true }, "pointpos": 1.4, "scalemode": "count", "scalegroup": "F", "showlegend": true, "legendgroup": "F" } ], "frames": [], "layout": { "font": { "color": "rgb(0, 0, 0)", "family": "Arial" }, "title": { "font": { "size": 16, "color": "rgb(0, 0, 0)" }, "text": "<br>" }, "xaxis": { "type": "category", "range": [ -0.8816810988354732, 0.8816810988354732 ], "ticks": "", "title": { "font": { "color": "rgb(0, 0, 0)", "family": "Arial" }, "text": "<br>" }, "domain": [ 0, 0.25 ], "mirror": false, "showgrid": false, "showline": true, "tickfont": { "size": 14 }, "zeroline": false, "autorange": true, "linecolor": "rgb(0, 0, 0)", "showspikes": false, "rangeslider": { "range": [ -0.6825918184532698, 0.6825918184532698 ], "yaxis": {}, "visible": false, "autorange": true }, "showticklabels": true }, "yaxis": { "type": "linear", "range": [ 0, 160 ], "ticks": "outside", "title": { "font": { "size": 14, "color": "rgb(0, 0, 0)", "family": "Arial" }, "text": "Residues (amino acids)" }, "domain": [ 0, 1 ], "mirror": false, "ticklen": 5, "showgrid": false, "showline": true, "tickfont": { "size": 12 }, "tickmode": "auto", "zeroline": false, "autorange": false, "linecolor": "rgb(0, 0, 0)", "linewidth": 1, "tickcolor": "rgb(0, 0, 0)", "tickwidth": 1, "automargin": false, "showspikes": false }, "legend": { "x": 0.3, "y": 1, "font": { "size": 12, "color": "rgb(0, 0, 0)", "family": "Arial" }, "title": { "font": { "size": 14, "color": "rgb(0, 0, 0)", "family": "Arial" }, "text": "<b>Mature Cathelicidins</b>" }, "valign": "middle", "yanchor": "top", "borderwidth": 0, "orientation": "v", "tracegroupgap": 0 }, "margin": { "b": 40, "l": 60, "r": 10, "t": 25 }, "autosize": true, "hovermode": "closest", "violingap": 0, "hoverlabel": { "font": { "size": 14 } }, "showlegend": true, "violinmode": "overlay", "violingroupgap": 0 } }, "height": null, "width": null, "user": { "profile_url": "https://chart-studio.plotly.com/~Hugo86", "avatar_url": "https://storage.googleapis.com/plotly-prod-profiles/25.jpg", "background_url": "https://storage.googleapis.com/plotly-prod-profiles/bg-1.jpg", "bio": "", "nickname": "", "website": "", "stream_tokens": null, "feature_set_id": null, "csrf_token": null, "date_joined": "2023-11-08 16:15:12", "mapbox_access_tokens": null, "has_password": null, "username": "Hugo86", "email": null, "is_active": null, "readonly": null, "is_dash_creator": null, "dash_created_count": null, "is_chart_creator": null, "charts_created_count": null } } ] }
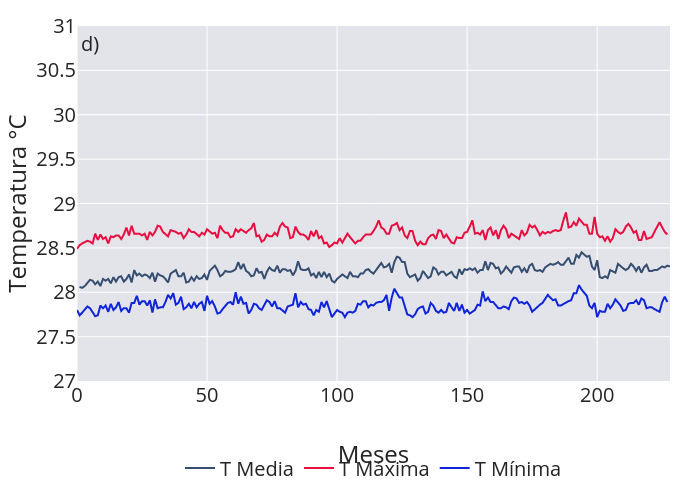