Plots List
Plots
This endpoint handles manipulation of Plotly plot files.
Reference
Authorization
Any user with or without a Plotly account may view public plots. For private plots, see authentication.
Actions
list
Listing all public plots can be done via a GET request to this endpoint.
By default, plots will be listed in order of date created. The order_by
query parameter is accepted at this endpoint. Currently, only ordering by
views is supported. It is possible to filter the plots by quality
with min_quality or max_quality as query parameter.
Example:
// GET https://api.plotly.com/v2/plots/ ---> 200

// GET https://api.plotly.com/v2/plots/?order_by=-views ---> 200

// GET https://api.plotly.com/v2/plots/?min_quality=5 ---> 200

// GET https://api.plotly.com/v2/plots/?max_quality=5 ---> 200
feed
Listing all handpicked feed plots can be done via a GET request to this endpoint. By default, plots will be listed in a random order.
Example:
// GET https://api.plotly.com/v2/plots/feed ---> 200
create
You can create new plot resources here. The only required field is 'figure'. Currently, the figure is restricted to only contain references to grid data. That is, this will fail if raw data arrays are passed in. To create and manipulate underlying grids for plots, see the grids endpoint.
Example:
// This fails because a figure field is required.
// POST https://api.plotly.com/v2/plots ---> 400 Bad Request
{}

// This fails because the figure has raw data
//POST https://api.plotly.com/v2/plots ---> 400 Bad Request
{
    "figure": {"data": [{"y": ['this', 'is', 'raw', 'data']}]}
}

// This succeeds because the figure has src keys, not raw data.
//POST https://api.plotly.com/v2/plots ---> 200 OK
{
    "figure": {"data": [{"ysrc": "sven:88:u8nd62"}]}
}
When creating a grid, you can optionally specify a source_fid to specify where a plot has come from:
- source_fid: the fid of a plot that was copied (and presumably edited) to produce this one
detail
There is a lot of meta information stored about plot files including filename, title, share_url, and content_url to name a few.
This information can only be reached with a GET to this endpoint.
Example:
// GET https://api.plotly.com/v2/plots/iheartgraphs:90
content
The contents of a plot can be downloaded via the content resource. The plot
content contains referenced grid/column data by default. If you wish to
return the raw grid/column data, the inline_data=true query must be included
in the request url. The Content-Type header will be appropriately set for the
response body.
Alternatively, you can set ?map_data=unreadable to append a mapping of
sources to data that belongs to grids which are unreadable for the
requestor. This is useful when you have read access to another users plot,
but that plot contains grid references which you don't have access to.
Examples:
// Returns referenced grid/column data
// GET https://api.plotly.com/v2/plots/iheartgraphs:90/content ---> 200 OK

// Returns full grid/column data
// GET https://api.plotly.com/v2/plots/iheartgraphs:90/content?inline_data=true ---> 200 OK

// Returns full grid/column data when requestor doesn't have permission
// to read the referenced grid.
// GET https://api.plotly.com/v2/plots/iheartgraphs:90/content?map_data=unreadable ---> 200 OK
GET /v2/plots?cursor=cj0xJnA9MjAyNC0wNC0wMysyMiUzQTM4JTNBNDMuMzcwNzMwJTJCMDAlM0EwMA%3D%3D&format=api
{ "next": "https://api.plot.ly/v2/plots?cursor=cD0yMDI0LTA0LTAzKzIyJTNBNDAlM0ExOC4zODU2ODklMkIwMCUzQTAw&format=api", "previous": "https://api.plot.ly/v2/plots?cursor=cj0xJnA9MjAyNC0wNC0wMysyMyUzQTQ1JTNBMTEuMDMyMTc1JTJCMDAlM0EwMA%3D%3D&format=api", "results": [ { "creation_time": "2024-04-03T23:45:11.032175Z", "comments": { "results": [], "count": 0 }, "parented": true, "embed_url": "https://chart-studio.plotly.com/~DORITOS12/54.embed", "fid": "DORITOS12:54", "filename": "IRA ST HRE", "filetype": "plot", "img_url": "https://storage.googleapis.com/plotly-prod-images/DORITOS12/54/9_Z9PJAT1MF93LU4UYHAOOQPPSK4PTC9.png", "image_urls": { "default": "https://storage.googleapis.com/plotly-prod-images/DORITOS12/54/2_JB1FU9NJQXN8ASYNLSLBVC4VIUG956.png", "block-thumb": "https://storage.googleapis.com/plotly-prod-images/DORITOS12/54/8_I1AE5KQJN7F1AJWDDYJSP6SG128GIE.png", "list-thumb": "https://storage.googleapis.com/plotly-prod-images/DORITOS12/54/9_Z9PJAT1MF93LU4UYHAOOQPPSK4PTC9.png" }, "api_urls": { "files": "https://api.plotly.com/v2/files/DORITOS12:54", "plots": "https://api.plotly.com/v2/plots/DORITOS12:54", "parent": "https://api.plotly.com/v2/folders/home?user=DORITOS12" }, "owner": "DORITOS12", "parent": -1, "preview": "", "referencers": [], "references": [], "title": "", "views": 1, "web_url": "https://chart-studio.plotly.com/~DORITOS12/54/", "world_readable": true, "date_modified": "2024-04-03T23:59:50.825Z", "stars": { "results": [], "count": 0 }, "collaborators": { "results": [], "count": 0 }, "subfolder_count": null, "refresh_interval": null, "organize_view_url": "https://chart-studio.plotly.com/~DORITOS12/54/", "current_user_permission": "read", "is_theme": null, "is_template": false, "autosize": true, "caption": "", "figure": { "data": [ { "meta": { "columnNames": { "x": "month", "y": "Humedad relativa" } }, "mode": "lines", "type": "scatter", "xsrc": "DORITOS12:53:0343d4", "ysrc": "DORITOS12:53:b6ceb8" } ], "frames": [], "layout": { "title": { "text": "Serie Temporal de Humedad Relativa" }, "xaxis": { "type": "linear", "range": [ 1, 228 ], "title": { "text": "Meses" }, "autorange": true }, "yaxis": { "type": "linear", "range": [ 57.76611111111111, 75.44388888888889 ], "title": { "text": "%" }, "autorange": true }, "margin": { "b": 37, "l": 100, "r": 100, "t": 70 }, "autosize": true, "template": { "data": { "bar": [ { "type": "bar", "marker": { "colorbar": { "ticks": "outside", "ticklen": 8, "tickcolor": "rgb(36,36,36)", "tickwidth": 2, "outlinewidth": 0 } } } ], "table": [ { "type": "table", "cells": { "fill": { "color": "rgb(231,231,240)" }, "line": { "color": "white" } }, "header": { "fill": { "color": "rgb(183,183,191)" }, "line": { "color": "white" } } } ], "carpet": [ { "type": "carpet", "aaxis": { "gridcolor": "white", "linecolor": "white", "endlinecolor": "rgb(36,36,36)", "minorgridcolor": "white", "startlinecolor": "rgb(36,36,36)" }, "baxis": { "gridcolor": "white", "linecolor": "white", "endlinecolor": "rgb(36,36,36)", "minorgridcolor": "white", "startlinecolor": "rgb(36,36,36)" } } ], "mesh3d": [ { "type": "mesh3d", "colorbar": { "ticks": "outside", "ticklen": 8, "tickcolor": "rgb(36,36,36)", "tickwidth": 2, "outlinewidth": 0 } } ], "contour": [ { "type": "contour", "colorbar": { "ticks": "outside", "ticklen": 8, "tickcolor": "rgb(36,36,36)", "tickwidth": 2, "outlinewidth": 0 }, "autocolorscale": true } ], "heatmap": [ { "type": "heatmap", "colorbar": { "ticks": "outside", "ticklen": 8, "tickcolor": "rgb(36,36,36)", "tickwidth": 2, "outlinewidth": 0 }, "autocolorscale": true } ], "scatter": [ { "type": "scatter", "marker": { "colorbar": { "ticks": "outside", "ticklen": 8, "tickcolor": "rgb(36,36,36)", "tickwidth": 2, "outlinewidth": 0 } } } ], "surface": [ { "type": "surface", "colorbar": { "ticks": "outside", "ticklen": 8, "tickcolor": "rgb(36,36,36)", "tickwidth": 2, "outlinewidth": 0 } } ], "heatmapgl": [ { "type": "heatmapgl", "colorbar": { "ticks": "outside", "ticklen": 8, "tickcolor": "rgb(36,36,36)", "tickwidth": 2, "outlinewidth": 0 } } ], "histogram": [ { "type": "histogram", "marker": { "colorbar": { "ticks": "outside", "ticklen": 8, "tickcolor": "rgb(36,36,36)", "tickwidth": 2, "outlinewidth": 0 } } } ], "parcoords": [ { "line": { "colorbar": { "ticks": "outside", "ticklen": 8, "tickcolor": "rgb(36,36,36)", "tickwidth": 2, "outlinewidth": 0 } }, "type": "parcoords" } ], "scatter3d": [ { "type": "scatter3d", "marker": { "colorbar": { "ticks": "outside", "ticklen": 8, "tickcolor": "rgb(36,36,36)", "tickwidth": 2, "outlinewidth": 0 } } } ], "scattergl": [ { "type": "scattergl", "marker": { "colorbar": { "ticks": "outside", "ticklen": 8, "tickcolor": "rgb(36,36,36)", "tickwidth": 2, "outlinewidth": 0 } } } ], "choropleth": [ { "type": "choropleth", "colorbar": { "ticks": "outside", "ticklen": 8, "tickcolor": "rgb(36,36,36)", "tickwidth": 2, "outlinewidth": 0 } } ], "scattergeo": [ { "type": "scattergeo", "marker": { "colorbar": { "ticks": "outside", "ticklen": 8, "tickcolor": "rgb(36,36,36)", "tickwidth": 2, "outlinewidth": 0 } } } ], "histogram2d": [ { "type": "histogram2d", "colorbar": { "ticks": "outside", "ticklen": 8, "tickcolor": "rgb(36,36,36)", "tickwidth": 2, "outlinewidth": 0 }, "autocolorscale": true } ], "scatterpolar": [ { "type": "scatterpolar", "marker": { "colorbar": { "ticks": "outside", "ticklen": 8, "tickcolor": "rgb(36,36,36)", "tickwidth": 2, "outlinewidth": 0 } } } ], "contourcarpet": [ { "type": "contourcarpet", "colorbar": { "ticks": "outside", "ticklen": 8, "tickcolor": "rgb(36,36,36)", "tickwidth": 2, "outlinewidth": 0 } } ], "scattercarpet": [ { "type": "scattercarpet", "marker": { "colorbar": { "ticks": "outside", "ticklen": 8, "tickcolor": "rgb(36,36,36)", "tickwidth": 2, "outlinewidth": 0 } } } ], "scattermapbox": [ { "type": "scattermapbox", "marker": { "colorbar": { "ticks": "outside", "ticklen": 8, "tickcolor": "rgb(36,36,36)", "tickwidth": 2, "outlinewidth": 0 } } } ], "scatterpolargl": [ { "type": "scatterpolargl", "marker": { "colorbar": { "ticks": "outside", "ticklen": 8, "tickcolor": "rgb(36,36,36)", "tickwidth": 2, "outlinewidth": 0 } } } ], "scatterternary": [ { "type": "scatterternary", "marker": { "colorbar": { "ticks": "outside", "ticklen": 8, "tickcolor": "rgb(36,36,36)", "tickwidth": 2, "outlinewidth": 0 } } } ], "histogram2dcontour": [ { "type": "histogram2dcontour", "colorbar": { "ticks": "outside", "ticklen": 8, "tickcolor": "rgb(36,36,36)", "tickwidth": 2, "outlinewidth": 0 }, "autocolorscale": true } ] }, "layout": { "geo": { "bgcolor": "white", "showland": true, "lakecolor": "white", "landcolor": "rgb(234,234,242)", "showlakes": true, "subunitcolor": "white" }, "font": { "color": "rgb(36,36,36)" }, "polar": { "bgcolor": "rgb(234,234,242)", "radialaxis": { "ticks": "", "showgrid": true, "gridcolor": "white", "linecolor": "white" }, "angularaxis": { "ticks": "", "showgrid": true, "gridcolor": "white", "linecolor": "white" } }, "scene": { "xaxis": { "ticks": "", "showgrid": true, "gridcolor": "white", "gridwidth": 2, "linecolor": "white", "zerolinecolor": "white", "showbackground": true, "backgroundcolor": "rgb(234,234,242)" }, "yaxis": { "ticks": "", "showgrid": true, "gridcolor": "white", "gridwidth": 2, "linecolor": "white", "zerolinecolor": "white", "showbackground": true, "backgroundcolor": "rgb(234,234,242)" }, "zaxis": { "ticks": "", "showgrid": true, "gridcolor": "white", "gridwidth": 2, "linecolor": "white", "zerolinecolor": "white", "showbackground": true, "backgroundcolor": "rgb(234,234,242)" } }, "xaxis": { "ticks": "", "showgrid": true, "gridcolor": "white", "linecolor": "white", "automargin": true, "zerolinecolor": "white" }, "yaxis": { "ticks": "", "showgrid": true, "gridcolor": "white", "linecolor": "white", "automargin": true, "zerolinecolor": "white" }, "ternary": { "aaxis": { "ticks": "", "showgrid": true, "gridcolor": "white", "linecolor": "white" }, "baxis": { "ticks": "", "showgrid": true, "gridcolor": "white", "linecolor": "white" }, "caxis": { "ticks": "", "showgrid": true, "gridcolor": "white", "linecolor": "white" }, "bgcolor": "rgb(234,234,242)" }, "colorway": [ "rgb(76,114,176)", "rgb(221,132,82)", "rgb(85,168,104)", "rgb(196,78,82)", "rgb(129,114,179)", "rgb(147,120,96)", "rgb(218,139,195)", "rgb(140,140,140)", "rgb(204,185,116)", "rgb(100,181,205)" ], "hovermode": "closest", "colorscale": { "diverging": [ [ 0, "#67001f" ], [ 0.1, "#b2182b" ], [ 0.2, "#d6604d" ], [ 0.3, "#f4a582" ], [ 0.4, "#fddbc7" ], [ 0.5, "#f7f7f7" ], [ 0.6, "#d1e5f0" ], [ 0.7, "#92c5de" ], [ 0.8, "#4393c3" ], [ 0.9, "#2166ac" ], [ 1, "#053061" ] ], "sequential": [ [ 0, "rgb(2,4,25)" ], [ 0.06274509803921569, "rgb(24,15,41)" ], [ 0.12549019607843137, "rgb(47,23,57)" ], [ 0.18823529411764706, "rgb(71,28,72)" ], [ 0.25098039215686274, "rgb(97,30,82)" ], [ 0.3137254901960784, "rgb(123,30,89)" ], [ 0.3764705882352941, "rgb(150,27,91)" ], [ 0.4392156862745098, "rgb(177,22,88)" ], [ 0.5019607843137255, "rgb(203,26,79)" ], [ 0.5647058823529412, "rgb(223,47,67)" ], [ 0.6274509803921569, "rgb(236,76,61)" ], [ 0.6901960784313725, "rgb(242,107,73)" ], [ 0.7529411764705882, "rgb(244,135,95)" ], [ 0.8156862745098039, "rgb(245,162,122)" ], [ 0.8784313725490196, "rgb(246,188,153)" ], [ 0.9411764705882353, "rgb(247,212,187)" ], [ 1, "rgb(250,234,220)" ] ], "sequentialminus": [ [ 0, "rgb(2,4,25)" ], [ 0.06274509803921569, "rgb(24,15,41)" ], [ 0.12549019607843137, "rgb(47,23,57)" ], [ 0.18823529411764706, "rgb(71,28,72)" ], [ 0.25098039215686274, "rgb(97,30,82)" ], [ 0.3137254901960784, "rgb(123,30,89)" ], [ 0.3764705882352941, "rgb(150,27,91)" ], [ 0.4392156862745098, "rgb(177,22,88)" ], [ 0.5019607843137255, "rgb(203,26,79)" ], [ 0.5647058823529412, "rgb(223,47,67)" ], [ 0.6274509803921569, "rgb(236,76,61)" ], [ 0.6901960784313725, "rgb(242,107,73)" ], [ 0.7529411764705882, "rgb(244,135,95)" ], [ 0.8156862745098039, "rgb(245,162,122)" ], [ 0.8784313725490196, "rgb(246,188,153)" ], [ 0.9411764705882353, "rgb(247,212,187)" ], [ 1, "rgb(250,234,220)" ] ] }, "plot_bgcolor": "rgb(234,234,242)", "paper_bgcolor": "white", "shapedefaults": { "line": { "width": 0 }, "opacity": 0.5, "fillcolor": "rgb(67,103,167)" }, "annotationdefaults": { "arrowcolor": "rgb(67,103,167)" } }, "themeRef": "SEABORN" } } }, "height": null, "width": null, "user": { "profile_url": "https://chart-studio.plotly.com/~DORITOS12", "avatar_url": "https://storage.googleapis.com/plotly-prod-profiles/50.jpg", "background_url": "https://storage.googleapis.com/plotly-prod-profiles/bg-2.jpg", "bio": "", "nickname": "", "website": "", "stream_tokens": null, "feature_set_id": null, "csrf_token": null, "date_joined": "2024-02-24 22:37:07", "mapbox_access_tokens": null, "has_password": null, "username": "DORITOS12", "email": null, "is_active": null, "readonly": null, "is_dash_creator": null, "dash_created_count": null, "is_chart_creator": null, "charts_created_count": null } }, { "creation_time": "2024-04-03T23:13:05.584365Z", "comments": { "results": [], "count": 0 }, "parented": true, "embed_url": "https://chart-studio.plotly.com/~DORITOS12/52.embed", "fid": "DORITOS12:52", "filename": "URB ST NDVI", "filetype": "plot", "img_url": "https://storage.googleapis.com/plotly-prod-images/DORITOS12/52/9_68F4MFTZOWXI4EAX4FYLVHWKFNWAEE.png", "image_urls": { "default": "https://storage.googleapis.com/plotly-prod-images/DORITOS12/52/2_GXULMZ7RDWGT86BUCTI6QRRM5VZ2HU.png", "block-thumb": "https://storage.googleapis.com/plotly-prod-images/DORITOS12/52/8_PP65UDW9QIJM8FXHDRJFO936UOLQ5O.png", "list-thumb": "https://storage.googleapis.com/plotly-prod-images/DORITOS12/52/9_68F4MFTZOWXI4EAX4FYLVHWKFNWAEE.png" }, "api_urls": { "files": "https://api.plotly.com/v2/files/DORITOS12:52", "plots": "https://api.plotly.com/v2/plots/DORITOS12:52", "parent": "https://api.plotly.com/v2/folders/home?user=DORITOS12" }, "owner": "DORITOS12", "parent": -1, "preview": "", "referencers": [], "references": [], "title": "", "views": 1, "web_url": "https://chart-studio.plotly.com/~DORITOS12/52/", "world_readable": true, "date_modified": "2024-04-04T00:04:38.851Z", "stars": { "results": [], "count": 0 }, "collaborators": { "results": [], "count": 0 }, "subfolder_count": null, "refresh_interval": null, "organize_view_url": "https://chart-studio.plotly.com/~DORITOS12/52/", "current_user_permission": "read", "is_theme": null, "is_template": false, "autosize": true, "caption": "", "figure": { "data": [ { "line": { "color": "rgb(55, 110, 45)" }, "meta": { "columnNames": { "x": "month", "y": "NDVI" } }, "mode": "lines", "name": "Albedo NIR", "type": "scatter", "xsrc": "DORITOS12:51:8b2352", "ysrc": "DORITOS12:51:777c22" } ], "frames": [], "layout": { "font": { "color": "rgb(28, 27, 27)" }, "title": { "font": { "size": 17 }, "text": "" }, "xaxis": { "type": "linear", "range": [ 1, 228 ], "title": { "text": "Meses" }, "domain": [ 0.125, 0.875 ], "autorange": true }, "yaxis": { "type": "linear", "range": [ 0.08485000000000001, 0.8978499999999999 ], "title": { "text": "NDVI" }, "domain": [ 0, 1 ], "autorange": true }, "legend": { "x": 0.8776051779935277, "y": 0.6766467065868264 }, "margin": { "b": 39, "l": 60, "r": 68, "t": 40 }, "autosize": true, "dragmode": "pan", "template": { "data": { "bar": [ { "type": "bar", "marker": { "colorbar": { "ticks": "outside", "ticklen": 8, "tickcolor": "rgb(36,36,36)", "tickwidth": 2, "outlinewidth": 0 } } } ], "table": [ { "type": "table", "cells": { "fill": { "color": "rgb(231,231,240)" }, "line": { "color": "white" } }, "header": { "fill": { "color": "rgb(183,183,191)" }, "line": { "color": "white" } } } ], "carpet": [ { "type": "carpet", "aaxis": { "gridcolor": "white", "linecolor": "white", "endlinecolor": "rgb(36,36,36)", "minorgridcolor": "white", "startlinecolor": "rgb(36,36,36)" }, "baxis": { "gridcolor": "white", "linecolor": "white", "endlinecolor": "rgb(36,36,36)", "minorgridcolor": "white", "startlinecolor": "rgb(36,36,36)" } } ], "mesh3d": [ { "type": "mesh3d", "colorbar": { "ticks": "outside", "ticklen": 8, "tickcolor": "rgb(36,36,36)", "tickwidth": 2, "outlinewidth": 0 } } ], "contour": [ { "type": "contour", "colorbar": { "ticks": "outside", "ticklen": 8, "tickcolor": "rgb(36,36,36)", "tickwidth": 2, "outlinewidth": 0 }, "autocolorscale": true } ], "heatmap": [ { "type": "heatmap", "colorbar": { "ticks": "outside", "ticklen": 8, "tickcolor": "rgb(36,36,36)", "tickwidth": 2, "outlinewidth": 0 }, "autocolorscale": true } ], "scatter": [ { "type": "scatter", "marker": { "colorbar": { "ticks": "outside", "ticklen": 8, "tickcolor": "rgb(36,36,36)", "tickwidth": 2, "outlinewidth": 0 } } } ], "surface": [ { "type": "surface", "colorbar": { "ticks": "outside", "ticklen": 8, "tickcolor": "rgb(36,36,36)", "tickwidth": 2, "outlinewidth": 0 } } ], "heatmapgl": [ { "type": "heatmapgl", "colorbar": { "ticks": "outside", "ticklen": 8, "tickcolor": "rgb(36,36,36)", "tickwidth": 2, "outlinewidth": 0 } } ], "histogram": [ { "type": "histogram", "marker": { "colorbar": { "ticks": "outside", "ticklen": 8, "tickcolor": "rgb(36,36,36)", "tickwidth": 2, "outlinewidth": 0 } } } ], "parcoords": [ { "line": { "colorbar": { "ticks": "outside", "ticklen": 8, "tickcolor": "rgb(36,36,36)", "tickwidth": 2, "outlinewidth": 0 } }, "type": "parcoords" } ], "scatter3d": [ { "type": "scatter3d", "marker": { "colorbar": { "ticks": "outside", "ticklen": 8, "tickcolor": "rgb(36,36,36)", "tickwidth": 2, "outlinewidth": 0 } } } ], "scattergl": [ { "type": "scattergl", "marker": { "colorbar": { "ticks": "outside", "ticklen": 8, "tickcolor": "rgb(36,36,36)", "tickwidth": 2, "outlinewidth": 0 } } } ], "choropleth": [ { "type": "choropleth", "colorbar": { "ticks": "outside", "ticklen": 8, "tickcolor": "rgb(36,36,36)", "tickwidth": 2, "outlinewidth": 0 } } ], "scattergeo": [ { "type": "scattergeo", "marker": { "colorbar": { "ticks": "outside", "ticklen": 8, "tickcolor": "rgb(36,36,36)", "tickwidth": 2, "outlinewidth": 0 } } } ], "histogram2d": [ { "type": "histogram2d", "colorbar": { "ticks": "outside", "ticklen": 8, "tickcolor": "rgb(36,36,36)", "tickwidth": 2, "outlinewidth": 0 }, "autocolorscale": true } ], "scatterpolar": [ { "type": "scatterpolar", "marker": { "colorbar": { "ticks": "outside", "ticklen": 8, "tickcolor": "rgb(36,36,36)", "tickwidth": 2, "outlinewidth": 0 } } } ], "contourcarpet": [ { "type": "contourcarpet", "colorbar": { "ticks": "outside", "ticklen": 8, "tickcolor": "rgb(36,36,36)", "tickwidth": 2, "outlinewidth": 0 } } ], "scattercarpet": [ { "type": "scattercarpet", "marker": { "colorbar": { "ticks": "outside", "ticklen": 8, "tickcolor": "rgb(36,36,36)", "tickwidth": 2, "outlinewidth": 0 } } } ], "scattermapbox": [ { "type": "scattermapbox", "marker": { "colorbar": { "ticks": "outside", "ticklen": 8, "tickcolor": "rgb(36,36,36)", "tickwidth": 2, "outlinewidth": 0 } } } ], "scatterpolargl": [ { "type": "scatterpolargl", "marker": { "colorbar": { "ticks": "outside", "ticklen": 8, "tickcolor": "rgb(36,36,36)", "tickwidth": 2, "outlinewidth": 0 } } } ], "scatterternary": [ { "type": "scatterternary", "marker": { "colorbar": { "ticks": "outside", "ticklen": 8, "tickcolor": "rgb(36,36,36)", "tickwidth": 2, "outlinewidth": 0 } } } ], "histogram2dcontour": [ { "type": "histogram2dcontour", "colorbar": { "ticks": "outside", "ticklen": 8, "tickcolor": "rgb(36,36,36)", "tickwidth": 2, "outlinewidth": 0 }, "autocolorscale": true } ] }, "layout": { "geo": { "bgcolor": "white", "showland": true, "lakecolor": "white", "landcolor": "rgb(234,234,242)", "showlakes": true, "subunitcolor": "white" }, "font": { "color": "rgb(36,36,36)" }, "polar": { "bgcolor": "rgb(234,234,242)", "radialaxis": { "ticks": "", "showgrid": true, "gridcolor": "white", "linecolor": "white" }, "angularaxis": { "ticks": "", "showgrid": true, "gridcolor": "white", "linecolor": "white" } }, "scene": { "xaxis": { "ticks": "", "showgrid": true, "gridcolor": "white", "gridwidth": 2, "linecolor": "white", "zerolinecolor": "white", "showbackground": true, "backgroundcolor": "rgb(234,234,242)" }, "yaxis": { "ticks": "", "showgrid": true, "gridcolor": "white", "gridwidth": 2, "linecolor": "white", "zerolinecolor": "white", "showbackground": true, "backgroundcolor": "rgb(234,234,242)" }, "zaxis": { "ticks": "", "showgrid": true, "gridcolor": "white", "gridwidth": 2, "linecolor": "white", "zerolinecolor": "white", "showbackground": true, "backgroundcolor": "rgb(234,234,242)" } }, "xaxis": { "ticks": "", "showgrid": true, "gridcolor": "white", "linecolor": "white", "automargin": true, "zerolinecolor": "white" }, "yaxis": { "ticks": "", "showgrid": true, "gridcolor": "white", "linecolor": "white", "automargin": true, "zerolinecolor": "white" }, "ternary": { "aaxis": { "ticks": "", "showgrid": true, "gridcolor": "white", "linecolor": "white" }, "baxis": { "ticks": "", "showgrid": true, "gridcolor": "white", "linecolor": "white" }, "caxis": { "ticks": "", "showgrid": true, "gridcolor": "white", "linecolor": "white" }, "bgcolor": "rgb(234,234,242)" }, "colorway": [ "rgb(76,114,176)", "rgb(221,132,82)", "rgb(85,168,104)", "rgb(196,78,82)", "rgb(129,114,179)", "rgb(147,120,96)", "rgb(218,139,195)", "rgb(140,140,140)", "rgb(204,185,116)", "rgb(100,181,205)" ], "hovermode": "closest", "colorscale": { "diverging": [ [ 0, "#67001f" ], [ 0.1, "#b2182b" ], [ 0.2, "#d6604d" ], [ 0.3, "#f4a582" ], [ 0.4, "#fddbc7" ], [ 0.5, "#f7f7f7" ], [ 0.6, "#d1e5f0" ], [ 0.7, "#92c5de" ], [ 0.8, "#4393c3" ], [ 0.9, "#2166ac" ], [ 1, "#053061" ] ], "sequential": [ [ 0, "rgb(2,4,25)" ], [ 0.06274509803921569, "rgb(24,15,41)" ], [ 0.12549019607843137, "rgb(47,23,57)" ], [ 0.18823529411764706, "rgb(71,28,72)" ], [ 0.25098039215686274, "rgb(97,30,82)" ], [ 0.3137254901960784, "rgb(123,30,89)" ], [ 0.3764705882352941, "rgb(150,27,91)" ], [ 0.4392156862745098, "rgb(177,22,88)" ], [ 0.5019607843137255, "rgb(203,26,79)" ], [ 0.5647058823529412, "rgb(223,47,67)" ], [ 0.6274509803921569, "rgb(236,76,61)" ], [ 0.6901960784313725, "rgb(242,107,73)" ], [ 0.7529411764705882, "rgb(244,135,95)" ], [ 0.8156862745098039, "rgb(245,162,122)" ], [ 0.8784313725490196, "rgb(246,188,153)" ], [ 0.9411764705882353, "rgb(247,212,187)" ], [ 1, "rgb(250,234,220)" ] ], "sequentialminus": [ [ 0, "rgb(2,4,25)" ], [ 0.06274509803921569, "rgb(24,15,41)" ], [ 0.12549019607843137, "rgb(47,23,57)" ], [ 0.18823529411764706, "rgb(71,28,72)" ], [ 0.25098039215686274, "rgb(97,30,82)" ], [ 0.3137254901960784, "rgb(123,30,89)" ], [ 0.3764705882352941, "rgb(150,27,91)" ], [ 0.4392156862745098, "rgb(177,22,88)" ], [ 0.5019607843137255, "rgb(203,26,79)" ], [ 0.5647058823529412, "rgb(223,47,67)" ], [ 0.6274509803921569, "rgb(236,76,61)" ], [ 0.6901960784313725, "rgb(242,107,73)" ], [ 0.7529411764705882, "rgb(244,135,95)" ], [ 0.8156862745098039, "rgb(245,162,122)" ], [ 0.8784313725490196, "rgb(246,188,153)" ], [ 0.9411764705882353, "rgb(247,212,187)" ], [ 1, "rgb(250,234,220)" ] ] }, "plot_bgcolor": "rgb(234,234,242)", "paper_bgcolor": "white", "shapedefaults": { "line": { "width": 0 }, "opacity": 0.5, "fillcolor": "rgb(67,103,167)" }, "annotationdefaults": { "arrowcolor": "rgb(67,103,167)" } }, "themeRef": "SEABORN" }, "plot_bgcolor": "rgb(227, 227, 234)" } }, "height": null, "width": null, "user": { "profile_url": "https://chart-studio.plotly.com/~DORITOS12", "avatar_url": "https://storage.googleapis.com/plotly-prod-profiles/50.jpg", "background_url": "https://storage.googleapis.com/plotly-prod-profiles/bg-2.jpg", "bio": "", "nickname": "", "website": "", "stream_tokens": null, "feature_set_id": null, "csrf_token": null, "date_joined": "2024-02-24 22:37:07", "mapbox_access_tokens": null, "has_password": null, "username": "DORITOS12", "email": null, "is_active": null, "readonly": null, "is_dash_creator": null, "dash_created_count": null, "is_chart_creator": null, "charts_created_count": null } }, { "creation_time": "2024-04-03T23:06:32.262284Z", "comments": { "results": [], "count": 0 }, "parented": true, "embed_url": "https://chart-studio.plotly.com/~DORITOS12/50.embed", "fid": "DORITOS12:50", "filename": "URB ST Albedo", "filetype": "plot", "img_url": "https://storage.googleapis.com/plotly-prod-images/DORITOS12/50/9_TVWP7KAVIMU5O01WAOB8WLWEZ2XNV3.png", "image_urls": { "default": "https://storage.googleapis.com/plotly-prod-images/DORITOS12/50/2_TR6H6XC9FWZOQE26EMPV5I4S5T8YM1.png", "block-thumb": "https://storage.googleapis.com/plotly-prod-images/DORITOS12/50/8_1JHM8HRII00FLTUW93R4G5KRJ946OU.png", "list-thumb": "https://storage.googleapis.com/plotly-prod-images/DORITOS12/50/9_TVWP7KAVIMU5O01WAOB8WLWEZ2XNV3.png" }, "api_urls": { "files": "https://api.plotly.com/v2/files/DORITOS12:50", "plots": "https://api.plotly.com/v2/plots/DORITOS12:50", "parent": "https://api.plotly.com/v2/folders/home?user=DORITOS12" }, "owner": "DORITOS12", "parent": -1, "preview": "", "referencers": [], "references": [], "title": "", "views": 1, "web_url": "https://chart-studio.plotly.com/~DORITOS12/50/", "world_readable": true, "date_modified": "2024-04-04T00:15:33.639Z", "stars": { "results": [], "count": 0 }, "collaborators": { "results": [], "count": 0 }, "subfolder_count": null, "refresh_interval": null, "organize_view_url": "https://chart-studio.plotly.com/~DORITOS12/50/", "current_user_permission": "read", "is_theme": null, "is_template": false, "autosize": true, "caption": "", "figure": { "data": [ { "line": { "color": "rgb(96, 33, 118)", "width": 2 }, "meta": { "columnNames": { "x": "month", "y": "Albedo NIR" } }, "mode": "lines", "name": "Albedo NIR", "type": "scatter", "xsrc": "DORITOS12:49:8b2352", "ysrc": "DORITOS12:49:a2da09", "visible": true }, { "meta": { "columnNames": { "x": "", "y": "Albedo VIS" } }, "mode": "lines", "name": "Albedo VIS", "type": "scatter", "ysrc": "DORITOS12:49:4003d7", "visible": true, "stackgroup": null } ], "frames": [], "layout": { "title": { "font": { "size": 17 }, "text": "" }, "xaxis": { "type": "linear", "range": [ 0, 228 ], "title": { "text": "Meses" }, "domain": [ 0.125, 0.875 ], "autorange": true }, "yaxis": { "type": "linear", "range": [ 0.022027777777777775, 0.34947222222222224 ], "title": { "text": "Albedo" }, "domain": [ 0, 1 ], "autorange": true }, "legend": { "x": 0.13230850650293446, "y": 0.9032389597109393, "xanchor": "left", "yanchor": "middle", "traceorder": "reversed", "orientation": "h" }, "margin": { "b": 39, "l": 60, "r": 68, "t": 40 }, "autosize": true, "dragmode": "pan", "template": { "data": { "bar": [ { "type": "bar", "marker": { "colorbar": { "ticks": "outside", "ticklen": 8, "tickcolor": "rgb(36,36,36)", "tickwidth": 2, "outlinewidth": 0 } } } ], "table": [ { "type": "table", "cells": { "fill": { "color": "rgb(231,231,240)" }, "line": { "color": "white" } }, "header": { "fill": { "color": "rgb(183,183,191)" }, "line": { "color": "white" } } } ], "carpet": [ { "type": "carpet", "aaxis": { "gridcolor": "white", "linecolor": "white", "endlinecolor": "rgb(36,36,36)", "minorgridcolor": "white", "startlinecolor": "rgb(36,36,36)" }, "baxis": { "gridcolor": "white", "linecolor": "white", "endlinecolor": "rgb(36,36,36)", "minorgridcolor": "white", "startlinecolor": "rgb(36,36,36)" } } ], "mesh3d": [ { "type": "mesh3d", "colorbar": { "ticks": "outside", "ticklen": 8, "tickcolor": "rgb(36,36,36)", "tickwidth": 2, "outlinewidth": 0 } } ], "contour": [ { "type": "contour", "colorbar": { "ticks": "outside", "ticklen": 8, "tickcolor": "rgb(36,36,36)", "tickwidth": 2, "outlinewidth": 0 }, "autocolorscale": true } ], "heatmap": [ { "type": "heatmap", "colorbar": { "ticks": "outside", "ticklen": 8, "tickcolor": "rgb(36,36,36)", "tickwidth": 2, "outlinewidth": 0 }, "autocolorscale": true } ], "scatter": [ { "type": "scatter", "marker": { "colorbar": { "ticks": "outside", "ticklen": 8, "tickcolor": "rgb(36,36,36)", "tickwidth": 2, "outlinewidth": 0 } } } ], "surface": [ { "type": "surface", "colorbar": { "ticks": "outside", "ticklen": 8, "tickcolor": "rgb(36,36,36)", "tickwidth": 2, "outlinewidth": 0 } } ], "heatmapgl": [ { "type": "heatmapgl", "colorbar": { "ticks": "outside", "ticklen": 8, "tickcolor": "rgb(36,36,36)", "tickwidth": 2, "outlinewidth": 0 } } ], "histogram": [ { "type": "histogram", "marker": { "colorbar": { "ticks": "outside", "ticklen": 8, "tickcolor": "rgb(36,36,36)", "tickwidth": 2, "outlinewidth": 0 } } } ], "parcoords": [ { "line": { "colorbar": { "ticks": "outside", "ticklen": 8, "tickcolor": "rgb(36,36,36)", "tickwidth": 2, "outlinewidth": 0 } }, "type": "parcoords" } ], "scatter3d": [ { "type": "scatter3d", "marker": { "colorbar": { "ticks": "outside", "ticklen": 8, "tickcolor": "rgb(36,36,36)", "tickwidth": 2, "outlinewidth": 0 } } } ], "scattergl": [ { "type": "scattergl", "marker": { "colorbar": { "ticks": "outside", "ticklen": 8, "tickcolor": "rgb(36,36,36)", "tickwidth": 2, "outlinewidth": 0 } } } ], "choropleth": [ { "type": "choropleth", "colorbar": { "ticks": "outside", "ticklen": 8, "tickcolor": "rgb(36,36,36)", "tickwidth": 2, "outlinewidth": 0 } } ], "scattergeo": [ { "type": "scattergeo", "marker": { "colorbar": { "ticks": "outside", "ticklen": 8, "tickcolor": "rgb(36,36,36)", "tickwidth": 2, "outlinewidth": 0 } } } ], "histogram2d": [ { "type": "histogram2d", "colorbar": { "ticks": "outside", "ticklen": 8, "tickcolor": "rgb(36,36,36)", "tickwidth": 2, "outlinewidth": 0 }, "autocolorscale": true } ], "scatterpolar": [ { "type": "scatterpolar", "marker": { "colorbar": { "ticks": "outside", "ticklen": 8, "tickcolor": "rgb(36,36,36)", "tickwidth": 2, "outlinewidth": 0 } } } ], "contourcarpet": [ { "type": "contourcarpet", "colorbar": { "ticks": "outside", "ticklen": 8, "tickcolor": "rgb(36,36,36)", "tickwidth": 2, "outlinewidth": 0 } } ], "scattercarpet": [ { "type": "scattercarpet", "marker": { "colorbar": { "ticks": "outside", "ticklen": 8, "tickcolor": "rgb(36,36,36)", "tickwidth": 2, "outlinewidth": 0 } } } ], "scattermapbox": [ { "type": "scattermapbox", "marker": { "colorbar": { "ticks": "outside", "ticklen": 8, "tickcolor": "rgb(36,36,36)", "tickwidth": 2, "outlinewidth": 0 } } } ], "scatterpolargl": [ { "type": "scatterpolargl", "marker": { "colorbar": { "ticks": "outside", "ticklen": 8, "tickcolor": "rgb(36,36,36)", "tickwidth": 2, "outlinewidth": 0 } } } ], "scatterternary": [ { "type": "scatterternary", "marker": { "colorbar": { "ticks": "outside", "ticklen": 8, "tickcolor": "rgb(36,36,36)", "tickwidth": 2, "outlinewidth": 0 } } } ], "histogram2dcontour": [ { "type": "histogram2dcontour", "colorbar": { "ticks": "outside", "ticklen": 8, "tickcolor": "rgb(36,36,36)", "tickwidth": 2, "outlinewidth": 0 }, "autocolorscale": true } ] }, "layout": { "geo": { "bgcolor": "white", "showland": true, "lakecolor": "white", "landcolor": "rgb(234,234,242)", "showlakes": true, "subunitcolor": "white" }, "font": { "color": "rgb(36,36,36)" }, "polar": { "bgcolor": "rgb(234,234,242)", "radialaxis": { "ticks": "", "showgrid": true, "gridcolor": "white", "linecolor": "white" }, "angularaxis": { "ticks": "", "showgrid": true, "gridcolor": "white", "linecolor": "white" } }, "scene": { "xaxis": { "ticks": "", "showgrid": true, "gridcolor": "white", "gridwidth": 2, "linecolor": "white", "zerolinecolor": "white", "showbackground": true, "backgroundcolor": "rgb(234,234,242)" }, "yaxis": { "ticks": "", "showgrid": true, "gridcolor": "white", "gridwidth": 2, "linecolor": "white", "zerolinecolor": "white", "showbackground": true, "backgroundcolor": "rgb(234,234,242)" }, "zaxis": { "ticks": "", "showgrid": true, "gridcolor": "white", "gridwidth": 2, "linecolor": "white", "zerolinecolor": "white", "showbackground": true, "backgroundcolor": "rgb(234,234,242)" } }, "xaxis": { "ticks": "", "showgrid": true, "gridcolor": "white", "linecolor": "white", "automargin": true, "zerolinecolor": "white" }, "yaxis": { "ticks": "", "showgrid": true, "gridcolor": "white", "linecolor": "white", "automargin": true, "zerolinecolor": "white" }, "ternary": { "aaxis": { "ticks": "", "showgrid": true, "gridcolor": "white", "linecolor": "white" }, "baxis": { "ticks": "", "showgrid": true, "gridcolor": "white", "linecolor": "white" }, "caxis": { "ticks": "", "showgrid": true, "gridcolor": "white", "linecolor": "white" }, "bgcolor": "rgb(234,234,242)" }, "colorway": [ "rgb(76,114,176)", "rgb(221,132,82)", "rgb(85,168,104)", "rgb(196,78,82)", "rgb(129,114,179)", "rgb(147,120,96)", "rgb(218,139,195)", "rgb(140,140,140)", "rgb(204,185,116)", "rgb(100,181,205)" ], "hovermode": "closest", "colorscale": { "diverging": [ [ 0, "#67001f" ], [ 0.1, "#b2182b" ], [ 0.2, "#d6604d" ], [ 0.3, "#f4a582" ], [ 0.4, "#fddbc7" ], [ 0.5, "#f7f7f7" ], [ 0.6, "#d1e5f0" ], [ 0.7, "#92c5de" ], [ 0.8, "#4393c3" ], [ 0.9, "#2166ac" ], [ 1, "#053061" ] ], "sequential": [ [ 0, "rgb(2,4,25)" ], [ 0.06274509803921569, "rgb(24,15,41)" ], [ 0.12549019607843137, "rgb(47,23,57)" ], [ 0.18823529411764706, "rgb(71,28,72)" ], [ 0.25098039215686274, "rgb(97,30,82)" ], [ 0.3137254901960784, "rgb(123,30,89)" ], [ 0.3764705882352941, "rgb(150,27,91)" ], [ 0.4392156862745098, "rgb(177,22,88)" ], [ 0.5019607843137255, "rgb(203,26,79)" ], [ 0.5647058823529412, "rgb(223,47,67)" ], [ 0.6274509803921569, "rgb(236,76,61)" ], [ 0.6901960784313725, "rgb(242,107,73)" ], [ 0.7529411764705882, "rgb(244,135,95)" ], [ 0.8156862745098039, "rgb(245,162,122)" ], [ 0.8784313725490196, "rgb(246,188,153)" ], [ 0.9411764705882353, "rgb(247,212,187)" ], [ 1, "rgb(250,234,220)" ] ], "sequentialminus": [ [ 0, "rgb(2,4,25)" ], [ 0.06274509803921569, "rgb(24,15,41)" ], [ 0.12549019607843137, "rgb(47,23,57)" ], [ 0.18823529411764706, "rgb(71,28,72)" ], [ 0.25098039215686274, "rgb(97,30,82)" ], [ 0.3137254901960784, "rgb(123,30,89)" ], [ 0.3764705882352941, "rgb(150,27,91)" ], [ 0.4392156862745098, "rgb(177,22,88)" ], [ 0.5019607843137255, "rgb(203,26,79)" ], [ 0.5647058823529412, "rgb(223,47,67)" ], [ 0.6274509803921569, "rgb(236,76,61)" ], [ 0.6901960784313725, "rgb(242,107,73)" ], [ 0.7529411764705882, "rgb(244,135,95)" ], [ 0.8156862745098039, "rgb(245,162,122)" ], [ 0.8784313725490196, "rgb(246,188,153)" ], [ 0.9411764705882353, "rgb(247,212,187)" ], [ 1, "rgb(250,234,220)" ] ] }, "plot_bgcolor": "rgb(234,234,242)", "paper_bgcolor": "white", "shapedefaults": { "line": { "width": 0 }, "opacity": 0.5, "fillcolor": "rgb(67,103,167)" }, "annotationdefaults": { "arrowcolor": "rgb(67,103,167)" } }, "themeRef": "SEABORN" }, "showlegend": true, "plot_bgcolor": "rgb(227, 227, 234)" } }, "height": null, "width": null, "user": { "profile_url": "https://chart-studio.plotly.com/~DORITOS12", "avatar_url": "https://storage.googleapis.com/plotly-prod-profiles/50.jpg", "background_url": "https://storage.googleapis.com/plotly-prod-profiles/bg-2.jpg", "bio": "", "nickname": "", "website": "", "stream_tokens": null, "feature_set_id": null, "csrf_token": null, "date_joined": "2024-02-24 22:37:07", "mapbox_access_tokens": null, "has_password": null, "username": "DORITOS12", "email": null, "is_active": null, "readonly": null, "is_dash_creator": null, "dash_created_count": null, "is_chart_creator": null, "charts_created_count": null } }, { "creation_time": "2024-04-03T23:05:05.443350Z", "comments": { "results": [], "count": 0 }, "parented": true, "embed_url": "https://chart-studio.plotly.com/~yuricalil/69.embed", "fid": "yuricalil:69", "filename": "yieldcottonbrus", "filetype": "plot", "img_url": "https://api.plotly.com/v2/files/yuricalil:69/image?image_name=list-thumb", "image_urls": { "default": "https://api.plotly.com/v2/files/yuricalil:69/image?image_name=default", "block-thumb": "https://storage.googleapis.com/plotly-prod-images/yuricalil/69/8_3EQCFIVHRM36DNK1WG8HYEQ3307E48.png", "list-thumb": "https://api.plotly.com/v2/files/yuricalil:69/image?image_name=list-thumb" }, "api_urls": { "files": "https://api.plotly.com/v2/files/yuricalil:69", "plots": "https://api.plotly.com/v2/plots/yuricalil:69", "parent": "https://api.plotly.com/v2/folders/home?user=yuricalil" }, "owner": "yuricalil", "parent": -1, "preview": "", "referencers": [], "references": [], "title": "", "views": 1, "web_url": "https://chart-studio.plotly.com/~yuricalil/69/", "world_readable": true, "date_modified": "2024-09-18T19:31:35.306Z", "stars": { "results": [], "count": 0 }, "collaborators": { "results": [], "count": 0 }, "subfolder_count": null, "refresh_interval": null, "organize_view_url": "https://chart-studio.plotly.com/~yuricalil/69/", "current_user_permission": "read", "is_theme": null, "is_template": false, "autosize": true, "caption": "", "figure": { "data": [ { "line": { "width": 8 }, "meta": { "columnNames": { "x": "Year", "y": "Yield US" } }, "mode": "lines", "name": "United States", "type": "scatter", "xsrc": "yuricalil:67:60bf93", "ysrc": "yuricalil:67:f9278b", "marker": { "color": "rgb(179, 25, 66)" }, "orientation": "v" }, { "line": { "width": 4 }, "meta": { "columnNames": { "x": "Year", "y": "Yield BR" } }, "mode": "lines", "name": "Brazil", "type": "scatter", "xsrc": "yuricalil:67:60bf93", "ysrc": "yuricalil:67:2c5d83", "marker": { "color": "rgb(0, 151, 57)" }, "stackgroup": 1, "orientation": "v" } ], "frames": [], "layout": { "font": { "color": "rgb(0, 0, 0)" }, "xaxis": { "type": "linear", "range": [ 1960, 2024 ], "title": { "font": { "size": 12 } }, "nticks": 34, "tickfont": { "size": 24 }, "autorange": false, "gridwidth": 1 }, "yaxis": { "type": "linear", "range": [ -8.1646728515625, 2012.0086669921875 ], "title": { "font": { "size": 24 }, "text": "KG / HA" }, "nticks": 11, "tickfont": { "size": 24 }, "autorange": true }, "legend": { "x": 0.06281670872490186, "y": 0.9926441351888667, "font": { "size": 24 } }, "shapes": [ { "x0": 1995, "x1": 1995, "y0": 0, "y1": 2000, "line": { "color": "rgb(0, 0, 0)", "width": 7 }, "type": "line", "opacity": 1, "fillcolor": "rgb(0, 0, 0)" } ], "autosize": true, "template": { "data": { "bar": [ { "type": "bar", "marker": { "colorbar": { "ticks": "", "outlinewidth": 0 } } } ], "table": [ { "type": "table", "cells": { "fill": { "color": "#EBF0F8" }, "line": { "color": "white" } }, "header": { "fill": { "color": "#C8D4E3" }, "line": { "color": "white" } } } ], "carpet": [ { "type": "carpet", "aaxis": { "gridcolor": "#C8D4E3", "linecolor": "#C8D4E3", "endlinecolor": "#2a3f5f", "minorgridcolor": "#C8D4E3", "startlinecolor": "#2a3f5f" }, "baxis": { "gridcolor": "#C8D4E3", "linecolor": "#C8D4E3", "endlinecolor": "#2a3f5f", "minorgridcolor": "#C8D4E3", "startlinecolor": "#2a3f5f" } } ], "mesh3d": [ { "type": "mesh3d", "colorbar": { "ticks": "", "outlinewidth": 0 } } ], "contour": [ { "type": "contour", "colorbar": { "ticks": "", "outlinewidth": 0 }, "autocolorscale": true } ], "heatmap": [ { "type": "heatmap", "colorbar": { "ticks": "", "outlinewidth": 0 }, "autocolorscale": true } ], "scatter": [ { "type": "scatter", "marker": { "colorbar": { "ticks": "", "outlinewidth": 0 } } } ], "surface": [ { "type": "surface", "colorbar": { "ticks": "", "outlinewidth": 0 } } ], "heatmapgl": [ { "type": "heatmapgl", "colorbar": { "ticks": "", "outlinewidth": 0 } } ], "histogram": [ { "type": "histogram", "marker": { "colorbar": { "ticks": "", "outlinewidth": 0 } } } ], "parcoords": [ { "line": { "colorbar": { "ticks": "", "outlinewidth": 0 } }, "type": "parcoords" } ], "scatter3d": [ { "type": "scatter3d", "marker": { "colorbar": { "ticks": "", "outlinewidth": 0 } } } ], "scattergl": [ { "type": "scattergl", "marker": { "colorbar": { "ticks": "", "outlinewidth": 0 } } } ], "choropleth": [ { "type": "choropleth", "colorbar": { "ticks": "", "outlinewidth": 0 } } ], "scattergeo": [ { "type": "scattergeo", "marker": { "colorbar": { "ticks": "", "outlinewidth": 0 } } } ], "histogram2d": [ { "type": "histogram2d", "colorbar": { "ticks": "", "outlinewidth": 0 }, "autocolorscale": true } ], "scatterpolar": [ { "type": "scatterpolar", "marker": { "colorbar": { "ticks": "", "outlinewidth": 0 } } } ], "contourcarpet": [ { "type": "contourcarpet", "colorbar": { "ticks": "", "outlinewidth": 0 } } ], "scattercarpet": [ { "type": "scattercarpet", "marker": { "colorbar": { "ticks": "", "outlinewidth": 0 } } } ], "scattermapbox": [ { "type": "scattermapbox", "marker": { "colorbar": { "ticks": "", "outlinewidth": 0 } } } ], "scatterpolargl": [ { "type": "scatterpolargl", "marker": { "colorbar": { "ticks": "", "outlinewidth": 0 } } } ], "scatterternary": [ { "type": "scatterternary", "marker": { "colorbar": { "ticks": "", "outlinewidth": 0 } } } ], "histogram2dcontour": [ { "type": "histogram2dcontour", "colorbar": { "ticks": "", "outlinewidth": 0 }, "autocolorscale": true } ] }, "layout": { "geo": { "bgcolor": "white", "showland": true, "lakecolor": "white", "landcolor": "white", "showlakes": true, "subunitcolor": "#C8D4E3" }, "font": { "color": "#2a3f5f" }, "polar": { "bgcolor": "white", "radialaxis": { "ticks": "", "gridcolor": "#EBF0F8", "linecolor": "#EBF0F8" }, "angularaxis": { "ticks": "", "gridcolor": "#EBF0F8", "linecolor": "#EBF0F8" } }, "scene": { "xaxis": { "ticks": "", "gridcolor": "#DFE8F3", "gridwidth": 2, "linecolor": "#EBF0F8", "zerolinecolor": "#EBF0F8", "showbackground": true, "backgroundcolor": "white" }, "yaxis": { "ticks": "", "gridcolor": "#DFE8F3", "gridwidth": 2, "linecolor": "#EBF0F8", "zerolinecolor": "#EBF0F8", "showbackground": true, "backgroundcolor": "white" }, "zaxis": { "ticks": "", "gridcolor": "#DFE8F3", "gridwidth": 2, "linecolor": "#EBF0F8", "zerolinecolor": "#EBF0F8", "showbackground": true, "backgroundcolor": "white" } }, "title": { "x": 0.05 }, "xaxis": { "ticks": "", "gridcolor": "#EBF0F8", "linecolor": "#EBF0F8", "automargin": true, "zerolinecolor": "#EBF0F8", "zerolinewidth": 2 }, "yaxis": { "ticks": "", "gridcolor": "#EBF0F8", "linecolor": "#EBF0F8", "automargin": true, "zerolinecolor": "#EBF0F8", "zerolinewidth": 2 }, "ternary": { "aaxis": { "ticks": "", "gridcolor": "#DFE8F3", "linecolor": "#A2B1C6" }, "baxis": { "ticks": "", "gridcolor": "#DFE8F3", "linecolor": "#A2B1C6" }, "caxis": { "ticks": "", "gridcolor": "#DFE8F3", "linecolor": "#A2B1C6" }, "bgcolor": "white" }, "colorway": [ "#636efa", "#EF553B", "#00cc96", "#ab63fa", "#19d3f3", "#e763fa", "#fecb52", "#ffa15a", "#ff6692", "#b6e880" ], "hovermode": "closest", "colorscale": { "diverging": [ [ 0, "#8e0152" ], [ 0.1, "#c51b7d" ], [ 0.2, "#de77ae" ], [ 0.3, "#f1b6da" ], [ 0.4, "#fde0ef" ], [ 0.5, "#f7f7f7" ], [ 0.6, "#e6f5d0" ], [ 0.7, "#b8e186" ], [ 0.8, "#7fbc41" ], [ 0.9, "#4d9221" ], [ 1, "#276419" ] ], "sequential": [ [ 0, "#0508b8" ], [ 0.0893854748603352, "#1910d8" ], [ 0.1787709497206704, "#3c19f0" ], [ 0.2681564245810056, "#6b1cfb" ], [ 0.3575418994413408, "#981cfd" ], [ 0.44692737430167595, "#bf1cfd" ], [ 0.5363128491620112, "#dd2bfd" ], [ 0.6256983240223464, "#f246fe" ], [ 0.7150837988826816, "#fc67fd" ], [ 0.8044692737430168, "#fe88fc" ], [ 0.8938547486033519, "#fea5fd" ], [ 0.9832402234636871, "#febefe" ], [ 1, "#fec3fe" ] ], "sequentialminus": [ [ 0, "#0508b8" ], [ 0.0893854748603352, "#1910d8" ], [ 0.1787709497206704, "#3c19f0" ], [ 0.2681564245810056, "#6b1cfb" ], [ 0.3575418994413408, "#981cfd" ], [ 0.44692737430167595, "#bf1cfd" ], [ 0.5363128491620112, "#dd2bfd" ], [ 0.6256983240223464, "#f246fe" ], [ 0.7150837988826816, "#fc67fd" ], [ 0.8044692737430168, "#fe88fc" ], [ 0.8938547486033519, "#fea5fd" ], [ 0.9832402234636871, "#febefe" ], [ 1, "#fec3fe" ] ] }, "plot_bgcolor": "white", "paper_bgcolor": "white", "shapedefaults": { "line": { "width": 0 }, "opacity": 0.4, "fillcolor": "#506784" }, "annotationdefaults": { "arrowhead": 0, "arrowcolor": "#506784", "arrowwidth": 1 } }, "themeRef": "PLOTLY_WHITE" }, "annotations": [ { "x": 1997.5, "y": 1900, "font": { "size": 24, "color": "rgb(0, 0, 0)" }, "text": "ATC", "showarrow": false } ] } }, "height": null, "width": null, "user": { "profile_url": "https://chart-studio.plotly.com/~yuricalil", "avatar_url": "https://storage.googleapis.com/plotly-prod-profiles/68.jpg", "background_url": "https://storage.googleapis.com/plotly-prod-profiles/bg-10.jpg", "bio": "", "nickname": "", "website": "", "stream_tokens": null, "feature_set_id": null, "csrf_token": null, "date_joined": "2023-07-18 20:55:07", "mapbox_access_tokens": null, "has_password": null, "username": "yuricalil", "email": null, "is_active": null, "readonly": null, "is_dash_creator": null, "dash_created_count": null, "is_chart_creator": null, "charts_created_count": null } }, { "creation_time": "2024-04-03T22:52:54.614167Z", "comments": { "results": [], "count": 0 }, "parented": true, "embed_url": "https://chart-studio.plotly.com/~AL1148/0.embed", "fid": "AL1148:0", "filename": "date-axes", "filetype": "plot", "img_url": "https://storage.googleapis.com/plotly-prod-images/AL1148/0/9_HH4IQ20R148OYIZ97IVQDIBJHK1M30.png", "image_urls": { "default": "https://storage.googleapis.com/plotly-prod-images/AL1148/0/2_HM12RJGJALQDAMEGCJ986108IWTTW2.png", "block-thumb": "https://storage.googleapis.com/plotly-prod-images/AL1148/0/8_3OHTYO3XF2D0NRL8I8IEE5Q4EV975H.png", "list-thumb": "https://storage.googleapis.com/plotly-prod-images/AL1148/0/9_HH4IQ20R148OYIZ97IVQDIBJHK1M30.png" }, "api_urls": { "files": "https://api.plotly.com/v2/files/AL1148:0", "plots": "https://api.plotly.com/v2/plots/AL1148:0", "parent": "https://api.plotly.com/v2/folders/home?user=AL1148" }, "owner": "AL1148", "parent": -1, "preview": "", "referencers": [], "references": [], "title": "Synthetic Data for Student M00819539", "views": 3, "web_url": "https://chart-studio.plotly.com/~AL1148/0/synthetic-data-for-student-m00819539/", "world_readable": true, "date_modified": "2024-04-05T03:55:15.225Z", "stars": { "results": [], "count": 0 }, "collaborators": { "results": [], "count": 0 }, "subfolder_count": null, "refresh_interval": null, "organize_view_url": "https://chart-studio.plotly.com/~AL1148/0/", "current_user_permission": "read", "is_theme": null, "is_template": null, "autosize": true, "caption": "", "figure": { "data": [ { "mode": "lines", "name": "M00819539", "type": "scatter", "xsrc": "AL1148:1:f7e19a", "ysrc": "AL1148:1:c2d9af", "marker": { "size": 12, "color": "rgb(219, 64, 82)" } }, { "line": { "color": "green" }, "mode": "lines", "name": "Mean Prediction", "type": "scatter", "xsrc": "AL1148:1:f7e19a", "ysrc": "AL1148:1:c6d571" }, { "line": { "color": "blue" }, "mode": "lines", "name": "0.1 Quantile", "type": "scatter", "xsrc": "AL1148:1:f7e19a", "ysrc": "AL1148:1:63511e" }, { "line": { "color": "red" }, "mode": "lines", "name": "0.9 Quantile", "type": "scatter", "xsrc": "AL1148:1:f7e19a", "ysrc": "AL1148:1:262309" } ], "layout": { "font": { "size": 25 }, "title": "Synthetic Data for Student M00819539", "xaxis": { "title": "Time (hours)" }, "yaxis": { "title": "Value" } } }, "height": null, "width": null, "user": { "profile_url": "https://chart-studio.plotly.com/~AL1148", "avatar_url": "https://storage.googleapis.com/plotly-prod-profiles/44.jpg", "background_url": "https://storage.googleapis.com/plotly-prod-profiles/bg-8.jpg", "bio": "", "nickname": "", "website": "", "stream_tokens": null, "feature_set_id": null, "csrf_token": null, "date_joined": "2024-04-03 21:37:53", "mapbox_access_tokens": null, "has_password": null, "username": "AL1148", "email": null, "is_active": null, "readonly": null, "is_dash_creator": null, "dash_created_count": null, "is_chart_creator": null, "charts_created_count": null } }, { "creation_time": "2024-04-03T22:52:12.309697Z", "comments": { "results": [], "count": 0 }, "parented": true, "embed_url": "https://chart-studio.plotly.com/~yuricalil/68.embed", "fid": "yuricalil:68", "filename": "productionusbrcotton", "filetype": "plot", "img_url": "https://api.plotly.com/v2/files/yuricalil:68/image?image_name=list-thumb", "image_urls": { "default": "https://storage.googleapis.com/plotly-prod-images/yuricalil/68/2_EOCXFJA9SZB0VQXU0YSWYDKHAYMWK4.png", "block-thumb": "https://storage.googleapis.com/plotly-prod-images/yuricalil/68/8_DLMMOYOKEPIVKGU6595KRC5J4MJOSA.png", "list-thumb": "https://api.plotly.com/v2/files/yuricalil:68/image?image_name=list-thumb" }, "api_urls": { "files": "https://api.plotly.com/v2/files/yuricalil:68", "plots": "https://api.plotly.com/v2/plots/yuricalil:68", "parent": "https://api.plotly.com/v2/folders/home?user=yuricalil" }, "owner": "yuricalil", "parent": -1, "preview": "", "referencers": [], "references": [], "title": "", "views": 3, "web_url": "https://chart-studio.plotly.com/~yuricalil/68/", "world_readable": true, "date_modified": "2024-09-18T19:31:08.319Z", "stars": { "results": [], "count": 0 }, "collaborators": { "results": [], "count": 0 }, "subfolder_count": null, "refresh_interval": null, "organize_view_url": "https://chart-studio.plotly.com/~yuricalil/68/", "current_user_permission": "read", "is_theme": null, "is_template": false, "autosize": true, "caption": "", "figure": { "data": [ { "fill": "tozeroy", "line": { "color": "rgb(179, 25, 66)", "width": 5 }, "meta": { "columnNames": { "x": "Year", "y": "Production US" } }, "mode": "lines", "name": "United States", "type": "scatter", "xsrc": "yuricalil:67:60bf93", "ysrc": "yuricalil:67:3cfbe2", "fillcolor": "rgba(179, 25, 66, 0.5)", "stackgroup": "", "orientation": "v" }, { "line": { "color": "rgb(0, 151, 37)", "width": 5 }, "meta": { "columnNames": { "x": "Year", "y": "Production BR" } }, "mode": "lines", "name": "Brazil", "type": "scatter", "xsrc": "yuricalil:67:60bf93", "ysrc": "yuricalil:67:9bdcce", "fillcolor": "rgba(0, 151, 37, 0.5)", "stackgroup": 1 } ], "frames": [], "layout": { "xaxis": { "type": "linear", "range": [ 1960, 2024 ], "ticks": "", "title": { "font": { "size": 12, "color": "rgb(0, 0, 0)" } }, "nticks": 33, "ticklen": 0, "tickfont": { "size": 24, "color": "rgb(0, 0, 0)" }, "autorange": true, "gridwidth": 1, "tickcolor": "rgb(0, 0, 0)", "tickwidth": 0, "showspikes": false }, "yaxis": { "type": "linear", "range": [ -102.069091796875, 25152.740478515625 ], "title": { "font": { "size": 24, "color": "rgb(0, 0, 0)" }, "text": "1,000 480 lb. Bales" }, "nticks": 12, "tickfont": { "size": 24, "color": "rgb(0, 0, 0)" }, "autorange": true, "showticklabels": true }, "legend": { "x": 0.03572823546499681, "y": 1.0721283831647175, "font": { "size": 24, "color": "rgb(0, 0, 0)" } }, "shapes": [ { "x0": 1995, "x1": 1995, "y0": 0, "y1": 25000, "line": { "color": "rgb(0, 0, 0)", "width": 7 }, "type": "line", "opacity": 1, "fillcolor": "rgb(0, 0, 0)" } ], "autosize": true, "template": { "data": { "bar": [ { "type": "bar", "marker": { "colorbar": { "ticks": "", "outlinewidth": 0 } } } ], "table": [ { "type": "table", "cells": { "fill": { "color": "#EBF0F8" }, "line": { "color": "white" } }, "header": { "fill": { "color": "#C8D4E3" }, "line": { "color": "white" } } } ], "carpet": [ { "type": "carpet", "aaxis": { "gridcolor": "#C8D4E3", "linecolor": "#C8D4E3", "endlinecolor": "#2a3f5f", "minorgridcolor": "#C8D4E3", "startlinecolor": "#2a3f5f" }, "baxis": { "gridcolor": "#C8D4E3", "linecolor": "#C8D4E3", "endlinecolor": "#2a3f5f", "minorgridcolor": "#C8D4E3", "startlinecolor": "#2a3f5f" } } ], "mesh3d": [ { "type": "mesh3d", "colorbar": { "ticks": "", "outlinewidth": 0 } } ], "contour": [ { "type": "contour", "colorbar": { "ticks": "", "outlinewidth": 0 }, "autocolorscale": true } ], "heatmap": [ { "type": "heatmap", "colorbar": { "ticks": "", "outlinewidth": 0 }, "autocolorscale": true } ], "scatter": [ { "type": "scatter", "marker": { "colorbar": { "ticks": "", "outlinewidth": 0 } } } ], "surface": [ { "type": "surface", "colorbar": { "ticks": "", "outlinewidth": 0 } } ], "heatmapgl": [ { "type": "heatmapgl", "colorbar": { "ticks": "", "outlinewidth": 0 } } ], "histogram": [ { "type": "histogram", "marker": { "colorbar": { "ticks": "", "outlinewidth": 0 } } } ], "parcoords": [ { "line": { "colorbar": { "ticks": "", "outlinewidth": 0 } }, "type": "parcoords" } ], "scatter3d": [ { "type": "scatter3d", "marker": { "colorbar": { "ticks": "", "outlinewidth": 0 } } } ], "scattergl": [ { "type": "scattergl", "marker": { "colorbar": { "ticks": "", "outlinewidth": 0 } } } ], "choropleth": [ { "type": "choropleth", "colorbar": { "ticks": "", "outlinewidth": 0 } } ], "scattergeo": [ { "type": "scattergeo", "marker": { "colorbar": { "ticks": "", "outlinewidth": 0 } } } ], "histogram2d": [ { "type": "histogram2d", "colorbar": { "ticks": "", "outlinewidth": 0 }, "autocolorscale": true } ], "scatterpolar": [ { "type": "scatterpolar", "marker": { "colorbar": { "ticks": "", "outlinewidth": 0 } } } ], "contourcarpet": [ { "type": "contourcarpet", "colorbar": { "ticks": "", "outlinewidth": 0 } } ], "scattercarpet": [ { "type": "scattercarpet", "marker": { "colorbar": { "ticks": "", "outlinewidth": 0 } } } ], "scattermapbox": [ { "type": "scattermapbox", "marker": { "colorbar": { "ticks": "", "outlinewidth": 0 } } } ], "scatterpolargl": [ { "type": "scatterpolargl", "marker": { "colorbar": { "ticks": "", "outlinewidth": 0 } } } ], "scatterternary": [ { "type": "scatterternary", "marker": { "colorbar": { "ticks": "", "outlinewidth": 0 } } } ], "histogram2dcontour": [ { "type": "histogram2dcontour", "colorbar": { "ticks": "", "outlinewidth": 0 }, "autocolorscale": true } ] }, "layout": { "geo": { "bgcolor": "white", "showland": true, "lakecolor": "white", "landcolor": "white", "showlakes": true, "subunitcolor": "#C8D4E3" }, "font": { "color": "#2a3f5f" }, "polar": { "bgcolor": "white", "radialaxis": { "ticks": "", "gridcolor": "#EBF0F8", "linecolor": "#EBF0F8" }, "angularaxis": { "ticks": "", "gridcolor": "#EBF0F8", "linecolor": "#EBF0F8" } }, "scene": { "xaxis": { "ticks": "", "gridcolor": "#DFE8F3", "gridwidth": 2, "linecolor": "#EBF0F8", "zerolinecolor": "#EBF0F8", "showbackground": true, "backgroundcolor": "white" }, "yaxis": { "ticks": "", "gridcolor": "#DFE8F3", "gridwidth": 2, "linecolor": "#EBF0F8", "zerolinecolor": "#EBF0F8", "showbackground": true, "backgroundcolor": "white" }, "zaxis": { "ticks": "", "gridcolor": "#DFE8F3", "gridwidth": 2, "linecolor": "#EBF0F8", "zerolinecolor": "#EBF0F8", "showbackground": true, "backgroundcolor": "white" } }, "title": { "x": 0.05 }, "xaxis": { "ticks": "", "gridcolor": "#EBF0F8", "linecolor": "#EBF0F8", "automargin": true, "zerolinecolor": "#EBF0F8", "zerolinewidth": 2 }, "yaxis": { "ticks": "", "gridcolor": "#EBF0F8", "linecolor": "#EBF0F8", "automargin": true, "zerolinecolor": "#EBF0F8", "zerolinewidth": 2 }, "ternary": { "aaxis": { "ticks": "", "gridcolor": "#DFE8F3", "linecolor": "#A2B1C6" }, "baxis": { "ticks": "", "gridcolor": "#DFE8F3", "linecolor": "#A2B1C6" }, "caxis": { "ticks": "", "gridcolor": "#DFE8F3", "linecolor": "#A2B1C6" }, "bgcolor": "white" }, "colorway": [ "#636efa", "#EF553B", "#00cc96", "#ab63fa", "#19d3f3", "#e763fa", "#fecb52", "#ffa15a", "#ff6692", "#b6e880" ], "hovermode": "closest", "colorscale": { "diverging": [ [ 0, "#8e0152" ], [ 0.1, "#c51b7d" ], [ 0.2, "#de77ae" ], [ 0.3, "#f1b6da" ], [ 0.4, "#fde0ef" ], [ 0.5, "#f7f7f7" ], [ 0.6, "#e6f5d0" ], [ 0.7, "#b8e186" ], [ 0.8, "#7fbc41" ], [ 0.9, "#4d9221" ], [ 1, "#276419" ] ], "sequential": [ [ 0, "#0508b8" ], [ 0.0893854748603352, "#1910d8" ], [ 0.1787709497206704, "#3c19f0" ], [ 0.2681564245810056, "#6b1cfb" ], [ 0.3575418994413408, "#981cfd" ], [ 0.44692737430167595, "#bf1cfd" ], [ 0.5363128491620112, "#dd2bfd" ], [ 0.6256983240223464, "#f246fe" ], [ 0.7150837988826816, "#fc67fd" ], [ 0.8044692737430168, "#fe88fc" ], [ 0.8938547486033519, "#fea5fd" ], [ 0.9832402234636871, "#febefe" ], [ 1, "#fec3fe" ] ], "sequentialminus": [ [ 0, "#0508b8" ], [ 0.0893854748603352, "#1910d8" ], [ 0.1787709497206704, "#3c19f0" ], [ 0.2681564245810056, "#6b1cfb" ], [ 0.3575418994413408, "#981cfd" ], [ 0.44692737430167595, "#bf1cfd" ], [ 0.5363128491620112, "#dd2bfd" ], [ 0.6256983240223464, "#f246fe" ], [ 0.7150837988826816, "#fc67fd" ], [ 0.8044692737430168, "#fe88fc" ], [ 0.8938547486033519, "#fea5fd" ], [ 0.9832402234636871, "#febefe" ], [ 1, "#fec3fe" ] ] }, "plot_bgcolor": "white", "paper_bgcolor": "white", "shapedefaults": { "line": { "width": 0 }, "opacity": 0.4, "fillcolor": "#506784" }, "annotationdefaults": { "arrowhead": 0, "arrowcolor": "#506784", "arrowwidth": 1 } }, "themeRef": "PLOTLY_WHITE" }, "annotations": [ { "x": 1997, "y": 24000, "font": { "size": 24, "color": "rgb(0, 0, 0)" }, "text": "ATC", "showarrow": false } ] } }, "height": null, "width": null, "user": { "profile_url": "https://chart-studio.plotly.com/~yuricalil", "avatar_url": "https://storage.googleapis.com/plotly-prod-profiles/68.jpg", "background_url": "https://storage.googleapis.com/plotly-prod-profiles/bg-10.jpg", "bio": "", "nickname": "", "website": "", "stream_tokens": null, "feature_set_id": null, "csrf_token": null, "date_joined": "2023-07-18 20:55:07", "mapbox_access_tokens": null, "has_password": null, "username": "yuricalil", "email": null, "is_active": null, "readonly": null, "is_dash_creator": null, "dash_created_count": null, "is_chart_creator": null, "charts_created_count": null } }, { "creation_time": "2024-04-03T22:51:00.308366Z", "comments": { "results": [], "count": 0 }, "parented": true, "embed_url": "https://chart-studio.plotly.com/~pbhavara/1.embed", "fid": "pbhavara:1", "filename": "Plot 1", "filetype": "plot", "img_url": "https://storage.googleapis.com/plotly-prod-images/pbhavara/1/9_1JO2F6GIBYUEU3FE5K2AEKY6ZZMGUZ.png", "image_urls": { "default": "https://storage.googleapis.com/plotly-prod-images/pbhavara/1/2_CK8M5NHCEY0L0WS63416FD205DJNLM.png", "block-thumb": "https://storage.googleapis.com/plotly-prod-images/pbhavara/1/8_GMQP0TKPU2KNSFNHM0091BZ7441G7U.png", "list-thumb": "https://storage.googleapis.com/plotly-prod-images/pbhavara/1/9_1JO2F6GIBYUEU3FE5K2AEKY6ZZMGUZ.png" }, "api_urls": { "files": "https://api.plotly.com/v2/files/pbhavara:1", "plots": "https://api.plotly.com/v2/plots/pbhavara:1", "parent": "https://api.plotly.com/v2/folders/home?user=pbhavara" }, "owner": "pbhavara", "parent": -1, "preview": "", "referencers": [], "references": [], "title": "", "views": 1, "web_url": "https://chart-studio.plotly.com/~pbhavara/1/", "world_readable": true, "date_modified": "2024-04-03T23:04:22.020Z", "stars": { "results": [], "count": 0 }, "collaborators": { "results": [], "count": 0 }, "subfolder_count": null, "refresh_interval": null, "organize_view_url": "https://chart-studio.plotly.com/~pbhavara/1/", "current_user_permission": "read", "is_theme": null, "is_template": false, "autosize": true, "caption": "", "figure": { "data": [ { "meta": { "columnNames": { "x": "A", "y": "B", "error_x": { "array": "" }, "error_y": { "array": "C" } } }, "mode": "markers+lines", "type": "scatter", "xsrc": "pbhavara:0:24878e", "ysrc": "pbhavara:0:c07129", "error_x": { "meta": { "columnNames": { "array": "C" } }, "type": "data", "visible": true, "symmetric": true }, "error_y": { "meta": { "columnNames": { "array": "C" } }, "type": "data", "visible": true, "arraysrc": "pbhavara:0:9ab288", "symmetric": true } } ], "frames": [], "layout": { "title": { "x": 0.5, "text": "OD<sub>730</sub> of WT + Mannitol Phosphatase" }, "xaxis": { "type": "linear", "range": [ -0.4386953551912569, 7.438695355191257 ], "title": { "text": "Days" }, "anchor": "y", "nticks": 0, "showline": false, "tickmode": "linear", "autorange": true, "showspikes": false, "rangeslider": { "range": [ -0.38888888888888895, 7.388888888888889 ], "yaxis": {}, "visible": false, "autorange": true } }, "yaxis": { "side": "left", "type": "linear", "dtick": 2, "range": [ -1.0037609197620985, 12.246500150513794 ], "title": { "text": "OD<sub>730" }, "tickmode": "linear", "autorange": true, "tickformat": "" }, "autosize": true, "template": { "data": { "bar": [ { "type": "bar", "marker": { "colorbar": { "ticks": "", "outlinewidth": 0 } } } ], "table": [ { "type": "table", "cells": { "fill": { "color": "#EBF0F8" }, "line": { "color": "white" } }, "header": { "fill": { "color": "#C8D4E3" }, "line": { "color": "white" } } } ], "carpet": [ { "type": "carpet", "aaxis": { "gridcolor": "#C8D4E3", "linecolor": "#C8D4E3", "endlinecolor": "#2a3f5f", "minorgridcolor": "#C8D4E3", "startlinecolor": "#2a3f5f" }, "baxis": { "gridcolor": "#C8D4E3", "linecolor": "#C8D4E3", "endlinecolor": "#2a3f5f", "minorgridcolor": "#C8D4E3", "startlinecolor": "#2a3f5f" } } ], "mesh3d": [ { "type": "mesh3d", "colorbar": { "ticks": "", "outlinewidth": 0 } } ], "contour": [ { "type": "contour", "colorbar": { "ticks": "", "outlinewidth": 0 }, "autocolorscale": true } ], "heatmap": [ { "type": "heatmap", "colorbar": { "ticks": "", "outlinewidth": 0 }, "autocolorscale": true } ], "scatter": [ { "type": "scatter", "marker": { "colorbar": { "ticks": "", "outlinewidth": 0 } } } ], "surface": [ { "type": "surface", "colorbar": { "ticks": "", "outlinewidth": 0 } } ], "heatmapgl": [ { "type": "heatmapgl", "colorbar": { "ticks": "", "outlinewidth": 0 } } ], "histogram": [ { "type": "histogram", "marker": { "colorbar": { "ticks": "", "outlinewidth": 0 } } } ], "parcoords": [ { "line": { "colorbar": { "ticks": "", "outlinewidth": 0 } }, "type": "parcoords" } ], "scatter3d": [ { "type": "scatter3d", "marker": { "colorbar": { "ticks": "", "outlinewidth": 0 } } } ], "scattergl": [ { "type": "scattergl", "marker": { "colorbar": { "ticks": "", "outlinewidth": 0 } } } ], "choropleth": [ { "type": "choropleth", "colorbar": { "ticks": "", "outlinewidth": 0 } } ], "scattergeo": [ { "type": "scattergeo", "marker": { "colorbar": { "ticks": "", "outlinewidth": 0 } } } ], "histogram2d": [ { "type": "histogram2d", "colorbar": { "ticks": "", "outlinewidth": 0 }, "autocolorscale": true } ], "scatterpolar": [ { "type": "scatterpolar", "marker": { "colorbar": { "ticks": "", "outlinewidth": 0 } } } ], "contourcarpet": [ { "type": "contourcarpet", "colorbar": { "ticks": "", "outlinewidth": 0 } } ], "scattercarpet": [ { "type": "scattercarpet", "marker": { "colorbar": { "ticks": "", "outlinewidth": 0 } } } ], "scattermapbox": [ { "type": "scattermapbox", "marker": { "colorbar": { "ticks": "", "outlinewidth": 0 } } } ], "scatterpolargl": [ { "type": "scatterpolargl", "marker": { "colorbar": { "ticks": "", "outlinewidth": 0 } } } ], "scatterternary": [ { "type": "scatterternary", "marker": { "colorbar": { "ticks": "", "outlinewidth": 0 } } } ], "histogram2dcontour": [ { "type": "histogram2dcontour", "colorbar": { "ticks": "", "outlinewidth": 0 }, "autocolorscale": true } ] }, "layout": { "geo": { "bgcolor": "white", "showland": true, "lakecolor": "white", "landcolor": "white", "showlakes": true, "subunitcolor": "#C8D4E3" }, "font": { "color": "#2a3f5f" }, "polar": { "bgcolor": "white", "radialaxis": { "ticks": "", "gridcolor": "#EBF0F8", "linecolor": "#EBF0F8" }, "angularaxis": { "ticks": "", "gridcolor": "#EBF0F8", "linecolor": "#EBF0F8" } }, "scene": { "xaxis": { "ticks": "", "gridcolor": "#DFE8F3", "gridwidth": 2, "linecolor": "#EBF0F8", "zerolinecolor": "#EBF0F8", "showbackground": true, "backgroundcolor": "white" }, "yaxis": { "ticks": "", "gridcolor": "#DFE8F3", "gridwidth": 2, "linecolor": "#EBF0F8", "zerolinecolor": "#EBF0F8", "showbackground": true, "backgroundcolor": "white" }, "zaxis": { "ticks": "", "gridcolor": "#DFE8F3", "gridwidth": 2, "linecolor": "#EBF0F8", "zerolinecolor": "#EBF0F8", "showbackground": true, "backgroundcolor": "white" } }, "title": { "x": 0.05 }, "xaxis": { "ticks": "", "gridcolor": "#EBF0F8", "linecolor": "#EBF0F8", "automargin": true, "zerolinecolor": "#EBF0F8", "zerolinewidth": 2 }, "yaxis": { "ticks": "", "gridcolor": "#EBF0F8", "linecolor": "#EBF0F8", "automargin": true, "zerolinecolor": "#EBF0F8", "zerolinewidth": 2 }, "ternary": { "aaxis": { "ticks": "", "gridcolor": "#DFE8F3", "linecolor": "#A2B1C6" }, "baxis": { "ticks": "", "gridcolor": "#DFE8F3", "linecolor": "#A2B1C6" }, "caxis": { "ticks": "", "gridcolor": "#DFE8F3", "linecolor": "#A2B1C6" }, "bgcolor": "white" }, "colorway": [ "#636efa", "#EF553B", "#00cc96", "#ab63fa", "#19d3f3", "#e763fa", "#fecb52", "#ffa15a", "#ff6692", "#b6e880" ], "hovermode": "closest", "colorscale": { "diverging": [ [ 0, "#8e0152" ], [ 0.1, "#c51b7d" ], [ 0.2, "#de77ae" ], [ 0.3, "#f1b6da" ], [ 0.4, "#fde0ef" ], [ 0.5, "#f7f7f7" ], [ 0.6, "#e6f5d0" ], [ 0.7, "#b8e186" ], [ 0.8, "#7fbc41" ], [ 0.9, "#4d9221" ], [ 1, "#276419" ] ], "sequential": [ [ 0, "#0508b8" ], [ 0.0893854748603352, "#1910d8" ], [ 0.1787709497206704, "#3c19f0" ], [ 0.2681564245810056, "#6b1cfb" ], [ 0.3575418994413408, "#981cfd" ], [ 0.44692737430167595, "#bf1cfd" ], [ 0.5363128491620112, "#dd2bfd" ], [ 0.6256983240223464, "#f246fe" ], [ 0.7150837988826816, "#fc67fd" ], [ 0.8044692737430168, "#fe88fc" ], [ 0.8938547486033519, "#fea5fd" ], [ 0.9832402234636871, "#febefe" ], [ 1, "#fec3fe" ] ], "sequentialminus": [ [ 0, "#0508b8" ], [ 0.0893854748603352, "#1910d8" ], [ 0.1787709497206704, "#3c19f0" ], [ 0.2681564245810056, "#6b1cfb" ], [ 0.3575418994413408, "#981cfd" ], [ 0.44692737430167595, "#bf1cfd" ], [ 0.5363128491620112, "#dd2bfd" ], [ 0.6256983240223464, "#f246fe" ], [ 0.7150837988826816, "#fc67fd" ], [ 0.8044692737430168, "#fe88fc" ], [ 0.8938547486033519, "#fea5fd" ], [ 0.9832402234636871, "#febefe" ], [ 1, "#fec3fe" ] ] }, "plot_bgcolor": "white", "paper_bgcolor": "white", "shapedefaults": { "line": { "width": 0 }, "opacity": 0.4, "fillcolor": "#506784" }, "annotationdefaults": { "arrowhead": 0, "arrowcolor": "#506784", "arrowwidth": 1 } }, "themeRef": "PLOTLY_WHITE" } } }, "height": null, "width": null, "user": { "profile_url": "https://chart-studio.plotly.com/~pbhavara", "avatar_url": "https://storage.googleapis.com/plotly-prod-profiles/32.jpg", "background_url": "https://storage.googleapis.com/plotly-prod-profiles/bg-14.jpg", "bio": "", "nickname": "", "website": "", "stream_tokens": null, "feature_set_id": null, "csrf_token": null, "date_joined": "2024-04-03 22:50:19", "mapbox_access_tokens": null, "has_password": null, "username": "pbhavara", "email": null, "is_active": null, "readonly": null, "is_dash_creator": null, "dash_created_count": null, "is_chart_creator": null, "charts_created_count": null } }, { "creation_time": "2024-04-03T22:49:44.740538Z", "comments": { "results": [], "count": 0 }, "parented": true, "embed_url": "https://chart-studio.plotly.com/~554488/28.embed", "fid": "554488:28", "filename": "Plot 28", "filetype": "plot", "img_url": "https://storage.googleapis.com/plotly-prod-images/554488/28/9_J4ZKXOWIX5HMM83G0J3834QA1F3H52.png", "image_urls": { "default": "https://storage.googleapis.com/plotly-prod-images/554488/28/2_ORD2W1UBGUCNZ6CGVNAFTZDJNZUJ88.png", "block-thumb": "https://storage.googleapis.com/plotly-prod-images/554488/28/8_9C6KPXI5ID5DS91YEIYOT1KDD6KM51.png", "list-thumb": "https://storage.googleapis.com/plotly-prod-images/554488/28/9_J4ZKXOWIX5HMM83G0J3834QA1F3H52.png" }, "api_urls": { "files": "https://api.plotly.com/v2/files/554488:28", "plots": "https://api.plotly.com/v2/plots/554488:28", "parent": "https://api.plotly.com/v2/folders/home?user=554488" }, "owner": "554488", "parent": -1, "preview": "", "referencers": [], "references": [], "title": "", "views": 1, "web_url": "https://chart-studio.plotly.com/~554488/28/", "world_readable": true, "date_modified": "2024-04-03T22:49:44.752Z", "stars": { "results": [], "count": 0 }, "collaborators": { "results": [], "count": 0 }, "subfolder_count": null, "refresh_interval": null, "organize_view_url": "https://chart-studio.plotly.com/~554488/28/", "current_user_permission": "read", "is_theme": null, "is_template": false, "autosize": true, "caption": "", "figure": { "data": [ { "uid": "1b80c1", "meta": { "columnNames": { "x": "Sucrose Concentration (M) ", "y": "Percent change Russet Potato" } }, "mode": "markers", "name": "Russet potato", "type": "scatter", "xsrc": "554488:27:d32fe1", "ysrc": "554488:27:5511cc" }, { "uid": "83422b", "meta": { "columnNames": { "x": "Sucrose Concentration (M) ", "y": "Percent change Idaho gold potato" } }, "mode": "markers", "name": "Sweet potato", "type": "scatter", "xsrc": "554488:27:d32fe1", "ysrc": "554488:27:c4be97", "stackgroup": null }, { "uid": "965d65", "meta": { "columnNames": { "x": "Sucrose Concentration (M) ", "y": "Percent change Sweet Potato" } }, "mode": "markers", "name": "Gold potato", "type": "scatter", "xsrc": "554488:27:d32fe1", "ysrc": "554488:27:0162ff", "stackgroup": null }, { "uid": "2a6be8", "transforms": [ { "rms": "", "type": "fit", "inputUid": "1b80c1", "regressor": "x", "parameters": [ { "hold": false, "name": "m", "error": 0.2073950900403064, "value": -0.7548148148000228 }, { "hold": false, "name": "b", "error": 0.10160242915146651, "value": 0.6013903133800091 } ], "regressand": "y", "correlation": "", "fitfunction": "m*x + b", "inputxrange": [], "outputxrange": [], "interpolation": 50 } ] }, { "uid": "a136b8", "transforms": [ { "rms": "", "type": "fit", "inputUid": "83422b", "regressor": "x", "parameters": [ { "hold": false, "name": "m", "error": 0.12256802848760776, "value": -0.38803088810999997 }, { "hold": false, "name": "b", "error": 0.06004582571470387, "value": 0.09792471044800001 } ], "regressand": "y", "correlation": "", "fitfunction": "m*x + b", "inputxrange": [], "outputxrange": [], "interpolation": 50 } ] }, { "uid": "70f2c1", "transforms": [ { "rms": "", "type": "fit", "inputUid": "965d65", "regressor": "x", "parameters": [ { "hold": false, "name": "m", "error": 0.05403710699440209, "value": -0.20845648600000302 }, { "hold": false, "name": "b", "error": 0.026472667862493176, "value": 0.3528571428200018 } ], "regressand": "y", "correlation": "", "fitfunction": "m*x + b", "inputxrange": [], "outputxrange": [], "interpolation": 50 } ] } ], "frames": [], "layout": { "title": { "text": "The percent changes in three different potatoes in different Sucrose Concentrations " }, "xaxis": { "type": "linear", "range": [ -0.049158534860698634, 0.8491585348606987 ], "title": { "text": "Sucrose Concentration" }, "autorange": true }, "yaxis": { "type": "linear", "range": [ -0.2599693706204488, 0.6894180409885236 ], "title": { "text": "Percent Change's" }, "autorange": true }, "autosize": true, "template": { "data": { "bar": [ { "type": "bar", "marker": { "colorbar": { "ticks": "", "outlinewidth": 0 } } } ], "table": [ { "type": "table", "cells": { "fill": { "color": "#EBF0F8" }, "line": { "color": "white" } }, "header": { "fill": { "color": "#C8D4E3" }, "line": { "color": "white" } } } ], "carpet": [ { "type": "carpet", "aaxis": { "gridcolor": "#C8D4E3", "linecolor": "#C8D4E3", "endlinecolor": "#2a3f5f", "minorgridcolor": "#C8D4E3", "startlinecolor": "#2a3f5f" }, "baxis": { "gridcolor": "#C8D4E3", "linecolor": "#C8D4E3", "endlinecolor": "#2a3f5f", "minorgridcolor": "#C8D4E3", "startlinecolor": "#2a3f5f" } } ], "mesh3d": [ { "type": "mesh3d", "colorbar": { "ticks": "", "outlinewidth": 0 } } ], "contour": [ { "type": "contour", "colorbar": { "ticks": "", "outlinewidth": 0 }, "autocolorscale": true } ], "heatmap": [ { "type": "heatmap", "colorbar": { "ticks": "", "outlinewidth": 0 }, "autocolorscale": true } ], "scatter": [ { "type": "scatter", "marker": { "colorbar": { "ticks": "", "outlinewidth": 0 } } } ], "surface": [ { "type": "surface", "colorbar": { "ticks": "", "outlinewidth": 0 } } ], "heatmapgl": [ { "type": "heatmapgl", "colorbar": { "ticks": "", "outlinewidth": 0 } } ], "histogram": [ { "type": "histogram", "marker": { "colorbar": { "ticks": "", "outlinewidth": 0 } } } ], "parcoords": [ { "line": { "colorbar": { "ticks": "", "outlinewidth": 0 } }, "type": "parcoords" } ], "scatter3d": [ { "type": "scatter3d", "marker": { "colorbar": { "ticks": "", "outlinewidth": 0 } } } ], "scattergl": [ { "type": "scattergl", "marker": { "colorbar": { "ticks": "", "outlinewidth": 0 } } } ], "choropleth": [ { "type": "choropleth", "colorbar": { "ticks": "", "outlinewidth": 0 } } ], "scattergeo": [ { "type": "scattergeo", "marker": { "colorbar": { "ticks": "", "outlinewidth": 0 } } } ], "histogram2d": [ { "type": "histogram2d", "colorbar": { "ticks": "", "outlinewidth": 0 }, "autocolorscale": true } ], "scatterpolar": [ { "type": "scatterpolar", "marker": { "colorbar": { "ticks": "", "outlinewidth": 0 } } } ], "contourcarpet": [ { "type": "contourcarpet", "colorbar": { "ticks": "", "outlinewidth": 0 } } ], "scattercarpet": [ { "type": "scattercarpet", "marker": { "colorbar": { "ticks": "", "outlinewidth": 0 } } } ], "scattermapbox": [ { "type": "scattermapbox", "marker": { "colorbar": { "ticks": "", "outlinewidth": 0 } } } ], "scatterpolargl": [ { "type": "scatterpolargl", "marker": { "colorbar": { "ticks": "", "outlinewidth": 0 } } } ], "scatterternary": [ { "type": "scatterternary", "marker": { "colorbar": { "ticks": "", "outlinewidth": 0 } } } ], "histogram2dcontour": [ { "type": "histogram2dcontour", "colorbar": { "ticks": "", "outlinewidth": 0 }, "autocolorscale": true } ] }, "layout": { "geo": { "bgcolor": "white", "showland": true, "lakecolor": "white", "landcolor": "white", "showlakes": true, "subunitcolor": "#C8D4E3" }, "font": { "color": "#2a3f5f" }, "polar": { "bgcolor": "white", "radialaxis": { "ticks": "", "gridcolor": "#EBF0F8", "linecolor": "#EBF0F8" }, "angularaxis": { "ticks": "", "gridcolor": "#EBF0F8", "linecolor": "#EBF0F8" } }, "scene": { "xaxis": { "ticks": "", "gridcolor": "#DFE8F3", "gridwidth": 2, "linecolor": "#EBF0F8", "zerolinecolor": "#EBF0F8", "showbackground": true, "backgroundcolor": "white" }, "yaxis": { "ticks": "", "gridcolor": "#DFE8F3", "gridwidth": 2, "linecolor": "#EBF0F8", "zerolinecolor": "#EBF0F8", "showbackground": true, "backgroundcolor": "white" }, "zaxis": { "ticks": "", "gridcolor": "#DFE8F3", "gridwidth": 2, "linecolor": "#EBF0F8", "zerolinecolor": "#EBF0F8", "showbackground": true, "backgroundcolor": "white" } }, "title": { "x": 0.05 }, "xaxis": { "ticks": "", "gridcolor": "#EBF0F8", "linecolor": "#EBF0F8", "automargin": true, "zerolinecolor": "#EBF0F8", "zerolinewidth": 2 }, "yaxis": { "ticks": "", "gridcolor": "#EBF0F8", "linecolor": "#EBF0F8", "automargin": true, "zerolinecolor": "#EBF0F8", "zerolinewidth": 2 }, "ternary": { "aaxis": { "ticks": "", "gridcolor": "#DFE8F3", "linecolor": "#A2B1C6" }, "baxis": { "ticks": "", "gridcolor": "#DFE8F3", "linecolor": "#A2B1C6" }, "caxis": { "ticks": "", "gridcolor": "#DFE8F3", "linecolor": "#A2B1C6" }, "bgcolor": "white" }, "colorway": [ "#636efa", "#EF553B", "#00cc96", "#ab63fa", "#19d3f3", "#e763fa", "#fecb52", "#ffa15a", "#ff6692", "#b6e880" ], "hovermode": "closest", "colorscale": { "diverging": [ [ 0, "#8e0152" ], [ 0.1, "#c51b7d" ], [ 0.2, "#de77ae" ], [ 0.3, "#f1b6da" ], [ 0.4, "#fde0ef" ], [ 0.5, "#f7f7f7" ], [ 0.6, "#e6f5d0" ], [ 0.7, "#b8e186" ], [ 0.8, "#7fbc41" ], [ 0.9, "#4d9221" ], [ 1, "#276419" ] ], "sequential": [ [ 0, "#0508b8" ], [ 0.0893854748603352, "#1910d8" ], [ 0.1787709497206704, "#3c19f0" ], [ 0.2681564245810056, "#6b1cfb" ], [ 0.3575418994413408, "#981cfd" ], [ 0.44692737430167595, "#bf1cfd" ], [ 0.5363128491620112, "#dd2bfd" ], [ 0.6256983240223464, "#f246fe" ], [ 0.7150837988826816, "#fc67fd" ], [ 0.8044692737430168, "#fe88fc" ], [ 0.8938547486033519, "#fea5fd" ], [ 0.9832402234636871, "#febefe" ], [ 1, "#fec3fe" ] ], "sequentialminus": [ [ 0, "#0508b8" ], [ 0.0893854748603352, "#1910d8" ], [ 0.1787709497206704, "#3c19f0" ], [ 0.2681564245810056, "#6b1cfb" ], [ 0.3575418994413408, "#981cfd" ], [ 0.44692737430167595, "#bf1cfd" ], [ 0.5363128491620112, "#dd2bfd" ], [ 0.6256983240223464, "#f246fe" ], [ 0.7150837988826816, "#fc67fd" ], [ 0.8044692737430168, "#fe88fc" ], [ 0.8938547486033519, "#fea5fd" ], [ 0.9832402234636871, "#febefe" ], [ 1, "#fec3fe" ] ] }, "plot_bgcolor": "white", "paper_bgcolor": "white", "shapedefaults": { "line": { "width": 0 }, "opacity": 0.4, "fillcolor": "#506784" }, "annotationdefaults": { "arrowhead": 0, "arrowcolor": "#506784", "arrowwidth": 1 } }, "themeRef": "PLOTLY_WHITE" } } }, "height": null, "width": null, "user": { "profile_url": "https://chart-studio.plotly.com/~554488", "avatar_url": "https://storage.googleapis.com/plotly-prod-profiles/61.jpg", "background_url": "https://storage.googleapis.com/plotly-prod-profiles/bg-7.jpg", "bio": "", "nickname": "", "website": "", "stream_tokens": null, "feature_set_id": null, "csrf_token": null, "date_joined": "2021-10-07 21:07:21", "mapbox_access_tokens": null, "has_password": null, "username": "554488", "email": null, "is_active": null, "readonly": null, "is_dash_creator": null, "dash_created_count": null, "is_chart_creator": null, "charts_created_count": null } }, { "creation_time": "2024-04-03T22:48:06.926937Z", "comments": { "results": [], "count": 0 }, "parented": true, "embed_url": "https://chart-studio.plotly.com/~DORITOS12/48.embed", "fid": "DORITOS12:48", "filename": "rotacion agropecuaria en conjunto_RESERVA", "filetype": "plot", "img_url": "https://storage.googleapis.com/plotly-prod-images/DORITOS12/48/9_IF8OVQM8SMAB9Z58B40SFQAVE92F9S.png", "image_urls": { "default": "https://storage.googleapis.com/plotly-prod-images/DORITOS12/48/2_PEAHZV0093M9838R4DY9UJW9F1KMVL.png", "block-thumb": "https://storage.googleapis.com/plotly-prod-images/DORITOS12/48/8_AW511UH3C0LGV5YYNYN51EBRIS964M.png", "list-thumb": "https://storage.googleapis.com/plotly-prod-images/DORITOS12/48/9_IF8OVQM8SMAB9Z58B40SFQAVE92F9S.png" }, "api_urls": { "files": "https://api.plotly.com/v2/files/DORITOS12:48", "plots": "https://api.plotly.com/v2/plots/DORITOS12:48", "parent": "https://api.plotly.com/v2/folders/home?user=DORITOS12" }, "owner": "DORITOS12", "parent": -1, "preview": "", "referencers": [], "references": [], "title": "", "views": 1, "web_url": "https://chart-studio.plotly.com/~DORITOS12/48/", "world_readable": true, "date_modified": "2024-04-17T21:53:04.211Z", "stars": { "results": [], "count": 0 }, "collaborators": { "results": [], "count": 0 }, "subfolder_count": null, "refresh_interval": null, "organize_view_url": "https://chart-studio.plotly.com/~DORITOS12/48/", "current_user_permission": "read", "is_theme": null, "is_template": false, "autosize": true, "caption": "", "figure": { "data": [ { "line": { "color": "rgb(76, 114, 176)" }, "meta": { "columnNames": { "x": "month", "y": "Humedad relativa 2000", "text": "" } }, "mode": "lines", "name": "hr 2000", "type": "scatter", "xsrc": "DORITOS12:43:9bdd4c", "ysrc": "DORITOS12:43:397a83", "hoverinfo": "x+y+name", "hoverlabel": { "align": "auto" }, "connectgaps": false, "hovertemplate": "" }, { "line": { "color": "rgb(221, 132, 82)" }, "meta": { "columnNames": { "x": "month", "y": "Humedad relativa 2018" } }, "mode": "lines", "name": "hr 2018", "type": "scatter", "xsrc": "DORITOS12:43:9bdd4c", "ysrc": "DORITOS12:43:d027f5", "stackgroup": null }, { "line": { "color": "rgb(76, 114, 176)" }, "meta": { "columnNames": { "x": "month", "y": "Velocidad del Viento 2000" } }, "mode": "lines", "name": "WS 2000", "type": "scatter", "xsrc": "DORITOS12:43:9bdd4c", "ysrc": "DORITOS12:43:7f9265", "xaxis": "x2", "yaxis": "y2", "stackgroup": null }, { "line": { "color": "rgb(221, 132, 82)" }, "meta": { "columnNames": { "x": "month", "y": "Velocidad del Viento 2018" } }, "mode": "lines", "name": "WS2018", "type": "scatter", "xsrc": "DORITOS12:43:9bdd4c", "ysrc": "DORITOS12:43:4a3c64", "xaxis": "x2", "yaxis": "y2", "stackgroup": null }, { "line": { "color": "rgb(76, 114, 176)" }, "meta": { "columnNames": { "x": "month", "y": "T máxima 2000" } }, "mode": "lines", "name": "TMAXX 2000", "type": "scatter", "xsrc": "DORITOS12:43:9bdd4c", "ysrc": "DORITOS12:43:d61b2f", "xaxis": "x3", "yaxis": "y3", "stackgroup": null }, { "line": { "color": "rgb(221, 132, 82)" }, "meta": { "columnNames": { "x": "month", "y": "T máxima 2018" } }, "mode": "lines", "name": "TMAXX 2018", "type": "scatter", "xsrc": "DORITOS12:43:9bdd4c", "ysrc": "DORITOS12:43:53dc9d", "xaxis": "x3", "yaxis": "y3", "stackgroup": null }, { "line": { "color": "rgb(76, 114, 176)" }, "meta": { "columnNames": { "x": "month", "y": "T media 2000" } }, "mode": "lines", "name": "T media 2000", "type": "scatter", "xsrc": "DORITOS12:43:9bdd4c", "ysrc": "DORITOS12:43:f567c1", "xaxis": "x4", "yaxis": "y4", "stackgroup": null }, { "line": { "color": "rgb(221, 132, 82)" }, "meta": { "columnNames": { "x": "month", "y": "T media 2018" } }, "mode": "lines", "name": "T. media 2018", "type": "scatter", "xsrc": "DORITOS12:43:9bdd4c", "ysrc": "DORITOS12:43:454ce3", "xaxis": "x4", "yaxis": "y4", "stackgroup": null }, { "line": { "color": "rgb(76, 114, 176)" }, "meta": { "columnNames": { "x": "month", "y": "NDVI 2000" } }, "mode": "lines", "name": "NDVI 2000", "type": "scatter", "xsrc": "DORITOS12:43:9bdd4c", "ysrc": "DORITOS12:43:64df78", "xaxis": "x5", "yaxis": "y5" }, { "line": { "color": "rgb(76, 114, 176)" }, "meta": { "columnNames": { "x": "month", "y": "T mínima 2000" } }, "mode": "lines", "name": "t min 2000", "type": "scatter", "xsrc": "DORITOS12:43:9bdd4c", "ysrc": "DORITOS12:43:31eaf5", "xaxis": "x6", "yaxis": "y6", "stackgroup": null }, { "line": { "color": "rgb(221, 132, 82)" }, "meta": { "columnNames": { "x": "month", "y": "NDVI 2018" } }, "mode": "lines", "name": "NDVI 2018", "type": "scatter", "xsrc": "DORITOS12:43:9bdd4c", "ysrc": "DORITOS12:43:f86d13", "xaxis": "x5", "yaxis": "y5", "stackgroup": null }, { "line": { "color": "rgb(221, 132, 82)" }, "meta": { "columnNames": { "x": "month", "y": "T mínima 2018" } }, "mode": "lines", "name": " 2018 t min", "type": "scatter", "xsrc": "DORITOS12:43:9bdd4c", "ysrc": "DORITOS12:43:979938", "xaxis": "x6", "yaxis": "y6", "stackgroup": null }, { "line": { "color": "rgb(76, 114, 176)" }, "meta": { "columnNames": { "x": "month", "y": "Albedo NIR 2000" } }, "mode": "lines", "name": "2000 NIR", "type": "scatter", "xsrc": "DORITOS12:43:9bdd4c", "ysrc": "DORITOS12:43:bed04c", "xaxis": "x7", "yaxis": "y7", "stackgroup": null }, { "line": { "color": "rgb(221, 132, 82)" }, "meta": { "columnNames": { "x": "month", "y": "Albedo NIR 2018" } }, "mode": "lines", "name": "NIR 2018", "type": "scatter", "xsrc": "DORITOS12:43:9bdd4c", "ysrc": "DORITOS12:43:d16e73", "xaxis": "x7", "yaxis": "y7", "stackgroup": null }, { "line": { "color": "rgb(76, 114, 176)" }, "meta": { "columnNames": { "x": "month", "y": "Albedo VIS 2000" } }, "mode": "lines", "name": "VIS 2000", "type": "scatter", "xsrc": "DORITOS12:43:9bdd4c", "ysrc": "DORITOS12:43:4630cc", "xaxis": "x8", "yaxis": "y8", "stackgroup": null }, { "line": { "color": "rgb(221, 132, 82)" }, "meta": { "columnNames": { "x": "month", "y": "Albedo VIS 2018" } }, "mode": "lines", "name": "VIS 2018", "type": "scatter", "xsrc": "DORITOS12:43:9bdd4c", "ysrc": "DORITOS12:43:6d0ef8", "xaxis": "x8", "yaxis": "y8", "stackgroup": null } ], "frames": [], "layout": { "title": { "x": 0.5, "font": { "color": "rgb(22, 22, 22)" }, "text": "Rotación agropecuaria" }, "xaxis": { "side": "bottom", "type": "linear", "range": [ 1, 12 ], "ticks": "", "title": { "text": "<br>" }, "domain": [ 0, 0.49 ], "showgrid": true, "showline": false, "tickmode": "auto", "zeroline": true, "autorange": false, "automargin": true, "fixedrange": false, "showspikes": false, "rangeslider": { "range": [ 1, 12 ], "yaxis": {}, "yaxis2": {}, "visible": false, "autorange": true }, "showticklabels": false }, "yaxis": { "type": "linear", "range": [ 57, 78 ], "ticks": "outside", "title": { "text": "HR (%)" }, "domain": [ 0.78, 1 ], "autorange": false, "fixedrange": false }, "legend": { "x": 0, "y": -0.15999999999999992, "title": { "text": "<br>" }, "valign": "middle", "xanchor": "auto", "itemsizing": "trace", "traceorder": "reversed", "orientation": "h" }, "margin": { "b": 88, "l": 55, "r": 25, "t": 31, "pad": 0 }, "xaxis2": { "side": "bottom", "type": "linear", "range": [ 1, 12 ], "ticks": "", "title": { "text": "<br>" }, "anchor": "free", "domain": [ 0, 0.5 ], "showline": false, "autorange": true, "fixedrange": false, "overlaying": "x", "showticklabels": false }, "xaxis3": { "side": "top", "type": "linear", "range": [ 1, 12 ], "ticks": "", "title": { "text": "" }, "anchor": "y3", "domain": [ 0.5, 0.96 ], "showgrid": true, "showline": false, "autorange": true, "fixedrange": false, "overlaying": "x2", "showticklabels": false }, "xaxis4": { "side": "bottom", "type": "linear", "range": [ 1, 12 ], "ticks": "", "title": { "text": "<br>" }, "anchor": "y4", "domain": [ 0.5, 0.96 ], "autorange": true, "overlaying": "x3", "showspikes": false, "showticklabels": false }, "xaxis5": { "side": "bottom", "type": "linear", "range": [ 1, 12 ], "ticks": "", "title": { "text": "" }, "anchor": "y5", "domain": [ 0, 0.49 ], "showline": false, "autorange": true, "overlaying": "x4", "showticklabels": false }, "xaxis6": { "side": "bottom", "type": "linear", "range": [ 1, 12 ], "ticks": "", "title": { "text": "" }, "anchor": "y6", "domain": [ 0.5, 0.96 ], "showline": false, "autorange": true, "overlaying": "x5", "showticklabels": false }, "xaxis7": { "side": "bottom", "type": "linear", "range": [ 1, 12 ], "ticks": "outside", "title": { "text": "mes" }, "anchor": "y7", "domain": [ 0, 0.49 ], "autorange": true, "overlaying": "x6", "showticklabels": true }, "xaxis8": { "side": "bottom", "type": "linear", "range": [ 1, 12 ], "ticks": "outside", "title": { "text": "mes" }, "anchor": "y8", "domain": [ 0.5, 0.96 ], "autorange": true, "overlaying": "x7", "showticklabels": true }, "yaxis2": { "side": "left", "type": "linear", "range": [ 0.5, 5.5 ], "ticks": "outside", "title": { "text": "WS (m/s)" }, "anchor": "x", "domain": [ 0.53, 0.75 ], "autorange": false, "overlaying": false }, "yaxis3": { "side": "right", "type": "linear", "range": [ 27.5, 31 ], "ticks": "outside", "title": { "text": "T. max (°C)" }, "anchor": "x3", "domain": [ 0.78, 1 ], "mirror": false, "showgrid": true, "showline": true, "zeroline": true, "autorange": false, "automargin": true, "overlaying": false, "zerolinewidth": 1, "showticklabels": true, "separatethousands": false }, "yaxis4": { "side": "right", "type": "linear", "range": [ 27.5, 31 ], "ticks": "outside", "title": { "text": "T. media (°C)" }, "anchor": "x4", "domain": [ 0.53, 0.75 ], "autorange": false, "overlaying": false }, "yaxis5": { "side": "left", "type": "linear", "range": [ 0.02, 0.9 ], "ticks": "outside", "title": { "text": "NDVI" }, "anchor": "x5", "domain": [ 0.26, 0.5 ], "autorange": false, "overlaying": false }, "yaxis6": { "side": "right", "type": "linear", "range": [ 27.5, 31 ], "ticks": "outside", "title": { "text": "T. min (°C)" }, "anchor": "x6", "domain": [ 0.26, 0.5 ], "autorange": false, "overlaying": false }, "yaxis7": { "side": "left", "type": "linear", "range": [ 0.1, 0.3 ], "ticks": "outside", "title": { "text": "NIR" }, "anchor": "x7", "domain": [ 0.01, 0.23 ], "autorange": false, "overlaying": false }, "yaxis8": { "side": "right", "type": "linear", "range": [ 0.02, 0.08 ], "ticks": "outside", "title": { "text": "VIS" }, "anchor": "x8", "domain": [ 0.01, 0.23 ], "autorange": false, "overlaying": false }, "modebar": { "color": "rgba(252, 250, 250, 0.3)", "activecolor": "rgba(253, 251, 251, 0.7)" }, "autosize": true, "template": { "data": { "bar": [ { "type": "bar", "marker": { "colorbar": { "ticks": "", "outlinewidth": 0 } } } ], "table": [ { "type": "table", "cells": { "fill": { "color": "#EBF0F8" }, "line": { "color": "white" } }, "header": { "fill": { "color": "#C8D4E3" }, "line": { "color": "white" } } } ], "carpet": [ { "type": "carpet", "aaxis": { "gridcolor": "white", "linecolor": "white", "endlinecolor": "#2a3f5f", "minorgridcolor": "white", "startlinecolor": "#2a3f5f" }, "baxis": { "gridcolor": "white", "linecolor": "white", "endlinecolor": "#2a3f5f", "minorgridcolor": "white", "startlinecolor": "#2a3f5f" } } ], "mesh3d": [ { "type": "mesh3d", "colorbar": { "ticks": "", "outlinewidth": 0 } } ], "contour": [ { "type": "contour", "colorbar": { "ticks": "", "outlinewidth": 0 }, "autocolorscale": true } ], "heatmap": [ { "type": "heatmap", "colorbar": { "ticks": "", "outlinewidth": 0 }, "autocolorscale": true } ], "scatter": [ { "type": "scatter", "marker": { "colorbar": { "ticks": "", "outlinewidth": 0 } } } ], "surface": [ { "type": "surface", "colorbar": { "ticks": "", "outlinewidth": 0 } } ], "heatmapgl": [ { "type": "heatmapgl", "colorbar": { "ticks": "", "outlinewidth": 0 } } ], "histogram": [ { "type": "histogram", "marker": { "colorbar": { "ticks": "", "outlinewidth": 0 } } } ], "parcoords": [ { "line": { "colorbar": { "ticks": "", "outlinewidth": 0 } }, "type": "parcoords" } ], "scatter3d": [ { "type": "scatter3d", "marker": { "colorbar": { "ticks": "", "outlinewidth": 0 } } } ], "scattergl": [ { "type": "scattergl", "marker": { "colorbar": { "ticks": "", "outlinewidth": 0 } } } ], "choropleth": [ { "type": "choropleth", "colorbar": { "ticks": "", "outlinewidth": 0 } } ], "scattergeo": [ { "type": "scattergeo", "marker": { "colorbar": { "ticks": "", "outlinewidth": 0 } } } ], "histogram2d": [ { "type": "histogram2d", "colorbar": { "ticks": "", "outlinewidth": 0 }, "autocolorscale": true } ], "scatterpolar": [ { "type": "scatterpolar", "marker": { "colorbar": { "ticks": "", "outlinewidth": 0 } } } ], "contourcarpet": [ { "type": "contourcarpet", "colorbar": { "ticks": "", "outlinewidth": 0 } } ], "scattercarpet": [ { "type": "scattercarpet", "marker": { "colorbar": { "ticks": "", "outlinewidth": 0 } } } ], "scattermapbox": [ { "type": "scattermapbox", "marker": { "colorbar": { "ticks": "", "outlinewidth": 0 } } } ], "scatterpolargl": [ { "type": "scatterpolargl", "marker": { "colorbar": { "ticks": "", "outlinewidth": 0 } } } ], "scatterternary": [ { "type": "scatterternary", "marker": { "colorbar": { "ticks": "", "outlinewidth": 0 } } } ], "histogram2dcontour": [ { "type": "histogram2dcontour", "colorbar": { "ticks": "", "outlinewidth": 0 }, "autocolorscale": true } ] }, "layout": { "geo": { "bgcolor": "white", "showland": true, "lakecolor": "white", "landcolor": "#E5ECF6", "showlakes": true, "subunitcolor": "white" }, "font": { "color": "#2a3f5f" }, "polar": { "bgcolor": "#E5ECF6", "radialaxis": { "ticks": "", "gridcolor": "white", "linecolor": "white" }, "angularaxis": { "ticks": "", "gridcolor": "white", "linecolor": "white" } }, "scene": { "xaxis": { "ticks": "", "gridcolor": "white", "gridwidth": 2, "linecolor": "white", "zerolinecolor": "white", "showbackground": true, "backgroundcolor": "#E5ECF6" }, "yaxis": { "ticks": "", "gridcolor": "white", "gridwidth": 2, "linecolor": "white", "zerolinecolor": "white", "showbackground": true, "backgroundcolor": "#E5ECF6" }, "zaxis": { "ticks": "", "gridcolor": "white", "gridwidth": 2, "linecolor": "white", "zerolinecolor": "white", "showbackground": true, "backgroundcolor": "#E5ECF6" } }, "title": { "x": 0.05 }, "xaxis": { "ticks": "", "gridcolor": "white", "linecolor": "white", "automargin": true, "zerolinecolor": "white", "zerolinewidth": 2 }, "yaxis": { "ticks": "", "gridcolor": "white", "linecolor": "white", "automargin": true, "zerolinecolor": "white", "zerolinewidth": 2 }, "ternary": { "aaxis": { "ticks": "", "gridcolor": "white", "linecolor": "white" }, "baxis": { "ticks": "", "gridcolor": "white", "linecolor": "white" }, "caxis": { "ticks": "", "gridcolor": "white", "linecolor": "white" }, "bgcolor": "#E5ECF6" }, "colorway": [ "#636efa", "#EF553B", "#00cc96", "#ab63fa", "#19d3f3", "#e763fa", "#fecb52", "#ffa15a", "#ff6692", "#b6e880" ], "hovermode": "closest", "colorscale": { "diverging": [ [ 0, "#8e0152" ], [ 0.1, "#c51b7d" ], [ 0.2, "#de77ae" ], [ 0.3, "#f1b6da" ], [ 0.4, "#fde0ef" ], [ 0.5, "#f7f7f7" ], [ 0.6, "#e6f5d0" ], [ 0.7, "#b8e186" ], [ 0.8, "#7fbc41" ], [ 0.9, "#4d9221" ], [ 1, "#276419" ] ], "sequential": [ [ 0, "#0508b8" ], [ 0.0893854748603352, "#1910d8" ], [ 0.1787709497206704, "#3c19f0" ], [ 0.2681564245810056, "#6b1cfb" ], [ 0.3575418994413408, "#981cfd" ], [ 0.44692737430167595, "#bf1cfd" ], [ 0.5363128491620112, "#dd2bfd" ], [ 0.6256983240223464, "#f246fe" ], [ 0.7150837988826816, "#fc67fd" ], [ 0.8044692737430168, "#fe88fc" ], [ 0.8938547486033519, "#fea5fd" ], [ 0.9832402234636871, "#febefe" ], [ 1, "#fec3fe" ] ], "sequentialminus": [ [ 0, "#0508b8" ], [ 0.0893854748603352, "#1910d8" ], [ 0.1787709497206704, "#3c19f0" ], [ 0.2681564245810056, "#6b1cfb" ], [ 0.3575418994413408, "#981cfd" ], [ 0.44692737430167595, "#bf1cfd" ], [ 0.5363128491620112, "#dd2bfd" ], [ 0.6256983240223464, "#f246fe" ], [ 0.7150837988826816, "#fc67fd" ], [ 0.8044692737430168, "#fe88fc" ], [ 0.8938547486033519, "#fea5fd" ], [ 0.9832402234636871, "#febefe" ], [ 1, "#fec3fe" ] ] }, "plot_bgcolor": "#E5ECF6", "paper_bgcolor": "white", "shapedefaults": { "line": { "width": 0 }, "opacity": 0.4, "fillcolor": "#506784" }, "annotationdefaults": { "arrowhead": 0, "arrowcolor": "#506784", "arrowwidth": 1 } }, "themeRef": "PLOTLY_GRAY" }, "hovermode": "x", "hoverlabel": { "align": "auto", "bgcolor": "#FFF", "bordercolor": "rgb(238, 238, 238)" }, "showlegend": true, "annotations": [ { "x": 11.5, "y": 75, "font": { "family": "Arial" }, "text": "a)", "xref": "x", "axref": "x", "xanchor": "auto", "yanchor": "auto", "showarrow": false }, { "x": 1.5, "y": 30.5, "text": "b)", "xref": "x3", "yref": "y3", "axref": "x3", "ayref": "y3", "xanchor": "auto", "yanchor": "auto", "showarrow": false }, { "x": 11.5, "y": 5, "text": "c)", "xref": "x2", "yref": "y2", "axref": "x2", "ayref": "y2", "showarrow": false }, { "x": 1.5, "y": 30.6, "text": "d)", "xref": "x4", "yref": "y4", "ayref": "y4", "showarrow": false }, { "x": 11.5, "y": 0.8, "text": "e)", "xref": "x5", "yref": "y5", "ayref": "y5", "showarrow": false }, { "x": 1.5, "y": 30.6, "text": "f)", "xref": "x6", "yref": "y6", "axref": "x6", "ayref": "y6", "showarrow": false }, { "x": 11.5, "y": 0.27, "text": "g)", "xref": "x7", "yref": "y7", "axref": "x7", "ayref": "y7", "showarrow": false }, { "x": 1.5, "y": 0.071, "text": "h)", "xref": "x8", "yref": "y8", "axref": "x8", "ayref": "y8", "showarrow": false } ] } }, "height": null, "width": null, "user": { "profile_url": "https://chart-studio.plotly.com/~DORITOS12", "avatar_url": "https://storage.googleapis.com/plotly-prod-profiles/50.jpg", "background_url": "https://storage.googleapis.com/plotly-prod-profiles/bg-2.jpg", "bio": "", "nickname": "", "website": "", "stream_tokens": null, "feature_set_id": null, "csrf_token": null, "date_joined": "2024-02-24 22:37:07", "mapbox_access_tokens": null, "has_password": null, "username": "DORITOS12", "email": null, "is_active": null, "readonly": null, "is_dash_creator": null, "dash_created_count": null, "is_chart_creator": null, "charts_created_count": null } }, { "creation_time": "2024-04-03T22:40:18.385689Z", "comments": { "results": [], "count": 0 }, "parented": true, "embed_url": "https://chart-studio.plotly.com/~fwgepfl/68.embed", "fid": "fwgepfl:68", "filename": "glider_trajectory_nn", "filetype": "plot", "img_url": "https://storage.googleapis.com/plotly-prod-images/fwgepfl/68/9_8KFPQ0HBJ3JP3HRFEOBYKUBBIF600U.png", "image_urls": { "default": "https://storage.googleapis.com/plotly-prod-images/fwgepfl/68/2_JA7XGM6DYI0TKE0461FGP6BWDAHU2M.png", "block-thumb": "https://storage.googleapis.com/plotly-prod-images/fwgepfl/68/8_0AHTXG2ZCU64XJMC8741AZKPO953GA.png", "list-thumb": "https://storage.googleapis.com/plotly-prod-images/fwgepfl/68/9_8KFPQ0HBJ3JP3HRFEOBYKUBBIF600U.png" }, "api_urls": { "files": "https://api.plotly.com/v2/files/fwgepfl:68", "plots": "https://api.plotly.com/v2/plots/fwgepfl:68", "parent": "https://api.plotly.com/v2/folders/home?user=fwgepfl" }, "owner": "fwgepfl", "parent": -1, "preview": "", "referencers": [], "references": [], "title": "", "views": 2, "web_url": "https://chart-studio.plotly.com/~fwgepfl/68/", "world_readable": true, "date_modified": "2024-04-08T06:50:11.781Z", "stars": { "results": [], "count": 0 }, "collaborators": { "results": [], "count": 0 }, "subfolder_count": null, "refresh_interval": null, "organize_view_url": "https://chart-studio.plotly.com/~fwgepfl/68/", "current_user_permission": "read", "is_theme": null, "is_template": null, "autosize": true, "caption": "", "figure": { "data": [ { "mode": "markers", "name": "Goals", "type": "scatter3d", "xsrc": "fwgepfl:71:4909bf", "ysrc": "fwgepfl:71:9d4723", "zsrc": "fwgepfl:71:864ab4", "marker": { "size": 5, "color": "rgb(36, 121, 108)" }, "opacity": 0.8 }, { "mode": "markers", "name": "Start", "type": "scatter3d", "xsrc": "fwgepfl:71:37f635", "ysrc": "fwgepfl:71:e6a915", "zsrc": "fwgepfl:71:cc27c7", "marker": { "size": 5, "color": "rgb(82, 188, 163)" }, "opacity": 0.8 }, { "isrc": "fwgepfl:71:b68485", "jsrc": "fwgepfl:71:985264", "ksrc": "fwgepfl:71:8171c8", "type": "mesh3d", "xsrc": "fwgepfl:71:b07dd8", "ysrc": "fwgepfl:71:98e84d", "zsrc": "fwgepfl:71:912a25", "color": "#DC3912", "opacity": 1.0 }, { "isrc": "fwgepfl:71:fd0724", "jsrc": "fwgepfl:71:58610d", "ksrc": "fwgepfl:71:672077", "type": "mesh3d", "xsrc": "fwgepfl:71:5f0097", "ysrc": "fwgepfl:71:feacee", "zsrc": "fwgepfl:71:15b39e", "color": "#DC3912", "opacity": 1.0 }, { "isrc": "fwgepfl:71:96b232", "jsrc": "fwgepfl:71:bfffe7", "ksrc": "fwgepfl:71:824b73", "type": "mesh3d", "xsrc": "fwgepfl:71:413bb0", "ysrc": "fwgepfl:71:1cf55d", "zsrc": "fwgepfl:71:691248", "color": "#DC3912", "opacity": 1.0 }, { "isrc": "fwgepfl:71:c38dc9", "jsrc": "fwgepfl:71:34b7f8", "ksrc": "fwgepfl:71:d51ceb", "type": "mesh3d", "xsrc": "fwgepfl:71:579bbd", "ysrc": "fwgepfl:71:c47825", "zsrc": "fwgepfl:71:8afd85", "color": "#DC3912", "opacity": 1.0 }, { "isrc": "fwgepfl:71:733cb1", "jsrc": "fwgepfl:71:7f8fe9", "ksrc": "fwgepfl:71:edd8b3", "type": "mesh3d", "xsrc": "fwgepfl:71:420f11", "ysrc": "fwgepfl:71:c12531", "zsrc": "fwgepfl:71:366525", "color": "#DC3912", "opacity": 1.0 }, { "isrc": "fwgepfl:71:527aa6", "jsrc": "fwgepfl:71:216522", "ksrc": "fwgepfl:71:13bd8d", "type": "mesh3d", "xsrc": "fwgepfl:71:a25088", "ysrc": "fwgepfl:71:8838eb", "zsrc": "fwgepfl:71:d0c33f", "color": "#DC3912", "opacity": 1.0 }, { "isrc": "fwgepfl:71:b5d716", "jsrc": "fwgepfl:71:756014", "ksrc": "fwgepfl:71:b1dfe3", "type": "mesh3d", "xsrc": "fwgepfl:71:15b9dc", "ysrc": "fwgepfl:71:f8d38d", "zsrc": "fwgepfl:71:1bc7a0", "color": "#DC3912", "opacity": 1.0 }, { "isrc": "fwgepfl:71:a1338a", "jsrc": "fwgepfl:71:8e984f", "ksrc": "fwgepfl:71:05a1bc", "type": "mesh3d", "xsrc": "fwgepfl:71:2fb266", "ysrc": "fwgepfl:71:56260f", "zsrc": "fwgepfl:71:ea8ea6", "color": "#DC3912", "opacity": 1.0 }, { "isrc": "fwgepfl:71:0b1eda", "jsrc": "fwgepfl:71:08168f", "ksrc": "fwgepfl:71:e7acfc", "type": "mesh3d", "xsrc": "fwgepfl:71:01ad20", "ysrc": "fwgepfl:71:e2302b", "zsrc": "fwgepfl:71:bce570", "color": "#DC3912", "opacity": 1.0 }, { "isrc": "fwgepfl:71:3b9f14", "jsrc": "fwgepfl:71:b4bcf2", "ksrc": "fwgepfl:71:c42b48", "type": "mesh3d", "xsrc": "fwgepfl:71:eba53a", "ysrc": "fwgepfl:71:75f805", "zsrc": "fwgepfl:71:4a80fc", "color": "#DC3912", "opacity": 1.0 }, { "isrc": "fwgepfl:71:3f3a06", "jsrc": "fwgepfl:71:54b87c", "ksrc": "fwgepfl:71:da0c65", "type": "mesh3d", "xsrc": "fwgepfl:71:5837df", "ysrc": "fwgepfl:71:764b6f", "zsrc": "fwgepfl:71:84d63c", "color": "#DC3912", "opacity": 1.0 }, { "line": { "color": "#DC3912", "width": 10 }, "mode": "lines", "type": "scatter3d", "xsrc": "fwgepfl:71:64df36", "ysrc": "fwgepfl:71:eef4b3", "zsrc": "fwgepfl:71:547e19", "opacity": 0.8, "showlegend": false }, { "line": { "color": "#DC3912", "width": 10 }, "mode": "lines", "type": "scatter3d", "xsrc": "fwgepfl:71:0080fe", "ysrc": "fwgepfl:71:a63e59", "zsrc": "fwgepfl:71:ddf5b0", "opacity": 0.8, "showlegend": false }, { "line": { "color": "rgb(93, 105, 177)", "width": 2 }, "mode": "lines", "name": "Trajectory", "type": "scatter3d", "xsrc": "fwgepfl:71:d70430", "ysrc": "fwgepfl:71:f61673", "zsrc": "fwgepfl:71:eb089a", "opacity": 0.8 } ], "layout": { "scene": { "xaxis": { "gridcolor": "#54A24B", "showbackground": false }, "yaxis": { "gridcolor": "#54A24B", "showbackground": false }, "zaxis": { "range": [ 8.083022311376878, -34.32893405043984 ], "autorange": false, "showbackground": true, "backgroundcolor": "#54A24B" }, "aspectmode": "data" }, "title": { "text": "Glider Trajectory" }, "template": { "data": { "bar": [ { "type": "bar", "marker": { "line": { "color": "#E5ECF6", "width": 0.5 }, "pattern": { "size": 10, "fillmode": "overlay", "solidity": 0.2 } }, "error_x": { "color": "#2a3f5f" }, "error_y": { "color": "#2a3f5f" } } ], "pie": [ { "type": "pie", "automargin": true } ], "table": [ { "type": "table", "cells": { "fill": { "color": "#EBF0F8" }, "line": { "color": "white" } }, "header": { "fill": { "color": "#C8D4E3" }, "line": { "color": "white" } } } ], "carpet": [ { "type": "carpet", "aaxis": { "gridcolor": "white", "linecolor": "white", "endlinecolor": "#2a3f5f", "minorgridcolor": "white", "startlinecolor": "#2a3f5f" }, "baxis": { "gridcolor": "white", "linecolor": "white", "endlinecolor": "#2a3f5f", "minorgridcolor": "white", "startlinecolor": "#2a3f5f" } } ], "mesh3d": [ { "type": "mesh3d", "colorbar": { "ticks": "", "outlinewidth": 0 } } ], "contour": [ { "type": "contour", "colorbar": { "ticks": "", "outlinewidth": 0 }, "colorscale": [ [ 0.0, "#0d0887" ], [ 0.1111111111111111, "#46039f" ], [ 0.2222222222222222, "#7201a8" ], [ 0.3333333333333333, "#9c179e" ], [ 0.4444444444444444, "#bd3786" ], [ 0.5555555555555556, "#d8576b" ], [ 0.6666666666666666, "#ed7953" ], [ 0.7777777777777778, "#fb9f3a" ], [ 0.8888888888888888, "#fdca26" ], [ 1.0, "#f0f921" ] ] } ], "heatmap": [ { "type": "heatmap", "colorbar": { "ticks": "", "outlinewidth": 0 }, "colorscale": [ [ 0.0, "#0d0887" ], [ 0.1111111111111111, "#46039f" ], [ 0.2222222222222222, "#7201a8" ], [ 0.3333333333333333, "#9c179e" ], [ 0.4444444444444444, "#bd3786" ], [ 0.5555555555555556, "#d8576b" ], [ 0.6666666666666666, "#ed7953" ], [ 0.7777777777777778, "#fb9f3a" ], [ 0.8888888888888888, "#fdca26" ], [ 1.0, "#f0f921" ] ] } ], "scatter": [ { "type": "scatter", "fillpattern": { "size": 10, "fillmode": "overlay", "solidity": 0.2 } } ], "surface": [ { "type": "surface", "colorbar": { "ticks": "", "outlinewidth": 0 }, "colorscale": [ [ 0.0, "#0d0887" ], [ 0.1111111111111111, "#46039f" ], [ 0.2222222222222222, "#7201a8" ], [ 0.3333333333333333, "#9c179e" ], [ 0.4444444444444444, "#bd3786" ], [ 0.5555555555555556, "#d8576b" ], [ 0.6666666666666666, "#ed7953" ], [ 0.7777777777777778, "#fb9f3a" ], [ 0.8888888888888888, "#fdca26" ], [ 1.0, "#f0f921" ] ] } ], "barpolar": [ { "type": "barpolar", "marker": { "line": { "color": "#E5ECF6", "width": 0.5 }, "pattern": { "size": 10, "fillmode": "overlay", "solidity": 0.2 } } } ], "heatmapgl": [ { "type": "heatmapgl", "colorbar": { "ticks": "", "outlinewidth": 0 }, "colorscale": [ [ 0.0, "#0d0887" ], [ 0.1111111111111111, "#46039f" ], [ 0.2222222222222222, "#7201a8" ], [ 0.3333333333333333, "#9c179e" ], [ 0.4444444444444444, "#bd3786" ], [ 0.5555555555555556, "#d8576b" ], [ 0.6666666666666666, "#ed7953" ], [ 0.7777777777777778, "#fb9f3a" ], [ 0.8888888888888888, "#fdca26" ], [ 1.0, "#f0f921" ] ] } ], "histogram": [ { "type": "histogram", "marker": { "pattern": { "size": 10, "fillmode": "overlay", "solidity": 0.2 } } } ], "parcoords": [ { "line": { "colorbar": { "ticks": "", "outlinewidth": 0 } }, "type": "parcoords" } ], "scatter3d": [ { "line": { "colorbar": { "ticks": "", "outlinewidth": 0 } }, "type": "scatter3d", "marker": { "colorbar": { "ticks": "", "outlinewidth": 0 } } } ], "scattergl": [ { "type": "scattergl", "marker": { "colorbar": { "ticks": "", "outlinewidth": 0 } } } ], "choropleth": [ { "type": "choropleth", "colorbar": { "ticks": "", "outlinewidth": 0 } } ], "scattergeo": [ { "type": "scattergeo", "marker": { "colorbar": { "ticks": "", "outlinewidth": 0 } } } ], "histogram2d": [ { "type": "histogram2d", "colorbar": { "ticks": "", "outlinewidth": 0 }, "colorscale": [ [ 0.0, "#0d0887" ], [ 0.1111111111111111, "#46039f" ], [ 0.2222222222222222, "#7201a8" ], [ 0.3333333333333333, "#9c179e" ], [ 0.4444444444444444, "#bd3786" ], [ 0.5555555555555556, "#d8576b" ], [ 0.6666666666666666, "#ed7953" ], [ 0.7777777777777778, "#fb9f3a" ], [ 0.8888888888888888, "#fdca26" ], [ 1.0, "#f0f921" ] ] } ], "scatterpolar": [ { "type": "scatterpolar", "marker": { "colorbar": { "ticks": "", "outlinewidth": 0 } } } ], "contourcarpet": [ { "type": "contourcarpet", "colorbar": { "ticks": "", "outlinewidth": 0 } } ], "scattercarpet": [ { "type": "scattercarpet", "marker": { "colorbar": { "ticks": "", "outlinewidth": 0 } } } ], "scattermapbox": [ { "type": "scattermapbox", "marker": { "colorbar": { "ticks": "", "outlinewidth": 0 } } } ], "scatterpolargl": [ { "type": "scatterpolargl", "marker": { "colorbar": { "ticks": "", "outlinewidth": 0 } } } ], "scatterternary": [ { "type": "scatterternary", "marker": { "colorbar": { "ticks": "", "outlinewidth": 0 } } } ], "histogram2dcontour": [ { "type": "histogram2dcontour", "colorbar": { "ticks": "", "outlinewidth": 0 }, "colorscale": [ [ 0.0, "#0d0887" ], [ 0.1111111111111111, "#46039f" ], [ 0.2222222222222222, "#7201a8" ], [ 0.3333333333333333, "#9c179e" ], [ 0.4444444444444444, "#bd3786" ], [ 0.5555555555555556, "#d8576b" ], [ 0.6666666666666666, "#ed7953" ], [ 0.7777777777777778, "#fb9f3a" ], [ 0.8888888888888888, "#fdca26" ], [ 1.0, "#f0f921" ] ] } ] }, "layout": { "geo": { "bgcolor": "white", "showland": true, "lakecolor": "white", "landcolor": "#E5ECF6", "showlakes": true, "subunitcolor": "white" }, "font": { "color": "#2a3f5f" }, "polar": { "bgcolor": "#E5ECF6", "radialaxis": { "ticks": "", "gridcolor": "white", "linecolor": "white" }, "angularaxis": { "ticks": "", "gridcolor": "white", "linecolor": "white" } }, "scene": { "xaxis": { "ticks": "", "gridcolor": "white", "gridwidth": 2, "linecolor": "white", "zerolinecolor": "white", "showbackground": true, "backgroundcolor": "#E5ECF6" }, "yaxis": { "ticks": "", "gridcolor": "white", "gridwidth": 2, "linecolor": "white", "zerolinecolor": "white", "showbackground": true, "backgroundcolor": "#E5ECF6" }, "zaxis": { "ticks": "", "gridcolor": "white", "gridwidth": 2, "linecolor": "white", "zerolinecolor": "white", "showbackground": true, "backgroundcolor": "#E5ECF6" } }, "title": { "x": 0.05 }, "xaxis": { "ticks": "", "title": { "standoff": 15 }, "gridcolor": "white", "linecolor": "white", "automargin": true, "zerolinecolor": "white", "zerolinewidth": 2 }, "yaxis": { "ticks": "", "title": { "standoff": 15 }, "gridcolor": "white", "linecolor": "white", "automargin": true, "zerolinecolor": "white", "zerolinewidth": 2 }, "mapbox": { "style": "light" }, "ternary": { "aaxis": { "ticks": "", "gridcolor": "white", "linecolor": "white" }, "baxis": { "ticks": "", "gridcolor": "white", "linecolor": "white" }, "caxis": { "ticks": "", "gridcolor": "white", "linecolor": "white" }, "bgcolor": "#E5ECF6" }, "colorway": [ "#636efa", "#EF553B", "#00cc96", "#ab63fa", "#FFA15A", "#19d3f3", "#FF6692", "#B6E880", "#FF97FF", "#FECB52" ], "coloraxis": { "colorbar": { "ticks": "", "outlinewidth": 0 } }, "hovermode": "closest", "colorscale": { "diverging": [ [ 0, "#8e0152" ], [ 0.1, "#c51b7d" ], [ 0.2, "#de77ae" ], [ 0.3, "#f1b6da" ], [ 0.4, "#fde0ef" ], [ 0.5, "#f7f7f7" ], [ 0.6, "#e6f5d0" ], [ 0.7, "#b8e186" ], [ 0.8, "#7fbc41" ], [ 0.9, "#4d9221" ], [ 1, "#276419" ] ], "sequential": [ [ 0.0, "#0d0887" ], [ 0.1111111111111111, "#46039f" ], [ 0.2222222222222222, "#7201a8" ], [ 0.3333333333333333, "#9c179e" ], [ 0.4444444444444444, "#bd3786" ], [ 0.5555555555555556, "#d8576b" ], [ 0.6666666666666666, "#ed7953" ], [ 0.7777777777777778, "#fb9f3a" ], [ 0.8888888888888888, "#fdca26" ], [ 1.0, "#f0f921" ] ], "sequentialminus": [ [ 0.0, "#0d0887" ], [ 0.1111111111111111, "#46039f" ], [ 0.2222222222222222, "#7201a8" ], [ 0.3333333333333333, "#9c179e" ], [ 0.4444444444444444, "#bd3786" ], [ 0.5555555555555556, "#d8576b" ], [ 0.6666666666666666, "#ed7953" ], [ 0.7777777777777778, "#fb9f3a" ], [ 0.8888888888888888, "#fdca26" ], [ 1.0, "#f0f921" ] ] }, "hoverlabel": { "align": "left" }, "plot_bgcolor": "#E5ECF6", "paper_bgcolor": "white", "shapedefaults": { "line": { "color": "#2a3f5f" } }, "autotypenumbers": "strict", "annotationdefaults": { "arrowhead": 0, "arrowcolor": "#2a3f5f", "arrowwidth": 1 } } } } }, "height": null, "width": null, "user": { "profile_url": "https://chart-studio.plotly.com/~fwgepfl", "avatar_url": "https://storage.googleapis.com/plotly-prod-profiles/72.jpg", "background_url": "https://storage.googleapis.com/plotly-prod-profiles/bg-8.jpg", "bio": "", "nickname": "", "website": "", "stream_tokens": null, "feature_set_id": null, "csrf_token": null, "date_joined": "2024-04-03 15:05:46", "mapbox_access_tokens": null, "has_password": null, "username": "fwgepfl", "email": null, "is_active": null, "readonly": null, "is_dash_creator": null, "dash_created_count": null, "is_chart_creator": null, "charts_created_count": null } } ] }
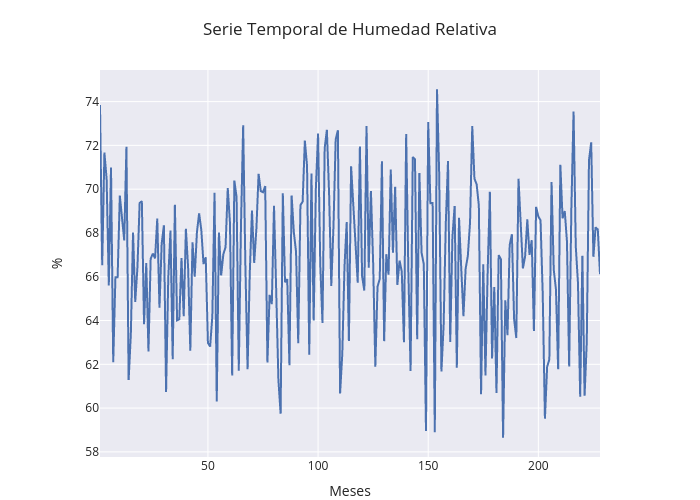