Plots List
Plots
This endpoint handles manipulation of Plotly plot files.
Reference
Authorization
Any user with or without a Plotly account may view public plots. For private plots, see authentication.
Actions
list
Listing all public plots can be done via a GET request to this endpoint.
By default, plots will be listed in order of date created. The order_by
query parameter is accepted at this endpoint. Currently, only ordering by
views is supported. It is possible to filter the plots by quality
with min_quality or max_quality as query parameter.
Example:
// GET https://api.plotly.com/v2/plots/ ---> 200

// GET https://api.plotly.com/v2/plots/?order_by=-views ---> 200

// GET https://api.plotly.com/v2/plots/?min_quality=5 ---> 200

// GET https://api.plotly.com/v2/plots/?max_quality=5 ---> 200
feed
Listing all handpicked feed plots can be done via a GET request to this endpoint. By default, plots will be listed in a random order.
Example:
// GET https://api.plotly.com/v2/plots/feed ---> 200
create
You can create new plot resources here. The only required field is 'figure'. Currently, the figure is restricted to only contain references to grid data. That is, this will fail if raw data arrays are passed in. To create and manipulate underlying grids for plots, see the grids endpoint.
Example:
// This fails because a figure field is required.
// POST https://api.plotly.com/v2/plots ---> 400 Bad Request
{}

// This fails because the figure has raw data
//POST https://api.plotly.com/v2/plots ---> 400 Bad Request
{
    "figure": {"data": [{"y": ['this', 'is', 'raw', 'data']}]}
}

// This succeeds because the figure has src keys, not raw data.
//POST https://api.plotly.com/v2/plots ---> 200 OK
{
    "figure": {"data": [{"ysrc": "sven:88:u8nd62"}]}
}
When creating a grid, you can optionally specify a source_fid to specify where a plot has come from:
- source_fid: the fid of a plot that was copied (and presumably edited) to produce this one
detail
There is a lot of meta information stored about plot files including filename, title, share_url, and content_url to name a few.
This information can only be reached with a GET to this endpoint.
Example:
// GET https://api.plotly.com/v2/plots/iheartgraphs:90
content
The contents of a plot can be downloaded via the content resource. The plot
content contains referenced grid/column data by default. If you wish to
return the raw grid/column data, the inline_data=true query must be included
in the request url. The Content-Type header will be appropriately set for the
response body.
Alternatively, you can set ?map_data=unreadable to append a mapping of
sources to data that belongs to grids which are unreadable for the
requestor. This is useful when you have read access to another users plot,
but that plot contains grid references which you don't have access to.
Examples:
// Returns referenced grid/column data
// GET https://api.plotly.com/v2/plots/iheartgraphs:90/content ---> 200 OK

// Returns full grid/column data
// GET https://api.plotly.com/v2/plots/iheartgraphs:90/content?inline_data=true ---> 200 OK

// Returns full grid/column data when requestor doesn't have permission
// to read the referenced grid.
// GET https://api.plotly.com/v2/plots/iheartgraphs:90/content?map_data=unreadable ---> 200 OK
GET /v2/plots?cursor=cj0xJnA9MjAyNC0wNC0wMysxMyUzQTMyJTNBMTguMDg2NTI3JTJCMDAlM0EwMA%3D%3D&format=api
{ "next": "https://api.plot.ly/v2/plots?cursor=cD0yMDI0LTA0LTAzKzEzJTNBMzklM0EyMy43MDk3MzElMkIwMCUzQTAw&format=api", "previous": "https://api.plot.ly/v2/plots?cursor=cj0xJnA9MjAyNC0wNC0wMysxNCUzQTI5JTNBMTkuMzIwOTQyJTJCMDAlM0EwMA%3D%3D&format=api", "results": [ { "creation_time": "2024-04-03T14:29:19.320942Z", "comments": { "results": [], "count": 0 }, "parented": true, "embed_url": "https://chart-studio.plotly.com/~leonsun1024/1218.embed", "fid": "leonsun1024:1218", "filename": "GRT_ICP_related_price_data_20220404-20240403", "filetype": "plot", "img_url": "https://api.plotly.com/v2/files/leonsun1024:1218/image?image_name=list-thumb", "image_urls": { "default": "https://api.plotly.com/v2/files/leonsun1024:1218/image?image_name=default", "block-thumb": "https://api.plotly.com/v2/files/leonsun1024:1218/image?image_name=block-thumb", "list-thumb": "https://api.plotly.com/v2/files/leonsun1024:1218/image?image_name=list-thumb" }, "api_urls": { "files": "https://api.plotly.com/v2/files/leonsun1024:1218", "plots": "https://api.plotly.com/v2/plots/leonsun1024:1218", "parent": "https://api.plotly.com/v2/folders/home?user=leonsun1024" }, "owner": "leonsun1024", "parent": -1, "preview": "", "referencers": [], "references": [], "title": "", "views": 15, "web_url": "https://chart-studio.plotly.com/~leonsun1024/1218/", "world_readable": true, "date_modified": "2024-04-03T14:29:26.819Z", "stars": { "results": [], "count": 0 }, "collaborators": { "results": [], "count": 0 }, "subfolder_count": null, "refresh_interval": null, "organize_view_url": "https://chart-studio.plotly.com/~leonsun1024/1218/", "current_user_permission": "read", "is_theme": null, "is_template": null, "autosize": true, "caption": "", "figure": { "data": [ { "type": "scatter", "xsrc": "leonsun1024:1219:327528", "ysrc": "leonsun1024:1219:ca8076" } ], "layout": {} }, "height": null, "width": null, "user": { "profile_url": "https://chart-studio.plotly.com/~leonsun1024", "avatar_url": "https://storage.googleapis.com/plotly-prod-profiles/99.jpg", "background_url": "https://storage.googleapis.com/plotly-prod-profiles/bg-4.jpg", "bio": "", "nickname": "", "website": "", "stream_tokens": null, "feature_set_id": null, "csrf_token": null, "date_joined": "2023-05-05 15:58:38", "mapbox_access_tokens": null, "has_password": null, "username": "leonsun1024", "email": null, "is_active": null, "readonly": null, "is_dash_creator": null, "dash_created_count": null, "is_chart_creator": null, "charts_created_count": null } }, { "creation_time": "2024-04-03T14:29:08.235999Z", "comments": { "results": [], "count": 0 }, "parented": true, "embed_url": "https://chart-studio.plotly.com/~leonsun1024/1216.embed", "fid": "leonsun1024:1216", "filename": "GRT_ICP_related_price_data_20220404-20240403_distribution", "filetype": "plot", "img_url": "https://storage.googleapis.com/plotly-prod-images/leonsun1024/1216/9_5NYE1U9FKAY34BCVP08XP3WP5GHR7N.png", "image_urls": { "default": "https://storage.googleapis.com/plotly-prod-images/leonsun1024/1216/2_HQLAIIWK76V1VI6MCER93FPAXPA0AQ.png", "block-thumb": "https://storage.googleapis.com/plotly-prod-images/leonsun1024/1216/8_XW0GFRRUDYEWSPTAVT6W0WYG5HSCSJ.png", "list-thumb": "https://storage.googleapis.com/plotly-prod-images/leonsun1024/1216/9_5NYE1U9FKAY34BCVP08XP3WP5GHR7N.png" }, "api_urls": { "files": "https://api.plotly.com/v2/files/leonsun1024:1216", "plots": "https://api.plotly.com/v2/plots/leonsun1024:1216", "parent": "https://api.plotly.com/v2/folders/home?user=leonsun1024" }, "owner": "leonsun1024", "parent": -1, "preview": "", "referencers": [], "references": [], "title": "", "views": 1, "web_url": "https://chart-studio.plotly.com/~leonsun1024/1216/", "world_readable": true, "date_modified": "2024-04-03T14:29:08.583Z", "stars": { "results": [], "count": 0 }, "collaborators": { "results": [], "count": 0 }, "subfolder_count": null, "refresh_interval": null, "organize_view_url": "https://chart-studio.plotly.com/~leonsun1024/1216/", "current_user_permission": "read", "is_theme": null, "is_template": null, "autosize": true, "caption": "", "figure": { "data": [ { "type": "bar", "xsrc": "leonsun1024:1217:351004", "ysrc": "leonsun1024:1217:8f9fe8" } ], "layout": {} }, "height": null, "width": null, "user": { "profile_url": "https://chart-studio.plotly.com/~leonsun1024", "avatar_url": "https://storage.googleapis.com/plotly-prod-profiles/99.jpg", "background_url": "https://storage.googleapis.com/plotly-prod-profiles/bg-4.jpg", "bio": "", "nickname": "", "website": "", "stream_tokens": null, "feature_set_id": null, "csrf_token": null, "date_joined": "2023-05-05 15:58:38", "mapbox_access_tokens": null, "has_password": null, "username": "leonsun1024", "email": null, "is_active": null, "readonly": null, "is_dash_creator": null, "dash_created_count": null, "is_chart_creator": null, "charts_created_count": null } }, { "creation_time": "2024-04-03T14:24:27.889073Z", "comments": { "results": [], "count": 0 }, "parented": true, "embed_url": "https://chart-studio.plotly.com/~OlgaFedorenko/15.embed", "fid": "OlgaFedorenko:15", "filename": "Plot 15", "filetype": "plot", "img_url": "https://storage.googleapis.com/plotly-prod-images/OlgaFedorenko/15/9_KPSICZM9UWC3PA0U6AEU5I09FBBUF3.png", "image_urls": { "default": "https://storage.googleapis.com/plotly-prod-images/OlgaFedorenko/15/2_1GHIX8F91FFZOX01G05MPZKM288RDY.png", "block-thumb": "https://storage.googleapis.com/plotly-prod-images/OlgaFedorenko/15/8_PHD3PD76XE7MNYT1IVECUXZHQ5BEJN.png", "list-thumb": "https://storage.googleapis.com/plotly-prod-images/OlgaFedorenko/15/9_KPSICZM9UWC3PA0U6AEU5I09FBBUF3.png" }, "api_urls": { "files": "https://api.plotly.com/v2/files/OlgaFedorenko:15", "plots": "https://api.plotly.com/v2/plots/OlgaFedorenko:15", "parent": "https://api.plotly.com/v2/folders/home?user=OlgaFedorenko" }, "owner": "OlgaFedorenko", "parent": -1, "preview": "", "referencers": [], "references": [], "title": "", "views": 1, "web_url": "https://chart-studio.plotly.com/~OlgaFedorenko/15/", "world_readable": true, "date_modified": "2024-04-03T14:24:27.901Z", "stars": { "results": [], "count": 0 }, "collaborators": { "results": [], "count": 0 }, "subfolder_count": null, "refresh_interval": null, "organize_view_url": "https://chart-studio.plotly.com/~OlgaFedorenko/15/", "current_user_permission": "read", "is_theme": null, "is_template": false, "autosize": true, "caption": "", "figure": { "data": [ { "meta": { "columnNames": { "x": "F" } }, "name": "Other (n=5)", "type": "box", "xsrc": "OlgaFedorenko:14:c281bd", "marker": { "color": "rgb(77, 201, 230)" }, "boxmean": true, "visible": true, "boxpoints": "outliers" }, { "meta": { "columnNames": { "x": "C" } }, "name": "Mobile team (n=10)", "type": "box", "xsrc": "OlgaFedorenko:14:49aee9", "marker": { "color": "rgb(68, 163, 219)" }, "boxmean": true, "boxpoints": "outliers" }, { "meta": { "columnNames": { "x": "E" } }, "name": "Management and middle management (n=8)", "type": "box", "xsrc": "OlgaFedorenko:14:9f0d9f", "marker": { "color": "rgb(59, 125, 208)" }, "boxmean": true, "boxpoints": "outliers" }, { "meta": { "columnNames": { "x": "D" } }, "name": "Medical imaging, nuclear medicine and pain clinic (n=11)", "type": "box", "xsrc": "OlgaFedorenko:14:ee1fb3", "marker": { "color": "rgb(51, 88, 196)", "opacity": 1 }, "boxmean": true, "boxpoints": "outliers" }, { "meta": { "columnNames": { "x": "A" } }, "mode": "markers", "name": "Internal departments (n=162)", "type": "box", "xsrc": "OlgaFedorenko:14:ed1197", "marker": { "color": "rgb(42, 50, 185)" }, "boxmean": true, "boxpoints": "outliers" }, { "meta": { "columnNames": { "x": "B" } }, "name": "Critical departments (n=249)", "type": "box", "xsrc": "OlgaFedorenko:14:d157c4", "marker": { "color": "rgb(33, 12, 174)" }, "boxmean": true, "boxpoints": "outliers", "fillcolor": "rgb(17, 124, 209)" } ], "frames": [], "layout": { "xaxis": { "type": "linear", "range": [ 0, 100 ], "title": { "text": "Score" }, "autorange": false }, "yaxis": { "type": "category", "range": [ -0.5, 5.5 ], "title": { "text": "Department" }, "autorange": true }, "legend": { "x": 0.9030405221506532, "y": 1.045822102425876 }, "autosize": true, "template": { "data": { "bar": [ { "type": "bar", "marker": { "colorbar": { "ticks": "", "outlinewidth": 0 } } } ], "table": [ { "type": "table", "cells": { "fill": { "color": "#EBF0F8" }, "line": { "color": "white" } }, "header": { "fill": { "color": "#C8D4E3" }, "line": { "color": "white" } } } ], "carpet": [ { "type": "carpet", "aaxis": { "gridcolor": "#C8D4E3", "linecolor": "#C8D4E3", "endlinecolor": "#2a3f5f", "minorgridcolor": "#C8D4E3", "startlinecolor": "#2a3f5f" }, "baxis": { "gridcolor": "#C8D4E3", "linecolor": "#C8D4E3", "endlinecolor": "#2a3f5f", "minorgridcolor": "#C8D4E3", "startlinecolor": "#2a3f5f" } } ], "mesh3d": [ { "type": "mesh3d", "colorbar": { "ticks": "", "outlinewidth": 0 } } ], "contour": [ { "type": "contour", "colorbar": { "ticks": "", "outlinewidth": 0 }, "autocolorscale": true } ], "heatmap": [ { "type": "heatmap", "colorbar": { "ticks": "", "outlinewidth": 0 }, "autocolorscale": true } ], "scatter": [ { "type": "scatter", "marker": { "colorbar": { "ticks": "", "outlinewidth": 0 } } } ], "surface": [ { "type": "surface", "colorbar": { "ticks": "", "outlinewidth": 0 } } ], "heatmapgl": [ { "type": "heatmapgl", "colorbar": { "ticks": "", "outlinewidth": 0 } } ], "histogram": [ { "type": "histogram", "marker": { "colorbar": { "ticks": "", "outlinewidth": 0 } } } ], "parcoords": [ { "line": { "colorbar": { "ticks": "", "outlinewidth": 0 } }, "type": "parcoords" } ], "scatter3d": [ { "type": "scatter3d", "marker": { "colorbar": { "ticks": "", "outlinewidth": 0 } } } ], "scattergl": [ { "type": "scattergl", "marker": { "colorbar": { "ticks": "", "outlinewidth": 0 } } } ], "choropleth": [ { "type": "choropleth", "colorbar": { "ticks": "", "outlinewidth": 0 } } ], "scattergeo": [ { "type": "scattergeo", "marker": { "colorbar": { "ticks": "", "outlinewidth": 0 } } } ], "histogram2d": [ { "type": "histogram2d", "colorbar": { "ticks": "", "outlinewidth": 0 }, "autocolorscale": true } ], "scatterpolar": [ { "type": "scatterpolar", "marker": { "colorbar": { "ticks": "", "outlinewidth": 0 } } } ], "contourcarpet": [ { "type": "contourcarpet", "colorbar": { "ticks": "", "outlinewidth": 0 } } ], "scattercarpet": [ { "type": "scattercarpet", "marker": { "colorbar": { "ticks": "", "outlinewidth": 0 } } } ], "scattermapbox": [ { "type": "scattermapbox", "marker": { "colorbar": { "ticks": "", "outlinewidth": 0 } } } ], "scatterpolargl": [ { "type": "scatterpolargl", "marker": { "colorbar": { "ticks": "", "outlinewidth": 0 } } } ], "scatterternary": [ { "type": "scatterternary", "marker": { "colorbar": { "ticks": "", "outlinewidth": 0 } } } ], "histogram2dcontour": [ { "type": "histogram2dcontour", "colorbar": { "ticks": "", "outlinewidth": 0 }, "autocolorscale": true } ] }, "layout": { "geo": { "bgcolor": "white", "showland": true, "lakecolor": "white", "landcolor": "white", "showlakes": true, "subunitcolor": "#C8D4E3" }, "font": { "color": "#2a3f5f" }, "polar": { "bgcolor": "white", "radialaxis": { "ticks": "", "gridcolor": "#EBF0F8", "linecolor": "#EBF0F8" }, "angularaxis": { "ticks": "", "gridcolor": "#EBF0F8", "linecolor": "#EBF0F8" } }, "scene": { "xaxis": { "ticks": "", "gridcolor": "#DFE8F3", "gridwidth": 2, "linecolor": "#EBF0F8", "zerolinecolor": "#EBF0F8", "showbackground": true, "backgroundcolor": "white" }, "yaxis": { "ticks": "", "gridcolor": "#DFE8F3", "gridwidth": 2, "linecolor": "#EBF0F8", "zerolinecolor": "#EBF0F8", "showbackground": true, "backgroundcolor": "white" }, "zaxis": { "ticks": "", "gridcolor": "#DFE8F3", "gridwidth": 2, "linecolor": "#EBF0F8", "zerolinecolor": "#EBF0F8", "showbackground": true, "backgroundcolor": "white" } }, "title": { "x": 0.05 }, "xaxis": { "ticks": "", "gridcolor": "#EBF0F8", "linecolor": "#EBF0F8", "automargin": true, "zerolinecolor": "#EBF0F8", "zerolinewidth": 2 }, "yaxis": { "ticks": "", "gridcolor": "#EBF0F8", "linecolor": "#EBF0F8", "automargin": true, "zerolinecolor": "#EBF0F8", "zerolinewidth": 2 }, "ternary": { "aaxis": { "ticks": "", "gridcolor": "#DFE8F3", "linecolor": "#A2B1C6" }, "baxis": { "ticks": "", "gridcolor": "#DFE8F3", "linecolor": "#A2B1C6" }, "caxis": { "ticks": "", "gridcolor": "#DFE8F3", "linecolor": "#A2B1C6" }, "bgcolor": "white" }, "colorway": [ "#636efa", "#EF553B", "#00cc96", "#ab63fa", "#19d3f3", "#e763fa", "#fecb52", "#ffa15a", "#ff6692", "#b6e880" ], "hovermode": "closest", "colorscale": { "diverging": [ [ 0, "#8e0152" ], [ 0.1, "#c51b7d" ], [ 0.2, "#de77ae" ], [ 0.3, "#f1b6da" ], [ 0.4, "#fde0ef" ], [ 0.5, "#f7f7f7" ], [ 0.6, "#e6f5d0" ], [ 0.7, "#b8e186" ], [ 0.8, "#7fbc41" ], [ 0.9, "#4d9221" ], [ 1, "#276419" ] ], "sequential": [ [ 0, "#0508b8" ], [ 0.0893854748603352, "#1910d8" ], [ 0.1787709497206704, "#3c19f0" ], [ 0.2681564245810056, "#6b1cfb" ], [ 0.3575418994413408, "#981cfd" ], [ 0.44692737430167595, "#bf1cfd" ], [ 0.5363128491620112, "#dd2bfd" ], [ 0.6256983240223464, "#f246fe" ], [ 0.7150837988826816, "#fc67fd" ], [ 0.8044692737430168, "#fe88fc" ], [ 0.8938547486033519, "#fea5fd" ], [ 0.9832402234636871, "#febefe" ], [ 1, "#fec3fe" ] ], "sequentialminus": [ [ 0, "#0508b8" ], [ 0.0893854748603352, "#1910d8" ], [ 0.1787709497206704, "#3c19f0" ], [ 0.2681564245810056, "#6b1cfb" ], [ 0.3575418994413408, "#981cfd" ], [ 0.44692737430167595, "#bf1cfd" ], [ 0.5363128491620112, "#dd2bfd" ], [ 0.6256983240223464, "#f246fe" ], [ 0.7150837988826816, "#fc67fd" ], [ 0.8044692737430168, "#fe88fc" ], [ 0.8938547486033519, "#fea5fd" ], [ 0.9832402234636871, "#febefe" ], [ 1, "#fec3fe" ] ] }, "plot_bgcolor": "white", "paper_bgcolor": "white", "shapedefaults": { "line": { "width": 0 }, "opacity": 0.4, "fillcolor": "#506784" }, "annotationdefaults": { "arrowhead": 0, "arrowcolor": "#506784", "arrowwidth": 1 } }, "themeRef": "PLOTLY_WHITE" }, "showlegend": false } }, "height": null, "width": null, "user": { "profile_url": "https://chart-studio.plotly.com/~OlgaFedorenko", "avatar_url": "https://storage.googleapis.com/plotly-prod-profiles/52.jpg", "background_url": "https://storage.googleapis.com/plotly-prod-profiles/bg-1.jpg", "bio": "", "nickname": "", "website": "", "stream_tokens": null, "feature_set_id": null, "csrf_token": null, "date_joined": "2023-04-22 21:39:50", "mapbox_access_tokens": null, "has_password": null, "username": "OlgaFedorenko", "email": null, "is_active": null, "readonly": null, "is_dash_creator": null, "dash_created_count": null, "is_chart_creator": null, "charts_created_count": null } }, { "creation_time": "2024-04-03T14:22:39.960158Z", "comments": { "results": [], "count": 0 }, "parented": true, "embed_url": "https://chart-studio.plotly.com/~julia_koehler_nat/43.embed", "fid": "julia_koehler_nat:43", "filename": "seir_model_simulation", "filetype": "plot", "img_url": "https://storage.googleapis.com/plotly-prod-images/julia_koehler_nat/43/9_Q2HGHPT12OSRD2B2R9URHNWMPZQ2IU.png", "image_urls": { "default": "https://storage.googleapis.com/plotly-prod-images/julia_koehler_nat/43/2_I3LN75CB8YE1GF5MBKNAHM82VT7TFI.png", "block-thumb": "https://storage.googleapis.com/plotly-prod-images/julia_koehler_nat/43/8_A0PQ2HIL3O93L400KP8H8RKAG5R4AZ.png", "list-thumb": "https://storage.googleapis.com/plotly-prod-images/julia_koehler_nat/43/9_Q2HGHPT12OSRD2B2R9URHNWMPZQ2IU.png" }, "api_urls": { "files": "https://api.plotly.com/v2/files/julia_koehler_nat:43", "plots": "https://api.plotly.com/v2/plots/julia_koehler_nat:43", "parent": "https://api.plotly.com/v2/folders/home?user=julia_koehler_nat" }, "owner": "julia_koehler_nat", "parent": -1, "preview": "", "referencers": [], "references": [], "title": "", "views": 2, "web_url": "https://chart-studio.plotly.com/~julia_koehler_nat/43/", "world_readable": true, "date_modified": "2024-04-03T16:07:29.455Z", "stars": { "results": [], "count": 0 }, "collaborators": { "results": [], "count": 0 }, "subfolder_count": null, "refresh_interval": null, "organize_view_url": "https://chart-studio.plotly.com/~julia_koehler_nat/43/", "current_user_permission": "read", "is_theme": null, "is_template": null, "autosize": true, "caption": "", "figure": { "data": [ { "line": { "dash": "solid", "color": "#636efa" }, "mode": "lines", "name": "Susceptible", "type": "scatter", "xsrc": "julia_koehler_nat:44:49e602", "ysrc": "julia_koehler_nat:44:ed847b", "xaxis": "x", "yaxis": "y", "idssrc": "julia_koehler_nat:44:380802", "marker": { "symbol": "circle" }, "showlegend": true, "legendgroup": "Susceptible", "orientation": "v", "hovertemplate": "variable=Susceptible<br>Beta=0.0<br>Time=%{x}<br>Number of Individuals=%{y}<extra></extra>" }, { "line": { "dash": "solid", "color": "#EF553B" }, "mode": "lines", "name": "Exposed", "type": "scatter", "xsrc": "julia_koehler_nat:44:a6b6e1", "ysrc": "julia_koehler_nat:44:63d893", "xaxis": "x", "yaxis": "y", "idssrc": "julia_koehler_nat:44:006809", "marker": { "symbol": "circle" }, "showlegend": true, "legendgroup": "Exposed", "orientation": "v", "hovertemplate": "variable=Exposed<br>Beta=0.0<br>Time=%{x}<br>Number of Individuals=%{y}<extra></extra>" }, { "line": { "dash": "solid", "color": "#00cc96" }, "mode": "lines", "name": "Infected", "type": "scatter", "xsrc": "julia_koehler_nat:44:2ed1ab", "ysrc": "julia_koehler_nat:44:c8aa59", "xaxis": "x", "yaxis": "y", "idssrc": "julia_koehler_nat:44:1cb695", "marker": { "symbol": "circle" }, "showlegend": true, "legendgroup": "Infected", "orientation": "v", "hovertemplate": "variable=Infected<br>Beta=0.0<br>Time=%{x}<br>Number of Individuals=%{y}<extra></extra>" }, { "line": { "dash": "solid", "color": "#ab63fa" }, "mode": "lines", "name": "Recovered", "type": "scatter", "xsrc": "julia_koehler_nat:44:d4c90b", "ysrc": "julia_koehler_nat:44:a7dcf8", "xaxis": "x", "yaxis": "y", "idssrc": "julia_koehler_nat:44:342cc7", "marker": { "symbol": "circle" }, "showlegend": true, "legendgroup": "Recovered", "orientation": "v", "hovertemplate": "variable=Recovered<br>Beta=0.0<br>Time=%{x}<br>Number of Individuals=%{y}<extra></extra>" } ], "frames": [ { "data": [ { "line": { "dash": "solid", "color": "#636efa" }, "mode": "lines", "name": "Susceptible", "type": "scatter", "xsrc": "julia_koehler_nat:44:a9bac8", "ysrc": "julia_koehler_nat:44:3e62bd", "xaxis": "x", "yaxis": "y", "idssrc": "julia_koehler_nat:44:116ff5", "marker": { "symbol": "circle" }, "showlegend": true, "legendgroup": "Susceptible", "orientation": "v", "hovertemplate": "variable=Susceptible<br>Beta=0.0<br>Time=%{x}<br>Number of Individuals=%{y}<extra></extra>" }, { "line": { "dash": "solid", "color": "#EF553B" }, "mode": "lines", "name": "Exposed", "type": "scatter", "xsrc": "julia_koehler_nat:44:2d462b", "ysrc": "julia_koehler_nat:44:210d45", "xaxis": "x", "yaxis": "y", "idssrc": "julia_koehler_nat:44:3b9a52", "marker": { "symbol": "circle" }, "showlegend": true, "legendgroup": "Exposed", "orientation": "v", "hovertemplate": "variable=Exposed<br>Beta=0.0<br>Time=%{x}<br>Number of Individuals=%{y}<extra></extra>" }, { "line": { "dash": "solid", "color": "#00cc96" }, "mode": "lines", "name": "Infected", "type": "scatter", "xsrc": "julia_koehler_nat:44:763c23", "ysrc": "julia_koehler_nat:44:801ae1", "xaxis": "x", "yaxis": "y", "idssrc": "julia_koehler_nat:44:03b23e", "marker": { "symbol": "circle" }, "showlegend": true, "legendgroup": "Infected", "orientation": "v", "hovertemplate": "variable=Infected<br>Beta=0.0<br>Time=%{x}<br>Number of Individuals=%{y}<extra></extra>" }, { "line": { "dash": "solid", "color": "#ab63fa" }, "mode": "lines", "name": "Recovered", "type": "scatter", "xsrc": "julia_koehler_nat:44:c811b2", "ysrc": "julia_koehler_nat:44:d635d6", "xaxis": "x", "yaxis": "y", "idssrc": "julia_koehler_nat:44:099bfb", "marker": { "symbol": "circle" }, "showlegend": true, "legendgroup": "Recovered", "orientation": "v", "hovertemplate": "variable=Recovered<br>Beta=0.0<br>Time=%{x}<br>Number of Individuals=%{y}<extra></extra>" } ], "name": "0.0" }, { "data": [ { "line": { "dash": "solid", "color": "#636efa" }, "mode": "lines", "name": "Susceptible", "type": "scatter", "xsrc": "julia_koehler_nat:44:b7a154", "ysrc": "julia_koehler_nat:44:871c90", "xaxis": "x", "yaxis": "y", "idssrc": "julia_koehler_nat:44:0c405d", "marker": { "symbol": "circle" }, "showlegend": true, "legendgroup": "Susceptible", "orientation": "v", "hovertemplate": "variable=Susceptible<br>Beta=0.1<br>Time=%{x}<br>Number of Individuals=%{y}<extra></extra>" }, { "line": { "dash": "solid", "color": "#EF553B" }, "mode": "lines", "name": "Exposed", "type": "scatter", "xsrc": "julia_koehler_nat:44:775ff4", "ysrc": "julia_koehler_nat:44:de8251", "xaxis": "x", "yaxis": "y", "idssrc": "julia_koehler_nat:44:3ff73f", "marker": { "symbol": "circle" }, "showlegend": true, "legendgroup": "Exposed", "orientation": "v", "hovertemplate": "variable=Exposed<br>Beta=0.1<br>Time=%{x}<br>Number of Individuals=%{y}<extra></extra>" }, { "line": { "dash": "solid", "color": "#00cc96" }, "mode": "lines", "name": "Infected", "type": "scatter", "xsrc": "julia_koehler_nat:44:3bdb9c", "ysrc": "julia_koehler_nat:44:4c7540", "xaxis": "x", "yaxis": "y", "idssrc": "julia_koehler_nat:44:11647d", "marker": { "symbol": "circle" }, "showlegend": true, "legendgroup": "Infected", "orientation": "v", "hovertemplate": "variable=Infected<br>Beta=0.1<br>Time=%{x}<br>Number of Individuals=%{y}<extra></extra>" }, { "line": { "dash": "solid", "color": "#ab63fa" }, "mode": "lines", "name": "Recovered", "type": "scatter", "xsrc": "julia_koehler_nat:44:11cd8a", "ysrc": "julia_koehler_nat:44:5c3f76", "xaxis": "x", "yaxis": "y", "idssrc": "julia_koehler_nat:44:1c12c2", "marker": { "symbol": "circle" }, "showlegend": true, "legendgroup": "Recovered", "orientation": "v", "hovertemplate": "variable=Recovered<br>Beta=0.1<br>Time=%{x}<br>Number of Individuals=%{y}<extra></extra>" } ], "name": "0.1" }, { "data": [ { "line": { "dash": "solid", "color": "#636efa" }, "mode": "lines", "name": "Susceptible", "type": "scatter", "xsrc": "julia_koehler_nat:44:1d3d50", "ysrc": "julia_koehler_nat:44:e178f7", "xaxis": "x", "yaxis": "y", "idssrc": "julia_koehler_nat:44:86d9a6", "marker": { "symbol": "circle" }, "showlegend": true, "legendgroup": "Susceptible", "orientation": "v", "hovertemplate": "variable=Susceptible<br>Beta=0.2<br>Time=%{x}<br>Number of Individuals=%{y}<extra></extra>" }, { "line": { "dash": "solid", "color": "#EF553B" }, "mode": "lines", "name": "Exposed", "type": "scatter", "xsrc": "julia_koehler_nat:44:da54fb", "ysrc": "julia_koehler_nat:44:fb6f3c", "xaxis": "x", "yaxis": "y", "idssrc": "julia_koehler_nat:44:98bf1d", "marker": { "symbol": "circle" }, "showlegend": true, "legendgroup": "Exposed", "orientation": "v", "hovertemplate": "variable=Exposed<br>Beta=0.2<br>Time=%{x}<br>Number of Individuals=%{y}<extra></extra>" }, { "line": { "dash": "solid", "color": "#00cc96" }, "mode": "lines", "name": "Infected", "type": "scatter", "xsrc": "julia_koehler_nat:44:d34f05", "ysrc": "julia_koehler_nat:44:c4d369", "xaxis": "x", "yaxis": "y", "idssrc": "julia_koehler_nat:44:9d8bc9", "marker": { "symbol": "circle" }, "showlegend": true, "legendgroup": "Infected", "orientation": "v", "hovertemplate": "variable=Infected<br>Beta=0.2<br>Time=%{x}<br>Number of Individuals=%{y}<extra></extra>" }, { "line": { "dash": "solid", "color": "#ab63fa" }, "mode": "lines", "name": "Recovered", "type": "scatter", "xsrc": "julia_koehler_nat:44:9a7f8f", "ysrc": "julia_koehler_nat:44:caf988", "xaxis": "x", "yaxis": "y", "idssrc": "julia_koehler_nat:44:10509a", "marker": { "symbol": "circle" }, "showlegend": true, "legendgroup": "Recovered", "orientation": "v", "hovertemplate": "variable=Recovered<br>Beta=0.2<br>Time=%{x}<br>Number of Individuals=%{y}<extra></extra>" } ], "name": "0.2" }, { "data": [ { "line": { "dash": "solid", "color": "#636efa" }, "mode": "lines", "name": "Susceptible", "type": "scatter", "xsrc": "julia_koehler_nat:44:f3d452", "ysrc": "julia_koehler_nat:44:f5b2e5", "xaxis": "x", "yaxis": "y", "idssrc": "julia_koehler_nat:44:0937c7", "marker": { "symbol": "circle" }, "showlegend": true, "legendgroup": "Susceptible", "orientation": "v", "hovertemplate": "variable=Susceptible<br>Beta=0.30000000000000004<br>Time=%{x}<br>Number of Individuals=%{y}<extra></extra>" }, { "line": { "dash": "solid", "color": "#EF553B" }, "mode": "lines", "name": "Exposed", "type": "scatter", "xsrc": "julia_koehler_nat:44:506845", "ysrc": "julia_koehler_nat:44:3333ce", "xaxis": "x", "yaxis": "y", "idssrc": "julia_koehler_nat:44:e3c52e", "marker": { "symbol": "circle" }, "showlegend": true, "legendgroup": "Exposed", "orientation": "v", "hovertemplate": "variable=Exposed<br>Beta=0.30000000000000004<br>Time=%{x}<br>Number of Individuals=%{y}<extra></extra>" }, { "line": { "dash": "solid", "color": "#00cc96" }, "mode": "lines", "name": "Infected", "type": "scatter", "xsrc": "julia_koehler_nat:44:92ce4b", "ysrc": "julia_koehler_nat:44:9e0947", "xaxis": "x", "yaxis": "y", "idssrc": "julia_koehler_nat:44:2bb586", "marker": { "symbol": "circle" }, "showlegend": true, "legendgroup": "Infected", "orientation": "v", "hovertemplate": "variable=Infected<br>Beta=0.30000000000000004<br>Time=%{x}<br>Number of Individuals=%{y}<extra></extra>" }, { "line": { "dash": "solid", "color": "#ab63fa" }, "mode": "lines", "name": "Recovered", "type": "scatter", "xsrc": "julia_koehler_nat:44:f455e4", "ysrc": "julia_koehler_nat:44:0e226d", "xaxis": "x", "yaxis": "y", "idssrc": "julia_koehler_nat:44:f45dba", "marker": { "symbol": "circle" }, "showlegend": true, "legendgroup": "Recovered", "orientation": "v", "hovertemplate": "variable=Recovered<br>Beta=0.30000000000000004<br>Time=%{x}<br>Number of Individuals=%{y}<extra></extra>" } ], "name": "0.30000000000000004" }, { "data": [ { "line": { "dash": "solid", "color": "#636efa" }, "mode": "lines", "name": "Susceptible", "type": "scatter", "xsrc": "julia_koehler_nat:44:4da6dd", "ysrc": "julia_koehler_nat:44:c63dbb", "xaxis": "x", "yaxis": "y", "idssrc": "julia_koehler_nat:44:ba3268", "marker": { "symbol": "circle" }, "showlegend": true, "legendgroup": "Susceptible", "orientation": "v", "hovertemplate": "variable=Susceptible<br>Beta=0.4<br>Time=%{x}<br>Number of Individuals=%{y}<extra></extra>" }, { "line": { "dash": "solid", "color": "#EF553B" }, "mode": "lines", "name": "Exposed", "type": "scatter", "xsrc": "julia_koehler_nat:44:8cac67", "ysrc": "julia_koehler_nat:44:2028e7", "xaxis": "x", "yaxis": "y", "idssrc": "julia_koehler_nat:44:9aef23", "marker": { "symbol": "circle" }, "showlegend": true, "legendgroup": "Exposed", "orientation": "v", "hovertemplate": "variable=Exposed<br>Beta=0.4<br>Time=%{x}<br>Number of Individuals=%{y}<extra></extra>" }, { "line": { "dash": "solid", "color": "#00cc96" }, "mode": "lines", "name": "Infected", "type": "scatter", "xsrc": "julia_koehler_nat:44:70bfe4", "ysrc": "julia_koehler_nat:44:cbb4aa", "xaxis": "x", "yaxis": "y", "idssrc": "julia_koehler_nat:44:9e47c5", "marker": { "symbol": "circle" }, "showlegend": true, "legendgroup": "Infected", "orientation": "v", "hovertemplate": "variable=Infected<br>Beta=0.4<br>Time=%{x}<br>Number of Individuals=%{y}<extra></extra>" }, { "line": { "dash": "solid", "color": "#ab63fa" }, "mode": "lines", "name": "Recovered", "type": "scatter", "xsrc": "julia_koehler_nat:44:2abaf2", "ysrc": "julia_koehler_nat:44:537b6d", "xaxis": "x", "yaxis": "y", "idssrc": "julia_koehler_nat:44:1b457c", "marker": { "symbol": "circle" }, "showlegend": true, "legendgroup": "Recovered", "orientation": "v", "hovertemplate": "variable=Recovered<br>Beta=0.4<br>Time=%{x}<br>Number of Individuals=%{y}<extra></extra>" } ], "name": "0.4" }, { "data": [ { "line": { "dash": "solid", "color": "#636efa" }, "mode": "lines", "name": "Susceptible", "type": "scatter", "xsrc": "julia_koehler_nat:44:58b0c7", "ysrc": "julia_koehler_nat:44:c8f1f7", "xaxis": "x", "yaxis": "y", "idssrc": "julia_koehler_nat:44:dba90a", "marker": { "symbol": "circle" }, "showlegend": true, "legendgroup": "Susceptible", "orientation": "v", "hovertemplate": "variable=Susceptible<br>Beta=0.5<br>Time=%{x}<br>Number of Individuals=%{y}<extra></extra>" }, { "line": { "dash": "solid", "color": "#EF553B" }, "mode": "lines", "name": "Exposed", "type": "scatter", "xsrc": "julia_koehler_nat:44:8a09ad", "ysrc": "julia_koehler_nat:44:8da5d3", "xaxis": "x", "yaxis": "y", "idssrc": "julia_koehler_nat:44:54fd10", "marker": { "symbol": "circle" }, "showlegend": true, "legendgroup": "Exposed", "orientation": "v", "hovertemplate": "variable=Exposed<br>Beta=0.5<br>Time=%{x}<br>Number of Individuals=%{y}<extra></extra>" }, { "line": { "dash": "solid", "color": "#00cc96" }, "mode": "lines", "name": "Infected", "type": "scatter", "xsrc": "julia_koehler_nat:44:cc04be", "ysrc": "julia_koehler_nat:44:432565", "xaxis": "x", "yaxis": "y", "idssrc": "julia_koehler_nat:44:6c3059", "marker": { "symbol": "circle" }, "showlegend": true, "legendgroup": "Infected", "orientation": "v", "hovertemplate": "variable=Infected<br>Beta=0.5<br>Time=%{x}<br>Number of Individuals=%{y}<extra></extra>" }, { "line": { "dash": "solid", "color": "#ab63fa" }, "mode": "lines", "name": "Recovered", "type": "scatter", "xsrc": "julia_koehler_nat:44:ab160b", "ysrc": "julia_koehler_nat:44:850524", "xaxis": "x", "yaxis": "y", "idssrc": "julia_koehler_nat:44:e763f3", "marker": { "symbol": "circle" }, "showlegend": true, "legendgroup": "Recovered", "orientation": "v", "hovertemplate": "variable=Recovered<br>Beta=0.5<br>Time=%{x}<br>Number of Individuals=%{y}<extra></extra>" } ], "name": "0.5" }, { "data": [ { "line": { "dash": "solid", "color": "#636efa" }, "mode": "lines", "name": "Susceptible", "type": "scatter", "xsrc": "julia_koehler_nat:44:d9231e", "ysrc": "julia_koehler_nat:44:3bac25", "xaxis": "x", "yaxis": "y", "idssrc": "julia_koehler_nat:44:b0156a", "marker": { "symbol": "circle" }, "showlegend": true, "legendgroup": "Susceptible", "orientation": "v", "hovertemplate": "variable=Susceptible<br>Beta=0.6000000000000001<br>Time=%{x}<br>Number of Individuals=%{y}<extra></extra>" }, { "line": { "dash": "solid", "color": "#EF553B" }, "mode": "lines", "name": "Exposed", "type": "scatter", "xsrc": "julia_koehler_nat:44:c35eb6", "ysrc": "julia_koehler_nat:44:bba7ba", "xaxis": "x", "yaxis": "y", "idssrc": "julia_koehler_nat:44:6737cc", "marker": { "symbol": "circle" }, "showlegend": true, "legendgroup": "Exposed", "orientation": "v", "hovertemplate": "variable=Exposed<br>Beta=0.6000000000000001<br>Time=%{x}<br>Number of Individuals=%{y}<extra></extra>" }, { "line": { "dash": "solid", "color": "#00cc96" }, "mode": "lines", "name": "Infected", "type": "scatter", "xsrc": "julia_koehler_nat:44:41ee88", "ysrc": "julia_koehler_nat:44:14e508", "xaxis": "x", "yaxis": "y", "idssrc": "julia_koehler_nat:44:6e6295", "marker": { "symbol": "circle" }, "showlegend": true, "legendgroup": "Infected", "orientation": "v", "hovertemplate": "variable=Infected<br>Beta=0.6000000000000001<br>Time=%{x}<br>Number of Individuals=%{y}<extra></extra>" }, { "line": { "dash": "solid", "color": "#ab63fa" }, "mode": "lines", "name": "Recovered", "type": "scatter", "xsrc": "julia_koehler_nat:44:22eebf", "ysrc": "julia_koehler_nat:44:896a6e", "xaxis": "x", "yaxis": "y", "idssrc": "julia_koehler_nat:44:8ca77b", "marker": { "symbol": "circle" }, "showlegend": true, "legendgroup": "Recovered", "orientation": "v", "hovertemplate": "variable=Recovered<br>Beta=0.6000000000000001<br>Time=%{x}<br>Number of Individuals=%{y}<extra></extra>" } ], "name": "0.6000000000000001" }, { "data": [ { "line": { "dash": "solid", "color": "#636efa" }, "mode": "lines", "name": "Susceptible", "type": "scatter", "xsrc": "julia_koehler_nat:44:43ebb9", "ysrc": "julia_koehler_nat:44:dc08b1", "xaxis": "x", "yaxis": "y", "idssrc": "julia_koehler_nat:44:911dfe", "marker": { "symbol": "circle" }, "showlegend": true, "legendgroup": "Susceptible", "orientation": "v", "hovertemplate": "variable=Susceptible<br>Beta=0.7000000000000001<br>Time=%{x}<br>Number of Individuals=%{y}<extra></extra>" }, { "line": { "dash": "solid", "color": "#EF553B" }, "mode": "lines", "name": "Exposed", "type": "scatter", "xsrc": "julia_koehler_nat:44:a77450", "ysrc": "julia_koehler_nat:44:f57aed", "xaxis": "x", "yaxis": "y", "idssrc": "julia_koehler_nat:44:53df82", "marker": { "symbol": "circle" }, "showlegend": true, "legendgroup": "Exposed", "orientation": "v", "hovertemplate": "variable=Exposed<br>Beta=0.7000000000000001<br>Time=%{x}<br>Number of Individuals=%{y}<extra></extra>" }, { "line": { "dash": "solid", "color": "#00cc96" }, "mode": "lines", "name": "Infected", "type": "scatter", "xsrc": "julia_koehler_nat:44:742ff7", "ysrc": "julia_koehler_nat:44:11486a", "xaxis": "x", "yaxis": "y", "idssrc": "julia_koehler_nat:44:5c7f09", "marker": { "symbol": "circle" }, "showlegend": true, "legendgroup": "Infected", "orientation": "v", "hovertemplate": "variable=Infected<br>Beta=0.7000000000000001<br>Time=%{x}<br>Number of Individuals=%{y}<extra></extra>" }, { "line": { "dash": "solid", "color": "#ab63fa" }, "mode": "lines", "name": "Recovered", "type": "scatter", "xsrc": "julia_koehler_nat:44:db45b5", "ysrc": "julia_koehler_nat:44:cf96cf", "xaxis": "x", "yaxis": "y", "idssrc": "julia_koehler_nat:44:23e61a", "marker": { "symbol": "circle" }, "showlegend": true, "legendgroup": "Recovered", "orientation": "v", "hovertemplate": "variable=Recovered<br>Beta=0.7000000000000001<br>Time=%{x}<br>Number of Individuals=%{y}<extra></extra>" } ], "name": "0.7000000000000001" }, { "data": [ { "line": { "dash": "solid", "color": "#636efa" }, "mode": "lines", "name": "Susceptible", "type": "scatter", "xsrc": "julia_koehler_nat:44:971229", "ysrc": "julia_koehler_nat:44:09c8ce", "xaxis": "x", "yaxis": "y", "idssrc": "julia_koehler_nat:44:e0c02b", "marker": { "symbol": "circle" }, "showlegend": true, "legendgroup": "Susceptible", "orientation": "v", "hovertemplate": "variable=Susceptible<br>Beta=0.8<br>Time=%{x}<br>Number of Individuals=%{y}<extra></extra>" }, { "line": { "dash": "solid", "color": "#EF553B" }, "mode": "lines", "name": "Exposed", "type": "scatter", "xsrc": "julia_koehler_nat:44:85f7fe", "ysrc": "julia_koehler_nat:44:f8f122", "xaxis": "x", "yaxis": "y", "idssrc": "julia_koehler_nat:44:aaa5bd", "marker": { "symbol": "circle" }, "showlegend": true, "legendgroup": "Exposed", "orientation": "v", "hovertemplate": "variable=Exposed<br>Beta=0.8<br>Time=%{x}<br>Number of Individuals=%{y}<extra></extra>" }, { "line": { "dash": "solid", "color": "#00cc96" }, "mode": "lines", "name": "Infected", "type": "scatter", "xsrc": "julia_koehler_nat:44:7d740b", "ysrc": "julia_koehler_nat:44:9456ff", "xaxis": "x", "yaxis": "y", "idssrc": "julia_koehler_nat:44:fbb6bc", "marker": { "symbol": "circle" }, "showlegend": true, "legendgroup": "Infected", "orientation": "v", "hovertemplate": "variable=Infected<br>Beta=0.8<br>Time=%{x}<br>Number of Individuals=%{y}<extra></extra>" }, { "line": { "dash": "solid", "color": "#ab63fa" }, "mode": "lines", "name": "Recovered", "type": "scatter", "xsrc": "julia_koehler_nat:44:3416f9", "ysrc": "julia_koehler_nat:44:18e1ea", "xaxis": "x", "yaxis": "y", "idssrc": "julia_koehler_nat:44:d42733", "marker": { "symbol": "circle" }, "showlegend": true, "legendgroup": "Recovered", "orientation": "v", "hovertemplate": "variable=Recovered<br>Beta=0.8<br>Time=%{x}<br>Number of Individuals=%{y}<extra></extra>" } ], "name": "0.8" }, { "data": [ { "line": { "dash": "solid", "color": "#636efa" }, "mode": "lines", "name": "Susceptible", "type": "scatter", "xsrc": "julia_koehler_nat:44:2bf1c0", "ysrc": "julia_koehler_nat:44:7dcece", "xaxis": "x", "yaxis": "y", "idssrc": "julia_koehler_nat:44:0ba0c7", "marker": { "symbol": "circle" }, "showlegend": true, "legendgroup": "Susceptible", "orientation": "v", "hovertemplate": "variable=Susceptible<br>Beta=0.9<br>Time=%{x}<br>Number of Individuals=%{y}<extra></extra>" }, { "line": { "dash": "solid", "color": "#EF553B" }, "mode": "lines", "name": "Exposed", "type": "scatter", "xsrc": "julia_koehler_nat:44:f48d66", "ysrc": "julia_koehler_nat:44:16f7b0", "xaxis": "x", "yaxis": "y", "idssrc": "julia_koehler_nat:44:c5f494", "marker": { "symbol": "circle" }, "showlegend": true, "legendgroup": "Exposed", "orientation": "v", "hovertemplate": "variable=Exposed<br>Beta=0.9<br>Time=%{x}<br>Number of Individuals=%{y}<extra></extra>" }, { "line": { "dash": "solid", "color": "#00cc96" }, "mode": "lines", "name": "Infected", "type": "scatter", "xsrc": "julia_koehler_nat:44:49dfa7", "ysrc": "julia_koehler_nat:44:01e92e", "xaxis": "x", "yaxis": "y", "idssrc": "julia_koehler_nat:44:55a3dd", "marker": { "symbol": "circle" }, "showlegend": true, "legendgroup": "Infected", "orientation": "v", "hovertemplate": "variable=Infected<br>Beta=0.9<br>Time=%{x}<br>Number of Individuals=%{y}<extra></extra>" }, { "line": { "dash": "solid", "color": "#ab63fa" }, "mode": "lines", "name": "Recovered", "type": "scatter", "xsrc": "julia_koehler_nat:44:9358d7", "ysrc": "julia_koehler_nat:44:fc3927", "xaxis": "x", "yaxis": "y", "idssrc": "julia_koehler_nat:44:611a95", "marker": { "symbol": "circle" }, "showlegend": true, "legendgroup": "Recovered", "orientation": "v", "hovertemplate": "variable=Recovered<br>Beta=0.9<br>Time=%{x}<br>Number of Individuals=%{y}<extra></extra>" } ], "name": "0.9" } ], "layout": { "title": { "text": "SEIR Model Simulation" }, "xaxis": { "title": { "text": "Time" }, "anchor": "y", "domain": [ 0.0, 1.0 ], "tickformat": ".2f" }, "yaxis": { "title": { "text": "Number of Individuals" }, "anchor": "x", "domain": [ 0.0, 1.0 ] }, "legend": { "title": { "text": "variable" }, "tracegroupgap": 0 }, "sliders": [ { "x": 0.1, "y": 0, "len": 0.9, "pad": { "b": 10, "t": 60 }, "steps": [ { "args": [ [ "0.0" ], { "mode": "immediate", "frame": { "redraw": false, "duration": 0 }, "transition": { "easing": "linear", "duration": 0 }, "fromcurrent": true } ], "label": "0.0", "method": "animate" }, { "args": [ [ "0.1" ], { "mode": "immediate", "frame": { "redraw": false, "duration": 0 }, "transition": { "easing": "linear", "duration": 0 }, "fromcurrent": true } ], "label": "0.1", "method": "animate" }, { "args": [ [ "0.2" ], { "mode": "immediate", "frame": { "redraw": false, "duration": 0 }, "transition": { "easing": "linear", "duration": 0 }, "fromcurrent": true } ], "label": "0.2", "method": "animate" }, { "args": [ [ "0.30000000000000004" ], { "mode": "immediate", "frame": { "redraw": false, "duration": 0 }, "transition": { "easing": "linear", "duration": 0 }, "fromcurrent": true } ], "label": "0.30000000000000004", "method": "animate" }, { "args": [ [ "0.4" ], { "mode": "immediate", "frame": { "redraw": false, "duration": 0 }, "transition": { "easing": "linear", "duration": 0 }, "fromcurrent": true } ], "label": "0.4", "method": "animate" }, { "args": [ [ "0.5" ], { "mode": "immediate", "frame": { "redraw": false, "duration": 0 }, "transition": { "easing": "linear", "duration": 0 }, "fromcurrent": true } ], "label": "0.5", "method": "animate" }, { "args": [ [ "0.6000000000000001" ], { "mode": "immediate", "frame": { "redraw": false, "duration": 0 }, "transition": { "easing": "linear", "duration": 0 }, "fromcurrent": true } ], "label": "0.6000000000000001", "method": "animate" }, { "args": [ [ "0.7000000000000001" ], { "mode": "immediate", "frame": { "redraw": false, "duration": 0 }, "transition": { "easing": "linear", "duration": 0 }, "fromcurrent": true } ], "label": "0.7000000000000001", "method": "animate" }, { "args": [ [ "0.8" ], { "mode": "immediate", "frame": { "redraw": false, "duration": 0 }, "transition": { "easing": "linear", "duration": 0 }, "fromcurrent": true } ], "label": "0.8", "method": "animate" }, { "args": [ [ "0.9" ], { "mode": "immediate", "frame": { "redraw": false, "duration": 0 }, "transition": { "easing": "linear", "duration": 0 }, "fromcurrent": true } ], "label": "0.9", "method": "animate" } ], "active": 0, "xanchor": "left", "yanchor": "top", "currentvalue": { "prefix": "Beta=" } } ], "template": { "data": { "bar": [ { "type": "bar", "marker": { "line": { "color": "#E5ECF6", "width": 0.5 }, "pattern": { "size": 10, "fillmode": "overlay", "solidity": 0.2 } }, "error_x": { "color": "#2a3f5f" }, "error_y": { "color": "#2a3f5f" } } ], "pie": [ { "type": "pie", "automargin": true } ], "table": [ { "type": "table", "cells": { "fill": { "color": "#EBF0F8" }, "line": { "color": "white" } }, "header": { "fill": { "color": "#C8D4E3" }, "line": { "color": "white" } } } ], "carpet": [ { "type": "carpet", "aaxis": { "gridcolor": "white", "linecolor": "white", "endlinecolor": "#2a3f5f", "minorgridcolor": "white", "startlinecolor": "#2a3f5f" }, "baxis": { "gridcolor": "white", "linecolor": "white", "endlinecolor": "#2a3f5f", "minorgridcolor": "white", "startlinecolor": "#2a3f5f" } } ], "mesh3d": [ { "type": "mesh3d", "colorbar": { "ticks": "", "outlinewidth": 0 } } ], "contour": [ { "type": "contour", "colorbar": { "ticks": "", "outlinewidth": 0 }, "colorscale": [ [ 0.0, "#0d0887" ], [ 0.1111111111111111, "#46039f" ], [ 0.2222222222222222, "#7201a8" ], [ 0.3333333333333333, "#9c179e" ], [ 0.4444444444444444, "#bd3786" ], [ 0.5555555555555556, "#d8576b" ], [ 0.6666666666666666, "#ed7953" ], [ 0.7777777777777778, "#fb9f3a" ], [ 0.8888888888888888, "#fdca26" ], [ 1.0, "#f0f921" ] ] } ], "heatmap": [ { "type": "heatmap", "colorbar": { "ticks": "", "outlinewidth": 0 }, "colorscale": [ [ 0.0, "#0d0887" ], [ 0.1111111111111111, "#46039f" ], [ 0.2222222222222222, "#7201a8" ], [ 0.3333333333333333, "#9c179e" ], [ 0.4444444444444444, "#bd3786" ], [ 0.5555555555555556, "#d8576b" ], [ 0.6666666666666666, "#ed7953" ], [ 0.7777777777777778, "#fb9f3a" ], [ 0.8888888888888888, "#fdca26" ], [ 1.0, "#f0f921" ] ] } ], "scatter": [ { "type": "scatter", "fillpattern": { "size": 10, "fillmode": "overlay", "solidity": 0.2 } } ], "surface": [ { "type": "surface", "colorbar": { "ticks": "", "outlinewidth": 0 }, "colorscale": [ [ 0.0, "#0d0887" ], [ 0.1111111111111111, "#46039f" ], [ 0.2222222222222222, "#7201a8" ], [ 0.3333333333333333, "#9c179e" ], [ 0.4444444444444444, "#bd3786" ], [ 0.5555555555555556, "#d8576b" ], [ 0.6666666666666666, "#ed7953" ], [ 0.7777777777777778, "#fb9f3a" ], [ 0.8888888888888888, "#fdca26" ], [ 1.0, "#f0f921" ] ] } ], "barpolar": [ { "type": "barpolar", "marker": { "line": { "color": "#E5ECF6", "width": 0.5 }, "pattern": { "size": 10, "fillmode": "overlay", "solidity": 0.2 } } } ], "heatmapgl": [ { "type": "heatmapgl", "colorbar": { "ticks": "", "outlinewidth": 0 }, "colorscale": [ [ 0.0, "#0d0887" ], [ 0.1111111111111111, "#46039f" ], [ 0.2222222222222222, "#7201a8" ], [ 0.3333333333333333, "#9c179e" ], [ 0.4444444444444444, "#bd3786" ], [ 0.5555555555555556, "#d8576b" ], [ 0.6666666666666666, "#ed7953" ], [ 0.7777777777777778, "#fb9f3a" ], [ 0.8888888888888888, "#fdca26" ], [ 1.0, "#f0f921" ] ] } ], "histogram": [ { "type": "histogram", "marker": { "pattern": { "size": 10, "fillmode": "overlay", "solidity": 0.2 } } } ], "parcoords": [ { "line": { "colorbar": { "ticks": "", "outlinewidth": 0 } }, "type": "parcoords" } ], "scatter3d": [ { "line": { "colorbar": { "ticks": "", "outlinewidth": 0 } }, "type": "scatter3d", "marker": { "colorbar": { "ticks": "", "outlinewidth": 0 } } } ], "scattergl": [ { "type": "scattergl", "marker": { "colorbar": { "ticks": "", "outlinewidth": 0 } } } ], "choropleth": [ { "type": "choropleth", "colorbar": { "ticks": "", "outlinewidth": 0 } } ], "scattergeo": [ { "type": "scattergeo", "marker": { "colorbar": { "ticks": "", "outlinewidth": 0 } } } ], "histogram2d": [ { "type": "histogram2d", "colorbar": { "ticks": "", "outlinewidth": 0 }, "colorscale": [ [ 0.0, "#0d0887" ], [ 0.1111111111111111, "#46039f" ], [ 0.2222222222222222, "#7201a8" ], [ 0.3333333333333333, "#9c179e" ], [ 0.4444444444444444, "#bd3786" ], [ 0.5555555555555556, "#d8576b" ], [ 0.6666666666666666, "#ed7953" ], [ 0.7777777777777778, "#fb9f3a" ], [ 0.8888888888888888, "#fdca26" ], [ 1.0, "#f0f921" ] ] } ], "scatterpolar": [ { "type": "scatterpolar", "marker": { "colorbar": { "ticks": "", "outlinewidth": 0 } } } ], "contourcarpet": [ { "type": "contourcarpet", "colorbar": { "ticks": "", "outlinewidth": 0 } } ], "scattercarpet": [ { "type": "scattercarpet", "marker": { "colorbar": { "ticks": "", "outlinewidth": 0 } } } ], "scattermapbox": [ { "type": "scattermapbox", "marker": { "colorbar": { "ticks": "", "outlinewidth": 0 } } } ], "scatterpolargl": [ { "type": "scatterpolargl", "marker": { "colorbar": { "ticks": "", "outlinewidth": 0 } } } ], "scatterternary": [ { "type": "scatterternary", "marker": { "colorbar": { "ticks": "", "outlinewidth": 0 } } } ], "histogram2dcontour": [ { "type": "histogram2dcontour", "colorbar": { "ticks": "", "outlinewidth": 0 }, "colorscale": [ [ 0.0, "#0d0887" ], [ 0.1111111111111111, "#46039f" ], [ 0.2222222222222222, "#7201a8" ], [ 0.3333333333333333, "#9c179e" ], [ 0.4444444444444444, "#bd3786" ], [ 0.5555555555555556, "#d8576b" ], [ 0.6666666666666666, "#ed7953" ], [ 0.7777777777777778, "#fb9f3a" ], [ 0.8888888888888888, "#fdca26" ], [ 1.0, "#f0f921" ] ] } ] }, "layout": { "geo": { "bgcolor": "white", "showland": true, "lakecolor": "white", "landcolor": "#E5ECF6", "showlakes": true, "subunitcolor": "white" }, "font": { "color": "#2a3f5f" }, "polar": { "bgcolor": "#E5ECF6", "radialaxis": { "ticks": "", "gridcolor": "white", "linecolor": "white" }, "angularaxis": { "ticks": "", "gridcolor": "white", "linecolor": "white" } }, "scene": { "xaxis": { "ticks": "", "gridcolor": "white", "gridwidth": 2, "linecolor": "white", "zerolinecolor": "white", "showbackground": true, "backgroundcolor": "#E5ECF6" }, "yaxis": { "ticks": "", "gridcolor": "white", "gridwidth": 2, "linecolor": "white", "zerolinecolor": "white", "showbackground": true, "backgroundcolor": "#E5ECF6" }, "zaxis": { "ticks": "", "gridcolor": "white", "gridwidth": 2, "linecolor": "white", "zerolinecolor": "white", "showbackground": true, "backgroundcolor": "#E5ECF6" } }, "title": { "x": 0.05 }, "xaxis": { "ticks": "", "title": { "standoff": 15 }, "gridcolor": "white", "linecolor": "white", "automargin": true, "zerolinecolor": "white", "zerolinewidth": 2 }, "yaxis": { "ticks": "", "title": { "standoff": 15 }, "gridcolor": "white", "linecolor": "white", "automargin": true, "zerolinecolor": "white", "zerolinewidth": 2 }, "mapbox": { "style": "light" }, "ternary": { "aaxis": { "ticks": "", "gridcolor": "white", "linecolor": "white" }, "baxis": { "ticks": "", "gridcolor": "white", "linecolor": "white" }, "caxis": { "ticks": "", "gridcolor": "white", "linecolor": "white" }, "bgcolor": "#E5ECF6" }, "colorway": [ "#636efa", "#EF553B", "#00cc96", "#ab63fa", "#FFA15A", "#19d3f3", "#FF6692", "#B6E880", "#FF97FF", "#FECB52" ], "coloraxis": { "colorbar": { "ticks": "", "outlinewidth": 0 } }, "hovermode": "closest", "colorscale": { "diverging": [ [ 0, "#8e0152" ], [ 0.1, "#c51b7d" ], [ 0.2, "#de77ae" ], [ 0.3, "#f1b6da" ], [ 0.4, "#fde0ef" ], [ 0.5, "#f7f7f7" ], [ 0.6, "#e6f5d0" ], [ 0.7, "#b8e186" ], [ 0.8, "#7fbc41" ], [ 0.9, "#4d9221" ], [ 1, "#276419" ] ], "sequential": [ [ 0.0, "#0d0887" ], [ 0.1111111111111111, "#46039f" ], [ 0.2222222222222222, "#7201a8" ], [ 0.3333333333333333, "#9c179e" ], [ 0.4444444444444444, "#bd3786" ], [ 0.5555555555555556, "#d8576b" ], [ 0.6666666666666666, "#ed7953" ], [ 0.7777777777777778, "#fb9f3a" ], [ 0.8888888888888888, "#fdca26" ], [ 1.0, "#f0f921" ] ], "sequentialminus": [ [ 0.0, "#0d0887" ], [ 0.1111111111111111, "#46039f" ], [ 0.2222222222222222, "#7201a8" ], [ 0.3333333333333333, "#9c179e" ], [ 0.4444444444444444, "#bd3786" ], [ 0.5555555555555556, "#d8576b" ], [ 0.6666666666666666, "#ed7953" ], [ 0.7777777777777778, "#fb9f3a" ], [ 0.8888888888888888, "#fdca26" ], [ 1.0, "#f0f921" ] ] }, "hoverlabel": { "align": "left" }, "plot_bgcolor": "#E5ECF6", "paper_bgcolor": "white", "shapedefaults": { "line": { "color": "#2a3f5f" } }, "autotypenumbers": "strict", "annotationdefaults": { "arrowhead": 0, "arrowcolor": "#2a3f5f", "arrowwidth": 1 } } }, "updatemenus": [ { "x": 0.1, "y": 0, "pad": { "r": 10, "t": 70 }, "type": "buttons", "buttons": [ { "args": [ null, { "mode": "immediate", "frame": { "redraw": false, "duration": 500 }, "transition": { "easing": "linear", "duration": 500 }, "fromcurrent": true } ], "label": "▶", "method": "animate" }, { "args": [ [ null ], { "mode": "immediate", "frame": { "redraw": false, "duration": 0 }, "transition": { "easing": "linear", "duration": 0 }, "fromcurrent": true } ], "label": "◼", "method": "animate" } ], "xanchor": "right", "yanchor": "top", "direction": "left", "showactive": false } ], "plot_bgcolor": "black", "paper_bgcolor": "black" } }, "height": null, "width": null, "user": { "profile_url": "https://chart-studio.plotly.com/~julia_koehler_nat", "avatar_url": "https://storage.googleapis.com/plotly-prod-profiles/47.jpg", "background_url": "https://storage.googleapis.com/plotly-prod-profiles/bg-9.jpg", "bio": "", "nickname": "", "website": "", "stream_tokens": null, "feature_set_id": null, "csrf_token": null, "date_joined": "2024-01-12 11:03:33", "mapbox_access_tokens": null, "has_password": null, "username": "julia_koehler_nat", "email": null, "is_active": null, "readonly": null, "is_dash_creator": null, "dash_created_count": null, "is_chart_creator": null, "charts_created_count": null } }, { "creation_time": "2024-04-03T14:18:01.489441Z", "comments": { "results": [], "count": 0 }, "parented": true, "embed_url": "https://chart-studio.plotly.com/~leonsun1024/1214.embed", "fid": "leonsun1024:1214", "filename": "GRT_ICP_related_price_data_20210708-20240403_distribution", "filetype": "plot", "img_url": "https://storage.googleapis.com/plotly-prod-images/leonsun1024/1214/9_D7OZV4GXQA2JPH35KP16SZUFI9RTHJ.png", "image_urls": { "default": "https://storage.googleapis.com/plotly-prod-images/leonsun1024/1214/2_DX2NCVKLVS88WZYA1F8RFMVFWILOP4.png", "block-thumb": "https://storage.googleapis.com/plotly-prod-images/leonsun1024/1214/8_DCY2CEQEUKJ9QH5V1Y3SJTHF2MXHG0.png", "list-thumb": "https://storage.googleapis.com/plotly-prod-images/leonsun1024/1214/9_D7OZV4GXQA2JPH35KP16SZUFI9RTHJ.png" }, "api_urls": { "files": "https://api.plotly.com/v2/files/leonsun1024:1214", "plots": "https://api.plotly.com/v2/plots/leonsun1024:1214", "parent": "https://api.plotly.com/v2/folders/home?user=leonsun1024" }, "owner": "leonsun1024", "parent": -1, "preview": "", "referencers": [], "references": [], "title": "", "views": 12, "web_url": "https://chart-studio.plotly.com/~leonsun1024/1214/", "world_readable": true, "date_modified": "2024-04-03T14:18:01.974Z", "stars": { "results": [], "count": 0 }, "collaborators": { "results": [], "count": 0 }, "subfolder_count": null, "refresh_interval": null, "organize_view_url": "https://chart-studio.plotly.com/~leonsun1024/1214/", "current_user_permission": "read", "is_theme": null, "is_template": null, "autosize": true, "caption": "", "figure": { "data": [ { "type": "bar", "xsrc": "leonsun1024:1215:f5dcd5", "ysrc": "leonsun1024:1215:c67982" } ], "layout": {} }, "height": null, "width": null, "user": { "profile_url": "https://chart-studio.plotly.com/~leonsun1024", "avatar_url": "https://storage.googleapis.com/plotly-prod-profiles/99.jpg", "background_url": "https://storage.googleapis.com/plotly-prod-profiles/bg-4.jpg", "bio": "", "nickname": "", "website": "", "stream_tokens": null, "feature_set_id": null, "csrf_token": null, "date_joined": "2023-05-05 15:58:38", "mapbox_access_tokens": null, "has_password": null, "username": "leonsun1024", "email": null, "is_active": null, "readonly": null, "is_dash_creator": null, "dash_created_count": null, "is_chart_creator": null, "charts_created_count": null } }, { "creation_time": "2024-04-03T14:17:17.905099Z", "comments": { "results": [], "count": 0 }, "parented": true, "embed_url": "https://chart-studio.plotly.com/~ASCIVOLETTO/49.embed", "fid": "ASCIVOLETTO:49", "filename": "VCGENAPRILUP", "filetype": "plot", "img_url": "https://storage.googleapis.com/plotly-prod-images/ASCIVOLETTO/49/9_5IIKO4J2S5KB7MAKVQAXI55HJEICAN.png", "image_urls": { "default": "https://storage.googleapis.com/plotly-prod-images/ASCIVOLETTO/49/2_DOU8FZGLW3LSHWCOPY066LKVHH4TLO.png", "block-thumb": "https://storage.googleapis.com/plotly-prod-images/ASCIVOLETTO/49/8_7TUH8PDM06RYZ0WT6XCWEATPCGBPY8.png", "list-thumb": "https://storage.googleapis.com/plotly-prod-images/ASCIVOLETTO/49/9_5IIKO4J2S5KB7MAKVQAXI55HJEICAN.png" }, "api_urls": { "files": "https://api.plotly.com/v2/files/ASCIVOLETTO:49", "plots": "https://api.plotly.com/v2/plots/ASCIVOLETTO:49", "parent": "https://api.plotly.com/v2/folders/home?user=ASCIVOLETTO" }, "owner": "ASCIVOLETTO", "parent": -1, "preview": "", "referencers": [], "references": [], "title": "", "views": 1, "web_url": "https://chart-studio.plotly.com/~ASCIVOLETTO/49/", "world_readable": true, "date_modified": "2024-04-03T14:17:17.914Z", "stars": { "results": [], "count": 0 }, "collaborators": { "results": [], "count": 0 }, "subfolder_count": null, "refresh_interval": null, "organize_view_url": "https://chart-studio.plotly.com/~ASCIVOLETTO/49/", "current_user_permission": "read", "is_theme": null, "is_template": false, "autosize": true, "caption": "", "figure": { "data": [ { "box": { "visible": false }, "uid": "1824af", "line": { "dash": "solid", "color": "rgb(6, 6, 6)", "shape": "linear", "width": 1 }, "meta": { "columnNames": { "x": "A", "y": "C" } }, "mode": "lines", "name": "Coef Trend", "side": "both", "type": "violin", "xsrc": "ASCIVOLETTO:48:ecee99", "ysrc": "ASCIVOLETTO:48:365af1", "marker": { "line": { "color": "rgb(6, 6, 6)", "width": 0 }, "size": 1, "color": "rgb(6, 6, 6)", "symbol": "circle", "opacity": 1 }, "opacity": 1, "visible": true, "meanline": { "visible": false }, "spanmode": "soft", "bandwidth": 0, "boxpoints": false, "fillcolor": "rgba(2, 2, 2, 0.5)", "scalemode": "width", "showlegend": false, "orientation": "v" }, { "uid": "0cbf81", "fill": "tonexty", "line": { "color": "rgb(6, 6, 6)", "width": 1 }, "meta": { "columnNames": { "x": "A", "y": "D" } }, "mode": "lines", "type": "box", "xsrc": "ASCIVOLETTO:48:ecee99", "ysrc": "ASCIVOLETTO:48:6ac6df", "width": 0, "jitter": 0, "boxmean": false, "hoveron": "boxes+points", "notched": true, "opacity": 1, "boxpoints": false, "fillcolor": "rgb(230, 236, 254)", "hoverinfo": "x+y+name", "hoverlabel": { "namelength": 15 }, "notchwidth": 0.10000000000000003, "showlegend": false, "stackgroup": null, "connectgaps": true, "whiskerwidth": 0.2, "hovertemplate": "" }, { "uid": "12ee11", "meta": { "columnNames": { "x": "E", "y": "F" } }, "mode": "markers", "name": "Pre", "type": "scatter", "xsrc": "ASCIVOLETTO:48:02c26d", "ysrc": "ASCIVOLETTO:48:d2d8fe", "marker": { "line": { "color": "rgb(18, 18, 18)", "width": 1 }, "size": 8, "color": "rgb(85, 160, 231)", "symbol": "circle", "maxdisplayed": 18 }, "boxpoints": false, "showlegend": true }, { "uid": "30e82f", "meta": { "columnNames": { "x": "G", "y": "H" } }, "mode": "markers", "name": "Post", "type": "scatter", "xsrc": "ASCIVOLETTO:48:2cf2d3", "ysrc": "ASCIVOLETTO:48:2654fe", "marker": { "line": { "color": "rgb(5, 5, 5)", "width": 1 }, "size": 8, "color": "rgb(85, 160, 231)" }, "visible": true, "stackgroup": null } ], "frames": [], "layout": { "font": { "size": 14, "color": "rgb(10, 9, 9)", "family": "Times New Roman" }, "title": { "x": 0.5, "font": { "size": 17 }, "text": "" }, "xaxis": { "side": "bottom", "type": "linear", "range": [ -8.5, 12.5 ], "title": { "text": "Quarters to Transaction" }, "domain": [ 0, 1 ], "nticks": 17, "showgrid": true, "showline": true, "zeroline": false, "autorange": false, "gridwidth": 1, "linewidth": 1, "showspikes": false, "rangeslider": { "range": [ 1, 10 ], "yaxis": {}, "visible": false, "autorange": true }, "zerolinecolor": "rgb(92, 129, 189)", "zerolinewidth": 13 }, "yaxis": { "side": "left", "type": "linear", "range": [ -0.6, 0.6 ], "ticks": "outside", "title": { "text": "Score" }, "domain": [ 0.0071532231178051036, 1 ], "nticks": 9, "ticklen": 4, "showline": true, "autorange": false, "tickwidth": 1 }, "boxgap": 0.88, "legend": { "x": 0.8545079587622635, "y": 0.8894999077400635, "font": { "size": 12 }, "title": { "font": { "size": 14 }, "text": "Legend:" }, "valign": "top", "bgcolor": "rgb(248, 252, 255)", "xanchor": "center", "yanchor": "middle", "itemsizing": "trace", "traceorder": "normal", "bordercolor": "rgb(3, 0, 0)", "borderwidth": 1, "orientation": "v" }, "shapes": [ { "x0": 0, "x1": 0.001, "y0": 1, "y1": -1, "line": { "dash": "dot", "color": "rgb(245, 1, 1)", "width": 1 }, "type": "rect", "opacity": 1, "fillcolor": "rgb(0, 0, 0)" }, { "x0": -8, "x1": -8.0001, "y0": -0.1124477, "y1": 0.1995922, "line": { "color": "#444444", "width": 1 }, "opacity": 1, "fillcolor": "rgb(5, 5, 5)" }, { "x0": -13, "x1": 13, "y0": 0, "y1": 0.001, "line": { "color": "rgb(8, 8, 8)", "width": 1 }, "opacity": 1, "fillcolor": "rgb(3, 3, 3)" }, { "x0": -7, "x1": -7.0001, "y0": -0.1157042, "y1": 0.211451, "line": { "color": "#444444", "width": 1 }, "opacity": 1, "fillcolor": "rgb(13, 13, 13)" }, { "x0": -6, "x1": -6.0001, "y0": -0.2091453, "y1": 0.1790035, "line": { "color": "#444444", "width": 1 }, "opacity": 1, "fillcolor": "rgb(5, 5, 5)" }, { "x0": -5, "x1": -5.0001, "y0": -0.1285395, "y1": 0.1385468, "line": { "color": "#444444", "width": 1 }, "opacity": 1, "fillcolor": "rgb(68, 68, 68)" }, { "x0": -4, "x1": -4.0001, "y0": -0.2273415, "y1": 0.0880791, "line": { "color": "#444444", "width": 1 }, "opacity": 1, "fillcolor": "rgb(68, 68, 68)" }, { "x0": -3, "x1": -3.0001, "y0": -0.2028382, "y1": 0.1635668, "line": { "color": "#444444", "width": 1 }, "opacity": 1, "fillcolor": "rgb(68, 68, 68)" }, { "x0": -2, "x1": -2.0001, "y0": -0.1988805, "y1": 0.0049189, "line": { "color": "#444444", "width": 1 }, "opacity": 1, "fillcolor": "rgb(68, 68, 68)" }, { "x0": 0, "x1": 0.0001, "y0": -0.2872954, "y1": -0.0812451, "line": { "color": "#444444", "width": 1 }, "opacity": 1, "fillcolor": "rgb(68, 68, 68)" }, { "x0": 1, "x1": 1.0001, "y0": -0.4701053, "y1": -0.0594784, "line": { "color": "#444444", "width": 1 }, "opacity": 1, "fillcolor": "rgb(68, 68, 68)" }, { "x0": 2, "x1": 2.0001, "y0": -0.4209257, "y1": -0.0087079, "line": { "color": "#444444", "width": 1 }, "opacity": 1, "fillcolor": "rgb(68, 68, 68)" }, { "x0": 3, "x1": 3.0001, "y0": -0.4374738, "y1": -0.0797005, "line": { "color": "#444444", "width": 1 }, "opacity": 1, "fillcolor": "rgb(68, 68, 68)" }, { "x0": 4, "x1": 4.0001, "y0": -0.3517234, "y1": -0.1340711, "line": { "color": "#444444", "width": 1 }, "opacity": 1, "fillcolor": "rgb(68, 68, 68)" }, { "x0": 5, "x1": 5.0001, "y0": -0.5467668, "y1": -0.1526276, "line": { "color": "#444444", "width": 1 }, "opacity": 1, "fillcolor": "rgb(68, 68, 68)" }, { "x0": 6, "x1": 6.0001, "y0": -0.4200838, "y1": -0.0405217, "line": { "color": "#444444", "width": 1 }, "opacity": 1, "fillcolor": "rgb(68, 68, 68)" }, { "x0": 7, "x1": 7.0001, "y0": -0.4296701, "y1": -0.0934687, "line": { "color": "#444444", "width": 1 }, "opacity": 1, "fillcolor": "rgb(68, 68, 68)" }, { "x0": 8, "x1": 8.0001, "y0": -0.4067217, "y1": -0.0378387, "line": { "color": "#444444", "width": 1 }, "opacity": 1, "fillcolor": "rgb(68, 68, 68)" }, { "x0": 9, "x1": 9.0001, "y0": -0.4521592, "y1": -0.0942071, "line": { "color": "#444444", "width": 1 }, "opacity": 1, "fillcolor": "rgb(68, 68, 68)" }, { "x0": 10, "x1": 10.0001, "y0": -0.4745731, "y1": -0.1175519, "line": { "color": "#444444", "width": 1 }, "opacity": 1, "fillcolor": "rgb(68, 68, 68)" }, { "x0": 11, "x1": 11.0001, "y0": -0.5048536, "y1": -0.2262327, "line": { "color": "#444444", "width": 1 }, "opacity": 1, "fillcolor": "rgb(68, 68, 68)" }, { "x0": 12, "x1": 12.0001, "y0": -0.5881219, "y1": -0.2248211, "line": { "color": "#444444", "width": 1 }, "opacity": 1, "fillcolor": "rgb(68, 68, 68)" }, { "x0": -12.5, "x1": 12.5, "y0": -0.6, "y1": -0.5999, "line": { "color": "rgb(0, 0, 0)", "width": 2 }, "opacity": 1, "fillcolor": "rgb(8, 8, 8)" }, { "x0": -8.5, "x1": -8.5001, "y0": -1.5, "y1": 1.5, "line": { "color": "rgb(5, 5, 5)", "width": 2 }, "opacity": 1, "fillcolor": "rgb(8, 8, 8)" } ], "boxmode": "overlay", "modebar": { "color": "rgba(98, 15, 15, 0.3)", "bgcolor": "rgba(144, 81, 81, 0.5)", "activecolor": "rgba(227, 178, 178, 0.7)", "orientation": "v" }, "autosize": true, "dragmode": "lasso", "template": { "data": { "bar": [ { "type": "bar", "marker": { "colorbar": { "ticks": "", "outlinewidth": 0 } } } ], "table": [ { "type": "table", "cells": { "fill": { "color": "#EBF0F8" }, "line": { "color": "white" } }, "header": { "fill": { "color": "#C8D4E3" }, "line": { "color": "white" } } } ], "carpet": [ { "type": "carpet", "aaxis": { "gridcolor": "#C8D4E3", "linecolor": "#C8D4E3", "endlinecolor": "#2a3f5f", "minorgridcolor": "#C8D4E3", "startlinecolor": "#2a3f5f" }, "baxis": { "gridcolor": "#C8D4E3", "linecolor": "#C8D4E3", "endlinecolor": "#2a3f5f", "minorgridcolor": "#C8D4E3", "startlinecolor": "#2a3f5f" } } ], "mesh3d": [ { "type": "mesh3d", "colorbar": { "ticks": "", "outlinewidth": 0 } } ], "contour": [ { "type": "contour", "colorbar": { "ticks": "", "outlinewidth": 0 }, "autocolorscale": true } ], "heatmap": [ { "type": "heatmap", "colorbar": { "ticks": "", "outlinewidth": 0 }, "autocolorscale": true } ], "scatter": [ { "type": "scatter", "marker": { "colorbar": { "ticks": "", "outlinewidth": 0 } } } ], "surface": [ { "type": "surface", "colorbar": { "ticks": "", "outlinewidth": 0 } } ], "heatmapgl": [ { "type": "heatmapgl", "colorbar": { "ticks": "", "outlinewidth": 0 } } ], "histogram": [ { "type": "histogram", "marker": { "colorbar": { "ticks": "", "outlinewidth": 0 } } } ], "parcoords": [ { "line": { "colorbar": { "ticks": "", "outlinewidth": 0 } }, "type": "parcoords" } ], "scatter3d": [ { "type": "scatter3d", "marker": { "colorbar": { "ticks": "", "outlinewidth": 0 } } } ], "scattergl": [ { "type": "scattergl", "marker": { "colorbar": { "ticks": "", "outlinewidth": 0 } } } ], "choropleth": [ { "type": "choropleth", "colorbar": { "ticks": "", "outlinewidth": 0 } } ], "scattergeo": [ { "type": "scattergeo", "marker": { "colorbar": { "ticks": "", "outlinewidth": 0 } } } ], "histogram2d": [ { "type": "histogram2d", "colorbar": { "ticks": "", "outlinewidth": 0 }, "autocolorscale": true } ], "scatterpolar": [ { "type": "scatterpolar", "marker": { "colorbar": { "ticks": "", "outlinewidth": 0 } } } ], "contourcarpet": [ { "type": "contourcarpet", "colorbar": { "ticks": "", "outlinewidth": 0 } } ], "scattercarpet": [ { "type": "scattercarpet", "marker": { "colorbar": { "ticks": "", "outlinewidth": 0 } } } ], "scattermapbox": [ { "type": "scattermapbox", "marker": { "colorbar": { "ticks": "", "outlinewidth": 0 } } } ], "scatterpolargl": [ { "type": "scatterpolargl", "marker": { "colorbar": { "ticks": "", "outlinewidth": 0 } } } ], "scatterternary": [ { "type": "scatterternary", "marker": { "colorbar": { "ticks": "", "outlinewidth": 0 } } } ], "histogram2dcontour": [ { "type": "histogram2dcontour", "colorbar": { "ticks": "", "outlinewidth": 0 }, "autocolorscale": true } ] }, "layout": { "geo": { "bgcolor": "white", "showland": true, "lakecolor": "white", "landcolor": "white", "showlakes": true, "subunitcolor": "#C8D4E3" }, "font": { "color": "#2a3f5f" }, "polar": { "bgcolor": "white", "radialaxis": { "ticks": "", "gridcolor": "#EBF0F8", "linecolor": "#EBF0F8" }, "angularaxis": { "ticks": "", "gridcolor": "#EBF0F8", "linecolor": "#EBF0F8" } }, "scene": { "xaxis": { "ticks": "", "gridcolor": "#DFE8F3", "gridwidth": 2, "linecolor": "#EBF0F8", "zerolinecolor": "#EBF0F8", "showbackground": true, "backgroundcolor": "white" }, "yaxis": { "ticks": "", "gridcolor": "#DFE8F3", "gridwidth": 2, "linecolor": "#EBF0F8", "zerolinecolor": "#EBF0F8", "showbackground": true, "backgroundcolor": "white" }, "zaxis": { "ticks": "", "gridcolor": "#DFE8F3", "gridwidth": 2, "linecolor": "#EBF0F8", "zerolinecolor": "#EBF0F8", "showbackground": true, "backgroundcolor": "white" } }, "title": { "x": 0.05 }, "xaxis": { "ticks": "", "gridcolor": "#EBF0F8", "linecolor": "#EBF0F8", "automargin": true, "zerolinecolor": "#EBF0F8", "zerolinewidth": 2 }, "yaxis": { "ticks": "", "gridcolor": "#EBF0F8", "linecolor": "#EBF0F8", "automargin": true, "zerolinecolor": "#EBF0F8", "zerolinewidth": 2 }, "ternary": { "aaxis": { "ticks": "", "gridcolor": "#DFE8F3", "linecolor": "#A2B1C6" }, "baxis": { "ticks": "", "gridcolor": "#DFE8F3", "linecolor": "#A2B1C6" }, "caxis": { "ticks": "", "gridcolor": "#DFE8F3", "linecolor": "#A2B1C6" }, "bgcolor": "white" }, "colorway": [ "#636efa", "#EF553B", "#00cc96", "#ab63fa", "#19d3f3", "#e763fa", "#fecb52", "#ffa15a", "#ff6692", "#b6e880" ], "hovermode": "closest", "colorscale": { "diverging": [ [ 0, "#8e0152" ], [ 0.1, "#c51b7d" ], [ 0.2, "#de77ae" ], [ 0.3, "#f1b6da" ], [ 0.4, "#fde0ef" ], [ 0.5, "#f7f7f7" ], [ 0.6, "#e6f5d0" ], [ 0.7, "#b8e186" ], [ 0.8, "#7fbc41" ], [ 0.9, "#4d9221" ], [ 1, "#276419" ] ], "sequential": [ [ 0, "#0508b8" ], [ 0.0893854748603352, "#1910d8" ], [ 0.1787709497206704, "#3c19f0" ], [ 0.2681564245810056, "#6b1cfb" ], [ 0.3575418994413408, "#981cfd" ], [ 0.44692737430167595, "#bf1cfd" ], [ 0.5363128491620112, "#dd2bfd" ], [ 0.6256983240223464, "#f246fe" ], [ 0.7150837988826816, "#fc67fd" ], [ 0.8044692737430168, "#fe88fc" ], [ 0.8938547486033519, "#fea5fd" ], [ 0.9832402234636871, "#febefe" ], [ 1, "#fec3fe" ] ], "sequentialminus": [ [ 0, "#0508b8" ], [ 0.0893854748603352, "#1910d8" ], [ 0.1787709497206704, "#3c19f0" ], [ 0.2681564245810056, "#6b1cfb" ], [ 0.3575418994413408, "#981cfd" ], [ 0.44692737430167595, "#bf1cfd" ], [ 0.5363128491620112, "#dd2bfd" ], [ 0.6256983240223464, "#f246fe" ], [ 0.7150837988826816, "#fc67fd" ], [ 0.8044692737430168, "#fe88fc" ], [ 0.8938547486033519, "#fea5fd" ], [ 0.9832402234636871, "#febefe" ], [ 1, "#fec3fe" ] ] }, "plot_bgcolor": "white", "paper_bgcolor": "white", "shapedefaults": { "line": { "width": 0 }, "opacity": 0.4, "fillcolor": "#506784" }, "annotationdefaults": { "arrowhead": 0, "arrowcolor": "#506784", "arrowwidth": 1 } }, "themeRef": "PLOTLY_WHITE" }, "hovermode": "x", "violingap": 0.88, "colorscale": { "sequential": [ [ 0, "#00224e" ], [ 0.1111111111111111, "#123570" ], [ 0.2222222222222222, "#3b496c" ], [ 0.3333333333333333, "#575d6d" ], [ 0.4444444444444444, "#707173" ], [ 0.5555555555555556, "#8a8678" ], [ 0.6666666666666666, "#a59c74" ], [ 0.7777777777777778, "#c3b369" ], [ 0.8888888888888888, "#e1cc55" ], [ 1, "#fee838" ] ] }, "hoverlabel": { "font": { "size": 14 } }, "showlegend": false, "boxgroupgap": 0.12, "uniformtext": { "mode": false }, "plot_bgcolor": "rgb(255, 255, 255)", "paper_bgcolor": "rgb(255, 255, 255)", "violingroupgap": 0.12 } }, "height": null, "width": null, "user": { "profile_url": "https://chart-studio.plotly.com/~ASCIVOLETTO", "avatar_url": "https://storage.googleapis.com/plotly-prod-profiles/96.jpg", "background_url": "https://storage.googleapis.com/plotly-prod-profiles/bg-7.jpg", "bio": "", "nickname": "", "website": "", "stream_tokens": null, "feature_set_id": null, "csrf_token": null, "date_joined": "2023-03-30 13:28:23", "mapbox_access_tokens": null, "has_password": null, "username": "ASCIVOLETTO", "email": null, "is_active": null, "readonly": null, "is_dash_creator": null, "dash_created_count": null, "is_chart_creator": null, "charts_created_count": null } }, { "creation_time": "2024-04-03T14:02:09.132313Z", "comments": { "results": [], "count": 0 }, "parented": true, "embed_url": "https://chart-studio.plotly.com/~harharidisd/1.embed", "fid": "harharidisd:1", "filename": "Plot 1", "filetype": "plot", "img_url": "https://api.plotly.com/v2/files/harharidisd:1/image?image_name=list-thumb", "image_urls": { "default": "https://storage.googleapis.com/plotly-prod-images/harharidisd/1/2_JKC2MME9RRHI4MRGTEIHAZ7GLIK8U3.png", "block-thumb": "https://storage.googleapis.com/plotly-prod-images/harharidisd/1/8_CL0OAVUUYFYZWW1FIX436JN18DI0ZI.png", "list-thumb": "https://api.plotly.com/v2/files/harharidisd:1/image?image_name=list-thumb" }, "api_urls": { "files": "https://api.plotly.com/v2/files/harharidisd:1", "plots": "https://api.plotly.com/v2/plots/harharidisd:1", "parent": "https://api.plotly.com/v2/folders/home?user=harharidisd" }, "owner": "harharidisd", "parent": -1, "preview": "", "referencers": [], "references": [], "title": "", "views": 2, "web_url": "https://chart-studio.plotly.com/~harharidisd/1/", "world_readable": true, "date_modified": "2024-05-29T10:20:35.878Z", "stars": { "results": [], "count": 0 }, "collaborators": { "results": [], "count": 0 }, "subfolder_count": null, "refresh_interval": null, "organize_view_url": "https://chart-studio.plotly.com/~harharidisd/1/", "current_user_permission": "read", "is_theme": null, "is_template": false, "autosize": true, "caption": "", "figure": { "data": [ { "isrc": "harharidisd:0:03969c", "jsrc": "harharidisd:0:d7ce12", "ksrc": "harharidisd:0:aba129", "meta": { "columnNames": { "i": "D", "j": "E", "k": "F", "x": "A", "y": "B", "z": "C", "text": "", "intensity": "" } }, "name": "y", "text": "", "type": "mesh3d", "xsrc": "harharidisd:0:d3d178", "ysrc": "harharidisd:0:5cd036", "zsrc": "harharidisd:0:5524cd", "color": "#f1f1f1", "contour": { "show": false }, "opacity": 1, "visible": true, "colorbar": { "title": { "text": "z" } }, "lighting": { "ambient": 1, "diffuse": 1, "fresnel": 0, "specular": 0, "roughness": 0.5, "facenormalsepsilon": 0, "vertexnormalsepsilon": 0 }, "alphahull": -1, "hoverinfo": "x+y+z+name", "hovertext": "", "showscale": true, "xcalendar": "gregorian", "ycalendar": "gregorian", "zcalendar": "gregorian", "colorscale": [ [ "0", "rgb(255, 0, 0)" ], [ "0.5", "rgb(0, 255, 0)" ], [ "1", "rgb(0, 0, 255)" ] ], "hoverlabel": { "font": { "size": 13, "family": "Arial" }, "align": "auto", "bgcolor": "#FFF", "namelength": 15, "bordercolor": "rgb(11, 2, 0)" }, "showlegend": false, "flatshading": false, "legendgroup": "", "delaunayaxis": "z", "hovertemplate": "asdfasdf", "lightposition": { "x": 52000, "y": -4000, "z": 0 } }, { "isrc": "harharidisd:2:7a7fde", "jsrc": "harharidisd:2:0ae435", "ksrc": "harharidisd:2:b60902", "meta": { "columnNames": { "i": "D", "j": "E", "k": "F", "x": "A", "y": "B", "z": "C", "facecolor": "", "intensity": "G", "vertexcolor": "" } }, "type": "mesh3d", "xsrc": "harharidisd:2:63cbe9", "ysrc": "harharidisd:2:2f1892", "zsrc": "harharidisd:0:5524cd", "opacity": 1, "colorbar": { "x": 0.9444619796029946, "y": 0.4847328244274809, "title": { "text": "TRL" } }, "lighting": { "ambient": 1, "diffuse": 1, "fresnel": 0, "specular": 0, "facenormalsepsilon": 0, "vertexnormalsepsilon": 0 }, "hoverinfo": "x+y+z", "colorscale": [ [ 0, "#000000" ], [ 0.0625, "#001f4d" ], [ 0.125, "#003786" ], [ 0.1875, "#0e58a8" ], [ 0.25, "#217eb8" ], [ 0.3125, "#30a4ca" ], [ 0.375, "#54c8df" ], [ 0.4375, "#9be4ef" ], [ 0.5, "#e1e9d1" ], [ 0.5625, "#f3d573" ], [ 0.625, "#e7b000" ], [ 0.6875, "#da8200" ], [ 0.75, "#c65400" ], [ 0.8125, "#ac2301" ], [ 0.875, "#820000" ], [ 0.9375, "#4c0000" ], [ 1, "#040100" ] ], "hoverlabel": { "namelength": 15 }, "intensitysrc": "harharidisd:2:792859", "reversescale": false, "hovertemplate": "", "lightposition": { "x": 52000, "y": -4000 }, "autocolorscale": false }, { "isrc": "harharidisd:3:490351", "jsrc": "harharidisd:3:de163e", "ksrc": "harharidisd:3:7b4c0a", "line": { "color": "#00cc96" }, "meta": { "columnNames": { "i": "D", "j": "E", "k": "F", "x": "A", "y": "B", "z": "C", "intensity": "" } }, "mode": "lines", "type": "scatter3d", "xsrc": "harharidisd:3:648e71", "ysrc": "harharidisd:3:dda52d", "zsrc": "harharidisd:3:c1afe6", "scene": "scene", "opacity": 1, "visible": true, "hoverlabel": { "namelength": 0 }, "reversescale": false, "hovertemplate": "<br>" }, { "isrc": "harharidisd:4:a6588c", "jsrc": "harharidisd:4:1f95a5", "ksrc": "harharidisd:4:9f561c", "meta": { "columnNames": { "i": "D", "j": "E", "k": "F", "x": "A", "y": "B", "z": "C", "text": "" } }, "mode": "lines", "type": "mesh3d", "xsrc": "harharidisd:4:842554", "ysrc": "harharidisd:4:89b8ab", "zsrc": "harharidisd:4:7c8687", "color": "rgb(241, 241, 241)", "scene": "scene2", "contour": { "show": true }, "opacity": 1, "lighting": { "ambient": 1, "diffuse": 1, "fresnel": 0, "specular": 0, "roughness": 1, "facenormalsepsilon": 0, "vertexnormalsepsilon": 0 }, "hoverinfo": "none", "showscale": true, "lightposition": { "x": 52000, "y": -4000 } }, { "line": { "color": "#19d3f3" }, "meta": { "columnNames": { "x": "A", "y": "B", "z": "C" } }, "mode": "lines", "type": "scatter3d", "xsrc": "harharidisd:5:64fc17", "ysrc": "harharidisd:5:7ca5c6", "zsrc": "harharidisd:5:1d7ebb", "scene": "scene2", "visible": true, "reversescale": false }, { "isrc": "harharidisd:6:140277", "jsrc": "harharidisd:6:c6b3e2", "ksrc": "harharidisd:6:fd9133", "meta": { "columnNames": { "i": "D", "j": "E", "k": "F", "x": "A", "y": "B", "z": "C", "intensity": "G" } }, "mode": "lines", "type": "mesh3d", "xsrc": "harharidisd:6:3c894b", "ysrc": "harharidisd:6:e6531b", "zsrc": "harharidisd:6:20405d", "scene": "scene2", "opacity": 1, "colorbar": { "x": 0.8505355715427658, "y": 0.5935114503816794 }, "lighting": { "ambient": 1, "diffuse": 1, "fresnel": 0, "specular": 0, "facenormalsepsilon": 0, "vertexnormalsepsilon": 0 }, "showscale": false, "colorscale": [ [ 0, "#67001f" ], [ 0.1, "#b2182b" ], [ 0.2, "#d6604d" ], [ 0.3, "#f4a582" ], [ 0.4, "#fddbc7" ], [ 0.5, "#f7f7f7" ], [ 0.6, "#d1e5f0" ], [ 0.7, "#92c5de" ], [ 0.8, "#4393c3" ], [ 0.9, "#2166ac" ], [ 1, "#053061" ] ], "intensitysrc": "harharidisd:6:8e00a9", "reversescale": true, "lightposition": { "x": 52000, "y": -4000 }, "autocolorscale": false } ], "frames": [], "layout": { "scene": { "xaxis": { "type": "log", "dtick": "D2", "range": [ -0.09374999999999999, 3.0937499999999996 ], "ticks": "inside", "title": { "font": { "family": "Courier New" }, "text": "asdf" }, "mirror": false, "showgrid": true, "showline": true, "tickmode": "auto", "zeroline": true, "autorange": true, "gridwidth": 1, "showspikes": false, "spikesides": true, "categoryorder": "trace", "showbackground": true, "showticklabels": true }, "yaxis": { "type": "linear", "dtick": 0.2, "range": [ -0.3125, 10.3125 ], "ticks": "inside", "nticks": 0, "showgrid": true, "showline": true, "tickmode": "auto", "autorange": true, "rangemode": "normal", "showspikes": false, "spikesides": true }, "zaxis": { "type": "date", "dtick": "M120", "range": [ "2000-01-01", "2001-01-01" ], "tick0": "1980-01-01", "ticks": "inside", "mirror": false, "nticks": 0, "showgrid": true, "showline": true, "tickmode": "auto", "zeroline": true, "autorange": true, "gridcolor": "rgb(183, 193, 204)", "gridwidth": 2, "linecolor": "rgb(29, 42, 64)", "linewidth": 1, "showspikes": false, "spikecolor": "#444", "spikesides": true, "zerolinecolor": "#EBF0F8", "zerolinewidth": 1, "spikethickness": 2 }, "camera": { "up": { "x": 0, "y": 0, "z": 1 }, "eye": { "x": 0.6450104167712496, "y": -0.606869224731584, "z": 0.5719545645947103 }, "center": { "x": 0, "y": 0, "z": 0 }, "projection": { "type": "perspective" } }, "domain": { "x": [ 0, 0.375 ], "y": [ 0, 1 ] }, "dragmode": "turntable", "hovermode": "closest", "aspectmode": "auto", "aspectratio": { "x": 1, "y": 1, "z": 1 } }, "title": { "text": "<br>" }, "xaxis": { "title": { "text": "x1" } }, "yaxis": { "title": { "text": "y" } }, "legend": { "x": 0.9882218593831364, "y": 1, "font": { "size": 12, "color": "#f2f5fa", "family": "Balto" }, "title": { "font": { "size": 12, "color": "#f2f5fa", "family": "\"Open Sans\", verdana, arial, sans-serif" }, "side": "top", "text": "<br>" }, "valign": "middle", "bgcolor": "rgb(17,17,17)", "xanchor": "left", "yanchor": "auto", "itemclick": "toggle", "itemwidth": 30, "itemsizing": "trace", "traceorder": "normal", "bordercolor": "#444", "borderwidth": 0, "orientation": "v", "itemdoubleclick": "toggleothers" }, "margin": { "b": 100, "l": 80, "r": 80, "t": 100, "pad": 0 }, "scene2": { "xaxis": { "type": "category", "dtick": 10, "range": [ 0, 1 ], "ticks": "inside", "title": { "font": { "size": 14, "color": "#2a3f5f", "family": "\"Open Sans\", verdana, arial, sans-serif" } }, "mirror": false, "nticks": 12, "ticklen": 5, "visible": true, "showgrid": true, "showline": true, "tickfont": { "size": 12, "color": "#2a3f5f", "family": "\"Open Sans\", verdana, arial, sans-serif" }, "tickmode": "auto", "zeroline": true, "autorange": false, "gridwidth": 2, "linecolor": "#EBF0F8", "linewidth": 1, "rangemode": "auto", "tickangle": "auto", "tickcolor": "#444", "tickwidth": 1, "showspikes": false, "spikesides": true, "tickformat": "", "hoverformat": "", "minexponent": 3, "showexponent": "all", "zerolinecolor": "#EBF0F8", "zerolinewidth": 1, "exponentformat": "B", "showaxeslabels": true, "showbackground": true, "showticklabels": true, "backgroundcolor": "white", "separatethousands": false }, "yaxis": { "type": "linear", "range": [ -1, 4 ], "ticks": "inside", "showgrid": true, "showline": true, "autorange": true, "rangemode": "normal", "showspikes": false, "spikesides": true }, "zaxis": { "type": "date", "range": [ "2000-01-01", "2001-01-01" ], "ticks": "inside", "showgrid": true, "showline": true, "autorange": true, "showspikes": false, "spikesides": true, "showaxeslabels": true }, "camera": { "up": { "x": 0, "y": 0, "z": 1 }, "eye": { "x": 2.2192436460537532, "y": 0.2433309322627084, "z": 0.8907679694408142 }, "center": { "x": 0, "y": 0, "z": 0 }, "projection": { "type": "perspective" } }, "domain": { "x": [ 0.375, 0.75 ], "y": [ 0, 1 ] }, "dragmode": "turntable", "hovermode": "closest", "aspectmode": "auto", "aspectratio": { "x": 1, "y": 1, "z": 1 } }, "shapes": [], "autosize": true, "dragmode": "zoom", "template": { "data": { "bar": [ { "type": "bar", "marker": { "colorbar": { "ticks": "", "outlinewidth": 0 } } } ], "table": [ { "type": "table", "cells": { "fill": { "color": "#506784" }, "line": { "color": "rgb(17,17,17)" } }, "header": { "fill": { "color": "#2a3f5f" }, "line": { "color": "rgb(17,17,17)" } } } ], "carpet": [ { "type": "carpet", "aaxis": { "gridcolor": "#506784", "linecolor": "#506784", "endlinecolor": "#A2B1C6", "minorgridcolor": "#506784", "startlinecolor": "#A2B1C6" }, "baxis": { "gridcolor": "#506784", "linecolor": "#506784", "endlinecolor": "#A2B1C6", "minorgridcolor": "#506784", "startlinecolor": "#A2B1C6" } } ], "mesh3d": [ { "type": "mesh3d", "colorbar": { "ticks": "", "outlinewidth": 0 } } ], "contour": [ { "type": "contour", "colorbar": { "ticks": "", "outlinewidth": 0 }, "autocolorscale": true } ], "heatmap": [ { "type": "heatmap", "colorbar": { "ticks": "", "outlinewidth": 0 }, "autocolorscale": true } ], "scatter": [ { "type": "scatter", "marker": { "colorbar": { "ticks": "", "outlinewidth": 0 } } } ], "surface": [ { "type": "surface", "colorbar": { "ticks": "", "outlinewidth": 0 } } ], "heatmapgl": [ { "type": "heatmapgl", "colorbar": { "ticks": "", "outlinewidth": 0 } } ], "histogram": [ { "type": "histogram", "marker": { "colorbar": { "ticks": "", "outlinewidth": 0 } } } ], "parcoords": [ { "line": { "colorbar": { "ticks": "", "outlinewidth": 0 } }, "type": "parcoords" } ], "scatter3d": [ { "type": "scatter3d", "marker": { "colorbar": { "ticks": "", "outlinewidth": 0 } } } ], "scattergl": [ { "type": "scattergl", "marker": { "colorbar": { "ticks": "", "outlinewidth": 0 } } } ], "choropleth": [ { "type": "choropleth", "colorbar": { "ticks": "", "outlinewidth": 0 } } ], "scattergeo": [ { "type": "scattergeo", "marker": { "colorbar": { "ticks": "", "outlinewidth": 0 } } } ], "histogram2d": [ { "type": "histogram2d", "colorbar": { "ticks": "", "outlinewidth": 0 }, "autocolorscale": true } ], "scatterpolar": [ { "type": "scatterpolar", "marker": { "colorbar": { "ticks": "", "outlinewidth": 0 } } } ], "contourcarpet": [ { "type": "contourcarpet", "colorbar": { "ticks": "", "outlinewidth": 0 } } ], "scattercarpet": [ { "type": "scattercarpet", "marker": { "colorbar": { "ticks": "", "outlinewidth": 0 } } } ], "scattermapbox": [ { "type": "scattermapbox", "marker": { "colorbar": { "ticks": "", "outlinewidth": 0 } } } ], "scatterpolargl": [ { "type": "scatterpolargl", "marker": { "colorbar": { "ticks": "", "outlinewidth": 0 } } } ], "scatterternary": [ { "type": "scatterternary", "marker": { "colorbar": { "ticks": "", "outlinewidth": 0 } } } ], "histogram2dcontour": [ { "type": "histogram2dcontour", "colorbar": { "ticks": "", "outlinewidth": 0 }, "autocolorscale": true } ] }, "layout": { "geo": { "bgcolor": "rgb(17,17,17)", "showland": true, "lakecolor": "rgb(17,17,17)", "landcolor": "rgb(17,17,17)", "showlakes": true, "subunitcolor": "#506784" }, "font": { "color": "#f2f5fa" }, "polar": { "bgcolor": "rgb(17,17,17)", "radialaxis": { "ticks": "", "gridcolor": "#506784", "linecolor": "#506784" }, "angularaxis": { "ticks": "", "gridcolor": "#506784", "linecolor": "#506784" } }, "scene": { "xaxis": { "ticks": "", "gridcolor": "#506784", "gridwidth": 2, "linecolor": "#506784", "zerolinecolor": "#C8D4E3", "showbackground": true, "backgroundcolor": "rgb(17,17,17)" }, "yaxis": { "ticks": "", "gridcolor": "#506784", "gridwidth": 2, "linecolor": "#506784", "zerolinecolor": "#C8D4E3", "showbackground": true, "backgroundcolor": "rgb(17,17,17)" }, "zaxis": { "ticks": "", "gridcolor": "#506784", "gridwidth": 2, "linecolor": "#506784", "zerolinecolor": "#C8D4E3", "showbackground": true, "backgroundcolor": "rgb(17,17,17)" } }, "title": { "x": 0.05 }, "xaxis": { "ticks": "", "gridcolor": "#283442", "linecolor": "#506784", "automargin": true, "zerolinecolor": "#283442", "zerolinewidth": 2 }, "yaxis": { "ticks": "", "gridcolor": "#283442", "linecolor": "#506784", "automargin": true, "zerolinecolor": "#283442", "zerolinewidth": 2 }, "ternary": { "aaxis": { "ticks": "", "gridcolor": "#506784", "linecolor": "#506784" }, "baxis": { "ticks": "", "gridcolor": "#506784", "linecolor": "#506784" }, "caxis": { "ticks": "", "gridcolor": "#506784", "linecolor": "#506784" }, "bgcolor": "rgb(17,17,17)" }, "colorway": [ "#636efa", "#EF553B", "#00cc96", "#ab63fa", "#19d3f3", "#e763fa", "#fecb52", "#ffa15a", "#ff6692", "#b6e880" ], "hovermode": "closest", "colorscale": { "diverging": [ [ 0, "#8e0152" ], [ 0.1, "#c51b7d" ], [ 0.2, "#de77ae" ], [ 0.3, "#f1b6da" ], [ 0.4, "#fde0ef" ], [ 0.5, "#f7f7f7" ], [ 0.6, "#e6f5d0" ], [ 0.7, "#b8e186" ], [ 0.8, "#7fbc41" ], [ 0.9, "#4d9221" ], [ 1, "#276419" ] ], "sequential": [ [ 0, "#0508b8" ], [ 0.0893854748603352, "#1910d8" ], [ 0.1787709497206704, "#3c19f0" ], [ 0.2681564245810056, "#6b1cfb" ], [ 0.3575418994413408, "#981cfd" ], [ 0.44692737430167595, "#bf1cfd" ], [ 0.5363128491620112, "#dd2bfd" ], [ 0.6256983240223464, "#f246fe" ], [ 0.7150837988826816, "#fc67fd" ], [ 0.8044692737430168, "#fe88fc" ], [ 0.8938547486033519, "#fea5fd" ], [ 0.9832402234636871, "#febefe" ], [ 1, "#fec3fe" ] ], "sequentialminus": [ [ 0, "#0508b8" ], [ 0.0893854748603352, "#1910d8" ], [ 0.1787709497206704, "#3c19f0" ], [ 0.2681564245810056, "#6b1cfb" ], [ 0.3575418994413408, "#981cfd" ], [ 0.44692737430167595, "#bf1cfd" ], [ 0.5363128491620112, "#dd2bfd" ], [ 0.6256983240223464, "#f246fe" ], [ 0.7150837988826816, "#fc67fd" ], [ 0.8044692737430168, "#fe88fc" ], [ 0.8938547486033519, "#fea5fd" ], [ 0.9832402234636871, "#febefe" ], [ 1, "#fec3fe" ] ] }, "plot_bgcolor": "rgb(17,17,17)", "paper_bgcolor": "rgb(17,17,17)", "shapedefaults": { "line": { "width": 0 }, "opacity": 0.4, "fillcolor": "#f2f5fa" }, "sliderdefaults": { "bgcolor": "#C8D4E3", "tickwidth": 0, "bordercolor": "rgb(17,17,17)", "borderwidth": 1 }, "annotationdefaults": { "arrowhead": 0, "arrowcolor": "#f2f5fa", "arrowwidth": 1 }, "updatemenudefaults": { "bgcolor": "#506784", "borderwidth": 0 } }, "themeRef": "PLOTLY_DARK" }, "clickmode": "event", "hovermode": "closest", "colorscale": { "diverging": [ [ 0, "#a50026" ], [ 0.1, "#d73027" ], [ 0.2, "#f46d43" ], [ 0.3, "#fdae61" ], [ 0.4, "#fee090" ], [ 0.5, "#ffffbf" ], [ 0.6, "#e0f3f8" ], [ 0.7, "#abd9e9" ], [ 0.8, "#74add1" ], [ 0.9, "#4575b4" ], [ 1, "#313695" ] ], "sequential": [ [ 0, "#ffffe5" ], [ 0.125, "#fff7bc" ], [ 0.25, "#fee391" ], [ 0.375, "#fec44f" ], [ 0.5, "#fe9929" ], [ 0.625, "#ec7014" ], [ 0.75, "#cc4c02" ], [ 0.875, "#993404" ], [ 1, "#662506" ] ], "sequentialminus": [ [ 0, "#ffffe5" ], [ 0.125, "#fff7bc" ], [ 0.25, "#fee391" ], [ 0.375, "#fec44f" ], [ 0.5, "#fe9929" ], [ 0.625, "#ec7014" ], [ 0.75, "#cc4c02" ], [ 0.875, "#993404" ], [ 1, "#662506" ] ] }, "hoverlabel": { "font": { "family": "Arial" }, "bgcolor": "#FFF", "bordercolor": "rgb(11, 2, 0)" }, "showlegend": true, "hidesources": false } }, "height": null, "width": null, "user": { "profile_url": "https://chart-studio.plotly.com/~harharidisd", "avatar_url": "https://storage.googleapis.com/plotly-prod-profiles/77.jpg", "background_url": "https://storage.googleapis.com/plotly-prod-profiles/bg-1.jpg", "bio": "", "nickname": "", "website": "", "stream_tokens": null, "feature_set_id": null, "csrf_token": null, "date_joined": "2024-04-03 14:00:52", "mapbox_access_tokens": null, "has_password": null, "username": "harharidisd", "email": null, "is_active": null, "readonly": null, "is_dash_creator": null, "dash_created_count": null, "is_chart_creator": null, "charts_created_count": null } }, { "creation_time": "2024-04-03T13:56:50.389452Z", "comments": { "results": [], "count": 0 }, "parented": true, "embed_url": "https://chart-studio.plotly.com/~ASCIVOLETTO/47.embed", "fid": "ASCIVOLETTO:47", "filename": "VC2IPOAPRIL", "filetype": "plot", "img_url": "https://storage.googleapis.com/plotly-prod-images/ASCIVOLETTO/47/9_JOOUHLVKWN2CMNLONLWQE33X32S8LC.png", "image_urls": { "default": "https://storage.googleapis.com/plotly-prod-images/ASCIVOLETTO/47/2_66X97Q3W7JAM4DQ5FJ01VIUEYV10YR.png", "block-thumb": "https://storage.googleapis.com/plotly-prod-images/ASCIVOLETTO/47/8_NIUZR7UO7YBX72G4V3V9VK7O6DTFG1.png", "list-thumb": "https://storage.googleapis.com/plotly-prod-images/ASCIVOLETTO/47/9_JOOUHLVKWN2CMNLONLWQE33X32S8LC.png" }, "api_urls": { "files": "https://api.plotly.com/v2/files/ASCIVOLETTO:47", "plots": "https://api.plotly.com/v2/plots/ASCIVOLETTO:47", "parent": "https://api.plotly.com/v2/folders/home?user=ASCIVOLETTO" }, "owner": "ASCIVOLETTO", "parent": -1, "preview": "", "referencers": [], "references": [], "title": "", "views": 1, "web_url": "https://chart-studio.plotly.com/~ASCIVOLETTO/47/", "world_readable": true, "date_modified": "2024-04-03T13:56:50.401Z", "stars": { "results": [], "count": 0 }, "collaborators": { "results": [], "count": 0 }, "subfolder_count": null, "refresh_interval": null, "organize_view_url": "https://chart-studio.plotly.com/~ASCIVOLETTO/47/", "current_user_permission": "read", "is_theme": null, "is_template": false, "autosize": true, "caption": "", "figure": { "data": [ { "box": { "visible": false }, "uid": "1824af", "line": { "dash": "solid", "color": "rgb(6, 6, 6)", "shape": "linear", "width": 1 }, "meta": { "columnNames": { "x": "A", "y": "C" } }, "mode": "lines", "name": "Coef Trend", "side": "both", "type": "violin", "xsrc": "ASCIVOLETTO:46:172071", "ysrc": "ASCIVOLETTO:46:421f78", "marker": { "line": { "color": "rgb(6, 6, 6)", "width": 0 }, "size": 1, "color": "rgb(6, 6, 6)", "symbol": "circle", "opacity": 1 }, "opacity": 1, "visible": true, "meanline": { "visible": false }, "spanmode": "soft", "bandwidth": 0, "boxpoints": false, "fillcolor": "rgba(2, 2, 2, 0.5)", "scalemode": "width", "showlegend": false, "orientation": "v" }, { "uid": "0cbf81", "fill": "tonexty", "line": { "color": "rgb(6, 6, 6)", "width": 1 }, "meta": { "columnNames": { "x": "A", "y": "D" } }, "mode": "lines", "type": "box", "xsrc": "ASCIVOLETTO:46:172071", "ysrc": "ASCIVOLETTO:46:57edb8", "width": 0, "jitter": 0, "boxmean": false, "hoveron": "boxes+points", "notched": true, "opacity": 1, "boxpoints": false, "fillcolor": "rgb(230, 236, 254)", "hoverinfo": "x+y+name", "hoverlabel": { "namelength": 15 }, "notchwidth": 0.10000000000000003, "showlegend": false, "stackgroup": null, "connectgaps": true, "whiskerwidth": 0.2, "hovertemplate": "" }, { "uid": "12ee11", "meta": { "columnNames": { "x": "E", "y": "F" } }, "mode": "markers", "name": "Pre", "type": "scatter", "xsrc": "ASCIVOLETTO:46:f953ac", "ysrc": "ASCIVOLETTO:46:bf7da2", "marker": { "line": { "color": "rgb(18, 18, 18)", "width": 1 }, "size": 8, "color": "rgb(85, 160, 231)", "symbol": "circle", "maxdisplayed": 18 }, "boxpoints": false, "showlegend": true }, { "uid": "30e82f", "meta": { "columnNames": { "x": "G", "y": "H" } }, "mode": "markers", "name": "Post", "type": "scatter", "xsrc": "ASCIVOLETTO:46:5b07bf", "ysrc": "ASCIVOLETTO:46:4fb3e1", "marker": { "line": { "color": "rgb(5, 5, 5)", "width": 1 }, "size": 8, "color": "rgb(85, 160, 231)" }, "visible": true, "stackgroup": null } ], "frames": [], "layout": { "font": { "size": 14, "color": "rgb(10, 9, 9)", "family": "Times New Roman" }, "title": { "x": 0.5, "font": { "size": 17 }, "text": "VC to IPO" }, "xaxis": { "side": "bottom", "type": "linear", "range": [ -8.5, 12.5 ], "title": { "text": "Quarters to Transaction" }, "domain": [ 0, 1 ], "nticks": 17, "showgrid": true, "showline": true, "zeroline": false, "autorange": false, "gridwidth": 1, "linewidth": 1, "showspikes": false, "rangeslider": { "range": [ 1, 10 ], "yaxis": {}, "visible": false, "autorange": true }, "zerolinecolor": "rgb(92, 129, 189)", "zerolinewidth": 13 }, "yaxis": { "side": "left", "type": "linear", "range": [ -1, 1 ], "ticks": "outside", "title": { "text": "Score" }, "domain": [ 0.0071532231178051036, 1 ], "nticks": 9, "ticklen": 4, "showline": true, "autorange": false, "tickwidth": 1 }, "boxgap": 0.88, "legend": { "x": 0.8545079587622635, "y": 0.8894999077400635, "font": { "size": 12 }, "title": { "font": { "size": 14 }, "text": "Legend:" }, "valign": "top", "bgcolor": "rgb(248, 252, 255)", "xanchor": "center", "yanchor": "middle", "itemsizing": "trace", "traceorder": "normal", "bordercolor": "rgb(3, 0, 0)", "borderwidth": 1, "orientation": "v" }, "shapes": [ { "x0": 0, "x1": 0.001, "y0": 1, "y1": -1, "line": { "dash": "dot", "color": "rgb(245, 1, 1)", "width": 1 }, "type": "rect", "opacity": 1, "fillcolor": "rgb(0, 0, 0)" }, { "x0": -8, "x1": -8.0001, "y0": -0.3534753, "y1": 0.1418858, "line": { "color": "#444444", "width": 1 }, "opacity": 1, "fillcolor": "rgb(5, 5, 5)" }, { "x0": -13, "x1": 13, "y0": 0, "y1": 0.001, "line": { "color": "rgb(8, 8, 8)", "width": 1 }, "opacity": 1, "fillcolor": "rgb(3, 3, 3)" }, { "x0": -7, "x1": -7.0001, "y0": -0.2528379, "y1": 0.233581, "line": { "color": "#444444", "width": 1 }, "opacity": 1, "fillcolor": "rgb(13, 13, 13)" }, { "x0": -6, "x1": -6.0001, "y0": -0.4634203, "y1": 0.0313103, "line": { "color": "#444444", "width": 1 }, "opacity": 1, "fillcolor": "rgb(5, 5, 5)" }, { "x0": -5, "x1": -5.0001, "y0": -0.410584, "y1": 0.0866882, "line": { "color": "#444444", "width": 1 }, "opacity": 1, "fillcolor": "rgb(68, 68, 68)" }, { "x0": -4, "x1": -4.0001, "y0": -0.3375287, "y1": 0.0166375, "line": { "color": "#444444", "width": 1 }, "opacity": 1, "fillcolor": "rgb(68, 68, 68)" }, { "x0": -3, "x1": -3.0001, "y0": -0.31644, "y1": 0.1921243, "line": { "color": "#444444", "width": 1 }, "opacity": 1, "fillcolor": "rgb(68, 68, 68)" }, { "x0": -2, "x1": -2.0001, "y0": -0.4859767, "y1": -0.0670626, "line": { "color": "#444444", "width": 1 }, "opacity": 1, "fillcolor": "rgb(68, 68, 68)" }, { "x0": 0, "x1": 0.0001, "y0": -0.3613604, "y1": 0.0132118, "line": { "color": "#444444", "width": 1 }, "opacity": 1, "fillcolor": "rgb(68, 68, 68)" }, { "x0": 1, "x1": 1.0001, "y0": -0.5542384, "y1": 0.0348703, "line": { "color": "#444444", "width": 1 }, "opacity": 1, "fillcolor": "rgb(68, 68, 68)" }, { "x0": 2, "x1": 2.0001, "y0": -0.5038977, "y1": 0.0633718, "line": { "color": "#444444", "width": 1 }, "opacity": 1, "fillcolor": "rgb(68, 68, 68)" }, { "x0": 3, "x1": 3.0001, "y0": -0.5888652, "y1": -0.0663287, "line": { "color": "#444444", "width": 1 }, "opacity": 1, "fillcolor": "rgb(68, 68, 68)" }, { "x0": 4, "x1": 4.0001, "y0": -0.4846416, "y1": -0.1138222, "line": { "color": "#444444", "width": 1 }, "opacity": 1, "fillcolor": "rgb(68, 68, 68)" }, { "x0": 5, "x1": 5.0001, "y0": -0.8685779, "y1": -0.2038827, "line": { "color": "#444444", "width": 1 }, "opacity": 1, "fillcolor": "rgb(68, 68, 68)" }, { "x0": 6, "x1": 6.0001, "y0": -0.708793, "y1": -0.1461131, "line": { "color": "#444444", "width": 1 }, "opacity": 1, "fillcolor": "rgb(68, 68, 68)" }, { "x0": 7, "x1": 7.0001, "y0": -0.7093708, "y1": -0.1212604, "line": { "color": "#444444", "width": 1 }, "opacity": 1, "fillcolor": "rgb(68, 68, 68)" }, { "x0": 8, "x1": 8.0001, "y0": -0.6405016, "y1": -0.0006146, "line": { "color": "#444444", "width": 1 }, "opacity": 1, "fillcolor": "rgb(68, 68, 68)" }, { "x0": 9, "x1": 9.0001, "y0": -0.7479014, "y1": -0.1327778, "line": { "color": "#444444", "width": 1 }, "opacity": 1, "fillcolor": "rgb(68, 68, 68)" }, { "x0": 10, "x1": 10.0001, "y0": -0.8122023, "y1": -0.1433444, "line": { "color": "#444444", "width": 1 }, "opacity": 1, "fillcolor": "rgb(68, 68, 68)" }, { "x0": 11, "x1": 11.0001, "y0": -0.7866939, "y1": -0.2197312, "line": { "color": "#444444", "width": 1 }, "opacity": 1, "fillcolor": "rgb(68, 68, 68)" }, { "x0": 12, "x1": 12.0001, "y0": -0.9434608, "y1": -0.3998987, "line": { "color": "#444444", "width": 1 }, "opacity": 1, "fillcolor": "rgb(68, 68, 68)" }, { "x0": -12.5, "x1": 12.5, "y0": -1, "y1": -0.9999, "line": { "color": "rgb(0, 0, 0)", "width": 2 }, "opacity": 1, "fillcolor": "rgb(8, 8, 8)" }, { "x0": -8.5, "x1": -8.5001, "y0": -1.5, "y1": 1.5, "line": { "color": "rgb(5, 5, 5)", "width": 2 }, "opacity": 1, "fillcolor": "rgb(8, 8, 8)" } ], "boxmode": "overlay", "modebar": { "color": "rgba(98, 15, 15, 0.3)", "bgcolor": "rgba(144, 81, 81, 0.5)", "activecolor": "rgba(227, 178, 178, 0.7)", "orientation": "v" }, "autosize": true, "dragmode": "lasso", "template": { "data": { "bar": [ { "type": "bar", "marker": { "colorbar": { "ticks": "", "outlinewidth": 0 } } } ], "table": [ { "type": "table", "cells": { "fill": { "color": "#EBF0F8" }, "line": { "color": "white" } }, "header": { "fill": { "color": "#C8D4E3" }, "line": { "color": "white" } } } ], "carpet": [ { "type": "carpet", "aaxis": { "gridcolor": "#C8D4E3", "linecolor": "#C8D4E3", "endlinecolor": "#2a3f5f", "minorgridcolor": "#C8D4E3", "startlinecolor": "#2a3f5f" }, "baxis": { "gridcolor": "#C8D4E3", "linecolor": "#C8D4E3", "endlinecolor": "#2a3f5f", "minorgridcolor": "#C8D4E3", "startlinecolor": "#2a3f5f" } } ], "mesh3d": [ { "type": "mesh3d", "colorbar": { "ticks": "", "outlinewidth": 0 } } ], "contour": [ { "type": "contour", "colorbar": { "ticks": "", "outlinewidth": 0 }, "autocolorscale": true } ], "heatmap": [ { "type": "heatmap", "colorbar": { "ticks": "", "outlinewidth": 0 }, "autocolorscale": true } ], "scatter": [ { "type": "scatter", "marker": { "colorbar": { "ticks": "", "outlinewidth": 0 } } } ], "surface": [ { "type": "surface", "colorbar": { "ticks": "", "outlinewidth": 0 } } ], "heatmapgl": [ { "type": "heatmapgl", "colorbar": { "ticks": "", "outlinewidth": 0 } } ], "histogram": [ { "type": "histogram", "marker": { "colorbar": { "ticks": "", "outlinewidth": 0 } } } ], "parcoords": [ { "line": { "colorbar": { "ticks": "", "outlinewidth": 0 } }, "type": "parcoords" } ], "scatter3d": [ { "type": "scatter3d", "marker": { "colorbar": { "ticks": "", "outlinewidth": 0 } } } ], "scattergl": [ { "type": "scattergl", "marker": { "colorbar": { "ticks": "", "outlinewidth": 0 } } } ], "choropleth": [ { "type": "choropleth", "colorbar": { "ticks": "", "outlinewidth": 0 } } ], "scattergeo": [ { "type": "scattergeo", "marker": { "colorbar": { "ticks": "", "outlinewidth": 0 } } } ], "histogram2d": [ { "type": "histogram2d", "colorbar": { "ticks": "", "outlinewidth": 0 }, "autocolorscale": true } ], "scatterpolar": [ { "type": "scatterpolar", "marker": { "colorbar": { "ticks": "", "outlinewidth": 0 } } } ], "contourcarpet": [ { "type": "contourcarpet", "colorbar": { "ticks": "", "outlinewidth": 0 } } ], "scattercarpet": [ { "type": "scattercarpet", "marker": { "colorbar": { "ticks": "", "outlinewidth": 0 } } } ], "scattermapbox": [ { "type": "scattermapbox", "marker": { "colorbar": { "ticks": "", "outlinewidth": 0 } } } ], "scatterpolargl": [ { "type": "scatterpolargl", "marker": { "colorbar": { "ticks": "", "outlinewidth": 0 } } } ], "scatterternary": [ { "type": "scatterternary", "marker": { "colorbar": { "ticks": "", "outlinewidth": 0 } } } ], "histogram2dcontour": [ { "type": "histogram2dcontour", "colorbar": { "ticks": "", "outlinewidth": 0 }, "autocolorscale": true } ] }, "layout": { "geo": { "bgcolor": "white", "showland": true, "lakecolor": "white", "landcolor": "white", "showlakes": true, "subunitcolor": "#C8D4E3" }, "font": { "color": "#2a3f5f" }, "polar": { "bgcolor": "white", "radialaxis": { "ticks": "", "gridcolor": "#EBF0F8", "linecolor": "#EBF0F8" }, "angularaxis": { "ticks": "", "gridcolor": "#EBF0F8", "linecolor": "#EBF0F8" } }, "scene": { "xaxis": { "ticks": "", "gridcolor": "#DFE8F3", "gridwidth": 2, "linecolor": "#EBF0F8", "zerolinecolor": "#EBF0F8", "showbackground": true, "backgroundcolor": "white" }, "yaxis": { "ticks": "", "gridcolor": "#DFE8F3", "gridwidth": 2, "linecolor": "#EBF0F8", "zerolinecolor": "#EBF0F8", "showbackground": true, "backgroundcolor": "white" }, "zaxis": { "ticks": "", "gridcolor": "#DFE8F3", "gridwidth": 2, "linecolor": "#EBF0F8", "zerolinecolor": "#EBF0F8", "showbackground": true, "backgroundcolor": "white" } }, "title": { "x": 0.05 }, "xaxis": { "ticks": "", "gridcolor": "#EBF0F8", "linecolor": "#EBF0F8", "automargin": true, "zerolinecolor": "#EBF0F8", "zerolinewidth": 2 }, "yaxis": { "ticks": "", "gridcolor": "#EBF0F8", "linecolor": "#EBF0F8", "automargin": true, "zerolinecolor": "#EBF0F8", "zerolinewidth": 2 }, "ternary": { "aaxis": { "ticks": "", "gridcolor": "#DFE8F3", "linecolor": "#A2B1C6" }, "baxis": { "ticks": "", "gridcolor": "#DFE8F3", "linecolor": "#A2B1C6" }, "caxis": { "ticks": "", "gridcolor": "#DFE8F3", "linecolor": "#A2B1C6" }, "bgcolor": "white" }, "colorway": [ "#636efa", "#EF553B", "#00cc96", "#ab63fa", "#19d3f3", "#e763fa", "#fecb52", "#ffa15a", "#ff6692", "#b6e880" ], "hovermode": "closest", "colorscale": { "diverging": [ [ 0, "#8e0152" ], [ 0.1, "#c51b7d" ], [ 0.2, "#de77ae" ], [ 0.3, "#f1b6da" ], [ 0.4, "#fde0ef" ], [ 0.5, "#f7f7f7" ], [ 0.6, "#e6f5d0" ], [ 0.7, "#b8e186" ], [ 0.8, "#7fbc41" ], [ 0.9, "#4d9221" ], [ 1, "#276419" ] ], "sequential": [ [ 0, "#0508b8" ], [ 0.0893854748603352, "#1910d8" ], [ 0.1787709497206704, "#3c19f0" ], [ 0.2681564245810056, "#6b1cfb" ], [ 0.3575418994413408, "#981cfd" ], [ 0.44692737430167595, "#bf1cfd" ], [ 0.5363128491620112, "#dd2bfd" ], [ 0.6256983240223464, "#f246fe" ], [ 0.7150837988826816, "#fc67fd" ], [ 0.8044692737430168, "#fe88fc" ], [ 0.8938547486033519, "#fea5fd" ], [ 0.9832402234636871, "#febefe" ], [ 1, "#fec3fe" ] ], "sequentialminus": [ [ 0, "#0508b8" ], [ 0.0893854748603352, "#1910d8" ], [ 0.1787709497206704, "#3c19f0" ], [ 0.2681564245810056, "#6b1cfb" ], [ 0.3575418994413408, "#981cfd" ], [ 0.44692737430167595, "#bf1cfd" ], [ 0.5363128491620112, "#dd2bfd" ], [ 0.6256983240223464, "#f246fe" ], [ 0.7150837988826816, "#fc67fd" ], [ 0.8044692737430168, "#fe88fc" ], [ 0.8938547486033519, "#fea5fd" ], [ 0.9832402234636871, "#febefe" ], [ 1, "#fec3fe" ] ] }, "plot_bgcolor": "white", "paper_bgcolor": "white", "shapedefaults": { "line": { "width": 0 }, "opacity": 0.4, "fillcolor": "#506784" }, "annotationdefaults": { "arrowhead": 0, "arrowcolor": "#506784", "arrowwidth": 1 } }, "themeRef": "PLOTLY_WHITE" }, "hovermode": "x", "violingap": 0.88, "colorscale": { "sequential": [ [ 0, "#00224e" ], [ 0.1111111111111111, "#123570" ], [ 0.2222222222222222, "#3b496c" ], [ 0.3333333333333333, "#575d6d" ], [ 0.4444444444444444, "#707173" ], [ 0.5555555555555556, "#8a8678" ], [ 0.6666666666666666, "#a59c74" ], [ 0.7777777777777778, "#c3b369" ], [ 0.8888888888888888, "#e1cc55" ], [ 1, "#fee838" ] ] }, "hoverlabel": { "font": { "size": 14 } }, "showlegend": false, "boxgroupgap": 0.12, "uniformtext": { "mode": false }, "plot_bgcolor": "rgb(255, 255, 255)", "paper_bgcolor": "rgb(255, 255, 255)", "violingroupgap": 0.12 } }, "height": null, "width": null, "user": { "profile_url": "https://chart-studio.plotly.com/~ASCIVOLETTO", "avatar_url": "https://storage.googleapis.com/plotly-prod-profiles/96.jpg", "background_url": "https://storage.googleapis.com/plotly-prod-profiles/bg-7.jpg", "bio": "", "nickname": "", "website": "", "stream_tokens": null, "feature_set_id": null, "csrf_token": null, "date_joined": "2023-03-30 13:28:23", "mapbox_access_tokens": null, "has_password": null, "username": "ASCIVOLETTO", "email": null, "is_active": null, "readonly": null, "is_dash_creator": null, "dash_created_count": null, "is_chart_creator": null, "charts_created_count": null } }, { "creation_time": "2024-04-03T13:54:21.243972Z", "comments": { "results": [], "count": 0 }, "parented": true, "embed_url": "https://chart-studio.plotly.com/~andreapalazzo1974/6.embed", "fid": "andreapalazzo1974:6", "filename": "efficient_frontier", "filetype": "plot", "img_url": "https://storage.googleapis.com/plotly-prod-images/andreapalazzo1974/6/9_DB01Y2SU60THC8IAJ833STPV4UC2QP.png", "image_urls": { "default": "https://storage.googleapis.com/plotly-prod-images/andreapalazzo1974/6/2_KXI58VL3C67UO219BH5308VLVU557J.png", "block-thumb": "https://storage.googleapis.com/plotly-prod-images/andreapalazzo1974/6/8_3ETHZGOXT51JPYAW3YY2F7XNNIB22I.png", "list-thumb": "https://storage.googleapis.com/plotly-prod-images/andreapalazzo1974/6/9_DB01Y2SU60THC8IAJ833STPV4UC2QP.png" }, "api_urls": { "files": "https://api.plotly.com/v2/files/andreapalazzo1974:6", "plots": "https://api.plotly.com/v2/plots/andreapalazzo1974:6", "parent": "https://api.plotly.com/v2/folders/home?user=andreapalazzo1974" }, "owner": "andreapalazzo1974", "parent": -1, "preview": "", "referencers": [], "references": [], "title": "", "views": 4, "web_url": "https://chart-studio.plotly.com/~andreapalazzo1974/6/", "world_readable": true, "date_modified": "2024-04-03T13:54:21.255Z", "stars": { "results": [], "count": 0 }, "collaborators": { "results": [], "count": 0 }, "subfolder_count": null, "refresh_interval": null, "organize_view_url": "https://chart-studio.plotly.com/~andreapalazzo1974/6/", "current_user_permission": "read", "is_theme": null, "is_template": null, "autosize": false, "caption": "", "figure": { "data": [ { "mode": "markers", "name": "_child0", "type": "scatter", "xsrc": "andreapalazzo1974:5:31304d", "ysrc": "andreapalazzo1974:5:9e0820", "xaxis": "x", "yaxis": "y", "marker": { "line": { "color": "#1F77B4", "width": 1.0 }, "size": 6.0, "color": "#1F77B4", "symbol": "circle", "opacity": 1 } }, { "line": { "dash": "solid", "color": "rgba (191, 191, 0, 1)", "width": 1.5 }, "mode": "lines+markers", "name": "_child1", "type": "scatter", "xsrc": "andreapalazzo1974:5:e16630", "ysrc": "andreapalazzo1974:5:2acdfb", "xaxis": "x", "yaxis": "y", "marker": { "line": { "color": "#BFBF00", "width": 1.0 }, "size": 6.0, "color": "#BFBF00", "symbol": "circle", "opacity": 1 } } ], "layout": { "width": 640, "xaxis": { "side": "bottom", "type": "linear", "range": [ 0.4948360111332014, 0.8741411452816876 ], "ticks": "inside", "title": { "font": { "size": 10.0, "color": "#000000" }, "text": "std" }, "anchor": "y", "domain": [ 0.0, 1.0 ], "mirror": "ticks", "nticks": 10, "showgrid": false, "showline": true, "tickfont": { "size": 10.0 }, "zeroline": false }, "yaxis": { "side": "left", "type": "linear", "range": [ -0.02606130110308676, 0.04213227972229723 ], "ticks": "inside", "title": { "font": { "size": 10.0, "color": "#000000" }, "text": "mean" }, "anchor": "x", "domain": [ 0.0, 1.0 ], "mirror": "ticks", "nticks": 9, "showgrid": false, "showline": true, "tickfont": { "size": 10.0 }, "zeroline": false }, "height": 480, "margin": { "b": 52, "l": 80, "r": 63, "t": 57, "pad": 0 }, "autosize": false, "template": { "data": { "bar": [ { "type": "bar", "marker": { "line": { "color": "#E5ECF6", "width": 0.5 }, "pattern": { "size": 10, "fillmode": "overlay", "solidity": 0.2 } }, "error_x": { "color": "#2a3f5f" }, "error_y": { "color": "#2a3f5f" } } ], "pie": [ { "type": "pie", "automargin": true } ], "table": [ { "type": "table", "cells": { "fill": { "color": "#EBF0F8" }, "line": { "color": "white" } }, "header": { "fill": { "color": "#C8D4E3" }, "line": { "color": "white" } } } ], "carpet": [ { "type": "carpet", "aaxis": { "gridcolor": "white", "linecolor": "white", "endlinecolor": "#2a3f5f", "minorgridcolor": "white", "startlinecolor": "#2a3f5f" }, "baxis": { "gridcolor": "white", "linecolor": "white", "endlinecolor": "#2a3f5f", "minorgridcolor": "white", "startlinecolor": "#2a3f5f" } } ], "mesh3d": [ { "type": "mesh3d", "colorbar": { "ticks": "", "outlinewidth": 0 } } ], "contour": [ { "type": "contour", "colorbar": { "ticks": "", "outlinewidth": 0 }, "colorscale": [ [ 0.0, "#0d0887" ], [ 0.1111111111111111, "#46039f" ], [ 0.2222222222222222, "#7201a8" ], [ 0.3333333333333333, "#9c179e" ], [ 0.4444444444444444, "#bd3786" ], [ 0.5555555555555556, "#d8576b" ], [ 0.6666666666666666, "#ed7953" ], [ 0.7777777777777778, "#fb9f3a" ], [ 0.8888888888888888, "#fdca26" ], [ 1.0, "#f0f921" ] ] } ], "heatmap": [ { "type": "heatmap", "colorbar": { "ticks": "", "outlinewidth": 0 }, "colorscale": [ [ 0.0, "#0d0887" ], [ 0.1111111111111111, "#46039f" ], [ 0.2222222222222222, "#7201a8" ], [ 0.3333333333333333, "#9c179e" ], [ 0.4444444444444444, "#bd3786" ], [ 0.5555555555555556, "#d8576b" ], [ 0.6666666666666666, "#ed7953" ], [ 0.7777777777777778, "#fb9f3a" ], [ 0.8888888888888888, "#fdca26" ], [ 1.0, "#f0f921" ] ] } ], "scatter": [ { "type": "scatter", "fillpattern": { "size": 10, "fillmode": "overlay", "solidity": 0.2 } } ], "surface": [ { "type": "surface", "colorbar": { "ticks": "", "outlinewidth": 0 }, "colorscale": [ [ 0.0, "#0d0887" ], [ 0.1111111111111111, "#46039f" ], [ 0.2222222222222222, "#7201a8" ], [ 0.3333333333333333, "#9c179e" ], [ 0.4444444444444444, "#bd3786" ], [ 0.5555555555555556, "#d8576b" ], [ 0.6666666666666666, "#ed7953" ], [ 0.7777777777777778, "#fb9f3a" ], [ 0.8888888888888888, "#fdca26" ], [ 1.0, "#f0f921" ] ] } ], "barpolar": [ { "type": "barpolar", "marker": { "line": { "color": "#E5ECF6", "width": 0.5 }, "pattern": { "size": 10, "fillmode": "overlay", "solidity": 0.2 } } } ], "heatmapgl": [ { "type": "heatmapgl", "colorbar": { "ticks": "", "outlinewidth": 0 }, "colorscale": [ [ 0.0, "#0d0887" ], [ 0.1111111111111111, "#46039f" ], [ 0.2222222222222222, "#7201a8" ], [ 0.3333333333333333, "#9c179e" ], [ 0.4444444444444444, "#bd3786" ], [ 0.5555555555555556, "#d8576b" ], [ 0.6666666666666666, "#ed7953" ], [ 0.7777777777777778, "#fb9f3a" ], [ 0.8888888888888888, "#fdca26" ], [ 1.0, "#f0f921" ] ] } ], "histogram": [ { "type": "histogram", "marker": { "pattern": { "size": 10, "fillmode": "overlay", "solidity": 0.2 } } } ], "parcoords": [ { "line": { "colorbar": { "ticks": "", "outlinewidth": 0 } }, "type": "parcoords" } ], "scatter3d": [ { "line": { "colorbar": { "ticks": "", "outlinewidth": 0 } }, "type": "scatter3d", "marker": { "colorbar": { "ticks": "", "outlinewidth": 0 } } } ], "scattergl": [ { "type": "scattergl", "marker": { "colorbar": { "ticks": "", "outlinewidth": 0 } } } ], "choropleth": [ { "type": "choropleth", "colorbar": { "ticks": "", "outlinewidth": 0 } } ], "scattergeo": [ { "type": "scattergeo", "marker": { "colorbar": { "ticks": "", "outlinewidth": 0 } } } ], "histogram2d": [ { "type": "histogram2d", "colorbar": { "ticks": "", "outlinewidth": 0 }, "colorscale": [ [ 0.0, "#0d0887" ], [ 0.1111111111111111, "#46039f" ], [ 0.2222222222222222, "#7201a8" ], [ 0.3333333333333333, "#9c179e" ], [ 0.4444444444444444, "#bd3786" ], [ 0.5555555555555556, "#d8576b" ], [ 0.6666666666666666, "#ed7953" ], [ 0.7777777777777778, "#fb9f3a" ], [ 0.8888888888888888, "#fdca26" ], [ 1.0, "#f0f921" ] ] } ], "scatterpolar": [ { "type": "scatterpolar", "marker": { "colorbar": { "ticks": "", "outlinewidth": 0 } } } ], "contourcarpet": [ { "type": "contourcarpet", "colorbar": { "ticks": "", "outlinewidth": 0 } } ], "scattercarpet": [ { "type": "scattercarpet", "marker": { "colorbar": { "ticks": "", "outlinewidth": 0 } } } ], "scattermapbox": [ { "type": "scattermapbox", "marker": { "colorbar": { "ticks": "", "outlinewidth": 0 } } } ], "scatterpolargl": [ { "type": "scatterpolargl", "marker": { "colorbar": { "ticks": "", "outlinewidth": 0 } } } ], "scatterternary": [ { "type": "scatterternary", "marker": { "colorbar": { "ticks": "", "outlinewidth": 0 } } } ], "histogram2dcontour": [ { "type": "histogram2dcontour", "colorbar": { "ticks": "", "outlinewidth": 0 }, "colorscale": [ [ 0.0, "#0d0887" ], [ 0.1111111111111111, "#46039f" ], [ 0.2222222222222222, "#7201a8" ], [ 0.3333333333333333, "#9c179e" ], [ 0.4444444444444444, "#bd3786" ], [ 0.5555555555555556, "#d8576b" ], [ 0.6666666666666666, "#ed7953" ], [ 0.7777777777777778, "#fb9f3a" ], [ 0.8888888888888888, "#fdca26" ], [ 1.0, "#f0f921" ] ] } ] }, "layout": { "geo": { "bgcolor": "white", "showland": true, "lakecolor": "white", "landcolor": "#E5ECF6", "showlakes": true, "subunitcolor": "white" }, "font": { "color": "#2a3f5f" }, "polar": { "bgcolor": "#E5ECF6", "radialaxis": { "ticks": "", "gridcolor": "white", "linecolor": "white" }, "angularaxis": { "ticks": "", "gridcolor": "white", "linecolor": "white" } }, "scene": { "xaxis": { "ticks": "", "gridcolor": "white", "gridwidth": 2, "linecolor": "white", "zerolinecolor": "white", "showbackground": true, "backgroundcolor": "#E5ECF6" }, "yaxis": { "ticks": "", "gridcolor": "white", "gridwidth": 2, "linecolor": "white", "zerolinecolor": "white", "showbackground": true, "backgroundcolor": "#E5ECF6" }, "zaxis": { "ticks": "", "gridcolor": "white", "gridwidth": 2, "linecolor": "white", "zerolinecolor": "white", "showbackground": true, "backgroundcolor": "#E5ECF6" } }, "title": { "x": 0.05 }, "xaxis": { "ticks": "", "title": { "standoff": 15 }, "gridcolor": "white", "linecolor": "white", "automargin": true, "zerolinecolor": "white", "zerolinewidth": 2 }, "yaxis": { "ticks": "", "title": { "standoff": 15 }, "gridcolor": "white", "linecolor": "white", "automargin": true, "zerolinecolor": "white", "zerolinewidth": 2 }, "mapbox": { "style": "light" }, "ternary": { "aaxis": { "ticks": "", "gridcolor": "white", "linecolor": "white" }, "baxis": { "ticks": "", "gridcolor": "white", "linecolor": "white" }, "caxis": { "ticks": "", "gridcolor": "white", "linecolor": "white" }, "bgcolor": "#E5ECF6" }, "colorway": [ "#636efa", "#EF553B", "#00cc96", "#ab63fa", "#FFA15A", "#19d3f3", "#FF6692", "#B6E880", "#FF97FF", "#FECB52" ], "coloraxis": { "colorbar": { "ticks": "", "outlinewidth": 0 } }, "hovermode": "closest", "colorscale": { "diverging": [ [ 0, "#8e0152" ], [ 0.1, "#c51b7d" ], [ 0.2, "#de77ae" ], [ 0.3, "#f1b6da" ], [ 0.4, "#fde0ef" ], [ 0.5, "#f7f7f7" ], [ 0.6, "#e6f5d0" ], [ 0.7, "#b8e186" ], [ 0.8, "#7fbc41" ], [ 0.9, "#4d9221" ], [ 1, "#276419" ] ], "sequential": [ [ 0.0, "#0d0887" ], [ 0.1111111111111111, "#46039f" ], [ 0.2222222222222222, "#7201a8" ], [ 0.3333333333333333, "#9c179e" ], [ 0.4444444444444444, "#bd3786" ], [ 0.5555555555555556, "#d8576b" ], [ 0.6666666666666666, "#ed7953" ], [ 0.7777777777777778, "#fb9f3a" ], [ 0.8888888888888888, "#fdca26" ], [ 1.0, "#f0f921" ] ], "sequentialminus": [ [ 0.0, "#0d0887" ], [ 0.1111111111111111, "#46039f" ], [ 0.2222222222222222, "#7201a8" ], [ 0.3333333333333333, "#9c179e" ], [ 0.4444444444444444, "#bd3786" ], [ 0.5555555555555556, "#d8576b" ], [ 0.6666666666666666, "#ed7953" ], [ 0.7777777777777778, "#fb9f3a" ], [ 0.8888888888888888, "#fdca26" ], [ 1.0, "#f0f921" ] ] }, "hoverlabel": { "align": "left" }, "plot_bgcolor": "#E5ECF6", "paper_bgcolor": "white", "shapedefaults": { "line": { "color": "#2a3f5f" } }, "autotypenumbers": "strict", "annotationdefaults": { "arrowhead": 0, "arrowcolor": "#2a3f5f", "arrowwidth": 1 } } }, "hovermode": "closest", "showlegend": false } }, "height": 480, "width": 640, "user": { "profile_url": "https://chart-studio.plotly.com/~andreapalazzo1974", "avatar_url": "https://storage.googleapis.com/plotly-prod-profiles/62.jpg", "background_url": "https://storage.googleapis.com/plotly-prod-profiles/bg-3.jpg", "bio": "", "nickname": "", "website": "", "stream_tokens": null, "feature_set_id": null, "csrf_token": null, "date_joined": "2024-04-03 13:19:48", "mapbox_access_tokens": null, "has_password": null, "username": "andreapalazzo1974", "email": null, "is_active": null, "readonly": null, "is_dash_creator": null, "dash_created_count": null, "is_chart_creator": null, "charts_created_count": null } }, { "creation_time": "2024-04-03T13:39:23.709731Z", "comments": { "results": [], "count": 0 }, "parented": true, "embed_url": "https://chart-studio.plotly.com/~andreapalazzo1974/3.embed", "fid": "andreapalazzo1974:3", "filename": "mean_std", "filetype": "plot", "img_url": "https://storage.googleapis.com/plotly-prod-images/andreapalazzo1974/3/9_ALWS7R3ZH0J0TYB96TYIXGP3ACCE8M.png", "image_urls": { "default": "https://storage.googleapis.com/plotly-prod-images/andreapalazzo1974/3/2_F3ZNE8118YJOD7B81GK2ITCUNAQAI5.png", "block-thumb": "https://storage.googleapis.com/plotly-prod-images/andreapalazzo1974/3/8_D0GGT8IZ55FPG4APXNQ94M0YINDQ9W.png", "list-thumb": "https://storage.googleapis.com/plotly-prod-images/andreapalazzo1974/3/9_ALWS7R3ZH0J0TYB96TYIXGP3ACCE8M.png" }, "api_urls": { "files": "https://api.plotly.com/v2/files/andreapalazzo1974:3", "plots": "https://api.plotly.com/v2/plots/andreapalazzo1974:3", "parent": "https://api.plotly.com/v2/folders/home?user=andreapalazzo1974" }, "owner": "andreapalazzo1974", "parent": -1, "preview": "", "referencers": [], "references": [], "title": "", "views": 3, "web_url": "https://chart-studio.plotly.com/~andreapalazzo1974/3/", "world_readable": true, "date_modified": "2024-04-03T13:49:08.688Z", "stars": { "results": [], "count": 0 }, "collaborators": { "results": [], "count": 0 }, "subfolder_count": null, "refresh_interval": null, "organize_view_url": "https://chart-studio.plotly.com/~andreapalazzo1974/3/", "current_user_permission": "read", "is_theme": null, "is_template": null, "autosize": false, "caption": "", "figure": { "data": [ { "mode": "markers", "name": "_child0", "type": "scatter", "xsrc": "andreapalazzo1974:4:2fbd0d", "ysrc": "andreapalazzo1974:4:96ded7", "xaxis": "x", "yaxis": "y", "marker": { "line": { "color": "#1F77B4", "width": 1.0 }, "size": 5.0, "color": "#1F77B4", "symbol": "circle", "opacity": 1 } } ], "layout": { "title": { "font": { "size": 12.0, "color": "#000000" }, "text": "Mean and standard deviation of returns of randomly generated portfolios" }, "width": 640, "xaxis": { "side": "bottom", "type": "linear", "range": [ 0.4956576844619297, 0.8741020179803196 ], "ticks": "inside", "title": { "font": { "size": 10.0, "color": "#000000" }, "text": "std" }, "anchor": "y", "domain": [ 0.0, 1.0 ], "mirror": "ticks", "nticks": 10, "showgrid": false, "showline": true, "tickfont": { "size": 10.0 }, "zeroline": false }, "yaxis": { "side": "left", "type": "linear", "range": [ -0.02606130110308676, 0.04213227972229723 ], "ticks": "inside", "title": { "font": { "size": 10.0, "color": "#000000" }, "text": "mean" }, "anchor": "x", "domain": [ 0.0, 1.0 ], "mirror": "ticks", "nticks": 9, "showgrid": false, "showline": true, "tickfont": { "size": 10.0 }, "zeroline": false }, "height": 480, "margin": { "b": 52, "l": 80, "r": 63, "t": 57, "pad": 0 }, "autosize": false, "template": { "data": { "bar": [ { "type": "bar", "marker": { "line": { "color": "#E5ECF6", "width": 0.5 }, "pattern": { "size": 10, "fillmode": "overlay", "solidity": 0.2 } }, "error_x": { "color": "#2a3f5f" }, "error_y": { "color": "#2a3f5f" } } ], "pie": [ { "type": "pie", "automargin": true } ], "table": [ { "type": "table", "cells": { "fill": { "color": "#EBF0F8" }, "line": { "color": "white" } }, "header": { "fill": { "color": "#C8D4E3" }, "line": { "color": "white" } } } ], "carpet": [ { "type": "carpet", "aaxis": { "gridcolor": "white", "linecolor": "white", "endlinecolor": "#2a3f5f", "minorgridcolor": "white", "startlinecolor": "#2a3f5f" }, "baxis": { "gridcolor": "white", "linecolor": "white", "endlinecolor": "#2a3f5f", "minorgridcolor": "white", "startlinecolor": "#2a3f5f" } } ], "mesh3d": [ { "type": "mesh3d", "colorbar": { "ticks": "", "outlinewidth": 0 } } ], "contour": [ { "type": "contour", "colorbar": { "ticks": "", "outlinewidth": 0 }, "colorscale": [ [ 0.0, "#0d0887" ], [ 0.1111111111111111, "#46039f" ], [ 0.2222222222222222, "#7201a8" ], [ 0.3333333333333333, "#9c179e" ], [ 0.4444444444444444, "#bd3786" ], [ 0.5555555555555556, "#d8576b" ], [ 0.6666666666666666, "#ed7953" ], [ 0.7777777777777778, "#fb9f3a" ], [ 0.8888888888888888, "#fdca26" ], [ 1.0, "#f0f921" ] ] } ], "heatmap": [ { "type": "heatmap", "colorbar": { "ticks": "", "outlinewidth": 0 }, "colorscale": [ [ 0.0, "#0d0887" ], [ 0.1111111111111111, "#46039f" ], [ 0.2222222222222222, "#7201a8" ], [ 0.3333333333333333, "#9c179e" ], [ 0.4444444444444444, "#bd3786" ], [ 0.5555555555555556, "#d8576b" ], [ 0.6666666666666666, "#ed7953" ], [ 0.7777777777777778, "#fb9f3a" ], [ 0.8888888888888888, "#fdca26" ], [ 1.0, "#f0f921" ] ] } ], "scatter": [ { "type": "scatter", "fillpattern": { "size": 10, "fillmode": "overlay", "solidity": 0.2 } } ], "surface": [ { "type": "surface", "colorbar": { "ticks": "", "outlinewidth": 0 }, "colorscale": [ [ 0.0, "#0d0887" ], [ 0.1111111111111111, "#46039f" ], [ 0.2222222222222222, "#7201a8" ], [ 0.3333333333333333, "#9c179e" ], [ 0.4444444444444444, "#bd3786" ], [ 0.5555555555555556, "#d8576b" ], [ 0.6666666666666666, "#ed7953" ], [ 0.7777777777777778, "#fb9f3a" ], [ 0.8888888888888888, "#fdca26" ], [ 1.0, "#f0f921" ] ] } ], "barpolar": [ { "type": "barpolar", "marker": { "line": { "color": "#E5ECF6", "width": 0.5 }, "pattern": { "size": 10, "fillmode": "overlay", "solidity": 0.2 } } } ], "heatmapgl": [ { "type": "heatmapgl", "colorbar": { "ticks": "", "outlinewidth": 0 }, "colorscale": [ [ 0.0, "#0d0887" ], [ 0.1111111111111111, "#46039f" ], [ 0.2222222222222222, "#7201a8" ], [ 0.3333333333333333, "#9c179e" ], [ 0.4444444444444444, "#bd3786" ], [ 0.5555555555555556, "#d8576b" ], [ 0.6666666666666666, "#ed7953" ], [ 0.7777777777777778, "#fb9f3a" ], [ 0.8888888888888888, "#fdca26" ], [ 1.0, "#f0f921" ] ] } ], "histogram": [ { "type": "histogram", "marker": { "pattern": { "size": 10, "fillmode": "overlay", "solidity": 0.2 } } } ], "parcoords": [ { "line": { "colorbar": { "ticks": "", "outlinewidth": 0 } }, "type": "parcoords" } ], "scatter3d": [ { "line": { "colorbar": { "ticks": "", "outlinewidth": 0 } }, "type": "scatter3d", "marker": { "colorbar": { "ticks": "", "outlinewidth": 0 } } } ], "scattergl": [ { "type": "scattergl", "marker": { "colorbar": { "ticks": "", "outlinewidth": 0 } } } ], "choropleth": [ { "type": "choropleth", "colorbar": { "ticks": "", "outlinewidth": 0 } } ], "scattergeo": [ { "type": "scattergeo", "marker": { "colorbar": { "ticks": "", "outlinewidth": 0 } } } ], "histogram2d": [ { "type": "histogram2d", "colorbar": { "ticks": "", "outlinewidth": 0 }, "colorscale": [ [ 0.0, "#0d0887" ], [ 0.1111111111111111, "#46039f" ], [ 0.2222222222222222, "#7201a8" ], [ 0.3333333333333333, "#9c179e" ], [ 0.4444444444444444, "#bd3786" ], [ 0.5555555555555556, "#d8576b" ], [ 0.6666666666666666, "#ed7953" ], [ 0.7777777777777778, "#fb9f3a" ], [ 0.8888888888888888, "#fdca26" ], [ 1.0, "#f0f921" ] ] } ], "scatterpolar": [ { "type": "scatterpolar", "marker": { "colorbar": { "ticks": "", "outlinewidth": 0 } } } ], "contourcarpet": [ { "type": "contourcarpet", "colorbar": { "ticks": "", "outlinewidth": 0 } } ], "scattercarpet": [ { "type": "scattercarpet", "marker": { "colorbar": { "ticks": "", "outlinewidth": 0 } } } ], "scattermapbox": [ { "type": "scattermapbox", "marker": { "colorbar": { "ticks": "", "outlinewidth": 0 } } } ], "scatterpolargl": [ { "type": "scatterpolargl", "marker": { "colorbar": { "ticks": "", "outlinewidth": 0 } } } ], "scatterternary": [ { "type": "scatterternary", "marker": { "colorbar": { "ticks": "", "outlinewidth": 0 } } } ], "histogram2dcontour": [ { "type": "histogram2dcontour", "colorbar": { "ticks": "", "outlinewidth": 0 }, "colorscale": [ [ 0.0, "#0d0887" ], [ 0.1111111111111111, "#46039f" ], [ 0.2222222222222222, "#7201a8" ], [ 0.3333333333333333, "#9c179e" ], [ 0.4444444444444444, "#bd3786" ], [ 0.5555555555555556, "#d8576b" ], [ 0.6666666666666666, "#ed7953" ], [ 0.7777777777777778, "#fb9f3a" ], [ 0.8888888888888888, "#fdca26" ], [ 1.0, "#f0f921" ] ] } ] }, "layout": { "geo": { "bgcolor": "white", "showland": true, "lakecolor": "white", "landcolor": "#E5ECF6", "showlakes": true, "subunitcolor": "white" }, "font": { "color": "#2a3f5f" }, "polar": { "bgcolor": "#E5ECF6", "radialaxis": { "ticks": "", "gridcolor": "white", "linecolor": "white" }, "angularaxis": { "ticks": "", "gridcolor": "white", "linecolor": "white" } }, "scene": { "xaxis": { "ticks": "", "gridcolor": "white", "gridwidth": 2, "linecolor": "white", "zerolinecolor": "white", "showbackground": true, "backgroundcolor": "#E5ECF6" }, "yaxis": { "ticks": "", "gridcolor": "white", "gridwidth": 2, "linecolor": "white", "zerolinecolor": "white", "showbackground": true, "backgroundcolor": "#E5ECF6" }, "zaxis": { "ticks": "", "gridcolor": "white", "gridwidth": 2, "linecolor": "white", "zerolinecolor": "white", "showbackground": true, "backgroundcolor": "#E5ECF6" } }, "title": { "x": 0.05 }, "xaxis": { "ticks": "", "title": { "standoff": 15 }, "gridcolor": "white", "linecolor": "white", "automargin": true, "zerolinecolor": "white", "zerolinewidth": 2 }, "yaxis": { "ticks": "", "title": { "standoff": 15 }, "gridcolor": "white", "linecolor": "white", "automargin": true, "zerolinecolor": "white", "zerolinewidth": 2 }, "mapbox": { "style": "light" }, "ternary": { "aaxis": { "ticks": "", "gridcolor": "white", "linecolor": "white" }, "baxis": { "ticks": "", "gridcolor": "white", "linecolor": "white" }, "caxis": { "ticks": "", "gridcolor": "white", "linecolor": "white" }, "bgcolor": "#E5ECF6" }, "colorway": [ "#636efa", "#EF553B", "#00cc96", "#ab63fa", "#FFA15A", "#19d3f3", "#FF6692", "#B6E880", "#FF97FF", "#FECB52" ], "coloraxis": { "colorbar": { "ticks": "", "outlinewidth": 0 } }, "hovermode": "closest", "colorscale": { "diverging": [ [ 0, "#8e0152" ], [ 0.1, "#c51b7d" ], [ 0.2, "#de77ae" ], [ 0.3, "#f1b6da" ], [ 0.4, "#fde0ef" ], [ 0.5, "#f7f7f7" ], [ 0.6, "#e6f5d0" ], [ 0.7, "#b8e186" ], [ 0.8, "#7fbc41" ], [ 0.9, "#4d9221" ], [ 1, "#276419" ] ], "sequential": [ [ 0.0, "#0d0887" ], [ 0.1111111111111111, "#46039f" ], [ 0.2222222222222222, "#7201a8" ], [ 0.3333333333333333, "#9c179e" ], [ 0.4444444444444444, "#bd3786" ], [ 0.5555555555555556, "#d8576b" ], [ 0.6666666666666666, "#ed7953" ], [ 0.7777777777777778, "#fb9f3a" ], [ 0.8888888888888888, "#fdca26" ], [ 1.0, "#f0f921" ] ], "sequentialminus": [ [ 0.0, "#0d0887" ], [ 0.1111111111111111, "#46039f" ], [ 0.2222222222222222, "#7201a8" ], [ 0.3333333333333333, "#9c179e" ], [ 0.4444444444444444, "#bd3786" ], [ 0.5555555555555556, "#d8576b" ], [ 0.6666666666666666, "#ed7953" ], [ 0.7777777777777778, "#fb9f3a" ], [ 0.8888888888888888, "#fdca26" ], [ 1.0, "#f0f921" ] ] }, "hoverlabel": { "align": "left" }, "plot_bgcolor": "#E5ECF6", "paper_bgcolor": "white", "shapedefaults": { "line": { "color": "#2a3f5f" } }, "autotypenumbers": "strict", "annotationdefaults": { "arrowhead": 0, "arrowcolor": "#2a3f5f", "arrowwidth": 1 } } }, "hovermode": "closest", "showlegend": false } }, "height": 480, "width": 640, "user": { "profile_url": "https://chart-studio.plotly.com/~andreapalazzo1974", "avatar_url": "https://storage.googleapis.com/plotly-prod-profiles/62.jpg", "background_url": "https://storage.googleapis.com/plotly-prod-profiles/bg-3.jpg", "bio": "", "nickname": "", "website": "", "stream_tokens": null, "feature_set_id": null, "csrf_token": null, "date_joined": "2024-04-03 13:19:48", "mapbox_access_tokens": null, "has_password": null, "username": "andreapalazzo1974", "email": null, "is_active": null, "readonly": null, "is_dash_creator": null, "dash_created_count": null, "is_chart_creator": null, "charts_created_count": null } } ] }
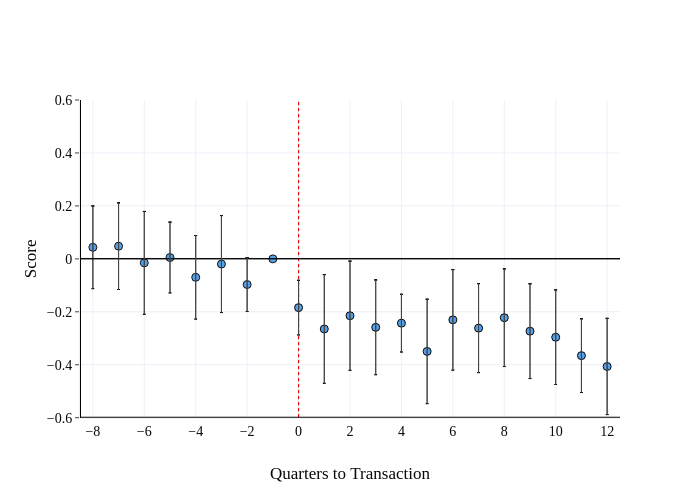