Plots List
Plots
This endpoint handles manipulation of Plotly plot files.
Reference
Authorization
Any user with or without a Plotly account may view public plots. For private plots, see authentication.
Actions
list
Listing all public plots can be done via a GET request to this endpoint.
By default, plots will be listed in order of date created. The order_by
query parameter is accepted at this endpoint. Currently, only ordering by
views is supported. It is possible to filter the plots by quality
with min_quality or max_quality as query parameter.
Example:
// GET https://api.plotly.com/v2/plots/ ---> 200

// GET https://api.plotly.com/v2/plots/?order_by=-views ---> 200

// GET https://api.plotly.com/v2/plots/?min_quality=5 ---> 200

// GET https://api.plotly.com/v2/plots/?max_quality=5 ---> 200
feed
Listing all handpicked feed plots can be done via a GET request to this endpoint. By default, plots will be listed in a random order.
Example:
// GET https://api.plotly.com/v2/plots/feed ---> 200
create
You can create new plot resources here. The only required field is 'figure'. Currently, the figure is restricted to only contain references to grid data. That is, this will fail if raw data arrays are passed in. To create and manipulate underlying grids for plots, see the grids endpoint.
Example:
// This fails because a figure field is required.
// POST https://api.plotly.com/v2/plots ---> 400 Bad Request
{}

// This fails because the figure has raw data
//POST https://api.plotly.com/v2/plots ---> 400 Bad Request
{
    "figure": {"data": [{"y": ['this', 'is', 'raw', 'data']}]}
}

// This succeeds because the figure has src keys, not raw data.
//POST https://api.plotly.com/v2/plots ---> 200 OK
{
    "figure": {"data": [{"ysrc": "sven:88:u8nd62"}]}
}
When creating a grid, you can optionally specify a source_fid to specify where a plot has come from:
- source_fid: the fid of a plot that was copied (and presumably edited) to produce this one
detail
There is a lot of meta information stored about plot files including filename, title, share_url, and content_url to name a few.
This information can only be reached with a GET to this endpoint.
Example:
// GET https://api.plotly.com/v2/plots/iheartgraphs:90
content
The contents of a plot can be downloaded via the content resource. The plot
content contains referenced grid/column data by default. If you wish to
return the raw grid/column data, the inline_data=true query must be included
in the request url. The Content-Type header will be appropriately set for the
response body.
Alternatively, you can set ?map_data=unreadable to append a mapping of
sources to data that belongs to grids which are unreadable for the
requestor. This is useful when you have read access to another users plot,
but that plot contains grid references which you don't have access to.
Examples:
// Returns referenced grid/column data
// GET https://api.plotly.com/v2/plots/iheartgraphs:90/content ---> 200 OK

// Returns full grid/column data
// GET https://api.plotly.com/v2/plots/iheartgraphs:90/content?inline_data=true ---> 200 OK

// Returns full grid/column data when requestor doesn't have permission
// to read the referenced grid.
// GET https://api.plotly.com/v2/plots/iheartgraphs:90/content?map_data=unreadable ---> 200 OK
GET /v2/plots?cursor=cj0xJnA9MjAyNC0wNC0wMyswOSUzQTU0JTNBMjUuNTc2NTAwJTJCMDAlM0EwMA%3D%3D&format=api
{ "next": "https://api.plot.ly/v2/plots?cursor=cD0yMDI0LTA0LTAzKzA5JTNBNTUlM0EyNC4yOTE1NDQlMkIwMCUzQTAw&format=api", "previous": "https://api.plot.ly/v2/plots?cursor=cj0xJnA9MjAyNC0wNC0wMysxMCUzQTI2JTNBMjguMTc2OTc2JTJCMDAlM0EwMA%3D%3D&format=api", "results": [ { "creation_time": "2024-04-03T10:26:28.176976Z", "comments": { "results": [], "count": 0 }, "parented": true, "embed_url": "https://chart-studio.plotly.com/~lviktor/63.embed", "fid": "lviktor:63", "filename": "Exports 4407 .html", "filetype": "plot", "img_url": "https://storage.googleapis.com/plotly-prod-images/lviktor/63/9_370YHMV71NPGXF8CEHZY2H0VDFNV4K.png", "image_urls": { "default": "https://storage.googleapis.com/plotly-prod-images/lviktor/63/2_YALPXBWGG2FYCF4CJEWFQY6J37NF82.png", "block-thumb": "https://storage.googleapis.com/plotly-prod-images/lviktor/63/8_C2JTCDNL6C7ZKT8BB9HID7ZD05E4IQ.png", "list-thumb": "https://storage.googleapis.com/plotly-prod-images/lviktor/63/9_370YHMV71NPGXF8CEHZY2H0VDFNV4K.png" }, "api_urls": { "files": "https://api.plotly.com/v2/files/lviktor:63", "plots": "https://api.plotly.com/v2/plots/lviktor:63", "parent": "https://api.plotly.com/v2/folders/home?user=lviktor" }, "owner": "lviktor", "parent": -1, "preview": "", "referencers": [], "references": [], "title": "", "views": 1, "web_url": "https://chart-studio.plotly.com/~lviktor/63/", "world_readable": true, "date_modified": "2024-04-08T07:43:07.655Z", "stars": { "results": [], "count": 0 }, "collaborators": { "results": [], "count": 0 }, "subfolder_count": null, "refresh_interval": null, "organize_view_url": "https://chart-studio.plotly.com/~lviktor/63/", "current_user_permission": "read", "is_theme": null, "is_template": null, "autosize": true, "caption": "", "figure": { "data": [ { "type": "choropleth", "zsrc": "lviktor:109:cb215e", "geojson": "https://raw.githubusercontent.com/python-visualization/folium/master/examples/data/world-countries.json", "showscale": false, "colorscale": [ [ 0.0, "rgba(228, 26, 28, 0.5)" ], [ 0.022727272727272728, "rgba(55, 126, 184, 0.5)" ], [ 0.045454545454545456, "rgba(77, 175, 74, 0.5)" ], [ 0.06818181818181818, "rgba(255, 127, 0, 0.5)" ], [ 0.09090909090909091, "rgba(152, 78, 163, 0.5)" ], [ 0.11363636363636363, "rgba(255, 255, 51, 0.5)" ], [ 0.13636363636363635, "rgba(166, 86, 40, 0.5)" ], [ 0.1590909090909091, "rgba(247, 129, 191, 0.5)" ], [ 0.18181818181818182, "rgba(153, 153, 153, 0.5)" ], [ 0.20454545454545456, "rgba(102, 194, 165, 0.5)" ], [ 0.22727272727272727, "rgba(140, 86, 75, 0.5)" ], [ 0.25, "rgba(178, 223, 138, 0.5)" ], [ 0.2727272727272727, "rgba(251, 154, 153, 0.5)" ], [ 0.29545454545454547, "rgba(227, 26, 28, 0.5)" ], [ 0.3181818181818182, "rgba(253, 191, 111, 0.5)" ], [ 0.3409090909090909, "rgba(255, 127, 0, 0.5)" ], [ 0.36363636363636365, "rgba(202, 178, 214, 0.5)" ], [ 0.38636363636363635, "rgba(106, 61, 154, 0.5)" ], [ 0.4090909090909091, "rgba(255, 255, 153, 0.5)" ], [ 0.4318181818181818, "rgba(177, 89, 40, 0.5)" ], [ 0.45454545454545453, "rgba(247, 129, 191, 0.5)" ], [ 0.4772727272727273, "rgba(255, 127, 0, 0.5)" ], [ 0.5, "rgba(166, 206, 227, 0.5)" ], [ 0.5227272727272727, "rgba(31, 120, 180, 0.5)" ], [ 0.5454545454545454, "rgba(178, 223, 138, 0.5)" ], [ 0.5681818181818182, "rgba(51, 160, 44, 0.5)" ], [ 0.5909090909090909, "rgba(251, 154, 153, 0.5)" ], [ 0.6136363636363636, "rgba(255, 127, 0, 0.5)" ], [ 0.6363636363636364, "rgba(106, 61, 154, 0.5)" ], [ 0.6590909090909091, "rgba(128, 26, 28, 0.5)" ], [ 0.6818181818181818, "rgba(55, 126, 184, 0.5)" ], [ 0.7045454545454546, "rgba(152, 78, 163, 0.5)" ], [ 0.7272727272727273, "rgba(247, 129, 191, 0.5)" ], [ 0.75, "rgba(255, 127, 0, 0.5)" ], [ 0.7727272727272727, "rgba(255, 255, 255, 0.5)" ], [ 0.7954545454545454, "rgba(253, 191, 111, 0.5)" ], [ 0.8181818181818182, "rgba(178, 223, 138, 0.5)" ], [ 0.8409090909090909, "rgba(255, 127, 0, 0.5)" ], [ 0.8636363636363636, "rgba(202, 178, 214, 0.5)" ], [ 0.8863636363636364, "rgba(102, 194, 165, 0.5)" ], [ 0.9090909090909091, "rgba(255, 127, 0, 0.5)" ], [ 0.9318181818181818, "rgba(140, 86, 75, 0.5)" ], [ 0.9545454545454546, "rgba(177, 89, 40, 0.5)" ], [ 0.9772727272727273, "rgba(106, 61, 154, 0.5)" ], [ 1.0, "rgba(255, 255, 153, 0.5)" ] ], "locationssrc": "lviktor:109:07772f" }, { "mode": "markers", "name": "BEL Tot.: 1098103 Tons", "text": "BEL Tot.: 1098103 Tons", "type": "scattergeo", "latsrc": "lviktor:109:7a7d70", "lonsrc": "lviktor:109:f77b53", "marker": { "line": { "width": 0 }, "size": 10.98103, "color": "rgb(152, 78, 163)", "opacity": 1 }, "hoverinfo": "text", "locationmode": "country names" }, { "mode": "markers", "name": "FRA Tot.: 905280 Tons", "text": "FRA Tot.: 905280 Tons", "type": "scattergeo", "latsrc": "lviktor:109:303a9f", "lonsrc": "lviktor:109:1c27b6", "marker": { "line": { "width": 0 }, "size": 9.052800000000001, "color": "rgb(227, 26, 28)", "opacity": 1 }, "hoverinfo": "text", "locationmode": "country names" }, { "mode": "markers", "name": "AUT Tot.: 3216222 Tons", "text": "AUT Tot.: 3216222 Tons", "type": "scattergeo", "latsrc": "lviktor:109:51c5b2", "lonsrc": "lviktor:109:58d2e4", "marker": { "line": { "width": 0 }, "size": 32.162220000000005, "color": "rgb(77, 175, 74)", "opacity": 1 }, "hoverinfo": "text", "locationmode": "country names" }, { "mode": "markers", "name": "POL Tot.: 569677 Tons", "text": "POL Tot.: 569677 Tons", "type": "scattergeo", "latsrc": "lviktor:109:8fb91a", "lonsrc": "lviktor:109:ddeab6", "marker": { "line": { "width": 0 }, "size": 5.696770000000001, "color": "rgb(152, 78, 163)", "opacity": 1 }, "hoverinfo": "text", "locationmode": "country names" }, { "mode": "markers", "name": "PRT Tot.: 169688 Tons", "text": "PRT Tot.: 169688 Tons", "type": "scattergeo", "latsrc": "lviktor:109:46ca7f", "lonsrc": "lviktor:109:6df75a", "marker": { "line": { "width": 0 }, "size": 1.6968800000000002, "color": "rgb(247, 129, 191)", "opacity": 1 }, "hoverinfo": "text", "locationmode": "country names" }, { "mode": "markers", "name": "GBR Tot.: 106129 Tons", "text": "GBR Tot.: 106129 Tons", "type": "scattergeo", "latsrc": "lviktor:109:ee5d3e", "lonsrc": "lviktor:109:78254a", "marker": { "line": { "width": 0 }, "size": 1.06129, "color": "rgb(106, 61, 154)", "opacity": 1 }, "hoverinfo": "text", "locationmode": "country names" }, { "mode": "markers", "name": "SWE Tot.: 6953567 Tons", "text": "SWE Tot.: 6953567 Tons", "type": "scattergeo", "latsrc": "lviktor:109:08243a", "lonsrc": "lviktor:109:6cb61a", "marker": { "line": { "width": 0 }, "size": 69.53567000000001, "color": "rgb(255, 127, 0)", "opacity": 1 }, "hoverinfo": "text", "locationmode": "country names" }, { "mode": "markers", "name": "EST Tot.: 498298 Tons", "text": "EST Tot.: 498298 Tons", "type": "scattergeo", "latsrc": "lviktor:109:e41f69", "lonsrc": "lviktor:109:c99a82", "marker": { "line": { "width": 0 }, "size": 4.98298, "color": "rgb(178, 223, 138)", "opacity": 1 }, "hoverinfo": "text", "locationmode": "country names" }, { "mode": "markers", "name": "NOR Tot.: 412990 Tons", "text": "NOR Tot.: 412990 Tons", "type": "scattergeo", "latsrc": "lviktor:109:2eb02a", "lonsrc": "lviktor:109:337855", "marker": { "line": { "width": 0 }, "size": 4.1299, "color": "rgb(55, 126, 184)", "opacity": 1 }, "hoverinfo": "text", "locationmode": "country names" }, { "mode": "markers", "name": "DNK Tot.: 214206 Tons", "text": "DNK Tot.: 214206 Tons", "type": "scattergeo", "latsrc": "lviktor:109:6b5f1a", "lonsrc": "lviktor:109:51863e", "marker": { "line": { "width": 0 }, "size": 2.1420600000000003, "color": "rgb(140, 86, 75)", "opacity": 1 }, "hoverinfo": "text", "locationmode": "country names" }, { "mode": "markers", "name": "CHE Tot.: 113508 Tons", "text": "CHE Tot.: 113508 Tons", "type": "scattergeo", "latsrc": "lviktor:109:01f0ae", "lonsrc": "lviktor:109:80f672", "marker": { "line": { "width": 0 }, "size": 1.13508, "color": "rgb(140, 86, 75)", "opacity": 1 }, "hoverinfo": "text", "locationmode": "country names" }, { "mode": "markers", "name": "FIN Tot.: 4368360 Tons", "text": "FIN Tot.: 4368360 Tons", "type": "scattergeo", "latsrc": "lviktor:109:7bbfdd", "lonsrc": "lviktor:109:5c19b8", "marker": { "line": { "width": 0 }, "size": 43.683600000000006, "color": "rgb(251, 154, 153)", "opacity": 1 }, "hoverinfo": "text", "locationmode": "country names" }, { "mode": "markers", "name": "LTU Tot.: 693657 Tons", "text": "LTU Tot.: 693657 Tons", "type": "scattergeo", "latsrc": "lviktor:109:442b53", "lonsrc": "lviktor:109:6c1fbf", "marker": { "line": { "width": 0 }, "size": 6.936570000000001, "color": "rgb(166, 206, 227)", "opacity": 1 }, "hoverinfo": "text", "locationmode": "country names" }, { "mode": "markers", "name": "SVN Tot.: 608298 Tons", "text": "SVN Tot.: 608298 Tons", "type": "scattergeo", "latsrc": "lviktor:109:8e4cef", "lonsrc": "lviktor:109:0e0070", "marker": { "line": { "width": 0 }, "size": 6.08298, "color": "rgb(202, 178, 214)", "opacity": 1 }, "hoverinfo": "text", "locationmode": "country names" }, { "mode": "markers", "name": "DEU Tot.: 6168871 Tons", "text": "DEU Tot.: 6168871 Tons", "type": "scattergeo", "latsrc": "lviktor:109:5e8da4", "lonsrc": "lviktor:109:df3b7f", "marker": { "line": { "width": 0 }, "size": 61.68871000000001, "color": "rgb(253, 191, 111)", "opacity": 1 }, "hoverinfo": "text", "locationmode": "country names" }, { "mode": "markers", "name": "LVA Tot.: 2176792 Tons", "text": "LVA Tot.: 2176792 Tons", "type": "scattergeo", "latsrc": "lviktor:109:17eaad", "lonsrc": "lviktor:109:69a0d8", "marker": { "line": { "width": 0 }, "size": 21.76792, "color": "rgb(247, 129, 191)", "opacity": 1 }, "hoverinfo": "text", "locationmode": "country names" }, { "mode": "markers", "name": "ITA Tot.: 240465 Tons", "text": "ITA Tot.: 240465 Tons", "type": "scattergeo", "latsrc": "lviktor:109:2028ee", "lonsrc": "lviktor:109:d5ace1", "marker": { "line": { "width": 0 }, "size": 2.40465, "color": "rgb(177, 89, 40)", "opacity": 1 }, "hoverinfo": "text", "locationmode": "country names" }, { "mode": "markers", "name": "SVK Tot.: 701939 Tons", "text": "SVK Tot.: 701939 Tons", "type": "scattergeo", "latsrc": "lviktor:109:21438d", "lonsrc": "lviktor:109:ce60e0", "marker": { "line": { "width": 0 }, "size": 7.0193900000000005, "color": "rgb(255, 127, 0)", "opacity": 1 }, "hoverinfo": "text", "locationmode": "country names" }, { "mode": "markers", "name": "NLD Tot.: 410061 Tons", "text": "NLD Tot.: 410061 Tons", "type": "scattergeo", "latsrc": "lviktor:109:e08868", "lonsrc": "lviktor:109:299039", "marker": { "line": { "width": 0 }, "size": 4.1006100000000005, "color": "rgb(128, 26, 28)", "opacity": 1 }, "hoverinfo": "text", "locationmode": "country names" }, { "mode": "markers", "name": "HRV Tot.: 1050098 Tons", "text": "HRV Tot.: 1050098 Tons", "type": "scattergeo", "latsrc": "lviktor:109:0a7682", "lonsrc": "lviktor:109:b9bc16", "marker": { "line": { "width": 0 }, "size": 10.50098, "color": "rgb(247, 129, 191)", "opacity": 1 }, "hoverinfo": "text", "locationmode": "country names" }, { "mode": "markers", "name": "UKR Tot.: 1145411 Tons", "text": "UKR Tot.: 1145411 Tons", "type": "scattergeo", "latsrc": "lviktor:109:b0d4de", "lonsrc": "lviktor:109:567360", "marker": { "line": { "width": 0 }, "size": 11.454110000000002, "color": "rgb(177, 89, 40)", "opacity": 1 }, "hoverinfo": "text", "locationmode": "country names" }, { "mode": "markers", "name": "ROU Tot.: 983476 Tons", "text": "ROU Tot.: 983476 Tons", "type": "scattergeo", "latsrc": "lviktor:109:e9b5f3", "lonsrc": "lviktor:109:16a58f", "marker": { "line": { "width": 0 }, "size": 9.834760000000001, "color": "rgb(255, 127, 0)", "opacity": 1 }, "hoverinfo": "text", "locationmode": "country names" }, { "mode": "markers", "name": "BIH Tot.: 518015 Tons", "text": "BIH Tot.: 518015 Tons", "type": "scattergeo", "latsrc": "lviktor:109:5357a9", "lonsrc": "lviktor:109:7b3578", "marker": { "line": { "width": 0 }, "size": 5.18015, "color": "rgb(255, 255, 51)", "opacity": 1 }, "hoverinfo": "text", "locationmode": "country names" }, { "mode": "markers", "name": "CZE Tot.: 1321869 Tons", "text": "CZE Tot.: 1321869 Tons", "type": "scattergeo", "latsrc": "lviktor:109:6bcfd2", "lonsrc": "lviktor:109:79e28d", "marker": { "line": { "width": 0 }, "size": 13.21869, "color": "rgb(102, 194, 165)", "opacity": 1 }, "hoverinfo": "text", "locationmode": "country names" }, { "line": { "color": "rgb(152, 78, 163)", "width": 2.9962400000000002 }, "mode": "lines+markers", "name": "BEL to France: 299624 Tons", "text": "BEL to France: 299624 Tons", "type": "scattergeo", "latsrc": "lviktor:109:329bac", "lonsrc": "lviktor:109:186cc4", "marker": { "line": { "width": 0 }, "angle": -158.0804610558197, "color": "rgb(152, 78, 163)", "symbol": "circle", "opacity": 1, "sizesrc": "lviktor:109:95844b" }, "hoverinfo": "text", "locationmode": "country names" }, { "line": { "color": "rgb(152, 78, 163)", "width": 2.8167600000000004 }, "mode": "lines+markers", "name": "BEL to Germany: 281676 Tons", "text": "BEL to Germany: 281676 Tons", "type": "scattergeo", "latsrc": "lviktor:109:50e5ad", "lonsrc": "lviktor:109:c076ad", "marker": { "line": { "width": 0 }, "angle": 79.5659832094671, "color": "rgb(152, 78, 163)", "symbol": "circle", "opacity": 1, "sizesrc": "lviktor:109:96a3d5" }, "hoverinfo": "text", "locationmode": "country names" }, { "line": { "color": "rgb(152, 78, 163)", "width": 2.44695 }, "mode": "lines+markers", "name": "BEL to Netherlands: 244695 Tons", "text": "BEL to Netherlands: 244695 Tons", "type": "scattergeo", "latsrc": "lviktor:109:ae8852", "lonsrc": "lviktor:109:27fc5b", "marker": { "line": { "width": 0 }, "angle": 19.480508609393922, "color": "rgb(152, 78, 163)", "symbol": "circle", "opacity": 1, "sizesrc": "lviktor:109:eb5d20" }, "hoverinfo": "text", "locationmode": "country names" }, { "line": { "color": "rgb(227, 26, 28)", "width": 2.0810600000000004 }, "mode": "lines+markers", "name": "FRA to Belgium: 208106 Tons", "text": "FRA to Belgium: 208106 Tons", "type": "scattergeo", "latsrc": "lviktor:109:720ce9", "lonsrc": "lviktor:109:0b1760", "marker": { "line": { "width": 0 }, "angle": 19.92606228040455, "color": "rgb(227, 26, 28)", "symbol": "circle", "opacity": 1, "sizesrc": "lviktor:109:4a2d19" }, "hoverinfo": "text", "locationmode": "country names" }, { "line": { "color": "rgb(227, 26, 28)", "width": 1.8225500000000001 }, "mode": "lines+markers", "name": "FRA to Spain: 182255 Tons", "text": "FRA to Spain: 182255 Tons", "type": "scattergeo", "latsrc": "lviktor:109:f905cd", "lonsrc": "lviktor:109:5741ae", "marker": { "line": { "width": 0 }, "angle": -141.73274007073414, "color": "rgb(227, 26, 28)", "symbol": "circle", "opacity": 1, "sizesrc": "lviktor:109:c995e8" }, "hoverinfo": "text", "locationmode": "country names" }, { "line": { "color": "rgb(227, 26, 28)", "width": 1.05682 }, "mode": "lines+markers", "name": "FRA to Netherlands: 105682 Tons", "text": "FRA to Netherlands: 105682 Tons", "type": "scattergeo", "latsrc": "lviktor:109:9e877b", "lonsrc": "lviktor:109:a8233c", "marker": { "line": { "width": 0 }, "angle": 19.229930652428948, "color": "rgb(227, 26, 28)", "symbol": "circle", "opacity": 1, "sizesrc": "lviktor:109:1178a1" }, "hoverinfo": "text", "locationmode": "country names" }, { "line": { "color": "rgb(227, 26, 28)", "width": 0.6406900000000001 }, "mode": "lines+markers", "name": "FRA to Germany: 64069 Tons", "text": "FRA to Germany: 64069 Tons", "type": "scattergeo", "latsrc": "lviktor:109:134ffb", "lonsrc": "lviktor:109:619a4a", "marker": { "line": { "width": 0 }, "angle": 44.150895851293, "color": "rgb(227, 26, 28)", "symbol": "circle", "opacity": 1, "sizesrc": "lviktor:109:bbe18e" }, "hoverinfo": "text", "locationmode": "country names" }, { "line": { "color": "rgb(227, 26, 28)", "width": 0.6019300000000001 }, "mode": "lines+markers", "name": "FRA to United Kingdom: 60193 Tons", "text": "FRA to United Kingdom: 60193 Tons", "type": "scattergeo", "latsrc": "lviktor:109:6fb524", "lonsrc": "lviktor:109:8091fb", "marker": { "line": { "width": 0 }, "angle": -16.301348453697415, "color": "rgb(227, 26, 28)", "symbol": "circle", "opacity": 1, "sizesrc": "lviktor:109:27964f" }, "hoverinfo": "text", "locationmode": "country names" }, { "line": { "color": "rgb(77, 175, 74)", "width": 15.435860000000002 }, "mode": "lines+markers", "name": "AUT to Italy: 1543586 Tons", "text": "AUT to Italy: 1543586 Tons", "type": "scattergeo", "latsrc": "lviktor:109:e62923", "lonsrc": "lviktor:109:16ea0b", "marker": { "line": { "width": 0 }, "angle": -168.10371644467477, "color": "rgb(77, 175, 74)", "symbol": "circle", "opacity": 1, "sizesrc": "lviktor:109:9019ae" }, "hoverinfo": "text", "locationmode": "country names" }, { "line": { "color": "rgb(77, 175, 74)", "width": 5.10871 }, "mode": "lines+markers", "name": "AUT to Germany: 510871 Tons", "text": "AUT to Germany: 510871 Tons", "type": "scattergeo", "latsrc": "lviktor:109:0f8d2d", "lonsrc": "lviktor:109:aac29b", "marker": { "line": { "width": 0 }, "angle": -32.838568384491424, "color": "rgb(77, 175, 74)", "symbol": "circle", "opacity": 1, "sizesrc": "lviktor:109:3b97f1" }, "hoverinfo": "text", "locationmode": "country names" }, { "line": { "color": "rgb(77, 175, 74)", "width": 2.4547100000000004 }, "mode": "lines+markers", "name": "AUT to Slovenia: 245471 Tons", "text": "AUT to Slovenia: 245471 Tons", "type": "scattergeo", "latsrc": "lviktor:109:26d0b9", "lonsrc": "lviktor:109:0848e1", "marker": { "line": { "width": 0 }, "angle": 158.81616270861014, "color": "rgb(77, 175, 74)", "symbol": "circle", "opacity": 1, "sizesrc": "lviktor:109:0371f0" }, "hoverinfo": "text", "locationmode": "country names" }, { "line": { "color": "rgb(77, 175, 74)", "width": 0.8170400000000001 }, "mode": "lines+markers", "name": "AUT to Croatia: 81704 Tons", "text": "AUT to Croatia: 81704 Tons", "type": "scattergeo", "latsrc": "lviktor:109:dcd99d", "lonsrc": "lviktor:109:f5ba08", "marker": { "line": { "width": 0 }, "angle": 164.03422251408517, "color": "rgb(77, 175, 74)", "symbol": "circle", "opacity": 1, "sizesrc": "lviktor:109:fa9e9d" }, "hoverinfo": "text", "locationmode": "country names" }, { "line": { "color": "rgb(77, 175, 74)", "width": 0.63117 }, "mode": "lines+markers", "name": "AUT to Czech Republic: 63117 Tons", "text": "AUT to Czech Republic: 63117 Tons", "type": "scattergeo", "latsrc": "lviktor:109:b2986a", "lonsrc": "lviktor:109:7464ae", "marker": { "line": { "width": 0 }, "angle": 20.231308838025228, "color": "rgb(77, 175, 74)", "symbol": "circle", "opacity": 1, "sizesrc": "lviktor:109:2ed856" }, "hoverinfo": "text", "locationmode": "country names" }, { "line": { "color": "rgb(77, 175, 74)", "width": 0.5784100000000001 }, "mode": "lines+markers", "name": "AUT to Switzerland: 57841 Tons", "text": "AUT to Switzerland: 57841 Tons", "type": "scattergeo", "latsrc": "lviktor:109:da35d7", "lonsrc": "lviktor:109:c524f2", "marker": { "line": { "width": 0 }, "angle": -95.65267999411253, "color": "rgb(77, 175, 74)", "symbol": "circle", "opacity": 1, "sizesrc": "lviktor:109:f4db7f" }, "hoverinfo": "text", "locationmode": "country names" }, { "line": { "color": "rgb(77, 175, 74)", "width": 0.52602 }, "mode": "lines+markers", "name": "AUT to Slovakia: 52602 Tons", "text": "AUT to Slovakia: 52602 Tons", "type": "scattergeo", "latsrc": "lviktor:109:b1fb05", "lonsrc": "lviktor:109:c4b88a", "marker": { "line": { "width": 0 }, "angle": 71.53524422786776, "color": "rgb(77, 175, 74)", "symbol": "circle", "opacity": 1, "sizesrc": "lviktor:109:794f0e" }, "hoverinfo": "text", "locationmode": "country names" }, { "line": { "color": "rgb(152, 78, 163)", "width": 1.2193900000000002 }, "mode": "lines+markers", "name": "POL to Germany: 121939 Tons", "text": "POL to Germany: 121939 Tons", "type": "scattergeo", "latsrc": "lviktor:109:ec2ff5", "lonsrc": "lviktor:109:6e1fd3", "marker": { "line": { "width": 0 }, "angle": -94.24163714076593, "color": "rgb(152, 78, 163)", "symbol": "circle", "opacity": 1, "sizesrc": "lviktor:109:2e4657" }, "hoverinfo": "text", "locationmode": "country names" }, { "line": { "color": "rgb(152, 78, 163)", "width": 0.85223 }, "mode": "lines+markers", "name": "POL to Italy: 85223 Tons", "text": "POL to Italy: 85223 Tons", "type": "scattergeo", "latsrc": "lviktor:109:3eb5eb", "lonsrc": "lviktor:109:c9a238", "marker": { "line": { "width": 0 }, "angle": -149.41530296142219, "color": "rgb(152, 78, 163)", "symbol": "circle", "opacity": 1, "sizesrc": "lviktor:109:7b972b" }, "hoverinfo": "text", "locationmode": "country names" }, { "line": { "color": "rgb(152, 78, 163)", "width": 0.5104700000000001 }, "mode": "lines+markers", "name": "POL to France: 51047 Tons", "text": "POL to France: 51047 Tons", "type": "scattergeo", "latsrc": "lviktor:109:81d106", "lonsrc": "lviktor:109:0ed728", "marker": { "line": { "width": 0 }, "angle": -109.90722102210212, "color": "rgb(152, 78, 163)", "symbol": "circle", "opacity": 1, "sizesrc": "lviktor:109:bf53e4" }, "hoverinfo": "text", "locationmode": "country names" }, { "line": { "color": "rgb(247, 129, 191)", "width": 1.47757 }, "mode": "lines+markers", "name": "PRT to Spain: 147757 Tons", "text": "PRT to Spain: 147757 Tons", "type": "scattergeo", "latsrc": "lviktor:109:b2ebd1", "lonsrc": "lviktor:109:c1a18d", "marker": { "line": { "width": 0 }, "angle": 79.49004289093159, "color": "rgb(247, 129, 191)", "symbol": "circle", "opacity": 1, "sizesrc": "lviktor:109:15c182" }, "hoverinfo": "text", "locationmode": "country names" }, { "line": { "color": "rgb(106, 61, 154)", "width": 0.9664900000000001 }, "mode": "lines+markers", "name": "GBR to Ireland: 96649 Tons", "text": "GBR to Ireland: 96649 Tons", "type": "scattergeo", "latsrc": "lviktor:109:9164e0", "lonsrc": "lviktor:109:94d333", "marker": { "line": { "width": 0 }, "angle": -100.27927028869813, "color": "rgb(106, 61, 154)", "symbol": "circle", "opacity": 1, "sizesrc": "lviktor:109:bd4dbe" }, "hoverinfo": "text", "locationmode": "country names" }, { "line": { "color": "rgb(255, 127, 0)", "width": 11.848590000000002 }, "mode": "lines+markers", "name": "SWE to United Kingdom: 1184859 Tons", "text": "SWE to United Kingdom: 1184859 Tons", "type": "scattergeo", "latsrc": "lviktor:109:9467e0", "lonsrc": "lviktor:109:a95175", "marker": { "line": { "width": 0 }, "angle": -124.13281257271218, "color": "rgb(255, 127, 0)", "symbol": "circle", "opacity": 1, "sizesrc": "lviktor:109:7eaa1f" }, "hoverinfo": "text", "locationmode": "country names" }, { "line": { "color": "rgb(255, 127, 0)", "width": 4.83772 }, "mode": "lines+markers", "name": "SWE to Netherlands: 483772 Tons", "text": "SWE to Netherlands: 483772 Tons", "type": "scattergeo", "latsrc": "lviktor:109:306ce3", "lonsrc": "lviktor:109:848021", "marker": { "line": { "width": 0 }, "angle": -148.2383221433501, "color": "rgb(255, 127, 0)", "symbol": "circle", "opacity": 1, "sizesrc": "lviktor:109:87e740" }, "hoverinfo": "text", "locationmode": "country names" }, { "line": { "color": "rgb(255, 127, 0)", "width": 4.32099 }, "mode": "lines+markers", "name": "SWE to Norway: 432099 Tons", "text": "SWE to Norway: 432099 Tons", "type": "scattergeo", "latsrc": "lviktor:109:c4c920", "lonsrc": "lviktor:109:8ee4d3", "marker": { "line": { "width": 0 }, "angle": -87.7923223076729, "color": "rgb(255, 127, 0)", "symbol": "circle", "opacity": 1, "sizesrc": "lviktor:109:28711e" }, "hoverinfo": "text", "locationmode": "country names" }, { "line": { "color": "rgb(255, 127, 0)", "width": 3.8919200000000003 }, "mode": "lines+markers", "name": "SWE to Denmark: 389192 Tons", "text": "SWE to Denmark: 389192 Tons", "type": "scattergeo", "latsrc": "lviktor:109:edf89b", "lonsrc": "lviktor:109:04a916", "marker": { "line": { "width": 0 }, "angle": -154.60216823520264, "color": "rgb(255, 127, 0)", "symbol": "circle", "opacity": 1, "sizesrc": "lviktor:109:d3455c" }, "hoverinfo": "text", "locationmode": "country names" }, { "line": { "color": "rgb(255, 127, 0)", "width": 3.7045900000000005 }, "mode": "lines+markers", "name": "SWE to Germany: 370459 Tons", "text": "SWE to Germany: 370459 Tons", "type": "scattergeo", "latsrc": "lviktor:109:fa8629", "lonsrc": "lviktor:109:73ddeb", "marker": { "line": { "width": 0 }, "angle": -165.04894798231575, "color": "rgb(255, 127, 0)", "symbol": "circle", "opacity": 1, "sizesrc": "lviktor:109:e95119" }, "hoverinfo": "text", "locationmode": "country names" }, { "line": { "color": "rgb(255, 127, 0)", "width": 1.8893700000000002 }, "mode": "lines+markers", "name": "SWE to Poland: 188937 Tons", "text": "SWE to Poland: 188937 Tons", "type": "scattergeo", "latsrc": "lviktor:109:57d127", "lonsrc": "lviktor:109:0a33af", "marker": { "line": { "width": 0 }, "angle": 162.6338682756906, "color": "rgb(255, 127, 0)", "symbol": "circle", "opacity": 1, "sizesrc": "lviktor:109:d7daad" }, "hoverinfo": "text", "locationmode": "country names" }, { "line": { "color": "rgb(255, 127, 0)", "width": 1.82807 }, "mode": "lines+markers", "name": "SWE to France: 182807 Tons", "text": "SWE to France: 182807 Tons", "type": "scattergeo", "latsrc": "lviktor:109:e34309", "lonsrc": "lviktor:109:6a011c", "marker": { "line": { "width": 0 }, "angle": -148.98541657373056, "color": "rgb(255, 127, 0)", "symbol": "circle", "opacity": 1, "sizesrc": "lviktor:109:fef366" }, "hoverinfo": "text", "locationmode": "country names" }, { "line": { "color": "rgb(255, 127, 0)", "width": 1.3020500000000002 }, "mode": "lines+markers", "name": "SWE to Belgium: 130205 Tons", "text": "SWE to Belgium: 130205 Tons", "type": "scattergeo", "latsrc": "lviktor:109:1c0105", "lonsrc": "lviktor:109:234ba3", "marker": { "line": { "width": 0 }, "angle": -148.8069387959069, "color": "rgb(255, 127, 0)", "symbol": "circle", "opacity": 1, "sizesrc": "lviktor:109:38d59f" }, "hoverinfo": "text", "locationmode": "country names" }, { "line": { "color": "rgb(255, 127, 0)", "width": 0.7358500000000001 }, "mode": "lines+markers", "name": "SWE to Spain: 73585 Tons", "text": "SWE to Spain: 73585 Tons", "type": "scattergeo", "latsrc": "lviktor:109:5dd7e5", "lonsrc": "lviktor:109:0ff093", "marker": { "line": { "width": 0 }, "angle": -143.55781823612037, "color": "rgb(255, 127, 0)", "symbol": "circle", "opacity": 1, "sizesrc": "lviktor:109:0cc177" }, "hoverinfo": "text", "locationmode": "country names" }, { "line": { "color": "rgb(255, 127, 0)", "width": 0.6246200000000001 }, "mode": "lines+markers", "name": "SWE to Estonia: 62462 Tons", "text": "SWE to Estonia: 62462 Tons", "type": "scattergeo", "latsrc": "lviktor:109:0f4e66", "lonsrc": "lviktor:109:940c04", "marker": { "line": { "width": 0 }, "angle": 120.03221627244608, "color": "rgb(255, 127, 0)", "symbol": "circle", "opacity": 1, "sizesrc": "lviktor:109:51f70f" }, "hoverinfo": "text", "locationmode": "country names" }, { "line": { "color": "rgb(178, 223, 138)", "width": 0.9565800000000001 }, "mode": "lines+markers", "name": "EST to Latvia: 95658 Tons", "text": "EST to Latvia: 95658 Tons", "type": "scattergeo", "latsrc": "lviktor:109:d810bb", "lonsrc": "lviktor:109:45078a", "marker": { "line": { "width": 0 }, "angle": -179.73393905188595, "color": "rgb(178, 223, 138)", "symbol": "circle", "opacity": 1, "sizesrc": "lviktor:109:838802" }, "hoverinfo": "text", "locationmode": "country names" }, { "line": { "color": "rgb(55, 126, 184)", "width": 1.16669 }, "mode": "lines+markers", "name": "NOR to Sweden: 116669 Tons", "text": "NOR to Sweden: 116669 Tons", "type": "scattergeo", "latsrc": "lviktor:109:a19750", "lonsrc": "lviktor:109:9fa7bc", "marker": { "line": { "width": 0 }, "angle": 87.79232230767292, "color": "rgb(55, 126, 184)", "symbol": "circle", "opacity": 1, "sizesrc": "lviktor:109:d9105b" }, "hoverinfo": "text", "locationmode": "country names" }, { "line": { "color": "rgb(55, 126, 184)", "width": 0.57027 }, "mode": "lines+markers", "name": "NOR to Germany: 57027 Tons", "text": "NOR to Germany: 57027 Tons", "type": "scattergeo", "latsrc": "lviktor:109:fb8a88", "lonsrc": "lviktor:109:3592c3", "marker": { "line": { "width": 0 }, "angle": 178.494009741421, "color": "rgb(55, 126, 184)", "symbol": "circle", "opacity": 1, "sizesrc": "lviktor:109:2e1d2b" }, "hoverinfo": "text", "locationmode": "country names" }, { "line": { "color": "rgb(55, 126, 184)", "width": 0.5317200000000001 }, "mode": "lines+markers", "name": "NOR to Denmark: 53172 Tons", "text": "NOR to Denmark: 53172 Tons", "type": "scattergeo", "latsrc": "lviktor:109:e3aaaf", "lonsrc": "lviktor:109:a0dccc", "marker": { "line": { "width": 0 }, "angle": -180.0, "color": "rgb(55, 126, 184)", "symbol": "circle", "opacity": 1, "sizesrc": "lviktor:109:ea2e4a" }, "hoverinfo": "text", "locationmode": "country names" }, { "line": { "color": "rgb(55, 126, 184)", "width": 0.5429700000000001 }, "mode": "lines+markers", "name": "NOR to United Kingdom: 54297 Tons", "text": "NOR to United Kingdom: 54297 Tons", "type": "scattergeo", "latsrc": "lviktor:109:e137d9", "lonsrc": "lviktor:109:971627", "marker": { "line": { "width": 0 }, "angle": -136.28865139099722, "color": "rgb(55, 126, 184)", "symbol": "circle", "opacity": 1, "sizesrc": "lviktor:109:180fe9" }, "hoverinfo": "text", "locationmode": "country names" }, { "line": { "color": "rgb(140, 86, 75)", "width": 0.72711 }, "mode": "lines+markers", "name": "DNK to Sweden: 72711 Tons", "text": "DNK to Sweden: 72711 Tons", "type": "scattergeo", "latsrc": "lviktor:109:42abfd", "lonsrc": "lviktor:109:790f7d", "marker": { "line": { "width": 0 }, "angle": 21.10539668854898, "color": "rgb(140, 86, 75)", "symbol": "circle", "opacity": 1, "sizesrc": "lviktor:109:2fbd37" }, "hoverinfo": "text", "locationmode": "country names" }, { "line": { "color": "rgb(251, 154, 153)", "width": 3.7618700000000005 }, "mode": "lines+markers", "name": "FIN to United Kingdom: 376187 Tons", "text": "FIN to United Kingdom: 376187 Tons", "type": "scattergeo", "latsrc": "lviktor:109:0bc3b7", "lonsrc": "lviktor:109:dc5dcf", "marker": { "line": { "width": 0 }, "angle": -112.05695690053413, "color": "rgb(251, 154, 153)", "symbol": "circle", "opacity": 1, "sizesrc": "lviktor:109:97143f" }, "hoverinfo": "text", "locationmode": "country names" }, { "line": { "color": "rgb(251, 154, 153)", "width": 2.5963900000000004 }, "mode": "lines+markers", "name": "FIN to Estonia: 259639 Tons", "text": "FIN to Estonia: 259639 Tons", "type": "scattergeo", "latsrc": "lviktor:109:1c7b09", "lonsrc": "lviktor:109:3a842e", "marker": { "line": { "width": 0 }, "angle": -174.55570923746188, "color": "rgb(251, 154, 153)", "symbol": "circle", "opacity": 1, "sizesrc": "lviktor:109:49e854" }, "hoverinfo": "text", "locationmode": "country names" }, { "line": { "color": "rgb(251, 154, 153)", "width": 2.2456400000000003 }, "mode": "lines+markers", "name": "FIN to Germany: 224564 Tons", "text": "FIN to Germany: 224564 Tons", "type": "scattergeo", "latsrc": "lviktor:109:95839a", "lonsrc": "lviktor:109:33cdfd", "marker": { "line": { "width": 0 }, "angle": -140.16647238571636, "color": "rgb(251, 154, 153)", "symbol": "circle", "opacity": 1, "sizesrc": "lviktor:109:510223" }, "hoverinfo": "text", "locationmode": "country names" }, { "line": { "color": "rgb(251, 154, 153)", "width": 2.11774 }, "mode": "lines+markers", "name": "FIN to France: 211774 Tons", "text": "FIN to France: 211774 Tons", "type": "scattergeo", "latsrc": "lviktor:109:b5790b", "lonsrc": "lviktor:109:b5de02", "marker": { "line": { "width": 0 }, "angle": -132.0711260118332, "color": "rgb(251, 154, 153)", "symbol": "circle", "opacity": 1, "sizesrc": "lviktor:109:bc0359" }, "hoverinfo": "text", "locationmode": "country names" }, { "line": { "color": "rgb(251, 154, 153)", "width": 1.33627 }, "mode": "lines+markers", "name": "FIN to Netherlands: 133627 Tons", "text": "FIN to Netherlands: 133627 Tons", "type": "scattergeo", "latsrc": "lviktor:109:c0bc66", "lonsrc": "lviktor:109:957117", "marker": { "line": { "width": 0 }, "angle": -128.15674241039727, "color": "rgb(251, 154, 153)", "symbol": "circle", "opacity": 1, "sizesrc": "lviktor:109:186867" }, "hoverinfo": "text", "locationmode": "country names" }, { "line": { "color": "rgb(251, 154, 153)", "width": 0.8516600000000001 }, "mode": "lines+markers", "name": "FIN to Italy: 85166 Tons", "text": "FIN to Italy: 85166 Tons", "type": "scattergeo", "latsrc": "lviktor:109:c8648e", "lonsrc": "lviktor:109:f5e821", "marker": { "line": { "width": 0 }, "angle": -154.08327646924585, "color": "rgb(251, 154, 153)", "symbol": "circle", "opacity": 1, "sizesrc": "lviktor:109:9d6c17" }, "hoverinfo": "text", "locationmode": "country names" }, { "line": { "color": "rgb(251, 154, 153)", "width": 0.7536700000000001 }, "mode": "lines+markers", "name": "FIN to Austria: 75367 Tons", "text": "FIN to Austria: 75367 Tons", "type": "scattergeo", "latsrc": "lviktor:109:b5b377", "lonsrc": "lviktor:109:802b61", "marker": { "line": { "width": 0 }, "angle": -152.90833536562846, "color": "rgb(251, 154, 153)", "symbol": "circle", "opacity": 1, "sizesrc": "lviktor:109:779e04" }, "hoverinfo": "text", "locationmode": "country names" }, { "line": { "color": "rgb(251, 154, 153)", "width": 0.6906500000000001 }, "mode": "lines+markers", "name": "FIN to Latvia: 69065 Tons", "text": "FIN to Latvia: 69065 Tons", "type": "scattergeo", "latsrc": "lviktor:109:0c7b6f", "lonsrc": "lviktor:109:e67943", "marker": { "line": { "width": 0 }, "angle": -175.53749612802488, "color": "rgb(251, 154, 153)", "symbol": "circle", "opacity": 1, "sizesrc": "lviktor:109:939d01" }, "hoverinfo": "text", "locationmode": "country names" }, { "line": { "color": "rgb(251, 154, 153)", "width": 0.6024400000000001 }, "mode": "lines+markers", "name": "FIN to Denmark: 60244 Tons", "text": "FIN to Denmark: 60244 Tons", "type": "scattergeo", "latsrc": "lviktor:109:5bc0c4", "lonsrc": "lviktor:109:26bd59", "marker": { "line": { "width": 0 }, "angle": -127.83347956998998, "color": "rgb(251, 154, 153)", "symbol": "circle", "opacity": 1, "sizesrc": "lviktor:109:0278bf" }, "hoverinfo": "text", "locationmode": "country names" }, { "line": { "color": "rgb(251, 154, 153)", "width": 0.6004 }, "mode": "lines+markers", "name": "FIN to Belgium: 60040 Tons", "text": "FIN to Belgium: 60040 Tons", "type": "scattergeo", "latsrc": "lviktor:109:6dbf2e", "lonsrc": "lviktor:109:914c3e", "marker": { "line": { "width": 0 }, "angle": -129.76840258908715, "color": "rgb(251, 154, 153)", "symbol": "circle", "opacity": 1, "sizesrc": "lviktor:109:cb4605" }, "hoverinfo": "text", "locationmode": "country names" }, { "line": { "color": "rgb(251, 154, 153)", "width": 0.5696 }, "mode": "lines+markers", "name": "FIN to Spain: 56960 Tons", "text": "FIN to Spain: 56960 Tons", "type": "scattergeo", "latsrc": "lviktor:109:075fd4", "lonsrc": "lviktor:109:7875db", "marker": { "line": { "width": 0 }, "angle": -129.38882988231276, "color": "rgb(251, 154, 153)", "symbol": "circle", "opacity": 1, "sizesrc": "lviktor:109:cc9580" }, "hoverinfo": "text", "locationmode": "country names" }, { "line": { "color": "rgb(251, 154, 153)", "width": 0.5545 }, "mode": "lines+markers", "name": "FIN to Poland: 55450 Tons", "text": "FIN to Poland: 55450 Tons", "type": "scattergeo", "latsrc": "lviktor:109:63457f", "lonsrc": "lviktor:109:5f0570", "marker": { "line": { "width": 0 }, "angle": -162.5621843767621, "color": "rgb(251, 154, 153)", "symbol": "circle", "opacity": 1, "sizesrc": "lviktor:109:fa7498" }, "hoverinfo": "text", "locationmode": "country names" }, { "line": { "color": "rgb(166, 206, 227)", "width": 1.4235200000000001 }, "mode": "lines+markers", "name": "LTU to Germany: 142352 Tons", "text": "LTU to Germany: 142352 Tons", "type": "scattergeo", "latsrc": "lviktor:109:5386ea", "lonsrc": "lviktor:109:ae1da8", "marker": { "line": { "width": 0 }, "angle": -115.41687094109008, "color": "rgb(166, 206, 227)", "symbol": "circle", "opacity": 1, "sizesrc": "lviktor:109:595f69" }, "hoverinfo": "text", "locationmode": "country names" }, { "line": { "color": "rgb(166, 206, 227)", "width": 0.6041200000000001 }, "mode": "lines+markers", "name": "LTU to France: 60412 Tons", "text": "LTU to France: 60412 Tons", "type": "scattergeo", "latsrc": "lviktor:109:7fc6d1", "lonsrc": "lviktor:109:ce6add", "marker": { "line": { "width": 0 }, "angle": -116.84648641507599, "color": "rgb(166, 206, 227)", "symbol": "circle", "opacity": 1, "sizesrc": "lviktor:109:1a384d" }, "hoverinfo": "text", "locationmode": "country names" }, { "line": { "color": "rgb(202, 178, 214)", "width": 1.59051 }, "mode": "lines+markers", "name": "SVN to Italy: 159051 Tons", "text": "SVN to Italy: 159051 Tons", "type": "scattergeo", "latsrc": "lviktor:109:a887ba", "lonsrc": "lviktor:109:374e17", "marker": { "line": { "width": 0 }, "angle": -154.30398294757194, "color": "rgb(202, 178, 214)", "symbol": "circle", "opacity": 1, "sizesrc": "lviktor:109:4e0e66" }, "hoverinfo": "text", "locationmode": "country names" }, { "line": { "color": "rgb(253, 191, 111)", "width": 5.10888 }, "mode": "lines+markers", "name": "DEU to France: 510888 Tons", "text": "DEU to France: 510888 Tons", "type": "scattergeo", "latsrc": "lviktor:109:726dc0", "lonsrc": "lviktor:109:7d719d", "marker": { "line": { "width": 0 }, "angle": -129.49974571106284, "color": "rgb(253, 191, 111)", "symbol": "circle", "opacity": 1, "sizesrc": "lviktor:109:1708de" }, "hoverinfo": "text", "locationmode": "country names" }, { "line": { "color": "rgb(253, 191, 111)", "width": 4.710800000000001 }, "mode": "lines+markers", "name": "DEU to Austria: 471080 Tons", "text": "DEU to Austria: 471080 Tons", "type": "scattergeo", "latsrc": "lviktor:109:9d85ec", "lonsrc": "lviktor:109:c31532", "marker": { "line": { "width": 0 }, "angle": 144.3186194799946, "color": "rgb(253, 191, 111)", "symbol": "circle", "opacity": 1, "sizesrc": "lviktor:109:43f354" }, "hoverinfo": "text", "locationmode": "country names" }, { "line": { "color": "rgb(253, 191, 111)", "width": 4.61441 }, "mode": "lines+markers", "name": "DEU to Belgium: 461441 Tons", "text": "DEU to Belgium: 461441 Tons", "type": "scattergeo", "latsrc": "lviktor:109:bea63f", "lonsrc": "lviktor:109:4670c5", "marker": { "line": { "width": 0 }, "angle": -95.94298850401717, "color": "rgb(253, 191, 111)", "symbol": "circle", "opacity": 1, "sizesrc": "lviktor:109:ab207a" }, "hoverinfo": "text", "locationmode": "country names" }, { "line": { "color": "rgb(253, 191, 111)", "width": 4.563910000000001 }, "mode": "lines+markers", "name": "DEU to Netherlands: 456391 Tons", "text": "DEU to Netherlands: 456391 Tons", "type": "scattergeo", "latsrc": "lviktor:109:84d14f", "lonsrc": "lviktor:109:1dcdca", "marker": { "line": { "width": 0 }, "angle": -63.49656991321723, "color": "rgb(253, 191, 111)", "symbol": "circle", "opacity": 1, "sizesrc": "lviktor:109:aa586a" }, "hoverinfo": "text", "locationmode": "country names" }, { "line": { "color": "rgb(253, 191, 111)", "width": 3.1500700000000004 }, "mode": "lines+markers", "name": "DEU to Italy: 315007 Tons", "text": "DEU to Italy: 315007 Tons", "type": "scattergeo", "latsrc": "lviktor:109:e07bf8", "lonsrc": "lviktor:109:4f7c0a", "marker": { "line": { "width": 0 }, "angle": 168.0842001979509, "color": "rgb(253, 191, 111)", "symbol": "circle", "opacity": 1, "sizesrc": "lviktor:109:6ca20c" }, "hoverinfo": "text", "locationmode": "country names" }, { "line": { "color": "rgb(253, 191, 111)", "width": 2.4773300000000003 }, "mode": "lines+markers", "name": "DEU to United Kingdom: 247733 Tons", "text": "DEU to United Kingdom: 247733 Tons", "type": "scattergeo", "latsrc": "lviktor:109:505c44", "lonsrc": "lviktor:109:5dc220", "marker": { "line": { "width": 0 }, "angle": -64.58549710541996, "color": "rgb(253, 191, 111)", "symbol": "circle", "opacity": 1, "sizesrc": "lviktor:109:882f6c" }, "hoverinfo": "text", "locationmode": "country names" }, { "line": { "color": "rgb(253, 191, 111)", "width": 1.9280800000000002 }, "mode": "lines+markers", "name": "DEU to Poland: 192808 Tons", "text": "DEU to Poland: 192808 Tons", "type": "scattergeo", "latsrc": "lviktor:109:e637f6", "lonsrc": "lviktor:109:cf160e", "marker": { "line": { "width": 0 }, "angle": 78.27015656162581, "color": "rgb(253, 191, 111)", "symbol": "circle", "opacity": 1, "sizesrc": "lviktor:109:f06064" }, "hoverinfo": "text", "locationmode": "country names" }, { "line": { "color": "rgb(253, 191, 111)", "width": 1.07583 }, "mode": "lines+markers", "name": "DEU to Czech Republic: 107583 Tons", "text": "DEU to Czech Republic: 107583 Tons", "type": "scattergeo", "latsrc": "lviktor:109:63c41f", "lonsrc": "lviktor:109:8c7985", "marker": { "line": { "width": 0 }, "angle": 110.9293488526323, "color": "rgb(253, 191, 111)", "symbol": "circle", "opacity": 1, "sizesrc": "lviktor:109:b312d8" }, "hoverinfo": "text", "locationmode": "country names" }, { "line": { "color": "rgb(253, 191, 111)", "width": 0.9135200000000001 }, "mode": "lines+markers", "name": "DEU to Spain: 91352 Tons", "text": "DEU to Spain: 91352 Tons", "type": "scattergeo", "latsrc": "lviktor:109:7c8069", "lonsrc": "lviktor:109:931fcb", "marker": { "line": { "width": 0 }, "angle": -132.4327055714385, "color": "rgb(253, 191, 111)", "symbol": "circle", "opacity": 1, "sizesrc": "lviktor:109:b0a43a" }, "hoverinfo": "text", "locationmode": "country names" }, { "line": { "color": "rgb(253, 191, 111)", "width": 0.6543000000000001 }, "mode": "lines+markers", "name": "DEU to Switzerland: 65430 Tons", "text": "DEU to Switzerland: 65430 Tons", "type": "scattergeo", "latsrc": "lviktor:109:66be8c", "lonsrc": "lviktor:109:d68c2e", "marker": { "line": { "width": 0 }, "angle": -157.9869614765162, "color": "rgb(253, 191, 111)", "symbol": "circle", "opacity": 1, "sizesrc": "lviktor:109:8a853f" }, "hoverinfo": "text", "locationmode": "country names" }, { "line": { "color": "rgb(253, 191, 111)", "width": 0.50921 }, "mode": "lines+markers", "name": "DEU to Denmark: 50921 Tons", "text": "DEU to Denmark: 50921 Tons", "type": "scattergeo", "latsrc": "lviktor:109:d6da25", "lonsrc": "lviktor:109:9465bf", "marker": { "line": { "width": 0 }, "angle": -2.992640055408799, "color": "rgb(253, 191, 111)", "symbol": "circle", "opacity": 1, "sizesrc": "lviktor:109:1ce38c" }, "hoverinfo": "text", "locationmode": "country names" }, { "line": { "color": "rgb(247, 129, 191)", "width": 8.17425 }, "mode": "lines+markers", "name": "LVA to United Kingdom: 817425 Tons", "text": "LVA to United Kingdom: 817425 Tons", "type": "scattergeo", "latsrc": "lviktor:109:4868a8", "lonsrc": "lviktor:109:e8a8a2", "marker": { "line": { "width": 0 }, "angle": -89.70085023462117, "color": "rgb(247, 129, 191)", "symbol": "circle", "opacity": 1, "sizesrc": "lviktor:109:86b7d0" }, "hoverinfo": "text", "locationmode": "country names" }, { "line": { "color": "rgb(247, 129, 191)", "width": 2.0204400000000002 }, "mode": "lines+markers", "name": "LVA to Netherlands: 202044 Tons", "text": "LVA to Netherlands: 202044 Tons", "type": "scattergeo", "latsrc": "lviktor:109:be09c8", "lonsrc": "lviktor:109:5254e7", "marker": { "line": { "width": 0 }, "angle": -103.96582471014084, "color": "rgb(247, 129, 191)", "symbol": "circle", "opacity": 1, "sizesrc": "lviktor:109:9f6943" }, "hoverinfo": "text", "locationmode": "country names" }, { "line": { "color": "rgb(247, 129, 191)", "width": 1.6686900000000002 }, "mode": "lines+markers", "name": "LVA to Estonia: 166869 Tons", "text": "LVA to Estonia: 166869 Tons", "type": "scattergeo", "latsrc": "lviktor:109:a1beb4", "lonsrc": "lviktor:109:00f91b", "marker": { "line": { "width": 0 }, "angle": 0.2545519030168464, "color": "rgb(247, 129, 191)", "symbol": "circle", "opacity": 1, "sizesrc": "lviktor:109:5e7aa5" }, "hoverinfo": "text", "locationmode": "country names" }, { "line": { "color": "rgb(247, 129, 191)", "width": 1.20144 }, "mode": "lines+markers", "name": "LVA to Lithuania: 120144 Tons", "text": "LVA to Lithuania: 120144 Tons", "type": "scattergeo", "latsrc": "lviktor:109:faa541", "lonsrc": "lviktor:109:2edd41", "marker": { "line": { "width": 0 }, "angle": -150.6861847452231, "color": "rgb(247, 129, 191)", "symbol": "circle", "opacity": 1, "sizesrc": "lviktor:109:6096ff" }, "hoverinfo": "text", "locationmode": "country names" }, { "line": { "color": "rgb(247, 129, 191)", "width": 1.16154 }, "mode": "lines+markers", "name": "LVA to Germany: 116154 Tons", "text": "LVA to Germany: 116154 Tons", "type": "scattergeo", "latsrc": "lviktor:109:853a4f", "lonsrc": "lviktor:109:bcc56b", "marker": { "line": { "width": 0 }, "angle": -118.29246355183294, "color": "rgb(247, 129, 191)", "symbol": "circle", "opacity": 1, "sizesrc": "lviktor:109:b309b8" }, "hoverinfo": "text", "locationmode": "country names" }, { "line": { "color": "rgb(247, 129, 191)", "width": 0.81196 }, "mode": "lines+markers", "name": "LVA to Belgium: 81196 Tons", "text": "LVA to Belgium: 81196 Tons", "type": "scattergeo", "latsrc": "lviktor:109:cdab8d", "lonsrc": "lviktor:109:27aba5", "marker": { "line": { "width": 0 }, "angle": -109.4054656567425, "color": "rgb(247, 129, 191)", "symbol": "circle", "opacity": 1, "sizesrc": "lviktor:109:ae4861" }, "hoverinfo": "text", "locationmode": "country names" }, { "line": { "color": "rgb(255, 127, 0)", "width": 3.0597200000000004 }, "mode": "lines+markers", "name": "SVK to Hungary: 305972 Tons", "text": "SVK to Hungary: 305972 Tons", "type": "scattergeo", "latsrc": "lviktor:109:ca728a", "lonsrc": "lviktor:109:e3cdb1", "marker": { "line": { "width": 0 }, "angle": -174.95134873240255, "color": "rgb(255, 127, 0)", "symbol": "circle", "opacity": 1, "sizesrc": "lviktor:109:2d4614" }, "hoverinfo": "text", "locationmode": "country names" }, { "line": { "color": "rgb(255, 127, 0)", "width": 0.8680200000000001 }, "mode": "lines+markers", "name": "SVK to Poland: 86802 Tons", "text": "SVK to Poland: 86802 Tons", "type": "scattergeo", "latsrc": "lviktor:109:3b8bb2", "lonsrc": "lviktor:109:2ab206", "marker": { "line": { "width": 0 }, "angle": 3.1856907396364136, "color": "rgb(255, 127, 0)", "symbol": "circle", "opacity": 1, "sizesrc": "lviktor:109:0ac6b8" }, "hoverinfo": "text", "locationmode": "country names" }, { "line": { "color": "rgb(255, 127, 0)", "width": 0.7512700000000001 }, "mode": "lines+markers", "name": "SVK to Italy: 75127 Tons", "text": "SVK to Italy: 75127 Tons", "type": "scattergeo", "latsrc": "lviktor:109:2cc8da", "lonsrc": "lviktor:109:8daca8", "marker": { "line": { "width": 0 }, "angle": -138.10684935296226, "color": "rgb(255, 127, 0)", "symbol": "circle", "opacity": 1, "sizesrc": "lviktor:109:c9aa31" }, "hoverinfo": "text", "locationmode": "country names" }, { "line": { "color": "rgb(255, 127, 0)", "width": 0.5494800000000001 }, "mode": "lines+markers", "name": "SVK to Czech Republic: 54948 Tons", "text": "SVK to Czech Republic: 54948 Tons", "type": "scattergeo", "latsrc": "lviktor:109:120416", "lonsrc": "lviktor:109:0468bf", "marker": { "line": { "width": 0 }, "angle": -65.80745963255295, "color": "rgb(255, 127, 0)", "symbol": "circle", "opacity": 1, "sizesrc": "lviktor:109:d623f9" }, "hoverinfo": "text", "locationmode": "country names" }, { "line": { "color": "rgb(128, 26, 28)", "width": 0.58767 }, "mode": "lines+markers", "name": "NLD to Belgium: 58767 Tons", "text": "NLD to Belgium: 58767 Tons", "type": "scattergeo", "latsrc": "lviktor:109:625231", "lonsrc": "lviktor:109:97a60b", "marker": { "line": { "width": 0 }, "angle": -159.67074541498147, "color": "rgb(128, 26, 28)", "symbol": "circle", "opacity": 1, "sizesrc": "lviktor:109:62634e" }, "hoverinfo": "text", "locationmode": "country names" }, { "line": { "color": "rgb(128, 26, 28)", "width": 0.5186700000000001 }, "mode": "lines+markers", "name": "NLD to United Kingdom: 51867 Tons", "text": "NLD to United Kingdom: 51867 Tons", "type": "scattergeo", "latsrc": "lviktor:109:dd2608", "lonsrc": "lviktor:109:655aa3", "marker": { "line": { "width": 0 }, "angle": -68.99369265202876, "color": "rgb(128, 26, 28)", "symbol": "circle", "opacity": 1, "sizesrc": "lviktor:109:487a1b" }, "hoverinfo": "text", "locationmode": "country names" }, { "line": { "color": "rgb(247, 129, 191)", "width": 1.4850200000000002 }, "mode": "lines+markers", "name": "HRV to Italy: 148502 Tons", "text": "HRV to Italy: 148502 Tons", "type": "scattergeo", "latsrc": "lviktor:109:a9a348", "lonsrc": "lviktor:109:7828bd", "marker": { "line": { "width": 0 }, "angle": -142.2477919675032, "color": "rgb(247, 129, 191)", "symbol": "circle", "opacity": 1, "sizesrc": "lviktor:109:c3b141" }, "hoverinfo": "text", "locationmode": "country names" }, { "line": { "color": "rgb(247, 129, 191)", "width": 0.66266 }, "mode": "lines+markers", "name": "HRV to Bosnia and Herzegovina: 66266 Tons", "text": "HRV to Bosnia and Herzegovina: 66266 Tons", "type": "scattergeo", "latsrc": "lviktor:109:c5573e", "lonsrc": "lviktor:109:48d2ef", "marker": { "line": { "width": 0 }, "angle": 122.93846914326014, "color": "rgb(247, 129, 191)", "symbol": "circle", "opacity": 1, "sizesrc": "lviktor:109:3732c7" }, "hoverinfo": "text", "locationmode": "country names" }, { "line": { "color": "rgb(247, 129, 191)", "width": 0.65303 }, "mode": "lines+markers", "name": "HRV to Slovenia: 65303 Tons", "text": "HRV to Slovenia: 65303 Tons", "type": "scattergeo", "latsrc": "lviktor:109:2213b5", "lonsrc": "lviktor:109:1ece0c", "marker": { "line": { "width": 0 }, "angle": -7.674554018338625, "color": "rgb(247, 129, 191)", "symbol": "circle", "opacity": 1, "sizesrc": "lviktor:109:b00cd4" }, "hoverinfo": "text", "locationmode": "country names" }, { "line": { "color": "rgb(247, 129, 191)", "width": 0.55462 }, "mode": "lines+markers", "name": "HRV to Austria: 55462 Tons", "text": "HRV to Austria: 55462 Tons", "type": "scattergeo", "latsrc": "lviktor:109:a30456", "lonsrc": "lviktor:109:59386c", "marker": { "line": { "width": 0 }, "angle": -15.238206360743504, "color": "rgb(247, 129, 191)", "symbol": "circle", "opacity": 1, "sizesrc": "lviktor:109:970c6a" }, "hoverinfo": "text", "locationmode": "country names" }, { "line": { "color": "rgb(177, 89, 40)", "width": 1.30085 }, "mode": "lines+markers", "name": "UKR to Hungary: 130085 Tons", "text": "UKR to Hungary: 130085 Tons", "type": "scattergeo", "latsrc": "lviktor:109:794b6e", "lonsrc": "lviktor:109:49d9c6", "marker": { "line": { "width": 0 }, "angle": -97.70607253711874, "color": "rgb(177, 89, 40)", "symbol": "circle", "opacity": 1, "sizesrc": "lviktor:109:b7ee27" }, "hoverinfo": "text", "locationmode": "country names" }, { "line": { "color": "rgb(177, 89, 40)", "width": 1.12968 }, "mode": "lines+markers", "name": "UKR to Italy: 112968 Tons", "text": "UKR to Italy: 112968 Tons", "type": "scattergeo", "latsrc": "lviktor:109:f0d06b", "lonsrc": "lviktor:109:614fe3", "marker": { "line": { "width": 0 }, "angle": -107.67917216320673, "color": "rgb(177, 89, 40)", "symbol": "circle", "opacity": 1, "sizesrc": "lviktor:109:a1b4cc" }, "hoverinfo": "text", "locationmode": "country names" }, { "line": { "color": "rgb(177, 89, 40)", "width": 1.05841 }, "mode": "lines+markers", "name": "UKR to Poland: 105841 Tons", "text": "UKR to Poland: 105841 Tons", "type": "scattergeo", "latsrc": "lviktor:109:11f46a", "lonsrc": "lviktor:109:5475d6", "marker": { "line": { "width": 0 }, "angle": -63.9789456902991, "color": "rgb(177, 89, 40)", "symbol": "circle", "opacity": 1, "sizesrc": "lviktor:109:e86090" }, "hoverinfo": "text", "locationmode": "country names" }, { "line": { "color": "rgb(177, 89, 40)", "width": 0.8857100000000001 }, "mode": "lines+markers", "name": "UKR to Germany: 88571 Tons", "text": "UKR to Germany: 88571 Tons", "type": "scattergeo", "latsrc": "lviktor:109:afc823", "lonsrc": "lviktor:109:f3d45a", "marker": { "line": { "width": 0 }, "angle": -72.8971637190895, "color": "rgb(177, 89, 40)", "symbol": "circle", "opacity": 1, "sizesrc": "lviktor:109:9e0259" }, "hoverinfo": "text", "locationmode": "country names" }, { "line": { "color": "rgb(177, 89, 40)", "width": 0.73184 }, "mode": "lines+markers", "name": "UKR to Romania: 73184 Tons", "text": "UKR to Romania: 73184 Tons", "type": "scattergeo", "latsrc": "lviktor:109:d47eaf", "lonsrc": "lviktor:109:535938", "marker": { "line": { "width": 0 }, "angle": -119.77161558765268, "color": "rgb(177, 89, 40)", "symbol": "circle", "opacity": 1, "sizesrc": "lviktor:109:43ee3e" }, "hoverinfo": "text", "locationmode": "country names" }, { "line": { "color": "rgb(177, 89, 40)", "width": 0.57237 }, "mode": "lines+markers", "name": "UKR to Lithuania: 57237 Tons", "text": "UKR to Lithuania: 57237 Tons", "type": "scattergeo", "latsrc": "lviktor:109:9b3071", "lonsrc": "lviktor:109:d8d474", "marker": { "line": { "width": 0 }, "angle": -31.706565175697023, "color": "rgb(177, 89, 40)", "symbol": "circle", "opacity": 1, "sizesrc": "lviktor:109:170f3c" }, "hoverinfo": "text", "locationmode": "country names" }, { "line": { "color": "rgb(255, 255, 51)", "width": 0.9358500000000001 }, "mode": "lines+markers", "name": "BIH to Croatia: 93585 Tons", "text": "BIH to Croatia: 93585 Tons", "type": "scattergeo", "latsrc": "lviktor:109:996086", "lonsrc": "lviktor:109:b546e4", "marker": { "line": { "width": 0 }, "angle": -55.32343069077541, "color": "rgb(255, 255, 51)", "symbol": "circle", "opacity": 1, "sizesrc": "lviktor:109:a559bb" }, "hoverinfo": "text", "locationmode": "country names" }, { "line": { "color": "rgb(255, 255, 51)", "width": 0.51795 }, "mode": "lines+markers", "name": "BIH to Italy: 51795 Tons", "text": "BIH to Italy: 51795 Tons", "type": "scattergeo", "latsrc": "lviktor:109:3ff132", "lonsrc": "lviktor:109:c43347", "marker": { "line": { "width": 0 }, "angle": -105.41067901295992, "color": "rgb(255, 255, 51)", "symbol": "circle", "opacity": 1, "sizesrc": "lviktor:109:99603e" }, "hoverinfo": "text", "locationmode": "country names" }, { "line": { "color": "rgb(102, 194, 165)", "width": 3.21646 }, "mode": "lines+markers", "name": "CZE to Austria: 321646 Tons", "text": "CZE to Austria: 321646 Tons", "type": "scattergeo", "latsrc": "lviktor:109:8389d4", "lonsrc": "lviktor:109:9b27f4", "marker": { "line": { "width": 0 }, "angle": -158.80805127609625, "color": "rgb(102, 194, 165)", "symbol": "circle", "opacity": 1, "sizesrc": "lviktor:109:f35bf0" }, "hoverinfo": "text", "locationmode": "country names" }, { "line": { "color": "rgb(102, 194, 165)", "width": 2.9863700000000004 }, "mode": "lines+markers", "name": "CZE to Germany: 298637 Tons", "text": "CZE to Germany: 298637 Tons", "type": "scattergeo", "latsrc": "lviktor:109:b5ab7b", "lonsrc": "lviktor:109:48269e", "marker": { "line": { "width": 0 }, "angle": -65.19513481819659, "color": "rgb(102, 194, 165)", "symbol": "circle", "opacity": 1, "sizesrc": "lviktor:109:bda0e7" }, "hoverinfo": "text", "locationmode": "country names" }, { "line": { "color": "rgb(102, 194, 165)", "width": 1.6566900000000002 }, "mode": "lines+markers", "name": "CZE to Italy: 165669 Tons", "text": "CZE to Italy: 165669 Tons", "type": "scattergeo", "latsrc": "lviktor:109:8c65f5", "lonsrc": "lviktor:109:28b9ea", "marker": { "line": { "width": 0 }, "angle": -164.40451167748526, "color": "rgb(102, 194, 165)", "symbol": "circle", "opacity": 1, "sizesrc": "lviktor:109:b659ed" }, "hoverinfo": "text", "locationmode": "country names" }, { "line": { "color": "rgb(102, 194, 165)", "width": 1.2636800000000001 }, "mode": "lines+markers", "name": "CZE to Slovenia: 126368 Tons", "text": "CZE to Slovenia: 126368 Tons", "type": "scattergeo", "latsrc": "lviktor:109:83b3f6", "lonsrc": "lviktor:109:c62d4a", "marker": { "line": { "width": 0 }, "angle": -174.83953294342186, "color": "rgb(102, 194, 165)", "symbol": "circle", "opacity": 1, "sizesrc": "lviktor:109:e19bf9" }, "hoverinfo": "text", "locationmode": "country names" }, { "line": { "color": "rgb(102, 194, 165)", "width": 0.8905400000000001 }, "mode": "lines+markers", "name": "CZE to Slovakia: 89054 Tons", "text": "CZE to Slovakia: 89054 Tons", "type": "scattergeo", "latsrc": "lviktor:109:018cf7", "lonsrc": "lviktor:109:7588fb", "marker": { "line": { "width": 0 }, "angle": 110.9906164366688, "color": "rgb(102, 194, 165)", "symbol": "circle", "opacity": 1, "sizesrc": "lviktor:109:677032" }, "hoverinfo": "text", "locationmode": "country names" }, { "line": { "color": "rgb(102, 194, 165)", "width": 0.6276400000000001 }, "mode": "lines+markers", "name": "CZE to Poland: 62764 Tons", "text": "CZE to Poland: 62764 Tons", "type": "scattergeo", "latsrc": "lviktor:109:dd41d4", "lonsrc": "lviktor:109:306b98", "marker": { "line": { "width": 0 }, "angle": 50.85800841183817, "color": "rgb(102, 194, 165)", "symbol": "circle", "opacity": 1, "sizesrc": "lviktor:109:ee079f" }, "hoverinfo": "text", "locationmode": "country names" } ], "layout": { "geo": { "center": { "lat": 48, "lon": 10 }, "lataxis": { "range": [ 35, 60 ] }, "lonaxis": { "range": [ -5, 25 ] }, "showland": true, "landcolor": "rgb(243, 243, 243)", "showocean": true, "oceancolor": "rgb(215, 230, 250)", "projection": { "type": "equirectangular" }, "countrycolor": "rgb(204, 204, 204)", "showcountries": true }, "title": { "text": "Exports Volume of 4407: for European Countries" }, "template": { "data": { "bar": [ { "type": "bar", "marker": { "line": { "color": "#E5ECF6", "width": 0.5 }, "pattern": { "size": 10, "fillmode": "overlay", "solidity": 0.2 } }, "error_x": { "color": "#2a3f5f" }, "error_y": { "color": "#2a3f5f" } } ], "pie": [ { "type": "pie", "automargin": true } ], "table": [ { "type": "table", "cells": { "fill": { "color": "#EBF0F8" }, "line": { "color": "white" } }, "header": { "fill": { "color": "#C8D4E3" }, "line": { "color": "white" } } } ], "carpet": [ { "type": "carpet", "aaxis": { "gridcolor": "white", "linecolor": "white", "endlinecolor": "#2a3f5f", "minorgridcolor": "white", "startlinecolor": "#2a3f5f" }, "baxis": { "gridcolor": "white", "linecolor": "white", "endlinecolor": "#2a3f5f", "minorgridcolor": "white", "startlinecolor": "#2a3f5f" } } ], "mesh3d": [ { "type": "mesh3d", "colorbar": { "ticks": "", "outlinewidth": 0 } } ], "contour": [ { "type": "contour", "colorbar": { "ticks": "", "outlinewidth": 0 }, "colorscale": [ [ 0.0, "#0d0887" ], [ 0.1111111111111111, "#46039f" ], [ 0.2222222222222222, "#7201a8" ], [ 0.3333333333333333, "#9c179e" ], [ 0.4444444444444444, "#bd3786" ], [ 0.5555555555555556, "#d8576b" ], [ 0.6666666666666666, "#ed7953" ], [ 0.7777777777777778, "#fb9f3a" ], [ 0.8888888888888888, "#fdca26" ], [ 1.0, "#f0f921" ] ] } ], "heatmap": [ { "type": "heatmap", "colorbar": { "ticks": "", "outlinewidth": 0 }, "colorscale": [ [ 0.0, "#0d0887" ], [ 0.1111111111111111, "#46039f" ], [ 0.2222222222222222, "#7201a8" ], [ 0.3333333333333333, "#9c179e" ], [ 0.4444444444444444, "#bd3786" ], [ 0.5555555555555556, "#d8576b" ], [ 0.6666666666666666, "#ed7953" ], [ 0.7777777777777778, "#fb9f3a" ], [ 0.8888888888888888, "#fdca26" ], [ 1.0, "#f0f921" ] ] } ], "scatter": [ { "type": "scatter", "fillpattern": { "size": 10, "fillmode": "overlay", "solidity": 0.2 } } ], "surface": [ { "type": "surface", "colorbar": { "ticks": "", "outlinewidth": 0 }, "colorscale": [ [ 0.0, "#0d0887" ], [ 0.1111111111111111, "#46039f" ], [ 0.2222222222222222, "#7201a8" ], [ 0.3333333333333333, "#9c179e" ], [ 0.4444444444444444, "#bd3786" ], [ 0.5555555555555556, "#d8576b" ], [ 0.6666666666666666, "#ed7953" ], [ 0.7777777777777778, "#fb9f3a" ], [ 0.8888888888888888, "#fdca26" ], [ 1.0, "#f0f921" ] ] } ], "barpolar": [ { "type": "barpolar", "marker": { "line": { "color": "#E5ECF6", "width": 0.5 }, "pattern": { "size": 10, "fillmode": "overlay", "solidity": 0.2 } } } ], "heatmapgl": [ { "type": "heatmapgl", "colorbar": { "ticks": "", "outlinewidth": 0 }, "colorscale": [ [ 0.0, "#0d0887" ], [ 0.1111111111111111, "#46039f" ], [ 0.2222222222222222, "#7201a8" ], [ 0.3333333333333333, "#9c179e" ], [ 0.4444444444444444, "#bd3786" ], [ 0.5555555555555556, "#d8576b" ], [ 0.6666666666666666, "#ed7953" ], [ 0.7777777777777778, "#fb9f3a" ], [ 0.8888888888888888, "#fdca26" ], [ 1.0, "#f0f921" ] ] } ], "histogram": [ { "type": "histogram", "marker": { "pattern": { "size": 10, "fillmode": "overlay", "solidity": 0.2 } } } ], "parcoords": [ { "line": { "colorbar": { "ticks": "", "outlinewidth": 0 } }, "type": "parcoords" } ], "scatter3d": [ { "line": { "colorbar": { "ticks": "", "outlinewidth": 0 } }, "type": "scatter3d", "marker": { "colorbar": { "ticks": "", "outlinewidth": 0 } } } ], "scattergl": [ { "type": "scattergl", "marker": { "colorbar": { "ticks": "", "outlinewidth": 0 } } } ], "choropleth": [ { "type": "choropleth", "colorbar": { "ticks": "", "outlinewidth": 0 } } ], "scattergeo": [ { "type": "scattergeo", "marker": { "colorbar": { "ticks": "", "outlinewidth": 0 } } } ], "histogram2d": [ { "type": "histogram2d", "colorbar": { "ticks": "", "outlinewidth": 0 }, "colorscale": [ [ 0.0, "#0d0887" ], [ 0.1111111111111111, "#46039f" ], [ 0.2222222222222222, "#7201a8" ], [ 0.3333333333333333, "#9c179e" ], [ 0.4444444444444444, "#bd3786" ], [ 0.5555555555555556, "#d8576b" ], [ 0.6666666666666666, "#ed7953" ], [ 0.7777777777777778, "#fb9f3a" ], [ 0.8888888888888888, "#fdca26" ], [ 1.0, "#f0f921" ] ] } ], "scatterpolar": [ { "type": "scatterpolar", "marker": { "colorbar": { "ticks": "", "outlinewidth": 0 } } } ], "contourcarpet": [ { "type": "contourcarpet", "colorbar": { "ticks": "", "outlinewidth": 0 } } ], "scattercarpet": [ { "type": "scattercarpet", "marker": { "colorbar": { "ticks": "", "outlinewidth": 0 } } } ], "scattermapbox": [ { "type": "scattermapbox", "marker": { "colorbar": { "ticks": "", "outlinewidth": 0 } } } ], "scatterpolargl": [ { "type": "scatterpolargl", "marker": { "colorbar": { "ticks": "", "outlinewidth": 0 } } } ], "scatterternary": [ { "type": "scatterternary", "marker": { "colorbar": { "ticks": "", "outlinewidth": 0 } } } ], "histogram2dcontour": [ { "type": "histogram2dcontour", "colorbar": { "ticks": "", "outlinewidth": 0 }, "colorscale": [ [ 0.0, "#0d0887" ], [ 0.1111111111111111, "#46039f" ], [ 0.2222222222222222, "#7201a8" ], [ 0.3333333333333333, "#9c179e" ], [ 0.4444444444444444, "#bd3786" ], [ 0.5555555555555556, "#d8576b" ], [ 0.6666666666666666, "#ed7953" ], [ 0.7777777777777778, "#fb9f3a" ], [ 0.8888888888888888, "#fdca26" ], [ 1.0, "#f0f921" ] ] } ] }, "layout": { "geo": { "bgcolor": "white", "showland": true, "lakecolor": "white", "landcolor": "#E5ECF6", "showlakes": true, "subunitcolor": "white" }, "font": { "color": "#2a3f5f" }, "polar": { "bgcolor": "#E5ECF6", "radialaxis": { "ticks": "", "gridcolor": "white", "linecolor": "white" }, "angularaxis": { "ticks": "", "gridcolor": "white", "linecolor": "white" } }, "scene": { "xaxis": { "ticks": "", "gridcolor": "white", "gridwidth": 2, "linecolor": "white", "zerolinecolor": "white", "showbackground": true, "backgroundcolor": "#E5ECF6" }, "yaxis": { "ticks": "", "gridcolor": "white", "gridwidth": 2, "linecolor": "white", "zerolinecolor": "white", "showbackground": true, "backgroundcolor": "#E5ECF6" }, "zaxis": { "ticks": "", "gridcolor": "white", "gridwidth": 2, "linecolor": "white", "zerolinecolor": "white", "showbackground": true, "backgroundcolor": "#E5ECF6" } }, "title": { "x": 0.05 }, "xaxis": { "ticks": "", "title": { "standoff": 15 }, "gridcolor": "white", "linecolor": "white", "automargin": true, "zerolinecolor": "white", "zerolinewidth": 2 }, "yaxis": { "ticks": "", "title": { "standoff": 15 }, "gridcolor": "white", "linecolor": "white", "automargin": true, "zerolinecolor": "white", "zerolinewidth": 2 }, "mapbox": { "style": "light" }, "ternary": { "aaxis": { "ticks": "", "gridcolor": "white", "linecolor": "white" }, "baxis": { "ticks": "", "gridcolor": "white", "linecolor": "white" }, "caxis": { "ticks": "", "gridcolor": "white", "linecolor": "white" }, "bgcolor": "#E5ECF6" }, "colorway": [ "#636efa", "#EF553B", "#00cc96", "#ab63fa", "#FFA15A", "#19d3f3", "#FF6692", "#B6E880", "#FF97FF", "#FECB52" ], "coloraxis": { "colorbar": { "ticks": "", "outlinewidth": 0 } }, "hovermode": "closest", "colorscale": { "diverging": [ [ 0, "#8e0152" ], [ 0.1, "#c51b7d" ], [ 0.2, "#de77ae" ], [ 0.3, "#f1b6da" ], [ 0.4, "#fde0ef" ], [ 0.5, "#f7f7f7" ], [ 0.6, "#e6f5d0" ], [ 0.7, "#b8e186" ], [ 0.8, "#7fbc41" ], [ 0.9, "#4d9221" ], [ 1, "#276419" ] ], "sequential": [ [ 0.0, "#0d0887" ], [ 0.1111111111111111, "#46039f" ], [ 0.2222222222222222, "#7201a8" ], [ 0.3333333333333333, "#9c179e" ], [ 0.4444444444444444, "#bd3786" ], [ 0.5555555555555556, "#d8576b" ], [ 0.6666666666666666, "#ed7953" ], [ 0.7777777777777778, "#fb9f3a" ], [ 0.8888888888888888, "#fdca26" ], [ 1.0, "#f0f921" ] ], "sequentialminus": [ [ 0.0, "#0d0887" ], [ 0.1111111111111111, "#46039f" ], [ 0.2222222222222222, "#7201a8" ], [ 0.3333333333333333, "#9c179e" ], [ 0.4444444444444444, "#bd3786" ], [ 0.5555555555555556, "#d8576b" ], [ 0.6666666666666666, "#ed7953" ], [ 0.7777777777777778, "#fb9f3a" ], [ 0.8888888888888888, "#fdca26" ], [ 1.0, "#f0f921" ] ] }, "hoverlabel": { "align": "left" }, "plot_bgcolor": "#E5ECF6", "paper_bgcolor": "white", "shapedefaults": { "line": { "color": "#2a3f5f" } }, "autotypenumbers": "strict", "annotationdefaults": { "arrowhead": 0, "arrowcolor": "#2a3f5f", "arrowwidth": 1 } } } } }, "height": null, "width": null, "user": { "profile_url": "https://chart-studio.plotly.com/~lviktor", "avatar_url": "https://storage.googleapis.com/plotly-prod-profiles/21.jpg", "background_url": "https://storage.googleapis.com/plotly-prod-profiles/bg-3.jpg", "bio": "", "nickname": "", "website": "", "stream_tokens": null, "feature_set_id": null, "csrf_token": null, "date_joined": "2024-03-28 14:45:39", "mapbox_access_tokens": null, "has_password": null, "username": "lviktor", "email": null, "is_active": null, "readonly": null, "is_dash_creator": null, "dash_created_count": null, "is_chart_creator": null, "charts_created_count": null } }, { "creation_time": "2024-04-03T10:25:00.064378Z", "comments": { "results": [], "count": 0 }, "parented": true, "embed_url": "https://chart-studio.plotly.com/~irysikpusik/1.embed", "fid": "irysikpusik:1", "filename": "Plot 1", "filetype": "plot", "img_url": "https://storage.googleapis.com/plotly-prod-images/irysikpusik/1/9_78VI6WNKUWHAX5GJW7LM1PIWOMN3E7.png", "image_urls": { "default": "https://storage.googleapis.com/plotly-prod-images/irysikpusik/1/2_J63YFQ5AD5ZSLNN1CB5CUTEDPVNLGS.png", "block-thumb": "https://storage.googleapis.com/plotly-prod-images/irysikpusik/1/8_3N6HRZT54FKOV5PXH0XQZ6HJ9FNEXP.png", "list-thumb": "https://storage.googleapis.com/plotly-prod-images/irysikpusik/1/9_78VI6WNKUWHAX5GJW7LM1PIWOMN3E7.png" }, "api_urls": { "files": "https://api.plotly.com/v2/files/irysikpusik:1", "plots": "https://api.plotly.com/v2/plots/irysikpusik:1", "parent": "https://api.plotly.com/v2/folders/home?user=irysikpusik" }, "owner": "irysikpusik", "parent": -1, "preview": "", "referencers": [], "references": [], "title": "", "views": 1, "web_url": "https://chart-studio.plotly.com/~irysikpusik/1/", "world_readable": true, "date_modified": "2024-04-03T10:25:00.079Z", "stars": { "results": [], "count": 0 }, "collaborators": { "results": [], "count": 0 }, "subfolder_count": null, "refresh_interval": null, "organize_view_url": "https://chart-studio.plotly.com/~irysikpusik/1/", "current_user_permission": "read", "is_theme": null, "is_template": false, "autosize": true, "caption": "", "figure": { "data": [ { "line": { "shape": "spline" }, "meta": { "columnNames": { "y": "B" } }, "mode": "lines", "name": "PG 13.13", "type": "scatter", "ysrc": "irysikpusik:0:f8e9ae" }, { "line": { "shape": "spline" }, "meta": { "columnNames": { "x": "A", "y": "C" } }, "mode": "markers", "name": "PG 16.1", "type": "scatter", "xsrc": "irysikpusik:0:033825", "ysrc": "irysikpusik:0:5c765c", "orientation": "v" } ], "frames": [], "layout": { "xaxis": { "type": "category", "range": [ -0.970762773194384, 34.97076277319439 ], "title": { "text": "" }, "autorange": true }, "yaxis": { "type": "linear", "range": [ -131.90989096573213, 1886.0098909657322 ], "title": { "text": "ms" }, "autorange": true }, "autosize": true, "template": { "data": { "bar": [ { "type": "bar", "marker": { "colorbar": { "ticks": "", "outlinewidth": 0 } } } ], "table": [ { "type": "table", "cells": { "fill": { "color": "#EBF0F8" }, "line": { "color": "white" } }, "header": { "fill": { "color": "#C8D4E3" }, "line": { "color": "white" } } } ], "carpet": [ { "type": "carpet", "aaxis": { "gridcolor": "#C8D4E3", "linecolor": "#C8D4E3", "endlinecolor": "#2a3f5f", "minorgridcolor": "#C8D4E3", "startlinecolor": "#2a3f5f" }, "baxis": { "gridcolor": "#C8D4E3", "linecolor": "#C8D4E3", "endlinecolor": "#2a3f5f", "minorgridcolor": "#C8D4E3", "startlinecolor": "#2a3f5f" } } ], "mesh3d": [ { "type": "mesh3d", "colorbar": { "ticks": "", "outlinewidth": 0 } } ], "contour": [ { "type": "contour", "colorbar": { "ticks": "", "outlinewidth": 0 }, "autocolorscale": true } ], "heatmap": [ { "type": "heatmap", "colorbar": { "ticks": "", "outlinewidth": 0 }, "autocolorscale": true } ], "scatter": [ { "type": "scatter", "marker": { "colorbar": { "ticks": "", "outlinewidth": 0 } } } ], "surface": [ { "type": "surface", "colorbar": { "ticks": "", "outlinewidth": 0 } } ], "heatmapgl": [ { "type": "heatmapgl", "colorbar": { "ticks": "", "outlinewidth": 0 } } ], "histogram": [ { "type": "histogram", "marker": { "colorbar": { "ticks": "", "outlinewidth": 0 } } } ], "parcoords": [ { "line": { "colorbar": { "ticks": "", "outlinewidth": 0 } }, "type": "parcoords" } ], "scatter3d": [ { "type": "scatter3d", "marker": { "colorbar": { "ticks": "", "outlinewidth": 0 } } } ], "scattergl": [ { "type": "scattergl", "marker": { "colorbar": { "ticks": "", "outlinewidth": 0 } } } ], "choropleth": [ { "type": "choropleth", "colorbar": { "ticks": "", "outlinewidth": 0 } } ], "scattergeo": [ { "type": "scattergeo", "marker": { "colorbar": { "ticks": "", "outlinewidth": 0 } } } ], "histogram2d": [ { "type": "histogram2d", "colorbar": { "ticks": "", "outlinewidth": 0 }, "autocolorscale": true } ], "scatterpolar": [ { "type": "scatterpolar", "marker": { "colorbar": { "ticks": "", "outlinewidth": 0 } } } ], "contourcarpet": [ { "type": "contourcarpet", "colorbar": { "ticks": "", "outlinewidth": 0 } } ], "scattercarpet": [ { "type": "scattercarpet", "marker": { "colorbar": { "ticks": "", "outlinewidth": 0 } } } ], "scattermapbox": [ { "type": "scattermapbox", "marker": { "colorbar": { "ticks": "", "outlinewidth": 0 } } } ], "scatterpolargl": [ { "type": "scatterpolargl", "marker": { "colorbar": { "ticks": "", "outlinewidth": 0 } } } ], "scatterternary": [ { "type": "scatterternary", "marker": { "colorbar": { "ticks": "", "outlinewidth": 0 } } } ], "histogram2dcontour": [ { "type": "histogram2dcontour", "colorbar": { "ticks": "", "outlinewidth": 0 }, "autocolorscale": true } ] }, "layout": { "geo": { "bgcolor": "white", "showland": true, "lakecolor": "white", "landcolor": "white", "showlakes": true, "subunitcolor": "#C8D4E3" }, "font": { "color": "#2a3f5f" }, "polar": { "bgcolor": "white", "radialaxis": { "ticks": "", "gridcolor": "#EBF0F8", "linecolor": "#EBF0F8" }, "angularaxis": { "ticks": "", "gridcolor": "#EBF0F8", "linecolor": "#EBF0F8" } }, "scene": { "xaxis": { "ticks": "", "gridcolor": "#DFE8F3", "gridwidth": 2, "linecolor": "#EBF0F8", "zerolinecolor": "#EBF0F8", "showbackground": true, "backgroundcolor": "white" }, "yaxis": { "ticks": "", "gridcolor": "#DFE8F3", "gridwidth": 2, "linecolor": "#EBF0F8", "zerolinecolor": "#EBF0F8", "showbackground": true, "backgroundcolor": "white" }, "zaxis": { "ticks": "", "gridcolor": "#DFE8F3", "gridwidth": 2, "linecolor": "#EBF0F8", "zerolinecolor": "#EBF0F8", "showbackground": true, "backgroundcolor": "white" } }, "title": { "x": 0.05 }, "xaxis": { "ticks": "", "gridcolor": "#EBF0F8", "linecolor": "#EBF0F8", "automargin": true, "zerolinecolor": "#EBF0F8", "zerolinewidth": 2 }, "yaxis": { "ticks": "", "gridcolor": "#EBF0F8", "linecolor": "#EBF0F8", "automargin": true, "zerolinecolor": "#EBF0F8", "zerolinewidth": 2 }, "ternary": { "aaxis": { "ticks": "", "gridcolor": "#DFE8F3", "linecolor": "#A2B1C6" }, "baxis": { "ticks": "", "gridcolor": "#DFE8F3", "linecolor": "#A2B1C6" }, "caxis": { "ticks": "", "gridcolor": "#DFE8F3", "linecolor": "#A2B1C6" }, "bgcolor": "white" }, "colorway": [ "#636efa", "#EF553B", "#00cc96", "#ab63fa", "#19d3f3", "#e763fa", "#fecb52", "#ffa15a", "#ff6692", "#b6e880" ], "hovermode": "closest", "colorscale": { "diverging": [ [ 0, "#8e0152" ], [ 0.1, "#c51b7d" ], [ 0.2, "#de77ae" ], [ 0.3, "#f1b6da" ], [ 0.4, "#fde0ef" ], [ 0.5, "#f7f7f7" ], [ 0.6, "#e6f5d0" ], [ 0.7, "#b8e186" ], [ 0.8, "#7fbc41" ], [ 0.9, "#4d9221" ], [ 1, "#276419" ] ], "sequential": [ [ 0, "#0508b8" ], [ 0.0893854748603352, "#1910d8" ], [ 0.1787709497206704, "#3c19f0" ], [ 0.2681564245810056, "#6b1cfb" ], [ 0.3575418994413408, "#981cfd" ], [ 0.44692737430167595, "#bf1cfd" ], [ 0.5363128491620112, "#dd2bfd" ], [ 0.6256983240223464, "#f246fe" ], [ 0.7150837988826816, "#fc67fd" ], [ 0.8044692737430168, "#fe88fc" ], [ 0.8938547486033519, "#fea5fd" ], [ 0.9832402234636871, "#febefe" ], [ 1, "#fec3fe" ] ], "sequentialminus": [ [ 0, "#0508b8" ], [ 0.0893854748603352, "#1910d8" ], [ 0.1787709497206704, "#3c19f0" ], [ 0.2681564245810056, "#6b1cfb" ], [ 0.3575418994413408, "#981cfd" ], [ 0.44692737430167595, "#bf1cfd" ], [ 0.5363128491620112, "#dd2bfd" ], [ 0.6256983240223464, "#f246fe" ], [ 0.7150837988826816, "#fc67fd" ], [ 0.8044692737430168, "#fe88fc" ], [ 0.8938547486033519, "#fea5fd" ], [ 0.9832402234636871, "#febefe" ], [ 1, "#fec3fe" ] ] }, "plot_bgcolor": "white", "paper_bgcolor": "white", "shapedefaults": { "line": { "width": 0 }, "opacity": 0.4, "fillcolor": "#506784" }, "annotationdefaults": { "arrowhead": 0, "arrowcolor": "#506784", "arrowwidth": 1 } }, "themeRef": "PLOTLY_WHITE" }, "hovermode": "x" } }, "height": null, "width": null, "user": { "profile_url": "https://chart-studio.plotly.com/~irysikpusik", "avatar_url": "https://storage.googleapis.com/plotly-prod-profiles/34.jpg", "background_url": "https://storage.googleapis.com/plotly-prod-profiles/bg-5.jpg", "bio": "", "nickname": "", "website": "", "stream_tokens": null, "feature_set_id": null, "csrf_token": null, "date_joined": "2024-04-03 10:24:33", "mapbox_access_tokens": null, "has_password": null, "username": "irysikpusik", "email": null, "is_active": null, "readonly": null, "is_dash_creator": null, "dash_created_count": null, "is_chart_creator": null, "charts_created_count": null } }, { "creation_time": "2024-04-03T10:09:39.840123Z", "comments": { "results": [], "count": 0 }, "parented": true, "embed_url": "https://chart-studio.plotly.com/~M00He/12.embed", "fid": "M00He:12", "filename": "Plot 12", "filetype": "plot", "img_url": "https://storage.googleapis.com/plotly-prod-images/M00He/12/9_DGCK7VB7K873U1O5O2WR85LTQQVEGD.png", "image_urls": { "default": "https://storage.googleapis.com/plotly-prod-images/M00He/12/2_40K6Q2DWJCSMMLJWL0CTDM3BWSRI2H.png", "block-thumb": "https://storage.googleapis.com/plotly-prod-images/M00He/12/8_YF3M8SYK7X9JG8303VZ0OGG1D0J96B.png", "list-thumb": "https://storage.googleapis.com/plotly-prod-images/M00He/12/9_DGCK7VB7K873U1O5O2WR85LTQQVEGD.png" }, "api_urls": { "files": "https://api.plotly.com/v2/files/M00He:12", "plots": "https://api.plotly.com/v2/plots/M00He:12", "parent": "https://api.plotly.com/v2/folders/home?user=M00He" }, "owner": "M00He", "parent": -1, "preview": "", "referencers": [], "references": [], "title": "", "views": 2, "web_url": "https://chart-studio.plotly.com/~M00He/12/", "world_readable": true, "date_modified": "2024-04-03T10:09:39.854Z", "stars": { "results": [], "count": 0 }, "collaborators": { "results": [], "count": 0 }, "subfolder_count": null, "refresh_interval": null, "organize_view_url": "https://chart-studio.plotly.com/~M00He/12/", "current_user_permission": "read", "is_theme": null, "is_template": false, "autosize": true, "caption": "", "figure": { "data": [ { "meta": { "columnNames": { "x": "C", "y": "A" } }, "mode": "markers", "type": "funnel", "xsrc": "M00He:11:ed6de0", "ysrc": "M00He:11:1d0f34" } ], "frames": [], "layout": { "xaxis": { "type": "linear", "range": [ -3359.4444444444443, 3359.4444444444443 ], "autorange": true }, "yaxis": { "type": "category", "range": [ 4.5, -0.5 ], "title": { "text": "Höchster Leadfunnel Status" }, "autorange": true }, "autosize": true, "template": { "data": { "bar": [ { "type": "bar", "marker": { "colorbar": { "ticks": "", "outlinewidth": 0 } } } ], "table": [ { "type": "table", "cells": { "fill": { "color": "#EBF0F8" }, "line": { "color": "white" } }, "header": { "fill": { "color": "#C8D4E3" }, "line": { "color": "white" } } } ], "carpet": [ { "type": "carpet", "aaxis": { "gridcolor": "#C8D4E3", "linecolor": "#C8D4E3", "endlinecolor": "#2a3f5f", "minorgridcolor": "#C8D4E3", "startlinecolor": "#2a3f5f" }, "baxis": { "gridcolor": "#C8D4E3", "linecolor": "#C8D4E3", "endlinecolor": "#2a3f5f", "minorgridcolor": "#C8D4E3", "startlinecolor": "#2a3f5f" } } ], "mesh3d": [ { "type": "mesh3d", "colorbar": { "ticks": "", "outlinewidth": 0 } } ], "contour": [ { "type": "contour", "colorbar": { "ticks": "", "outlinewidth": 0 }, "autocolorscale": true } ], "heatmap": [ { "type": "heatmap", "colorbar": { "ticks": "", "outlinewidth": 0 }, "autocolorscale": true } ], "scatter": [ { "type": "scatter", "marker": { "colorbar": { "ticks": "", "outlinewidth": 0 } } } ], "surface": [ { "type": "surface", "colorbar": { "ticks": "", "outlinewidth": 0 } } ], "heatmapgl": [ { "type": "heatmapgl", "colorbar": { "ticks": "", "outlinewidth": 0 } } ], "histogram": [ { "type": "histogram", "marker": { "colorbar": { "ticks": "", "outlinewidth": 0 } } } ], "parcoords": [ { "line": { "colorbar": { "ticks": "", "outlinewidth": 0 } }, "type": "parcoords" } ], "scatter3d": [ { "type": "scatter3d", "marker": { "colorbar": { "ticks": "", "outlinewidth": 0 } } } ], "scattergl": [ { "type": "scattergl", "marker": { "colorbar": { "ticks": "", "outlinewidth": 0 } } } ], "choropleth": [ { "type": "choropleth", "colorbar": { "ticks": "", "outlinewidth": 0 } } ], "scattergeo": [ { "type": "scattergeo", "marker": { "colorbar": { "ticks": "", "outlinewidth": 0 } } } ], "histogram2d": [ { "type": "histogram2d", "colorbar": { "ticks": "", "outlinewidth": 0 }, "autocolorscale": true } ], "scatterpolar": [ { "type": "scatterpolar", "marker": { "colorbar": { "ticks": "", "outlinewidth": 0 } } } ], "contourcarpet": [ { "type": "contourcarpet", "colorbar": { "ticks": "", "outlinewidth": 0 } } ], "scattercarpet": [ { "type": "scattercarpet", "marker": { "colorbar": { "ticks": "", "outlinewidth": 0 } } } ], "scattermapbox": [ { "type": "scattermapbox", "marker": { "colorbar": { "ticks": "", "outlinewidth": 0 } } } ], "scatterpolargl": [ { "type": "scatterpolargl", "marker": { "colorbar": { "ticks": "", "outlinewidth": 0 } } } ], "scatterternary": [ { "type": "scatterternary", "marker": { "colorbar": { "ticks": "", "outlinewidth": 0 } } } ], "histogram2dcontour": [ { "type": "histogram2dcontour", "colorbar": { "ticks": "", "outlinewidth": 0 }, "autocolorscale": true } ] }, "layout": { "geo": { "bgcolor": "white", "showland": true, "lakecolor": "white", "landcolor": "white", "showlakes": true, "subunitcolor": "#C8D4E3" }, "font": { "color": "#2a3f5f" }, "polar": { "bgcolor": "white", "radialaxis": { "ticks": "", "gridcolor": "#EBF0F8", "linecolor": "#EBF0F8" }, "angularaxis": { "ticks": "", "gridcolor": "#EBF0F8", "linecolor": "#EBF0F8" } }, "scene": { "xaxis": { "ticks": "", "gridcolor": "#DFE8F3", "gridwidth": 2, "linecolor": "#EBF0F8", "zerolinecolor": "#EBF0F8", "showbackground": true, "backgroundcolor": "white" }, "yaxis": { "ticks": "", "gridcolor": "#DFE8F3", "gridwidth": 2, "linecolor": "#EBF0F8", "zerolinecolor": "#EBF0F8", "showbackground": true, "backgroundcolor": "white" }, "zaxis": { "ticks": "", "gridcolor": "#DFE8F3", "gridwidth": 2, "linecolor": "#EBF0F8", "zerolinecolor": "#EBF0F8", "showbackground": true, "backgroundcolor": "white" } }, "title": { "x": 0.05 }, "xaxis": { "ticks": "", "gridcolor": "#EBF0F8", "linecolor": "#EBF0F8", "automargin": true, "zerolinecolor": "#EBF0F8", "zerolinewidth": 2 }, "yaxis": { "ticks": "", "gridcolor": "#EBF0F8", "linecolor": "#EBF0F8", "automargin": true, "zerolinecolor": "#EBF0F8", "zerolinewidth": 2 }, "ternary": { "aaxis": { "ticks": "", "gridcolor": "#DFE8F3", "linecolor": "#A2B1C6" }, "baxis": { "ticks": "", "gridcolor": "#DFE8F3", "linecolor": "#A2B1C6" }, "caxis": { "ticks": "", "gridcolor": "#DFE8F3", "linecolor": "#A2B1C6" }, "bgcolor": "white" }, "colorway": [ "#636efa", "#EF553B", "#00cc96", "#ab63fa", "#19d3f3", "#e763fa", "#fecb52", "#ffa15a", "#ff6692", "#b6e880" ], "hovermode": "closest", "colorscale": { "diverging": [ [ 0, "#8e0152" ], [ 0.1, "#c51b7d" ], [ 0.2, "#de77ae" ], [ 0.3, "#f1b6da" ], [ 0.4, "#fde0ef" ], [ 0.5, "#f7f7f7" ], [ 0.6, "#e6f5d0" ], [ 0.7, "#b8e186" ], [ 0.8, "#7fbc41" ], [ 0.9, "#4d9221" ], [ 1, "#276419" ] ], "sequential": [ [ 0, "#0508b8" ], [ 0.0893854748603352, "#1910d8" ], [ 0.1787709497206704, "#3c19f0" ], [ 0.2681564245810056, "#6b1cfb" ], [ 0.3575418994413408, "#981cfd" ], [ 0.44692737430167595, "#bf1cfd" ], [ 0.5363128491620112, "#dd2bfd" ], [ 0.6256983240223464, "#f246fe" ], [ 0.7150837988826816, "#fc67fd" ], [ 0.8044692737430168, "#fe88fc" ], [ 0.8938547486033519, "#fea5fd" ], [ 0.9832402234636871, "#febefe" ], [ 1, "#fec3fe" ] ], "sequentialminus": [ [ 0, "#0508b8" ], [ 0.0893854748603352, "#1910d8" ], [ 0.1787709497206704, "#3c19f0" ], [ 0.2681564245810056, "#6b1cfb" ], [ 0.3575418994413408, "#981cfd" ], [ 0.44692737430167595, "#bf1cfd" ], [ 0.5363128491620112, "#dd2bfd" ], [ 0.6256983240223464, "#f246fe" ], [ 0.7150837988826816, "#fc67fd" ], [ 0.8044692737430168, "#fe88fc" ], [ 0.8938547486033519, "#fea5fd" ], [ 0.9832402234636871, "#febefe" ], [ 1, "#fec3fe" ] ] }, "plot_bgcolor": "white", "paper_bgcolor": "white", "shapedefaults": { "line": { "width": 0 }, "opacity": 0.4, "fillcolor": "#506784" }, "annotationdefaults": { "arrowhead": 0, "arrowcolor": "#506784", "arrowwidth": 1 } }, "themeRef": "PLOTLY_WHITE" } } }, "height": null, "width": null, "user": { "profile_url": "https://chart-studio.plotly.com/~M00He", "avatar_url": "https://storage.googleapis.com/plotly-prod-profiles/91.jpg", "background_url": "https://storage.googleapis.com/plotly-prod-profiles/bg-8.jpg", "bio": "", "nickname": "", "website": "", "stream_tokens": null, "feature_set_id": null, "csrf_token": null, "date_joined": "2024-03-01 14:15:56", "mapbox_access_tokens": null, "has_password": null, "username": "M00He", "email": null, "is_active": null, "readonly": null, "is_dash_creator": null, "dash_created_count": null, "is_chart_creator": null, "charts_created_count": null } }, { "creation_time": "2024-04-03T10:04:15.543353Z", "comments": { "results": [], "count": 0 }, "parented": true, "embed_url": "https://chart-studio.plotly.com/~OlgaFedorenko/13.embed", "fid": "OlgaFedorenko:13", "filename": "Plot 13", "filetype": "plot", "img_url": "https://storage.googleapis.com/plotly-prod-images/OlgaFedorenko/13/9_QVSERDPEOVH5Z4QE6S696W2M9LEWO7.png", "image_urls": { "default": "https://storage.googleapis.com/plotly-prod-images/OlgaFedorenko/13/2_BSWAL8M0YZ61RCCFZ0SBGJQSTIB148.png", "block-thumb": "https://storage.googleapis.com/plotly-prod-images/OlgaFedorenko/13/8_COE4HY4PFP4O2M5K9J96UAZRUARSU0.png", "list-thumb": "https://storage.googleapis.com/plotly-prod-images/OlgaFedorenko/13/9_QVSERDPEOVH5Z4QE6S696W2M9LEWO7.png" }, "api_urls": { "files": "https://api.plotly.com/v2/files/OlgaFedorenko:13", "plots": "https://api.plotly.com/v2/plots/OlgaFedorenko:13", "parent": "https://api.plotly.com/v2/folders/home?user=OlgaFedorenko" }, "owner": "OlgaFedorenko", "parent": -1, "preview": "", "referencers": [], "references": [], "title": "", "views": 1, "web_url": "https://chart-studio.plotly.com/~OlgaFedorenko/13/", "world_readable": true, "date_modified": "2024-04-03T10:04:29.368Z", "stars": { "results": [], "count": 0 }, "collaborators": { "results": [], "count": 0 }, "subfolder_count": null, "refresh_interval": null, "organize_view_url": "https://chart-studio.plotly.com/~OlgaFedorenko/13/", "current_user_permission": "read", "is_theme": null, "is_template": false, "autosize": true, "caption": "", "figure": { "data": [ { "line": { "color": "rgb(33, 12, 174)" }, "meta": { "columnNames": { "x": "", "y": "B" } }, "mode": "markers", "name": "Male (n=140)", "type": "box", "ysrc": "OlgaFedorenko:12:485462", "boxpoints": "outliers", "fillcolor": "rgb(17, 124, 209)" }, { "line": { "color": "rgb(77, 201, 230)" }, "meta": { "columnNames": { "y": "A" } }, "name": "Female (n=482)", "type": "box", "ysrc": "OlgaFedorenko:12:e2e608", "boxpoints": "outliers" } ], "frames": [], "layout": { "xaxis": { "type": "category", "range": [ -0.5, 1.5 ], "autorange": true }, "yaxis": { "type": "linear", "range": [ -4.216286149162869, 100.53333333333333 ], "autorange": false }, "autosize": true, "template": { "data": { "bar": [ { "type": "bar", "marker": { "colorbar": { "ticks": "", "outlinewidth": 0 } } } ], "table": [ { "type": "table", "cells": { "fill": { "color": "#EBF0F8" }, "line": { "color": "white" } }, "header": { "fill": { "color": "#C8D4E3" }, "line": { "color": "white" } } } ], "carpet": [ { "type": "carpet", "aaxis": { "gridcolor": "#C8D4E3", "linecolor": "#C8D4E3", "endlinecolor": "#2a3f5f", "minorgridcolor": "#C8D4E3", "startlinecolor": "#2a3f5f" }, "baxis": { "gridcolor": "#C8D4E3", "linecolor": "#C8D4E3", "endlinecolor": "#2a3f5f", "minorgridcolor": "#C8D4E3", "startlinecolor": "#2a3f5f" } } ], "mesh3d": [ { "type": "mesh3d", "colorbar": { "ticks": "", "outlinewidth": 0 } } ], "contour": [ { "type": "contour", "colorbar": { "ticks": "", "outlinewidth": 0 }, "autocolorscale": true } ], "heatmap": [ { "type": "heatmap", "colorbar": { "ticks": "", "outlinewidth": 0 }, "autocolorscale": true } ], "scatter": [ { "type": "scatter", "marker": { "colorbar": { "ticks": "", "outlinewidth": 0 } } } ], "surface": [ { "type": "surface", "colorbar": { "ticks": "", "outlinewidth": 0 } } ], "heatmapgl": [ { "type": "heatmapgl", "colorbar": { "ticks": "", "outlinewidth": 0 } } ], "histogram": [ { "type": "histogram", "marker": { "colorbar": { "ticks": "", "outlinewidth": 0 } } } ], "parcoords": [ { "line": { "colorbar": { "ticks": "", "outlinewidth": 0 } }, "type": "parcoords" } ], "scatter3d": [ { "type": "scatter3d", "marker": { "colorbar": { "ticks": "", "outlinewidth": 0 } } } ], "scattergl": [ { "type": "scattergl", "marker": { "colorbar": { "ticks": "", "outlinewidth": 0 } } } ], "choropleth": [ { "type": "choropleth", "colorbar": { "ticks": "", "outlinewidth": 0 } } ], "scattergeo": [ { "type": "scattergeo", "marker": { "colorbar": { "ticks": "", "outlinewidth": 0 } } } ], "histogram2d": [ { "type": "histogram2d", "colorbar": { "ticks": "", "outlinewidth": 0 }, "autocolorscale": true } ], "scatterpolar": [ { "type": "scatterpolar", "marker": { "colorbar": { "ticks": "", "outlinewidth": 0 } } } ], "contourcarpet": [ { "type": "contourcarpet", "colorbar": { "ticks": "", "outlinewidth": 0 } } ], "scattercarpet": [ { "type": "scattercarpet", "marker": { "colorbar": { "ticks": "", "outlinewidth": 0 } } } ], "scattermapbox": [ { "type": "scattermapbox", "marker": { "colorbar": { "ticks": "", "outlinewidth": 0 } } } ], "scatterpolargl": [ { "type": "scatterpolargl", "marker": { "colorbar": { "ticks": "", "outlinewidth": 0 } } } ], "scatterternary": [ { "type": "scatterternary", "marker": { "colorbar": { "ticks": "", "outlinewidth": 0 } } } ], "histogram2dcontour": [ { "type": "histogram2dcontour", "colorbar": { "ticks": "", "outlinewidth": 0 }, "autocolorscale": true } ] }, "layout": { "geo": { "bgcolor": "white", "showland": true, "lakecolor": "white", "landcolor": "white", "showlakes": true, "subunitcolor": "#C8D4E3" }, "font": { "color": "#2a3f5f" }, "polar": { "bgcolor": "white", "radialaxis": { "ticks": "", "gridcolor": "#EBF0F8", "linecolor": "#EBF0F8" }, "angularaxis": { "ticks": "", "gridcolor": "#EBF0F8", "linecolor": "#EBF0F8" } }, "scene": { "xaxis": { "ticks": "", "gridcolor": "#DFE8F3", "gridwidth": 2, "linecolor": "#EBF0F8", "zerolinecolor": "#EBF0F8", "showbackground": true, "backgroundcolor": "white" }, "yaxis": { "ticks": "", "gridcolor": "#DFE8F3", "gridwidth": 2, "linecolor": "#EBF0F8", "zerolinecolor": "#EBF0F8", "showbackground": true, "backgroundcolor": "white" }, "zaxis": { "ticks": "", "gridcolor": "#DFE8F3", "gridwidth": 2, "linecolor": "#EBF0F8", "zerolinecolor": "#EBF0F8", "showbackground": true, "backgroundcolor": "white" } }, "title": { "x": 0.05 }, "xaxis": { "ticks": "", "gridcolor": "#EBF0F8", "linecolor": "#EBF0F8", "automargin": true, "zerolinecolor": "#EBF0F8", "zerolinewidth": 2 }, "yaxis": { "ticks": "", "gridcolor": "#EBF0F8", "linecolor": "#EBF0F8", "automargin": true, "zerolinecolor": "#EBF0F8", "zerolinewidth": 2 }, "ternary": { "aaxis": { "ticks": "", "gridcolor": "#DFE8F3", "linecolor": "#A2B1C6" }, "baxis": { "ticks": "", "gridcolor": "#DFE8F3", "linecolor": "#A2B1C6" }, "caxis": { "ticks": "", "gridcolor": "#DFE8F3", "linecolor": "#A2B1C6" }, "bgcolor": "white" }, "colorway": [ "#636efa", "#EF553B", "#00cc96", "#ab63fa", "#19d3f3", "#e763fa", "#fecb52", "#ffa15a", "#ff6692", "#b6e880" ], "hovermode": "closest", "colorscale": { "diverging": [ [ 0, "#8e0152" ], [ 0.1, "#c51b7d" ], [ 0.2, "#de77ae" ], [ 0.3, "#f1b6da" ], [ 0.4, "#fde0ef" ], [ 0.5, "#f7f7f7" ], [ 0.6, "#e6f5d0" ], [ 0.7, "#b8e186" ], [ 0.8, "#7fbc41" ], [ 0.9, "#4d9221" ], [ 1, "#276419" ] ], "sequential": [ [ 0, "#0508b8" ], [ 0.0893854748603352, "#1910d8" ], [ 0.1787709497206704, "#3c19f0" ], [ 0.2681564245810056, "#6b1cfb" ], [ 0.3575418994413408, "#981cfd" ], [ 0.44692737430167595, "#bf1cfd" ], [ 0.5363128491620112, "#dd2bfd" ], [ 0.6256983240223464, "#f246fe" ], [ 0.7150837988826816, "#fc67fd" ], [ 0.8044692737430168, "#fe88fc" ], [ 0.8938547486033519, "#fea5fd" ], [ 0.9832402234636871, "#febefe" ], [ 1, "#fec3fe" ] ], "sequentialminus": [ [ 0, "#0508b8" ], [ 0.0893854748603352, "#1910d8" ], [ 0.1787709497206704, "#3c19f0" ], [ 0.2681564245810056, "#6b1cfb" ], [ 0.3575418994413408, "#981cfd" ], [ 0.44692737430167595, "#bf1cfd" ], [ 0.5363128491620112, "#dd2bfd" ], [ 0.6256983240223464, "#f246fe" ], [ 0.7150837988826816, "#fc67fd" ], [ 0.8044692737430168, "#fe88fc" ], [ 0.8938547486033519, "#fea5fd" ], [ 0.9832402234636871, "#febefe" ], [ 1, "#fec3fe" ] ] }, "plot_bgcolor": "white", "paper_bgcolor": "white", "shapedefaults": { "line": { "width": 0 }, "opacity": 0.4, "fillcolor": "#506784" }, "annotationdefaults": { "arrowhead": 0, "arrowcolor": "#506784", "arrowwidth": 1 } }, "themeRef": "PLOTLY_WHITE" } } }, "height": null, "width": null, "user": { "profile_url": "https://chart-studio.plotly.com/~OlgaFedorenko", "avatar_url": "https://storage.googleapis.com/plotly-prod-profiles/52.jpg", "background_url": "https://storage.googleapis.com/plotly-prod-profiles/bg-1.jpg", "bio": "", "nickname": "", "website": "", "stream_tokens": null, "feature_set_id": null, "csrf_token": null, "date_joined": "2023-04-22 21:39:50", "mapbox_access_tokens": null, "has_password": null, "username": "OlgaFedorenko", "email": null, "is_active": null, "readonly": null, "is_dash_creator": null, "dash_created_count": null, "is_chart_creator": null, "charts_created_count": null } }, { "creation_time": "2024-04-03T10:01:20.961987Z", "comments": { "results": [], "count": 0 }, "parented": true, "embed_url": "https://chart-studio.plotly.com/~Raell/70.embed", "fid": "Raell:70", "filename": "eeth-token-distribution", "filetype": "plot", "img_url": "https://storage.googleapis.com/plotly-prod-images/Raell/70/9_KK62G8H5SC0YWEQZL1P2GJQD9K84TO.png", "image_urls": { "default": "https://storage.googleapis.com/plotly-prod-images/Raell/70/2_O3YUMFA2XH6DNRXLXHYX3OZMYUGBT1.png", "block-thumb": "https://storage.googleapis.com/plotly-prod-images/Raell/70/8_DC1TXAEUZHO04VENMXR3PTSW15VA4R.png", "list-thumb": "https://storage.googleapis.com/plotly-prod-images/Raell/70/9_KK62G8H5SC0YWEQZL1P2GJQD9K84TO.png" }, "api_urls": { "files": "https://api.plotly.com/v2/files/Raell:70", "plots": "https://api.plotly.com/v2/plots/Raell:70", "parent": "https://api.plotly.com/v2/folders/home?user=Raell" }, "owner": "Raell", "parent": -1, "preview": "", "referencers": [], "references": [], "title": "", "views": 1, "web_url": "https://chart-studio.plotly.com/~Raell/70/", "world_readable": true, "date_modified": "2024-04-03T10:24:53.299Z", "stars": { "results": [], "count": 0 }, "collaborators": { "results": [], "count": 0 }, "subfolder_count": null, "refresh_interval": null, "organize_view_url": "https://chart-studio.plotly.com/~Raell/70/", "current_user_permission": "read", "is_theme": null, "is_template": null, "autosize": true, "caption": "", "figure": { "data": [ { "type": "sunburst", "idssrc": "Raell:73:30a971", "marker": { "colorssrc": "Raell:73:ec6dc6" }, "hoverinfo": "text", "labelssrc": "Raell:73:2fea63", "valuessrc": "Raell:73:a0ad40", "parentssrc": "Raell:73:00d636", "branchvalues": "total", "hovertextsrc": "Raell:73:d60a63" } ], "layout": { "title": { "x": 0.5, "text": "EETH Token Distribution" }, "margin": { "b": 0, "l": 0, "r": 0, "t": 0 }, "template": { "data": { "bar": [ { "type": "bar", "marker": { "line": { "color": "#E5ECF6", "width": 0.5 }, "pattern": { "size": 10, "fillmode": "overlay", "solidity": 0.2 } }, "error_x": { "color": "#2a3f5f" }, "error_y": { "color": "#2a3f5f" } } ], "pie": [ { "type": "pie", "automargin": true } ], "table": [ { "type": "table", "cells": { "fill": { "color": "#EBF0F8" }, "line": { "color": "white" } }, "header": { "fill": { "color": "#C8D4E3" }, "line": { "color": "white" } } } ], "carpet": [ { "type": "carpet", "aaxis": { "gridcolor": "white", "linecolor": "white", "endlinecolor": "#2a3f5f", "minorgridcolor": "white", "startlinecolor": "#2a3f5f" }, "baxis": { "gridcolor": "white", "linecolor": "white", "endlinecolor": "#2a3f5f", "minorgridcolor": "white", "startlinecolor": "#2a3f5f" } } ], "mesh3d": [ { "type": "mesh3d", "colorbar": { "ticks": "", "outlinewidth": 0 } } ], "contour": [ { "type": "contour", "colorbar": { "ticks": "", "outlinewidth": 0 }, "colorscale": [ [ 0.0, "#0d0887" ], [ 0.1111111111111111, "#46039f" ], [ 0.2222222222222222, "#7201a8" ], [ 0.3333333333333333, "#9c179e" ], [ 0.4444444444444444, "#bd3786" ], [ 0.5555555555555556, "#d8576b" ], [ 0.6666666666666666, "#ed7953" ], [ 0.7777777777777778, "#fb9f3a" ], [ 0.8888888888888888, "#fdca26" ], [ 1.0, "#f0f921" ] ] } ], "heatmap": [ { "type": "heatmap", "colorbar": { "ticks": "", "outlinewidth": 0 }, "colorscale": [ [ 0.0, "#0d0887" ], [ 0.1111111111111111, "#46039f" ], [ 0.2222222222222222, "#7201a8" ], [ 0.3333333333333333, "#9c179e" ], [ 0.4444444444444444, "#bd3786" ], [ 0.5555555555555556, "#d8576b" ], [ 0.6666666666666666, "#ed7953" ], [ 0.7777777777777778, "#fb9f3a" ], [ 0.8888888888888888, "#fdca26" ], [ 1.0, "#f0f921" ] ] } ], "scatter": [ { "type": "scatter", "fillpattern": { "size": 10, "fillmode": "overlay", "solidity": 0.2 } } ], "surface": [ { "type": "surface", "colorbar": { "ticks": "", "outlinewidth": 0 }, "colorscale": [ [ 0.0, "#0d0887" ], [ 0.1111111111111111, "#46039f" ], [ 0.2222222222222222, "#7201a8" ], [ 0.3333333333333333, "#9c179e" ], [ 0.4444444444444444, "#bd3786" ], [ 0.5555555555555556, "#d8576b" ], [ 0.6666666666666666, "#ed7953" ], [ 0.7777777777777778, "#fb9f3a" ], [ 0.8888888888888888, "#fdca26" ], [ 1.0, "#f0f921" ] ] } ], "barpolar": [ { "type": "barpolar", "marker": { "line": { "color": "#E5ECF6", "width": 0.5 }, "pattern": { "size": 10, "fillmode": "overlay", "solidity": 0.2 } } } ], "heatmapgl": [ { "type": "heatmapgl", "colorbar": { "ticks": "", "outlinewidth": 0 }, "colorscale": [ [ 0.0, "#0d0887" ], [ 0.1111111111111111, "#46039f" ], [ 0.2222222222222222, "#7201a8" ], [ 0.3333333333333333, "#9c179e" ], [ 0.4444444444444444, "#bd3786" ], [ 0.5555555555555556, "#d8576b" ], [ 0.6666666666666666, "#ed7953" ], [ 0.7777777777777778, "#fb9f3a" ], [ 0.8888888888888888, "#fdca26" ], [ 1.0, "#f0f921" ] ] } ], "histogram": [ { "type": "histogram", "marker": { "pattern": { "size": 10, "fillmode": "overlay", "solidity": 0.2 } } } ], "parcoords": [ { "line": { "colorbar": { "ticks": "", "outlinewidth": 0 } }, "type": "parcoords" } ], "scatter3d": [ { "line": { "colorbar": { "ticks": "", "outlinewidth": 0 } }, "type": "scatter3d", "marker": { "colorbar": { "ticks": "", "outlinewidth": 0 } } } ], "scattergl": [ { "type": "scattergl", "marker": { "colorbar": { "ticks": "", "outlinewidth": 0 } } } ], "choropleth": [ { "type": "choropleth", "colorbar": { "ticks": "", "outlinewidth": 0 } } ], "scattergeo": [ { "type": "scattergeo", "marker": { "colorbar": { "ticks": "", "outlinewidth": 0 } } } ], "histogram2d": [ { "type": "histogram2d", "colorbar": { "ticks": "", "outlinewidth": 0 }, "colorscale": [ [ 0.0, "#0d0887" ], [ 0.1111111111111111, "#46039f" ], [ 0.2222222222222222, "#7201a8" ], [ 0.3333333333333333, "#9c179e" ], [ 0.4444444444444444, "#bd3786" ], [ 0.5555555555555556, "#d8576b" ], [ 0.6666666666666666, "#ed7953" ], [ 0.7777777777777778, "#fb9f3a" ], [ 0.8888888888888888, "#fdca26" ], [ 1.0, "#f0f921" ] ] } ], "scatterpolar": [ { "type": "scatterpolar", "marker": { "colorbar": { "ticks": "", "outlinewidth": 0 } } } ], "contourcarpet": [ { "type": "contourcarpet", "colorbar": { "ticks": "", "outlinewidth": 0 } } ], "scattercarpet": [ { "type": "scattercarpet", "marker": { "colorbar": { "ticks": "", "outlinewidth": 0 } } } ], "scattermapbox": [ { "type": "scattermapbox", "marker": { "colorbar": { "ticks": "", "outlinewidth": 0 } } } ], "scatterpolargl": [ { "type": "scatterpolargl", "marker": { "colorbar": { "ticks": "", "outlinewidth": 0 } } } ], "scatterternary": [ { "type": "scatterternary", "marker": { "colorbar": { "ticks": "", "outlinewidth": 0 } } } ], "histogram2dcontour": [ { "type": "histogram2dcontour", "colorbar": { "ticks": "", "outlinewidth": 0 }, "colorscale": [ [ 0.0, "#0d0887" ], [ 0.1111111111111111, "#46039f" ], [ 0.2222222222222222, "#7201a8" ], [ 0.3333333333333333, "#9c179e" ], [ 0.4444444444444444, "#bd3786" ], [ 0.5555555555555556, "#d8576b" ], [ 0.6666666666666666, "#ed7953" ], [ 0.7777777777777778, "#fb9f3a" ], [ 0.8888888888888888, "#fdca26" ], [ 1.0, "#f0f921" ] ] } ] }, "layout": { "geo": { "bgcolor": "white", "showland": true, "lakecolor": "white", "landcolor": "#E5ECF6", "showlakes": true, "subunitcolor": "white" }, "font": { "color": "#2a3f5f" }, "polar": { "bgcolor": "#E5ECF6", "radialaxis": { "ticks": "", "gridcolor": "white", "linecolor": "white" }, "angularaxis": { "ticks": "", "gridcolor": "white", "linecolor": "white" } }, "scene": { "xaxis": { "ticks": "", "gridcolor": "white", "gridwidth": 2, "linecolor": "white", "zerolinecolor": "white", "showbackground": true, "backgroundcolor": "#E5ECF6" }, "yaxis": { "ticks": "", "gridcolor": "white", "gridwidth": 2, "linecolor": "white", "zerolinecolor": "white", "showbackground": true, "backgroundcolor": "#E5ECF6" }, "zaxis": { "ticks": "", "gridcolor": "white", "gridwidth": 2, "linecolor": "white", "zerolinecolor": "white", "showbackground": true, "backgroundcolor": "#E5ECF6" } }, "title": { "x": 0.05 }, "xaxis": { "ticks": "", "title": { "standoff": 15 }, "gridcolor": "white", "linecolor": "white", "automargin": true, "zerolinecolor": "white", "zerolinewidth": 2 }, "yaxis": { "ticks": "", "title": { "standoff": 15 }, "gridcolor": "white", "linecolor": "white", "automargin": true, "zerolinecolor": "white", "zerolinewidth": 2 }, "mapbox": { "style": "light" }, "ternary": { "aaxis": { "ticks": "", "gridcolor": "white", "linecolor": "white" }, "baxis": { "ticks": "", "gridcolor": "white", "linecolor": "white" }, "caxis": { "ticks": "", "gridcolor": "white", "linecolor": "white" }, "bgcolor": "#E5ECF6" }, "colorway": [ "#636efa", "#EF553B", "#00cc96", "#ab63fa", "#FFA15A", "#19d3f3", "#FF6692", "#B6E880", "#FF97FF", "#FECB52" ], "coloraxis": { "colorbar": { "ticks": "", "outlinewidth": 0 } }, "hovermode": "closest", "colorscale": { "diverging": [ [ 0, "#8e0152" ], [ 0.1, "#c51b7d" ], [ 0.2, "#de77ae" ], [ 0.3, "#f1b6da" ], [ 0.4, "#fde0ef" ], [ 0.5, "#f7f7f7" ], [ 0.6, "#e6f5d0" ], [ 0.7, "#b8e186" ], [ 0.8, "#7fbc41" ], [ 0.9, "#4d9221" ], [ 1, "#276419" ] ], "sequential": [ [ 0.0, "#0d0887" ], [ 0.1111111111111111, "#46039f" ], [ 0.2222222222222222, "#7201a8" ], [ 0.3333333333333333, "#9c179e" ], [ 0.4444444444444444, "#bd3786" ], [ 0.5555555555555556, "#d8576b" ], [ 0.6666666666666666, "#ed7953" ], [ 0.7777777777777778, "#fb9f3a" ], [ 0.8888888888888888, "#fdca26" ], [ 1.0, "#f0f921" ] ], "sequentialminus": [ [ 0.0, "#0d0887" ], [ 0.1111111111111111, "#46039f" ], [ 0.2222222222222222, "#7201a8" ], [ 0.3333333333333333, "#9c179e" ], [ 0.4444444444444444, "#bd3786" ], [ 0.5555555555555556, "#d8576b" ], [ 0.6666666666666666, "#ed7953" ], [ 0.7777777777777778, "#fb9f3a" ], [ 0.8888888888888888, "#fdca26" ], [ 1.0, "#f0f921" ] ] }, "hoverlabel": { "align": "left" }, "plot_bgcolor": "#E5ECF6", "paper_bgcolor": "white", "shapedefaults": { "line": { "color": "#2a3f5f" } }, "autotypenumbers": "strict", "annotationdefaults": { "arrowhead": 0, "arrowcolor": "#2a3f5f", "arrowwidth": 1 } } } } }, "height": null, "width": null, "user": { "profile_url": "https://chart-studio.plotly.com/~Raell", "avatar_url": "https://storage.googleapis.com/plotly-prod-profiles/30.jpg", "background_url": "https://storage.googleapis.com/plotly-prod-profiles/bg-3.jpg", "bio": "", "nickname": "", "website": "", "stream_tokens": null, "feature_set_id": null, "csrf_token": null, "date_joined": "2024-04-01 09:43:28", "mapbox_access_tokens": null, "has_password": null, "username": "Raell", "email": null, "is_active": null, "readonly": null, "is_dash_creator": null, "dash_created_count": null, "is_chart_creator": null, "charts_created_count": null } }, { "creation_time": "2024-04-03T10:01:05.387550Z", "comments": { "results": [], "count": 0 }, "parented": true, "embed_url": "https://chart-studio.plotly.com/~Raell/68.embed", "fid": "Raell:68", "filename": "eeth-token-distribution-20240403180057", "filetype": "plot", "img_url": "https://storage.googleapis.com/plotly-prod-images/Raell/68/9_DEVWCE3L3YCFKOLUQC0DIKDD666RWO.png", "image_urls": { "default": "https://storage.googleapis.com/plotly-prod-images/Raell/68/2_R1IL655VC0W1FK2EONTBBJOIV8KXZA.png", "block-thumb": "https://storage.googleapis.com/plotly-prod-images/Raell/68/8_6GO21ZCCZ7C4L79V87Z43AIXCQWQRD.png", "list-thumb": "https://storage.googleapis.com/plotly-prod-images/Raell/68/9_DEVWCE3L3YCFKOLUQC0DIKDD666RWO.png" }, "api_urls": { "files": "https://api.plotly.com/v2/files/Raell:68", "plots": "https://api.plotly.com/v2/plots/Raell:68", "parent": "https://api.plotly.com/v2/folders/home?user=Raell" }, "owner": "Raell", "parent": -1, "preview": "", "referencers": [], "references": [], "title": "", "views": 1, "web_url": "https://chart-studio.plotly.com/~Raell/68/", "world_readable": true, "date_modified": "2024-04-03T10:01:05.402Z", "stars": { "results": [], "count": 0 }, "collaborators": { "results": [], "count": 0 }, "subfolder_count": null, "refresh_interval": null, "organize_view_url": "https://chart-studio.plotly.com/~Raell/68/", "current_user_permission": "read", "is_theme": null, "is_template": null, "autosize": true, "caption": "", "figure": { "data": [ { "type": "sunburst", "idssrc": "Raell:67:cd6081", "marker": { "colorssrc": "Raell:67:3fd52d" }, "hoverinfo": "text", "labelssrc": "Raell:67:8849bb", "valuessrc": "Raell:67:e3cf72", "parentssrc": "Raell:67:5bdc0f", "branchvalues": "total", "hovertextsrc": "Raell:67:d82807" } ], "layout": { "title": { "x": 0.5, "text": "EETH Token Distribution" }, "margin": { "b": 0, "l": 0, "r": 0, "t": 0 }, "template": { "data": { "bar": [ { "type": "bar", "marker": { "line": { "color": "#E5ECF6", "width": 0.5 }, "pattern": { "size": 10, "fillmode": "overlay", "solidity": 0.2 } }, "error_x": { "color": "#2a3f5f" }, "error_y": { "color": "#2a3f5f" } } ], "pie": [ { "type": "pie", "automargin": true } ], "table": [ { "type": "table", "cells": { "fill": { "color": "#EBF0F8" }, "line": { "color": "white" } }, "header": { "fill": { "color": "#C8D4E3" }, "line": { "color": "white" } } } ], "carpet": [ { "type": "carpet", "aaxis": { "gridcolor": "white", "linecolor": "white", "endlinecolor": "#2a3f5f", "minorgridcolor": "white", "startlinecolor": "#2a3f5f" }, "baxis": { "gridcolor": "white", "linecolor": "white", "endlinecolor": "#2a3f5f", "minorgridcolor": "white", "startlinecolor": "#2a3f5f" } } ], "mesh3d": [ { "type": "mesh3d", "colorbar": { "ticks": "", "outlinewidth": 0 } } ], "contour": [ { "type": "contour", "colorbar": { "ticks": "", "outlinewidth": 0 }, "colorscale": [ [ 0.0, "#0d0887" ], [ 0.1111111111111111, "#46039f" ], [ 0.2222222222222222, "#7201a8" ], [ 0.3333333333333333, "#9c179e" ], [ 0.4444444444444444, "#bd3786" ], [ 0.5555555555555556, "#d8576b" ], [ 0.6666666666666666, "#ed7953" ], [ 0.7777777777777778, "#fb9f3a" ], [ 0.8888888888888888, "#fdca26" ], [ 1.0, "#f0f921" ] ] } ], "heatmap": [ { "type": "heatmap", "colorbar": { "ticks": "", "outlinewidth": 0 }, "colorscale": [ [ 0.0, "#0d0887" ], [ 0.1111111111111111, "#46039f" ], [ 0.2222222222222222, "#7201a8" ], [ 0.3333333333333333, "#9c179e" ], [ 0.4444444444444444, "#bd3786" ], [ 0.5555555555555556, "#d8576b" ], [ 0.6666666666666666, "#ed7953" ], [ 0.7777777777777778, "#fb9f3a" ], [ 0.8888888888888888, "#fdca26" ], [ 1.0, "#f0f921" ] ] } ], "scatter": [ { "type": "scatter", "fillpattern": { "size": 10, "fillmode": "overlay", "solidity": 0.2 } } ], "surface": [ { "type": "surface", "colorbar": { "ticks": "", "outlinewidth": 0 }, "colorscale": [ [ 0.0, "#0d0887" ], [ 0.1111111111111111, "#46039f" ], [ 0.2222222222222222, "#7201a8" ], [ 0.3333333333333333, "#9c179e" ], [ 0.4444444444444444, "#bd3786" ], [ 0.5555555555555556, "#d8576b" ], [ 0.6666666666666666, "#ed7953" ], [ 0.7777777777777778, "#fb9f3a" ], [ 0.8888888888888888, "#fdca26" ], [ 1.0, "#f0f921" ] ] } ], "barpolar": [ { "type": "barpolar", "marker": { "line": { "color": "#E5ECF6", "width": 0.5 }, "pattern": { "size": 10, "fillmode": "overlay", "solidity": 0.2 } } } ], "heatmapgl": [ { "type": "heatmapgl", "colorbar": { "ticks": "", "outlinewidth": 0 }, "colorscale": [ [ 0.0, "#0d0887" ], [ 0.1111111111111111, "#46039f" ], [ 0.2222222222222222, "#7201a8" ], [ 0.3333333333333333, "#9c179e" ], [ 0.4444444444444444, "#bd3786" ], [ 0.5555555555555556, "#d8576b" ], [ 0.6666666666666666, "#ed7953" ], [ 0.7777777777777778, "#fb9f3a" ], [ 0.8888888888888888, "#fdca26" ], [ 1.0, "#f0f921" ] ] } ], "histogram": [ { "type": "histogram", "marker": { "pattern": { "size": 10, "fillmode": "overlay", "solidity": 0.2 } } } ], "parcoords": [ { "line": { "colorbar": { "ticks": "", "outlinewidth": 0 } }, "type": "parcoords" } ], "scatter3d": [ { "line": { "colorbar": { "ticks": "", "outlinewidth": 0 } }, "type": "scatter3d", "marker": { "colorbar": { "ticks": "", "outlinewidth": 0 } } } ], "scattergl": [ { "type": "scattergl", "marker": { "colorbar": { "ticks": "", "outlinewidth": 0 } } } ], "choropleth": [ { "type": "choropleth", "colorbar": { "ticks": "", "outlinewidth": 0 } } ], "scattergeo": [ { "type": "scattergeo", "marker": { "colorbar": { "ticks": "", "outlinewidth": 0 } } } ], "histogram2d": [ { "type": "histogram2d", "colorbar": { "ticks": "", "outlinewidth": 0 }, "colorscale": [ [ 0.0, "#0d0887" ], [ 0.1111111111111111, "#46039f" ], [ 0.2222222222222222, "#7201a8" ], [ 0.3333333333333333, "#9c179e" ], [ 0.4444444444444444, "#bd3786" ], [ 0.5555555555555556, "#d8576b" ], [ 0.6666666666666666, "#ed7953" ], [ 0.7777777777777778, "#fb9f3a" ], [ 0.8888888888888888, "#fdca26" ], [ 1.0, "#f0f921" ] ] } ], "scatterpolar": [ { "type": "scatterpolar", "marker": { "colorbar": { "ticks": "", "outlinewidth": 0 } } } ], "contourcarpet": [ { "type": "contourcarpet", "colorbar": { "ticks": "", "outlinewidth": 0 } } ], "scattercarpet": [ { "type": "scattercarpet", "marker": { "colorbar": { "ticks": "", "outlinewidth": 0 } } } ], "scattermapbox": [ { "type": "scattermapbox", "marker": { "colorbar": { "ticks": "", "outlinewidth": 0 } } } ], "scatterpolargl": [ { "type": "scatterpolargl", "marker": { "colorbar": { "ticks": "", "outlinewidth": 0 } } } ], "scatterternary": [ { "type": "scatterternary", "marker": { "colorbar": { "ticks": "", "outlinewidth": 0 } } } ], "histogram2dcontour": [ { "type": "histogram2dcontour", "colorbar": { "ticks": "", "outlinewidth": 0 }, "colorscale": [ [ 0.0, "#0d0887" ], [ 0.1111111111111111, "#46039f" ], [ 0.2222222222222222, "#7201a8" ], [ 0.3333333333333333, "#9c179e" ], [ 0.4444444444444444, "#bd3786" ], [ 0.5555555555555556, "#d8576b" ], [ 0.6666666666666666, "#ed7953" ], [ 0.7777777777777778, "#fb9f3a" ], [ 0.8888888888888888, "#fdca26" ], [ 1.0, "#f0f921" ] ] } ] }, "layout": { "geo": { "bgcolor": "white", "showland": true, "lakecolor": "white", "landcolor": "#E5ECF6", "showlakes": true, "subunitcolor": "white" }, "font": { "color": "#2a3f5f" }, "polar": { "bgcolor": "#E5ECF6", "radialaxis": { "ticks": "", "gridcolor": "white", "linecolor": "white" }, "angularaxis": { "ticks": "", "gridcolor": "white", "linecolor": "white" } }, "scene": { "xaxis": { "ticks": "", "gridcolor": "white", "gridwidth": 2, "linecolor": "white", "zerolinecolor": "white", "showbackground": true, "backgroundcolor": "#E5ECF6" }, "yaxis": { "ticks": "", "gridcolor": "white", "gridwidth": 2, "linecolor": "white", "zerolinecolor": "white", "showbackground": true, "backgroundcolor": "#E5ECF6" }, "zaxis": { "ticks": "", "gridcolor": "white", "gridwidth": 2, "linecolor": "white", "zerolinecolor": "white", "showbackground": true, "backgroundcolor": "#E5ECF6" } }, "title": { "x": 0.05 }, "xaxis": { "ticks": "", "title": { "standoff": 15 }, "gridcolor": "white", "linecolor": "white", "automargin": true, "zerolinecolor": "white", "zerolinewidth": 2 }, "yaxis": { "ticks": "", "title": { "standoff": 15 }, "gridcolor": "white", "linecolor": "white", "automargin": true, "zerolinecolor": "white", "zerolinewidth": 2 }, "mapbox": { "style": "light" }, "ternary": { "aaxis": { "ticks": "", "gridcolor": "white", "linecolor": "white" }, "baxis": { "ticks": "", "gridcolor": "white", "linecolor": "white" }, "caxis": { "ticks": "", "gridcolor": "white", "linecolor": "white" }, "bgcolor": "#E5ECF6" }, "colorway": [ "#636efa", "#EF553B", "#00cc96", "#ab63fa", "#FFA15A", "#19d3f3", "#FF6692", "#B6E880", "#FF97FF", "#FECB52" ], "coloraxis": { "colorbar": { "ticks": "", "outlinewidth": 0 } }, "hovermode": "closest", "colorscale": { "diverging": [ [ 0, "#8e0152" ], [ 0.1, "#c51b7d" ], [ 0.2, "#de77ae" ], [ 0.3, "#f1b6da" ], [ 0.4, "#fde0ef" ], [ 0.5, "#f7f7f7" ], [ 0.6, "#e6f5d0" ], [ 0.7, "#b8e186" ], [ 0.8, "#7fbc41" ], [ 0.9, "#4d9221" ], [ 1, "#276419" ] ], "sequential": [ [ 0.0, "#0d0887" ], [ 0.1111111111111111, "#46039f" ], [ 0.2222222222222222, "#7201a8" ], [ 0.3333333333333333, "#9c179e" ], [ 0.4444444444444444, "#bd3786" ], [ 0.5555555555555556, "#d8576b" ], [ 0.6666666666666666, "#ed7953" ], [ 0.7777777777777778, "#fb9f3a" ], [ 0.8888888888888888, "#fdca26" ], [ 1.0, "#f0f921" ] ], "sequentialminus": [ [ 0.0, "#0d0887" ], [ 0.1111111111111111, "#46039f" ], [ 0.2222222222222222, "#7201a8" ], [ 0.3333333333333333, "#9c179e" ], [ 0.4444444444444444, "#bd3786" ], [ 0.5555555555555556, "#d8576b" ], [ 0.6666666666666666, "#ed7953" ], [ 0.7777777777777778, "#fb9f3a" ], [ 0.8888888888888888, "#fdca26" ], [ 1.0, "#f0f921" ] ] }, "hoverlabel": { "align": "left" }, "plot_bgcolor": "#E5ECF6", "paper_bgcolor": "white", "shapedefaults": { "line": { "color": "#2a3f5f" } }, "autotypenumbers": "strict", "annotationdefaults": { "arrowhead": 0, "arrowcolor": "#2a3f5f", "arrowwidth": 1 } } } } }, "height": null, "width": null, "user": { "profile_url": "https://chart-studio.plotly.com/~Raell", "avatar_url": "https://storage.googleapis.com/plotly-prod-profiles/30.jpg", "background_url": "https://storage.googleapis.com/plotly-prod-profiles/bg-3.jpg", "bio": "", "nickname": "", "website": "", "stream_tokens": null, "feature_set_id": null, "csrf_token": null, "date_joined": "2024-04-01 09:43:28", "mapbox_access_tokens": null, "has_password": null, "username": "Raell", "email": null, "is_active": null, "readonly": null, "is_dash_creator": null, "dash_created_count": null, "is_chart_creator": null, "charts_created_count": null } }, { "creation_time": "2024-04-03T10:00:46.283590Z", "comments": { "results": [], "count": 0 }, "parented": true, "embed_url": "https://chart-studio.plotly.com/~Raell/66.embed", "fid": "Raell:66", "filename": "eeth-token-distribution-20240403180037", "filetype": "plot", "img_url": "https://storage.googleapis.com/plotly-prod-images/Raell/66/9_TBCQ14TMO5SNWPZW2B5KGR2MZFHA3W.png", "image_urls": { "default": "https://storage.googleapis.com/plotly-prod-images/Raell/66/2_RQ2LJXR402G754DKSOAYQCHT8MTU2M.png", "block-thumb": "https://storage.googleapis.com/plotly-prod-images/Raell/66/8_ZWQ2KODCOLM3I9DTGZ09HTJ1TDVYX9.png", "list-thumb": "https://storage.googleapis.com/plotly-prod-images/Raell/66/9_TBCQ14TMO5SNWPZW2B5KGR2MZFHA3W.png" }, "api_urls": { "files": "https://api.plotly.com/v2/files/Raell:66", "plots": "https://api.plotly.com/v2/plots/Raell:66", "parent": "https://api.plotly.com/v2/folders/home?user=Raell" }, "owner": "Raell", "parent": -1, "preview": "", "referencers": [], "references": [], "title": "", "views": 1, "web_url": "https://chart-studio.plotly.com/~Raell/66/", "world_readable": true, "date_modified": "2024-04-03T10:00:46.296Z", "stars": { "results": [], "count": 0 }, "collaborators": { "results": [], "count": 0 }, "subfolder_count": null, "refresh_interval": null, "organize_view_url": "https://chart-studio.plotly.com/~Raell/66/", "current_user_permission": "read", "is_theme": null, "is_template": null, "autosize": true, "caption": "", "figure": { "data": [ { "type": "sunburst", "idssrc": "Raell:65:d73f2d", "marker": { "colorssrc": "Raell:65:564455" }, "hoverinfo": "text", "labelssrc": "Raell:65:46a386", "valuessrc": "Raell:65:1d3dbe", "parentssrc": "Raell:65:a9268d", "branchvalues": "total", "hovertextsrc": "Raell:65:a4ad52" } ], "layout": { "title": { "x": 0.5, "text": "EETH Token Distribution" }, "margin": { "b": 0, "l": 0, "r": 0, "t": 0 }, "template": { "data": { "bar": [ { "type": "bar", "marker": { "line": { "color": "#E5ECF6", "width": 0.5 }, "pattern": { "size": 10, "fillmode": "overlay", "solidity": 0.2 } }, "error_x": { "color": "#2a3f5f" }, "error_y": { "color": "#2a3f5f" } } ], "pie": [ { "type": "pie", "automargin": true } ], "table": [ { "type": "table", "cells": { "fill": { "color": "#EBF0F8" }, "line": { "color": "white" } }, "header": { "fill": { "color": "#C8D4E3" }, "line": { "color": "white" } } } ], "carpet": [ { "type": "carpet", "aaxis": { "gridcolor": "white", "linecolor": "white", "endlinecolor": "#2a3f5f", "minorgridcolor": "white", "startlinecolor": "#2a3f5f" }, "baxis": { "gridcolor": "white", "linecolor": "white", "endlinecolor": "#2a3f5f", "minorgridcolor": "white", "startlinecolor": "#2a3f5f" } } ], "mesh3d": [ { "type": "mesh3d", "colorbar": { "ticks": "", "outlinewidth": 0 } } ], "contour": [ { "type": "contour", "colorbar": { "ticks": "", "outlinewidth": 0 }, "colorscale": [ [ 0.0, "#0d0887" ], [ 0.1111111111111111, "#46039f" ], [ 0.2222222222222222, "#7201a8" ], [ 0.3333333333333333, "#9c179e" ], [ 0.4444444444444444, "#bd3786" ], [ 0.5555555555555556, "#d8576b" ], [ 0.6666666666666666, "#ed7953" ], [ 0.7777777777777778, "#fb9f3a" ], [ 0.8888888888888888, "#fdca26" ], [ 1.0, "#f0f921" ] ] } ], "heatmap": [ { "type": "heatmap", "colorbar": { "ticks": "", "outlinewidth": 0 }, "colorscale": [ [ 0.0, "#0d0887" ], [ 0.1111111111111111, "#46039f" ], [ 0.2222222222222222, "#7201a8" ], [ 0.3333333333333333, "#9c179e" ], [ 0.4444444444444444, "#bd3786" ], [ 0.5555555555555556, "#d8576b" ], [ 0.6666666666666666, "#ed7953" ], [ 0.7777777777777778, "#fb9f3a" ], [ 0.8888888888888888, "#fdca26" ], [ 1.0, "#f0f921" ] ] } ], "scatter": [ { "type": "scatter", "fillpattern": { "size": 10, "fillmode": "overlay", "solidity": 0.2 } } ], "surface": [ { "type": "surface", "colorbar": { "ticks": "", "outlinewidth": 0 }, "colorscale": [ [ 0.0, "#0d0887" ], [ 0.1111111111111111, "#46039f" ], [ 0.2222222222222222, "#7201a8" ], [ 0.3333333333333333, "#9c179e" ], [ 0.4444444444444444, "#bd3786" ], [ 0.5555555555555556, "#d8576b" ], [ 0.6666666666666666, "#ed7953" ], [ 0.7777777777777778, "#fb9f3a" ], [ 0.8888888888888888, "#fdca26" ], [ 1.0, "#f0f921" ] ] } ], "barpolar": [ { "type": "barpolar", "marker": { "line": { "color": "#E5ECF6", "width": 0.5 }, "pattern": { "size": 10, "fillmode": "overlay", "solidity": 0.2 } } } ], "heatmapgl": [ { "type": "heatmapgl", "colorbar": { "ticks": "", "outlinewidth": 0 }, "colorscale": [ [ 0.0, "#0d0887" ], [ 0.1111111111111111, "#46039f" ], [ 0.2222222222222222, "#7201a8" ], [ 0.3333333333333333, "#9c179e" ], [ 0.4444444444444444, "#bd3786" ], [ 0.5555555555555556, "#d8576b" ], [ 0.6666666666666666, "#ed7953" ], [ 0.7777777777777778, "#fb9f3a" ], [ 0.8888888888888888, "#fdca26" ], [ 1.0, "#f0f921" ] ] } ], "histogram": [ { "type": "histogram", "marker": { "pattern": { "size": 10, "fillmode": "overlay", "solidity": 0.2 } } } ], "parcoords": [ { "line": { "colorbar": { "ticks": "", "outlinewidth": 0 } }, "type": "parcoords" } ], "scatter3d": [ { "line": { "colorbar": { "ticks": "", "outlinewidth": 0 } }, "type": "scatter3d", "marker": { "colorbar": { "ticks": "", "outlinewidth": 0 } } } ], "scattergl": [ { "type": "scattergl", "marker": { "colorbar": { "ticks": "", "outlinewidth": 0 } } } ], "choropleth": [ { "type": "choropleth", "colorbar": { "ticks": "", "outlinewidth": 0 } } ], "scattergeo": [ { "type": "scattergeo", "marker": { "colorbar": { "ticks": "", "outlinewidth": 0 } } } ], "histogram2d": [ { "type": "histogram2d", "colorbar": { "ticks": "", "outlinewidth": 0 }, "colorscale": [ [ 0.0, "#0d0887" ], [ 0.1111111111111111, "#46039f" ], [ 0.2222222222222222, "#7201a8" ], [ 0.3333333333333333, "#9c179e" ], [ 0.4444444444444444, "#bd3786" ], [ 0.5555555555555556, "#d8576b" ], [ 0.6666666666666666, "#ed7953" ], [ 0.7777777777777778, "#fb9f3a" ], [ 0.8888888888888888, "#fdca26" ], [ 1.0, "#f0f921" ] ] } ], "scatterpolar": [ { "type": "scatterpolar", "marker": { "colorbar": { "ticks": "", "outlinewidth": 0 } } } ], "contourcarpet": [ { "type": "contourcarpet", "colorbar": { "ticks": "", "outlinewidth": 0 } } ], "scattercarpet": [ { "type": "scattercarpet", "marker": { "colorbar": { "ticks": "", "outlinewidth": 0 } } } ], "scattermapbox": [ { "type": "scattermapbox", "marker": { "colorbar": { "ticks": "", "outlinewidth": 0 } } } ], "scatterpolargl": [ { "type": "scatterpolargl", "marker": { "colorbar": { "ticks": "", "outlinewidth": 0 } } } ], "scatterternary": [ { "type": "scatterternary", "marker": { "colorbar": { "ticks": "", "outlinewidth": 0 } } } ], "histogram2dcontour": [ { "type": "histogram2dcontour", "colorbar": { "ticks": "", "outlinewidth": 0 }, "colorscale": [ [ 0.0, "#0d0887" ], [ 0.1111111111111111, "#46039f" ], [ 0.2222222222222222, "#7201a8" ], [ 0.3333333333333333, "#9c179e" ], [ 0.4444444444444444, "#bd3786" ], [ 0.5555555555555556, "#d8576b" ], [ 0.6666666666666666, "#ed7953" ], [ 0.7777777777777778, "#fb9f3a" ], [ 0.8888888888888888, "#fdca26" ], [ 1.0, "#f0f921" ] ] } ] }, "layout": { "geo": { "bgcolor": "white", "showland": true, "lakecolor": "white", "landcolor": "#E5ECF6", "showlakes": true, "subunitcolor": "white" }, "font": { "color": "#2a3f5f" }, "polar": { "bgcolor": "#E5ECF6", "radialaxis": { "ticks": "", "gridcolor": "white", "linecolor": "white" }, "angularaxis": { "ticks": "", "gridcolor": "white", "linecolor": "white" } }, "scene": { "xaxis": { "ticks": "", "gridcolor": "white", "gridwidth": 2, "linecolor": "white", "zerolinecolor": "white", "showbackground": true, "backgroundcolor": "#E5ECF6" }, "yaxis": { "ticks": "", "gridcolor": "white", "gridwidth": 2, "linecolor": "white", "zerolinecolor": "white", "showbackground": true, "backgroundcolor": "#E5ECF6" }, "zaxis": { "ticks": "", "gridcolor": "white", "gridwidth": 2, "linecolor": "white", "zerolinecolor": "white", "showbackground": true, "backgroundcolor": "#E5ECF6" } }, "title": { "x": 0.05 }, "xaxis": { "ticks": "", "title": { "standoff": 15 }, "gridcolor": "white", "linecolor": "white", "automargin": true, "zerolinecolor": "white", "zerolinewidth": 2 }, "yaxis": { "ticks": "", "title": { "standoff": 15 }, "gridcolor": "white", "linecolor": "white", "automargin": true, "zerolinecolor": "white", "zerolinewidth": 2 }, "mapbox": { "style": "light" }, "ternary": { "aaxis": { "ticks": "", "gridcolor": "white", "linecolor": "white" }, "baxis": { "ticks": "", "gridcolor": "white", "linecolor": "white" }, "caxis": { "ticks": "", "gridcolor": "white", "linecolor": "white" }, "bgcolor": "#E5ECF6" }, "colorway": [ "#636efa", "#EF553B", "#00cc96", "#ab63fa", "#FFA15A", "#19d3f3", "#FF6692", "#B6E880", "#FF97FF", "#FECB52" ], "coloraxis": { "colorbar": { "ticks": "", "outlinewidth": 0 } }, "hovermode": "closest", "colorscale": { "diverging": [ [ 0, "#8e0152" ], [ 0.1, "#c51b7d" ], [ 0.2, "#de77ae" ], [ 0.3, "#f1b6da" ], [ 0.4, "#fde0ef" ], [ 0.5, "#f7f7f7" ], [ 0.6, "#e6f5d0" ], [ 0.7, "#b8e186" ], [ 0.8, "#7fbc41" ], [ 0.9, "#4d9221" ], [ 1, "#276419" ] ], "sequential": [ [ 0.0, "#0d0887" ], [ 0.1111111111111111, "#46039f" ], [ 0.2222222222222222, "#7201a8" ], [ 0.3333333333333333, "#9c179e" ], [ 0.4444444444444444, "#bd3786" ], [ 0.5555555555555556, "#d8576b" ], [ 0.6666666666666666, "#ed7953" ], [ 0.7777777777777778, "#fb9f3a" ], [ 0.8888888888888888, "#fdca26" ], [ 1.0, "#f0f921" ] ], "sequentialminus": [ [ 0.0, "#0d0887" ], [ 0.1111111111111111, "#46039f" ], [ 0.2222222222222222, "#7201a8" ], [ 0.3333333333333333, "#9c179e" ], [ 0.4444444444444444, "#bd3786" ], [ 0.5555555555555556, "#d8576b" ], [ 0.6666666666666666, "#ed7953" ], [ 0.7777777777777778, "#fb9f3a" ], [ 0.8888888888888888, "#fdca26" ], [ 1.0, "#f0f921" ] ] }, "hoverlabel": { "align": "left" }, "plot_bgcolor": "#E5ECF6", "paper_bgcolor": "white", "shapedefaults": { "line": { "color": "#2a3f5f" } }, "autotypenumbers": "strict", "annotationdefaults": { "arrowhead": 0, "arrowcolor": "#2a3f5f", "arrowwidth": 1 } } } } }, "height": null, "width": null, "user": { "profile_url": "https://chart-studio.plotly.com/~Raell", "avatar_url": "https://storage.googleapis.com/plotly-prod-profiles/30.jpg", "background_url": "https://storage.googleapis.com/plotly-prod-profiles/bg-3.jpg", "bio": "", "nickname": "", "website": "", "stream_tokens": null, "feature_set_id": null, "csrf_token": null, "date_joined": "2024-04-01 09:43:28", "mapbox_access_tokens": null, "has_password": null, "username": "Raell", "email": null, "is_active": null, "readonly": null, "is_dash_creator": null, "dash_created_count": null, "is_chart_creator": null, "charts_created_count": null } }, { "creation_time": "2024-04-03T09:57:24.095197Z", "comments": { "results": [], "count": 0 }, "parented": true, "embed_url": "https://chart-studio.plotly.com/~Raell/64.embed", "fid": "Raell:64", "filename": "eeth-token-distribution-20240403175714", "filetype": "plot", "img_url": "https://storage.googleapis.com/plotly-prod-images/Raell/64/9_9YOJ4UMJYF2KLP7LT2JLAULGNBNWEW.png", "image_urls": { "default": "https://storage.googleapis.com/plotly-prod-images/Raell/64/2_PBH42FL1PMWLK3ALMX0C2QY4XC0Q8Q.png", "block-thumb": "https://storage.googleapis.com/plotly-prod-images/Raell/64/8_BNVTMI886419ISG2WD26NWFOXOHKPG.png", "list-thumb": "https://storage.googleapis.com/plotly-prod-images/Raell/64/9_9YOJ4UMJYF2KLP7LT2JLAULGNBNWEW.png" }, "api_urls": { "files": "https://api.plotly.com/v2/files/Raell:64", "plots": "https://api.plotly.com/v2/plots/Raell:64", "parent": "https://api.plotly.com/v2/folders/home?user=Raell" }, "owner": "Raell", "parent": -1, "preview": "", "referencers": [], "references": [], "title": "", "views": 2, "web_url": "https://chart-studio.plotly.com/~Raell/64/", "world_readable": true, "date_modified": "2024-04-03T09:57:24.109Z", "stars": { "results": [], "count": 0 }, "collaborators": { "results": [], "count": 0 }, "subfolder_count": null, "refresh_interval": null, "organize_view_url": "https://chart-studio.plotly.com/~Raell/64/", "current_user_permission": "read", "is_theme": null, "is_template": null, "autosize": true, "caption": "", "figure": { "data": [ { "type": "sunburst", "idssrc": "Raell:63:7abe53", "marker": { "colorssrc": "Raell:63:ab16cd" }, "hoverinfo": "text", "labelssrc": "Raell:63:820edf", "valuessrc": "Raell:63:50ebde", "parentssrc": "Raell:63:e5a6b6", "branchvalues": "total", "hovertextsrc": "Raell:63:64931c" } ], "layout": { "title": { "x": 0.5, "text": "EETH Token Distribution" }, "margin": { "b": 0, "l": 0, "r": 0, "t": 0 }, "template": { "data": { "bar": [ { "type": "bar", "marker": { "line": { "color": "#E5ECF6", "width": 0.5 }, "pattern": { "size": 10, "fillmode": "overlay", "solidity": 0.2 } }, "error_x": { "color": "#2a3f5f" }, "error_y": { "color": "#2a3f5f" } } ], "pie": [ { "type": "pie", "automargin": true } ], "table": [ { "type": "table", "cells": { "fill": { "color": "#EBF0F8" }, "line": { "color": "white" } }, "header": { "fill": { "color": "#C8D4E3" }, "line": { "color": "white" } } } ], "carpet": [ { "type": "carpet", "aaxis": { "gridcolor": "white", "linecolor": "white", "endlinecolor": "#2a3f5f", "minorgridcolor": "white", "startlinecolor": "#2a3f5f" }, "baxis": { "gridcolor": "white", "linecolor": "white", "endlinecolor": "#2a3f5f", "minorgridcolor": "white", "startlinecolor": "#2a3f5f" } } ], "mesh3d": [ { "type": "mesh3d", "colorbar": { "ticks": "", "outlinewidth": 0 } } ], "contour": [ { "type": "contour", "colorbar": { "ticks": "", "outlinewidth": 0 }, "colorscale": [ [ 0.0, "#0d0887" ], [ 0.1111111111111111, "#46039f" ], [ 0.2222222222222222, "#7201a8" ], [ 0.3333333333333333, "#9c179e" ], [ 0.4444444444444444, "#bd3786" ], [ 0.5555555555555556, "#d8576b" ], [ 0.6666666666666666, "#ed7953" ], [ 0.7777777777777778, "#fb9f3a" ], [ 0.8888888888888888, "#fdca26" ], [ 1.0, "#f0f921" ] ] } ], "heatmap": [ { "type": "heatmap", "colorbar": { "ticks": "", "outlinewidth": 0 }, "colorscale": [ [ 0.0, "#0d0887" ], [ 0.1111111111111111, "#46039f" ], [ 0.2222222222222222, "#7201a8" ], [ 0.3333333333333333, "#9c179e" ], [ 0.4444444444444444, "#bd3786" ], [ 0.5555555555555556, "#d8576b" ], [ 0.6666666666666666, "#ed7953" ], [ 0.7777777777777778, "#fb9f3a" ], [ 0.8888888888888888, "#fdca26" ], [ 1.0, "#f0f921" ] ] } ], "scatter": [ { "type": "scatter", "fillpattern": { "size": 10, "fillmode": "overlay", "solidity": 0.2 } } ], "surface": [ { "type": "surface", "colorbar": { "ticks": "", "outlinewidth": 0 }, "colorscale": [ [ 0.0, "#0d0887" ], [ 0.1111111111111111, "#46039f" ], [ 0.2222222222222222, "#7201a8" ], [ 0.3333333333333333, "#9c179e" ], [ 0.4444444444444444, "#bd3786" ], [ 0.5555555555555556, "#d8576b" ], [ 0.6666666666666666, "#ed7953" ], [ 0.7777777777777778, "#fb9f3a" ], [ 0.8888888888888888, "#fdca26" ], [ 1.0, "#f0f921" ] ] } ], "barpolar": [ { "type": "barpolar", "marker": { "line": { "color": "#E5ECF6", "width": 0.5 }, "pattern": { "size": 10, "fillmode": "overlay", "solidity": 0.2 } } } ], "heatmapgl": [ { "type": "heatmapgl", "colorbar": { "ticks": "", "outlinewidth": 0 }, "colorscale": [ [ 0.0, "#0d0887" ], [ 0.1111111111111111, "#46039f" ], [ 0.2222222222222222, "#7201a8" ], [ 0.3333333333333333, "#9c179e" ], [ 0.4444444444444444, "#bd3786" ], [ 0.5555555555555556, "#d8576b" ], [ 0.6666666666666666, "#ed7953" ], [ 0.7777777777777778, "#fb9f3a" ], [ 0.8888888888888888, "#fdca26" ], [ 1.0, "#f0f921" ] ] } ], "histogram": [ { "type": "histogram", "marker": { "pattern": { "size": 10, "fillmode": "overlay", "solidity": 0.2 } } } ], "parcoords": [ { "line": { "colorbar": { "ticks": "", "outlinewidth": 0 } }, "type": "parcoords" } ], "scatter3d": [ { "line": { "colorbar": { "ticks": "", "outlinewidth": 0 } }, "type": "scatter3d", "marker": { "colorbar": { "ticks": "", "outlinewidth": 0 } } } ], "scattergl": [ { "type": "scattergl", "marker": { "colorbar": { "ticks": "", "outlinewidth": 0 } } } ], "choropleth": [ { "type": "choropleth", "colorbar": { "ticks": "", "outlinewidth": 0 } } ], "scattergeo": [ { "type": "scattergeo", "marker": { "colorbar": { "ticks": "", "outlinewidth": 0 } } } ], "histogram2d": [ { "type": "histogram2d", "colorbar": { "ticks": "", "outlinewidth": 0 }, "colorscale": [ [ 0.0, "#0d0887" ], [ 0.1111111111111111, "#46039f" ], [ 0.2222222222222222, "#7201a8" ], [ 0.3333333333333333, "#9c179e" ], [ 0.4444444444444444, "#bd3786" ], [ 0.5555555555555556, "#d8576b" ], [ 0.6666666666666666, "#ed7953" ], [ 0.7777777777777778, "#fb9f3a" ], [ 0.8888888888888888, "#fdca26" ], [ 1.0, "#f0f921" ] ] } ], "scatterpolar": [ { "type": "scatterpolar", "marker": { "colorbar": { "ticks": "", "outlinewidth": 0 } } } ], "contourcarpet": [ { "type": "contourcarpet", "colorbar": { "ticks": "", "outlinewidth": 0 } } ], "scattercarpet": [ { "type": "scattercarpet", "marker": { "colorbar": { "ticks": "", "outlinewidth": 0 } } } ], "scattermapbox": [ { "type": "scattermapbox", "marker": { "colorbar": { "ticks": "", "outlinewidth": 0 } } } ], "scatterpolargl": [ { "type": "scatterpolargl", "marker": { "colorbar": { "ticks": "", "outlinewidth": 0 } } } ], "scatterternary": [ { "type": "scatterternary", "marker": { "colorbar": { "ticks": "", "outlinewidth": 0 } } } ], "histogram2dcontour": [ { "type": "histogram2dcontour", "colorbar": { "ticks": "", "outlinewidth": 0 }, "colorscale": [ [ 0.0, "#0d0887" ], [ 0.1111111111111111, "#46039f" ], [ 0.2222222222222222, "#7201a8" ], [ 0.3333333333333333, "#9c179e" ], [ 0.4444444444444444, "#bd3786" ], [ 0.5555555555555556, "#d8576b" ], [ 0.6666666666666666, "#ed7953" ], [ 0.7777777777777778, "#fb9f3a" ], [ 0.8888888888888888, "#fdca26" ], [ 1.0, "#f0f921" ] ] } ] }, "layout": { "geo": { "bgcolor": "white", "showland": true, "lakecolor": "white", "landcolor": "#E5ECF6", "showlakes": true, "subunitcolor": "white" }, "font": { "color": "#2a3f5f" }, "polar": { "bgcolor": "#E5ECF6", "radialaxis": { "ticks": "", "gridcolor": "white", "linecolor": "white" }, "angularaxis": { "ticks": "", "gridcolor": "white", "linecolor": "white" } }, "scene": { "xaxis": { "ticks": "", "gridcolor": "white", "gridwidth": 2, "linecolor": "white", "zerolinecolor": "white", "showbackground": true, "backgroundcolor": "#E5ECF6" }, "yaxis": { "ticks": "", "gridcolor": "white", "gridwidth": 2, "linecolor": "white", "zerolinecolor": "white", "showbackground": true, "backgroundcolor": "#E5ECF6" }, "zaxis": { "ticks": "", "gridcolor": "white", "gridwidth": 2, "linecolor": "white", "zerolinecolor": "white", "showbackground": true, "backgroundcolor": "#E5ECF6" } }, "title": { "x": 0.05 }, "xaxis": { "ticks": "", "title": { "standoff": 15 }, "gridcolor": "white", "linecolor": "white", "automargin": true, "zerolinecolor": "white", "zerolinewidth": 2 }, "yaxis": { "ticks": "", "title": { "standoff": 15 }, "gridcolor": "white", "linecolor": "white", "automargin": true, "zerolinecolor": "white", "zerolinewidth": 2 }, "mapbox": { "style": "light" }, "ternary": { "aaxis": { "ticks": "", "gridcolor": "white", "linecolor": "white" }, "baxis": { "ticks": "", "gridcolor": "white", "linecolor": "white" }, "caxis": { "ticks": "", "gridcolor": "white", "linecolor": "white" }, "bgcolor": "#E5ECF6" }, "colorway": [ "#636efa", "#EF553B", "#00cc96", "#ab63fa", "#FFA15A", "#19d3f3", "#FF6692", "#B6E880", "#FF97FF", "#FECB52" ], "coloraxis": { "colorbar": { "ticks": "", "outlinewidth": 0 } }, "hovermode": "closest", "colorscale": { "diverging": [ [ 0, "#8e0152" ], [ 0.1, "#c51b7d" ], [ 0.2, "#de77ae" ], [ 0.3, "#f1b6da" ], [ 0.4, "#fde0ef" ], [ 0.5, "#f7f7f7" ], [ 0.6, "#e6f5d0" ], [ 0.7, "#b8e186" ], [ 0.8, "#7fbc41" ], [ 0.9, "#4d9221" ], [ 1, "#276419" ] ], "sequential": [ [ 0.0, "#0d0887" ], [ 0.1111111111111111, "#46039f" ], [ 0.2222222222222222, "#7201a8" ], [ 0.3333333333333333, "#9c179e" ], [ 0.4444444444444444, "#bd3786" ], [ 0.5555555555555556, "#d8576b" ], [ 0.6666666666666666, "#ed7953" ], [ 0.7777777777777778, "#fb9f3a" ], [ 0.8888888888888888, "#fdca26" ], [ 1.0, "#f0f921" ] ], "sequentialminus": [ [ 0.0, "#0d0887" ], [ 0.1111111111111111, "#46039f" ], [ 0.2222222222222222, "#7201a8" ], [ 0.3333333333333333, "#9c179e" ], [ 0.4444444444444444, "#bd3786" ], [ 0.5555555555555556, "#d8576b" ], [ 0.6666666666666666, "#ed7953" ], [ 0.7777777777777778, "#fb9f3a" ], [ 0.8888888888888888, "#fdca26" ], [ 1.0, "#f0f921" ] ] }, "hoverlabel": { "align": "left" }, "plot_bgcolor": "#E5ECF6", "paper_bgcolor": "white", "shapedefaults": { "line": { "color": "#2a3f5f" } }, "autotypenumbers": "strict", "annotationdefaults": { "arrowhead": 0, "arrowcolor": "#2a3f5f", "arrowwidth": 1 } } } } }, "height": null, "width": null, "user": { "profile_url": "https://chart-studio.plotly.com/~Raell", "avatar_url": "https://storage.googleapis.com/plotly-prod-profiles/30.jpg", "background_url": "https://storage.googleapis.com/plotly-prod-profiles/bg-3.jpg", "bio": "", "nickname": "", "website": "", "stream_tokens": null, "feature_set_id": null, "csrf_token": null, "date_joined": "2024-04-01 09:43:28", "mapbox_access_tokens": null, "has_password": null, "username": "Raell", "email": null, "is_active": null, "readonly": null, "is_dash_creator": null, "dash_created_count": null, "is_chart_creator": null, "charts_created_count": null } }, { "creation_time": "2024-04-03T09:55:53.274796Z", "comments": { "results": [], "count": 0 }, "parented": true, "embed_url": "https://chart-studio.plotly.com/~Raell/62.embed", "fid": "Raell:62", "filename": "eeth-token-distribution-20240403175544", "filetype": "plot", "img_url": "https://storage.googleapis.com/plotly-prod-images/Raell/62/9_NC0ASFTMIO9G73C2PNTJ8DJKOWOVLS.png", "image_urls": { "default": "https://storage.googleapis.com/plotly-prod-images/Raell/62/2_2B77BMMXHHH46LLY24FBHCZLFHE7AO.png", "block-thumb": "https://storage.googleapis.com/plotly-prod-images/Raell/62/8_GT00GV7PWZ7XVE9G61FRZ09Q482ZZ0.png", "list-thumb": "https://storage.googleapis.com/plotly-prod-images/Raell/62/9_NC0ASFTMIO9G73C2PNTJ8DJKOWOVLS.png" }, "api_urls": { "files": "https://api.plotly.com/v2/files/Raell:62", "plots": "https://api.plotly.com/v2/plots/Raell:62", "parent": "https://api.plotly.com/v2/folders/home?user=Raell" }, "owner": "Raell", "parent": -1, "preview": "", "referencers": [], "references": [], "title": "", "views": 2, "web_url": "https://chart-studio.plotly.com/~Raell/62/", "world_readable": true, "date_modified": "2024-04-03T09:55:53.285Z", "stars": { "results": [], "count": 0 }, "collaborators": { "results": [], "count": 0 }, "subfolder_count": null, "refresh_interval": null, "organize_view_url": "https://chart-studio.plotly.com/~Raell/62/", "current_user_permission": "read", "is_theme": null, "is_template": null, "autosize": true, "caption": "", "figure": { "data": [ { "type": "sunburst", "idssrc": "Raell:61:09ea81", "marker": { "colorssrc": "Raell:61:74e636" }, "hoverinfo": "text", "labelssrc": "Raell:61:baa727", "valuessrc": "Raell:61:c91ff6", "parentssrc": "Raell:61:7f4f38", "branchvalues": "total", "hovertextsrc": "Raell:61:56ddf5" } ], "layout": { "title": { "x": 0.5, "text": "EETH Token Distribution" }, "margin": { "b": 0, "l": 0, "r": 0, "t": 0 }, "template": { "data": { "bar": [ { "type": "bar", "marker": { "line": { "color": "#E5ECF6", "width": 0.5 }, "pattern": { "size": 10, "fillmode": "overlay", "solidity": 0.2 } }, "error_x": { "color": "#2a3f5f" }, "error_y": { "color": "#2a3f5f" } } ], "pie": [ { "type": "pie", "automargin": true } ], "table": [ { "type": "table", "cells": { "fill": { "color": "#EBF0F8" }, "line": { "color": "white" } }, "header": { "fill": { "color": "#C8D4E3" }, "line": { "color": "white" } } } ], "carpet": [ { "type": "carpet", "aaxis": { "gridcolor": "white", "linecolor": "white", "endlinecolor": "#2a3f5f", "minorgridcolor": "white", "startlinecolor": "#2a3f5f" }, "baxis": { "gridcolor": "white", "linecolor": "white", "endlinecolor": "#2a3f5f", "minorgridcolor": "white", "startlinecolor": "#2a3f5f" } } ], "mesh3d": [ { "type": "mesh3d", "colorbar": { "ticks": "", "outlinewidth": 0 } } ], "contour": [ { "type": "contour", "colorbar": { "ticks": "", "outlinewidth": 0 }, "colorscale": [ [ 0.0, "#0d0887" ], [ 0.1111111111111111, "#46039f" ], [ 0.2222222222222222, "#7201a8" ], [ 0.3333333333333333, "#9c179e" ], [ 0.4444444444444444, "#bd3786" ], [ 0.5555555555555556, "#d8576b" ], [ 0.6666666666666666, "#ed7953" ], [ 0.7777777777777778, "#fb9f3a" ], [ 0.8888888888888888, "#fdca26" ], [ 1.0, "#f0f921" ] ] } ], "heatmap": [ { "type": "heatmap", "colorbar": { "ticks": "", "outlinewidth": 0 }, "colorscale": [ [ 0.0, "#0d0887" ], [ 0.1111111111111111, "#46039f" ], [ 0.2222222222222222, "#7201a8" ], [ 0.3333333333333333, "#9c179e" ], [ 0.4444444444444444, "#bd3786" ], [ 0.5555555555555556, "#d8576b" ], [ 0.6666666666666666, "#ed7953" ], [ 0.7777777777777778, "#fb9f3a" ], [ 0.8888888888888888, "#fdca26" ], [ 1.0, "#f0f921" ] ] } ], "scatter": [ { "type": "scatter", "fillpattern": { "size": 10, "fillmode": "overlay", "solidity": 0.2 } } ], "surface": [ { "type": "surface", "colorbar": { "ticks": "", "outlinewidth": 0 }, "colorscale": [ [ 0.0, "#0d0887" ], [ 0.1111111111111111, "#46039f" ], [ 0.2222222222222222, "#7201a8" ], [ 0.3333333333333333, "#9c179e" ], [ 0.4444444444444444, "#bd3786" ], [ 0.5555555555555556, "#d8576b" ], [ 0.6666666666666666, "#ed7953" ], [ 0.7777777777777778, "#fb9f3a" ], [ 0.8888888888888888, "#fdca26" ], [ 1.0, "#f0f921" ] ] } ], "barpolar": [ { "type": "barpolar", "marker": { "line": { "color": "#E5ECF6", "width": 0.5 }, "pattern": { "size": 10, "fillmode": "overlay", "solidity": 0.2 } } } ], "heatmapgl": [ { "type": "heatmapgl", "colorbar": { "ticks": "", "outlinewidth": 0 }, "colorscale": [ [ 0.0, "#0d0887" ], [ 0.1111111111111111, "#46039f" ], [ 0.2222222222222222, "#7201a8" ], [ 0.3333333333333333, "#9c179e" ], [ 0.4444444444444444, "#bd3786" ], [ 0.5555555555555556, "#d8576b" ], [ 0.6666666666666666, "#ed7953" ], [ 0.7777777777777778, "#fb9f3a" ], [ 0.8888888888888888, "#fdca26" ], [ 1.0, "#f0f921" ] ] } ], "histogram": [ { "type": "histogram", "marker": { "pattern": { "size": 10, "fillmode": "overlay", "solidity": 0.2 } } } ], "parcoords": [ { "line": { "colorbar": { "ticks": "", "outlinewidth": 0 } }, "type": "parcoords" } ], "scatter3d": [ { "line": { "colorbar": { "ticks": "", "outlinewidth": 0 } }, "type": "scatter3d", "marker": { "colorbar": { "ticks": "", "outlinewidth": 0 } } } ], "scattergl": [ { "type": "scattergl", "marker": { "colorbar": { "ticks": "", "outlinewidth": 0 } } } ], "choropleth": [ { "type": "choropleth", "colorbar": { "ticks": "", "outlinewidth": 0 } } ], "scattergeo": [ { "type": "scattergeo", "marker": { "colorbar": { "ticks": "", "outlinewidth": 0 } } } ], "histogram2d": [ { "type": "histogram2d", "colorbar": { "ticks": "", "outlinewidth": 0 }, "colorscale": [ [ 0.0, "#0d0887" ], [ 0.1111111111111111, "#46039f" ], [ 0.2222222222222222, "#7201a8" ], [ 0.3333333333333333, "#9c179e" ], [ 0.4444444444444444, "#bd3786" ], [ 0.5555555555555556, "#d8576b" ], [ 0.6666666666666666, "#ed7953" ], [ 0.7777777777777778, "#fb9f3a" ], [ 0.8888888888888888, "#fdca26" ], [ 1.0, "#f0f921" ] ] } ], "scatterpolar": [ { "type": "scatterpolar", "marker": { "colorbar": { "ticks": "", "outlinewidth": 0 } } } ], "contourcarpet": [ { "type": "contourcarpet", "colorbar": { "ticks": "", "outlinewidth": 0 } } ], "scattercarpet": [ { "type": "scattercarpet", "marker": { "colorbar": { "ticks": "", "outlinewidth": 0 } } } ], "scattermapbox": [ { "type": "scattermapbox", "marker": { "colorbar": { "ticks": "", "outlinewidth": 0 } } } ], "scatterpolargl": [ { "type": "scatterpolargl", "marker": { "colorbar": { "ticks": "", "outlinewidth": 0 } } } ], "scatterternary": [ { "type": "scatterternary", "marker": { "colorbar": { "ticks": "", "outlinewidth": 0 } } } ], "histogram2dcontour": [ { "type": "histogram2dcontour", "colorbar": { "ticks": "", "outlinewidth": 0 }, "colorscale": [ [ 0.0, "#0d0887" ], [ 0.1111111111111111, "#46039f" ], [ 0.2222222222222222, "#7201a8" ], [ 0.3333333333333333, "#9c179e" ], [ 0.4444444444444444, "#bd3786" ], [ 0.5555555555555556, "#d8576b" ], [ 0.6666666666666666, "#ed7953" ], [ 0.7777777777777778, "#fb9f3a" ], [ 0.8888888888888888, "#fdca26" ], [ 1.0, "#f0f921" ] ] } ] }, "layout": { "geo": { "bgcolor": "white", "showland": true, "lakecolor": "white", "landcolor": "#E5ECF6", "showlakes": true, "subunitcolor": "white" }, "font": { "color": "#2a3f5f" }, "polar": { "bgcolor": "#E5ECF6", "radialaxis": { "ticks": "", "gridcolor": "white", "linecolor": "white" }, "angularaxis": { "ticks": "", "gridcolor": "white", "linecolor": "white" } }, "scene": { "xaxis": { "ticks": "", "gridcolor": "white", "gridwidth": 2, "linecolor": "white", "zerolinecolor": "white", "showbackground": true, "backgroundcolor": "#E5ECF6" }, "yaxis": { "ticks": "", "gridcolor": "white", "gridwidth": 2, "linecolor": "white", "zerolinecolor": "white", "showbackground": true, "backgroundcolor": "#E5ECF6" }, "zaxis": { "ticks": "", "gridcolor": "white", "gridwidth": 2, "linecolor": "white", "zerolinecolor": "white", "showbackground": true, "backgroundcolor": "#E5ECF6" } }, "title": { "x": 0.05 }, "xaxis": { "ticks": "", "title": { "standoff": 15 }, "gridcolor": "white", "linecolor": "white", "automargin": true, "zerolinecolor": "white", "zerolinewidth": 2 }, "yaxis": { "ticks": "", "title": { "standoff": 15 }, "gridcolor": "white", "linecolor": "white", "automargin": true, "zerolinecolor": "white", "zerolinewidth": 2 }, "mapbox": { "style": "light" }, "ternary": { "aaxis": { "ticks": "", "gridcolor": "white", "linecolor": "white" }, "baxis": { "ticks": "", "gridcolor": "white", "linecolor": "white" }, "caxis": { "ticks": "", "gridcolor": "white", "linecolor": "white" }, "bgcolor": "#E5ECF6" }, "colorway": [ "#636efa", "#EF553B", "#00cc96", "#ab63fa", "#FFA15A", "#19d3f3", "#FF6692", "#B6E880", "#FF97FF", "#FECB52" ], "coloraxis": { "colorbar": { "ticks": "", "outlinewidth": 0 } }, "hovermode": "closest", "colorscale": { "diverging": [ [ 0, "#8e0152" ], [ 0.1, "#c51b7d" ], [ 0.2, "#de77ae" ], [ 0.3, "#f1b6da" ], [ 0.4, "#fde0ef" ], [ 0.5, "#f7f7f7" ], [ 0.6, "#e6f5d0" ], [ 0.7, "#b8e186" ], [ 0.8, "#7fbc41" ], [ 0.9, "#4d9221" ], [ 1, "#276419" ] ], "sequential": [ [ 0.0, "#0d0887" ], [ 0.1111111111111111, "#46039f" ], [ 0.2222222222222222, "#7201a8" ], [ 0.3333333333333333, "#9c179e" ], [ 0.4444444444444444, "#bd3786" ], [ 0.5555555555555556, "#d8576b" ], [ 0.6666666666666666, "#ed7953" ], [ 0.7777777777777778, "#fb9f3a" ], [ 0.8888888888888888, "#fdca26" ], [ 1.0, "#f0f921" ] ], "sequentialminus": [ [ 0.0, "#0d0887" ], [ 0.1111111111111111, "#46039f" ], [ 0.2222222222222222, "#7201a8" ], [ 0.3333333333333333, "#9c179e" ], [ 0.4444444444444444, "#bd3786" ], [ 0.5555555555555556, "#d8576b" ], [ 0.6666666666666666, "#ed7953" ], [ 0.7777777777777778, "#fb9f3a" ], [ 0.8888888888888888, "#fdca26" ], [ 1.0, "#f0f921" ] ] }, "hoverlabel": { "align": "left" }, "plot_bgcolor": "#E5ECF6", "paper_bgcolor": "white", "shapedefaults": { "line": { "color": "#2a3f5f" } }, "autotypenumbers": "strict", "annotationdefaults": { "arrowhead": 0, "arrowcolor": "#2a3f5f", "arrowwidth": 1 } } } } }, "height": null, "width": null, "user": { "profile_url": "https://chart-studio.plotly.com/~Raell", "avatar_url": "https://storage.googleapis.com/plotly-prod-profiles/30.jpg", "background_url": "https://storage.googleapis.com/plotly-prod-profiles/bg-3.jpg", "bio": "", "nickname": "", "website": "", "stream_tokens": null, "feature_set_id": null, "csrf_token": null, "date_joined": "2024-04-01 09:43:28", "mapbox_access_tokens": null, "has_password": null, "username": "Raell", "email": null, "is_active": null, "readonly": null, "is_dash_creator": null, "dash_created_count": null, "is_chart_creator": null, "charts_created_count": null } }, { "creation_time": "2024-04-03T09:55:24.291544Z", "comments": { "results": [], "count": 0 }, "parented": true, "embed_url": "https://chart-studio.plotly.com/~Raell/60.embed", "fid": "Raell:60", "filename": "eeth-token-distribution-20240403175516", "filetype": "plot", "img_url": "https://storage.googleapis.com/plotly-prod-images/Raell/60/9_A04SPOGEOGFX0Y72HT9SMX58ZBIDWF.png", "image_urls": { "default": "https://storage.googleapis.com/plotly-prod-images/Raell/60/2_652DR6A7K0EJZ29R9D8S7J2SCZSI3Y.png", "block-thumb": "https://storage.googleapis.com/plotly-prod-images/Raell/60/8_3CC9I7EVOEN31WW3BYZZH59F9TY8K7.png", "list-thumb": "https://storage.googleapis.com/plotly-prod-images/Raell/60/9_A04SPOGEOGFX0Y72HT9SMX58ZBIDWF.png" }, "api_urls": { "files": "https://api.plotly.com/v2/files/Raell:60", "plots": "https://api.plotly.com/v2/plots/Raell:60", "parent": "https://api.plotly.com/v2/folders/home?user=Raell" }, "owner": "Raell", "parent": -1, "preview": "", "referencers": [], "references": [], "title": "", "views": 3, "web_url": "https://chart-studio.plotly.com/~Raell/60/", "world_readable": true, "date_modified": "2024-04-03T09:55:24.303Z", "stars": { "results": [], "count": 0 }, "collaborators": { "results": [], "count": 0 }, "subfolder_count": null, "refresh_interval": null, "organize_view_url": "https://chart-studio.plotly.com/~Raell/60/", "current_user_permission": "read", "is_theme": null, "is_template": null, "autosize": true, "caption": "", "figure": { "data": [ { "type": "sunburst", "idssrc": "Raell:59:6c7039", "marker": { "colorssrc": "Raell:59:bd81d1" }, "hoverinfo": "text", "labelssrc": "Raell:59:bde75d", "valuessrc": "Raell:59:3c4cc4", "parentssrc": "Raell:59:c891f4", "branchvalues": "total", "hovertextsrc": "Raell:59:b62ec2" } ], "layout": { "title": { "x": 0.5, "text": "EETH Token Distribution" }, "margin": { "b": 0, "l": 0, "r": 0, "t": 0 }, "template": { "data": { "bar": [ { "type": "bar", "marker": { "line": { "color": "#E5ECF6", "width": 0.5 }, "pattern": { "size": 10, "fillmode": "overlay", "solidity": 0.2 } }, "error_x": { "color": "#2a3f5f" }, "error_y": { "color": "#2a3f5f" } } ], "pie": [ { "type": "pie", "automargin": true } ], "table": [ { "type": "table", "cells": { "fill": { "color": "#EBF0F8" }, "line": { "color": "white" } }, "header": { "fill": { "color": "#C8D4E3" }, "line": { "color": "white" } } } ], "carpet": [ { "type": "carpet", "aaxis": { "gridcolor": "white", "linecolor": "white", "endlinecolor": "#2a3f5f", "minorgridcolor": "white", "startlinecolor": "#2a3f5f" }, "baxis": { "gridcolor": "white", "linecolor": "white", "endlinecolor": "#2a3f5f", "minorgridcolor": "white", "startlinecolor": "#2a3f5f" } } ], "mesh3d": [ { "type": "mesh3d", "colorbar": { "ticks": "", "outlinewidth": 0 } } ], "contour": [ { "type": "contour", "colorbar": { "ticks": "", "outlinewidth": 0 }, "colorscale": [ [ 0.0, "#0d0887" ], [ 0.1111111111111111, "#46039f" ], [ 0.2222222222222222, "#7201a8" ], [ 0.3333333333333333, "#9c179e" ], [ 0.4444444444444444, "#bd3786" ], [ 0.5555555555555556, "#d8576b" ], [ 0.6666666666666666, "#ed7953" ], [ 0.7777777777777778, "#fb9f3a" ], [ 0.8888888888888888, "#fdca26" ], [ 1.0, "#f0f921" ] ] } ], "heatmap": [ { "type": "heatmap", "colorbar": { "ticks": "", "outlinewidth": 0 }, "colorscale": [ [ 0.0, "#0d0887" ], [ 0.1111111111111111, "#46039f" ], [ 0.2222222222222222, "#7201a8" ], [ 0.3333333333333333, "#9c179e" ], [ 0.4444444444444444, "#bd3786" ], [ 0.5555555555555556, "#d8576b" ], [ 0.6666666666666666, "#ed7953" ], [ 0.7777777777777778, "#fb9f3a" ], [ 0.8888888888888888, "#fdca26" ], [ 1.0, "#f0f921" ] ] } ], "scatter": [ { "type": "scatter", "fillpattern": { "size": 10, "fillmode": "overlay", "solidity": 0.2 } } ], "surface": [ { "type": "surface", "colorbar": { "ticks": "", "outlinewidth": 0 }, "colorscale": [ [ 0.0, "#0d0887" ], [ 0.1111111111111111, "#46039f" ], [ 0.2222222222222222, "#7201a8" ], [ 0.3333333333333333, "#9c179e" ], [ 0.4444444444444444, "#bd3786" ], [ 0.5555555555555556, "#d8576b" ], [ 0.6666666666666666, "#ed7953" ], [ 0.7777777777777778, "#fb9f3a" ], [ 0.8888888888888888, "#fdca26" ], [ 1.0, "#f0f921" ] ] } ], "barpolar": [ { "type": "barpolar", "marker": { "line": { "color": "#E5ECF6", "width": 0.5 }, "pattern": { "size": 10, "fillmode": "overlay", "solidity": 0.2 } } } ], "heatmapgl": [ { "type": "heatmapgl", "colorbar": { "ticks": "", "outlinewidth": 0 }, "colorscale": [ [ 0.0, "#0d0887" ], [ 0.1111111111111111, "#46039f" ], [ 0.2222222222222222, "#7201a8" ], [ 0.3333333333333333, "#9c179e" ], [ 0.4444444444444444, "#bd3786" ], [ 0.5555555555555556, "#d8576b" ], [ 0.6666666666666666, "#ed7953" ], [ 0.7777777777777778, "#fb9f3a" ], [ 0.8888888888888888, "#fdca26" ], [ 1.0, "#f0f921" ] ] } ], "histogram": [ { "type": "histogram", "marker": { "pattern": { "size": 10, "fillmode": "overlay", "solidity": 0.2 } } } ], "parcoords": [ { "line": { "colorbar": { "ticks": "", "outlinewidth": 0 } }, "type": "parcoords" } ], "scatter3d": [ { "line": { "colorbar": { "ticks": "", "outlinewidth": 0 } }, "type": "scatter3d", "marker": { "colorbar": { "ticks": "", "outlinewidth": 0 } } } ], "scattergl": [ { "type": "scattergl", "marker": { "colorbar": { "ticks": "", "outlinewidth": 0 } } } ], "choropleth": [ { "type": "choropleth", "colorbar": { "ticks": "", "outlinewidth": 0 } } ], "scattergeo": [ { "type": "scattergeo", "marker": { "colorbar": { "ticks": "", "outlinewidth": 0 } } } ], "histogram2d": [ { "type": "histogram2d", "colorbar": { "ticks": "", "outlinewidth": 0 }, "colorscale": [ [ 0.0, "#0d0887" ], [ 0.1111111111111111, "#46039f" ], [ 0.2222222222222222, "#7201a8" ], [ 0.3333333333333333, "#9c179e" ], [ 0.4444444444444444, "#bd3786" ], [ 0.5555555555555556, "#d8576b" ], [ 0.6666666666666666, "#ed7953" ], [ 0.7777777777777778, "#fb9f3a" ], [ 0.8888888888888888, "#fdca26" ], [ 1.0, "#f0f921" ] ] } ], "scatterpolar": [ { "type": "scatterpolar", "marker": { "colorbar": { "ticks": "", "outlinewidth": 0 } } } ], "contourcarpet": [ { "type": "contourcarpet", "colorbar": { "ticks": "", "outlinewidth": 0 } } ], "scattercarpet": [ { "type": "scattercarpet", "marker": { "colorbar": { "ticks": "", "outlinewidth": 0 } } } ], "scattermapbox": [ { "type": "scattermapbox", "marker": { "colorbar": { "ticks": "", "outlinewidth": 0 } } } ], "scatterpolargl": [ { "type": "scatterpolargl", "marker": { "colorbar": { "ticks": "", "outlinewidth": 0 } } } ], "scatterternary": [ { "type": "scatterternary", "marker": { "colorbar": { "ticks": "", "outlinewidth": 0 } } } ], "histogram2dcontour": [ { "type": "histogram2dcontour", "colorbar": { "ticks": "", "outlinewidth": 0 }, "colorscale": [ [ 0.0, "#0d0887" ], [ 0.1111111111111111, "#46039f" ], [ 0.2222222222222222, "#7201a8" ], [ 0.3333333333333333, "#9c179e" ], [ 0.4444444444444444, "#bd3786" ], [ 0.5555555555555556, "#d8576b" ], [ 0.6666666666666666, "#ed7953" ], [ 0.7777777777777778, "#fb9f3a" ], [ 0.8888888888888888, "#fdca26" ], [ 1.0, "#f0f921" ] ] } ] }, "layout": { "geo": { "bgcolor": "white", "showland": true, "lakecolor": "white", "landcolor": "#E5ECF6", "showlakes": true, "subunitcolor": "white" }, "font": { "color": "#2a3f5f" }, "polar": { "bgcolor": "#E5ECF6", "radialaxis": { "ticks": "", "gridcolor": "white", "linecolor": "white" }, "angularaxis": { "ticks": "", "gridcolor": "white", "linecolor": "white" } }, "scene": { "xaxis": { "ticks": "", "gridcolor": "white", "gridwidth": 2, "linecolor": "white", "zerolinecolor": "white", "showbackground": true, "backgroundcolor": "#E5ECF6" }, "yaxis": { "ticks": "", "gridcolor": "white", "gridwidth": 2, "linecolor": "white", "zerolinecolor": "white", "showbackground": true, "backgroundcolor": "#E5ECF6" }, "zaxis": { "ticks": "", "gridcolor": "white", "gridwidth": 2, "linecolor": "white", "zerolinecolor": "white", "showbackground": true, "backgroundcolor": "#E5ECF6" } }, "title": { "x": 0.05 }, "xaxis": { "ticks": "", "title": { "standoff": 15 }, "gridcolor": "white", "linecolor": "white", "automargin": true, "zerolinecolor": "white", "zerolinewidth": 2 }, "yaxis": { "ticks": "", "title": { "standoff": 15 }, "gridcolor": "white", "linecolor": "white", "automargin": true, "zerolinecolor": "white", "zerolinewidth": 2 }, "mapbox": { "style": "light" }, "ternary": { "aaxis": { "ticks": "", "gridcolor": "white", "linecolor": "white" }, "baxis": { "ticks": "", "gridcolor": "white", "linecolor": "white" }, "caxis": { "ticks": "", "gridcolor": "white", "linecolor": "white" }, "bgcolor": "#E5ECF6" }, "colorway": [ "#636efa", "#EF553B", "#00cc96", "#ab63fa", "#FFA15A", "#19d3f3", "#FF6692", "#B6E880", "#FF97FF", "#FECB52" ], "coloraxis": { "colorbar": { "ticks": "", "outlinewidth": 0 } }, "hovermode": "closest", "colorscale": { "diverging": [ [ 0, "#8e0152" ], [ 0.1, "#c51b7d" ], [ 0.2, "#de77ae" ], [ 0.3, "#f1b6da" ], [ 0.4, "#fde0ef" ], [ 0.5, "#f7f7f7" ], [ 0.6, "#e6f5d0" ], [ 0.7, "#b8e186" ], [ 0.8, "#7fbc41" ], [ 0.9, "#4d9221" ], [ 1, "#276419" ] ], "sequential": [ [ 0.0, "#0d0887" ], [ 0.1111111111111111, "#46039f" ], [ 0.2222222222222222, "#7201a8" ], [ 0.3333333333333333, "#9c179e" ], [ 0.4444444444444444, "#bd3786" ], [ 0.5555555555555556, "#d8576b" ], [ 0.6666666666666666, "#ed7953" ], [ 0.7777777777777778, "#fb9f3a" ], [ 0.8888888888888888, "#fdca26" ], [ 1.0, "#f0f921" ] ], "sequentialminus": [ [ 0.0, "#0d0887" ], [ 0.1111111111111111, "#46039f" ], [ 0.2222222222222222, "#7201a8" ], [ 0.3333333333333333, "#9c179e" ], [ 0.4444444444444444, "#bd3786" ], [ 0.5555555555555556, "#d8576b" ], [ 0.6666666666666666, "#ed7953" ], [ 0.7777777777777778, "#fb9f3a" ], [ 0.8888888888888888, "#fdca26" ], [ 1.0, "#f0f921" ] ] }, "hoverlabel": { "align": "left" }, "plot_bgcolor": "#E5ECF6", "paper_bgcolor": "white", "shapedefaults": { "line": { "color": "#2a3f5f" } }, "autotypenumbers": "strict", "annotationdefaults": { "arrowhead": 0, "arrowcolor": "#2a3f5f", "arrowwidth": 1 } } } } }, "height": null, "width": null, "user": { "profile_url": "https://chart-studio.plotly.com/~Raell", "avatar_url": "https://storage.googleapis.com/plotly-prod-profiles/30.jpg", "background_url": "https://storage.googleapis.com/plotly-prod-profiles/bg-3.jpg", "bio": "", "nickname": "", "website": "", "stream_tokens": null, "feature_set_id": null, "csrf_token": null, "date_joined": "2024-04-01 09:43:28", "mapbox_access_tokens": null, "has_password": null, "username": "Raell", "email": null, "is_active": null, "readonly": null, "is_dash_creator": null, "dash_created_count": null, "is_chart_creator": null, "charts_created_count": null } } ] }
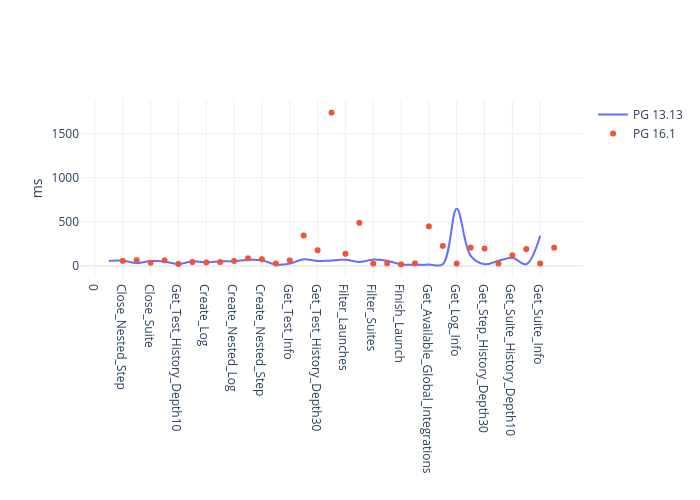
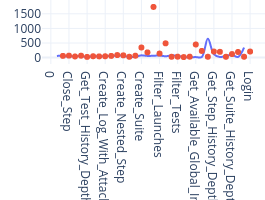
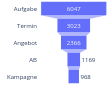
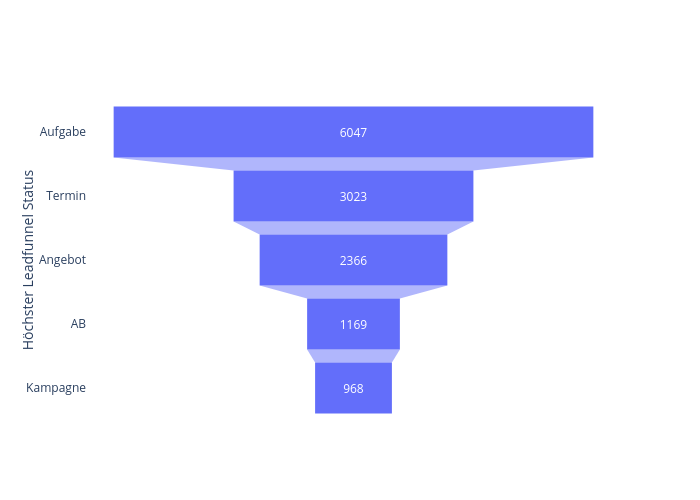