Plots List
Plots
This endpoint handles manipulation of Plotly plot files.
Reference
Authorization
Any user with or without a Plotly account may view public plots. For private plots, see authentication.
Actions
list
Listing all public plots can be done via a GET request to this endpoint.
By default, plots will be listed in order of date created. The order_by
query parameter is accepted at this endpoint. Currently, only ordering by
views is supported. It is possible to filter the plots by quality
with min_quality or max_quality as query parameter.
Example:
// GET https://api.plotly.com/v2/plots/ ---> 200

// GET https://api.plotly.com/v2/plots/?order_by=-views ---> 200

// GET https://api.plotly.com/v2/plots/?min_quality=5 ---> 200

// GET https://api.plotly.com/v2/plots/?max_quality=5 ---> 200
feed
Listing all handpicked feed plots can be done via a GET request to this endpoint. By default, plots will be listed in a random order.
Example:
// GET https://api.plotly.com/v2/plots/feed ---> 200
create
You can create new plot resources here. The only required field is 'figure'. Currently, the figure is restricted to only contain references to grid data. That is, this will fail if raw data arrays are passed in. To create and manipulate underlying grids for plots, see the grids endpoint.
Example:
// This fails because a figure field is required.
// POST https://api.plotly.com/v2/plots ---> 400 Bad Request
{}

// This fails because the figure has raw data
//POST https://api.plotly.com/v2/plots ---> 400 Bad Request
{
    "figure": {"data": [{"y": ['this', 'is', 'raw', 'data']}]}
}

// This succeeds because the figure has src keys, not raw data.
//POST https://api.plotly.com/v2/plots ---> 200 OK
{
    "figure": {"data": [{"ysrc": "sven:88:u8nd62"}]}
}
When creating a grid, you can optionally specify a source_fid to specify where a plot has come from:
- source_fid: the fid of a plot that was copied (and presumably edited) to produce this one
detail
There is a lot of meta information stored about plot files including filename, title, share_url, and content_url to name a few.
This information can only be reached with a GET to this endpoint.
Example:
// GET https://api.plotly.com/v2/plots/iheartgraphs:90
content
The contents of a plot can be downloaded via the content resource. The plot
content contains referenced grid/column data by default. If you wish to
return the raw grid/column data, the inline_data=true query must be included
in the request url. The Content-Type header will be appropriately set for the
response body.
Alternatively, you can set ?map_data=unreadable to append a mapping of
sources to data that belongs to grids which are unreadable for the
requestor. This is useful when you have read access to another users plot,
but that plot contains grid references which you don't have access to.
Examples:
// Returns referenced grid/column data
// GET https://api.plotly.com/v2/plots/iheartgraphs:90/content ---> 200 OK

// Returns full grid/column data
// GET https://api.plotly.com/v2/plots/iheartgraphs:90/content?inline_data=true ---> 200 OK

// Returns full grid/column data when requestor doesn't have permission
// to read the referenced grid.
// GET https://api.plotly.com/v2/plots/iheartgraphs:90/content?map_data=unreadable ---> 200 OK
GET /v2/plots?cursor=cj0xJnA9MjAyNC0wNC0wMyswNiUzQTAyJTNBNDEuNjg1MjQ0JTJCMDAlM0EwMA%3D%3D&format=api
{ "next": "https://api.plot.ly/v2/plots?cursor=cD0yMDI0LTA0LTAzKzA2JTNBMDYlM0E1Ny43MTU3NzMlMkIwMCUzQTAw&format=api", "previous": "https://api.plot.ly/v2/plots?cursor=cj0xJnA9MjAyNC0wNC0wMyswNyUzQTEwJTNBMjUuMzQyMTA1JTJCMDAlM0EwMA%3D%3D&format=api", "results": [ { "creation_time": "2024-04-03T07:10:25.342105Z", "comments": { "results": [], "count": 0 }, "parented": true, "embed_url": "https://chart-studio.plotly.com/~555043/43.embed", "fid": "555043:43", "filename": "potato", "filetype": "plot", "img_url": "https://storage.googleapis.com/plotly-prod-images/555043/43/9_RU7799P0CCMSURW9TS3SAWTR22O82R.png", "image_urls": { "default": "https://storage.googleapis.com/plotly-prod-images/555043/43/2_KRJ6PP8TIN0LFOZISGTBCZDYDPAK6D.png", "block-thumb": "https://storage.googleapis.com/plotly-prod-images/555043/43/8_OARKLR1EL4GVW2DWDBYHG8KA70W76M.png", "list-thumb": "https://storage.googleapis.com/plotly-prod-images/555043/43/9_RU7799P0CCMSURW9TS3SAWTR22O82R.png" }, "api_urls": { "files": "https://api.plotly.com/v2/files/555043:43", "plots": "https://api.plotly.com/v2/plots/555043:43", "parent": "https://api.plotly.com/v2/folders/home?user=555043" }, "owner": "555043", "parent": -1, "preview": "", "referencers": [], "references": [], "title": "", "views": 2, "web_url": "https://chart-studio.plotly.com/~555043/43/", "world_readable": true, "date_modified": "2024-04-03T07:10:25.351Z", "stars": { "results": [], "count": 0 }, "collaborators": { "results": [], "count": 0 }, "subfolder_count": null, "refresh_interval": null, "organize_view_url": "https://chart-studio.plotly.com/~555043/43/", "current_user_permission": "read", "is_theme": null, "is_template": false, "autosize": true, "caption": "", "figure": { "data": [ { "uid": "1404f3", "meta": { "columnNames": { "x": "concentration", "y": "red" } }, "mode": "markers+lines", "name": "Red potato", "type": "scatter", "xsrc": "555043:42:dbe976", "ysrc": "555043:42:e5c9d8", "showlegend": false }, { "uid": "5a9d9d", "meta": { "columnNames": { "x": "concentration", "y": "gold" } }, "mode": "markers+lines", "name": "Yukon Gold potato", "type": "scatter", "xsrc": "555043:42:dbe976", "ysrc": "555043:42:e4c539", "showlegend": false, "stackgroup": null }, { "uid": "2f10ff", "meta": { "columnNames": { "x": "concentration", "y": "sweet" } }, "mode": "markers+lines", "name": "Sweet potato", "type": "scatter", "xsrc": "555043:42:dbe976", "ysrc": "555043:42:51857d", "showlegend": false, "stackgroup": null }, { "uid": "72a59d", "name": "Red potato", "transforms": [ { "rms": "", "type": "fit", "inputUid": "1404f3", "regressor": "x", "parameters": [ { "hold": false, "name": "m", "error": 4.913501806247518, "value": -52.649999999999935 }, { "hold": false, "name": "b", "error": 2.407114455110201, "value": 22.359999999999975 } ], "regressand": "y", "correlation": "", "fitfunction": "m*x + b", "inputxrange": [], "outputxrange": [], "interpolation": 50 } ] }, { "uid": "91029f", "name": "Yukon Gold potato", "transforms": [ { "rms": "", "type": "fit", "inputUid": "5a9d9d", "regressor": "x", "parameters": [ { "hold": false, "name": "m", "error": 1.5107944929736516, "value": -67.85 }, { "hold": false, "name": "b", "error": 0.7401351227984609, "value": 36.32 } ], "regressand": "y", "correlation": "", "fitfunction": "m*x + b", "inputxrange": [], "outputxrange": [], "interpolation": 50 } ] }, { "uid": "1dfd96", "name": " Sweet potato", "transforms": [ { "rms": "", "type": "fit", "inputUid": "2f10ff", "regressor": "x", "parameters": [ { "hold": false, "name": "m", "error": 2.5263610193321573, "value": -18.150000000000023 }, { "hold": false, "name": "b", "error": 1.2376590806841186, "value": 36.180000000000014 } ], "regressand": "y", "correlation": "", "fitfunction": "m*x + b", "inputxrange": [], "outputxrange": [], "interpolation": 50 } ] } ], "frames": [], "layout": { "title": { "text": "<br>" }, "xaxis": { "type": "linear", "range": [ -0.05243230289959263, 0.8524323028995927 ], "title": { "text": "Sucrose Solution Concentration (M)" }, "autorange": true }, "yaxis": { "type": "linear", "range": [ -26.46598498162646, 46.71695158971082 ], "title": { "text": "Percent Change in Mass of Potatos (%)" }, "autorange": true }, "autosize": true, "template": { "data": { "bar": [ { "type": "bar", "marker": { "colorbar": { "ticks": "", "outlinewidth": 0 } } } ], "table": [ { "type": "table", "cells": { "fill": { "color": "#EBF0F8" }, "line": { "color": "white" } }, "header": { "fill": { "color": "#C8D4E3" }, "line": { "color": "white" } } } ], "carpet": [ { "type": "carpet", "aaxis": { "gridcolor": "#C8D4E3", "linecolor": "#C8D4E3", "endlinecolor": "#2a3f5f", "minorgridcolor": "#C8D4E3", "startlinecolor": "#2a3f5f" }, "baxis": { "gridcolor": "#C8D4E3", "linecolor": "#C8D4E3", "endlinecolor": "#2a3f5f", "minorgridcolor": "#C8D4E3", "startlinecolor": "#2a3f5f" } } ], "mesh3d": [ { "type": "mesh3d", "colorbar": { "ticks": "", "outlinewidth": 0 } } ], "contour": [ { "type": "contour", "colorbar": { "ticks": "", "outlinewidth": 0 }, "autocolorscale": true } ], "heatmap": [ { "type": "heatmap", "colorbar": { "ticks": "", "outlinewidth": 0 }, "autocolorscale": true } ], "scatter": [ { "type": "scatter", "marker": { "colorbar": { "ticks": "", "outlinewidth": 0 } } } ], "surface": [ { "type": "surface", "colorbar": { "ticks": "", "outlinewidth": 0 } } ], "heatmapgl": [ { "type": "heatmapgl", "colorbar": { "ticks": "", "outlinewidth": 0 } } ], "histogram": [ { "type": "histogram", "marker": { "colorbar": { "ticks": "", "outlinewidth": 0 } } } ], "parcoords": [ { "line": { "colorbar": { "ticks": "", "outlinewidth": 0 } }, "type": "parcoords" } ], "scatter3d": [ { "type": "scatter3d", "marker": { "colorbar": { "ticks": "", "outlinewidth": 0 } } } ], "scattergl": [ { "type": "scattergl", "marker": { "colorbar": { "ticks": "", "outlinewidth": 0 } } } ], "choropleth": [ { "type": "choropleth", "colorbar": { "ticks": "", "outlinewidth": 0 } } ], "scattergeo": [ { "type": "scattergeo", "marker": { "colorbar": { "ticks": "", "outlinewidth": 0 } } } ], "histogram2d": [ { "type": "histogram2d", "colorbar": { "ticks": "", "outlinewidth": 0 }, "autocolorscale": true } ], "scatterpolar": [ { "type": "scatterpolar", "marker": { "colorbar": { "ticks": "", "outlinewidth": 0 } } } ], "contourcarpet": [ { "type": "contourcarpet", "colorbar": { "ticks": "", "outlinewidth": 0 } } ], "scattercarpet": [ { "type": "scattercarpet", "marker": { "colorbar": { "ticks": "", "outlinewidth": 0 } } } ], "scattermapbox": [ { "type": "scattermapbox", "marker": { "colorbar": { "ticks": "", "outlinewidth": 0 } } } ], "scatterpolargl": [ { "type": "scatterpolargl", "marker": { "colorbar": { "ticks": "", "outlinewidth": 0 } } } ], "scatterternary": [ { "type": "scatterternary", "marker": { "colorbar": { "ticks": "", "outlinewidth": 0 } } } ], "histogram2dcontour": [ { "type": "histogram2dcontour", "colorbar": { "ticks": "", "outlinewidth": 0 }, "autocolorscale": true } ] }, "layout": { "geo": { "bgcolor": "white", "showland": true, "lakecolor": "white", "landcolor": "white", "showlakes": true, "subunitcolor": "#C8D4E3" }, "font": { "color": "#2a3f5f" }, "polar": { "bgcolor": "white", "radialaxis": { "ticks": "", "gridcolor": "#EBF0F8", "linecolor": "#EBF0F8" }, "angularaxis": { "ticks": "", "gridcolor": "#EBF0F8", "linecolor": "#EBF0F8" } }, "scene": { "xaxis": { "ticks": "", "gridcolor": "#DFE8F3", "gridwidth": 2, "linecolor": "#EBF0F8", "zerolinecolor": "#EBF0F8", "showbackground": true, "backgroundcolor": "white" }, "yaxis": { "ticks": "", "gridcolor": "#DFE8F3", "gridwidth": 2, "linecolor": "#EBF0F8", "zerolinecolor": "#EBF0F8", "showbackground": true, "backgroundcolor": "white" }, "zaxis": { "ticks": "", "gridcolor": "#DFE8F3", "gridwidth": 2, "linecolor": "#EBF0F8", "zerolinecolor": "#EBF0F8", "showbackground": true, "backgroundcolor": "white" } }, "title": { "x": 0.05 }, "xaxis": { "ticks": "", "gridcolor": "#EBF0F8", "linecolor": "#EBF0F8", "automargin": true, "zerolinecolor": "#EBF0F8", "zerolinewidth": 2 }, "yaxis": { "ticks": "", "gridcolor": "#EBF0F8", "linecolor": "#EBF0F8", "automargin": true, "zerolinecolor": "#EBF0F8", "zerolinewidth": 2 }, "ternary": { "aaxis": { "ticks": "", "gridcolor": "#DFE8F3", "linecolor": "#A2B1C6" }, "baxis": { "ticks": "", "gridcolor": "#DFE8F3", "linecolor": "#A2B1C6" }, "caxis": { "ticks": "", "gridcolor": "#DFE8F3", "linecolor": "#A2B1C6" }, "bgcolor": "white" }, "colorway": [ "#636efa", "#EF553B", "#00cc96", "#ab63fa", "#19d3f3", "#e763fa", "#fecb52", "#ffa15a", "#ff6692", "#b6e880" ], "hovermode": "closest", "colorscale": { "diverging": [ [ 0, "#8e0152" ], [ 0.1, "#c51b7d" ], [ 0.2, "#de77ae" ], [ 0.3, "#f1b6da" ], [ 0.4, "#fde0ef" ], [ 0.5, "#f7f7f7" ], [ 0.6, "#e6f5d0" ], [ 0.7, "#b8e186" ], [ 0.8, "#7fbc41" ], [ 0.9, "#4d9221" ], [ 1, "#276419" ] ], "sequential": [ [ 0, "#0508b8" ], [ 0.0893854748603352, "#1910d8" ], [ 0.1787709497206704, "#3c19f0" ], [ 0.2681564245810056, "#6b1cfb" ], [ 0.3575418994413408, "#981cfd" ], [ 0.44692737430167595, "#bf1cfd" ], [ 0.5363128491620112, "#dd2bfd" ], [ 0.6256983240223464, "#f246fe" ], [ 0.7150837988826816, "#fc67fd" ], [ 0.8044692737430168, "#fe88fc" ], [ 0.8938547486033519, "#fea5fd" ], [ 0.9832402234636871, "#febefe" ], [ 1, "#fec3fe" ] ], "sequentialminus": [ [ 0, "#0508b8" ], [ 0.0893854748603352, "#1910d8" ], [ 0.1787709497206704, "#3c19f0" ], [ 0.2681564245810056, "#6b1cfb" ], [ 0.3575418994413408, "#981cfd" ], [ 0.44692737430167595, "#bf1cfd" ], [ 0.5363128491620112, "#dd2bfd" ], [ 0.6256983240223464, "#f246fe" ], [ 0.7150837988826816, "#fc67fd" ], [ 0.8044692737430168, "#fe88fc" ], [ 0.8938547486033519, "#fea5fd" ], [ 0.9832402234636871, "#febefe" ], [ 1, "#fec3fe" ] ] }, "plot_bgcolor": "white", "paper_bgcolor": "white", "shapedefaults": { "line": { "width": 0 }, "opacity": 0.4, "fillcolor": "#506784" }, "annotationdefaults": { "arrowhead": 0, "arrowcolor": "#506784", "arrowwidth": 1 } }, "themeRef": "PLOTLY_WHITE" }, "annotations": [ { "x": 0.3731607955907022, "y": -5.133884297520659, "ax": -74, "ay": 11, "font": { "size": 16 }, "text": "r=-0.99<br>r2=0.97" }, { "x": 0.5821231727773785, "y": 28.07272727272727, "ax": 48, "ay": -30, "font": { "size": 16 }, "text": "r=-0.97<br>r2=0.95" }, { "ax": 60, "ay": -20, "font": { "size": 16 }, "text": "r=-1.00<br>r2=1.00" } ] } }, "height": null, "width": null, "user": { "profile_url": "https://chart-studio.plotly.com/~555043", "avatar_url": "https://storage.googleapis.com/plotly-prod-profiles/68.jpg", "background_url": "https://storage.googleapis.com/plotly-prod-profiles/bg-14.jpg", "bio": "", "nickname": "", "website": "", "stream_tokens": null, "feature_set_id": null, "csrf_token": null, "date_joined": "2021-10-07 16:49:02", "mapbox_access_tokens": null, "has_password": null, "username": "555043", "email": null, "is_active": null, "readonly": null, "is_dash_creator": null, "dash_created_count": null, "is_chart_creator": null, "charts_created_count": null } }, { "creation_time": "2024-04-03T06:57:13.445964Z", "comments": { "results": [], "count": 0 }, "parented": true, "embed_url": "https://chart-studio.plotly.com/~AR181RA/5.embed", "fid": "AR181RA:5", "filename": "Plot 5", "filetype": "plot", "img_url": "https://storage.googleapis.com/plotly-prod-images/AR181RA/5/9_AUESG4RDWV6274TPTEMEMHY5J7ZT9H.png", "image_urls": { "default": "https://storage.googleapis.com/plotly-prod-images/AR181RA/5/2_FBEU63QRRMIA5PKXNT7F8VHX97MCMW.png", "block-thumb": "https://storage.googleapis.com/plotly-prod-images/AR181RA/5/8_854WFRNN5FC81FY11GPKY5NJ335KTS.png", "list-thumb": "https://storage.googleapis.com/plotly-prod-images/AR181RA/5/9_AUESG4RDWV6274TPTEMEMHY5J7ZT9H.png" }, "api_urls": { "files": "https://api.plotly.com/v2/files/AR181RA:5", "plots": "https://api.plotly.com/v2/plots/AR181RA:5", "parent": "https://api.plotly.com/v2/folders/home?user=AR181RA" }, "owner": "AR181RA", "parent": -1, "preview": "", "referencers": [], "references": [], "title": "", "views": 2, "web_url": "https://chart-studio.plotly.com/~AR181RA/5/", "world_readable": true, "date_modified": "2024-04-11T08:58:48.017Z", "stars": { "results": [], "count": 0 }, "collaborators": { "results": [], "count": 0 }, "subfolder_count": null, "refresh_interval": null, "organize_view_url": "https://chart-studio.plotly.com/~AR181RA/5/", "current_user_permission": "read", "is_theme": null, "is_template": false, "autosize": true, "caption": "", "figure": { "data": [ { "fill": "tozerox", "line": { "dash": "solid", "shape": "linear", "width": 4 }, "meta": { "columnNames": { "x": "A", "y": "B", "z": "E", "text": "", "locations": "B" } }, "mode": "lines", "type": "scatter", "xsrc": "AR181RA:4:f68b38", "ysrc": "AR181RA:4:4a9218", "zsrc": "AR181RA:4:30666d", "xaxis": "x", "yaxis": "y", "error_x": { "type": "percent", "value": 10, "visible": false, "symmetric": true, "copy_ystyle": true }, "error_y": { "type": "percent", "color": "\u001bMIXED_VALUES", "value": 10, "width": 4, "visible": false, "symmetric": true, "thickness": 2 }, "hoveron": "points+fills", "contours": { "end": 6.5, "size": 0.5, "start": 2.5 }, "groupnorm": "percent", "hoverinfo": "x+y+text+name", "stackgaps": "infer zero", "hoverlabel": { "align": "auto", "namelength": 15 }, "stackgroup": 1, "autocontour": true, "connectgaps": true, "orientation": "v", "locationssrc": "AR181RA:4:4a9218", "hovertemplate": "", "autocolorscale": true }, { "fill": "tonextx", "line": { "width": 7 }, "meta": { "columnNames": { "x": "A", "y": "C" } }, "mode": "lines", "type": "scatter", "xsrc": "AR181RA:4:f68b38", "ysrc": "AR181RA:4:336f8d", "stackgroup": 1 }, { "fill": "tonexty", "meta": { "columnNames": { "x": "A", "y": "D" } }, "mode": "lines", "type": "scatter", "xsrc": "AR181RA:4:f68b38", "ysrc": "AR181RA:4:fa0491", "stackgroup": 1 } ], "frames": [], "layout": { "font": { "size": 15 }, "scene": { "camera": { "up": { "x": 0, "y": 0, "z": 1 }, "eye": { "x": 1.2726804253632804, "y": -1.7506645093933326, "z": -0.0543903525245188 }, "center": { "x": 0, "y": 0, "z": 0 }, "projection": { "type": "perspective" } }, "aspectmode": "auto", "aspectratio": { "x": 0.8109602660764534, "y": 1.2164403991146802, "z": 1.0137003325955667 } }, "title": { "x": 0.1, "font": { "size": 20, "family": "Gravitas One" }, "text": "Linear Chart Example" }, "xaxis": { "side": "bottom", "type": "linear", "range": [ 0, 6.315789473684211 ], "ticks": "inside", "title": { "font": { "size": 18, "family": "Arial" }, "text": "<b>Hedge Percentage</b>" }, "anchor": "free", "domain": [ 0.01, 0.875 ], "ticklen": 6, "showgrid": true, "autorange": true, "tickwidth": 4, "showspikes": false, "rangeslider": { "range": [ -0.17757988475641695, 3.177579884756417 ], "yaxis": {}, "yaxis2": {}, "visible": false, "autorange": true, "thickness": 0 }, "spikethickness": 18 }, "yaxis": { "side": "left", "type": "linear", "range": [ 0, 105.26315789473685 ], "ticks": "inside", "title": { "font": { "size": 18, "family": "Arial" }, "text": "<b>Hedgeing Year</b>" }, "domain": [ 0.07, 1 ], "ticklen": 6, "autorange": true, "tickwidth": 4, "showspikes": false, "spikethickness": 18 }, "legend": { "x": 0.26000000000000023, "y": -0.3599999999999999, "font": { "family": "Courier New" }, "title": { "font": { "family": "Arial" }, "text": "<b>Legend :</b>" }, "valign": "bottom", "bgcolor": "rgb(232, 224, 227)", "xanchor": "auto", "yanchor": "auto", "traceorder": "normal", "bordercolor": "rgb(148, 46, 46)", "borderwidth": 2, "orientation": "h" }, "mapbox": {}, "margin": { "b": 91, "l": 90, "r": 80, "t": 100, "pad": 12 }, "modebar": { "color": "rgba(154, 154, 154, 0.3)", "bgcolor": "rgba(255, 255, 255, 0.5)", "orientation": "h" }, "autosize": true, "template": { "data": { "bar": [ { "type": "bar", "marker": { "colorbar": { "ticks": "", "outlinewidth": 0 } } } ], "table": [ { "type": "table", "cells": { "fill": { "color": "#EBF0F8" }, "line": { "color": "white" } }, "header": { "fill": { "color": "#C8D4E3" }, "line": { "color": "white" } } } ], "carpet": [ { "type": "carpet", "aaxis": { "gridcolor": "#C8D4E3", "linecolor": "#C8D4E3", "endlinecolor": "#2a3f5f", "minorgridcolor": "#C8D4E3", "startlinecolor": "#2a3f5f" }, "baxis": { "gridcolor": "#C8D4E3", "linecolor": "#C8D4E3", "endlinecolor": "#2a3f5f", "minorgridcolor": "#C8D4E3", "startlinecolor": "#2a3f5f" } } ], "mesh3d": [ { "type": "mesh3d", "colorbar": { "ticks": "", "outlinewidth": 0 } } ], "contour": [ { "type": "contour", "colorbar": { "ticks": "", "outlinewidth": 0 }, "autocolorscale": true } ], "heatmap": [ { "type": "heatmap", "colorbar": { "ticks": "", "outlinewidth": 0 }, "autocolorscale": true } ], "scatter": [ { "type": "scatter", "marker": { "colorbar": { "ticks": "", "outlinewidth": 0 } } } ], "surface": [ { "type": "surface", "colorbar": { "ticks": "", "outlinewidth": 0 } } ], "heatmapgl": [ { "type": "heatmapgl", "colorbar": { "ticks": "", "outlinewidth": 0 } } ], "histogram": [ { "type": "histogram", "marker": { "colorbar": { "ticks": "", "outlinewidth": 0 } } } ], "parcoords": [ { "line": { "colorbar": { "ticks": "", "outlinewidth": 0 } }, "type": "parcoords" } ], "scatter3d": [ { "type": "scatter3d", "marker": { "colorbar": { "ticks": "", "outlinewidth": 0 } } } ], "scattergl": [ { "type": "scattergl", "marker": { "colorbar": { "ticks": "", "outlinewidth": 0 } } } ], "choropleth": [ { "type": "choropleth", "colorbar": { "ticks": "", "outlinewidth": 0 } } ], "scattergeo": [ { "type": "scattergeo", "marker": { "colorbar": { "ticks": "", "outlinewidth": 0 } } } ], "histogram2d": [ { "type": "histogram2d", "colorbar": { "ticks": "", "outlinewidth": 0 }, "autocolorscale": true } ], "scatterpolar": [ { "type": "scatterpolar", "marker": { "colorbar": { "ticks": "", "outlinewidth": 0 } } } ], "contourcarpet": [ { "type": "contourcarpet", "colorbar": { "ticks": "", "outlinewidth": 0 } } ], "scattercarpet": [ { "type": "scattercarpet", "marker": { "colorbar": { "ticks": "", "outlinewidth": 0 } } } ], "scattermapbox": [ { "type": "scattermapbox", "marker": { "colorbar": { "ticks": "", "outlinewidth": 0 } } } ], "scatterpolargl": [ { "type": "scatterpolargl", "marker": { "colorbar": { "ticks": "", "outlinewidth": 0 } } } ], "scatterternary": [ { "type": "scatterternary", "marker": { "colorbar": { "ticks": "", "outlinewidth": 0 } } } ], "histogram2dcontour": [ { "type": "histogram2dcontour", "colorbar": { "ticks": "", "outlinewidth": 0 }, "autocolorscale": true } ] }, "layout": { "geo": { "bgcolor": "white", "showland": true, "lakecolor": "white", "landcolor": "white", "showlakes": true, "subunitcolor": "#C8D4E3" }, "font": { "color": "#2a3f5f" }, "polar": { "bgcolor": "white", "radialaxis": { "ticks": "", "gridcolor": "#EBF0F8", "linecolor": "#EBF0F8" }, "angularaxis": { "ticks": "", "gridcolor": "#EBF0F8", "linecolor": "#EBF0F8" } }, "scene": { "xaxis": { "ticks": "", "gridcolor": "#DFE8F3", "gridwidth": 2, "linecolor": "#EBF0F8", "zerolinecolor": "#EBF0F8", "showbackground": true, "backgroundcolor": "white" }, "yaxis": { "ticks": "", "gridcolor": "#DFE8F3", "gridwidth": 2, "linecolor": "#EBF0F8", "zerolinecolor": "#EBF0F8", "showbackground": true, "backgroundcolor": "white" }, "zaxis": { "ticks": "", "gridcolor": "#DFE8F3", "gridwidth": 2, "linecolor": "#EBF0F8", "zerolinecolor": "#EBF0F8", "showbackground": true, "backgroundcolor": "white" } }, "title": { "x": 0.05 }, "xaxis": { "ticks": "", "gridcolor": "#EBF0F8", "linecolor": "#EBF0F8", "automargin": true, "zerolinecolor": "#EBF0F8", "zerolinewidth": 2 }, "yaxis": { "ticks": "", "gridcolor": "#EBF0F8", "linecolor": "#EBF0F8", "automargin": true, "zerolinecolor": "#EBF0F8", "zerolinewidth": 2 }, "ternary": { "aaxis": { "ticks": "", "gridcolor": "#DFE8F3", "linecolor": "#A2B1C6" }, "baxis": { "ticks": "", "gridcolor": "#DFE8F3", "linecolor": "#A2B1C6" }, "caxis": { "ticks": "", "gridcolor": "#DFE8F3", "linecolor": "#A2B1C6" }, "bgcolor": "white" }, "colorway": [ "#636efa", "#EF553B", "#00cc96", "#ab63fa", "#19d3f3", "#e763fa", "#fecb52", "#ffa15a", "#ff6692", "#b6e880" ], "hovermode": "closest", "colorscale": { "diverging": [ [ 0, "#8e0152" ], [ 0.1, "#c51b7d" ], [ 0.2, "#de77ae" ], [ 0.3, "#f1b6da" ], [ 0.4, "#fde0ef" ], [ 0.5, "#f7f7f7" ], [ 0.6, "#e6f5d0" ], [ 0.7, "#b8e186" ], [ 0.8, "#7fbc41" ], [ 0.9, "#4d9221" ], [ 1, "#276419" ] ], "sequential": [ [ 0, "#0508b8" ], [ 0.0893854748603352, "#1910d8" ], [ 0.1787709497206704, "#3c19f0" ], [ 0.2681564245810056, "#6b1cfb" ], [ 0.3575418994413408, "#981cfd" ], [ 0.44692737430167595, "#bf1cfd" ], [ 0.5363128491620112, "#dd2bfd" ], [ 0.6256983240223464, "#f246fe" ], [ 0.7150837988826816, "#fc67fd" ], [ 0.8044692737430168, "#fe88fc" ], [ 0.8938547486033519, "#fea5fd" ], [ 0.9832402234636871, "#febefe" ], [ 1, "#fec3fe" ] ], "sequentialminus": [ [ 0, "#0508b8" ], [ 0.0893854748603352, "#1910d8" ], [ 0.1787709497206704, "#3c19f0" ], [ 0.2681564245810056, "#6b1cfb" ], [ 0.3575418994413408, "#981cfd" ], [ 0.44692737430167595, "#bf1cfd" ], [ 0.5363128491620112, "#dd2bfd" ], [ 0.6256983240223464, "#f246fe" ], [ 0.7150837988826816, "#fc67fd" ], [ 0.8044692737430168, "#fe88fc" ], [ 0.8938547486033519, "#fea5fd" ], [ 0.9832402234636871, "#febefe" ], [ 1, "#fec3fe" ] ] }, "plot_bgcolor": "white", "paper_bgcolor": "white", "shapedefaults": { "line": { "width": 0 }, "opacity": 0.4, "fillcolor": "#506784" }, "annotationdefaults": { "arrowhead": 0, "arrowcolor": "#506784", "arrowwidth": 1 } }, "themeRef": "PLOTLY_WHITE" }, "clickmode": "event", "hovermode": "closest", "hoverlabel": { "font": { "size": 20, "family": "Courier New" } }, "showlegend": true, "annotations": [], "uniformtext": { "mode": false, "minsize": 0 }, "paper_bgcolor": "rgb(255, 255, 255)" } }, "height": null, "width": null, "user": { "profile_url": "https://chart-studio.plotly.com/~AR181RA", "avatar_url": "https://storage.googleapis.com/plotly-prod-profiles/12.jpg", "background_url": "https://storage.googleapis.com/plotly-prod-profiles/bg-10.jpg", "bio": "", "nickname": "", "website": "", "stream_tokens": null, "feature_set_id": null, "csrf_token": null, "date_joined": "2024-04-02 10:59:59", "mapbox_access_tokens": null, "has_password": null, "username": "AR181RA", "email": null, "is_active": null, "readonly": null, "is_dash_creator": null, "dash_created_count": null, "is_chart_creator": null, "charts_created_count": null } }, { "creation_time": "2024-04-03T06:54:03.727326Z", "comments": { "results": [], "count": 0 }, "parented": true, "embed_url": "https://chart-studio.plotly.com/~physics1d/42.embed", "fid": "physics1d:42", "filename": "Plot 42", "filetype": "plot", "img_url": "https://storage.googleapis.com/plotly-prod-images/physics1d/42/9_OH8AVKP5R4P5VK0WFSLJ1CFAXISF8U.png", "image_urls": { "default": "https://storage.googleapis.com/plotly-prod-images/physics1d/42/2_A13BI5MV5VBHSWPRFTPN17AD39H1G1.png", "block-thumb": "https://storage.googleapis.com/plotly-prod-images/physics1d/42/8_AUYSCMS8FLDXRBNSJD8SK4HC3ZDLDX.png", "list-thumb": "https://storage.googleapis.com/plotly-prod-images/physics1d/42/9_OH8AVKP5R4P5VK0WFSLJ1CFAXISF8U.png" }, "api_urls": { "files": "https://api.plotly.com/v2/files/physics1d:42", "plots": "https://api.plotly.com/v2/plots/physics1d:42", "parent": "https://api.plotly.com/v2/folders/home?user=physics1d" }, "owner": "physics1d", "parent": -1, "preview": "", "referencers": [], "references": [], "title": "", "views": 13, "web_url": "https://chart-studio.plotly.com/~physics1d/42/", "world_readable": true, "date_modified": "2024-04-03T06:54:03.738Z", "stars": { "results": [], "count": 0 }, "collaborators": { "results": [], "count": 0 }, "subfolder_count": null, "refresh_interval": null, "organize_view_url": "https://chart-studio.plotly.com/~physics1d/42/", "current_user_permission": "read", "is_theme": null, "is_template": false, "autosize": true, "caption": "", "figure": { "data": [ { "uid": "78b6da", "meta": { "columnNames": { "x": "A", "y": "B" } }, "mode": "markers", "name": "Russet", "type": "scatter", "xsrc": "physics1d:41:43427d", "ysrc": "physics1d:41:8f82f4" }, { "uid": "ac7323", "meta": { "columnNames": { "x": "E", "y": "F" } }, "mode": "markers", "name": "Sweet", "type": "scatter", "xsrc": "physics1d:41:4afad3", "ysrc": "physics1d:41:beea03", "stackgroup": null }, { "uid": "166a08", "meta": { "columnNames": { "x": "G", "y": "H" } }, "mode": "markers", "name": "Yukon gold", "type": "scatter", "xsrc": "physics1d:41:7904b1", "ysrc": "physics1d:41:7dd179", "stackgroup": null }, { "uid": "19b56c", "transforms": [ { "rms": "", "type": "fit", "inputUid": "78b6da", "regressor": "x", "parameters": [ { "hold": false, "name": "m", "error": 0.2073950900403064, "value": -0.7548148148000228 }, { "hold": false, "name": "b", "error": 0.10160242915146651, "value": 0.6013903133800091 } ], "regressand": "y", "correlation": "", "fitfunction": "m*x + b", "inputxrange": [], "outputxrange": [], "interpolation": 50 } ] }, { "uid": "6da28d", "transforms": [ { "rms": "", "type": "fit", "inputUid": "ac7323", "regressor": "x", "parameters": [ { "hold": false, "name": "m", "error": 0.05403710699440209, "value": -0.20845648600000302 }, { "hold": false, "name": "b", "error": 0.026472667862493176, "value": 0.3528571428200018 } ], "regressand": "y", "correlation": "", "fitfunction": "m*x + b", "inputxrange": [], "outputxrange": [], "interpolation": 50 } ] }, { "uid": "41cf5e", "transforms": [ { "rms": "", "type": "fit", "inputUid": "166a08", "regressor": "x", "parameters": [ { "hold": false, "name": "m", "error": 0.12256802848760776, "value": -0.38803088810999997 }, { "hold": false, "name": "b", "error": 0.06004582571470387, "value": 0.09792471044800001 } ], "regressand": "y", "correlation": "", "fitfunction": "m*x + b", "inputxrange": [], "outputxrange": [], "interpolation": 50 } ] } ], "frames": [], "layout": { "title": { "text": "Percent change of mass in russet, sweet and Yukon gold potatoes" }, "xaxis": { "type": "linear", "range": [ -0.05011916922029282, 0.8501191692202928 ], "title": { "text": "Sucrose concentration (M)" }, "autorange": true }, "yaxis": { "type": "linear", "range": [ -0.2602653855714112, 0.6950423250568092 ], "title": { "text": "change of mass (%)" }, "autorange": true }, "legend": { "x": 1.02, "y": 1.267515923566879 }, "autosize": true, "template": { "data": { "bar": [ { "type": "bar", "marker": { "colorbar": { "ticks": "", "outlinewidth": 0 } } } ], "table": [ { "type": "table", "cells": { "fill": { "color": "#EBF0F8" }, "line": { "color": "white" } }, "header": { "fill": { "color": "#C8D4E3" }, "line": { "color": "white" } } } ], "carpet": [ { "type": "carpet", "aaxis": { "gridcolor": "#C8D4E3", "linecolor": "#C8D4E3", "endlinecolor": "#2a3f5f", "minorgridcolor": "#C8D4E3", "startlinecolor": "#2a3f5f" }, "baxis": { "gridcolor": "#C8D4E3", "linecolor": "#C8D4E3", "endlinecolor": "#2a3f5f", "minorgridcolor": "#C8D4E3", "startlinecolor": "#2a3f5f" } } ], "mesh3d": [ { "type": "mesh3d", "colorbar": { "ticks": "", "outlinewidth": 0 } } ], "contour": [ { "type": "contour", "colorbar": { "ticks": "", "outlinewidth": 0 }, "autocolorscale": true } ], "heatmap": [ { "type": "heatmap", "colorbar": { "ticks": "", "outlinewidth": 0 }, "autocolorscale": true } ], "scatter": [ { "type": "scatter", "marker": { "colorbar": { "ticks": "", "outlinewidth": 0 } } } ], "surface": [ { "type": "surface", "colorbar": { "ticks": "", "outlinewidth": 0 } } ], "heatmapgl": [ { "type": "heatmapgl", "colorbar": { "ticks": "", "outlinewidth": 0 } } ], "histogram": [ { "type": "histogram", "marker": { "colorbar": { "ticks": "", "outlinewidth": 0 } } } ], "parcoords": [ { "line": { "colorbar": { "ticks": "", "outlinewidth": 0 } }, "type": "parcoords" } ], "scatter3d": [ { "type": "scatter3d", "marker": { "colorbar": { "ticks": "", "outlinewidth": 0 } } } ], "scattergl": [ { "type": "scattergl", "marker": { "colorbar": { "ticks": "", "outlinewidth": 0 } } } ], "choropleth": [ { "type": "choropleth", "colorbar": { "ticks": "", "outlinewidth": 0 } } ], "scattergeo": [ { "type": "scattergeo", "marker": { "colorbar": { "ticks": "", "outlinewidth": 0 } } } ], "histogram2d": [ { "type": "histogram2d", "colorbar": { "ticks": "", "outlinewidth": 0 }, "autocolorscale": true } ], "scatterpolar": [ { "type": "scatterpolar", "marker": { "colorbar": { "ticks": "", "outlinewidth": 0 } } } ], "contourcarpet": [ { "type": "contourcarpet", "colorbar": { "ticks": "", "outlinewidth": 0 } } ], "scattercarpet": [ { "type": "scattercarpet", "marker": { "colorbar": { "ticks": "", "outlinewidth": 0 } } } ], "scattermapbox": [ { "type": "scattermapbox", "marker": { "colorbar": { "ticks": "", "outlinewidth": 0 } } } ], "scatterpolargl": [ { "type": "scatterpolargl", "marker": { "colorbar": { "ticks": "", "outlinewidth": 0 } } } ], "scatterternary": [ { "type": "scatterternary", "marker": { "colorbar": { "ticks": "", "outlinewidth": 0 } } } ], "histogram2dcontour": [ { "type": "histogram2dcontour", "colorbar": { "ticks": "", "outlinewidth": 0 }, "autocolorscale": true } ] }, "layout": { "geo": { "bgcolor": "white", "showland": true, "lakecolor": "white", "landcolor": "white", "showlakes": true, "subunitcolor": "#C8D4E3" }, "font": { "color": "#2a3f5f" }, "polar": { "bgcolor": "white", "radialaxis": { "ticks": "", "gridcolor": "#EBF0F8", "linecolor": "#EBF0F8" }, "angularaxis": { "ticks": "", "gridcolor": "#EBF0F8", "linecolor": "#EBF0F8" } }, "scene": { "xaxis": { "ticks": "", "gridcolor": "#DFE8F3", "gridwidth": 2, "linecolor": "#EBF0F8", "zerolinecolor": "#EBF0F8", "showbackground": true, "backgroundcolor": "white" }, "yaxis": { "ticks": "", "gridcolor": "#DFE8F3", "gridwidth": 2, "linecolor": "#EBF0F8", "zerolinecolor": "#EBF0F8", "showbackground": true, "backgroundcolor": "white" }, "zaxis": { "ticks": "", "gridcolor": "#DFE8F3", "gridwidth": 2, "linecolor": "#EBF0F8", "zerolinecolor": "#EBF0F8", "showbackground": true, "backgroundcolor": "white" } }, "title": { "x": 0.05 }, "xaxis": { "ticks": "", "gridcolor": "#EBF0F8", "linecolor": "#EBF0F8", "automargin": true, "zerolinecolor": "#EBF0F8", "zerolinewidth": 2 }, "yaxis": { "ticks": "", "gridcolor": "#EBF0F8", "linecolor": "#EBF0F8", "automargin": true, "zerolinecolor": "#EBF0F8", "zerolinewidth": 2 }, "ternary": { "aaxis": { "ticks": "", "gridcolor": "#DFE8F3", "linecolor": "#A2B1C6" }, "baxis": { "ticks": "", "gridcolor": "#DFE8F3", "linecolor": "#A2B1C6" }, "caxis": { "ticks": "", "gridcolor": "#DFE8F3", "linecolor": "#A2B1C6" }, "bgcolor": "white" }, "colorway": [ "#636efa", "#EF553B", "#00cc96", "#ab63fa", "#19d3f3", "#e763fa", "#fecb52", "#ffa15a", "#ff6692", "#b6e880" ], "hovermode": "closest", "colorscale": { "diverging": [ [ 0, "#8e0152" ], [ 0.1, "#c51b7d" ], [ 0.2, "#de77ae" ], [ 0.3, "#f1b6da" ], [ 0.4, "#fde0ef" ], [ 0.5, "#f7f7f7" ], [ 0.6, "#e6f5d0" ], [ 0.7, "#b8e186" ], [ 0.8, "#7fbc41" ], [ 0.9, "#4d9221" ], [ 1, "#276419" ] ], "sequential": [ [ 0, "#0508b8" ], [ 0.0893854748603352, "#1910d8" ], [ 0.1787709497206704, "#3c19f0" ], [ 0.2681564245810056, "#6b1cfb" ], [ 0.3575418994413408, "#981cfd" ], [ 0.44692737430167595, "#bf1cfd" ], [ 0.5363128491620112, "#dd2bfd" ], [ 0.6256983240223464, "#f246fe" ], [ 0.7150837988826816, "#fc67fd" ], [ 0.8044692737430168, "#fe88fc" ], [ 0.8938547486033519, "#fea5fd" ], [ 0.9832402234636871, "#febefe" ], [ 1, "#fec3fe" ] ], "sequentialminus": [ [ 0, "#0508b8" ], [ 0.0893854748603352, "#1910d8" ], [ 0.1787709497206704, "#3c19f0" ], [ 0.2681564245810056, "#6b1cfb" ], [ 0.3575418994413408, "#981cfd" ], [ 0.44692737430167595, "#bf1cfd" ], [ 0.5363128491620112, "#dd2bfd" ], [ 0.6256983240223464, "#f246fe" ], [ 0.7150837988826816, "#fc67fd" ], [ 0.8044692737430168, "#fe88fc" ], [ 0.8938547486033519, "#fea5fd" ], [ 0.9832402234636871, "#febefe" ], [ 1, "#fec3fe" ] ] }, "plot_bgcolor": "white", "paper_bgcolor": "white", "shapedefaults": { "line": { "width": 0 }, "opacity": 0.4, "fillcolor": "#506784" }, "annotationdefaults": { "arrowhead": 0, "arrowcolor": "#506784", "arrowwidth": 1 } }, "themeRef": "PLOTLY_WHITE" } } }, "height": null, "width": null, "user": { "profile_url": "https://chart-studio.plotly.com/~physics1d", "avatar_url": "https://storage.googleapis.com/plotly-prod-profiles/62.jpg", "background_url": "https://storage.googleapis.com/plotly-prod-profiles/bg-6.jpg", "bio": "", "nickname": "", "website": "", "stream_tokens": null, "feature_set_id": null, "csrf_token": null, "date_joined": "2021-10-07 18:54:49", "mapbox_access_tokens": null, "has_password": null, "username": "physics1d", "email": null, "is_active": null, "readonly": null, "is_dash_creator": null, "dash_created_count": null, "is_chart_creator": null, "charts_created_count": null } }, { "creation_time": "2024-04-03T06:48:26.352543Z", "comments": { "results": [], "count": 0 }, "parented": true, "embed_url": "https://chart-studio.plotly.com/~ihtishamahmad2/1.embed", "fid": "ihtishamahmad2:1", "filename": "Plot 1", "filetype": "plot", "img_url": "https://storage.googleapis.com/plotly-prod-images/ihtishamahmad2/1/9_6SJ4GY87EM3IMW3MQ1CU7LZ6UESPDK.png", "image_urls": { "default": "https://storage.googleapis.com/plotly-prod-images/ihtishamahmad2/1/2_UAJVWHYA8XLW1KKAOQBLZWTJZ02CX2.png", "block-thumb": "https://storage.googleapis.com/plotly-prod-images/ihtishamahmad2/1/8_HFJ04MXYRTGSLEH005XB3HYSPM38DH.png", "list-thumb": "https://storage.googleapis.com/plotly-prod-images/ihtishamahmad2/1/9_6SJ4GY87EM3IMW3MQ1CU7LZ6UESPDK.png" }, "api_urls": { "files": "https://api.plotly.com/v2/files/ihtishamahmad2:1", "plots": "https://api.plotly.com/v2/plots/ihtishamahmad2:1", "parent": "https://api.plotly.com/v2/folders/home?user=ihtishamahmad2" }, "owner": "ihtishamahmad2", "parent": -1, "preview": "", "referencers": [], "references": [], "title": "", "views": 2, "web_url": "https://chart-studio.plotly.com/~ihtishamahmad2/1/", "world_readable": true, "date_modified": "2024-04-03T06:48:26.362Z", "stars": { "results": [], "count": 0 }, "collaborators": { "results": [], "count": 0 }, "subfolder_count": null, "refresh_interval": null, "organize_view_url": "https://chart-studio.plotly.com/~ihtishamahmad2/1/", "current_user_permission": "read", "is_theme": null, "is_template": false, "autosize": true, "caption": "", "figure": { "data": [ { "meta": { "columnNames": { "labels": "Q2_What_are_the_dis_neral_insecurity_etc", "values": "Q2_What_are_the_dis_neral_insecurity_etc" } }, "mode": "markers", "type": "pie", "labelssrc": "ihtishamahmad2:0:e25612", "valuessrc": "ihtishamahmad2:0:e25612" }, { "meta": { "columnNames": { "labels": "Q3_What_are_the_cop_sm_for_the_disasters", "values": "Q3_What_are_the_cop_sm_for_the_disasters" } }, "type": "pie", "labelssrc": "ihtishamahmad2:0:509889", "valuessrc": "ihtishamahmad2:0:509889" }, { "meta": { "columnNames": { "labels": "Q4_What_are_the_key_th_PWDs_unemployed", "values": "Q4_What_are_the_key_th_PWDs_unemployed" } }, "type": "pie", "labelssrc": "ihtishamahmad2:0:ecee27", "valuessrc": "ihtishamahmad2:0:ecee27" }, { "meta": { "columnNames": { "labels": "Q5_Does_any_other_o_f_Yes_please_explain", "values": "Q5_Does_any_other_o_f_Yes_please_explain" } }, "type": "pie", "labelssrc": "ihtishamahmad2:0:0ee537", "valuessrc": "ihtishamahmad2:0:0ee537" }, { "meta": { "columnNames": { "labels": "Q7_What_are_the_key_marginalized_groups_", "values": "Q7_What_are_the_key_marginalized_groups_" } }, "type": "pie", "labelssrc": "ihtishamahmad2:0:8b6b5d", "valuessrc": "ihtishamahmad2:0:8b6b5d" }, { "meta": { "columnNames": { "labels": "Q8_Are_there_some_c_esources_related_etc", "values": "Q8_Are_there_some_c_esources_related_etc" } }, "type": "pie", "labelssrc": "ihtishamahmad2:0:4a82d9", "valuessrc": "ihtishamahmad2:0:4a82d9" }, { "meta": { "columnNames": { "labels": "Q8_Are_there_some_c_esources_related_etc", "values": "Q9_What_are_your_su_water_and_sanitation" } }, "type": "pie", "labelssrc": "ihtishamahmad2:0:4a82d9", "valuessrc": "ihtishamahmad2:0:3d4032" }, { "type": "pie" } ], "frames": [], "layout": { "xaxis": { "range": [ -1, 6 ], "autorange": true }, "yaxis": { "range": [ -1, 4 ], "autorange": true }, "autosize": true, "template": { "data": { "bar": [ { "type": "bar", "marker": { "colorbar": { "ticks": "", "outlinewidth": 0 } } } ], "table": [ { "type": "table", "cells": { "fill": { "color": "#EBF0F8" }, "line": { "color": "white" } }, "header": { "fill": { "color": "#C8D4E3" }, "line": { "color": "white" } } } ], "carpet": [ { "type": "carpet", "aaxis": { "gridcolor": "#C8D4E3", "linecolor": "#C8D4E3", "endlinecolor": "#2a3f5f", "minorgridcolor": "#C8D4E3", "startlinecolor": "#2a3f5f" }, "baxis": { "gridcolor": "#C8D4E3", "linecolor": "#C8D4E3", "endlinecolor": "#2a3f5f", "minorgridcolor": "#C8D4E3", "startlinecolor": "#2a3f5f" } } ], "mesh3d": [ { "type": "mesh3d", "colorbar": { "ticks": "", "outlinewidth": 0 } } ], "contour": [ { "type": "contour", "colorbar": { "ticks": "", "outlinewidth": 0 }, "autocolorscale": true } ], "heatmap": [ { "type": "heatmap", "colorbar": { "ticks": "", "outlinewidth": 0 }, "autocolorscale": true } ], "scatter": [ { "type": "scatter", "marker": { "colorbar": { "ticks": "", "outlinewidth": 0 } } } ], "surface": [ { "type": "surface", "colorbar": { "ticks": "", "outlinewidth": 0 } } ], "heatmapgl": [ { "type": "heatmapgl", "colorbar": { "ticks": "", "outlinewidth": 0 } } ], "histogram": [ { "type": "histogram", "marker": { "colorbar": { "ticks": "", "outlinewidth": 0 } } } ], "parcoords": [ { "line": { "colorbar": { "ticks": "", "outlinewidth": 0 } }, "type": "parcoords" } ], "scatter3d": [ { "type": "scatter3d", "marker": { "colorbar": { "ticks": "", "outlinewidth": 0 } } } ], "scattergl": [ { "type": "scattergl", "marker": { "colorbar": { "ticks": "", "outlinewidth": 0 } } } ], "choropleth": [ { "type": "choropleth", "colorbar": { "ticks": "", "outlinewidth": 0 } } ], "scattergeo": [ { "type": "scattergeo", "marker": { "colorbar": { "ticks": "", "outlinewidth": 0 } } } ], "histogram2d": [ { "type": "histogram2d", "colorbar": { "ticks": "", "outlinewidth": 0 }, "autocolorscale": true } ], "scatterpolar": [ { "type": "scatterpolar", "marker": { "colorbar": { "ticks": "", "outlinewidth": 0 } } } ], "contourcarpet": [ { "type": "contourcarpet", "colorbar": { "ticks": "", "outlinewidth": 0 } } ], "scattercarpet": [ { "type": "scattercarpet", "marker": { "colorbar": { "ticks": "", "outlinewidth": 0 } } } ], "scattermapbox": [ { "type": "scattermapbox", "marker": { "colorbar": { "ticks": "", "outlinewidth": 0 } } } ], "scatterpolargl": [ { "type": "scatterpolargl", "marker": { "colorbar": { "ticks": "", "outlinewidth": 0 } } } ], "scatterternary": [ { "type": "scatterternary", "marker": { "colorbar": { "ticks": "", "outlinewidth": 0 } } } ], "histogram2dcontour": [ { "type": "histogram2dcontour", "colorbar": { "ticks": "", "outlinewidth": 0 }, "autocolorscale": true } ] }, "layout": { "geo": { "bgcolor": "white", "showland": true, "lakecolor": "white", "landcolor": "white", "showlakes": true, "subunitcolor": "#C8D4E3" }, "font": { "color": "#2a3f5f" }, "polar": { "bgcolor": "white", "radialaxis": { "ticks": "", "gridcolor": "#EBF0F8", "linecolor": "#EBF0F8" }, "angularaxis": { "ticks": "", "gridcolor": "#EBF0F8", "linecolor": "#EBF0F8" } }, "scene": { "xaxis": { "ticks": "", "gridcolor": "#DFE8F3", "gridwidth": 2, "linecolor": "#EBF0F8", "zerolinecolor": "#EBF0F8", "showbackground": true, "backgroundcolor": "white" }, "yaxis": { "ticks": "", "gridcolor": "#DFE8F3", "gridwidth": 2, "linecolor": "#EBF0F8", "zerolinecolor": "#EBF0F8", "showbackground": true, "backgroundcolor": "white" }, "zaxis": { "ticks": "", "gridcolor": "#DFE8F3", "gridwidth": 2, "linecolor": "#EBF0F8", "zerolinecolor": "#EBF0F8", "showbackground": true, "backgroundcolor": "white" } }, "title": { "x": 0.05 }, "xaxis": { "ticks": "", "gridcolor": "#EBF0F8", "linecolor": "#EBF0F8", "automargin": true, "zerolinecolor": "#EBF0F8", "zerolinewidth": 2 }, "yaxis": { "ticks": "", "gridcolor": "#EBF0F8", "linecolor": "#EBF0F8", "automargin": true, "zerolinecolor": "#EBF0F8", "zerolinewidth": 2 }, "ternary": { "aaxis": { "ticks": "", "gridcolor": "#DFE8F3", "linecolor": "#A2B1C6" }, "baxis": { "ticks": "", "gridcolor": "#DFE8F3", "linecolor": "#A2B1C6" }, "caxis": { "ticks": "", "gridcolor": "#DFE8F3", "linecolor": "#A2B1C6" }, "bgcolor": "white" }, "colorway": [ "#636efa", "#EF553B", "#00cc96", "#ab63fa", "#19d3f3", "#e763fa", "#fecb52", "#ffa15a", "#ff6692", "#b6e880" ], "hovermode": "closest", "colorscale": { "diverging": [ [ 0, "#8e0152" ], [ 0.1, "#c51b7d" ], [ 0.2, "#de77ae" ], [ 0.3, "#f1b6da" ], [ 0.4, "#fde0ef" ], [ 0.5, "#f7f7f7" ], [ 0.6, "#e6f5d0" ], [ 0.7, "#b8e186" ], [ 0.8, "#7fbc41" ], [ 0.9, "#4d9221" ], [ 1, "#276419" ] ], "sequential": [ [ 0, "#0508b8" ], [ 0.0893854748603352, "#1910d8" ], [ 0.1787709497206704, "#3c19f0" ], [ 0.2681564245810056, "#6b1cfb" ], [ 0.3575418994413408, "#981cfd" ], [ 0.44692737430167595, "#bf1cfd" ], [ 0.5363128491620112, "#dd2bfd" ], [ 0.6256983240223464, "#f246fe" ], [ 0.7150837988826816, "#fc67fd" ], [ 0.8044692737430168, "#fe88fc" ], [ 0.8938547486033519, "#fea5fd" ], [ 0.9832402234636871, "#febefe" ], [ 1, "#fec3fe" ] ], "sequentialminus": [ [ 0, "#0508b8" ], [ 0.0893854748603352, "#1910d8" ], [ 0.1787709497206704, "#3c19f0" ], [ 0.2681564245810056, "#6b1cfb" ], [ 0.3575418994413408, "#981cfd" ], [ 0.44692737430167595, "#bf1cfd" ], [ 0.5363128491620112, "#dd2bfd" ], [ 0.6256983240223464, "#f246fe" ], [ 0.7150837988826816, "#fc67fd" ], [ 0.8044692737430168, "#fe88fc" ], [ 0.8938547486033519, "#fea5fd" ], [ 0.9832402234636871, "#febefe" ], [ 1, "#fec3fe" ] ] }, "plot_bgcolor": "white", "paper_bgcolor": "white", "shapedefaults": { "line": { "width": 0 }, "opacity": 0.4, "fillcolor": "#506784" }, "annotationdefaults": { "arrowhead": 0, "arrowcolor": "#506784", "arrowwidth": 1 } }, "themeRef": "PLOTLY_WHITE" } } }, "height": null, "width": null, "user": { "profile_url": "https://chart-studio.plotly.com/~ihtishamahmad2", "avatar_url": "https://storage.googleapis.com/plotly-prod-profiles/20.jpg", "background_url": "https://storage.googleapis.com/plotly-prod-profiles/bg-3.jpg", "bio": "", "nickname": "", "website": "", "stream_tokens": null, "feature_set_id": null, "csrf_token": null, "date_joined": "2024-04-03 06:47:55", "mapbox_access_tokens": null, "has_password": null, "username": "ihtishamahmad2", "email": null, "is_active": null, "readonly": null, "is_dash_creator": null, "dash_created_count": null, "is_chart_creator": null, "charts_created_count": null } }, { "creation_time": "2024-04-03T06:20:04.477946Z", "comments": { "results": [], "count": 0 }, "parented": true, "embed_url": "https://chart-studio.plotly.com/~ASCIVOLETTO/45.embed", "fid": "ASCIVOLETTO:45", "filename": "Numberoftransactions", "filetype": "plot", "img_url": "https://storage.googleapis.com/plotly-prod-images/ASCIVOLETTO/45/9_P1EA2KTCQN0APYL3SV7WW5JWGKSSBA.png", "image_urls": { "default": "https://storage.googleapis.com/plotly-prod-images/ASCIVOLETTO/45/2_470IF1BZIA9NQZY3IFX7203IVJQ12A.png", "block-thumb": "https://storage.googleapis.com/plotly-prod-images/ASCIVOLETTO/45/8_XI0HFE4GQ37MMT6AZRNVWBTOKJTWKK.png", "list-thumb": "https://storage.googleapis.com/plotly-prod-images/ASCIVOLETTO/45/9_P1EA2KTCQN0APYL3SV7WW5JWGKSSBA.png" }, "api_urls": { "files": "https://api.plotly.com/v2/files/ASCIVOLETTO:45", "plots": "https://api.plotly.com/v2/plots/ASCIVOLETTO:45", "parent": "https://api.plotly.com/v2/folders/home?user=ASCIVOLETTO" }, "owner": "ASCIVOLETTO", "parent": -1, "preview": "", "referencers": [], "references": [], "title": "", "views": 1, "web_url": "https://chart-studio.plotly.com/~ASCIVOLETTO/45/", "world_readable": true, "date_modified": "2024-04-03T06:20:04.488Z", "stars": { "results": [], "count": 0 }, "collaborators": { "results": [], "count": 0 }, "subfolder_count": null, "refresh_interval": null, "organize_view_url": "https://chart-studio.plotly.com/~ASCIVOLETTO/45/", "current_user_permission": "read", "is_theme": null, "is_template": false, "autosize": true, "caption": "", "figure": { "data": [ { "meta": { "columnNames": { "x": "", "y": "B" } }, "mode": "markers", "type": "bar", "ysrc": "ASCIVOLETTO:44:099905", "marker": { "line": { "color": "rgb(0, 0, 0)" }, "color": "rgb(0, 0, 0)" }, "error_x": { "type": "percent", "color": "rgb(0, 0, 0)", "value": 10, "width": 4, "visible": false, "symmetric": true, "thickness": 2 }, "opacity": 1, "orientation": "v" } ], "frames": [], "layout": { "title": { "font": { "color": "rgb(0, 0, 0)" }, "text": "Number of LBO in the United States between 2013 and 2019" }, "xaxis": { "side": "bottom", "range": [ 2012.5, 2019.5 ], "title": { "font": { "color": "rgb(3, 3, 3)" }, "text": "Year" }, "mirror": false, "nticks": 0, "showgrid": false, "showline": true, "zeroline": false, "autorange": false, "linecolor": "rgb(5, 5, 5)", "automargin": false, "showspikes": false, "rangeslider": { "range": [ -0.5, 2019.5 ], "yaxis": {}, "visible": false, "autorange": true }, "spikethickness": 10, "separatethousands": false }, "yaxis": { "type": "linear", "range": [ 0, 1000 ], "title": { "font": { "color": "rgb(3, 3, 3)" }, "text": "Number of deals" }, "autorange": false, "fixedrange": true }, "bargap": 0.5, "legend": { "yanchor": "auto", "traceorder": "reversed+grouped", "borderwidth": 0, "orientation": "h" }, "modebar": { "orientation": "h" }, "autosize": true, "dragmode": "zoom", "hoverlabel": { "font": { "size": 13 } }, "showlegend": false, "bargroupgap": 0 } }, "height": null, "width": null, "user": { "profile_url": "https://chart-studio.plotly.com/~ASCIVOLETTO", "avatar_url": "https://storage.googleapis.com/plotly-prod-profiles/96.jpg", "background_url": "https://storage.googleapis.com/plotly-prod-profiles/bg-7.jpg", "bio": "", "nickname": "", "website": "", "stream_tokens": null, "feature_set_id": null, "csrf_token": null, "date_joined": "2023-03-30 13:28:23", "mapbox_access_tokens": null, "has_password": null, "username": "ASCIVOLETTO", "email": null, "is_active": null, "readonly": null, "is_dash_creator": null, "dash_created_count": null, "is_chart_creator": null, "charts_created_count": null } }, { "creation_time": "2024-04-03T06:19:42.459672Z", "comments": { "results": [], "count": 0 }, "parented": true, "embed_url": "https://chart-studio.plotly.com/~556710/50.embed", "fid": "556710:50", "filename": "Plot 50", "filetype": "plot", "img_url": "https://storage.googleapis.com/plotly-prod-images/556710/50/9_73A9AM89YFXIAVCXV6KJ6VL5R1EE9Q.png", "image_urls": { "default": "https://storage.googleapis.com/plotly-prod-images/556710/50/2_JF2Y649VQ1L7HFEATFF35KLNK7QP0Y.png", "block-thumb": "https://storage.googleapis.com/plotly-prod-images/556710/50/8_RKOPCC8S5NMFGW30JWOK34WSNKFSIG.png", "list-thumb": "https://storage.googleapis.com/plotly-prod-images/556710/50/9_73A9AM89YFXIAVCXV6KJ6VL5R1EE9Q.png" }, "api_urls": { "files": "https://api.plotly.com/v2/files/556710:50", "plots": "https://api.plotly.com/v2/plots/556710:50", "parent": "https://api.plotly.com/v2/folders/home?user=556710" }, "owner": "556710", "parent": -1, "preview": "", "referencers": [], "references": [], "title": "", "views": 2, "web_url": "https://chart-studio.plotly.com/~556710/50/", "world_readable": true, "date_modified": "2024-04-03T06:19:42.472Z", "stars": { "results": [], "count": 0 }, "collaborators": { "results": [], "count": 0 }, "subfolder_count": null, "refresh_interval": null, "organize_view_url": "https://chart-studio.plotly.com/~556710/50/", "current_user_permission": "read", "is_theme": null, "is_template": false, "autosize": true, "caption": "", "figure": { "data": [ { "uid": "8b919f", "meta": { "columnNames": { "x": "Sucrose Concentration (M)", "y": "Percent Changes in Mass for Sweet Potato" } }, "mode": "markers", "name": "Sweet Potato", "type": "scatter", "xsrc": "556710:48:62a387", "ysrc": "556710:48:155c69", "marker": { "color": "rgb(239, 12, 202)" } }, { "uid": "7381e9", "meta": { "columnNames": { "x": "Sucrose Concentration (M)", "y": "Percent Changes in Mass for Gold Potato" } }, "mode": "markers", "name": "Gold Potato", "type": "scatter", "xsrc": "556710:49:c7aee2", "ysrc": "556710:49:5e759d", "marker": { "color": "rgb(255, 208, 0)" } }, { "uid": "169aec", "showlegend": false, "transforms": [ { "rms": "", "type": "fit", "inputUid": "8b919f", "regressor": "x", "parameters": [ { "hold": false, "name": "m", "error": 2.5263610193321573, "value": -18.150000000000023 }, { "hold": false, "name": "b", "error": 1.2376590806841186, "value": 36.180000000000014 } ], "regressand": "y", "correlation": "", "fitfunction": "m*x + b", "inputxrange": [], "outputxrange": [], "interpolation": 50 } ] }, { "uid": "96b6ef", "showlegend": false, "transforms": [ { "rms": "", "type": "fit", "inputUid": "7381e9", "regressor": "x", "parameters": [ { "hold": false, "name": "m", "error": 1.5107944929736516, "value": -67.85 }, { "hold": false, "name": "b", "error": 0.7401351227984609, "value": 36.32 } ], "regressand": "y", "correlation": "", "fitfunction": "m*x + b", "inputxrange": [], "outputxrange": [], "interpolation": 50 } ] }, { "uid": "d6e55b", "meta": { "columnNames": { "x": "Sucrose Concentration (M)", "y": "Percent Changes in Mass for Red Potato" } }, "mode": "markers", "name": "Red Potato", "type": "scatter", "xsrc": "556710:47:d00518", "ysrc": "556710:47:2dcfea", "marker": { "color": "rgb(243, 25, 25)" }, "stackgroup": null }, { "uid": "0fea57", "showlegend": false, "transforms": [ { "rms": "", "type": "fit", "inputUid": "d6e55b", "regressor": "x", "parameters": [ { "hold": false, "name": "m", "error": 4.913501806247518, "value": -52.649999999999935 }, { "hold": false, "name": "b", "error": 2.407114455110201, "value": 22.359999999999975 } ], "regressand": "y", "correlation": "", "fitfunction": "m*x + b", "inputxrange": [], "outputxrange": [], "interpolation": 50 } ] } ], "frames": [], "layout": { "title": { "text": "" }, "xaxis": { "type": "linear", "range": [ -0.0499586435070306, 0.8499586435070307 ], "title": { "text": "Sucrose Concentration (M)" }, "autorange": true }, "yaxis": { "type": "linear", "range": [ -25.46214031684449, 39.86214031684449 ], "title": { "text": "Change in Mass (%)" }, "autorange": true }, "autosize": true, "template": { "data": { "bar": [ { "type": "bar", "marker": { "colorbar": { "ticks": "", "outlinewidth": 0 } } } ], "table": [ { "type": "table", "cells": { "fill": { "color": "#EBF0F8" }, "line": { "color": "white" } }, "header": { "fill": { "color": "#C8D4E3" }, "line": { "color": "white" } } } ], "carpet": [ { "type": "carpet", "aaxis": { "gridcolor": "#C8D4E3", "linecolor": "#C8D4E3", "endlinecolor": "#2a3f5f", "minorgridcolor": "#C8D4E3", "startlinecolor": "#2a3f5f" }, "baxis": { "gridcolor": "#C8D4E3", "linecolor": "#C8D4E3", "endlinecolor": "#2a3f5f", "minorgridcolor": "#C8D4E3", "startlinecolor": "#2a3f5f" } } ], "mesh3d": [ { "type": "mesh3d", "colorbar": { "ticks": "", "outlinewidth": 0 } } ], "contour": [ { "type": "contour", "colorbar": { "ticks": "", "outlinewidth": 0 }, "autocolorscale": true } ], "heatmap": [ { "type": "heatmap", "colorbar": { "ticks": "", "outlinewidth": 0 }, "autocolorscale": true } ], "scatter": [ { "type": "scatter", "marker": { "colorbar": { "ticks": "", "outlinewidth": 0 } } } ], "surface": [ { "type": "surface", "colorbar": { "ticks": "", "outlinewidth": 0 } } ], "heatmapgl": [ { "type": "heatmapgl", "colorbar": { "ticks": "", "outlinewidth": 0 } } ], "histogram": [ { "type": "histogram", "marker": { "colorbar": { "ticks": "", "outlinewidth": 0 } } } ], "parcoords": [ { "line": { "colorbar": { "ticks": "", "outlinewidth": 0 } }, "type": "parcoords" } ], "scatter3d": [ { "type": "scatter3d", "marker": { "colorbar": { "ticks": "", "outlinewidth": 0 } } } ], "scattergl": [ { "type": "scattergl", "marker": { "colorbar": { "ticks": "", "outlinewidth": 0 } } } ], "choropleth": [ { "type": "choropleth", "colorbar": { "ticks": "", "outlinewidth": 0 } } ], "scattergeo": [ { "type": "scattergeo", "marker": { "colorbar": { "ticks": "", "outlinewidth": 0 } } } ], "histogram2d": [ { "type": "histogram2d", "colorbar": { "ticks": "", "outlinewidth": 0 }, "autocolorscale": true } ], "scatterpolar": [ { "type": "scatterpolar", "marker": { "colorbar": { "ticks": "", "outlinewidth": 0 } } } ], "contourcarpet": [ { "type": "contourcarpet", "colorbar": { "ticks": "", "outlinewidth": 0 } } ], "scattercarpet": [ { "type": "scattercarpet", "marker": { "colorbar": { "ticks": "", "outlinewidth": 0 } } } ], "scattermapbox": [ { "type": "scattermapbox", "marker": { "colorbar": { "ticks": "", "outlinewidth": 0 } } } ], "scatterpolargl": [ { "type": "scatterpolargl", "marker": { "colorbar": { "ticks": "", "outlinewidth": 0 } } } ], "scatterternary": [ { "type": "scatterternary", "marker": { "colorbar": { "ticks": "", "outlinewidth": 0 } } } ], "histogram2dcontour": [ { "type": "histogram2dcontour", "colorbar": { "ticks": "", "outlinewidth": 0 }, "autocolorscale": true } ] }, "layout": { "geo": { "bgcolor": "white", "showland": true, "lakecolor": "white", "landcolor": "white", "showlakes": true, "subunitcolor": "#C8D4E3" }, "font": { "color": "#2a3f5f" }, "polar": { "bgcolor": "white", "radialaxis": { "ticks": "", "gridcolor": "#EBF0F8", "linecolor": "#EBF0F8" }, "angularaxis": { "ticks": "", "gridcolor": "#EBF0F8", "linecolor": "#EBF0F8" } }, "scene": { "xaxis": { "ticks": "", "gridcolor": "#DFE8F3", "gridwidth": 2, "linecolor": "#EBF0F8", "zerolinecolor": "#EBF0F8", "showbackground": true, "backgroundcolor": "white" }, "yaxis": { "ticks": "", "gridcolor": "#DFE8F3", "gridwidth": 2, "linecolor": "#EBF0F8", "zerolinecolor": "#EBF0F8", "showbackground": true, "backgroundcolor": "white" }, "zaxis": { "ticks": "", "gridcolor": "#DFE8F3", "gridwidth": 2, "linecolor": "#EBF0F8", "zerolinecolor": "#EBF0F8", "showbackground": true, "backgroundcolor": "white" } }, "title": { "x": 0.05 }, "xaxis": { "ticks": "", "gridcolor": "#EBF0F8", "linecolor": "#EBF0F8", "automargin": true, "zerolinecolor": "#EBF0F8", "zerolinewidth": 2 }, "yaxis": { "ticks": "", "gridcolor": "#EBF0F8", "linecolor": "#EBF0F8", "automargin": true, "zerolinecolor": "#EBF0F8", "zerolinewidth": 2 }, "ternary": { "aaxis": { "ticks": "", "gridcolor": "#DFE8F3", "linecolor": "#A2B1C6" }, "baxis": { "ticks": "", "gridcolor": "#DFE8F3", "linecolor": "#A2B1C6" }, "caxis": { "ticks": "", "gridcolor": "#DFE8F3", "linecolor": "#A2B1C6" }, "bgcolor": "white" }, "colorway": [ "#636efa", "#EF553B", "#00cc96", "#ab63fa", "#19d3f3", "#e763fa", "#fecb52", "#ffa15a", "#ff6692", "#b6e880" ], "hovermode": "closest", "colorscale": { "diverging": [ [ 0, "#8e0152" ], [ 0.1, "#c51b7d" ], [ 0.2, "#de77ae" ], [ 0.3, "#f1b6da" ], [ 0.4, "#fde0ef" ], [ 0.5, "#f7f7f7" ], [ 0.6, "#e6f5d0" ], [ 0.7, "#b8e186" ], [ 0.8, "#7fbc41" ], [ 0.9, "#4d9221" ], [ 1, "#276419" ] ], "sequential": [ [ 0, "#0508b8" ], [ 0.0893854748603352, "#1910d8" ], [ 0.1787709497206704, "#3c19f0" ], [ 0.2681564245810056, "#6b1cfb" ], [ 0.3575418994413408, "#981cfd" ], [ 0.44692737430167595, "#bf1cfd" ], [ 0.5363128491620112, "#dd2bfd" ], [ 0.6256983240223464, "#f246fe" ], [ 0.7150837988826816, "#fc67fd" ], [ 0.8044692737430168, "#fe88fc" ], [ 0.8938547486033519, "#fea5fd" ], [ 0.9832402234636871, "#febefe" ], [ 1, "#fec3fe" ] ], "sequentialminus": [ [ 0, "#0508b8" ], [ 0.0893854748603352, "#1910d8" ], [ 0.1787709497206704, "#3c19f0" ], [ 0.2681564245810056, "#6b1cfb" ], [ 0.3575418994413408, "#981cfd" ], [ 0.44692737430167595, "#bf1cfd" ], [ 0.5363128491620112, "#dd2bfd" ], [ 0.6256983240223464, "#f246fe" ], [ 0.7150837988826816, "#fc67fd" ], [ 0.8044692737430168, "#fe88fc" ], [ 0.8938547486033519, "#fea5fd" ], [ 0.9832402234636871, "#febefe" ], [ 1, "#fec3fe" ] ] }, "plot_bgcolor": "white", "paper_bgcolor": "white", "shapedefaults": { "line": { "width": 0 }, "opacity": 0.4, "fillcolor": "#506784" }, "annotationdefaults": { "arrowhead": 0, "arrowcolor": "#506784", "arrowwidth": 1 } }, "themeRef": "PLOTLY_WHITE" } } }, "height": null, "width": null, "user": { "profile_url": "https://chart-studio.plotly.com/~556710", "avatar_url": "https://storage.googleapis.com/plotly-prod-profiles/64.jpg", "background_url": "https://storage.googleapis.com/plotly-prod-profiles/bg-9.jpg", "bio": "", "nickname": "", "website": "", "stream_tokens": null, "feature_set_id": null, "csrf_token": null, "date_joined": "2021-10-08 20:56:39", "mapbox_access_tokens": null, "has_password": null, "username": "556710", "email": null, "is_active": null, "readonly": null, "is_dash_creator": null, "dash_created_count": null, "is_chart_creator": null, "charts_created_count": null } }, { "creation_time": "2024-04-03T06:18:44.990302Z", "comments": { "results": [], "count": 0 }, "parented": true, "embed_url": "https://chart-studio.plotly.com/~gracetheo/5.embed", "fid": "gracetheo:5", "filename": "Plot 5", "filetype": "plot", "img_url": "https://storage.googleapis.com/plotly-prod-images/gracetheo/5/9_VNE55RIXLBZILDZFQX5GQJPIV3EM4H.png", "image_urls": { "default": "https://storage.googleapis.com/plotly-prod-images/gracetheo/5/2_1G1Y4ICF5RO36UH35A6BLUAEQLDDBJ.png", "block-thumb": "https://storage.googleapis.com/plotly-prod-images/gracetheo/5/8_KTRVCM8TVXQWZM00JDZZOOA9WGPHGP.png", "list-thumb": "https://storage.googleapis.com/plotly-prod-images/gracetheo/5/9_VNE55RIXLBZILDZFQX5GQJPIV3EM4H.png" }, "api_urls": { "files": "https://api.plotly.com/v2/files/gracetheo:5", "plots": "https://api.plotly.com/v2/plots/gracetheo:5", "parent": "https://api.plotly.com/v2/folders/home?user=gracetheo" }, "owner": "gracetheo", "parent": -1, "preview": "", "referencers": [], "references": [], "title": "", "views": 1, "web_url": "https://chart-studio.plotly.com/~gracetheo/5/", "world_readable": true, "date_modified": "2024-04-03T06:18:45.003Z", "stars": { "results": [], "count": 0 }, "collaborators": { "results": [], "count": 0 }, "subfolder_count": null, "refresh_interval": null, "organize_view_url": "https://chart-studio.plotly.com/~gracetheo/5/", "current_user_permission": "read", "is_theme": null, "is_template": false, "autosize": true, "caption": "", "figure": { "data": [ { "meta": { "columnNames": { "x": "", "y": "A" } }, "mode": "markers", "name": "Pattern 1", "type": "box", "ysrc": "gracetheo:4:0ff591", "boxpoints": false }, { "meta": { "columnNames": { "y": "B" } }, "name": "Pattern 2", "type": "box", "ysrc": "gracetheo:4:804ba0", "boxpoints": false }, { "meta": { "columnNames": { "x": "", "y": "C" } }, "name": "Baseline", "type": "box", "ysrc": "gracetheo:4:d8fd9a", "boxpoints": false } ], "frames": [], "layout": { "font": { "size": 20 }, "xaxis": { "type": "category", "range": [ -0.5, 2.5 ], "domain": [ 0, 0.5 ], "autorange": true }, "yaxis": { "type": "linear", "range": [ 4.9, 25.1 ], "title": { "font": { "size": 17 }, "text": "average bpm" }, "domain": [ 0.375, 1 ], "autorange": false }, "autosize": true } }, "height": null, "width": null, "user": { "profile_url": "https://chart-studio.plotly.com/~gracetheo", "avatar_url": "https://storage.googleapis.com/plotly-prod-profiles/51.jpg", "background_url": "https://storage.googleapis.com/plotly-prod-profiles/bg-12.jpg", "bio": "", "nickname": "", "website": "", "stream_tokens": null, "feature_set_id": null, "csrf_token": null, "date_joined": "2023-09-14 18:36:36", "mapbox_access_tokens": null, "has_password": null, "username": "gracetheo", "email": null, "is_active": null, "readonly": null, "is_dash_creator": null, "dash_created_count": null, "is_chart_creator": null, "charts_created_count": null } }, { "creation_time": "2024-04-03T06:16:42.489625Z", "comments": { "results": [], "count": 0 }, "parented": true, "embed_url": "https://chart-studio.plotly.com/~mahendraadir/1.embed", "fid": "mahendraadir:1", "filename": "Plot 1", "filetype": "plot", "img_url": "https://storage.googleapis.com/plotly-prod-images/mahendraadir/1/9_54AK57BTK5ID27NM2UB2OMBR3MQ440.png", "image_urls": { "default": "https://storage.googleapis.com/plotly-prod-images/mahendraadir/1/2_E895HEHEJ7OTM47HM6K76EAPGLRQM4.png", "block-thumb": "https://storage.googleapis.com/plotly-prod-images/mahendraadir/1/8_SGUJU4TMLQ8EEYLCRN4JWD6F8NMXGF.png", "list-thumb": "https://storage.googleapis.com/plotly-prod-images/mahendraadir/1/9_54AK57BTK5ID27NM2UB2OMBR3MQ440.png" }, "api_urls": { "files": "https://api.plotly.com/v2/files/mahendraadir:1", "plots": "https://api.plotly.com/v2/plots/mahendraadir:1", "parent": "https://api.plotly.com/v2/folders/home?user=mahendraadir" }, "owner": "mahendraadir", "parent": -1, "preview": "", "referencers": [], "references": [], "title": "", "views": 1, "web_url": "https://chart-studio.plotly.com/~mahendraadir/1/", "world_readable": true, "date_modified": "2024-04-03T06:16:42.500Z", "stars": { "results": [], "count": 0 }, "collaborators": { "results": [], "count": 0 }, "subfolder_count": null, "refresh_interval": null, "organize_view_url": "https://chart-studio.plotly.com/~mahendraadir/1/", "current_user_permission": "read", "is_theme": null, "is_template": false, "autosize": true, "caption": "", "figure": { "data": [ { "uid": "9c6b7d", "meta": { "columnNames": { "x": "Akurasi, x;F1-score (1), x; F1-score (0), x; F1-score (2), x", "y": "0,0005, y" } }, "name": "0,0005", "type": "bar", "xsrc": "mahendraadir:0:989c6f", "ysrc": "mahendraadir:0:843d0c" }, { "uid": "52b1e9", "meta": { "columnNames": { "x": "Akurasi, x;F1-score (1), x; F1-score (0), x; F1-score (2), x", "y": "0,00005, y" } }, "name": "0,00005", "type": "bar", "xsrc": "mahendraadir:0:989c6f", "ysrc": "mahendraadir:0:84ff71" }, { "uid": "d0b68d", "meta": { "columnNames": { "x": "Akurasi, x;F1-score (1), x; F1-score (0), x; F1-score (2), x", "y": "0,000005, y" } }, "name": "0,000005", "type": "bar", "xsrc": "mahendraadir:0:989c6f", "ysrc": "mahendraadir:0:13f658" } ], "frames": [], "layout": { "title": { "text": "Perbandingan Hasil Pengujian Model Filter" }, "width": 869, "xaxis": { "type": "category", "range": [ -0.5856269113149848, 3.5 ], "autorange": false }, "yaxis": { "type": "linear", "range": [ -0.015434807827504615, 1.011132000805818 ], "domain": [ 0, 1 ], "autorange": false }, "bargap": 0.19999999999999996, "height": 464, "margin": { "b": 50, "l": 80, "r": 80, "t": 125 }, "barmode": "group", "autosize": true } }, "height": 464, "width": 869, "user": { "profile_url": "https://chart-studio.plotly.com/~mahendraadir", "avatar_url": "https://storage.googleapis.com/plotly-prod-profiles/94.jpg", "background_url": "https://storage.googleapis.com/plotly-prod-profiles/bg-2.jpg", "bio": "", "nickname": "", "website": "", "stream_tokens": null, "feature_set_id": null, "csrf_token": null, "date_joined": "2024-04-03 05:03:59", "mapbox_access_tokens": null, "has_password": null, "username": "mahendraadir", "email": null, "is_active": null, "readonly": null, "is_dash_creator": null, "dash_created_count": null, "is_chart_creator": null, "charts_created_count": null } }, { "creation_time": "2024-04-03T06:14:09.282193Z", "comments": { "results": [], "count": 0 }, "parented": true, "embed_url": "https://chart-studio.plotly.com/~poojatrivedi01712/21.embed", "fid": "poojatrivedi01712:21", "filename": "Plot 21", "filetype": "plot", "img_url": "https://storage.googleapis.com/plotly-prod-images/poojatrivedi01712/21/9_C14G6EVCLFTXFW97AS1KEOBG9I7IAA.png", "image_urls": { "default": "https://storage.googleapis.com/plotly-prod-images/poojatrivedi01712/21/2_AMDRQEKKQNN4NQA0W4RUQP7EORUZUH.png", "block-thumb": "https://storage.googleapis.com/plotly-prod-images/poojatrivedi01712/21/8_XVYKDXPAE7ROSMM37YAXG0JK4T9LSB.png", "list-thumb": "https://storage.googleapis.com/plotly-prod-images/poojatrivedi01712/21/9_C14G6EVCLFTXFW97AS1KEOBG9I7IAA.png" }, "api_urls": { "files": "https://api.plotly.com/v2/files/poojatrivedi01712:21", "plots": "https://api.plotly.com/v2/plots/poojatrivedi01712:21", "parent": "https://api.plotly.com/v2/folders/home?user=poojatrivedi01712" }, "owner": "poojatrivedi01712", "parent": -1, "preview": "", "referencers": [], "references": [], "title": "", "views": 2, "web_url": "https://chart-studio.plotly.com/~poojatrivedi01712/21/", "world_readable": true, "date_modified": "2024-04-29T07:06:02.714Z", "stars": { "results": [], "count": 0 }, "collaborators": { "results": [], "count": 0 }, "subfolder_count": null, "refresh_interval": null, "organize_view_url": "https://chart-studio.plotly.com/~poojatrivedi01712/21/", "current_user_permission": "read", "is_theme": null, "is_template": false, "autosize": false, "caption": "", "figure": { "data": [ { "meta": { "columnNames": { "x": "B - A", "y": "C" } }, "mode": "markers", "type": "histogram2d", "xgap": 2, "xsrc": "poojatrivedi01712:20:7b0a76,acc63b*", "ygap": 0, "ysrc": "poojatrivedi01712:20:83feda", "colorbar": { "ypad": 0, "ticks": "outside", "title": { "text": "" }, "bgcolor": "rgb(254, 249, 249)", "lenmode": "fraction", "tickmode": "linear", "borderwidth": 0, "outlinewidth": 1, "showticklabels": true }, "showlegend": false, "autocolorscale": true } ], "frames": [], "layout": { "font": { "size": 9.5, "color": "rgb(8, 7, 7)", "family": "Arial" }, "width": 921, "xaxis": { "side": "bottom", "type": "multicategory", "range": [ -0.5, 4.5 ], "tick0": 10, "title": { "font": { "family": "Arial" }, "text": "Prakriti in DMD and BMD" }, "mirror": false, "nticks": 0, "tickson": "boundaries", "showline": true, "tickmode": "auto", "zeroline": false, "autorange": true, "gridwidth": 18, "automargin": true, "showspikes": true, "rangeslider": { "range": [ -0.5, 4.5 ], "yaxis": {}, "visible": false, "autorange": true }, "showticklabels": true, "separatethousands": true }, "yaxis": { "type": "category", "range": [ -0.5, 71.5 ], "title": { "text": "Mutation" }, "tickson": "labels", "showgrid": true, "showline": false, "tickfont": { "size": 3 }, "tickmode": "linear", "zeroline": false, "autorange": true, "gridwidth": 17, "showspikes": true, "spikethickness": 15 }, "height": 599, "margin": { "pad": 5 }, "modebar": { "orientation": "v" }, "autosize": false, "colorway": [ "#4c78a8", "#f58518", "#e45756", "#72b7b2", "#54a24b", "#eeca3b", "#b279a2", "#ff9da6", "#9d755d", "#bab0ac" ], "dragmode": "zoom", "template": { "themeRef": "PLOTLY_CLASSIC" }, "hovermode": "x", "colorscale": { "diverging": [ [ 0, "#050aac" ], [ 0.2, "#6a89f7" ], [ 0.4, "#bebebe" ], [ 0.6, "#dcaa84" ], [ 0.8, "#e6915a" ], [ 1, "#b20a1c" ] ], "sequential": [ [ 0, "#440154" ], [ 0.1111111111111111, "#482878" ], [ 0.2222222222222222, "#3e4989" ], [ 0.3333333333333333, "#31688e" ], [ 0.4444444444444444, "#26828e" ], [ 0.5555555555555556, "#1f9e89" ], [ 0.6666666666666666, "#35b779" ], [ 0.7777777777777778, "#6ece58" ], [ 0.8888888888888888, "#b5de2b" ], [ 1, "#fde725" ] ], "sequentialminus": [ [ 0, "#440154" ], [ 0.1111111111111111, "#482878" ], [ 0.2222222222222222, "#3e4989" ], [ 0.3333333333333333, "#31688e" ], [ 0.4444444444444444, "#26828e" ], [ 0.5555555555555556, "#1f9e89" ], [ 0.6666666666666666, "#35b779" ], [ 0.7777777777777778, "#6ece58" ], [ 0.8888888888888888, "#b5de2b" ], [ 1, "#fde725" ] ] }, "hoverlabel": { "font": { "size": 16, "family": "Arial" }, "bgcolor": "#FFF" }, "showlegend": true, "uniformtext": { "mode": "show" } } }, "height": 599, "width": 921, "user": { "profile_url": "https://chart-studio.plotly.com/~poojatrivedi01712", "avatar_url": "https://storage.googleapis.com/plotly-prod-profiles/95.jpg", "background_url": "https://storage.googleapis.com/plotly-prod-profiles/bg-6.jpg", "bio": "", "nickname": "", "website": "", "stream_tokens": null, "feature_set_id": null, "csrf_token": null, "date_joined": "2024-04-02 03:46:19", "mapbox_access_tokens": null, "has_password": null, "username": "poojatrivedi01712", "email": null, "is_active": null, "readonly": null, "is_dash_creator": null, "dash_created_count": null, "is_chart_creator": null, "charts_created_count": null } }, { "creation_time": "2024-04-03T06:06:57.715773Z", "comments": { "results": [], "count": 0 }, "parented": true, "embed_url": "https://chart-studio.plotly.com/~patelfarukh/5.embed", "fid": "patelfarukh:5", "filename": "Plot 5", "filetype": "plot", "img_url": "https://storage.googleapis.com/plotly-prod-images/patelfarukh/5/9_DP9YV0AHIS0FXK3YL2VK6YACHXHZCU.png", "image_urls": { "default": "https://storage.googleapis.com/plotly-prod-images/patelfarukh/5/2_FF1JBOBADHNEWBKJ2SLKIOL95D4MEN.png", "block-thumb": "https://storage.googleapis.com/plotly-prod-images/patelfarukh/5/8_GKJZL4SINLFM3WXVCNUUMUQMT6QZZM.png", "list-thumb": "https://storage.googleapis.com/plotly-prod-images/patelfarukh/5/9_DP9YV0AHIS0FXK3YL2VK6YACHXHZCU.png" }, "api_urls": { "files": "https://api.plotly.com/v2/files/patelfarukh:5", "plots": "https://api.plotly.com/v2/plots/patelfarukh:5", "parent": "https://api.plotly.com/v2/folders/home?user=patelfarukh" }, "owner": "patelfarukh", "parent": -1, "preview": "", "referencers": [], "references": [], "title": "", "views": 1, "web_url": "https://chart-studio.plotly.com/~patelfarukh/5/", "world_readable": true, "date_modified": "2024-04-03T06:41:21.964Z", "stars": { "results": [], "count": 0 }, "collaborators": { "results": [], "count": 0 }, "subfolder_count": null, "refresh_interval": null, "organize_view_url": "https://chart-studio.plotly.com/~patelfarukh/5/", "current_user_permission": "read", "is_theme": null, "is_template": false, "autosize": true, "caption": "", "figure": { "data": [ { "meta": { "columnNames": { "x": "A", "y": "B" } }, "mode": "lines", "type": "scatter", "xsrc": "patelfarukh:4:9dfc3a", "ysrc": "patelfarukh:4:25ee1d", "visible": true }, { "meta": { "columnNames": { "x": "A", "y": "C" } }, "mode": "lines", "type": "scatter", "xsrc": "patelfarukh:4:9dfc3a", "ysrc": "patelfarukh:4:77ae61", "stackgroup": null }, { "meta": { "columnNames": { "x": "A", "y": "D" } }, "mode": "lines", "type": "scatter", "xsrc": "patelfarukh:4:9dfc3a", "ysrc": "patelfarukh:4:7c4b72", "stackgroup": null } ], "frames": [], "layout": { "title": { "text": "DRAIN CHARACTERSTICS" }, "xaxis": { "type": "linear", "range": [ 0.5, 10 ], "title": { "text": "voltage at gate to source" }, "autorange": true }, "yaxis": { "type": "linear", "range": [ -0.09111111111111114, 7.5311111111111115 ], "title": { "text": "drain current" }, "autorange": true }, "autosize": true, "template": { "data": { "bar": [ { "type": "bar", "marker": { "colorbar": { "ticks": "", "outlinewidth": 0 } } } ], "table": [ { "type": "table", "cells": { "fill": { "color": "#EBF0F8" }, "line": { "color": "white" } }, "header": { "fill": { "color": "#C8D4E3" }, "line": { "color": "white" } } } ], "carpet": [ { "type": "carpet", "aaxis": { "gridcolor": "#C8D4E3", "linecolor": "#C8D4E3", "endlinecolor": "#2a3f5f", "minorgridcolor": "#C8D4E3", "startlinecolor": "#2a3f5f" }, "baxis": { "gridcolor": "#C8D4E3", "linecolor": "#C8D4E3", "endlinecolor": "#2a3f5f", "minorgridcolor": "#C8D4E3", "startlinecolor": "#2a3f5f" } } ], "mesh3d": [ { "type": "mesh3d", "colorbar": { "ticks": "", "outlinewidth": 0 } } ], "contour": [ { "type": "contour", "colorbar": { "ticks": "", "outlinewidth": 0 }, "autocolorscale": true } ], "heatmap": [ { "type": "heatmap", "colorbar": { "ticks": "", "outlinewidth": 0 }, "autocolorscale": true } ], "scatter": [ { "type": "scatter", "marker": { "colorbar": { "ticks": "", "outlinewidth": 0 } } } ], "surface": [ { "type": "surface", "colorbar": { "ticks": "", "outlinewidth": 0 } } ], "heatmapgl": [ { "type": "heatmapgl", "colorbar": { "ticks": "", "outlinewidth": 0 } } ], "histogram": [ { "type": "histogram", "marker": { "colorbar": { "ticks": "", "outlinewidth": 0 } } } ], "parcoords": [ { "line": { "colorbar": { "ticks": "", "outlinewidth": 0 } }, "type": "parcoords" } ], "scatter3d": [ { "type": "scatter3d", "marker": { "colorbar": { "ticks": "", "outlinewidth": 0 } } } ], "scattergl": [ { "type": "scattergl", "marker": { "colorbar": { "ticks": "", "outlinewidth": 0 } } } ], "choropleth": [ { "type": "choropleth", "colorbar": { "ticks": "", "outlinewidth": 0 } } ], "scattergeo": [ { "type": "scattergeo", "marker": { "colorbar": { "ticks": "", "outlinewidth": 0 } } } ], "histogram2d": [ { "type": "histogram2d", "colorbar": { "ticks": "", "outlinewidth": 0 }, "autocolorscale": true } ], "scatterpolar": [ { "type": "scatterpolar", "marker": { "colorbar": { "ticks": "", "outlinewidth": 0 } } } ], "contourcarpet": [ { "type": "contourcarpet", "colorbar": { "ticks": "", "outlinewidth": 0 } } ], "scattercarpet": [ { "type": "scattercarpet", "marker": { "colorbar": { "ticks": "", "outlinewidth": 0 } } } ], "scattermapbox": [ { "type": "scattermapbox", "marker": { "colorbar": { "ticks": "", "outlinewidth": 0 } } } ], "scatterpolargl": [ { "type": "scatterpolargl", "marker": { "colorbar": { "ticks": "", "outlinewidth": 0 } } } ], "scatterternary": [ { "type": "scatterternary", "marker": { "colorbar": { "ticks": "", "outlinewidth": 0 } } } ], "histogram2dcontour": [ { "type": "histogram2dcontour", "colorbar": { "ticks": "", "outlinewidth": 0 }, "autocolorscale": true } ] }, "layout": { "geo": { "bgcolor": "white", "showland": true, "lakecolor": "white", "landcolor": "white", "showlakes": true, "subunitcolor": "#C8D4E3" }, "font": { "color": "#2a3f5f" }, "polar": { "bgcolor": "white", "radialaxis": { "ticks": "", "gridcolor": "#EBF0F8", "linecolor": "#EBF0F8" }, "angularaxis": { "ticks": "", "gridcolor": "#EBF0F8", "linecolor": "#EBF0F8" } }, "scene": { "xaxis": { "ticks": "", "gridcolor": "#DFE8F3", "gridwidth": 2, "linecolor": "#EBF0F8", "zerolinecolor": "#EBF0F8", "showbackground": true, "backgroundcolor": "white" }, "yaxis": { "ticks": "", "gridcolor": "#DFE8F3", "gridwidth": 2, "linecolor": "#EBF0F8", "zerolinecolor": "#EBF0F8", "showbackground": true, "backgroundcolor": "white" }, "zaxis": { "ticks": "", "gridcolor": "#DFE8F3", "gridwidth": 2, "linecolor": "#EBF0F8", "zerolinecolor": "#EBF0F8", "showbackground": true, "backgroundcolor": "white" } }, "title": { "x": 0.05 }, "xaxis": { "ticks": "", "gridcolor": "#EBF0F8", "linecolor": "#EBF0F8", "automargin": true, "zerolinecolor": "#EBF0F8", "zerolinewidth": 2 }, "yaxis": { "ticks": "", "gridcolor": "#EBF0F8", "linecolor": "#EBF0F8", "automargin": true, "zerolinecolor": "#EBF0F8", "zerolinewidth": 2 }, "ternary": { "aaxis": { "ticks": "", "gridcolor": "#DFE8F3", "linecolor": "#A2B1C6" }, "baxis": { "ticks": "", "gridcolor": "#DFE8F3", "linecolor": "#A2B1C6" }, "caxis": { "ticks": "", "gridcolor": "#DFE8F3", "linecolor": "#A2B1C6" }, "bgcolor": "white" }, "colorway": [ "#636efa", "#EF553B", "#00cc96", "#ab63fa", "#19d3f3", "#e763fa", "#fecb52", "#ffa15a", "#ff6692", "#b6e880" ], "hovermode": "closest", "colorscale": { "diverging": [ [ 0, "#8e0152" ], [ 0.1, "#c51b7d" ], [ 0.2, "#de77ae" ], [ 0.3, "#f1b6da" ], [ 0.4, "#fde0ef" ], [ 0.5, "#f7f7f7" ], [ 0.6, "#e6f5d0" ], [ 0.7, "#b8e186" ], [ 0.8, "#7fbc41" ], [ 0.9, "#4d9221" ], [ 1, "#276419" ] ], "sequential": [ [ 0, "#0508b8" ], [ 0.0893854748603352, "#1910d8" ], [ 0.1787709497206704, "#3c19f0" ], [ 0.2681564245810056, "#6b1cfb" ], [ 0.3575418994413408, "#981cfd" ], [ 0.44692737430167595, "#bf1cfd" ], [ 0.5363128491620112, "#dd2bfd" ], [ 0.6256983240223464, "#f246fe" ], [ 0.7150837988826816, "#fc67fd" ], [ 0.8044692737430168, "#fe88fc" ], [ 0.8938547486033519, "#fea5fd" ], [ 0.9832402234636871, "#febefe" ], [ 1, "#fec3fe" ] ], "sequentialminus": [ [ 0, "#0508b8" ], [ 0.0893854748603352, "#1910d8" ], [ 0.1787709497206704, "#3c19f0" ], [ 0.2681564245810056, "#6b1cfb" ], [ 0.3575418994413408, "#981cfd" ], [ 0.44692737430167595, "#bf1cfd" ], [ 0.5363128491620112, "#dd2bfd" ], [ 0.6256983240223464, "#f246fe" ], [ 0.7150837988826816, "#fc67fd" ], [ 0.8044692737430168, "#fe88fc" ], [ 0.8938547486033519, "#fea5fd" ], [ 0.9832402234636871, "#febefe" ], [ 1, "#fec3fe" ] ] }, "plot_bgcolor": "white", "paper_bgcolor": "white", "shapedefaults": { "line": { "width": 0 }, "opacity": 0.4, "fillcolor": "#506784" }, "annotationdefaults": { "arrowhead": 0, "arrowcolor": "#506784", "arrowwidth": 1 } }, "themeRef": "PLOTLY_WHITE" } } }, "height": null, "width": null, "user": { "profile_url": "https://chart-studio.plotly.com/~patelfarukh", "avatar_url": "https://storage.googleapis.com/plotly-prod-profiles/67.jpg", "background_url": "https://storage.googleapis.com/plotly-prod-profiles/bg-9.jpg", "bio": "", "nickname": "", "website": "", "stream_tokens": null, "feature_set_id": null, "csrf_token": null, "date_joined": "2024-04-01 15:08:31", "mapbox_access_tokens": null, "has_password": null, "username": "patelfarukh", "email": null, "is_active": null, "readonly": null, "is_dash_creator": null, "dash_created_count": null, "is_chart_creator": null, "charts_created_count": null } } ] }
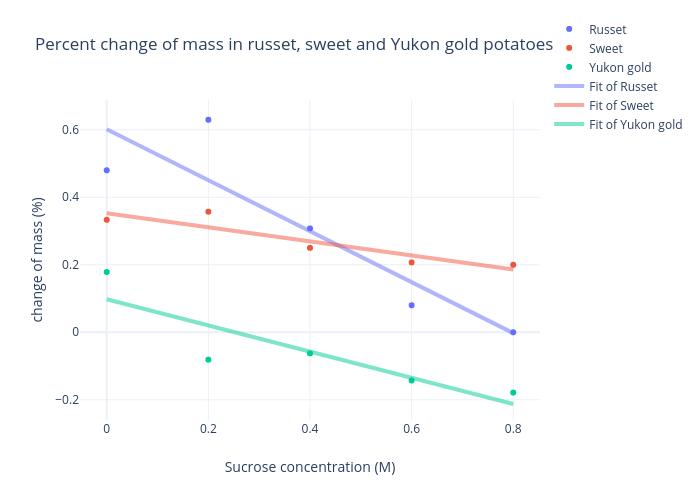