Plots List
Plots
This endpoint handles manipulation of Plotly plot files.
Reference
Authorization
Any user with or without a Plotly account may view public plots. For private plots, see authentication.
Actions
list
Listing all public plots can be done via a GET request to this endpoint.
By default, plots will be listed in order of date created. The order_by
query parameter is accepted at this endpoint. Currently, only ordering by
views is supported. It is possible to filter the plots by quality
with min_quality or max_quality as query parameter.
Example:
// GET https://api.plotly.com/v2/plots/ ---> 200

// GET https://api.plotly.com/v2/plots/?order_by=-views ---> 200

// GET https://api.plotly.com/v2/plots/?min_quality=5 ---> 200

// GET https://api.plotly.com/v2/plots/?max_quality=5 ---> 200
feed
Listing all handpicked feed plots can be done via a GET request to this endpoint. By default, plots will be listed in a random order.
Example:
// GET https://api.plotly.com/v2/plots/feed ---> 200
create
You can create new plot resources here. The only required field is 'figure'. Currently, the figure is restricted to only contain references to grid data. That is, this will fail if raw data arrays are passed in. To create and manipulate underlying grids for plots, see the grids endpoint.
Example:
// This fails because a figure field is required.
// POST https://api.plotly.com/v2/plots ---> 400 Bad Request
{}

// This fails because the figure has raw data
//POST https://api.plotly.com/v2/plots ---> 400 Bad Request
{
    "figure": {"data": [{"y": ['this', 'is', 'raw', 'data']}]}
}

// This succeeds because the figure has src keys, not raw data.
//POST https://api.plotly.com/v2/plots ---> 200 OK
{
    "figure": {"data": [{"ysrc": "sven:88:u8nd62"}]}
}
When creating a grid, you can optionally specify a source_fid to specify where a plot has come from:
- source_fid: the fid of a plot that was copied (and presumably edited) to produce this one
detail
There is a lot of meta information stored about plot files including filename, title, share_url, and content_url to name a few.
This information can only be reached with a GET to this endpoint.
Example:
// GET https://api.plotly.com/v2/plots/iheartgraphs:90
content
The contents of a plot can be downloaded via the content resource. The plot
content contains referenced grid/column data by default. If you wish to
return the raw grid/column data, the inline_data=true query must be included
in the request url. The Content-Type header will be appropriately set for the
response body.
Alternatively, you can set ?map_data=unreadable to append a mapping of
sources to data that belongs to grids which are unreadable for the
requestor. This is useful when you have read access to another users plot,
but that plot contains grid references which you don't have access to.
Examples:
// Returns referenced grid/column data
// GET https://api.plotly.com/v2/plots/iheartgraphs:90/content ---> 200 OK

// Returns full grid/column data
// GET https://api.plotly.com/v2/plots/iheartgraphs:90/content?inline_data=true ---> 200 OK

// Returns full grid/column data when requestor doesn't have permission
// to read the referenced grid.
// GET https://api.plotly.com/v2/plots/iheartgraphs:90/content?map_data=unreadable ---> 200 OK
GET /v2/plots?cursor=cj0xJnA9MjAyNC0wNC0wMisxMSUzQTMxJTNBNDEuODIzMzIxJTJCMDAlM0EwMA%3D%3D&format=api
{ "next": "https://api.plot.ly/v2/plots?cursor=cD0yMDI0LTA0LTAyKzExJTNBMzclM0E1MS42NTUwODMlMkIwMCUzQTAw&format=api", "previous": "https://api.plot.ly/v2/plots?cursor=cj0xJnA9MjAyNC0wNC0wMisxMiUzQTM1JTNBMTkuMTU3NzQzJTJCMDAlM0EwMA%3D%3D&format=api", "results": [ { "creation_time": "2024-04-02T12:35:19.157743Z", "comments": { "results": [], "count": 0 }, "parented": true, "embed_url": "https://chart-studio.plotly.com/~Chapui/6.embed", "fid": "Chapui:6", "filename": "lineplt_temp_Steinfurt", "filetype": "plot", "img_url": "https://storage.googleapis.com/plotly-prod-images/Chapui/6/9_A0G386RJJWT16K58R1F6DYCMQ8LZ9V.png", "image_urls": { "default": "https://storage.googleapis.com/plotly-prod-images/Chapui/6/2_SQ4ARCIQ5BC020KCNRA27PFK8KXAMA.png", "block-thumb": "https://storage.googleapis.com/plotly-prod-images/Chapui/6/8_R2CXLEVNSQ75NMB8PMVJO4GEAE3QU3.png", "list-thumb": "https://storage.googleapis.com/plotly-prod-images/Chapui/6/9_A0G386RJJWT16K58R1F6DYCMQ8LZ9V.png" }, "api_urls": { "files": "https://api.plotly.com/v2/files/Chapui:6", "plots": "https://api.plotly.com/v2/plots/Chapui:6", "parent": "https://api.plotly.com/v2/folders/home?user=Chapui" }, "owner": "Chapui", "parent": -1, "preview": "", "referencers": [], "references": [], "title": "", "views": 31, "web_url": "https://chart-studio.plotly.com/~Chapui/6/", "world_readable": true, "date_modified": "2024-11-12T07:26:20.457Z", "stars": { "results": [], "count": 0 }, "collaborators": { "results": [], "count": 0 }, "subfolder_count": null, "refresh_interval": null, "organize_view_url": "https://chart-studio.plotly.com/~Chapui/6/", "current_user_permission": "read", "is_theme": null, "is_template": null, "autosize": true, "caption": "", "figure": { "data": [ { "line": { "width": 1 }, "mode": "lines+markers", "name": "Monatsmittelwert der Lufttemperatur - bodennah", "type": "scatter", "xsrc": "Chapui:13:2a6abc", "ysrc": "Chapui:13:02f417", "marker": { "size": 2 }, "hovertemplate": "Datum = %{x} <br>Temperatur = °C%{y:.2f}" }, { "line": { "width": 1 }, "mode": "lines", "name": "Trendlinie", "type": "scatter", "xsrc": "Chapui:13:306cef", "ysrc": "Chapui:13:837f1e", "marker": { "size": 2 }, "hovertemplate": "Datum = %{x} <br>Temperatur = °C%{y:.2f}" }, { "line": { "width": 1 }, "mode": "lines+markers", "name": "Jahresmittelwert der Lufttemperatur - bodennah", "type": "scatter", "xsrc": "Chapui:13:a8ff89", "ysrc": "Chapui:13:6191c7", "marker": { "size": 2 }, "visible": false, "hovertemplate": "Datum = %{x} <br>Temperatur = °C%{y:.2f}" } ], "layout": { "title": { "x": 0.5 }, "xaxis": { "showgrid": false }, "yaxis": { "title": { "text": "°C" }, "showgrid": false }, "template": { "data": { "bar": [ { "type": "bar", "marker": { "line": { "color": "#E5ECF6", "width": 0.5 }, "pattern": { "size": 10, "fillmode": "overlay", "solidity": 0.2 } }, "error_x": { "color": "#2a3f5f" }, "error_y": { "color": "#2a3f5f" } } ], "pie": [ { "type": "pie", "automargin": true } ], "table": [ { "type": "table", "cells": { "fill": { "color": "#EBF0F8" }, "line": { "color": "white" } }, "header": { "fill": { "color": "#C8D4E3" }, "line": { "color": "white" } } } ], "carpet": [ { "type": "carpet", "aaxis": { "gridcolor": "white", "linecolor": "white", "endlinecolor": "#2a3f5f", "minorgridcolor": "white", "startlinecolor": "#2a3f5f" }, "baxis": { "gridcolor": "white", "linecolor": "white", "endlinecolor": "#2a3f5f", "minorgridcolor": "white", "startlinecolor": "#2a3f5f" } } ], "mesh3d": [ { "type": "mesh3d", "colorbar": { "ticks": "", "outlinewidth": 0 } } ], "contour": [ { "type": "contour", "colorbar": { "ticks": "", "outlinewidth": 0 }, "colorscale": [ [ 0.0, "#0d0887" ], [ 0.1111111111111111, "#46039f" ], [ 0.2222222222222222, "#7201a8" ], [ 0.3333333333333333, "#9c179e" ], [ 0.4444444444444444, "#bd3786" ], [ 0.5555555555555556, "#d8576b" ], [ 0.6666666666666666, "#ed7953" ], [ 0.7777777777777778, "#fb9f3a" ], [ 0.8888888888888888, "#fdca26" ], [ 1.0, "#f0f921" ] ] } ], "heatmap": [ { "type": "heatmap", "colorbar": { "ticks": "", "outlinewidth": 0 }, "colorscale": [ [ 0.0, "#0d0887" ], [ 0.1111111111111111, "#46039f" ], [ 0.2222222222222222, "#7201a8" ], [ 0.3333333333333333, "#9c179e" ], [ 0.4444444444444444, "#bd3786" ], [ 0.5555555555555556, "#d8576b" ], [ 0.6666666666666666, "#ed7953" ], [ 0.7777777777777778, "#fb9f3a" ], [ 0.8888888888888888, "#fdca26" ], [ 1.0, "#f0f921" ] ] } ], "scatter": [ { "type": "scatter", "fillpattern": { "size": 10, "fillmode": "overlay", "solidity": 0.2 } } ], "surface": [ { "type": "surface", "colorbar": { "ticks": "", "outlinewidth": 0 }, "colorscale": [ [ 0.0, "#0d0887" ], [ 0.1111111111111111, "#46039f" ], [ 0.2222222222222222, "#7201a8" ], [ 0.3333333333333333, "#9c179e" ], [ 0.4444444444444444, "#bd3786" ], [ 0.5555555555555556, "#d8576b" ], [ 0.6666666666666666, "#ed7953" ], [ 0.7777777777777778, "#fb9f3a" ], [ 0.8888888888888888, "#fdca26" ], [ 1.0, "#f0f921" ] ] } ], "barpolar": [ { "type": "barpolar", "marker": { "line": { "color": "#E5ECF6", "width": 0.5 }, "pattern": { "size": 10, "fillmode": "overlay", "solidity": 0.2 } } } ], "heatmapgl": [ { "type": "heatmapgl", "colorbar": { "ticks": "", "outlinewidth": 0 }, "colorscale": [ [ 0.0, "#0d0887" ], [ 0.1111111111111111, "#46039f" ], [ 0.2222222222222222, "#7201a8" ], [ 0.3333333333333333, "#9c179e" ], [ 0.4444444444444444, "#bd3786" ], [ 0.5555555555555556, "#d8576b" ], [ 0.6666666666666666, "#ed7953" ], [ 0.7777777777777778, "#fb9f3a" ], [ 0.8888888888888888, "#fdca26" ], [ 1.0, "#f0f921" ] ] } ], "histogram": [ { "type": "histogram", "marker": { "pattern": { "size": 10, "fillmode": "overlay", "solidity": 0.2 } } } ], "parcoords": [ { "line": { "colorbar": { "ticks": "", "outlinewidth": 0 } }, "type": "parcoords" } ], "scatter3d": [ { "line": { "colorbar": { "ticks": "", "outlinewidth": 0 } }, "type": "scatter3d", "marker": { "colorbar": { "ticks": "", "outlinewidth": 0 } } } ], "scattergl": [ { "type": "scattergl", "marker": { "colorbar": { "ticks": "", "outlinewidth": 0 } } } ], "choropleth": [ { "type": "choropleth", "colorbar": { "ticks": "", "outlinewidth": 0 } } ], "scattergeo": [ { "type": "scattergeo", "marker": { "colorbar": { "ticks": "", "outlinewidth": 0 } } } ], "histogram2d": [ { "type": "histogram2d", "colorbar": { "ticks": "", "outlinewidth": 0 }, "colorscale": [ [ 0.0, "#0d0887" ], [ 0.1111111111111111, "#46039f" ], [ 0.2222222222222222, "#7201a8" ], [ 0.3333333333333333, "#9c179e" ], [ 0.4444444444444444, "#bd3786" ], [ 0.5555555555555556, "#d8576b" ], [ 0.6666666666666666, "#ed7953" ], [ 0.7777777777777778, "#fb9f3a" ], [ 0.8888888888888888, "#fdca26" ], [ 1.0, "#f0f921" ] ] } ], "scatterpolar": [ { "type": "scatterpolar", "marker": { "colorbar": { "ticks": "", "outlinewidth": 0 } } } ], "contourcarpet": [ { "type": "contourcarpet", "colorbar": { "ticks": "", "outlinewidth": 0 } } ], "scattercarpet": [ { "type": "scattercarpet", "marker": { "colorbar": { "ticks": "", "outlinewidth": 0 } } } ], "scattermapbox": [ { "type": "scattermapbox", "marker": { "colorbar": { "ticks": "", "outlinewidth": 0 } } } ], "scatterpolargl": [ { "type": "scatterpolargl", "marker": { "colorbar": { "ticks": "", "outlinewidth": 0 } } } ], "scatterternary": [ { "type": "scatterternary", "marker": { "colorbar": { "ticks": "", "outlinewidth": 0 } } } ], "histogram2dcontour": [ { "type": "histogram2dcontour", "colorbar": { "ticks": "", "outlinewidth": 0 }, "colorscale": [ [ 0.0, "#0d0887" ], [ 0.1111111111111111, "#46039f" ], [ 0.2222222222222222, "#7201a8" ], [ 0.3333333333333333, "#9c179e" ], [ 0.4444444444444444, "#bd3786" ], [ 0.5555555555555556, "#d8576b" ], [ 0.6666666666666666, "#ed7953" ], [ 0.7777777777777778, "#fb9f3a" ], [ 0.8888888888888888, "#fdca26" ], [ 1.0, "#f0f921" ] ] } ] }, "layout": { "geo": { "bgcolor": "white", "showland": true, "lakecolor": "white", "landcolor": "#E5ECF6", "showlakes": true, "subunitcolor": "white" }, "font": { "color": "#2a3f5f" }, "polar": { "bgcolor": "#E5ECF6", "radialaxis": { "ticks": "", "gridcolor": "white", "linecolor": "white" }, "angularaxis": { "ticks": "", "gridcolor": "white", "linecolor": "white" } }, "scene": { "xaxis": { "ticks": "", "gridcolor": "white", "gridwidth": 2, "linecolor": "white", "zerolinecolor": "white", "showbackground": true, "backgroundcolor": "#E5ECF6" }, "yaxis": { "ticks": "", "gridcolor": "white", "gridwidth": 2, "linecolor": "white", "zerolinecolor": "white", "showbackground": true, "backgroundcolor": "#E5ECF6" }, "zaxis": { "ticks": "", "gridcolor": "white", "gridwidth": 2, "linecolor": "white", "zerolinecolor": "white", "showbackground": true, "backgroundcolor": "#E5ECF6" } }, "title": { "x": 0.05 }, "xaxis": { "ticks": "", "title": { "standoff": 15 }, "gridcolor": "white", "linecolor": "white", "automargin": true, "zerolinecolor": "white", "zerolinewidth": 2 }, "yaxis": { "ticks": "", "title": { "standoff": 15 }, "gridcolor": "white", "linecolor": "white", "automargin": true, "zerolinecolor": "white", "zerolinewidth": 2 }, "mapbox": { "style": "light" }, "ternary": { "aaxis": { "ticks": "", "gridcolor": "white", "linecolor": "white" }, "baxis": { "ticks": "", "gridcolor": "white", "linecolor": "white" }, "caxis": { "ticks": "", "gridcolor": "white", "linecolor": "white" }, "bgcolor": "#E5ECF6" }, "colorway": [ "#636efa", "#EF553B", "#00cc96", "#ab63fa", "#FFA15A", "#19d3f3", "#FF6692", "#B6E880", "#FF97FF", "#FECB52" ], "coloraxis": { "colorbar": { "ticks": "", "outlinewidth": 0 } }, "hovermode": "closest", "colorscale": { "diverging": [ [ 0, "#8e0152" ], [ 0.1, "#c51b7d" ], [ 0.2, "#de77ae" ], [ 0.3, "#f1b6da" ], [ 0.4, "#fde0ef" ], [ 0.5, "#f7f7f7" ], [ 0.6, "#e6f5d0" ], [ 0.7, "#b8e186" ], [ 0.8, "#7fbc41" ], [ 0.9, "#4d9221" ], [ 1, "#276419" ] ], "sequential": [ [ 0.0, "#0d0887" ], [ 0.1111111111111111, "#46039f" ], [ 0.2222222222222222, "#7201a8" ], [ 0.3333333333333333, "#9c179e" ], [ 0.4444444444444444, "#bd3786" ], [ 0.5555555555555556, "#d8576b" ], [ 0.6666666666666666, "#ed7953" ], [ 0.7777777777777778, "#fb9f3a" ], [ 0.8888888888888888, "#fdca26" ], [ 1.0, "#f0f921" ] ], "sequentialminus": [ [ 0.0, "#0d0887" ], [ 0.1111111111111111, "#46039f" ], [ 0.2222222222222222, "#7201a8" ], [ 0.3333333333333333, "#9c179e" ], [ 0.4444444444444444, "#bd3786" ], [ 0.5555555555555556, "#d8576b" ], [ 0.6666666666666666, "#ed7953" ], [ 0.7777777777777778, "#fb9f3a" ], [ 0.8888888888888888, "#fdca26" ], [ 1.0, "#f0f921" ] ] }, "hoverlabel": { "align": "left" }, "plot_bgcolor": "#E5ECF6", "paper_bgcolor": "white", "shapedefaults": { "line": { "color": "#2a3f5f" } }, "autotypenumbers": "strict", "annotationdefaults": { "arrowhead": 0, "arrowcolor": "#2a3f5f", "arrowwidth": 1 } } }, "hoverlabel": { "font": { "size": 10 }, "bgcolor": "rgb(0, 0, 0, 0 )", "bordercolor": "whitesmoke" }, "showlegend": false, "updatemenus": [ { "x": 0.3, "y": 1.2, "buttons": [ { "args": [ { "visible": [ true, true, false ] } ], "label": "Monatsmittel des Lufttemperatur", "method": "restyle", "visible": true }, { "args": [ { "visible": [ false, true, true ] } ], "label": "Jahresmittel der Lufttemperatur", "method": "restyle", "visible": true } ], "xanchor": "left", "yanchor": "top", "direction": "down", "showactive": true } ], "plot_bgcolor": "rgb(255, 255, 255)" } }, "height": null, "width": null, "user": { "profile_url": "https://chart-studio.plotly.com/~Chapui", "avatar_url": "https://storage.googleapis.com/plotly-prod-profiles/80.jpg", "background_url": "https://storage.googleapis.com/plotly-prod-profiles/bg-3.jpg", "bio": "", "nickname": "", "website": "", "stream_tokens": null, "feature_set_id": null, "csrf_token": null, "date_joined": "2024-04-02 11:25:38", "mapbox_access_tokens": null, "has_password": null, "username": "Chapui", "email": null, "is_active": null, "readonly": null, "is_dash_creator": null, "dash_created_count": null, "is_chart_creator": null, "charts_created_count": null } }, { "creation_time": "2024-04-02T12:33:33.187154Z", "comments": { "results": [], "count": 0 }, "parented": true, "embed_url": "https://chart-studio.plotly.com/~superpotato2812/15.embed", "fid": "superpotato2812:15", "filename": "mem1", "filetype": "plot", "img_url": "https://storage.googleapis.com/plotly-prod-images/superpotato2812/15/9_HID9NPA8F4Z152JLG9LOKC4NKKI2SP.png", "image_urls": { "default": "https://storage.googleapis.com/plotly-prod-images/superpotato2812/15/2_PCKBQOH0WIPVZ4BKL6C36KHQSH8C9O.png", "block-thumb": "https://storage.googleapis.com/plotly-prod-images/superpotato2812/15/8_2JWPHSIB0KE69LGQWPP6182S577LSV.png", "list-thumb": "https://storage.googleapis.com/plotly-prod-images/superpotato2812/15/9_HID9NPA8F4Z152JLG9LOKC4NKKI2SP.png" }, "api_urls": { "files": "https://api.plotly.com/v2/files/superpotato2812:15", "plots": "https://api.plotly.com/v2/plots/superpotato2812:15", "parent": "https://api.plotly.com/v2/folders/home?user=superpotato2812" }, "owner": "superpotato2812", "parent": -1, "preview": "", "referencers": [], "references": [], "title": "", "views": 2, "web_url": "https://chart-studio.plotly.com/~superpotato2812/15/", "world_readable": true, "date_modified": "2024-04-10T10:58:57.339Z", "stars": { "results": [], "count": 0 }, "collaborators": { "results": [], "count": 0 }, "subfolder_count": null, "refresh_interval": null, "organize_view_url": "https://chart-studio.plotly.com/~superpotato2812/15/", "current_user_permission": "read", "is_theme": null, "is_template": false, "autosize": true, "caption": "", "figure": { "data": [ { "meta": { "columnNames": { "y": "B" } }, "mode": "lines", "name": "DragonflyDB", "type": "scatter", "ysrc": "superpotato2812:14:59aef1" }, { "meta": { "columnNames": { "y": "C" } }, "mode": "lines", "name": "Redis", "type": "scatter", "ysrc": "superpotato2812:14:b19c98", "stackgroup": null } ], "frames": [], "layout": { "font": { "size": 28, "family": "Arial" }, "title": { "font": { "size": 35 }, "text": "Beanspruchter Speicher mit Child-Prozessen" }, "xaxis": { "range": [ 0, 172 ], "title": { "font": { "size": 30 }, "text": "Zeit in Sekunden" }, "autorange": true }, "yaxis": { "type": "linear", "range": [ 4.348222222222223, 87.62377777777778 ], "title": { "text": "Speicher in MB" }, "autorange": true }, "autosize": true, "template": { "data": { "bar": [ { "type": "bar", "marker": { "colorbar": { "ticks": "", "outlinewidth": 0 } } } ], "table": [ { "type": "table", "cells": { "fill": { "color": "#EBF0F8" }, "line": { "color": "white" } }, "header": { "fill": { "color": "#C8D4E3" }, "line": { "color": "white" } } } ], "carpet": [ { "type": "carpet", "aaxis": { "gridcolor": "#C8D4E3", "linecolor": "#C8D4E3", "endlinecolor": "#2a3f5f", "minorgridcolor": "#C8D4E3", "startlinecolor": "#2a3f5f" }, "baxis": { "gridcolor": "#C8D4E3", "linecolor": "#C8D4E3", "endlinecolor": "#2a3f5f", "minorgridcolor": "#C8D4E3", "startlinecolor": "#2a3f5f" } } ], "mesh3d": [ { "type": "mesh3d", "colorbar": { "ticks": "", "outlinewidth": 0 } } ], "contour": [ { "type": "contour", "colorbar": { "ticks": "", "outlinewidth": 0 }, "autocolorscale": true } ], "heatmap": [ { "type": "heatmap", "colorbar": { "ticks": "", "outlinewidth": 0 }, "autocolorscale": true } ], "scatter": [ { "type": "scatter", "marker": { "colorbar": { "ticks": "", "outlinewidth": 0 } } } ], "surface": [ { "type": "surface", "colorbar": { "ticks": "", "outlinewidth": 0 } } ], "heatmapgl": [ { "type": "heatmapgl", "colorbar": { "ticks": "", "outlinewidth": 0 } } ], "histogram": [ { "type": "histogram", "marker": { "colorbar": { "ticks": "", "outlinewidth": 0 } } } ], "parcoords": [ { "line": { "colorbar": { "ticks": "", "outlinewidth": 0 } }, "type": "parcoords" } ], "scatter3d": [ { "type": "scatter3d", "marker": { "colorbar": { "ticks": "", "outlinewidth": 0 } } } ], "scattergl": [ { "type": "scattergl", "marker": { "colorbar": { "ticks": "", "outlinewidth": 0 } } } ], "choropleth": [ { "type": "choropleth", "colorbar": { "ticks": "", "outlinewidth": 0 } } ], "scattergeo": [ { "type": "scattergeo", "marker": { "colorbar": { "ticks": "", "outlinewidth": 0 } } } ], "histogram2d": [ { "type": "histogram2d", "colorbar": { "ticks": "", "outlinewidth": 0 }, "autocolorscale": true } ], "scatterpolar": [ { "type": "scatterpolar", "marker": { "colorbar": { "ticks": "", "outlinewidth": 0 } } } ], "contourcarpet": [ { "type": "contourcarpet", "colorbar": { "ticks": "", "outlinewidth": 0 } } ], "scattercarpet": [ { "type": "scattercarpet", "marker": { "colorbar": { "ticks": "", "outlinewidth": 0 } } } ], "scattermapbox": [ { "type": "scattermapbox", "marker": { "colorbar": { "ticks": "", "outlinewidth": 0 } } } ], "scatterpolargl": [ { "type": "scatterpolargl", "marker": { "colorbar": { "ticks": "", "outlinewidth": 0 } } } ], "scatterternary": [ { "type": "scatterternary", "marker": { "colorbar": { "ticks": "", "outlinewidth": 0 } } } ], "histogram2dcontour": [ { "type": "histogram2dcontour", "colorbar": { "ticks": "", "outlinewidth": 0 }, "autocolorscale": true } ] }, "layout": { "geo": { "bgcolor": "white", "showland": true, "lakecolor": "white", "landcolor": "white", "showlakes": true, "subunitcolor": "#C8D4E3" }, "font": { "color": "#2a3f5f" }, "polar": { "bgcolor": "white", "radialaxis": { "ticks": "", "gridcolor": "#EBF0F8", "linecolor": "#EBF0F8" }, "angularaxis": { "ticks": "", "gridcolor": "#EBF0F8", "linecolor": "#EBF0F8" } }, "scene": { "xaxis": { "ticks": "", "gridcolor": "#DFE8F3", "gridwidth": 2, "linecolor": "#EBF0F8", "zerolinecolor": "#EBF0F8", "showbackground": true, "backgroundcolor": "white" }, "yaxis": { "ticks": "", "gridcolor": "#DFE8F3", "gridwidth": 2, "linecolor": "#EBF0F8", "zerolinecolor": "#EBF0F8", "showbackground": true, "backgroundcolor": "white" }, "zaxis": { "ticks": "", "gridcolor": "#DFE8F3", "gridwidth": 2, "linecolor": "#EBF0F8", "zerolinecolor": "#EBF0F8", "showbackground": true, "backgroundcolor": "white" } }, "title": { "x": 0.05 }, "xaxis": { "ticks": "", "gridcolor": "#EBF0F8", "linecolor": "#EBF0F8", "automargin": true, "zerolinecolor": "#EBF0F8", "zerolinewidth": 2 }, "yaxis": { "ticks": "", "gridcolor": "#EBF0F8", "linecolor": "#EBF0F8", "automargin": true, "zerolinecolor": "#EBF0F8", "zerolinewidth": 2 }, "ternary": { "aaxis": { "ticks": "", "gridcolor": "#DFE8F3", "linecolor": "#A2B1C6" }, "baxis": { "ticks": "", "gridcolor": "#DFE8F3", "linecolor": "#A2B1C6" }, "caxis": { "ticks": "", "gridcolor": "#DFE8F3", "linecolor": "#A2B1C6" }, "bgcolor": "white" }, "colorway": [ "#636efa", "#EF553B", "#00cc96", "#ab63fa", "#19d3f3", "#e763fa", "#fecb52", "#ffa15a", "#ff6692", "#b6e880" ], "hovermode": "closest", "colorscale": { "diverging": [ [ 0, "#8e0152" ], [ 0.1, "#c51b7d" ], [ 0.2, "#de77ae" ], [ 0.3, "#f1b6da" ], [ 0.4, "#fde0ef" ], [ 0.5, "#f7f7f7" ], [ 0.6, "#e6f5d0" ], [ 0.7, "#b8e186" ], [ 0.8, "#7fbc41" ], [ 0.9, "#4d9221" ], [ 1, "#276419" ] ], "sequential": [ [ 0, "#0508b8" ], [ 0.0893854748603352, "#1910d8" ], [ 0.1787709497206704, "#3c19f0" ], [ 0.2681564245810056, "#6b1cfb" ], [ 0.3575418994413408, "#981cfd" ], [ 0.44692737430167595, "#bf1cfd" ], [ 0.5363128491620112, "#dd2bfd" ], [ 0.6256983240223464, "#f246fe" ], [ 0.7150837988826816, "#fc67fd" ], [ 0.8044692737430168, "#fe88fc" ], [ 0.8938547486033519, "#fea5fd" ], [ 0.9832402234636871, "#febefe" ], [ 1, "#fec3fe" ] ], "sequentialminus": [ [ 0, "#0508b8" ], [ 0.0893854748603352, "#1910d8" ], [ 0.1787709497206704, "#3c19f0" ], [ 0.2681564245810056, "#6b1cfb" ], [ 0.3575418994413408, "#981cfd" ], [ 0.44692737430167595, "#bf1cfd" ], [ 0.5363128491620112, "#dd2bfd" ], [ 0.6256983240223464, "#f246fe" ], [ 0.7150837988826816, "#fc67fd" ], [ 0.8044692737430168, "#fe88fc" ], [ 0.8938547486033519, "#fea5fd" ], [ 0.9832402234636871, "#febefe" ], [ 1, "#fec3fe" ] ] }, "plot_bgcolor": "white", "paper_bgcolor": "white", "shapedefaults": { "line": { "width": 0 }, "opacity": 0.4, "fillcolor": "#506784" }, "annotationdefaults": { "arrowhead": 0, "arrowcolor": "#506784", "arrowwidth": 1 } }, "themeRef": "PLOTLY_WHITE" } } }, "height": null, "width": null, "user": { "profile_url": "https://chart-studio.plotly.com/~superpotato2812", "avatar_url": "https://storage.googleapis.com/plotly-prod-profiles/53.jpg", "background_url": "https://storage.googleapis.com/plotly-prod-profiles/bg-5.jpg", "bio": "", "nickname": "", "website": "", "stream_tokens": null, "feature_set_id": null, "csrf_token": null, "date_joined": "2024-04-01 22:27:58", "mapbox_access_tokens": null, "has_password": null, "username": "superpotato2812", "email": null, "is_active": null, "readonly": null, "is_dash_creator": null, "dash_created_count": null, "is_chart_creator": null, "charts_created_count": null } }, { "creation_time": "2024-04-02T12:29:53.158313Z", "comments": { "results": [], "count": 0 }, "parented": true, "embed_url": "https://chart-studio.plotly.com/~superpotato2812/13.embed", "fid": "superpotato2812:13", "filename": "cpu1", "filetype": "plot", "img_url": "https://storage.googleapis.com/plotly-prod-images/superpotato2812/13/9_CKU6XYGIFA6WS7HUE0JNL1YFCUD058.png", "image_urls": { "default": "https://storage.googleapis.com/plotly-prod-images/superpotato2812/13/2_WZVASCUXMDU6OJVM0RTGR8JHUSTEQS.png", "block-thumb": "https://storage.googleapis.com/plotly-prod-images/superpotato2812/13/8_TURRLGHN389V5IJKMFKS7GQT5YBHF6.png", "list-thumb": "https://storage.googleapis.com/plotly-prod-images/superpotato2812/13/9_CKU6XYGIFA6WS7HUE0JNL1YFCUD058.png" }, "api_urls": { "files": "https://api.plotly.com/v2/files/superpotato2812:13", "plots": "https://api.plotly.com/v2/plots/superpotato2812:13", "parent": "https://api.plotly.com/v2/folders/home?user=superpotato2812" }, "owner": "superpotato2812", "parent": -1, "preview": "", "referencers": [], "references": [], "title": "", "views": 2, "web_url": "https://chart-studio.plotly.com/~superpotato2812/13/", "world_readable": true, "date_modified": "2024-04-10T11:01:32.920Z", "stars": { "results": [], "count": 0 }, "collaborators": { "results": [], "count": 0 }, "subfolder_count": null, "refresh_interval": null, "organize_view_url": "https://chart-studio.plotly.com/~superpotato2812/13/", "current_user_permission": "read", "is_theme": null, "is_template": false, "autosize": true, "caption": "", "figure": { "data": [ { "meta": { "columnNames": { "x": "", "y": "C" } }, "mode": "lines", "name": "DragonflyDB", "type": "scatter", "ysrc": "superpotato2812:12:4b3cbf" }, { "meta": { "columnNames": { "y": "B" } }, "mode": "lines", "name": "Redis", "type": "scatter", "ysrc": "superpotato2812:12:026ba6", "stackgroup": null } ], "frames": [], "layout": { "font": { "size": 28, "family": "Arial" }, "title": { "font": { "size": 35 }, "text": "CPU-Beanspruchung mit Child-Prozessen" }, "xaxis": { "range": [ 0, 172 ], "title": { "font": { "size": 30 }, "text": "Zeit in Sekunden" }, "autorange": true }, "yaxis": { "type": "linear", "range": [ -0.7044444444444445, 13.384444444444444 ], "title": { "text": "CPU-Beanspruchung in %" }, "autorange": true }, "autosize": true, "template": { "data": { "bar": [ { "type": "bar", "marker": { "colorbar": { "ticks": "", "outlinewidth": 0 } } } ], "table": [ { "type": "table", "cells": { "fill": { "color": "#EBF0F8" }, "line": { "color": "white" } }, "header": { "fill": { "color": "#C8D4E3" }, "line": { "color": "white" } } } ], "carpet": [ { "type": "carpet", "aaxis": { "gridcolor": "#C8D4E3", "linecolor": "#C8D4E3", "endlinecolor": "#2a3f5f", "minorgridcolor": "#C8D4E3", "startlinecolor": "#2a3f5f" }, "baxis": { "gridcolor": "#C8D4E3", "linecolor": "#C8D4E3", "endlinecolor": "#2a3f5f", "minorgridcolor": "#C8D4E3", "startlinecolor": "#2a3f5f" } } ], "mesh3d": [ { "type": "mesh3d", "colorbar": { "ticks": "", "outlinewidth": 0 } } ], "contour": [ { "type": "contour", "colorbar": { "ticks": "", "outlinewidth": 0 }, "autocolorscale": true } ], "heatmap": [ { "type": "heatmap", "colorbar": { "ticks": "", "outlinewidth": 0 }, "autocolorscale": true } ], "scatter": [ { "type": "scatter", "marker": { "colorbar": { "ticks": "", "outlinewidth": 0 } } } ], "surface": [ { "type": "surface", "colorbar": { "ticks": "", "outlinewidth": 0 } } ], "heatmapgl": [ { "type": "heatmapgl", "colorbar": { "ticks": "", "outlinewidth": 0 } } ], "histogram": [ { "type": "histogram", "marker": { "colorbar": { "ticks": "", "outlinewidth": 0 } } } ], "parcoords": [ { "line": { "colorbar": { "ticks": "", "outlinewidth": 0 } }, "type": "parcoords" } ], "scatter3d": [ { "type": "scatter3d", "marker": { "colorbar": { "ticks": "", "outlinewidth": 0 } } } ], "scattergl": [ { "type": "scattergl", "marker": { "colorbar": { "ticks": "", "outlinewidth": 0 } } } ], "choropleth": [ { "type": "choropleth", "colorbar": { "ticks": "", "outlinewidth": 0 } } ], "scattergeo": [ { "type": "scattergeo", "marker": { "colorbar": { "ticks": "", "outlinewidth": 0 } } } ], "histogram2d": [ { "type": "histogram2d", "colorbar": { "ticks": "", "outlinewidth": 0 }, "autocolorscale": true } ], "scatterpolar": [ { "type": "scatterpolar", "marker": { "colorbar": { "ticks": "", "outlinewidth": 0 } } } ], "contourcarpet": [ { "type": "contourcarpet", "colorbar": { "ticks": "", "outlinewidth": 0 } } ], "scattercarpet": [ { "type": "scattercarpet", "marker": { "colorbar": { "ticks": "", "outlinewidth": 0 } } } ], "scattermapbox": [ { "type": "scattermapbox", "marker": { "colorbar": { "ticks": "", "outlinewidth": 0 } } } ], "scatterpolargl": [ { "type": "scatterpolargl", "marker": { "colorbar": { "ticks": "", "outlinewidth": 0 } } } ], "scatterternary": [ { "type": "scatterternary", "marker": { "colorbar": { "ticks": "", "outlinewidth": 0 } } } ], "histogram2dcontour": [ { "type": "histogram2dcontour", "colorbar": { "ticks": "", "outlinewidth": 0 }, "autocolorscale": true } ] }, "layout": { "geo": { "bgcolor": "white", "showland": true, "lakecolor": "white", "landcolor": "white", "showlakes": true, "subunitcolor": "#C8D4E3" }, "font": { "color": "#2a3f5f" }, "polar": { "bgcolor": "white", "radialaxis": { "ticks": "", "gridcolor": "#EBF0F8", "linecolor": "#EBF0F8" }, "angularaxis": { "ticks": "", "gridcolor": "#EBF0F8", "linecolor": "#EBF0F8" } }, "scene": { "xaxis": { "ticks": "", "gridcolor": "#DFE8F3", "gridwidth": 2, "linecolor": "#EBF0F8", "zerolinecolor": "#EBF0F8", "showbackground": true, "backgroundcolor": "white" }, "yaxis": { "ticks": "", "gridcolor": "#DFE8F3", "gridwidth": 2, "linecolor": "#EBF0F8", "zerolinecolor": "#EBF0F8", "showbackground": true, "backgroundcolor": "white" }, "zaxis": { "ticks": "", "gridcolor": "#DFE8F3", "gridwidth": 2, "linecolor": "#EBF0F8", "zerolinecolor": "#EBF0F8", "showbackground": true, "backgroundcolor": "white" } }, "title": { "x": 0.05 }, "xaxis": { "ticks": "", "gridcolor": "#EBF0F8", "linecolor": "#EBF0F8", "automargin": true, "zerolinecolor": "#EBF0F8", "zerolinewidth": 2 }, "yaxis": { "ticks": "", "gridcolor": "#EBF0F8", "linecolor": "#EBF0F8", "automargin": true, "zerolinecolor": "#EBF0F8", "zerolinewidth": 2 }, "ternary": { "aaxis": { "ticks": "", "gridcolor": "#DFE8F3", "linecolor": "#A2B1C6" }, "baxis": { "ticks": "", "gridcolor": "#DFE8F3", "linecolor": "#A2B1C6" }, "caxis": { "ticks": "", "gridcolor": "#DFE8F3", "linecolor": "#A2B1C6" }, "bgcolor": "white" }, "colorway": [ "#636efa", "#EF553B", "#00cc96", "#ab63fa", "#19d3f3", "#e763fa", "#fecb52", "#ffa15a", "#ff6692", "#b6e880" ], "hovermode": "closest", "colorscale": { "diverging": [ [ 0, "#8e0152" ], [ 0.1, "#c51b7d" ], [ 0.2, "#de77ae" ], [ 0.3, "#f1b6da" ], [ 0.4, "#fde0ef" ], [ 0.5, "#f7f7f7" ], [ 0.6, "#e6f5d0" ], [ 0.7, "#b8e186" ], [ 0.8, "#7fbc41" ], [ 0.9, "#4d9221" ], [ 1, "#276419" ] ], "sequential": [ [ 0, "#0508b8" ], [ 0.0893854748603352, "#1910d8" ], [ 0.1787709497206704, "#3c19f0" ], [ 0.2681564245810056, "#6b1cfb" ], [ 0.3575418994413408, "#981cfd" ], [ 0.44692737430167595, "#bf1cfd" ], [ 0.5363128491620112, "#dd2bfd" ], [ 0.6256983240223464, "#f246fe" ], [ 0.7150837988826816, "#fc67fd" ], [ 0.8044692737430168, "#fe88fc" ], [ 0.8938547486033519, "#fea5fd" ], [ 0.9832402234636871, "#febefe" ], [ 1, "#fec3fe" ] ], "sequentialminus": [ [ 0, "#0508b8" ], [ 0.0893854748603352, "#1910d8" ], [ 0.1787709497206704, "#3c19f0" ], [ 0.2681564245810056, "#6b1cfb" ], [ 0.3575418994413408, "#981cfd" ], [ 0.44692737430167595, "#bf1cfd" ], [ 0.5363128491620112, "#dd2bfd" ], [ 0.6256983240223464, "#f246fe" ], [ 0.7150837988826816, "#fc67fd" ], [ 0.8044692737430168, "#fe88fc" ], [ 0.8938547486033519, "#fea5fd" ], [ 0.9832402234636871, "#febefe" ], [ 1, "#fec3fe" ] ] }, "plot_bgcolor": "white", "paper_bgcolor": "white", "shapedefaults": { "line": { "width": 0 }, "opacity": 0.4, "fillcolor": "#506784" }, "annotationdefaults": { "arrowhead": 0, "arrowcolor": "#506784", "arrowwidth": 1 } }, "themeRef": "PLOTLY_WHITE" } } }, "height": null, "width": null, "user": { "profile_url": "https://chart-studio.plotly.com/~superpotato2812", "avatar_url": "https://storage.googleapis.com/plotly-prod-profiles/53.jpg", "background_url": "https://storage.googleapis.com/plotly-prod-profiles/bg-5.jpg", "bio": "", "nickname": "", "website": "", "stream_tokens": null, "feature_set_id": null, "csrf_token": null, "date_joined": "2024-04-01 22:27:58", "mapbox_access_tokens": null, "has_password": null, "username": "superpotato2812", "email": null, "is_active": null, "readonly": null, "is_dash_creator": null, "dash_created_count": null, "is_chart_creator": null, "charts_created_count": null } }, { "creation_time": "2024-04-02T12:28:43.395043Z", "comments": { "results": [], "count": 0 }, "parented": true, "embed_url": "https://chart-studio.plotly.com/~Jtetzopa/23.embed", "fid": "Jtetzopa:23", "filename": "Plot 23", "filetype": "plot", "img_url": "https://storage.googleapis.com/plotly-prod-images/Jtetzopa/23/9_MVOF4W25BSSDGT78B0ZGUHH0Q3ZW5D.png", "image_urls": { "default": "https://storage.googleapis.com/plotly-prod-images/Jtetzopa/23/2_UDBO5341QAEFRMILADG5E7YVMH4PQU.png", "block-thumb": "https://storage.googleapis.com/plotly-prod-images/Jtetzopa/23/8_PDZHU7EI3L25WV38P66FQDQLYJI0FJ.png", "list-thumb": "https://storage.googleapis.com/plotly-prod-images/Jtetzopa/23/9_MVOF4W25BSSDGT78B0ZGUHH0Q3ZW5D.png" }, "api_urls": { "files": "https://api.plotly.com/v2/files/Jtetzopa:23", "plots": "https://api.plotly.com/v2/plots/Jtetzopa:23", "parent": "https://api.plotly.com/v2/folders/home?user=Jtetzopa" }, "owner": "Jtetzopa", "parent": -1, "preview": "", "referencers": [], "references": [], "title": "", "views": 1, "web_url": "https://chart-studio.plotly.com/~Jtetzopa/23/", "world_readable": true, "date_modified": "2024-04-02T12:36:34.717Z", "stars": { "results": [], "count": 0 }, "collaborators": { "results": [], "count": 0 }, "subfolder_count": null, "refresh_interval": null, "organize_view_url": "https://chart-studio.plotly.com/~Jtetzopa/23/", "current_user_permission": "read", "is_theme": null, "is_template": false, "autosize": true, "caption": "", "figure": { "data": [ { "uid": "3bbf61", "meta": { "columnNames": { "x": "nm", "y": "A" } }, "mode": "lines", "name": "trace A", "type": "scatter", "xsrc": "Jtetzopa:22:19918c", "ysrc": "Jtetzopa:22:577f9f" }, { "uid": "5af107", "meta": { "columnNames": { "x": "nm", "y": "B" } }, "mode": "lines", "name": "trace B", "type": "scatter", "xsrc": "Jtetzopa:22:19918c", "ysrc": "Jtetzopa:22:9f8314" }, { "uid": "ffd0e1", "meta": { "columnNames": { "x": "nm", "y": "C" } }, "mode": "lines", "name": "trace C", "type": "scatter", "xsrc": "Jtetzopa:22:19918c", "ysrc": "Jtetzopa:22:09283f" } ], "frames": [], "layout": { "title": { "text": "Pigment % reflectance in response to Wavelenght (nm) Change" }, "xaxis": { "type": "linear", "range": [ 400, 700 ], "title": { "text": "Wavelength(nm)" }, "autorange": true }, "yaxis": { "type": "linear", "range": [ 34.55555555555556, 103.44444444444444 ], "title": { "text": "% Reflectance" }, "autorange": true }, "autosize": true, "template": { "data": { "bar": [ { "type": "bar", "marker": { "colorbar": { "ticks": "", "outlinewidth": 0 } } } ], "table": [ { "type": "table", "cells": { "fill": { "color": "#EBF0F8" }, "line": { "color": "white" } }, "header": { "fill": { "color": "#C8D4E3" }, "line": { "color": "white" } } } ], "carpet": [ { "type": "carpet", "aaxis": { "gridcolor": "#C8D4E3", "linecolor": "#C8D4E3", "endlinecolor": "#2a3f5f", "minorgridcolor": "#C8D4E3", "startlinecolor": "#2a3f5f" }, "baxis": { "gridcolor": "#C8D4E3", "linecolor": "#C8D4E3", "endlinecolor": "#2a3f5f", "minorgridcolor": "#C8D4E3", "startlinecolor": "#2a3f5f" } } ], "mesh3d": [ { "type": "mesh3d", "colorbar": { "ticks": "", "outlinewidth": 0 } } ], "contour": [ { "type": "contour", "colorbar": { "ticks": "", "outlinewidth": 0 }, "autocolorscale": true } ], "heatmap": [ { "type": "heatmap", "colorbar": { "ticks": "", "outlinewidth": 0 }, "autocolorscale": true } ], "scatter": [ { "type": "scatter", "marker": { "colorbar": { "ticks": "", "outlinewidth": 0 } } } ], "surface": [ { "type": "surface", "colorbar": { "ticks": "", "outlinewidth": 0 } } ], "heatmapgl": [ { "type": "heatmapgl", "colorbar": { "ticks": "", "outlinewidth": 0 } } ], "histogram": [ { "type": "histogram", "marker": { "colorbar": { "ticks": "", "outlinewidth": 0 } } } ], "parcoords": [ { "line": { "colorbar": { "ticks": "", "outlinewidth": 0 } }, "type": "parcoords" } ], "scatter3d": [ { "type": "scatter3d", "marker": { "colorbar": { "ticks": "", "outlinewidth": 0 } } } ], "scattergl": [ { "type": "scattergl", "marker": { "colorbar": { "ticks": "", "outlinewidth": 0 } } } ], "choropleth": [ { "type": "choropleth", "colorbar": { "ticks": "", "outlinewidth": 0 } } ], "scattergeo": [ { "type": "scattergeo", "marker": { "colorbar": { "ticks": "", "outlinewidth": 0 } } } ], "histogram2d": [ { "type": "histogram2d", "colorbar": { "ticks": "", "outlinewidth": 0 }, "autocolorscale": true } ], "scatterpolar": [ { "type": "scatterpolar", "marker": { "colorbar": { "ticks": "", "outlinewidth": 0 } } } ], "contourcarpet": [ { "type": "contourcarpet", "colorbar": { "ticks": "", "outlinewidth": 0 } } ], "scattercarpet": [ { "type": "scattercarpet", "marker": { "colorbar": { "ticks": "", "outlinewidth": 0 } } } ], "scattermapbox": [ { "type": "scattermapbox", "marker": { "colorbar": { "ticks": "", "outlinewidth": 0 } } } ], "scatterpolargl": [ { "type": "scatterpolargl", "marker": { "colorbar": { "ticks": "", "outlinewidth": 0 } } } ], "scatterternary": [ { "type": "scatterternary", "marker": { "colorbar": { "ticks": "", "outlinewidth": 0 } } } ], "histogram2dcontour": [ { "type": "histogram2dcontour", "colorbar": { "ticks": "", "outlinewidth": 0 }, "autocolorscale": true } ] }, "layout": { "geo": { "bgcolor": "white", "showland": true, "lakecolor": "white", "landcolor": "white", "showlakes": true, "subunitcolor": "#C8D4E3" }, "font": { "color": "#2a3f5f" }, "polar": { "bgcolor": "white", "radialaxis": { "ticks": "", "gridcolor": "#EBF0F8", "linecolor": "#EBF0F8" }, "angularaxis": { "ticks": "", "gridcolor": "#EBF0F8", "linecolor": "#EBF0F8" } }, "scene": { "xaxis": { "ticks": "", "gridcolor": "#DFE8F3", "gridwidth": 2, "linecolor": "#EBF0F8", "zerolinecolor": "#EBF0F8", "showbackground": true, "backgroundcolor": "white" }, "yaxis": { "ticks": "", "gridcolor": "#DFE8F3", "gridwidth": 2, "linecolor": "#EBF0F8", "zerolinecolor": "#EBF0F8", "showbackground": true, "backgroundcolor": "white" }, "zaxis": { "ticks": "", "gridcolor": "#DFE8F3", "gridwidth": 2, "linecolor": "#EBF0F8", "zerolinecolor": "#EBF0F8", "showbackground": true, "backgroundcolor": "white" } }, "title": { "x": 0.05 }, "xaxis": { "ticks": "", "gridcolor": "#EBF0F8", "linecolor": "#EBF0F8", "automargin": true, "zerolinecolor": "#EBF0F8", "zerolinewidth": 2 }, "yaxis": { "ticks": "", "gridcolor": "#EBF0F8", "linecolor": "#EBF0F8", "automargin": true, "zerolinecolor": "#EBF0F8", "zerolinewidth": 2 }, "ternary": { "aaxis": { "ticks": "", "gridcolor": "#DFE8F3", "linecolor": "#A2B1C6" }, "baxis": { "ticks": "", "gridcolor": "#DFE8F3", "linecolor": "#A2B1C6" }, "caxis": { "ticks": "", "gridcolor": "#DFE8F3", "linecolor": "#A2B1C6" }, "bgcolor": "white" }, "colorway": [ "#636efa", "#EF553B", "#00cc96", "#ab63fa", "#19d3f3", "#e763fa", "#fecb52", "#ffa15a", "#ff6692", "#b6e880" ], "hovermode": "closest", "colorscale": { "diverging": [ [ 0, "#8e0152" ], [ 0.1, "#c51b7d" ], [ 0.2, "#de77ae" ], [ 0.3, "#f1b6da" ], [ 0.4, "#fde0ef" ], [ 0.5, "#f7f7f7" ], [ 0.6, "#e6f5d0" ], [ 0.7, "#b8e186" ], [ 0.8, "#7fbc41" ], [ 0.9, "#4d9221" ], [ 1, "#276419" ] ], "sequential": [ [ 0, "#0508b8" ], [ 0.0893854748603352, "#1910d8" ], [ 0.1787709497206704, "#3c19f0" ], [ 0.2681564245810056, "#6b1cfb" ], [ 0.3575418994413408, "#981cfd" ], [ 0.44692737430167595, "#bf1cfd" ], [ 0.5363128491620112, "#dd2bfd" ], [ 0.6256983240223464, "#f246fe" ], [ 0.7150837988826816, "#fc67fd" ], [ 0.8044692737430168, "#fe88fc" ], [ 0.8938547486033519, "#fea5fd" ], [ 0.9832402234636871, "#febefe" ], [ 1, "#fec3fe" ] ], "sequentialminus": [ [ 0, "#0508b8" ], [ 0.0893854748603352, "#1910d8" ], [ 0.1787709497206704, "#3c19f0" ], [ 0.2681564245810056, "#6b1cfb" ], [ 0.3575418994413408, "#981cfd" ], [ 0.44692737430167595, "#bf1cfd" ], [ 0.5363128491620112, "#dd2bfd" ], [ 0.6256983240223464, "#f246fe" ], [ 0.7150837988826816, "#fc67fd" ], [ 0.8044692737430168, "#fe88fc" ], [ 0.8938547486033519, "#fea5fd" ], [ 0.9832402234636871, "#febefe" ], [ 1, "#fec3fe" ] ] }, "plot_bgcolor": "white", "paper_bgcolor": "white", "shapedefaults": { "line": { "width": 0 }, "opacity": 0.4, "fillcolor": "#506784" }, "annotationdefaults": { "arrowhead": 0, "arrowcolor": "#506784", "arrowwidth": 1 } }, "themeRef": "PLOTLY_WHITE" } } }, "height": null, "width": null, "user": { "profile_url": "https://chart-studio.plotly.com/~Jtetzopa", "avatar_url": "https://storage.googleapis.com/plotly-prod-profiles/41.jpg", "background_url": "https://storage.googleapis.com/plotly-prod-profiles/bg-6.jpg", "bio": "", "nickname": "", "website": "", "stream_tokens": null, "feature_set_id": null, "csrf_token": null, "date_joined": "2024-02-20 01:21:19", "mapbox_access_tokens": null, "has_password": null, "username": "Jtetzopa", "email": null, "is_active": null, "readonly": null, "is_dash_creator": null, "dash_created_count": null, "is_chart_creator": null, "charts_created_count": null } }, { "creation_time": "2024-04-02T12:19:41.261622Z", "comments": { "results": [], "count": 0 }, "parented": true, "embed_url": "https://chart-studio.plotly.com/~superpotato2812/11.embed", "fid": "superpotato2812:11", "filename": "Plot 11", "filetype": "plot", "img_url": "https://storage.googleapis.com/plotly-prod-images/superpotato2812/11/9_JM1IIVRCEU632GA0C2BS60QCW16JY0.png", "image_urls": { "default": "https://storage.googleapis.com/plotly-prod-images/superpotato2812/11/2_V195GCF20PJND0317EOODTTJEIAUP3.png", "block-thumb": "https://storage.googleapis.com/plotly-prod-images/superpotato2812/11/8_1HGTF2POFHTQGD101I1U11CI5SEEM2.png", "list-thumb": "https://storage.googleapis.com/plotly-prod-images/superpotato2812/11/9_JM1IIVRCEU632GA0C2BS60QCW16JY0.png" }, "api_urls": { "files": "https://api.plotly.com/v2/files/superpotato2812:11", "plots": "https://api.plotly.com/v2/plots/superpotato2812:11", "parent": "https://api.plotly.com/v2/folders/home?user=superpotato2812" }, "owner": "superpotato2812", "parent": -1, "preview": "", "referencers": [], "references": [], "title": "", "views": 1, "web_url": "https://chart-studio.plotly.com/~superpotato2812/11/", "world_readable": true, "date_modified": "2024-04-10T11:00:11.119Z", "stars": { "results": [], "count": 0 }, "collaborators": { "results": [], "count": 0 }, "subfolder_count": null, "refresh_interval": null, "organize_view_url": "https://chart-studio.plotly.com/~superpotato2812/11/", "current_user_permission": "read", "is_theme": null, "is_template": false, "autosize": true, "caption": "", "figure": { "data": [ { "meta": { "columnNames": { "y": "A" } }, "mode": "lines", "name": "DragonflyDB", "type": "scatter", "ysrc": "superpotato2812:10:e460d3", "stackgroup": null }, { "meta": { "columnNames": { "x": "", "y": "B" } }, "mode": "lines", "name": "Redis", "type": "scatter", "ysrc": "superpotato2812:10:319aa7" } ], "frames": [], "layout": { "font": { "size": 28, "family": "Arial" }, "title": { "font": { "size": 35 }, "text": "CPU-Beanspruchung mit Worker-Threads" }, "xaxis": { "range": [ 0, 167 ], "title": { "font": { "size": 30 }, "text": "Zeit in Sekunden" }, "autorange": true }, "yaxis": { "type": "linear", "range": [ -0.7744444444444444, 14.714444444444444 ], "title": { "text": "CPU-Beanspruchung in %" }, "autorange": true }, "autosize": true, "template": { "data": { "bar": [ { "type": "bar", "marker": { "colorbar": { "ticks": "", "outlinewidth": 0 } } } ], "table": [ { "type": "table", "cells": { "fill": { "color": "#EBF0F8" }, "line": { "color": "white" } }, "header": { "fill": { "color": "#C8D4E3" }, "line": { "color": "white" } } } ], "carpet": [ { "type": "carpet", "aaxis": { "gridcolor": "#C8D4E3", "linecolor": "#C8D4E3", "endlinecolor": "#2a3f5f", "minorgridcolor": "#C8D4E3", "startlinecolor": "#2a3f5f" }, "baxis": { "gridcolor": "#C8D4E3", "linecolor": "#C8D4E3", "endlinecolor": "#2a3f5f", "minorgridcolor": "#C8D4E3", "startlinecolor": "#2a3f5f" } } ], "mesh3d": [ { "type": "mesh3d", "colorbar": { "ticks": "", "outlinewidth": 0 } } ], "contour": [ { "type": "contour", "colorbar": { "ticks": "", "outlinewidth": 0 }, "autocolorscale": true } ], "heatmap": [ { "type": "heatmap", "colorbar": { "ticks": "", "outlinewidth": 0 }, "autocolorscale": true } ], "scatter": [ { "type": "scatter", "marker": { "colorbar": { "ticks": "", "outlinewidth": 0 } } } ], "surface": [ { "type": "surface", "colorbar": { "ticks": "", "outlinewidth": 0 } } ], "heatmapgl": [ { "type": "heatmapgl", "colorbar": { "ticks": "", "outlinewidth": 0 } } ], "histogram": [ { "type": "histogram", "marker": { "colorbar": { "ticks": "", "outlinewidth": 0 } } } ], "parcoords": [ { "line": { "colorbar": { "ticks": "", "outlinewidth": 0 } }, "type": "parcoords" } ], "scatter3d": [ { "type": "scatter3d", "marker": { "colorbar": { "ticks": "", "outlinewidth": 0 } } } ], "scattergl": [ { "type": "scattergl", "marker": { "colorbar": { "ticks": "", "outlinewidth": 0 } } } ], "choropleth": [ { "type": "choropleth", "colorbar": { "ticks": "", "outlinewidth": 0 } } ], "scattergeo": [ { "type": "scattergeo", "marker": { "colorbar": { "ticks": "", "outlinewidth": 0 } } } ], "histogram2d": [ { "type": "histogram2d", "colorbar": { "ticks": "", "outlinewidth": 0 }, "autocolorscale": true } ], "scatterpolar": [ { "type": "scatterpolar", "marker": { "colorbar": { "ticks": "", "outlinewidth": 0 } } } ], "contourcarpet": [ { "type": "contourcarpet", "colorbar": { "ticks": "", "outlinewidth": 0 } } ], "scattercarpet": [ { "type": "scattercarpet", "marker": { "colorbar": { "ticks": "", "outlinewidth": 0 } } } ], "scattermapbox": [ { "type": "scattermapbox", "marker": { "colorbar": { "ticks": "", "outlinewidth": 0 } } } ], "scatterpolargl": [ { "type": "scatterpolargl", "marker": { "colorbar": { "ticks": "", "outlinewidth": 0 } } } ], "scatterternary": [ { "type": "scatterternary", "marker": { "colorbar": { "ticks": "", "outlinewidth": 0 } } } ], "histogram2dcontour": [ { "type": "histogram2dcontour", "colorbar": { "ticks": "", "outlinewidth": 0 }, "autocolorscale": true } ] }, "layout": { "geo": { "bgcolor": "white", "showland": true, "lakecolor": "white", "landcolor": "white", "showlakes": true, "subunitcolor": "#C8D4E3" }, "font": { "color": "#2a3f5f" }, "polar": { "bgcolor": "white", "radialaxis": { "ticks": "", "gridcolor": "#EBF0F8", "linecolor": "#EBF0F8" }, "angularaxis": { "ticks": "", "gridcolor": "#EBF0F8", "linecolor": "#EBF0F8" } }, "scene": { "xaxis": { "ticks": "", "gridcolor": "#DFE8F3", "gridwidth": 2, "linecolor": "#EBF0F8", "zerolinecolor": "#EBF0F8", "showbackground": true, "backgroundcolor": "white" }, "yaxis": { "ticks": "", "gridcolor": "#DFE8F3", "gridwidth": 2, "linecolor": "#EBF0F8", "zerolinecolor": "#EBF0F8", "showbackground": true, "backgroundcolor": "white" }, "zaxis": { "ticks": "", "gridcolor": "#DFE8F3", "gridwidth": 2, "linecolor": "#EBF0F8", "zerolinecolor": "#EBF0F8", "showbackground": true, "backgroundcolor": "white" } }, "title": { "x": 0.05 }, "xaxis": { "ticks": "", "gridcolor": "#EBF0F8", "linecolor": "#EBF0F8", "automargin": true, "zerolinecolor": "#EBF0F8", "zerolinewidth": 2 }, "yaxis": { "ticks": "", "gridcolor": "#EBF0F8", "linecolor": "#EBF0F8", "automargin": true, "zerolinecolor": "#EBF0F8", "zerolinewidth": 2 }, "ternary": { "aaxis": { "ticks": "", "gridcolor": "#DFE8F3", "linecolor": "#A2B1C6" }, "baxis": { "ticks": "", "gridcolor": "#DFE8F3", "linecolor": "#A2B1C6" }, "caxis": { "ticks": "", "gridcolor": "#DFE8F3", "linecolor": "#A2B1C6" }, "bgcolor": "white" }, "colorway": [ "#636efa", "#EF553B", "#00cc96", "#ab63fa", "#19d3f3", "#e763fa", "#fecb52", "#ffa15a", "#ff6692", "#b6e880" ], "hovermode": "closest", "colorscale": { "diverging": [ [ 0, "#8e0152" ], [ 0.1, "#c51b7d" ], [ 0.2, "#de77ae" ], [ 0.3, "#f1b6da" ], [ 0.4, "#fde0ef" ], [ 0.5, "#f7f7f7" ], [ 0.6, "#e6f5d0" ], [ 0.7, "#b8e186" ], [ 0.8, "#7fbc41" ], [ 0.9, "#4d9221" ], [ 1, "#276419" ] ], "sequential": [ [ 0, "#0508b8" ], [ 0.0893854748603352, "#1910d8" ], [ 0.1787709497206704, "#3c19f0" ], [ 0.2681564245810056, "#6b1cfb" ], [ 0.3575418994413408, "#981cfd" ], [ 0.44692737430167595, "#bf1cfd" ], [ 0.5363128491620112, "#dd2bfd" ], [ 0.6256983240223464, "#f246fe" ], [ 0.7150837988826816, "#fc67fd" ], [ 0.8044692737430168, "#fe88fc" ], [ 0.8938547486033519, "#fea5fd" ], [ 0.9832402234636871, "#febefe" ], [ 1, "#fec3fe" ] ], "sequentialminus": [ [ 0, "#0508b8" ], [ 0.0893854748603352, "#1910d8" ], [ 0.1787709497206704, "#3c19f0" ], [ 0.2681564245810056, "#6b1cfb" ], [ 0.3575418994413408, "#981cfd" ], [ 0.44692737430167595, "#bf1cfd" ], [ 0.5363128491620112, "#dd2bfd" ], [ 0.6256983240223464, "#f246fe" ], [ 0.7150837988826816, "#fc67fd" ], [ 0.8044692737430168, "#fe88fc" ], [ 0.8938547486033519, "#fea5fd" ], [ 0.9832402234636871, "#febefe" ], [ 1, "#fec3fe" ] ] }, "plot_bgcolor": "white", "paper_bgcolor": "white", "shapedefaults": { "line": { "width": 0 }, "opacity": 0.4, "fillcolor": "#506784" }, "annotationdefaults": { "arrowhead": 0, "arrowcolor": "#506784", "arrowwidth": 1 } }, "themeRef": "PLOTLY_WHITE" } } }, "height": null, "width": null, "user": { "profile_url": "https://chart-studio.plotly.com/~superpotato2812", "avatar_url": "https://storage.googleapis.com/plotly-prod-profiles/53.jpg", "background_url": "https://storage.googleapis.com/plotly-prod-profiles/bg-5.jpg", "bio": "", "nickname": "", "website": "", "stream_tokens": null, "feature_set_id": null, "csrf_token": null, "date_joined": "2024-04-01 22:27:58", "mapbox_access_tokens": null, "has_password": null, "username": "superpotato2812", "email": null, "is_active": null, "readonly": null, "is_dash_creator": null, "dash_created_count": null, "is_chart_creator": null, "charts_created_count": null } }, { "creation_time": "2024-04-02T12:14:12.179887Z", "comments": { "results": [], "count": 0 }, "parented": true, "embed_url": "https://chart-studio.plotly.com/~superpotato2812/9.embed", "fid": "superpotato2812:9", "filename": "Plot 9", "filetype": "plot", "img_url": "https://storage.googleapis.com/plotly-prod-images/superpotato2812/9/9_KMXDEE4CKOC4PFPSLOSYBCKYNOQERO.png", "image_urls": { "default": "https://storage.googleapis.com/plotly-prod-images/superpotato2812/9/2_XA8M652HATUMWJQ5UPADB1N8ZDUJNI.png", "block-thumb": "https://storage.googleapis.com/plotly-prod-images/superpotato2812/9/8_D2RF2YK95GZ5S8H1TDVGDY1AMSNBLO.png", "list-thumb": "https://storage.googleapis.com/plotly-prod-images/superpotato2812/9/9_KMXDEE4CKOC4PFPSLOSYBCKYNOQERO.png" }, "api_urls": { "files": "https://api.plotly.com/v2/files/superpotato2812:9", "plots": "https://api.plotly.com/v2/plots/superpotato2812:9", "parent": "https://api.plotly.com/v2/folders/home?user=superpotato2812" }, "owner": "superpotato2812", "parent": -1, "preview": "", "referencers": [], "references": [], "title": "", "views": 2, "web_url": "https://chart-studio.plotly.com/~superpotato2812/9/", "world_readable": true, "date_modified": "2024-04-10T10:57:21.476Z", "stars": { "results": [], "count": 0 }, "collaborators": { "results": [], "count": 0 }, "subfolder_count": null, "refresh_interval": null, "organize_view_url": "https://chart-studio.plotly.com/~superpotato2812/9/", "current_user_permission": "read", "is_theme": null, "is_template": false, "autosize": true, "caption": "", "figure": { "data": [ { "meta": { "columnNames": { "x": "", "y": "A" } }, "mode": "lines", "name": "DragonflyDB", "type": "scatter", "ysrc": "superpotato2812:8:f98a4c" }, { "meta": { "columnNames": { "y": "B" } }, "mode": "lines", "name": "Redis", "type": "scatter", "ysrc": "superpotato2812:8:5fbb45", "stackgroup": null } ], "frames": [], "layout": { "font": { "size": 28, "family": "Arial" }, "title": { "font": { "size": 35 }, "text": "Beanspruchter Speicher mit Worker-Threads" }, "xaxis": { "range": [ 0, 168 ], "title": { "font": { "size": 30, "family": "Arial" }, "text": "Zeit in Sekunden" }, "autorange": true }, "yaxis": { "type": "linear", "range": [ 7.097888888888887, 45.300111111111114 ], "title": { "text": "Speicher in MB" }, "autorange": true }, "autosize": true, "template": { "data": { "bar": [ { "type": "bar", "marker": { "colorbar": { "ticks": "", "outlinewidth": 0 } } } ], "table": [ { "type": "table", "cells": { "fill": { "color": "#EBF0F8" }, "line": { "color": "white" } }, "header": { "fill": { "color": "#C8D4E3" }, "line": { "color": "white" } } } ], "carpet": [ { "type": "carpet", "aaxis": { "gridcolor": "#C8D4E3", "linecolor": "#C8D4E3", "endlinecolor": "#2a3f5f", "minorgridcolor": "#C8D4E3", "startlinecolor": "#2a3f5f" }, "baxis": { "gridcolor": "#C8D4E3", "linecolor": "#C8D4E3", "endlinecolor": "#2a3f5f", "minorgridcolor": "#C8D4E3", "startlinecolor": "#2a3f5f" } } ], "mesh3d": [ { "type": "mesh3d", "colorbar": { "ticks": "", "outlinewidth": 0 } } ], "contour": [ { "type": "contour", "colorbar": { "ticks": "", "outlinewidth": 0 }, "autocolorscale": true } ], "heatmap": [ { "type": "heatmap", "colorbar": { "ticks": "", "outlinewidth": 0 }, "autocolorscale": true } ], "scatter": [ { "type": "scatter", "marker": { "colorbar": { "ticks": "", "outlinewidth": 0 } } } ], "surface": [ { "type": "surface", "colorbar": { "ticks": "", "outlinewidth": 0 } } ], "heatmapgl": [ { "type": "heatmapgl", "colorbar": { "ticks": "", "outlinewidth": 0 } } ], "histogram": [ { "type": "histogram", "marker": { "colorbar": { "ticks": "", "outlinewidth": 0 } } } ], "parcoords": [ { "line": { "colorbar": { "ticks": "", "outlinewidth": 0 } }, "type": "parcoords" } ], "scatter3d": [ { "type": "scatter3d", "marker": { "colorbar": { "ticks": "", "outlinewidth": 0 } } } ], "scattergl": [ { "type": "scattergl", "marker": { "colorbar": { "ticks": "", "outlinewidth": 0 } } } ], "choropleth": [ { "type": "choropleth", "colorbar": { "ticks": "", "outlinewidth": 0 } } ], "scattergeo": [ { "type": "scattergeo", "marker": { "colorbar": { "ticks": "", "outlinewidth": 0 } } } ], "histogram2d": [ { "type": "histogram2d", "colorbar": { "ticks": "", "outlinewidth": 0 }, "autocolorscale": true } ], "scatterpolar": [ { "type": "scatterpolar", "marker": { "colorbar": { "ticks": "", "outlinewidth": 0 } } } ], "contourcarpet": [ { "type": "contourcarpet", "colorbar": { "ticks": "", "outlinewidth": 0 } } ], "scattercarpet": [ { "type": "scattercarpet", "marker": { "colorbar": { "ticks": "", "outlinewidth": 0 } } } ], "scattermapbox": [ { "type": "scattermapbox", "marker": { "colorbar": { "ticks": "", "outlinewidth": 0 } } } ], "scatterpolargl": [ { "type": "scatterpolargl", "marker": { "colorbar": { "ticks": "", "outlinewidth": 0 } } } ], "scatterternary": [ { "type": "scatterternary", "marker": { "colorbar": { "ticks": "", "outlinewidth": 0 } } } ], "histogram2dcontour": [ { "type": "histogram2dcontour", "colorbar": { "ticks": "", "outlinewidth": 0 }, "autocolorscale": true } ] }, "layout": { "geo": { "bgcolor": "white", "showland": true, "lakecolor": "white", "landcolor": "white", "showlakes": true, "subunitcolor": "#C8D4E3" }, "font": { "color": "#2a3f5f" }, "polar": { "bgcolor": "white", "radialaxis": { "ticks": "", "gridcolor": "#EBF0F8", "linecolor": "#EBF0F8" }, "angularaxis": { "ticks": "", "gridcolor": "#EBF0F8", "linecolor": "#EBF0F8" } }, "scene": { "xaxis": { "ticks": "", "gridcolor": "#DFE8F3", "gridwidth": 2, "linecolor": "#EBF0F8", "zerolinecolor": "#EBF0F8", "showbackground": true, "backgroundcolor": "white" }, "yaxis": { "ticks": "", "gridcolor": "#DFE8F3", "gridwidth": 2, "linecolor": "#EBF0F8", "zerolinecolor": "#EBF0F8", "showbackground": true, "backgroundcolor": "white" }, "zaxis": { "ticks": "", "gridcolor": "#DFE8F3", "gridwidth": 2, "linecolor": "#EBF0F8", "zerolinecolor": "#EBF0F8", "showbackground": true, "backgroundcolor": "white" } }, "title": { "x": 0.05 }, "xaxis": { "ticks": "", "gridcolor": "#EBF0F8", "linecolor": "#EBF0F8", "automargin": true, "zerolinecolor": "#EBF0F8", "zerolinewidth": 2 }, "yaxis": { "ticks": "", "gridcolor": "#EBF0F8", "linecolor": "#EBF0F8", "automargin": true, "zerolinecolor": "#EBF0F8", "zerolinewidth": 2 }, "ternary": { "aaxis": { "ticks": "", "gridcolor": "#DFE8F3", "linecolor": "#A2B1C6" }, "baxis": { "ticks": "", "gridcolor": "#DFE8F3", "linecolor": "#A2B1C6" }, "caxis": { "ticks": "", "gridcolor": "#DFE8F3", "linecolor": "#A2B1C6" }, "bgcolor": "white" }, "colorway": [ "#636efa", "#EF553B", "#00cc96", "#ab63fa", "#19d3f3", "#e763fa", "#fecb52", "#ffa15a", "#ff6692", "#b6e880" ], "hovermode": "closest", "colorscale": { "diverging": [ [ 0, "#8e0152" ], [ 0.1, "#c51b7d" ], [ 0.2, "#de77ae" ], [ 0.3, "#f1b6da" ], [ 0.4, "#fde0ef" ], [ 0.5, "#f7f7f7" ], [ 0.6, "#e6f5d0" ], [ 0.7, "#b8e186" ], [ 0.8, "#7fbc41" ], [ 0.9, "#4d9221" ], [ 1, "#276419" ] ], "sequential": [ [ 0, "#0508b8" ], [ 0.0893854748603352, "#1910d8" ], [ 0.1787709497206704, "#3c19f0" ], [ 0.2681564245810056, "#6b1cfb" ], [ 0.3575418994413408, "#981cfd" ], [ 0.44692737430167595, "#bf1cfd" ], [ 0.5363128491620112, "#dd2bfd" ], [ 0.6256983240223464, "#f246fe" ], [ 0.7150837988826816, "#fc67fd" ], [ 0.8044692737430168, "#fe88fc" ], [ 0.8938547486033519, "#fea5fd" ], [ 0.9832402234636871, "#febefe" ], [ 1, "#fec3fe" ] ], "sequentialminus": [ [ 0, "#0508b8" ], [ 0.0893854748603352, "#1910d8" ], [ 0.1787709497206704, "#3c19f0" ], [ 0.2681564245810056, "#6b1cfb" ], [ 0.3575418994413408, "#981cfd" ], [ 0.44692737430167595, "#bf1cfd" ], [ 0.5363128491620112, "#dd2bfd" ], [ 0.6256983240223464, "#f246fe" ], [ 0.7150837988826816, "#fc67fd" ], [ 0.8044692737430168, "#fe88fc" ], [ 0.8938547486033519, "#fea5fd" ], [ 0.9832402234636871, "#febefe" ], [ 1, "#fec3fe" ] ] }, "plot_bgcolor": "white", "paper_bgcolor": "white", "shapedefaults": { "line": { "width": 0 }, "opacity": 0.4, "fillcolor": "#506784" }, "annotationdefaults": { "arrowhead": 0, "arrowcolor": "#506784", "arrowwidth": 1 } }, "themeRef": "PLOTLY_WHITE" } } }, "height": null, "width": null, "user": { "profile_url": "https://chart-studio.plotly.com/~superpotato2812", "avatar_url": "https://storage.googleapis.com/plotly-prod-profiles/53.jpg", "background_url": "https://storage.googleapis.com/plotly-prod-profiles/bg-5.jpg", "bio": "", "nickname": "", "website": "", "stream_tokens": null, "feature_set_id": null, "csrf_token": null, "date_joined": "2024-04-01 22:27:58", "mapbox_access_tokens": null, "has_password": null, "username": "superpotato2812", "email": null, "is_active": null, "readonly": null, "is_dash_creator": null, "dash_created_count": null, "is_chart_creator": null, "charts_created_count": null } }, { "creation_time": "2024-04-02T12:12:12.802033Z", "comments": { "results": [], "count": 0 }, "parented": true, "embed_url": "https://chart-studio.plotly.com/~xzd47_Dretpo/1.embed", "fid": "xzd47_Dretpo:1", "filename": "basic-line", "filetype": "plot", "img_url": "https://storage.googleapis.com/plotly-prod-images/xzd47_Dretpo/1/9_E011VXOPT0R03WDVCOPM98I3Q9HVBB.png", "image_urls": { "default": "https://storage.googleapis.com/plotly-prod-images/xzd47_Dretpo/1/2_94W4O49V2ARLPZZ7VCYZKOO98K6TT0.png", "block-thumb": "https://storage.googleapis.com/plotly-prod-images/xzd47_Dretpo/1/8_2HDR0S2CZ05TZDB8KJPLJK00O4VJD4.png", "list-thumb": "https://storage.googleapis.com/plotly-prod-images/xzd47_Dretpo/1/9_E011VXOPT0R03WDVCOPM98I3Q9HVBB.png" }, "api_urls": { "files": "https://api.plotly.com/v2/files/xzd47_Dretpo:1", "plots": "https://api.plotly.com/v2/plots/xzd47_Dretpo:1", "parent": "https://api.plotly.com/v2/folders/home?user=xzd47_Dretpo" }, "owner": "xzd47_Dretpo", "parent": -1, "preview": "", "referencers": [], "references": [], "title": "", "views": 1, "web_url": "https://chart-studio.plotly.com/~xzd47_Dretpo/1/", "world_readable": true, "date_modified": "2024-04-02T12:20:23.845Z", "stars": { "results": [], "count": 0 }, "collaborators": { "results": [], "count": 0 }, "subfolder_count": null, "refresh_interval": null, "organize_view_url": "https://chart-studio.plotly.com/~xzd47_Dretpo/1/", "current_user_permission": "read", "is_theme": null, "is_template": null, "autosize": true, "caption": "", "figure": { "data": [ { "type": "scatter", "xsrc": "xzd47_Dretpo:2:f5b464", "ysrc": "xzd47_Dretpo:2:886227" }, { "type": "scatter", "xsrc": "xzd47_Dretpo:2:35a605", "ysrc": "xzd47_Dretpo:2:da5269" } ], "layout": { "template": { "data": { "bar": [ { "type": "bar", "marker": { "line": { "color": "#E5ECF6", "width": 0.5 }, "pattern": { "size": 10, "fillmode": "overlay", "solidity": 0.2 } }, "error_x": { "color": "#2a3f5f" }, "error_y": { "color": "#2a3f5f" } } ], "pie": [ { "type": "pie", "automargin": true } ], "table": [ { "type": "table", "cells": { "fill": { "color": "#EBF0F8" }, "line": { "color": "white" } }, "header": { "fill": { "color": "#C8D4E3" }, "line": { "color": "white" } } } ], "carpet": [ { "type": "carpet", "aaxis": { "gridcolor": "white", "linecolor": "white", "endlinecolor": "#2a3f5f", "minorgridcolor": "white", "startlinecolor": "#2a3f5f" }, "baxis": { "gridcolor": "white", "linecolor": "white", "endlinecolor": "#2a3f5f", "minorgridcolor": "white", "startlinecolor": "#2a3f5f" } } ], "mesh3d": [ { "type": "mesh3d", "colorbar": { "ticks": "", "outlinewidth": 0 } } ], "contour": [ { "type": "contour", "colorbar": { "ticks": "", "outlinewidth": 0 }, "colorscale": [ [ 0.0, "#0d0887" ], [ 0.1111111111111111, "#46039f" ], [ 0.2222222222222222, "#7201a8" ], [ 0.3333333333333333, "#9c179e" ], [ 0.4444444444444444, "#bd3786" ], [ 0.5555555555555556, "#d8576b" ], [ 0.6666666666666666, "#ed7953" ], [ 0.7777777777777778, "#fb9f3a" ], [ 0.8888888888888888, "#fdca26" ], [ 1.0, "#f0f921" ] ] } ], "heatmap": [ { "type": "heatmap", "colorbar": { "ticks": "", "outlinewidth": 0 }, "colorscale": [ [ 0.0, "#0d0887" ], [ 0.1111111111111111, "#46039f" ], [ 0.2222222222222222, "#7201a8" ], [ 0.3333333333333333, "#9c179e" ], [ 0.4444444444444444, "#bd3786" ], [ 0.5555555555555556, "#d8576b" ], [ 0.6666666666666666, "#ed7953" ], [ 0.7777777777777778, "#fb9f3a" ], [ 0.8888888888888888, "#fdca26" ], [ 1.0, "#f0f921" ] ] } ], "scatter": [ { "type": "scatter", "fillpattern": { "size": 10, "fillmode": "overlay", "solidity": 0.2 } } ], "surface": [ { "type": "surface", "colorbar": { "ticks": "", "outlinewidth": 0 }, "colorscale": [ [ 0.0, "#0d0887" ], [ 0.1111111111111111, "#46039f" ], [ 0.2222222222222222, "#7201a8" ], [ 0.3333333333333333, "#9c179e" ], [ 0.4444444444444444, "#bd3786" ], [ 0.5555555555555556, "#d8576b" ], [ 0.6666666666666666, "#ed7953" ], [ 0.7777777777777778, "#fb9f3a" ], [ 0.8888888888888888, "#fdca26" ], [ 1.0, "#f0f921" ] ] } ], "barpolar": [ { "type": "barpolar", "marker": { "line": { "color": "#E5ECF6", "width": 0.5 }, "pattern": { "size": 10, "fillmode": "overlay", "solidity": 0.2 } } } ], "heatmapgl": [ { "type": "heatmapgl", "colorbar": { "ticks": "", "outlinewidth": 0 }, "colorscale": [ [ 0.0, "#0d0887" ], [ 0.1111111111111111, "#46039f" ], [ 0.2222222222222222, "#7201a8" ], [ 0.3333333333333333, "#9c179e" ], [ 0.4444444444444444, "#bd3786" ], [ 0.5555555555555556, "#d8576b" ], [ 0.6666666666666666, "#ed7953" ], [ 0.7777777777777778, "#fb9f3a" ], [ 0.8888888888888888, "#fdca26" ], [ 1.0, "#f0f921" ] ] } ], "histogram": [ { "type": "histogram", "marker": { "pattern": { "size": 10, "fillmode": "overlay", "solidity": 0.2 } } } ], "parcoords": [ { "line": { "colorbar": { "ticks": "", "outlinewidth": 0 } }, "type": "parcoords" } ], "scatter3d": [ { "line": { "colorbar": { "ticks": "", "outlinewidth": 0 } }, "type": "scatter3d", "marker": { "colorbar": { "ticks": "", "outlinewidth": 0 } } } ], "scattergl": [ { "type": "scattergl", "marker": { "colorbar": { "ticks": "", "outlinewidth": 0 } } } ], "choropleth": [ { "type": "choropleth", "colorbar": { "ticks": "", "outlinewidth": 0 } } ], "scattergeo": [ { "type": "scattergeo", "marker": { "colorbar": { "ticks": "", "outlinewidth": 0 } } } ], "histogram2d": [ { "type": "histogram2d", "colorbar": { "ticks": "", "outlinewidth": 0 }, "colorscale": [ [ 0.0, "#0d0887" ], [ 0.1111111111111111, "#46039f" ], [ 0.2222222222222222, "#7201a8" ], [ 0.3333333333333333, "#9c179e" ], [ 0.4444444444444444, "#bd3786" ], [ 0.5555555555555556, "#d8576b" ], [ 0.6666666666666666, "#ed7953" ], [ 0.7777777777777778, "#fb9f3a" ], [ 0.8888888888888888, "#fdca26" ], [ 1.0, "#f0f921" ] ] } ], "scatterpolar": [ { "type": "scatterpolar", "marker": { "colorbar": { "ticks": "", "outlinewidth": 0 } } } ], "contourcarpet": [ { "type": "contourcarpet", "colorbar": { "ticks": "", "outlinewidth": 0 } } ], "scattercarpet": [ { "type": "scattercarpet", "marker": { "colorbar": { "ticks": "", "outlinewidth": 0 } } } ], "scattermapbox": [ { "type": "scattermapbox", "marker": { "colorbar": { "ticks": "", "outlinewidth": 0 } } } ], "scatterpolargl": [ { "type": "scatterpolargl", "marker": { "colorbar": { "ticks": "", "outlinewidth": 0 } } } ], "scatterternary": [ { "type": "scatterternary", "marker": { "colorbar": { "ticks": "", "outlinewidth": 0 } } } ], "histogram2dcontour": [ { "type": "histogram2dcontour", "colorbar": { "ticks": "", "outlinewidth": 0 }, "colorscale": [ [ 0.0, "#0d0887" ], [ 0.1111111111111111, "#46039f" ], [ 0.2222222222222222, "#7201a8" ], [ 0.3333333333333333, "#9c179e" ], [ 0.4444444444444444, "#bd3786" ], [ 0.5555555555555556, "#d8576b" ], [ 0.6666666666666666, "#ed7953" ], [ 0.7777777777777778, "#fb9f3a" ], [ 0.8888888888888888, "#fdca26" ], [ 1.0, "#f0f921" ] ] } ] }, "layout": { "geo": { "bgcolor": "white", "showland": true, "lakecolor": "white", "landcolor": "#E5ECF6", "showlakes": true, "subunitcolor": "white" }, "font": { "color": "#2a3f5f" }, "polar": { "bgcolor": "#E5ECF6", "radialaxis": { "ticks": "", "gridcolor": "white", "linecolor": "white" }, "angularaxis": { "ticks": "", "gridcolor": "white", "linecolor": "white" } }, "scene": { "xaxis": { "ticks": "", "gridcolor": "white", "gridwidth": 2, "linecolor": "white", "zerolinecolor": "white", "showbackground": true, "backgroundcolor": "#E5ECF6" }, "yaxis": { "ticks": "", "gridcolor": "white", "gridwidth": 2, "linecolor": "white", "zerolinecolor": "white", "showbackground": true, "backgroundcolor": "#E5ECF6" }, "zaxis": { "ticks": "", "gridcolor": "white", "gridwidth": 2, "linecolor": "white", "zerolinecolor": "white", "showbackground": true, "backgroundcolor": "#E5ECF6" } }, "title": { "x": 0.05 }, "xaxis": { "ticks": "", "title": { "standoff": 15 }, "gridcolor": "white", "linecolor": "white", "automargin": true, "zerolinecolor": "white", "zerolinewidth": 2 }, "yaxis": { "ticks": "", "title": { "standoff": 15 }, "gridcolor": "white", "linecolor": "white", "automargin": true, "zerolinecolor": "white", "zerolinewidth": 2 }, "mapbox": { "style": "light" }, "ternary": { "aaxis": { "ticks": "", "gridcolor": "white", "linecolor": "white" }, "baxis": { "ticks": "", "gridcolor": "white", "linecolor": "white" }, "caxis": { "ticks": "", "gridcolor": "white", "linecolor": "white" }, "bgcolor": "#E5ECF6" }, "colorway": [ "#636efa", "#EF553B", "#00cc96", "#ab63fa", "#FFA15A", "#19d3f3", "#FF6692", "#B6E880", "#FF97FF", "#FECB52" ], "coloraxis": { "colorbar": { "ticks": "", "outlinewidth": 0 } }, "hovermode": "closest", "colorscale": { "diverging": [ [ 0, "#8e0152" ], [ 0.1, "#c51b7d" ], [ 0.2, "#de77ae" ], [ 0.3, "#f1b6da" ], [ 0.4, "#fde0ef" ], [ 0.5, "#f7f7f7" ], [ 0.6, "#e6f5d0" ], [ 0.7, "#b8e186" ], [ 0.8, "#7fbc41" ], [ 0.9, "#4d9221" ], [ 1, "#276419" ] ], "sequential": [ [ 0.0, "#0d0887" ], [ 0.1111111111111111, "#46039f" ], [ 0.2222222222222222, "#7201a8" ], [ 0.3333333333333333, "#9c179e" ], [ 0.4444444444444444, "#bd3786" ], [ 0.5555555555555556, "#d8576b" ], [ 0.6666666666666666, "#ed7953" ], [ 0.7777777777777778, "#fb9f3a" ], [ 0.8888888888888888, "#fdca26" ], [ 1.0, "#f0f921" ] ], "sequentialminus": [ [ 0.0, "#0d0887" ], [ 0.1111111111111111, "#46039f" ], [ 0.2222222222222222, "#7201a8" ], [ 0.3333333333333333, "#9c179e" ], [ 0.4444444444444444, "#bd3786" ], [ 0.5555555555555556, "#d8576b" ], [ 0.6666666666666666, "#ed7953" ], [ 0.7777777777777778, "#fb9f3a" ], [ 0.8888888888888888, "#fdca26" ], [ 1.0, "#f0f921" ] ] }, "hoverlabel": { "align": "left" }, "plot_bgcolor": "#E5ECF6", "paper_bgcolor": "white", "shapedefaults": { "line": { "color": "#2a3f5f" } }, "autotypenumbers": "strict", "annotationdefaults": { "arrowhead": 0, "arrowcolor": "#2a3f5f", "arrowwidth": 1 } } } } }, "height": null, "width": null, "user": { "profile_url": "https://chart-studio.plotly.com/~xzd47_Dretpo", "avatar_url": "https://storage.googleapis.com/plotly-prod-profiles/98.jpg", "background_url": "https://storage.googleapis.com/plotly-prod-profiles/bg-10.jpg", "bio": "", "nickname": "", "website": "", "stream_tokens": null, "feature_set_id": null, "csrf_token": null, "date_joined": "2024-04-02 10:57:54", "mapbox_access_tokens": null, "has_password": null, "username": "xzd47_Dretpo", "email": null, "is_active": null, "readonly": null, "is_dash_creator": null, "dash_created_count": null, "is_chart_creator": null, "charts_created_count": null } }, { "creation_time": "2024-04-02T11:42:19.881554Z", "comments": { "results": [], "count": 0 }, "parented": true, "embed_url": "https://chart-studio.plotly.com/~thizzle/1.embed", "fid": "thizzle:1", "filename": "diff distr", "filetype": "plot", "img_url": "https://storage.googleapis.com/plotly-prod-images/thizzle/1/9_UPJ8OLZZHPUWUKPU986YAP4VCJ0KZP.png", "image_urls": { "default": "https://storage.googleapis.com/plotly-prod-images/thizzle/1/2_915YSQS3RL7GLZNBPRWRXGFI0PHT8A.png", "block-thumb": "https://storage.googleapis.com/plotly-prod-images/thizzle/1/8_RVHJPK3YLQ4FFLC7SN9407F8KDXC3Z.png", "list-thumb": "https://storage.googleapis.com/plotly-prod-images/thizzle/1/9_UPJ8OLZZHPUWUKPU986YAP4VCJ0KZP.png" }, "api_urls": { "files": "https://api.plotly.com/v2/files/thizzle:1", "plots": "https://api.plotly.com/v2/plots/thizzle:1", "parent": "https://api.plotly.com/v2/folders/home?user=thizzle" }, "owner": "thizzle", "parent": -1, "preview": "", "referencers": [], "references": [], "title": "", "views": 1, "web_url": "https://chart-studio.plotly.com/~thizzle/1/", "world_readable": true, "date_modified": "2024-04-02T11:42:19.894Z", "stars": { "results": [], "count": 0 }, "collaborators": { "results": [], "count": 0 }, "subfolder_count": null, "refresh_interval": null, "organize_view_url": "https://chart-studio.plotly.com/~thizzle/1/", "current_user_permission": "read", "is_theme": null, "is_template": false, "autosize": true, "caption": "", "figure": { "data": [ { "meta": { "columnNames": { "x": "", "y": " 世界杯 " } }, "mode": "markers", "name": "世界杯", "type": "violin", "ysrc": "thizzle:0:a9c74b", "points": false, "meanline": { "visible": true }, "bandwidth": 0, "orientation": "v" }, { "meta": { "columnNames": { "y": " 欧冠 " } }, "name": "欧冠", "type": "violin", "ysrc": "thizzle:0:796980", "xaxis": "x", "points": false, "meanline": { "visible": true }, "spanmode": "soft", "bandwidth": 0, "scalemode": "width" }, { "box": { "visible": false }, "meta": { "columnNames": { "x": "", "y": " 联赛(>0.9) " } }, "name": "三大联赛", "type": "violin", "ysrc": "thizzle:0:2ab811", "jitter": 0, "marker": { "color": "#00cc96" }, "points": false, "meanline": { "visible": true }, "pointpos": -2, "bandwidth": 0, "orientation": "v" }, { "meta": { "columnNames": { "x": "", "y": " 欧洲杯美洲杯 " } }, "name": "欧洲/美洲杯", "type": "violin", "ysrc": "thizzle:0:17cd75", "points": false, "meanline": { "visible": true }, "bandwidth": 0 }, { "meta": { "columnNames": { "y": " 其它杯赛 " } }, "name": "其它洲际杯赛", "type": "violin", "ysrc": "thizzle:0:e3a267", "jitter": 0.3, "points": false, "meanline": { "visible": true }, "bandwidth": 0 } ], "frames": [], "layout": { "font": { "size": 17 }, "title": { "text": "主要赛事难度系数分布图" }, "xaxis": { "side": "top", "type": "category", "range": [ -0.5, 4.5 ], "title": { "text": "Click to enter X axis title" }, "autorange": true }, "yaxis": { "type": "linear", "range": [ -0.07489397743132128, 3.424893977431321 ], "title": { "text": "难度系数" }, "autorange": true }, "autosize": true, "colorway": [ "#1f77b4", "#ff7f0e", "#2ca02c", "#d62728", "#9467bd", "#8c564b", "#e377c2", "#7f7f7f", "#bcbd22", "#17becf" ], "template": { "data": { "bar": [ { "type": "bar", "marker": { "colorbar": { "ticks": "", "outlinewidth": 0 } } } ], "table": [ { "type": "table", "cells": { "fill": { "color": "#EBF0F8" }, "line": { "color": "white" } }, "header": { "fill": { "color": "#C8D4E3" }, "line": { "color": "white" } } } ], "carpet": [ { "type": "carpet", "aaxis": { "gridcolor": "#C8D4E3", "linecolor": "#C8D4E3", "endlinecolor": "#2a3f5f", "minorgridcolor": "#C8D4E3", "startlinecolor": "#2a3f5f" }, "baxis": { "gridcolor": "#C8D4E3", "linecolor": "#C8D4E3", "endlinecolor": "#2a3f5f", "minorgridcolor": "#C8D4E3", "startlinecolor": "#2a3f5f" } } ], "mesh3d": [ { "type": "mesh3d", "colorbar": { "ticks": "", "outlinewidth": 0 } } ], "contour": [ { "type": "contour", "colorbar": { "ticks": "", "outlinewidth": 0 }, "autocolorscale": true } ], "heatmap": [ { "type": "heatmap", "colorbar": { "ticks": "", "outlinewidth": 0 }, "autocolorscale": true } ], "scatter": [ { "type": "scatter", "marker": { "colorbar": { "ticks": "", "outlinewidth": 0 } } } ], "surface": [ { "type": "surface", "colorbar": { "ticks": "", "outlinewidth": 0 } } ], "heatmapgl": [ { "type": "heatmapgl", "colorbar": { "ticks": "", "outlinewidth": 0 } } ], "histogram": [ { "type": "histogram", "marker": { "colorbar": { "ticks": "", "outlinewidth": 0 } } } ], "parcoords": [ { "line": { "colorbar": { "ticks": "", "outlinewidth": 0 } }, "type": "parcoords" } ], "scatter3d": [ { "type": "scatter3d", "marker": { "colorbar": { "ticks": "", "outlinewidth": 0 } } } ], "scattergl": [ { "type": "scattergl", "marker": { "colorbar": { "ticks": "", "outlinewidth": 0 } } } ], "choropleth": [ { "type": "choropleth", "colorbar": { "ticks": "", "outlinewidth": 0 } } ], "scattergeo": [ { "type": "scattergeo", "marker": { "colorbar": { "ticks": "", "outlinewidth": 0 } } } ], "histogram2d": [ { "type": "histogram2d", "colorbar": { "ticks": "", "outlinewidth": 0 }, "autocolorscale": true } ], "scatterpolar": [ { "type": "scatterpolar", "marker": { "colorbar": { "ticks": "", "outlinewidth": 0 } } } ], "contourcarpet": [ { "type": "contourcarpet", "colorbar": { "ticks": "", "outlinewidth": 0 } } ], "scattercarpet": [ { "type": "scattercarpet", "marker": { "colorbar": { "ticks": "", "outlinewidth": 0 } } } ], "scattermapbox": [ { "type": "scattermapbox", "marker": { "colorbar": { "ticks": "", "outlinewidth": 0 } } } ], "scatterpolargl": [ { "type": "scatterpolargl", "marker": { "colorbar": { "ticks": "", "outlinewidth": 0 } } } ], "scatterternary": [ { "type": "scatterternary", "marker": { "colorbar": { "ticks": "", "outlinewidth": 0 } } } ], "histogram2dcontour": [ { "type": "histogram2dcontour", "colorbar": { "ticks": "", "outlinewidth": 0 }, "autocolorscale": true } ] }, "layout": { "geo": { "bgcolor": "white", "showland": true, "lakecolor": "white", "landcolor": "white", "showlakes": true, "subunitcolor": "#C8D4E3" }, "font": { "color": "#2a3f5f" }, "polar": { "bgcolor": "white", "radialaxis": { "ticks": "", "gridcolor": "#EBF0F8", "linecolor": "#EBF0F8" }, "angularaxis": { "ticks": "", "gridcolor": "#EBF0F8", "linecolor": "#EBF0F8" } }, "scene": { "xaxis": { "ticks": "", "gridcolor": "#DFE8F3", "gridwidth": 2, "linecolor": "#EBF0F8", "zerolinecolor": "#EBF0F8", "showbackground": true, "backgroundcolor": "white" }, "yaxis": { "ticks": "", "gridcolor": "#DFE8F3", "gridwidth": 2, "linecolor": "#EBF0F8", "zerolinecolor": "#EBF0F8", "showbackground": true, "backgroundcolor": "white" }, "zaxis": { "ticks": "", "gridcolor": "#DFE8F3", "gridwidth": 2, "linecolor": "#EBF0F8", "zerolinecolor": "#EBF0F8", "showbackground": true, "backgroundcolor": "white" } }, "title": { "x": 0.05 }, "xaxis": { "ticks": "", "gridcolor": "#EBF0F8", "linecolor": "#EBF0F8", "automargin": true, "zerolinecolor": "#EBF0F8", "zerolinewidth": 2 }, "yaxis": { "ticks": "", "gridcolor": "#EBF0F8", "linecolor": "#EBF0F8", "automargin": true, "zerolinecolor": "#EBF0F8", "zerolinewidth": 2 }, "ternary": { "aaxis": { "ticks": "", "gridcolor": "#DFE8F3", "linecolor": "#A2B1C6" }, "baxis": { "ticks": "", "gridcolor": "#DFE8F3", "linecolor": "#A2B1C6" }, "caxis": { "ticks": "", "gridcolor": "#DFE8F3", "linecolor": "#A2B1C6" }, "bgcolor": "white" }, "colorway": [ "#636efa", "#EF553B", "#00cc96", "#ab63fa", "#19d3f3", "#e763fa", "#fecb52", "#ffa15a", "#ff6692", "#b6e880" ], "hovermode": "closest", "colorscale": { "diverging": [ [ 0, "#8e0152" ], [ 0.1, "#c51b7d" ], [ 0.2, "#de77ae" ], [ 0.3, "#f1b6da" ], [ 0.4, "#fde0ef" ], [ 0.5, "#f7f7f7" ], [ 0.6, "#e6f5d0" ], [ 0.7, "#b8e186" ], [ 0.8, "#7fbc41" ], [ 0.9, "#4d9221" ], [ 1, "#276419" ] ], "sequential": [ [ 0, "#0508b8" ], [ 0.0893854748603352, "#1910d8" ], [ 0.1787709497206704, "#3c19f0" ], [ 0.2681564245810056, "#6b1cfb" ], [ 0.3575418994413408, "#981cfd" ], [ 0.44692737430167595, "#bf1cfd" ], [ 0.5363128491620112, "#dd2bfd" ], [ 0.6256983240223464, "#f246fe" ], [ 0.7150837988826816, "#fc67fd" ], [ 0.8044692737430168, "#fe88fc" ], [ 0.8938547486033519, "#fea5fd" ], [ 0.9832402234636871, "#febefe" ], [ 1, "#fec3fe" ] ], "sequentialminus": [ [ 0, "#0508b8" ], [ 0.0893854748603352, "#1910d8" ], [ 0.1787709497206704, "#3c19f0" ], [ 0.2681564245810056, "#6b1cfb" ], [ 0.3575418994413408, "#981cfd" ], [ 0.44692737430167595, "#bf1cfd" ], [ 0.5363128491620112, "#dd2bfd" ], [ 0.6256983240223464, "#f246fe" ], [ 0.7150837988826816, "#fc67fd" ], [ 0.8044692737430168, "#fe88fc" ], [ 0.8938547486033519, "#fea5fd" ], [ 0.9832402234636871, "#febefe" ], [ 1, "#fec3fe" ] ] }, "plot_bgcolor": "white", "paper_bgcolor": "white", "shapedefaults": { "line": { "width": 0 }, "opacity": 0.4, "fillcolor": "#506784" }, "annotationdefaults": { "arrowhead": 0, "arrowcolor": "#506784", "arrowwidth": 1 } }, "themeRef": "PLOTLY_WHITE" }, "colorscale": { "sequential": [ [ 0, "#0508b8" ], [ 0.08333333333333333, "#1910d8" ], [ 0.16666666666666666, "#3c19f0" ], [ 0.25, "#6b1cfb" ], [ 0.3333333333333333, "#981cfd" ], [ 0.4166666666666667, "#bf1cfd" ], [ 0.5, "#dd2bfd" ], [ 0.5833333333333334, "#f246fe" ], [ 0.6666666666666666, "#fc67fd" ], [ 0.75, "#fe88fc" ], [ 0.8333333333333334, "#fea5fd" ], [ 0.9166666666666666, "#febefe" ], [ 1, "#fec3fe" ] ], "sequentialminus": [ [ 0, "#0508b8" ], [ 0.08333333333333333, "#1910d8" ], [ 0.16666666666666666, "#3c19f0" ], [ 0.25, "#6b1cfb" ], [ 0.3333333333333333, "#981cfd" ], [ 0.4166666666666667, "#bf1cfd" ], [ 0.5, "#dd2bfd" ], [ 0.5833333333333334, "#f246fe" ], [ 0.6666666666666666, "#fc67fd" ], [ 0.75, "#fe88fc" ], [ 0.8333333333333334, "#fea5fd" ], [ 0.9166666666666666, "#febefe" ], [ 1, "#fec3fe" ] ] } } }, "height": null, "width": null, "user": { "profile_url": "https://chart-studio.plotly.com/~thizzle", "avatar_url": "https://storage.googleapis.com/plotly-prod-profiles/4.jpg", "background_url": "https://storage.googleapis.com/plotly-prod-profiles/bg-14.jpg", "bio": "", "nickname": "", "website": "", "stream_tokens": null, "feature_set_id": null, "csrf_token": null, "date_joined": "2024-04-02 10:33:13", "mapbox_access_tokens": null, "has_password": null, "username": "thizzle", "email": null, "is_active": null, "readonly": null, "is_dash_creator": null, "dash_created_count": null, "is_chart_creator": null, "charts_created_count": null } }, { "creation_time": "2024-04-02T11:38:27.849404Z", "comments": { "results": [], "count": 0 }, "parented": true, "embed_url": "https://chart-studio.plotly.com/~Chapui/4.embed", "fid": "Chapui:4", "filename": "Mittelwerte der Lufttemperatur - Kreis Viersen", "filetype": "plot", "img_url": "https://api.plotly.com/v2/files/Chapui:4/image?image_name=list-thumb", "image_urls": { "default": "https://api.plotly.com/v2/files/Chapui:4/image?image_name=default", "block-thumb": "https://storage.googleapis.com/plotly-prod-images/Chapui/4/8_9QN7HGFKJ924DT94MX2V9QDOI3MEZT.png", "list-thumb": "https://api.plotly.com/v2/files/Chapui:4/image?image_name=list-thumb" }, "api_urls": { "files": "https://api.plotly.com/v2/files/Chapui:4", "plots": "https://api.plotly.com/v2/plots/Chapui:4", "parent": "https://api.plotly.com/v2/folders/home?user=Chapui" }, "owner": "Chapui", "parent": -1, "preview": "", "referencers": [], "references": [], "title": "", "views": 2, "web_url": "https://chart-studio.plotly.com/~Chapui/4/", "world_readable": true, "date_modified": "2025-05-27T07:39:39.106Z", "stars": { "results": [], "count": 0 }, "collaborators": { "results": [ { "profile_url": "https://chart-studio.plotly.com/~SchatzJ", "avatar_url": "https://storage.googleapis.com/plotly-prod-profiles/56.jpg", "background_url": "https://storage.googleapis.com/plotly-prod-profiles/bg-11.jpg", "bio": "", "nickname": "", "website": "", "stream_tokens": null, "feature_set_id": null, "csrf_token": null, "date_joined": "2025-04-16 12:09:22", "mapbox_access_tokens": null, "has_password": null, "username": "SchatzJ", "email": null, "is_active": null, "readonly": false, "is_dash_creator": null, "dash_created_count": null, "is_chart_creator": null, "charts_created_count": null } ], "count": 1 }, "subfolder_count": null, "refresh_interval": null, "organize_view_url": "https://chart-studio.plotly.com/~Chapui/4/", "current_user_permission": "read", "is_theme": null, "is_template": false, "autosize": true, "caption": "", "figure": { "data": [ { "line": { "width": 1 }, "meta": { "columnNames": { "x": "data.0.x", "y": "data.0.y" } }, "mode": "lines+markers", "name": "Monatsmittelwert der Lufttemperatur", "type": "scatter", "xsrc": "Chapui:15:f80889", "ysrc": "Chapui:15:f61c44", "marker": { "size": 2 }, "visible": false, "hovertemplate": "Datum = %{x} <br>Temperatur = °C%{y:.2f}" }, { "line": { "width": 1 }, "meta": { "columnNames": { "x": "data.1.x", "y": "data.1.y" } }, "mode": "lines", "name": "Trendlinie", "type": "scatter", "xsrc": "Chapui:15:ede64d", "ysrc": "Chapui:15:cba819", "marker": { "size": 2 }, "visible": true, "hovertemplate": "Datum = %{x}<br>Temperatur = °C%{y:.2f}" }, { "line": { "width": 1 }, "meta": { "columnNames": { "x": "data.2.x", "y": "data.2.y" } }, "mode": "lines+markers", "name": "Jahresmittelwert der Lufttemperatur", "type": "scatter", "xsrc": "Chapui:15:2f62ba", "ysrc": "Chapui:15:0a63b2", "marker": { "size": 2 }, "visible": true, "hovertemplate": "Datum = %{x} <br>Temperatur = °C%{y:.2f}" } ], "frames": [], "layout": { "font": { "size": 16, "color": "black" }, "title": { "x": 0.5, "text": "Mittelwerte der Lufttemperatur" }, "xaxis": { "type": "date", "range": [ "1948-11-28 21:10:15.728", "2027-02-03 02:49:44.272" ], "ticks": "", "title": { "font": { "size": 16 } }, "showgrid": false, "showline": false, "tickfont": { "size": 16 }, "autorange": true, "tickangle": "auto", "showspikes": false, "rangeslider": { "range": [ "1948-11-28 21:10:15.728", "2027-02-03 02:49:44.272" ], "yaxis": {}, "visible": false, "autorange": true }, "zerolinecolor": "rgb(250, 242, 242)", "zerolinewidth": 1 }, "yaxis": { "type": "linear", "range": [ 4, 16 ], "title": { "font": { "size": 16 }, "text": "Temperatur °C" }, "showgrid": false, "autorange": false }, "legend": { "x": 0.5012030075187969, "y": 0.9766949152542372 }, "autosize": true, "template": { "data": { "bar": [ { "type": "bar", "marker": { "line": { "color": "#E5ECF6", "width": 0.5 }, "pattern": { "size": 10, "fillmode": "overlay", "solidity": 0.2 } }, "error_x": { "color": "#2a3f5f" }, "error_y": { "color": "#2a3f5f" } } ], "pie": [ { "type": "pie", "automargin": true } ], "table": [ { "type": "table", "cells": { "fill": { "color": "#EBF0F8" }, "line": { "color": "white" } }, "header": { "fill": { "color": "#C8D4E3" }, "line": { "color": "white" } } } ], "carpet": [ { "type": "carpet", "aaxis": { "gridcolor": "white", "linecolor": "white", "endlinecolor": "#2a3f5f", "minorgridcolor": "white", "startlinecolor": "#2a3f5f" }, "baxis": { "gridcolor": "white", "linecolor": "white", "endlinecolor": "#2a3f5f", "minorgridcolor": "white", "startlinecolor": "#2a3f5f" } } ], "mesh3d": [ { "type": "mesh3d", "colorbar": { "ticks": "", "outlinewidth": 0 } } ], "contour": [ { "type": "contour", "colorbar": { "ticks": "", "outlinewidth": 0 }, "colorscale": [ [ 0, "#0d0887" ], [ 0.1111111111111111, "#46039f" ], [ 0.2222222222222222, "#7201a8" ], [ 0.3333333333333333, "#9c179e" ], [ 0.4444444444444444, "#bd3786" ], [ 0.5555555555555556, "#d8576b" ], [ 0.6666666666666666, "#ed7953" ], [ 0.7777777777777778, "#fb9f3a" ], [ 0.8888888888888888, "#fdca26" ], [ 1, "#f0f921" ] ] } ], "heatmap": [ { "type": "heatmap", "colorbar": { "ticks": "", "outlinewidth": 0 }, "colorscale": [ [ 0, "#0d0887" ], [ 0.1111111111111111, "#46039f" ], [ 0.2222222222222222, "#7201a8" ], [ 0.3333333333333333, "#9c179e" ], [ 0.4444444444444444, "#bd3786" ], [ 0.5555555555555556, "#d8576b" ], [ 0.6666666666666666, "#ed7953" ], [ 0.7777777777777778, "#fb9f3a" ], [ 0.8888888888888888, "#fdca26" ], [ 1, "#f0f921" ] ] } ], "scatter": [ { "type": "scatter", "fillpattern": { "size": 10, "fillmode": "overlay", "solidity": 0.2 } } ], "surface": [ { "type": "surface", "colorbar": { "ticks": "", "outlinewidth": 0 }, "colorscale": [ [ 0, "#0d0887" ], [ 0.1111111111111111, "#46039f" ], [ 0.2222222222222222, "#7201a8" ], [ 0.3333333333333333, "#9c179e" ], [ 0.4444444444444444, "#bd3786" ], [ 0.5555555555555556, "#d8576b" ], [ 0.6666666666666666, "#ed7953" ], [ 0.7777777777777778, "#fb9f3a" ], [ 0.8888888888888888, "#fdca26" ], [ 1, "#f0f921" ] ] } ], "barpolar": [ { "type": "barpolar", "marker": { "line": { "color": "#E5ECF6", "width": 0.5 }, "pattern": { "size": 10, "fillmode": "overlay", "solidity": 0.2 } } } ], "heatmapgl": [ { "type": "heatmapgl", "colorbar": { "ticks": "", "outlinewidth": 0 }, "colorscale": [ [ 0, "#0d0887" ], [ 0.1111111111111111, "#46039f" ], [ 0.2222222222222222, "#7201a8" ], [ 0.3333333333333333, "#9c179e" ], [ 0.4444444444444444, "#bd3786" ], [ 0.5555555555555556, "#d8576b" ], [ 0.6666666666666666, "#ed7953" ], [ 0.7777777777777778, "#fb9f3a" ], [ 0.8888888888888888, "#fdca26" ], [ 1, "#f0f921" ] ] } ], "histogram": [ { "type": "histogram", "marker": { "pattern": { "size": 10, "fillmode": "overlay", "solidity": 0.2 } } } ], "parcoords": [ { "line": { "colorbar": { "ticks": "", "outlinewidth": 0 } }, "type": "parcoords" } ], "scatter3d": [ { "line": { "colorbar": { "ticks": "", "outlinewidth": 0 } }, "type": "scatter3d", "marker": { "colorbar": { "ticks": "", "outlinewidth": 0 } } } ], "scattergl": [ { "type": "scattergl", "marker": { "colorbar": { "ticks": "", "outlinewidth": 0 } } } ], "choropleth": [ { "type": "choropleth", "colorbar": { "ticks": "", "outlinewidth": 0 } } ], "scattergeo": [ { "type": "scattergeo", "marker": { "colorbar": { "ticks": "", "outlinewidth": 0 } } } ], "histogram2d": [ { "type": "histogram2d", "colorbar": { "ticks": "", "outlinewidth": 0 }, "colorscale": [ [ 0, "#0d0887" ], [ 0.1111111111111111, "#46039f" ], [ 0.2222222222222222, "#7201a8" ], [ 0.3333333333333333, "#9c179e" ], [ 0.4444444444444444, "#bd3786" ], [ 0.5555555555555556, "#d8576b" ], [ 0.6666666666666666, "#ed7953" ], [ 0.7777777777777778, "#fb9f3a" ], [ 0.8888888888888888, "#fdca26" ], [ 1, "#f0f921" ] ] } ], "scatterpolar": [ { "type": "scatterpolar", "marker": { "colorbar": { "ticks": "", "outlinewidth": 0 } } } ], "contourcarpet": [ { "type": "contourcarpet", "colorbar": { "ticks": "", "outlinewidth": 0 } } ], "scattercarpet": [ { "type": "scattercarpet", "marker": { "colorbar": { "ticks": "", "outlinewidth": 0 } } } ], "scattermapbox": [ { "type": "scattermapbox", "marker": { "colorbar": { "ticks": "", "outlinewidth": 0 } } } ], "scatterpolargl": [ { "type": "scatterpolargl", "marker": { "colorbar": { "ticks": "", "outlinewidth": 0 } } } ], "scatterternary": [ { "type": "scatterternary", "marker": { "colorbar": { "ticks": "", "outlinewidth": 0 } } } ], "histogram2dcontour": [ { "type": "histogram2dcontour", "colorbar": { "ticks": "", "outlinewidth": 0 }, "colorscale": [ [ 0, "#0d0887" ], [ 0.1111111111111111, "#46039f" ], [ 0.2222222222222222, "#7201a8" ], [ 0.3333333333333333, "#9c179e" ], [ 0.4444444444444444, "#bd3786" ], [ 0.5555555555555556, "#d8576b" ], [ 0.6666666666666666, "#ed7953" ], [ 0.7777777777777778, "#fb9f3a" ], [ 0.8888888888888888, "#fdca26" ], [ 1, "#f0f921" ] ] } ] }, "layout": { "geo": { "bgcolor": "white", "showland": true, "lakecolor": "white", "landcolor": "#E5ECF6", "showlakes": true, "subunitcolor": "white" }, "font": { "color": "#2a3f5f" }, "polar": { "bgcolor": "#E5ECF6", "radialaxis": { "ticks": "", "gridcolor": "white", "linecolor": "white" }, "angularaxis": { "ticks": "", "gridcolor": "white", "linecolor": "white" } }, "scene": { "xaxis": { "ticks": "", "gridcolor": "white", "gridwidth": 2, "linecolor": "white", "zerolinecolor": "white", "showbackground": true, "backgroundcolor": "#E5ECF6" }, "yaxis": { "ticks": "", "gridcolor": "white", "gridwidth": 2, "linecolor": "white", "zerolinecolor": "white", "showbackground": true, "backgroundcolor": "#E5ECF6" }, "zaxis": { "ticks": "", "gridcolor": "white", "gridwidth": 2, "linecolor": "white", "zerolinecolor": "white", "showbackground": true, "backgroundcolor": "#E5ECF6" } }, "title": { "x": 0.05 }, "xaxis": { "ticks": "", "title": { "standoff": 15 }, "gridcolor": "white", "linecolor": "white", "automargin": true, "zerolinecolor": "white", "zerolinewidth": 2 }, "yaxis": { "ticks": "", "title": { "standoff": 15 }, "gridcolor": "white", "linecolor": "white", "automargin": true, "zerolinecolor": "white", "zerolinewidth": 2 }, "mapbox": { "style": "light" }, "ternary": { "aaxis": { "ticks": "", "gridcolor": "white", "linecolor": "white" }, "baxis": { "ticks": "", "gridcolor": "white", "linecolor": "white" }, "caxis": { "ticks": "", "gridcolor": "white", "linecolor": "white" }, "bgcolor": "#E5ECF6" }, "colorway": [ "#636efa", "#EF553B", "#00cc96", "#ab63fa", "#FFA15A", "#19d3f3", "#FF6692", "#B6E880", "#FF97FF", "#FECB52" ], "coloraxis": { "colorbar": { "ticks": "", "outlinewidth": 0 } }, "hovermode": "closest", "colorscale": { "diverging": [ [ 0, "#8e0152" ], [ 0.1, "#c51b7d" ], [ 0.2, "#de77ae" ], [ 0.3, "#f1b6da" ], [ 0.4, "#fde0ef" ], [ 0.5, "#f7f7f7" ], [ 0.6, "#e6f5d0" ], [ 0.7, "#b8e186" ], [ 0.8, "#7fbc41" ], [ 0.9, "#4d9221" ], [ 1, "#276419" ] ], "sequential": [ [ 0, "#0d0887" ], [ 0.1111111111111111, "#46039f" ], [ 0.2222222222222222, "#7201a8" ], [ 0.3333333333333333, "#9c179e" ], [ 0.4444444444444444, "#bd3786" ], [ 0.5555555555555556, "#d8576b" ], [ 0.6666666666666666, "#ed7953" ], [ 0.7777777777777778, "#fb9f3a" ], [ 0.8888888888888888, "#fdca26" ], [ 1, "#f0f921" ] ], "sequentialminus": [ [ 0, "#0d0887" ], [ 0.1111111111111111, "#46039f" ], [ 0.2222222222222222, "#7201a8" ], [ 0.3333333333333333, "#9c179e" ], [ 0.4444444444444444, "#bd3786" ], [ 0.5555555555555556, "#d8576b" ], [ 0.6666666666666666, "#ed7953" ], [ 0.7777777777777778, "#fb9f3a" ], [ 0.8888888888888888, "#fdca26" ], [ 1, "#f0f921" ] ] }, "hoverlabel": { "align": "left" }, "plot_bgcolor": "#E5ECF6", "paper_bgcolor": "white", "shapedefaults": { "line": { "color": "#2a3f5f" } }, "autotypenumbers": "strict", "annotationdefaults": { "arrowhead": 0, "arrowcolor": "#2a3f5f", "arrowwidth": 1 } } }, "hoverlabel": { "font": { "size": 10 }, "bgcolor": "rgb(0, 0, 0, 0 )", "bordercolor": "whitesmoke" }, "showlegend": true, "updatemenus": [ { "x": 0.14000000000000012, "y": 1.02, "font": { "size": 12 }, "active": 1, "buttons": [ { "args": [ { "visible": [ true, true, false ] } ], "label": "Monatsmittel des Lufttemperatur", "method": "restyle", "visible": true }, { "args": [ { "visible": [ false, true, true ] } ], "label": "Jahresmittel der Lufttemperatur", "method": "restyle", "visible": true } ], "xanchor": "center", "yanchor": "middle", "direction": "down", "showactive": true } ], "plot_bgcolor": "rgb(255, 255, 255)" } }, "height": null, "width": null, "user": { "profile_url": "https://chart-studio.plotly.com/~Chapui", "avatar_url": "https://storage.googleapis.com/plotly-prod-profiles/80.jpg", "background_url": "https://storage.googleapis.com/plotly-prod-profiles/bg-3.jpg", "bio": "", "nickname": "", "website": "", "stream_tokens": null, "feature_set_id": null, "csrf_token": null, "date_joined": "2024-04-02 11:25:38", "mapbox_access_tokens": null, "has_password": null, "username": "Chapui", "email": null, "is_active": null, "readonly": null, "is_dash_creator": null, "dash_created_count": null, "is_chart_creator": null, "charts_created_count": null } }, { "creation_time": "2024-04-02T11:37:51.655083Z", "comments": { "results": [], "count": 0 }, "parented": true, "embed_url": "https://chart-studio.plotly.com/~iddi5504/1.embed", "fid": "iddi5504:1", "filename": "Plot 1", "filetype": "plot", "img_url": "https://storage.googleapis.com/plotly-prod-images/iddi5504/1/9_2QWGPVFQCZ0PTDNRDGXXAPMC6N7SA8.png", "image_urls": { "default": "https://storage.googleapis.com/plotly-prod-images/iddi5504/1/2_WUK2QP5UBPPUC3BI9KXYAQQTI4OK5D.png", "block-thumb": "https://storage.googleapis.com/plotly-prod-images/iddi5504/1/8_4VYH01G9CO96Z0F0ZKBZ87PFRU48DC.png", "list-thumb": "https://storage.googleapis.com/plotly-prod-images/iddi5504/1/9_2QWGPVFQCZ0PTDNRDGXXAPMC6N7SA8.png" }, "api_urls": { "files": "https://api.plotly.com/v2/files/iddi5504:1", "plots": "https://api.plotly.com/v2/plots/iddi5504:1", "parent": "https://api.plotly.com/v2/folders/home?user=iddi5504" }, "owner": "iddi5504", "parent": -1, "preview": "", "referencers": [], "references": [], "title": "", "views": 1, "web_url": "https://chart-studio.plotly.com/~iddi5504/1/", "world_readable": true, "date_modified": "2024-04-02T12:09:00.999Z", "stars": { "results": [], "count": 0 }, "collaborators": { "results": [], "count": 0 }, "subfolder_count": null, "refresh_interval": null, "organize_view_url": "https://chart-studio.plotly.com/~iddi5504/1/", "current_user_permission": "read", "is_theme": null, "is_template": false, "autosize": true, "caption": "", "figure": { "data": [ { "meta": { "columnNames": { "x": "B", "y": "A" } }, "mode": "markers", "type": "scatter", "xsrc": "iddi5504:0:11e805", "ysrc": "iddi5504:0:e1cccf" } ], "frames": [], "layout": { "xaxis": { "type": "linear", "range": [ 2.690161764705882, 4.313838235294118 ], "title": { "text": "Eg/Eo" }, "autorange": false, "showspikes": false }, "yaxis": { "type": "linear", "range": [ 50.84036784741144, 70.34963215258855 ], "title": { "text": "(F-w/Eo) x 10^8" }, "autorange": false, "showspikes": false }, "shapes": [], "autosize": true, "template": { "data": { "bar": [ { "type": "bar", "marker": { "colorbar": { "ticks": "", "outlinewidth": 0 } } } ], "table": [ { "type": "table", "cells": { "fill": { "color": "#EBF0F8" }, "line": { "color": "white" } }, "header": { "fill": { "color": "#C8D4E3" }, "line": { "color": "white" } } } ], "carpet": [ { "type": "carpet", "aaxis": { "gridcolor": "white", "linecolor": "white", "endlinecolor": "#2a3f5f", "minorgridcolor": "white", "startlinecolor": "#2a3f5f" }, "baxis": { "gridcolor": "white", "linecolor": "white", "endlinecolor": "#2a3f5f", "minorgridcolor": "white", "startlinecolor": "#2a3f5f" } } ], "mesh3d": [ { "type": "mesh3d", "colorbar": { "ticks": "", "outlinewidth": 0 } } ], "contour": [ { "type": "contour", "colorbar": { "ticks": "", "outlinewidth": 0 }, "autocolorscale": true } ], "heatmap": [ { "type": "heatmap", "colorbar": { "ticks": "", "outlinewidth": 0 }, "autocolorscale": true } ], "scatter": [ { "type": "scatter", "marker": { "colorbar": { "ticks": "", "outlinewidth": 0 } } } ], "surface": [ { "type": "surface", "colorbar": { "ticks": "", "outlinewidth": 0 } } ], "heatmapgl": [ { "type": "heatmapgl", "colorbar": { "ticks": "", "outlinewidth": 0 } } ], "histogram": [ { "type": "histogram", "marker": { "colorbar": { "ticks": "", "outlinewidth": 0 } } } ], "parcoords": [ { "line": { "colorbar": { "ticks": "", "outlinewidth": 0 } }, "type": "parcoords" } ], "scatter3d": [ { "type": "scatter3d", "marker": { "colorbar": { "ticks": "", "outlinewidth": 0 } } } ], "scattergl": [ { "type": "scattergl", "marker": { "colorbar": { "ticks": "", "outlinewidth": 0 } } } ], "choropleth": [ { "type": "choropleth", "colorbar": { "ticks": "", "outlinewidth": 0 } } ], "scattergeo": [ { "type": "scattergeo", "marker": { "colorbar": { "ticks": "", "outlinewidth": 0 } } } ], "histogram2d": [ { "type": "histogram2d", "colorbar": { "ticks": "", "outlinewidth": 0 }, "autocolorscale": true } ], "scatterpolar": [ { "type": "scatterpolar", "marker": { "colorbar": { "ticks": "", "outlinewidth": 0 } } } ], "contourcarpet": [ { "type": "contourcarpet", "colorbar": { "ticks": "", "outlinewidth": 0 } } ], "scattercarpet": [ { "type": "scattercarpet", "marker": { "colorbar": { "ticks": "", "outlinewidth": 0 } } } ], "scattermapbox": [ { "type": "scattermapbox", "marker": { "colorbar": { "ticks": "", "outlinewidth": 0 } } } ], "scatterpolargl": [ { "type": "scatterpolargl", "marker": { "colorbar": { "ticks": "", "outlinewidth": 0 } } } ], "scatterternary": [ { "type": "scatterternary", "marker": { "colorbar": { "ticks": "", "outlinewidth": 0 } } } ], "histogram2dcontour": [ { "type": "histogram2dcontour", "colorbar": { "ticks": "", "outlinewidth": 0 }, "autocolorscale": true } ] }, "layout": { "geo": { "bgcolor": "white", "showland": true, "lakecolor": "white", "landcolor": "#E5ECF6", "showlakes": true, "subunitcolor": "white" }, "font": { "color": "#2a3f5f" }, "polar": { "bgcolor": "#E5ECF6", "radialaxis": { "ticks": "", "gridcolor": "white", "linecolor": "white" }, "angularaxis": { "ticks": "", "gridcolor": "white", "linecolor": "white" } }, "scene": { "xaxis": { "ticks": "", "gridcolor": "white", "gridwidth": 2, "linecolor": "white", "zerolinecolor": "white", "showbackground": true, "backgroundcolor": "#E5ECF6" }, "yaxis": { "ticks": "", "gridcolor": "white", "gridwidth": 2, "linecolor": "white", "zerolinecolor": "white", "showbackground": true, "backgroundcolor": "#E5ECF6" }, "zaxis": { "ticks": "", "gridcolor": "white", "gridwidth": 2, "linecolor": "white", "zerolinecolor": "white", "showbackground": true, "backgroundcolor": "#E5ECF6" } }, "title": { "x": 0.05 }, "xaxis": { "ticks": "", "gridcolor": "white", "linecolor": "white", "automargin": true, "zerolinecolor": "white", "zerolinewidth": 2 }, "yaxis": { "ticks": "", "gridcolor": "white", "linecolor": "white", "automargin": true, "zerolinecolor": "white", "zerolinewidth": 2 }, "ternary": { "aaxis": { "ticks": "", "gridcolor": "white", "linecolor": "white" }, "baxis": { "ticks": "", "gridcolor": "white", "linecolor": "white" }, "caxis": { "ticks": "", "gridcolor": "white", "linecolor": "white" }, "bgcolor": "#E5ECF6" }, "colorway": [ "#636efa", "#EF553B", "#00cc96", "#ab63fa", "#19d3f3", "#e763fa", "#fecb52", "#ffa15a", "#ff6692", "#b6e880" ], "hovermode": "closest", "colorscale": { "diverging": [ [ 0, "#8e0152" ], [ 0.1, "#c51b7d" ], [ 0.2, "#de77ae" ], [ 0.3, "#f1b6da" ], [ 0.4, "#fde0ef" ], [ 0.5, "#f7f7f7" ], [ 0.6, "#e6f5d0" ], [ 0.7, "#b8e186" ], [ 0.8, "#7fbc41" ], [ 0.9, "#4d9221" ], [ 1, "#276419" ] ], "sequential": [ [ 0, "#0508b8" ], [ 0.0893854748603352, "#1910d8" ], [ 0.1787709497206704, "#3c19f0" ], [ 0.2681564245810056, "#6b1cfb" ], [ 0.3575418994413408, "#981cfd" ], [ 0.44692737430167595, "#bf1cfd" ], [ 0.5363128491620112, "#dd2bfd" ], [ 0.6256983240223464, "#f246fe" ], [ 0.7150837988826816, "#fc67fd" ], [ 0.8044692737430168, "#fe88fc" ], [ 0.8938547486033519, "#fea5fd" ], [ 0.9832402234636871, "#febefe" ], [ 1, "#fec3fe" ] ], "sequentialminus": [ [ 0, "#0508b8" ], [ 0.0893854748603352, "#1910d8" ], [ 0.1787709497206704, "#3c19f0" ], [ 0.2681564245810056, "#6b1cfb" ], [ 0.3575418994413408, "#981cfd" ], [ 0.44692737430167595, "#bf1cfd" ], [ 0.5363128491620112, "#dd2bfd" ], [ 0.6256983240223464, "#f246fe" ], [ 0.7150837988826816, "#fc67fd" ], [ 0.8044692737430168, "#fe88fc" ], [ 0.8938547486033519, "#fea5fd" ], [ 0.9832402234636871, "#febefe" ], [ 1, "#fec3fe" ] ] }, "plot_bgcolor": "#E5ECF6", "paper_bgcolor": "white", "shapedefaults": { "line": { "width": 0 }, "opacity": 0.4, "fillcolor": "#506784" }, "annotationdefaults": { "arrowhead": 0, "arrowcolor": "#506784", "arrowwidth": 1 } }, "themeRef": "PLOTLY_GRAY" } } }, "height": null, "width": null, "user": { "profile_url": "https://chart-studio.plotly.com/~iddi5504", "avatar_url": "https://storage.googleapis.com/plotly-prod-profiles/36.jpg", "background_url": "https://storage.googleapis.com/plotly-prod-profiles/bg-5.jpg", "bio": "", "nickname": "", "website": "", "stream_tokens": null, "feature_set_id": null, "csrf_token": null, "date_joined": "2024-04-02 11:36:56", "mapbox_access_tokens": null, "has_password": null, "username": "iddi5504", "email": null, "is_active": null, "readonly": null, "is_dash_creator": null, "dash_created_count": null, "is_chart_creator": null, "charts_created_count": null } } ] }
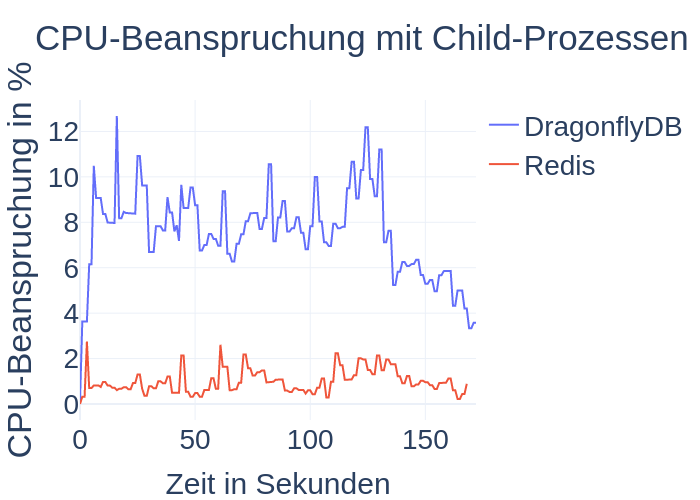