Plots List
Plots
This endpoint handles manipulation of Plotly plot files.
Reference
Authorization
Any user with or without a Plotly account may view public plots. For private plots, see authentication.
Actions
list
Listing all public plots can be done via a GET request to this endpoint.
By default, plots will be listed in order of date created. The order_by
query parameter is accepted at this endpoint. Currently, only ordering by
views is supported. It is possible to filter the plots by quality
with min_quality or max_quality as query parameter.
Example:
// GET https://api.plotly.com/v2/plots/ ---> 200

// GET https://api.plotly.com/v2/plots/?order_by=-views ---> 200

// GET https://api.plotly.com/v2/plots/?min_quality=5 ---> 200

// GET https://api.plotly.com/v2/plots/?max_quality=5 ---> 200
feed
Listing all handpicked feed plots can be done via a GET request to this endpoint. By default, plots will be listed in a random order.
Example:
// GET https://api.plotly.com/v2/plots/feed ---> 200
create
You can create new plot resources here. The only required field is 'figure'. Currently, the figure is restricted to only contain references to grid data. That is, this will fail if raw data arrays are passed in. To create and manipulate underlying grids for plots, see the grids endpoint.
Example:
// This fails because a figure field is required.
// POST https://api.plotly.com/v2/plots ---> 400 Bad Request
{}

// This fails because the figure has raw data
//POST https://api.plotly.com/v2/plots ---> 400 Bad Request
{
    "figure": {"data": [{"y": ['this', 'is', 'raw', 'data']}]}
}

// This succeeds because the figure has src keys, not raw data.
//POST https://api.plotly.com/v2/plots ---> 200 OK
{
    "figure": {"data": [{"ysrc": "sven:88:u8nd62"}]}
}
When creating a grid, you can optionally specify a source_fid to specify where a plot has come from:
- source_fid: the fid of a plot that was copied (and presumably edited) to produce this one
detail
There is a lot of meta information stored about plot files including filename, title, share_url, and content_url to name a few.
This information can only be reached with a GET to this endpoint.
Example:
// GET https://api.plotly.com/v2/plots/iheartgraphs:90
content
The contents of a plot can be downloaded via the content resource. The plot
content contains referenced grid/column data by default. If you wish to
return the raw grid/column data, the inline_data=true query must be included
in the request url. The Content-Type header will be appropriately set for the
response body.
Alternatively, you can set ?map_data=unreadable to append a mapping of
sources to data that belongs to grids which are unreadable for the
requestor. This is useful when you have read access to another users plot,
but that plot contains grid references which you don't have access to.
Examples:
// Returns referenced grid/column data
// GET https://api.plotly.com/v2/plots/iheartgraphs:90/content ---> 200 OK

// Returns full grid/column data
// GET https://api.plotly.com/v2/plots/iheartgraphs:90/content?inline_data=true ---> 200 OK

// Returns full grid/column data when requestor doesn't have permission
// to read the referenced grid.
// GET https://api.plotly.com/v2/plots/iheartgraphs:90/content?map_data=unreadable ---> 200 OK
GET /v2/plots?cursor=cj0xJnA9MjAyNC0wNC0wMisxMCUzQTQyJTNBNDQuNTQ4MjY1JTJCMDAlM0EwMA%3D%3D&format=api
{ "next": "https://api.plot.ly/v2/plots?cursor=cD0yMDI0LTA0LTAyKzEwJTNBNDIlM0E0NC43NzM5MTYlMkIwMCUzQTAw&format=api", "previous": "https://api.plot.ly/v2/plots?cursor=cj0xJnA9MjAyNC0wNC0wMisxMSUzQTMxJTNBNDEuODIzMzIxJTJCMDAlM0EwMA%3D%3D&format=api", "results": [ { "creation_time": "2024-04-02T11:31:41.823321Z", "comments": { "results": [], "count": 0 }, "parented": true, "embed_url": "https://chart-studio.plotly.com/~Chapui/1.embed", "fid": "Chapui:1", "filename": "basic-line", "filetype": "plot", "img_url": "https://storage.googleapis.com/plotly-prod-images/Chapui/1/9_LQMGYW8RPXF3JDS0PZIR3CVJH4S7E7.png", "image_urls": { "default": "https://storage.googleapis.com/plotly-prod-images/Chapui/1/2_BZUCRKW6HX6D0AXUHQ8NCVFBX7SJ8W.png", "block-thumb": "https://storage.googleapis.com/plotly-prod-images/Chapui/1/8_Q5DOW1EAUYJTH4PML56W5QH1QGG9FL.png", "list-thumb": "https://storage.googleapis.com/plotly-prod-images/Chapui/1/9_LQMGYW8RPXF3JDS0PZIR3CVJH4S7E7.png" }, "api_urls": { "files": "https://api.plotly.com/v2/files/Chapui:1", "plots": "https://api.plotly.com/v2/plots/Chapui:1", "parent": "https://api.plotly.com/v2/folders/home?user=Chapui" }, "owner": "Chapui", "parent": -1, "preview": "", "referencers": [], "references": [], "title": "", "views": 5, "web_url": "https://chart-studio.plotly.com/~Chapui/1/", "world_readable": true, "date_modified": "2024-04-02T11:31:41.833Z", "stars": { "results": [], "count": 0 }, "collaborators": { "results": [], "count": 0 }, "subfolder_count": null, "refresh_interval": null, "organize_view_url": "https://chart-studio.plotly.com/~Chapui/1/", "current_user_permission": "read", "is_theme": null, "is_template": null, "autosize": true, "caption": "", "figure": { "data": [ { "type": "scatter", "xsrc": "Chapui:0:ae65e2", "ysrc": "Chapui:0:540c6b" }, { "type": "scatter", "xsrc": "Chapui:0:9c8b6d", "ysrc": "Chapui:0:6a406d" } ], "layout": { "template": { "data": { "bar": [ { "type": "bar", "marker": { "line": { "color": "#E5ECF6", "width": 0.5 }, "pattern": { "size": 10, "fillmode": "overlay", "solidity": 0.2 } }, "error_x": { "color": "#2a3f5f" }, "error_y": { "color": "#2a3f5f" } } ], "pie": [ { "type": "pie", "automargin": true } ], "table": [ { "type": "table", "cells": { "fill": { "color": "#EBF0F8" }, "line": { "color": "white" } }, "header": { "fill": { "color": "#C8D4E3" }, "line": { "color": "white" } } } ], "carpet": [ { "type": "carpet", "aaxis": { "gridcolor": "white", "linecolor": "white", "endlinecolor": "#2a3f5f", "minorgridcolor": "white", "startlinecolor": "#2a3f5f" }, "baxis": { "gridcolor": "white", "linecolor": "white", "endlinecolor": "#2a3f5f", "minorgridcolor": "white", "startlinecolor": "#2a3f5f" } } ], "mesh3d": [ { "type": "mesh3d", "colorbar": { "ticks": "", "outlinewidth": 0 } } ], "contour": [ { "type": "contour", "colorbar": { "ticks": "", "outlinewidth": 0 }, "colorscale": [ [ 0.0, "#0d0887" ], [ 0.1111111111111111, "#46039f" ], [ 0.2222222222222222, "#7201a8" ], [ 0.3333333333333333, "#9c179e" ], [ 0.4444444444444444, "#bd3786" ], [ 0.5555555555555556, "#d8576b" ], [ 0.6666666666666666, "#ed7953" ], [ 0.7777777777777778, "#fb9f3a" ], [ 0.8888888888888888, "#fdca26" ], [ 1.0, "#f0f921" ] ] } ], "heatmap": [ { "type": "heatmap", "colorbar": { "ticks": "", "outlinewidth": 0 }, "colorscale": [ [ 0.0, "#0d0887" ], [ 0.1111111111111111, "#46039f" ], [ 0.2222222222222222, "#7201a8" ], [ 0.3333333333333333, "#9c179e" ], [ 0.4444444444444444, "#bd3786" ], [ 0.5555555555555556, "#d8576b" ], [ 0.6666666666666666, "#ed7953" ], [ 0.7777777777777778, "#fb9f3a" ], [ 0.8888888888888888, "#fdca26" ], [ 1.0, "#f0f921" ] ] } ], "scatter": [ { "type": "scatter", "fillpattern": { "size": 10, "fillmode": "overlay", "solidity": 0.2 } } ], "surface": [ { "type": "surface", "colorbar": { "ticks": "", "outlinewidth": 0 }, "colorscale": [ [ 0.0, "#0d0887" ], [ 0.1111111111111111, "#46039f" ], [ 0.2222222222222222, "#7201a8" ], [ 0.3333333333333333, "#9c179e" ], [ 0.4444444444444444, "#bd3786" ], [ 0.5555555555555556, "#d8576b" ], [ 0.6666666666666666, "#ed7953" ], [ 0.7777777777777778, "#fb9f3a" ], [ 0.8888888888888888, "#fdca26" ], [ 1.0, "#f0f921" ] ] } ], "barpolar": [ { "type": "barpolar", "marker": { "line": { "color": "#E5ECF6", "width": 0.5 }, "pattern": { "size": 10, "fillmode": "overlay", "solidity": 0.2 } } } ], "heatmapgl": [ { "type": "heatmapgl", "colorbar": { "ticks": "", "outlinewidth": 0 }, "colorscale": [ [ 0.0, "#0d0887" ], [ 0.1111111111111111, "#46039f" ], [ 0.2222222222222222, "#7201a8" ], [ 0.3333333333333333, "#9c179e" ], [ 0.4444444444444444, "#bd3786" ], [ 0.5555555555555556, "#d8576b" ], [ 0.6666666666666666, "#ed7953" ], [ 0.7777777777777778, "#fb9f3a" ], [ 0.8888888888888888, "#fdca26" ], [ 1.0, "#f0f921" ] ] } ], "histogram": [ { "type": "histogram", "marker": { "pattern": { "size": 10, "fillmode": "overlay", "solidity": 0.2 } } } ], "parcoords": [ { "line": { "colorbar": { "ticks": "", "outlinewidth": 0 } }, "type": "parcoords" } ], "scatter3d": [ { "line": { "colorbar": { "ticks": "", "outlinewidth": 0 } }, "type": "scatter3d", "marker": { "colorbar": { "ticks": "", "outlinewidth": 0 } } } ], "scattergl": [ { "type": "scattergl", "marker": { "colorbar": { "ticks": "", "outlinewidth": 0 } } } ], "choropleth": [ { "type": "choropleth", "colorbar": { "ticks": "", "outlinewidth": 0 } } ], "scattergeo": [ { "type": "scattergeo", "marker": { "colorbar": { "ticks": "", "outlinewidth": 0 } } } ], "histogram2d": [ { "type": "histogram2d", "colorbar": { "ticks": "", "outlinewidth": 0 }, "colorscale": [ [ 0.0, "#0d0887" ], [ 0.1111111111111111, "#46039f" ], [ 0.2222222222222222, "#7201a8" ], [ 0.3333333333333333, "#9c179e" ], [ 0.4444444444444444, "#bd3786" ], [ 0.5555555555555556, "#d8576b" ], [ 0.6666666666666666, "#ed7953" ], [ 0.7777777777777778, "#fb9f3a" ], [ 0.8888888888888888, "#fdca26" ], [ 1.0, "#f0f921" ] ] } ], "scatterpolar": [ { "type": "scatterpolar", "marker": { "colorbar": { "ticks": "", "outlinewidth": 0 } } } ], "contourcarpet": [ { "type": "contourcarpet", "colorbar": { "ticks": "", "outlinewidth": 0 } } ], "scattercarpet": [ { "type": "scattercarpet", "marker": { "colorbar": { "ticks": "", "outlinewidth": 0 } } } ], "scattermapbox": [ { "type": "scattermapbox", "marker": { "colorbar": { "ticks": "", "outlinewidth": 0 } } } ], "scatterpolargl": [ { "type": "scatterpolargl", "marker": { "colorbar": { "ticks": "", "outlinewidth": 0 } } } ], "scatterternary": [ { "type": "scatterternary", "marker": { "colorbar": { "ticks": "", "outlinewidth": 0 } } } ], "histogram2dcontour": [ { "type": "histogram2dcontour", "colorbar": { "ticks": "", "outlinewidth": 0 }, "colorscale": [ [ 0.0, "#0d0887" ], [ 0.1111111111111111, "#46039f" ], [ 0.2222222222222222, "#7201a8" ], [ 0.3333333333333333, "#9c179e" ], [ 0.4444444444444444, "#bd3786" ], [ 0.5555555555555556, "#d8576b" ], [ 0.6666666666666666, "#ed7953" ], [ 0.7777777777777778, "#fb9f3a" ], [ 0.8888888888888888, "#fdca26" ], [ 1.0, "#f0f921" ] ] } ] }, "layout": { "geo": { "bgcolor": "white", "showland": true, "lakecolor": "white", "landcolor": "#E5ECF6", "showlakes": true, "subunitcolor": "white" }, "font": { "color": "#2a3f5f" }, "polar": { "bgcolor": "#E5ECF6", "radialaxis": { "ticks": "", "gridcolor": "white", "linecolor": "white" }, "angularaxis": { "ticks": "", "gridcolor": "white", "linecolor": "white" } }, "scene": { "xaxis": { "ticks": "", "gridcolor": "white", "gridwidth": 2, "linecolor": "white", "zerolinecolor": "white", "showbackground": true, "backgroundcolor": "#E5ECF6" }, "yaxis": { "ticks": "", "gridcolor": "white", "gridwidth": 2, "linecolor": "white", "zerolinecolor": "white", "showbackground": true, "backgroundcolor": "#E5ECF6" }, "zaxis": { "ticks": "", "gridcolor": "white", "gridwidth": 2, "linecolor": "white", "zerolinecolor": "white", "showbackground": true, "backgroundcolor": "#E5ECF6" } }, "title": { "x": 0.05 }, "xaxis": { "ticks": "", "title": { "standoff": 15 }, "gridcolor": "white", "linecolor": "white", "automargin": true, "zerolinecolor": "white", "zerolinewidth": 2 }, "yaxis": { "ticks": "", "title": { "standoff": 15 }, "gridcolor": "white", "linecolor": "white", "automargin": true, "zerolinecolor": "white", "zerolinewidth": 2 }, "mapbox": { "style": "light" }, "ternary": { "aaxis": { "ticks": "", "gridcolor": "white", "linecolor": "white" }, "baxis": { "ticks": "", "gridcolor": "white", "linecolor": "white" }, "caxis": { "ticks": "", "gridcolor": "white", "linecolor": "white" }, "bgcolor": "#E5ECF6" }, "colorway": [ "#636efa", "#EF553B", "#00cc96", "#ab63fa", "#FFA15A", "#19d3f3", "#FF6692", "#B6E880", "#FF97FF", "#FECB52" ], "coloraxis": { "colorbar": { "ticks": "", "outlinewidth": 0 } }, "hovermode": "closest", "colorscale": { "diverging": [ [ 0, "#8e0152" ], [ 0.1, "#c51b7d" ], [ 0.2, "#de77ae" ], [ 0.3, "#f1b6da" ], [ 0.4, "#fde0ef" ], [ 0.5, "#f7f7f7" ], [ 0.6, "#e6f5d0" ], [ 0.7, "#b8e186" ], [ 0.8, "#7fbc41" ], [ 0.9, "#4d9221" ], [ 1, "#276419" ] ], "sequential": [ [ 0.0, "#0d0887" ], [ 0.1111111111111111, "#46039f" ], [ 0.2222222222222222, "#7201a8" ], [ 0.3333333333333333, "#9c179e" ], [ 0.4444444444444444, "#bd3786" ], [ 0.5555555555555556, "#d8576b" ], [ 0.6666666666666666, "#ed7953" ], [ 0.7777777777777778, "#fb9f3a" ], [ 0.8888888888888888, "#fdca26" ], [ 1.0, "#f0f921" ] ], "sequentialminus": [ [ 0.0, "#0d0887" ], [ 0.1111111111111111, "#46039f" ], [ 0.2222222222222222, "#7201a8" ], [ 0.3333333333333333, "#9c179e" ], [ 0.4444444444444444, "#bd3786" ], [ 0.5555555555555556, "#d8576b" ], [ 0.6666666666666666, "#ed7953" ], [ 0.7777777777777778, "#fb9f3a" ], [ 0.8888888888888888, "#fdca26" ], [ 1.0, "#f0f921" ] ] }, "hoverlabel": { "align": "left" }, "plot_bgcolor": "#E5ECF6", "paper_bgcolor": "white", "shapedefaults": { "line": { "color": "#2a3f5f" } }, "autotypenumbers": "strict", "annotationdefaults": { "arrowhead": 0, "arrowcolor": "#2a3f5f", "arrowwidth": 1 } } } } }, "height": null, "width": null, "user": { "profile_url": "https://chart-studio.plotly.com/~Chapui", "avatar_url": "https://storage.googleapis.com/plotly-prod-profiles/80.jpg", "background_url": "https://storage.googleapis.com/plotly-prod-profiles/bg-3.jpg", "bio": "", "nickname": "", "website": "", "stream_tokens": null, "feature_set_id": null, "csrf_token": null, "date_joined": "2024-04-02 11:25:38", "mapbox_access_tokens": null, "has_password": null, "username": "Chapui", "email": null, "is_active": null, "readonly": null, "is_dash_creator": null, "dash_created_count": null, "is_chart_creator": null, "charts_created_count": null } }, { "creation_time": "2024-04-02T11:29:52.619160Z", "comments": { "results": [], "count": 0 }, "parented": true, "embed_url": "https://chart-studio.plotly.com/~AR181RA/3.embed", "fid": "AR181RA:3", "filename": "Plot 3", "filetype": "plot", "img_url": "https://storage.googleapis.com/plotly-prod-images/AR181RA/3/9_LU2RCU592JGHAAYSQQVT9MBVIQNVS5.png", "image_urls": { "default": "https://storage.googleapis.com/plotly-prod-images/AR181RA/3/2_N79OGONKSDU378J6QA2GWRCJY78UYA.png", "block-thumb": "https://storage.googleapis.com/plotly-prod-images/AR181RA/3/8_SG7H8521H3X0AWWCTE8EYB1NXLW4O8.png", "list-thumb": "https://storage.googleapis.com/plotly-prod-images/AR181RA/3/9_LU2RCU592JGHAAYSQQVT9MBVIQNVS5.png" }, "api_urls": { "files": "https://api.plotly.com/v2/files/AR181RA:3", "plots": "https://api.plotly.com/v2/plots/AR181RA:3", "parent": "https://api.plotly.com/v2/folders/home?user=AR181RA" }, "owner": "AR181RA", "parent": -1, "preview": "", "referencers": [], "references": [], "title": "", "views": 1, "web_url": "https://chart-studio.plotly.com/~AR181RA/3/", "world_readable": true, "date_modified": "2024-04-02T11:29:52.631Z", "stars": { "results": [], "count": 0 }, "collaborators": { "results": [], "count": 0 }, "subfolder_count": null, "refresh_interval": null, "organize_view_url": "https://chart-studio.plotly.com/~AR181RA/3/", "current_user_permission": "read", "is_theme": null, "is_template": true, "autosize": true, "caption": "", "figure": { "data": [ { "meta": { "columnNames": { "x": "A", "y": "B" } }, "mode": "markers+lines+text", "name": "Line 1", "type": "scatter", "xsrc": "AR181RA:2:5bd75e", "ysrc": "AR181RA:2:df08ab" }, { "meta": { "columnNames": { "x": "A", "y": "B" } }, "mode": "markers+lines+text", "name": "Line 2", "type": "scatter", "xsrc": "AR181RA:2:5bd75e", "ysrc": "AR181RA:2:df08ab", "stackgroup": null }, { "meta": { "columnNames": { "x": "A", "y": "C" } }, "mode": "markers+lines+text", "name": "Line 3", "type": "scatter", "xsrc": "AR181RA:2:5bd75e", "ysrc": "AR181RA:2:db8a28", "stackgroup": null }, { "meta": { "columnNames": { "x": "A", "y": "D" } }, "mode": "markers+lines+text", "name": "Line 4", "type": "scatter", "xsrc": "AR181RA:2:5bd75e", "ysrc": "AR181RA:2:1023fa", "stackgroup": null }, { "meta": { "columnNames": { "x": "A", "y": "E" } }, "mode": "markers+lines+text", "name": "Line 5", "type": "scatter", "xsrc": "AR181RA:2:5bd75e", "ysrc": "AR181RA:2:115a10", "stackgroup": null }, { "meta": { "columnNames": { "x": "A", "y": "F" } }, "mode": "markers+lines+text", "name": "Line 6", "type": "scatter", "xsrc": "AR181RA:2:5bd75e", "ysrc": "AR181RA:2:b54bf1", "marker": { "color": "#e763fa" } } ], "frames": [], "layout": { "font": { "size": 14 }, "title": { "font": { "size": 18, "family": "Gravitas One" }, "text": "Linear Chart Example" }, "xaxis": { "side": "bottom", "type": "linear", "range": [ 0.7632268203247774, 5.236773179675223 ], "ticks": "inside", "title": { "font": { "size": 18, "family": "Arial" }, "text": "<b>Hedge Percentage</b>" }, "domain": [ 0, 1 ], "ticklen": 6, "showgrid": true, "autorange": true, "tickwidth": 4, "rangeslider": { "range": [ 1, 5 ], "yaxis": {}, "visible": false, "autorange": true, "thickness": 0 } }, "yaxis": { "type": "linear", "range": [ 1.46875, 10.53125 ], "ticks": "inside", "title": { "font": { "size": 18, "family": "Arial" }, "text": "<b>Hedgeing Year</b>" }, "domain": [ 0, 1 ], "ticklen": 6, "autorange": true, "tickwidth": 4, "showspikes": false }, "legend": { "x": 0.26000000000000023, "y": -0.3599999999999999, "font": { "family": "Courier New" }, "title": { "font": { "family": "Arial" }, "text": "<sub><b>Legend :</b></sub>" }, "valign": "bottom", "bgcolor": "rgb(232, 224, 227)", "xanchor": "auto", "yanchor": "auto", "traceorder": "normal", "bordercolor": "rgb(148, 46, 46)", "borderwidth": 2, "orientation": "h" }, "margin": { "b": 90, "l": 90, "r": 80, "t": 100, "pad": 5 }, "modebar": { "color": "rgba(154, 154, 154, 0.3)", "bgcolor": "rgba(255, 255, 255, 0.5)", "orientation": "h" }, "autosize": true, "template": { "data": { "bar": [ { "type": "bar", "marker": { "colorbar": { "ticks": "", "outlinewidth": 0 } } } ], "table": [ { "type": "table", "cells": { "fill": { "color": "#EBF0F8" }, "line": { "color": "white" } }, "header": { "fill": { "color": "#C8D4E3" }, "line": { "color": "white" } } } ], "carpet": [ { "type": "carpet", "aaxis": { "gridcolor": "#C8D4E3", "linecolor": "#C8D4E3", "endlinecolor": "#2a3f5f", "minorgridcolor": "#C8D4E3", "startlinecolor": "#2a3f5f" }, "baxis": { "gridcolor": "#C8D4E3", "linecolor": "#C8D4E3", "endlinecolor": "#2a3f5f", "minorgridcolor": "#C8D4E3", "startlinecolor": "#2a3f5f" } } ], "mesh3d": [ { "type": "mesh3d", "colorbar": { "ticks": "", "outlinewidth": 0 } } ], "contour": [ { "type": "contour", "colorbar": { "ticks": "", "outlinewidth": 0 }, "autocolorscale": true } ], "heatmap": [ { "type": "heatmap", "colorbar": { "ticks": "", "outlinewidth": 0 }, "autocolorscale": true } ], "scatter": [ { "type": "scatter", "marker": { "colorbar": { "ticks": "", "outlinewidth": 0 } } } ], "surface": [ { "type": "surface", "colorbar": { "ticks": "", "outlinewidth": 0 } } ], "heatmapgl": [ { "type": "heatmapgl", "colorbar": { "ticks": "", "outlinewidth": 0 } } ], "histogram": [ { "type": "histogram", "marker": { "colorbar": { "ticks": "", "outlinewidth": 0 } } } ], "parcoords": [ { "line": { "colorbar": { "ticks": "", "outlinewidth": 0 } }, "type": "parcoords" } ], "scatter3d": [ { "type": "scatter3d", "marker": { "colorbar": { "ticks": "", "outlinewidth": 0 } } } ], "scattergl": [ { "type": "scattergl", "marker": { "colorbar": { "ticks": "", "outlinewidth": 0 } } } ], "choropleth": [ { "type": "choropleth", "colorbar": { "ticks": "", "outlinewidth": 0 } } ], "scattergeo": [ { "type": "scattergeo", "marker": { "colorbar": { "ticks": "", "outlinewidth": 0 } } } ], "histogram2d": [ { "type": "histogram2d", "colorbar": { "ticks": "", "outlinewidth": 0 }, "autocolorscale": true } ], "scatterpolar": [ { "type": "scatterpolar", "marker": { "colorbar": { "ticks": "", "outlinewidth": 0 } } } ], "contourcarpet": [ { "type": "contourcarpet", "colorbar": { "ticks": "", "outlinewidth": 0 } } ], "scattercarpet": [ { "type": "scattercarpet", "marker": { "colorbar": { "ticks": "", "outlinewidth": 0 } } } ], "scattermapbox": [ { "type": "scattermapbox", "marker": { "colorbar": { "ticks": "", "outlinewidth": 0 } } } ], "scatterpolargl": [ { "type": "scatterpolargl", "marker": { "colorbar": { "ticks": "", "outlinewidth": 0 } } } ], "scatterternary": [ { "type": "scatterternary", "marker": { "colorbar": { "ticks": "", "outlinewidth": 0 } } } ], "histogram2dcontour": [ { "type": "histogram2dcontour", "colorbar": { "ticks": "", "outlinewidth": 0 }, "autocolorscale": true } ] }, "layout": { "geo": { "bgcolor": "white", "showland": true, "lakecolor": "white", "landcolor": "white", "showlakes": true, "subunitcolor": "#C8D4E3" }, "font": { "color": "#2a3f5f" }, "polar": { "bgcolor": "white", "radialaxis": { "ticks": "", "gridcolor": "#EBF0F8", "linecolor": "#EBF0F8" }, "angularaxis": { "ticks": "", "gridcolor": "#EBF0F8", "linecolor": "#EBF0F8" } }, "scene": { "xaxis": { "ticks": "", "gridcolor": "#DFE8F3", "gridwidth": 2, "linecolor": "#EBF0F8", "zerolinecolor": "#EBF0F8", "showbackground": true, "backgroundcolor": "white" }, "yaxis": { "ticks": "", "gridcolor": "#DFE8F3", "gridwidth": 2, "linecolor": "#EBF0F8", "zerolinecolor": "#EBF0F8", "showbackground": true, "backgroundcolor": "white" }, "zaxis": { "ticks": "", "gridcolor": "#DFE8F3", "gridwidth": 2, "linecolor": "#EBF0F8", "zerolinecolor": "#EBF0F8", "showbackground": true, "backgroundcolor": "white" } }, "title": { "x": 0.05 }, "xaxis": { "ticks": "", "gridcolor": "#EBF0F8", "linecolor": "#EBF0F8", "automargin": true, "zerolinecolor": "#EBF0F8", "zerolinewidth": 2 }, "yaxis": { "ticks": "", "gridcolor": "#EBF0F8", "linecolor": "#EBF0F8", "automargin": true, "zerolinecolor": "#EBF0F8", "zerolinewidth": 2 }, "ternary": { "aaxis": { "ticks": "", "gridcolor": "#DFE8F3", "linecolor": "#A2B1C6" }, "baxis": { "ticks": "", "gridcolor": "#DFE8F3", "linecolor": "#A2B1C6" }, "caxis": { "ticks": "", "gridcolor": "#DFE8F3", "linecolor": "#A2B1C6" }, "bgcolor": "white" }, "colorway": [ "#636efa", "#EF553B", "#00cc96", "#ab63fa", "#19d3f3", "#e763fa", "#fecb52", "#ffa15a", "#ff6692", "#b6e880" ], "hovermode": "closest", "colorscale": { "diverging": [ [ 0, "#8e0152" ], [ 0.1, "#c51b7d" ], [ 0.2, "#de77ae" ], [ 0.3, "#f1b6da" ], [ 0.4, "#fde0ef" ], [ 0.5, "#f7f7f7" ], [ 0.6, "#e6f5d0" ], [ 0.7, "#b8e186" ], [ 0.8, "#7fbc41" ], [ 0.9, "#4d9221" ], [ 1, "#276419" ] ], "sequential": [ [ 0, "#0508b8" ], [ 0.0893854748603352, "#1910d8" ], [ 0.1787709497206704, "#3c19f0" ], [ 0.2681564245810056, "#6b1cfb" ], [ 0.3575418994413408, "#981cfd" ], [ 0.44692737430167595, "#bf1cfd" ], [ 0.5363128491620112, "#dd2bfd" ], [ 0.6256983240223464, "#f246fe" ], [ 0.7150837988826816, "#fc67fd" ], [ 0.8044692737430168, "#fe88fc" ], [ 0.8938547486033519, "#fea5fd" ], [ 0.9832402234636871, "#febefe" ], [ 1, "#fec3fe" ] ], "sequentialminus": [ [ 0, "#0508b8" ], [ 0.0893854748603352, "#1910d8" ], [ 0.1787709497206704, "#3c19f0" ], [ 0.2681564245810056, "#6b1cfb" ], [ 0.3575418994413408, "#981cfd" ], [ 0.44692737430167595, "#bf1cfd" ], [ 0.5363128491620112, "#dd2bfd" ], [ 0.6256983240223464, "#f246fe" ], [ 0.7150837988826816, "#fc67fd" ], [ 0.8044692737430168, "#fe88fc" ], [ 0.8938547486033519, "#fea5fd" ], [ 0.9832402234636871, "#febefe" ], [ 1, "#fec3fe" ] ] }, "plot_bgcolor": "white", "paper_bgcolor": "white", "shapedefaults": { "line": { "width": 0 }, "opacity": 0.4, "fillcolor": "#506784" }, "annotationdefaults": { "arrowhead": 0, "arrowcolor": "#506784", "arrowwidth": 1 } }, "themeRef": "PLOTLY_WHITE" }, "clickmode": "event", "hovermode": "closest", "hoverlabel": { "font": { "size": 20, "family": "Courier New" } }, "showlegend": true, "annotations": [], "uniformtext": { "mode": false, "minsize": 0 }, "paper_bgcolor": "rgb(255, 255, 255)" } }, "height": null, "width": null, "user": { "profile_url": "https://chart-studio.plotly.com/~AR181RA", "avatar_url": "https://storage.googleapis.com/plotly-prod-profiles/12.jpg", "background_url": "https://storage.googleapis.com/plotly-prod-profiles/bg-10.jpg", "bio": "", "nickname": "", "website": "", "stream_tokens": null, "feature_set_id": null, "csrf_token": null, "date_joined": "2024-04-02 10:59:59", "mapbox_access_tokens": null, "has_password": null, "username": "AR181RA", "email": null, "is_active": null, "readonly": null, "is_dash_creator": null, "dash_created_count": null, "is_chart_creator": null, "charts_created_count": null } }, { "creation_time": "2024-04-02T11:23:19.940495Z", "comments": { "results": [], "count": 0 }, "parented": true, "embed_url": "https://chart-studio.plotly.com/~abhi_plotly/16.embed", "fid": "abhi_plotly:16", "filename": "MatchWinsGroupstage", "filetype": "plot", "img_url": "https://storage.googleapis.com/plotly-prod-images/abhi_plotly/16/9_TEJ1NPSKIDYMKTROMV6ZKHIZFX4Y4R.png", "image_urls": { "default": "https://storage.googleapis.com/plotly-prod-images/abhi_plotly/16/2_IR7HOVL97AVSS5CCTKI16WTLVY9ED7.png", "block-thumb": "https://storage.googleapis.com/plotly-prod-images/abhi_plotly/16/8_RCGJOGA6UICA39N9QULEQ3A7QOUDYT.png", "list-thumb": "https://storage.googleapis.com/plotly-prod-images/abhi_plotly/16/9_TEJ1NPSKIDYMKTROMV6ZKHIZFX4Y4R.png" }, "api_urls": { "files": "https://api.plotly.com/v2/files/abhi_plotly:16", "plots": "https://api.plotly.com/v2/plots/abhi_plotly:16", "parent": "https://api.plotly.com/v2/folders/home?user=abhi_plotly" }, "owner": "abhi_plotly", "parent": -1, "preview": "", "referencers": [], "references": [], "title": "", "views": 75, "web_url": "https://chart-studio.plotly.com/~abhi_plotly/16/", "world_readable": true, "date_modified": "2024-04-02T17:01:28.502Z", "stars": { "results": [], "count": 0 }, "collaborators": { "results": [], "count": 0 }, "subfolder_count": null, "refresh_interval": null, "organize_view_url": "https://chart-studio.plotly.com/~abhi_plotly/16/", "current_user_permission": "read", "is_theme": null, "is_template": null, "autosize": true, "caption": "", "figure": { "data": [ { "name": "MI", "type": "bar", "xsrc": "abhi_plotly:54:f4449e", "ysrc": "abhi_plotly:54:5dc3f9", "xaxis": "x", "yaxis": "y", "marker": { "color": "#636efa", "pattern": { "shape": "" } }, "showlegend": true, "legendgroup": "MI", "offsetgroup": "MI", "orientation": "v", "textposition": "auto", "hovertemplate": "winner=%{x}<br>season=%{y}<extra></extra>", "alignmentgroup": "True" }, { "name": "CSK", "type": "bar", "xsrc": "abhi_plotly:54:927f18", "ysrc": "abhi_plotly:54:7cca69", "xaxis": "x", "yaxis": "y", "marker": { "color": "#EF553B", "pattern": { "shape": "" } }, "showlegend": true, "legendgroup": "CSK", "offsetgroup": "CSK", "orientation": "v", "textposition": "auto", "hovertemplate": "winner=%{x}<br>season=%{y}<extra></extra>", "alignmentgroup": "True" }, { "name": "KKR", "type": "bar", "xsrc": "abhi_plotly:54:4d8af4", "ysrc": "abhi_plotly:54:9cfbbc", "xaxis": "x", "yaxis": "y", "marker": { "color": "#00cc96", "pattern": { "shape": "" } }, "showlegend": true, "legendgroup": "KKR", "offsetgroup": "KKR", "orientation": "v", "textposition": "auto", "hovertemplate": "winner=%{x}<br>season=%{y}<extra></extra>", "alignmentgroup": "True" }, { "name": "RCB", "type": "bar", "xsrc": "abhi_plotly:54:3c7e07", "ysrc": "abhi_plotly:54:4ba91f", "xaxis": "x", "yaxis": "y", "marker": { "color": "#ab63fa", "pattern": { "shape": "" } }, "showlegend": true, "legendgroup": "RCB", "offsetgroup": "RCB", "orientation": "v", "textposition": "auto", "hovertemplate": "winner=%{x}<br>season=%{y}<extra></extra>", "alignmentgroup": "True" }, { "name": "SRH", "type": "bar", "xsrc": "abhi_plotly:54:b6ba98", "ysrc": "abhi_plotly:54:300a3f", "xaxis": "x", "yaxis": "y", "marker": { "color": "#FFA15A", "pattern": { "shape": "" } }, "showlegend": true, "legendgroup": "SRH", "offsetgroup": "SRH", "orientation": "v", "textposition": "auto", "hovertemplate": "winner=%{x}<br>season=%{y}<extra></extra>", "alignmentgroup": "True" }, { "name": "DC", "type": "bar", "xsrc": "abhi_plotly:54:ae6a5f", "ysrc": "abhi_plotly:54:18bf90", "xaxis": "x", "yaxis": "y", "marker": { "color": "#19d3f3", "pattern": { "shape": "" } }, "showlegend": true, "legendgroup": "DC", "offsetgroup": "DC", "orientation": "v", "textposition": "auto", "hovertemplate": "winner=%{x}<br>season=%{y}<extra></extra>", "alignmentgroup": "True" }, { "name": "RR", "type": "bar", "xsrc": "abhi_plotly:54:d20149", "ysrc": "abhi_plotly:54:1817a5", "xaxis": "x", "yaxis": "y", "marker": { "color": "#FF6692", "pattern": { "shape": "" } }, "showlegend": true, "legendgroup": "RR", "offsetgroup": "RR", "orientation": "v", "textposition": "auto", "hovertemplate": "winner=%{x}<br>season=%{y}<extra></extra>", "alignmentgroup": "True" }, { "name": "KXIP", "type": "bar", "xsrc": "abhi_plotly:54:18f020", "ysrc": "abhi_plotly:54:2762bc", "xaxis": "x", "yaxis": "y", "marker": { "color": "#B6E880", "pattern": { "shape": "" } }, "showlegend": true, "legendgroup": "KXIP", "offsetgroup": "KXIP", "orientation": "v", "textposition": "auto", "hovertemplate": "winner=%{x}<br>season=%{y}<extra></extra>", "alignmentgroup": "True" }, { "name": "GT", "type": "bar", "xsrc": "abhi_plotly:54:a7fc4d", "ysrc": "abhi_plotly:54:e66a94", "xaxis": "x", "yaxis": "y", "marker": { "color": "#FF97FF", "pattern": { "shape": "" } }, "showlegend": true, "legendgroup": "GT", "offsetgroup": "GT", "orientation": "v", "textposition": "auto", "hovertemplate": "winner=%{x}<br>season=%{y}<extra></extra>", "alignmentgroup": "True" }, { "name": "PBKS", "type": "bar", "xsrc": "abhi_plotly:54:266609", "ysrc": "abhi_plotly:54:8ee480", "xaxis": "x", "yaxis": "y", "marker": { "color": "#FECB52", "pattern": { "shape": "" } }, "showlegend": true, "legendgroup": "PBKS", "offsetgroup": "PBKS", "orientation": "v", "textposition": "auto", "hovertemplate": "winner=%{x}<br>season=%{y}<extra></extra>", "alignmentgroup": "True" }, { "name": "LSG", "type": "bar", "xsrc": "abhi_plotly:54:23007c", "ysrc": "abhi_plotly:54:e5df09", "xaxis": "x", "yaxis": "y", "marker": { "color": "#636efa", "pattern": { "shape": "" } }, "showlegend": true, "legendgroup": "LSG", "offsetgroup": "LSG", "orientation": "v", "textposition": "auto", "hovertemplate": "winner=%{x}<br>season=%{y}<extra></extra>", "alignmentgroup": "True" }, { "name": "RPS", "type": "bar", "xsrc": "abhi_plotly:54:f2d68f", "ysrc": "abhi_plotly:54:73ea69", "xaxis": "x", "yaxis": "y", "marker": { "color": "#EF553B", "pattern": { "shape": "" } }, "showlegend": true, "legendgroup": "RPS", "offsetgroup": "RPS", "orientation": "v", "textposition": "auto", "hovertemplate": "winner=%{x}<br>season=%{y}<extra></extra>", "alignmentgroup": "True" }, { "name": "PWI", "type": "bar", "xsrc": "abhi_plotly:54:0ced35", "ysrc": "abhi_plotly:54:85b800", "xaxis": "x", "yaxis": "y", "marker": { "color": "#00cc96", "pattern": { "shape": "" } }, "showlegend": true, "legendgroup": "PWI", "offsetgroup": "PWI", "orientation": "v", "textposition": "auto", "hovertemplate": "winner=%{x}<br>season=%{y}<extra></extra>", "alignmentgroup": "True" }, { "name": "GL", "type": "bar", "xsrc": "abhi_plotly:54:44920f", "ysrc": "abhi_plotly:54:504db5", "xaxis": "x", "yaxis": "y", "marker": { "color": "#ab63fa", "pattern": { "shape": "" } }, "showlegend": true, "legendgroup": "GL", "offsetgroup": "GL", "orientation": "v", "textposition": "auto", "hovertemplate": "winner=%{x}<br>season=%{y}<extra></extra>", "alignmentgroup": "True" }, { "name": "Kochi", "type": "bar", "xsrc": "abhi_plotly:54:d8fb84", "ysrc": "abhi_plotly:54:e9aef3", "xaxis": "x", "yaxis": "y", "marker": { "color": "#FFA15A", "pattern": { "shape": "" } }, "showlegend": true, "legendgroup": "Kochi", "offsetgroup": "Kochi", "orientation": "v", "textposition": "auto", "hovertemplate": "winner=%{x}<br>season=%{y}<extra></extra>", "alignmentgroup": "True" } ], "layout": { "xaxis": { "title": { "text": "Teams" }, "anchor": "y", "domain": [ 0.0, 1.0 ], "categoryarray": [ "MI", "CSK", "KKR", "RCB", "SRH", "DC", "RR", "KXIP", "GT", "PBKS", "LSG", "RPS", "PWI", "GL", "Kochi" ], "categoryorder": "array" }, "yaxis": { "title": { "text": " Number of match wins" }, "anchor": "x", "domain": [ 0.0, 1.0 ] }, "legend": { "title": { "text": "winner" }, "tracegroupgap": 0 }, "margin": { "t": 60 }, "barmode": "relative", "template": { "data": { "bar": [ { "type": "bar", "marker": { "line": { "color": "#E5ECF6", "width": 0.5 }, "pattern": { "size": 10, "fillmode": "overlay", "solidity": 0.2 } }, "error_x": { "color": "#2a3f5f" }, "error_y": { "color": "#2a3f5f" } } ], "pie": [ { "type": "pie", "automargin": true } ], "table": [ { "type": "table", "cells": { "fill": { "color": "#EBF0F8" }, "line": { "color": "white" } }, "header": { "fill": { "color": "#C8D4E3" }, "line": { "color": "white" } } } ], "carpet": [ { "type": "carpet", "aaxis": { "gridcolor": "white", "linecolor": "white", "endlinecolor": "#2a3f5f", "minorgridcolor": "white", "startlinecolor": "#2a3f5f" }, "baxis": { "gridcolor": "white", "linecolor": "white", "endlinecolor": "#2a3f5f", "minorgridcolor": "white", "startlinecolor": "#2a3f5f" } } ], "mesh3d": [ { "type": "mesh3d", "colorbar": { "ticks": "", "outlinewidth": 0 } } ], "contour": [ { "type": "contour", "colorbar": { "ticks": "", "outlinewidth": 0 }, "colorscale": [ [ 0.0, "#0d0887" ], [ 0.1111111111111111, "#46039f" ], [ 0.2222222222222222, "#7201a8" ], [ 0.3333333333333333, "#9c179e" ], [ 0.4444444444444444, "#bd3786" ], [ 0.5555555555555556, "#d8576b" ], [ 0.6666666666666666, "#ed7953" ], [ 0.7777777777777778, "#fb9f3a" ], [ 0.8888888888888888, "#fdca26" ], [ 1.0, "#f0f921" ] ] } ], "heatmap": [ { "type": "heatmap", "colorbar": { "ticks": "", "outlinewidth": 0 }, "colorscale": [ [ 0.0, "#0d0887" ], [ 0.1111111111111111, "#46039f" ], [ 0.2222222222222222, "#7201a8" ], [ 0.3333333333333333, "#9c179e" ], [ 0.4444444444444444, "#bd3786" ], [ 0.5555555555555556, "#d8576b" ], [ 0.6666666666666666, "#ed7953" ], [ 0.7777777777777778, "#fb9f3a" ], [ 0.8888888888888888, "#fdca26" ], [ 1.0, "#f0f921" ] ] } ], "scatter": [ { "type": "scatter", "fillpattern": { "size": 10, "fillmode": "overlay", "solidity": 0.2 } } ], "surface": [ { "type": "surface", "colorbar": { "ticks": "", "outlinewidth": 0 }, "colorscale": [ [ 0.0, "#0d0887" ], [ 0.1111111111111111, "#46039f" ], [ 0.2222222222222222, "#7201a8" ], [ 0.3333333333333333, "#9c179e" ], [ 0.4444444444444444, "#bd3786" ], [ 0.5555555555555556, "#d8576b" ], [ 0.6666666666666666, "#ed7953" ], [ 0.7777777777777778, "#fb9f3a" ], [ 0.8888888888888888, "#fdca26" ], [ 1.0, "#f0f921" ] ] } ], "barpolar": [ { "type": "barpolar", "marker": { "line": { "color": "#E5ECF6", "width": 0.5 }, "pattern": { "size": 10, "fillmode": "overlay", "solidity": 0.2 } } } ], "heatmapgl": [ { "type": "heatmapgl", "colorbar": { "ticks": "", "outlinewidth": 0 }, "colorscale": [ [ 0.0, "#0d0887" ], [ 0.1111111111111111, "#46039f" ], [ 0.2222222222222222, "#7201a8" ], [ 0.3333333333333333, "#9c179e" ], [ 0.4444444444444444, "#bd3786" ], [ 0.5555555555555556, "#d8576b" ], [ 0.6666666666666666, "#ed7953" ], [ 0.7777777777777778, "#fb9f3a" ], [ 0.8888888888888888, "#fdca26" ], [ 1.0, "#f0f921" ] ] } ], "histogram": [ { "type": "histogram", "marker": { "pattern": { "size": 10, "fillmode": "overlay", "solidity": 0.2 } } } ], "parcoords": [ { "line": { "colorbar": { "ticks": "", "outlinewidth": 0 } }, "type": "parcoords" } ], "scatter3d": [ { "line": { "colorbar": { "ticks": "", "outlinewidth": 0 } }, "type": "scatter3d", "marker": { "colorbar": { "ticks": "", "outlinewidth": 0 } } } ], "scattergl": [ { "type": "scattergl", "marker": { "colorbar": { "ticks": "", "outlinewidth": 0 } } } ], "choropleth": [ { "type": "choropleth", "colorbar": { "ticks": "", "outlinewidth": 0 } } ], "scattergeo": [ { "type": "scattergeo", "marker": { "colorbar": { "ticks": "", "outlinewidth": 0 } } } ], "histogram2d": [ { "type": "histogram2d", "colorbar": { "ticks": "", "outlinewidth": 0 }, "colorscale": [ [ 0.0, "#0d0887" ], [ 0.1111111111111111, "#46039f" ], [ 0.2222222222222222, "#7201a8" ], [ 0.3333333333333333, "#9c179e" ], [ 0.4444444444444444, "#bd3786" ], [ 0.5555555555555556, "#d8576b" ], [ 0.6666666666666666, "#ed7953" ], [ 0.7777777777777778, "#fb9f3a" ], [ 0.8888888888888888, "#fdca26" ], [ 1.0, "#f0f921" ] ] } ], "scatterpolar": [ { "type": "scatterpolar", "marker": { "colorbar": { "ticks": "", "outlinewidth": 0 } } } ], "contourcarpet": [ { "type": "contourcarpet", "colorbar": { "ticks": "", "outlinewidth": 0 } } ], "scattercarpet": [ { "type": "scattercarpet", "marker": { "colorbar": { "ticks": "", "outlinewidth": 0 } } } ], "scattermapbox": [ { "type": "scattermapbox", "marker": { "colorbar": { "ticks": "", "outlinewidth": 0 } } } ], "scatterpolargl": [ { "type": "scatterpolargl", "marker": { "colorbar": { "ticks": "", "outlinewidth": 0 } } } ], "scatterternary": [ { "type": "scatterternary", "marker": { "colorbar": { "ticks": "", "outlinewidth": 0 } } } ], "histogram2dcontour": [ { "type": "histogram2dcontour", "colorbar": { "ticks": "", "outlinewidth": 0 }, "colorscale": [ [ 0.0, "#0d0887" ], [ 0.1111111111111111, "#46039f" ], [ 0.2222222222222222, "#7201a8" ], [ 0.3333333333333333, "#9c179e" ], [ 0.4444444444444444, "#bd3786" ], [ 0.5555555555555556, "#d8576b" ], [ 0.6666666666666666, "#ed7953" ], [ 0.7777777777777778, "#fb9f3a" ], [ 0.8888888888888888, "#fdca26" ], [ 1.0, "#f0f921" ] ] } ] }, "layout": { "geo": { "bgcolor": "white", "showland": true, "lakecolor": "white", "landcolor": "#E5ECF6", "showlakes": true, "subunitcolor": "white" }, "font": { "color": "#2a3f5f" }, "polar": { "bgcolor": "#E5ECF6", "radialaxis": { "ticks": "", "gridcolor": "white", "linecolor": "white" }, "angularaxis": { "ticks": "", "gridcolor": "white", "linecolor": "white" } }, "scene": { "xaxis": { "ticks": "", "gridcolor": "white", "gridwidth": 2, "linecolor": "white", "zerolinecolor": "white", "showbackground": true, "backgroundcolor": "#E5ECF6" }, "yaxis": { "ticks": "", "gridcolor": "white", "gridwidth": 2, "linecolor": "white", "zerolinecolor": "white", "showbackground": true, "backgroundcolor": "#E5ECF6" }, "zaxis": { "ticks": "", "gridcolor": "white", "gridwidth": 2, "linecolor": "white", "zerolinecolor": "white", "showbackground": true, "backgroundcolor": "#E5ECF6" } }, "title": { "x": 0.05 }, "xaxis": { "ticks": "", "title": { "standoff": 15 }, "gridcolor": "white", "linecolor": "white", "automargin": true, "zerolinecolor": "white", "zerolinewidth": 2 }, "yaxis": { "ticks": "", "title": { "standoff": 15 }, "gridcolor": "white", "linecolor": "white", "automargin": true, "zerolinecolor": "white", "zerolinewidth": 2 }, "mapbox": { "style": "light" }, "ternary": { "aaxis": { "ticks": "", "gridcolor": "white", "linecolor": "white" }, "baxis": { "ticks": "", "gridcolor": "white", "linecolor": "white" }, "caxis": { "ticks": "", "gridcolor": "white", "linecolor": "white" }, "bgcolor": "#E5ECF6" }, "colorway": [ "#636efa", "#EF553B", "#00cc96", "#ab63fa", "#FFA15A", "#19d3f3", "#FF6692", "#B6E880", "#FF97FF", "#FECB52" ], "coloraxis": { "colorbar": { "ticks": "", "outlinewidth": 0 } }, "hovermode": "closest", "colorscale": { "diverging": [ [ 0, "#8e0152" ], [ 0.1, "#c51b7d" ], [ 0.2, "#de77ae" ], [ 0.3, "#f1b6da" ], [ 0.4, "#fde0ef" ], [ 0.5, "#f7f7f7" ], [ 0.6, "#e6f5d0" ], [ 0.7, "#b8e186" ], [ 0.8, "#7fbc41" ], [ 0.9, "#4d9221" ], [ 1, "#276419" ] ], "sequential": [ [ 0.0, "#0d0887" ], [ 0.1111111111111111, "#46039f" ], [ 0.2222222222222222, "#7201a8" ], [ 0.3333333333333333, "#9c179e" ], [ 0.4444444444444444, "#bd3786" ], [ 0.5555555555555556, "#d8576b" ], [ 0.6666666666666666, "#ed7953" ], [ 0.7777777777777778, "#fb9f3a" ], [ 0.8888888888888888, "#fdca26" ], [ 1.0, "#f0f921" ] ], "sequentialminus": [ [ 0.0, "#0d0887" ], [ 0.1111111111111111, "#46039f" ], [ 0.2222222222222222, "#7201a8" ], [ 0.3333333333333333, "#9c179e" ], [ 0.4444444444444444, "#bd3786" ], [ 0.5555555555555556, "#d8576b" ], [ 0.6666666666666666, "#ed7953" ], [ 0.7777777777777778, "#fb9f3a" ], [ 0.8888888888888888, "#fdca26" ], [ 1.0, "#f0f921" ] ] }, "hoverlabel": { "align": "left" }, "plot_bgcolor": "#E5ECF6", "paper_bgcolor": "white", "shapedefaults": { "line": { "color": "#2a3f5f" } }, "autotypenumbers": "strict", "annotationdefaults": { "arrowhead": 0, "arrowcolor": "#2a3f5f", "arrowwidth": 1 } } } } }, "height": null, "width": null, "user": { "profile_url": "https://chart-studio.plotly.com/~abhi_plotly", "avatar_url": "https://storage.googleapis.com/plotly-prod-profiles/23.jpg", "background_url": "https://storage.googleapis.com/plotly-prod-profiles/bg-10.jpg", "bio": "", "nickname": "", "website": "", "stream_tokens": null, "feature_set_id": null, "csrf_token": null, "date_joined": "2024-04-02 09:52:01", "mapbox_access_tokens": null, "has_password": null, "username": "abhi_plotly", "email": null, "is_active": null, "readonly": null, "is_dash_creator": null, "dash_created_count": null, "is_chart_creator": null, "charts_created_count": null } }, { "creation_time": "2024-04-02T11:15:28.876346Z", "comments": { "results": [], "count": 0 }, "parented": true, "embed_url": "https://chart-studio.plotly.com/~Chuanyun/13.embed", "fid": "Chuanyun:13", "filename": "Sentiment_Analysis_Results_Comparison", "filetype": "plot", "img_url": "https://storage.googleapis.com/plotly-prod-images/Chuanyun/13/9_M92TA6VNHP1G3LAKZP8H9YF7AATGS8.png", "image_urls": { "default": "https://storage.googleapis.com/plotly-prod-images/Chuanyun/13/2_ULDX6BVCCRQACQ43J1KQOCZALE8DPT.png", "block-thumb": "https://storage.googleapis.com/plotly-prod-images/Chuanyun/13/8_7I8RRU5JYE5SPEITUEHLVVQYG6ELPV.png", "list-thumb": "https://storage.googleapis.com/plotly-prod-images/Chuanyun/13/9_M92TA6VNHP1G3LAKZP8H9YF7AATGS8.png" }, "api_urls": { "files": "https://api.plotly.com/v2/files/Chuanyun:13", "plots": "https://api.plotly.com/v2/plots/Chuanyun:13", "parent": "https://api.plotly.com/v2/folders/home?user=Chuanyun" }, "owner": "Chuanyun", "parent": -1, "preview": "", "referencers": [], "references": [], "title": "", "views": 75, "web_url": "https://chart-studio.plotly.com/~Chuanyun/13/", "world_readable": true, "date_modified": "2024-04-02T11:15:28.885Z", "stars": { "results": [], "count": 0 }, "collaborators": { "results": [], "count": 0 }, "subfolder_count": null, "refresh_interval": null, "organize_view_url": "https://chart-studio.plotly.com/~Chuanyun/13/", "current_user_permission": "read", "is_theme": null, "is_template": null, "autosize": true, "caption": "", "figure": { "data": [ { "name": "Title", "type": "bar", "xsrc": "Chuanyun:12:9eae35", "ysrc": "Chuanyun:12:862af2", "xaxis": "x", "yaxis": "y", "marker": { "color": "#636efa", "pattern": { "shape": "" } }, "showlegend": true, "legendgroup": "Title", "offsetgroup": "Title", "orientation": "v", "textposition": "auto", "hovertemplate": "Text Type=Title<br>Sentiment=%{x}<br>count=%{y}<extra></extra>", "alignmentgroup": "True" }, { "name": "Abstract", "type": "bar", "xsrc": "Chuanyun:12:056447", "ysrc": "Chuanyun:12:118ab2", "xaxis": "x", "yaxis": "y", "marker": { "color": "#EF553B", "pattern": { "shape": "" } }, "showlegend": true, "legendgroup": "Abstract", "offsetgroup": "Abstract", "orientation": "v", "textposition": "auto", "hovertemplate": "Text Type=Abstract<br>Sentiment=%{x}<br>count=%{y}<extra></extra>", "alignmentgroup": "True" } ], "layout": { "title": { "text": "Comparison of Sentiment Analysis Results between Title and Abstract" }, "xaxis": { "title": { "text": "Sentiment" }, "anchor": "y", "domain": [ 0.0, 1.0 ] }, "yaxis": { "title": { "text": "count" }, "anchor": "x", "domain": [ 0.0, 1.0 ] }, "legend": { "title": { "text": "Text Type" }, "tracegroupgap": 0 }, "barmode": "group", "template": { "data": { "bar": [ { "type": "bar", "marker": { "line": { "color": "#E5ECF6", "width": 0.5 }, "pattern": { "size": 10, "fillmode": "overlay", "solidity": 0.2 } }, "error_x": { "color": "#2a3f5f" }, "error_y": { "color": "#2a3f5f" } } ], "pie": [ { "type": "pie", "automargin": true } ], "table": [ { "type": "table", "cells": { "fill": { "color": "#EBF0F8" }, "line": { "color": "white" } }, "header": { "fill": { "color": "#C8D4E3" }, "line": { "color": "white" } } } ], "carpet": [ { "type": "carpet", "aaxis": { "gridcolor": "white", "linecolor": "white", "endlinecolor": "#2a3f5f", "minorgridcolor": "white", "startlinecolor": "#2a3f5f" }, "baxis": { "gridcolor": "white", "linecolor": "white", "endlinecolor": "#2a3f5f", "minorgridcolor": "white", "startlinecolor": "#2a3f5f" } } ], "mesh3d": [ { "type": "mesh3d", "colorbar": { "ticks": "", "outlinewidth": 0 } } ], "contour": [ { "type": "contour", "colorbar": { "ticks": "", "outlinewidth": 0 }, "colorscale": [ [ 0.0, "#0d0887" ], [ 0.1111111111111111, "#46039f" ], [ 0.2222222222222222, "#7201a8" ], [ 0.3333333333333333, "#9c179e" ], [ 0.4444444444444444, "#bd3786" ], [ 0.5555555555555556, "#d8576b" ], [ 0.6666666666666666, "#ed7953" ], [ 0.7777777777777778, "#fb9f3a" ], [ 0.8888888888888888, "#fdca26" ], [ 1.0, "#f0f921" ] ] } ], "heatmap": [ { "type": "heatmap", "colorbar": { "ticks": "", "outlinewidth": 0 }, "colorscale": [ [ 0.0, "#0d0887" ], [ 0.1111111111111111, "#46039f" ], [ 0.2222222222222222, "#7201a8" ], [ 0.3333333333333333, "#9c179e" ], [ 0.4444444444444444, "#bd3786" ], [ 0.5555555555555556, "#d8576b" ], [ 0.6666666666666666, "#ed7953" ], [ 0.7777777777777778, "#fb9f3a" ], [ 0.8888888888888888, "#fdca26" ], [ 1.0, "#f0f921" ] ] } ], "scatter": [ { "type": "scatter", "fillpattern": { "size": 10, "fillmode": "overlay", "solidity": 0.2 } } ], "surface": [ { "type": "surface", "colorbar": { "ticks": "", "outlinewidth": 0 }, "colorscale": [ [ 0.0, "#0d0887" ], [ 0.1111111111111111, "#46039f" ], [ 0.2222222222222222, "#7201a8" ], [ 0.3333333333333333, "#9c179e" ], [ 0.4444444444444444, "#bd3786" ], [ 0.5555555555555556, "#d8576b" ], [ 0.6666666666666666, "#ed7953" ], [ 0.7777777777777778, "#fb9f3a" ], [ 0.8888888888888888, "#fdca26" ], [ 1.0, "#f0f921" ] ] } ], "barpolar": [ { "type": "barpolar", "marker": { "line": { "color": "#E5ECF6", "width": 0.5 }, "pattern": { "size": 10, "fillmode": "overlay", "solidity": 0.2 } } } ], "heatmapgl": [ { "type": "heatmapgl", "colorbar": { "ticks": "", "outlinewidth": 0 }, "colorscale": [ [ 0.0, "#0d0887" ], [ 0.1111111111111111, "#46039f" ], [ 0.2222222222222222, "#7201a8" ], [ 0.3333333333333333, "#9c179e" ], [ 0.4444444444444444, "#bd3786" ], [ 0.5555555555555556, "#d8576b" ], [ 0.6666666666666666, "#ed7953" ], [ 0.7777777777777778, "#fb9f3a" ], [ 0.8888888888888888, "#fdca26" ], [ 1.0, "#f0f921" ] ] } ], "histogram": [ { "type": "histogram", "marker": { "pattern": { "size": 10, "fillmode": "overlay", "solidity": 0.2 } } } ], "parcoords": [ { "line": { "colorbar": { "ticks": "", "outlinewidth": 0 } }, "type": "parcoords" } ], "scatter3d": [ { "line": { "colorbar": { "ticks": "", "outlinewidth": 0 } }, "type": "scatter3d", "marker": { "colorbar": { "ticks": "", "outlinewidth": 0 } } } ], "scattergl": [ { "type": "scattergl", "marker": { "colorbar": { "ticks": "", "outlinewidth": 0 } } } ], "choropleth": [ { "type": "choropleth", "colorbar": { "ticks": "", "outlinewidth": 0 } } ], "scattergeo": [ { "type": "scattergeo", "marker": { "colorbar": { "ticks": "", "outlinewidth": 0 } } } ], "histogram2d": [ { "type": "histogram2d", "colorbar": { "ticks": "", "outlinewidth": 0 }, "colorscale": [ [ 0.0, "#0d0887" ], [ 0.1111111111111111, "#46039f" ], [ 0.2222222222222222, "#7201a8" ], [ 0.3333333333333333, "#9c179e" ], [ 0.4444444444444444, "#bd3786" ], [ 0.5555555555555556, "#d8576b" ], [ 0.6666666666666666, "#ed7953" ], [ 0.7777777777777778, "#fb9f3a" ], [ 0.8888888888888888, "#fdca26" ], [ 1.0, "#f0f921" ] ] } ], "scatterpolar": [ { "type": "scatterpolar", "marker": { "colorbar": { "ticks": "", "outlinewidth": 0 } } } ], "contourcarpet": [ { "type": "contourcarpet", "colorbar": { "ticks": "", "outlinewidth": 0 } } ], "scattercarpet": [ { "type": "scattercarpet", "marker": { "colorbar": { "ticks": "", "outlinewidth": 0 } } } ], "scattermapbox": [ { "type": "scattermapbox", "marker": { "colorbar": { "ticks": "", "outlinewidth": 0 } } } ], "scatterpolargl": [ { "type": "scatterpolargl", "marker": { "colorbar": { "ticks": "", "outlinewidth": 0 } } } ], "scatterternary": [ { "type": "scatterternary", "marker": { "colorbar": { "ticks": "", "outlinewidth": 0 } } } ], "histogram2dcontour": [ { "type": "histogram2dcontour", "colorbar": { "ticks": "", "outlinewidth": 0 }, "colorscale": [ [ 0.0, "#0d0887" ], [ 0.1111111111111111, "#46039f" ], [ 0.2222222222222222, "#7201a8" ], [ 0.3333333333333333, "#9c179e" ], [ 0.4444444444444444, "#bd3786" ], [ 0.5555555555555556, "#d8576b" ], [ 0.6666666666666666, "#ed7953" ], [ 0.7777777777777778, "#fb9f3a" ], [ 0.8888888888888888, "#fdca26" ], [ 1.0, "#f0f921" ] ] } ] }, "layout": { "geo": { "bgcolor": "white", "showland": true, "lakecolor": "white", "landcolor": "#E5ECF6", "showlakes": true, "subunitcolor": "white" }, "font": { "color": "#2a3f5f" }, "polar": { "bgcolor": "#E5ECF6", "radialaxis": { "ticks": "", "gridcolor": "white", "linecolor": "white" }, "angularaxis": { "ticks": "", "gridcolor": "white", "linecolor": "white" } }, "scene": { "xaxis": { "ticks": "", "gridcolor": "white", "gridwidth": 2, "linecolor": "white", "zerolinecolor": "white", "showbackground": true, "backgroundcolor": "#E5ECF6" }, "yaxis": { "ticks": "", "gridcolor": "white", "gridwidth": 2, "linecolor": "white", "zerolinecolor": "white", "showbackground": true, "backgroundcolor": "#E5ECF6" }, "zaxis": { "ticks": "", "gridcolor": "white", "gridwidth": 2, "linecolor": "white", "zerolinecolor": "white", "showbackground": true, "backgroundcolor": "#E5ECF6" } }, "title": { "x": 0.05 }, "xaxis": { "ticks": "", "title": { "standoff": 15 }, "gridcolor": "white", "linecolor": "white", "automargin": true, "zerolinecolor": "white", "zerolinewidth": 2 }, "yaxis": { "ticks": "", "title": { "standoff": 15 }, "gridcolor": "white", "linecolor": "white", "automargin": true, "zerolinecolor": "white", "zerolinewidth": 2 }, "mapbox": { "style": "light" }, "ternary": { "aaxis": { "ticks": "", "gridcolor": "white", "linecolor": "white" }, "baxis": { "ticks": "", "gridcolor": "white", "linecolor": "white" }, "caxis": { "ticks": "", "gridcolor": "white", "linecolor": "white" }, "bgcolor": "#E5ECF6" }, "colorway": [ "#636efa", "#EF553B", "#00cc96", "#ab63fa", "#FFA15A", "#19d3f3", "#FF6692", "#B6E880", "#FF97FF", "#FECB52" ], "coloraxis": { "colorbar": { "ticks": "", "outlinewidth": 0 } }, "hovermode": "closest", "colorscale": { "diverging": [ [ 0, "#8e0152" ], [ 0.1, "#c51b7d" ], [ 0.2, "#de77ae" ], [ 0.3, "#f1b6da" ], [ 0.4, "#fde0ef" ], [ 0.5, "#f7f7f7" ], [ 0.6, "#e6f5d0" ], [ 0.7, "#b8e186" ], [ 0.8, "#7fbc41" ], [ 0.9, "#4d9221" ], [ 1, "#276419" ] ], "sequential": [ [ 0.0, "#0d0887" ], [ 0.1111111111111111, "#46039f" ], [ 0.2222222222222222, "#7201a8" ], [ 0.3333333333333333, "#9c179e" ], [ 0.4444444444444444, "#bd3786" ], [ 0.5555555555555556, "#d8576b" ], [ 0.6666666666666666, "#ed7953" ], [ 0.7777777777777778, "#fb9f3a" ], [ 0.8888888888888888, "#fdca26" ], [ 1.0, "#f0f921" ] ], "sequentialminus": [ [ 0.0, "#0d0887" ], [ 0.1111111111111111, "#46039f" ], [ 0.2222222222222222, "#7201a8" ], [ 0.3333333333333333, "#9c179e" ], [ 0.4444444444444444, "#bd3786" ], [ 0.5555555555555556, "#d8576b" ], [ 0.6666666666666666, "#ed7953" ], [ 0.7777777777777778, "#fb9f3a" ], [ 0.8888888888888888, "#fdca26" ], [ 1.0, "#f0f921" ] ] }, "hoverlabel": { "align": "left" }, "plot_bgcolor": "#E5ECF6", "paper_bgcolor": "white", "shapedefaults": { "line": { "color": "#2a3f5f" } }, "autotypenumbers": "strict", "annotationdefaults": { "arrowhead": 0, "arrowcolor": "#2a3f5f", "arrowwidth": 1 } } } } }, "height": null, "width": null, "user": { "profile_url": "https://chart-studio.plotly.com/~Chuanyun", "avatar_url": "https://storage.googleapis.com/plotly-prod-profiles/53.jpg", "background_url": "https://storage.googleapis.com/plotly-prod-profiles/bg-7.jpg", "bio": "", "nickname": "", "website": "", "stream_tokens": null, "feature_set_id": null, "csrf_token": null, "date_joined": "2024-03-29 06:55:48", "mapbox_access_tokens": null, "has_password": null, "username": "Chuanyun", "email": null, "is_active": null, "readonly": null, "is_dash_creator": null, "dash_created_count": null, "is_chart_creator": null, "charts_created_count": null } }, { "creation_time": "2024-04-02T11:11:43.779759Z", "comments": { "results": [], "count": 0 }, "parented": true, "embed_url": "https://chart-studio.plotly.com/~Chuanyun/11.embed", "fid": "Chuanyun:11", "filename": "sentiment_analysis_comparison", "filetype": "plot", "img_url": "https://storage.googleapis.com/plotly-prod-images/Chuanyun/11/9_QP8C3N0NC7JUZ7NSD95F827QDN4GZM.png", "image_urls": { "default": "https://storage.googleapis.com/plotly-prod-images/Chuanyun/11/2_XEQZ68OQ823VI3JIQCWVAFNZVS2VME.png", "block-thumb": "https://storage.googleapis.com/plotly-prod-images/Chuanyun/11/8_56YEQFGFHA2M5HDWW45S5WBQPQXXBO.png", "list-thumb": "https://storage.googleapis.com/plotly-prod-images/Chuanyun/11/9_QP8C3N0NC7JUZ7NSD95F827QDN4GZM.png" }, "api_urls": { "files": "https://api.plotly.com/v2/files/Chuanyun:11", "plots": "https://api.plotly.com/v2/plots/Chuanyun:11", "parent": "https://api.plotly.com/v2/folders/home?user=Chuanyun" }, "owner": "Chuanyun", "parent": -1, "preview": "", "referencers": [], "references": [], "title": "", "views": 2, "web_url": "https://chart-studio.plotly.com/~Chuanyun/11/", "world_readable": true, "date_modified": "2024-04-02T11:11:43.789Z", "stars": { "results": [], "count": 0 }, "collaborators": { "results": [], "count": 0 }, "subfolder_count": null, "refresh_interval": null, "organize_view_url": "https://chart-studio.plotly.com/~Chuanyun/11/", "current_user_permission": "read", "is_theme": null, "is_template": null, "autosize": true, "caption": "", "figure": { "data": [ { "name": "Title", "type": "bar", "xsrc": "Chuanyun:10:081735", "ysrc": "Chuanyun:10:b403a3", "xaxis": "x", "yaxis": "y", "marker": { "color": "#636efa", "pattern": { "shape": "" } }, "showlegend": true, "legendgroup": "Title", "offsetgroup": "Title", "orientation": "v", "textposition": "auto", "hovertemplate": "Text Type=Title<br>Sentiment=%{x}<br>count=%{y}<extra></extra>", "alignmentgroup": "True" }, { "name": "Abstract", "type": "bar", "xsrc": "Chuanyun:10:8fd3f1", "ysrc": "Chuanyun:10:b46410", "xaxis": "x", "yaxis": "y", "marker": { "color": "#EF553B", "pattern": { "shape": "" } }, "showlegend": true, "legendgroup": "Abstract", "offsetgroup": "Abstract", "orientation": "v", "textposition": "auto", "hovertemplate": "Text Type=Abstract<br>Sentiment=%{x}<br>count=%{y}<extra></extra>", "alignmentgroup": "True" } ], "layout": { "title": { "text": "Comparison of Sentiment Analysis Results between Title and Abstract" }, "xaxis": { "title": { "text": "Sentiment" }, "anchor": "y", "domain": [ 0.0, 1.0 ] }, "yaxis": { "title": { "text": "count" }, "anchor": "x", "domain": [ 0.0, 1.0 ] }, "legend": { "title": { "text": "Text Type" }, "tracegroupgap": 0 }, "barmode": "group", "template": { "data": { "bar": [ { "type": "bar", "marker": { "line": { "color": "#E5ECF6", "width": 0.5 }, "pattern": { "size": 10, "fillmode": "overlay", "solidity": 0.2 } }, "error_x": { "color": "#2a3f5f" }, "error_y": { "color": "#2a3f5f" } } ], "pie": [ { "type": "pie", "automargin": true } ], "table": [ { "type": "table", "cells": { "fill": { "color": "#EBF0F8" }, "line": { "color": "white" } }, "header": { "fill": { "color": "#C8D4E3" }, "line": { "color": "white" } } } ], "carpet": [ { "type": "carpet", "aaxis": { "gridcolor": "white", "linecolor": "white", "endlinecolor": "#2a3f5f", "minorgridcolor": "white", "startlinecolor": "#2a3f5f" }, "baxis": { "gridcolor": "white", "linecolor": "white", "endlinecolor": "#2a3f5f", "minorgridcolor": "white", "startlinecolor": "#2a3f5f" } } ], "mesh3d": [ { "type": "mesh3d", "colorbar": { "ticks": "", "outlinewidth": 0 } } ], "contour": [ { "type": "contour", "colorbar": { "ticks": "", "outlinewidth": 0 }, "colorscale": [ [ 0.0, "#0d0887" ], [ 0.1111111111111111, "#46039f" ], [ 0.2222222222222222, "#7201a8" ], [ 0.3333333333333333, "#9c179e" ], [ 0.4444444444444444, "#bd3786" ], [ 0.5555555555555556, "#d8576b" ], [ 0.6666666666666666, "#ed7953" ], [ 0.7777777777777778, "#fb9f3a" ], [ 0.8888888888888888, "#fdca26" ], [ 1.0, "#f0f921" ] ] } ], "heatmap": [ { "type": "heatmap", "colorbar": { "ticks": "", "outlinewidth": 0 }, "colorscale": [ [ 0.0, "#0d0887" ], [ 0.1111111111111111, "#46039f" ], [ 0.2222222222222222, "#7201a8" ], [ 0.3333333333333333, "#9c179e" ], [ 0.4444444444444444, "#bd3786" ], [ 0.5555555555555556, "#d8576b" ], [ 0.6666666666666666, "#ed7953" ], [ 0.7777777777777778, "#fb9f3a" ], [ 0.8888888888888888, "#fdca26" ], [ 1.0, "#f0f921" ] ] } ], "scatter": [ { "type": "scatter", "fillpattern": { "size": 10, "fillmode": "overlay", "solidity": 0.2 } } ], "surface": [ { "type": "surface", "colorbar": { "ticks": "", "outlinewidth": 0 }, "colorscale": [ [ 0.0, "#0d0887" ], [ 0.1111111111111111, "#46039f" ], [ 0.2222222222222222, "#7201a8" ], [ 0.3333333333333333, "#9c179e" ], [ 0.4444444444444444, "#bd3786" ], [ 0.5555555555555556, "#d8576b" ], [ 0.6666666666666666, "#ed7953" ], [ 0.7777777777777778, "#fb9f3a" ], [ 0.8888888888888888, "#fdca26" ], [ 1.0, "#f0f921" ] ] } ], "barpolar": [ { "type": "barpolar", "marker": { "line": { "color": "#E5ECF6", "width": 0.5 }, "pattern": { "size": 10, "fillmode": "overlay", "solidity": 0.2 } } } ], "heatmapgl": [ { "type": "heatmapgl", "colorbar": { "ticks": "", "outlinewidth": 0 }, "colorscale": [ [ 0.0, "#0d0887" ], [ 0.1111111111111111, "#46039f" ], [ 0.2222222222222222, "#7201a8" ], [ 0.3333333333333333, "#9c179e" ], [ 0.4444444444444444, "#bd3786" ], [ 0.5555555555555556, "#d8576b" ], [ 0.6666666666666666, "#ed7953" ], [ 0.7777777777777778, "#fb9f3a" ], [ 0.8888888888888888, "#fdca26" ], [ 1.0, "#f0f921" ] ] } ], "histogram": [ { "type": "histogram", "marker": { "pattern": { "size": 10, "fillmode": "overlay", "solidity": 0.2 } } } ], "parcoords": [ { "line": { "colorbar": { "ticks": "", "outlinewidth": 0 } }, "type": "parcoords" } ], "scatter3d": [ { "line": { "colorbar": { "ticks": "", "outlinewidth": 0 } }, "type": "scatter3d", "marker": { "colorbar": { "ticks": "", "outlinewidth": 0 } } } ], "scattergl": [ { "type": "scattergl", "marker": { "colorbar": { "ticks": "", "outlinewidth": 0 } } } ], "choropleth": [ { "type": "choropleth", "colorbar": { "ticks": "", "outlinewidth": 0 } } ], "scattergeo": [ { "type": "scattergeo", "marker": { "colorbar": { "ticks": "", "outlinewidth": 0 } } } ], "histogram2d": [ { "type": "histogram2d", "colorbar": { "ticks": "", "outlinewidth": 0 }, "colorscale": [ [ 0.0, "#0d0887" ], [ 0.1111111111111111, "#46039f" ], [ 0.2222222222222222, "#7201a8" ], [ 0.3333333333333333, "#9c179e" ], [ 0.4444444444444444, "#bd3786" ], [ 0.5555555555555556, "#d8576b" ], [ 0.6666666666666666, "#ed7953" ], [ 0.7777777777777778, "#fb9f3a" ], [ 0.8888888888888888, "#fdca26" ], [ 1.0, "#f0f921" ] ] } ], "scatterpolar": [ { "type": "scatterpolar", "marker": { "colorbar": { "ticks": "", "outlinewidth": 0 } } } ], "contourcarpet": [ { "type": "contourcarpet", "colorbar": { "ticks": "", "outlinewidth": 0 } } ], "scattercarpet": [ { "type": "scattercarpet", "marker": { "colorbar": { "ticks": "", "outlinewidth": 0 } } } ], "scattermapbox": [ { "type": "scattermapbox", "marker": { "colorbar": { "ticks": "", "outlinewidth": 0 } } } ], "scatterpolargl": [ { "type": "scatterpolargl", "marker": { "colorbar": { "ticks": "", "outlinewidth": 0 } } } ], "scatterternary": [ { "type": "scatterternary", "marker": { "colorbar": { "ticks": "", "outlinewidth": 0 } } } ], "histogram2dcontour": [ { "type": "histogram2dcontour", "colorbar": { "ticks": "", "outlinewidth": 0 }, "colorscale": [ [ 0.0, "#0d0887" ], [ 0.1111111111111111, "#46039f" ], [ 0.2222222222222222, "#7201a8" ], [ 0.3333333333333333, "#9c179e" ], [ 0.4444444444444444, "#bd3786" ], [ 0.5555555555555556, "#d8576b" ], [ 0.6666666666666666, "#ed7953" ], [ 0.7777777777777778, "#fb9f3a" ], [ 0.8888888888888888, "#fdca26" ], [ 1.0, "#f0f921" ] ] } ] }, "layout": { "geo": { "bgcolor": "white", "showland": true, "lakecolor": "white", "landcolor": "#E5ECF6", "showlakes": true, "subunitcolor": "white" }, "font": { "color": "#2a3f5f" }, "polar": { "bgcolor": "#E5ECF6", "radialaxis": { "ticks": "", "gridcolor": "white", "linecolor": "white" }, "angularaxis": { "ticks": "", "gridcolor": "white", "linecolor": "white" } }, "scene": { "xaxis": { "ticks": "", "gridcolor": "white", "gridwidth": 2, "linecolor": "white", "zerolinecolor": "white", "showbackground": true, "backgroundcolor": "#E5ECF6" }, "yaxis": { "ticks": "", "gridcolor": "white", "gridwidth": 2, "linecolor": "white", "zerolinecolor": "white", "showbackground": true, "backgroundcolor": "#E5ECF6" }, "zaxis": { "ticks": "", "gridcolor": "white", "gridwidth": 2, "linecolor": "white", "zerolinecolor": "white", "showbackground": true, "backgroundcolor": "#E5ECF6" } }, "title": { "x": 0.05 }, "xaxis": { "ticks": "", "title": { "standoff": 15 }, "gridcolor": "white", "linecolor": "white", "automargin": true, "zerolinecolor": "white", "zerolinewidth": 2 }, "yaxis": { "ticks": "", "title": { "standoff": 15 }, "gridcolor": "white", "linecolor": "white", "automargin": true, "zerolinecolor": "white", "zerolinewidth": 2 }, "mapbox": { "style": "light" }, "ternary": { "aaxis": { "ticks": "", "gridcolor": "white", "linecolor": "white" }, "baxis": { "ticks": "", "gridcolor": "white", "linecolor": "white" }, "caxis": { "ticks": "", "gridcolor": "white", "linecolor": "white" }, "bgcolor": "#E5ECF6" }, "colorway": [ "#636efa", "#EF553B", "#00cc96", "#ab63fa", "#FFA15A", "#19d3f3", "#FF6692", "#B6E880", "#FF97FF", "#FECB52" ], "coloraxis": { "colorbar": { "ticks": "", "outlinewidth": 0 } }, "hovermode": "closest", "colorscale": { "diverging": [ [ 0, "#8e0152" ], [ 0.1, "#c51b7d" ], [ 0.2, "#de77ae" ], [ 0.3, "#f1b6da" ], [ 0.4, "#fde0ef" ], [ 0.5, "#f7f7f7" ], [ 0.6, "#e6f5d0" ], [ 0.7, "#b8e186" ], [ 0.8, "#7fbc41" ], [ 0.9, "#4d9221" ], [ 1, "#276419" ] ], "sequential": [ [ 0.0, "#0d0887" ], [ 0.1111111111111111, "#46039f" ], [ 0.2222222222222222, "#7201a8" ], [ 0.3333333333333333, "#9c179e" ], [ 0.4444444444444444, "#bd3786" ], [ 0.5555555555555556, "#d8576b" ], [ 0.6666666666666666, "#ed7953" ], [ 0.7777777777777778, "#fb9f3a" ], [ 0.8888888888888888, "#fdca26" ], [ 1.0, "#f0f921" ] ], "sequentialminus": [ [ 0.0, "#0d0887" ], [ 0.1111111111111111, "#46039f" ], [ 0.2222222222222222, "#7201a8" ], [ 0.3333333333333333, "#9c179e" ], [ 0.4444444444444444, "#bd3786" ], [ 0.5555555555555556, "#d8576b" ], [ 0.6666666666666666, "#ed7953" ], [ 0.7777777777777778, "#fb9f3a" ], [ 0.8888888888888888, "#fdca26" ], [ 1.0, "#f0f921" ] ] }, "hoverlabel": { "align": "left" }, "plot_bgcolor": "#E5ECF6", "paper_bgcolor": "white", "shapedefaults": { "line": { "color": "#2a3f5f" } }, "autotypenumbers": "strict", "annotationdefaults": { "arrowhead": 0, "arrowcolor": "#2a3f5f", "arrowwidth": 1 } } } } }, "height": null, "width": null, "user": { "profile_url": "https://chart-studio.plotly.com/~Chuanyun", "avatar_url": "https://storage.googleapis.com/plotly-prod-profiles/53.jpg", "background_url": "https://storage.googleapis.com/plotly-prod-profiles/bg-7.jpg", "bio": "", "nickname": "", "website": "", "stream_tokens": null, "feature_set_id": null, "csrf_token": null, "date_joined": "2024-03-29 06:55:48", "mapbox_access_tokens": null, "has_password": null, "username": "Chuanyun", "email": null, "is_active": null, "readonly": null, "is_dash_creator": null, "dash_created_count": null, "is_chart_creator": null, "charts_created_count": null } }, { "creation_time": "2024-04-02T11:00:20.299078Z", "comments": { "results": [], "count": 0 }, "parented": true, "embed_url": "https://chart-studio.plotly.com/~AR181RA/1.embed", "fid": "AR181RA:1", "filename": "Plot 1", "filetype": "plot", "img_url": "https://storage.googleapis.com/plotly-prod-images/AR181RA/1/9_19SIYWXTA72UFLYYSAKQCKEBCOTZT2.png", "image_urls": { "default": "https://storage.googleapis.com/plotly-prod-images/AR181RA/1/2_W42E2NB407WYV36SSKHWKWFJZ7HZZE.png", "block-thumb": "https://storage.googleapis.com/plotly-prod-images/AR181RA/1/8_OGHGUI6GEGSYA9CS4VJZ41CL6XH573.png", "list-thumb": "https://storage.googleapis.com/plotly-prod-images/AR181RA/1/9_19SIYWXTA72UFLYYSAKQCKEBCOTZT2.png" }, "api_urls": { "files": "https://api.plotly.com/v2/files/AR181RA:1", "plots": "https://api.plotly.com/v2/plots/AR181RA:1", "parent": "https://api.plotly.com/v2/folders/home?user=AR181RA" }, "owner": "AR181RA", "parent": -1, "preview": "", "referencers": [], "references": [], "title": "", "views": 8, "web_url": "https://chart-studio.plotly.com/~AR181RA/1/", "world_readable": true, "date_modified": "2024-04-02T11:00:20.309Z", "stars": { "results": [], "count": 0 }, "collaborators": { "results": [], "count": 0 }, "subfolder_count": null, "refresh_interval": null, "organize_view_url": "https://chart-studio.plotly.com/~AR181RA/1/", "current_user_permission": "read", "is_theme": null, "is_template": false, "autosize": true, "caption": "", "figure": { "data": [ { "fill": "none", "line": { "width": 2 }, "meta": { "columnNames": { "x": "A", "y": "A", "text": "" } }, "mode": "markers+lines+text", "name": "test", "type": "scatter", "xsrc": "AR181RA:0:173872", "ysrc": "AR181RA:0:173872", "error_x": { "type": "percent", "color": "#1f77b4", "value": 10, "width": 4, "visible": false, "symmetric": false, "thickness": 2, "valueminus": 10 }, "hoveron": "points", "hoverinfo": "x+y+name", "hoverlabel": { "namelength": 15 }, "showlegend": true, "connectgaps": false, "hovertemplate": "" }, { "fill": "none", "line": { "width": 2 }, "meta": { "columnNames": { "x": "A", "y": "B", "text": "" } }, "mode": "lines", "name": "Test 1", "type": "scatter", "xsrc": "AR181RA:0:173872", "ysrc": "AR181RA:0:d3fbd1", "hoveron": "points", "hoverinfo": "x+y+name", "hoverlabel": { "namelength": 15 }, "showlegend": true, "stackgroup": null, "connectgaps": false, "hovertemplate": "" }, { "fill": "none", "line": { "width": 2 }, "meta": { "columnNames": { "x": "A", "y": "C", "text": "" } }, "mode": "lines", "name": "Test 2", "type": "scatter", "xsrc": "AR181RA:0:173872", "ysrc": "AR181RA:0:bab6c4", "hoveron": "points", "hoverinfo": "x+y+name", "hoverlabel": { "namelength": 15 }, "showlegend": true, "stackgroup": null, "connectgaps": false, "hovertemplate": "" }, { "fill": "none", "line": { "width": 2 }, "meta": { "columnNames": { "x": "A", "y": "D", "text": "" } }, "mode": "lines", "name": "Test 3", "type": "scatter", "xsrc": "AR181RA:0:173872", "ysrc": "AR181RA:0:f01fc5", "hoveron": "points", "hoverinfo": "x+y+name", "hoverlabel": { "namelength": 15 }, "showlegend": true, "stackgroup": null, "connectgaps": false, "hovertemplate": "" } ], "frames": [], "layout": { "title": { "text": "Linear Chart Demo" }, "xaxis": { "side": "bottom", "type": "linear", "range": [ 0.8214266323372664, 4.178573367662733 ], "ticks": "outside", "title": { "font": { "size": 16, "color": "rgb(17, 4, 28)", "family": "Droid Sans" }, "text": "test X Axis" }, "anchor": "free", "domain": [ 0.03, 0.94 ], "ticklen": 8, "autorange": true, "tickwidth": 5, "fixedrange": false, "showspikes": true }, "yaxis": { "side": "left", "type": "linear", "dtick": 0, "range": [ 0.47456829527784605, 9.448706931827482 ], "tick0": 0, "ticks": "outside", "title": { "font": { "size": 16, "color": "rgb(17, 4, 28)", "family": "Droid Sans" }, "text": "Test Y Axis" }, "anchor": "free", "domain": [ 0.03, 0.94 ], "ticklen": 8, "tickmode": "linear", "autorange": true, "tickwidth": 5 }, "legend": { "x": 0.26000000000000023, "y": -0.1399999999999999, "font": { "size": 18, "color": "rgb(18, 1, 1)", "family": "Open Sans" }, "title": { "text": "<b>Legend tittle : </b>" }, "bgcolor": "rgb(207, 188, 67)", "xanchor": "auto", "itemsizing": "constant", "traceorder": "normal", "bordercolor": "rgb(61, 61, 184)", "borderwidth": 3, "orientation": "h" }, "shapes": [ { "x0": 1.5, "x1": 2.5, "y0": 2.7777777777777777, "y1": 7.222222222222222, "line": { "color": "#444444" }, "type": "rect", "yref": "y", "opacity": 0.3, "fillcolor": "#7f7f7f" } ], "modebar": { "orientation": "h" }, "autosize": true, "showlegend": true, "annotations": [ { "x": 2, "y": 5, "text": "<br>", "xref": "x", "axref": "pixel", "ayref": "pixel", "xanchor": "auto", "arrowsize": 2.000000000000001, "showarrow": true } ] } }, "height": null, "width": null, "user": { "profile_url": "https://chart-studio.plotly.com/~AR181RA", "avatar_url": "https://storage.googleapis.com/plotly-prod-profiles/12.jpg", "background_url": "https://storage.googleapis.com/plotly-prod-profiles/bg-10.jpg", "bio": "", "nickname": "", "website": "", "stream_tokens": null, "feature_set_id": null, "csrf_token": null, "date_joined": "2024-04-02 10:59:59", "mapbox_access_tokens": null, "has_password": null, "username": "AR181RA", "email": null, "is_active": null, "readonly": null, "is_dash_creator": null, "dash_created_count": null, "is_chart_creator": null, "charts_created_count": null } }, { "creation_time": "2024-04-02T10:58:48.066936Z", "comments": { "results": [], "count": 0 }, "parented": true, "embed_url": "https://chart-studio.plotly.com/~abhi_plotly/14.embed", "fid": "abhi_plotly:14", "filename": "TossWins", "filetype": "plot", "img_url": "https://storage.googleapis.com/plotly-prod-images/abhi_plotly/14/9_WFBTXKUBC0TUHBE0LO8DSJ22U5M3G3.png", "image_urls": { "default": "https://storage.googleapis.com/plotly-prod-images/abhi_plotly/14/2_3VOEH839I06F41UWBUHON12FLV1GR0.png", "block-thumb": "https://storage.googleapis.com/plotly-prod-images/abhi_plotly/14/8_05WV8PAK3HUV5EHP5Y8LJW8RM78VST.png", "list-thumb": "https://storage.googleapis.com/plotly-prod-images/abhi_plotly/14/9_WFBTXKUBC0TUHBE0LO8DSJ22U5M3G3.png" }, "api_urls": { "files": "https://api.plotly.com/v2/files/abhi_plotly:14", "plots": "https://api.plotly.com/v2/plots/abhi_plotly:14", "parent": "https://api.plotly.com/v2/folders/home?user=abhi_plotly" }, "owner": "abhi_plotly", "parent": -1, "preview": "", "referencers": [], "references": [], "title": "", "views": 79, "web_url": "https://chart-studio.plotly.com/~abhi_plotly/14/", "world_readable": true, "date_modified": "2024-04-02T17:01:24.538Z", "stars": { "results": [], "count": 0 }, "collaborators": { "results": [], "count": 0 }, "subfolder_count": null, "refresh_interval": null, "organize_view_url": "https://chart-studio.plotly.com/~abhi_plotly/14/", "current_user_permission": "read", "is_theme": null, "is_template": null, "autosize": true, "caption": "", "figure": { "data": [ { "name": "MI", "type": "bar", "xsrc": "abhi_plotly:53:8dd6e3", "ysrc": "abhi_plotly:53:9d0852", "xaxis": "x", "yaxis": "y", "marker": { "color": "#636efa", "pattern": { "shape": "" } }, "showlegend": true, "legendgroup": "MI", "offsetgroup": "MI", "orientation": "v", "textposition": "auto", "hovertemplate": "toss_won=%{x}<br>season=%{y}<extra></extra>", "alignmentgroup": "True" }, { "name": "DC", "type": "bar", "xsrc": "abhi_plotly:53:dfcd2b", "ysrc": "abhi_plotly:53:6d205f", "xaxis": "x", "yaxis": "y", "marker": { "color": "#EF553B", "pattern": { "shape": "" } }, "showlegend": true, "legendgroup": "DC", "offsetgroup": "DC", "orientation": "v", "textposition": "auto", "hovertemplate": "toss_won=%{x}<br>season=%{y}<extra></extra>", "alignmentgroup": "True" }, { "name": "KKR", "type": "bar", "xsrc": "abhi_plotly:53:3329e2", "ysrc": "abhi_plotly:53:6b89bc", "xaxis": "x", "yaxis": "y", "marker": { "color": "#00cc96", "pattern": { "shape": "" } }, "showlegend": true, "legendgroup": "KKR", "offsetgroup": "KKR", "orientation": "v", "textposition": "auto", "hovertemplate": "toss_won=%{x}<br>season=%{y}<extra></extra>", "alignmentgroup": "True" }, { "name": "RCB", "type": "bar", "xsrc": "abhi_plotly:53:25eb24", "ysrc": "abhi_plotly:53:9d3284", "xaxis": "x", "yaxis": "y", "marker": { "color": "#ab63fa", "pattern": { "shape": "" } }, "showlegend": true, "legendgroup": "RCB", "offsetgroup": "RCB", "orientation": "v", "textposition": "auto", "hovertemplate": "toss_won=%{x}<br>season=%{y}<extra></extra>", "alignmentgroup": "True" }, { "name": "SRH", "type": "bar", "xsrc": "abhi_plotly:53:65b233", "ysrc": "abhi_plotly:53:73447e", "xaxis": "x", "yaxis": "y", "marker": { "color": "#FFA15A", "pattern": { "shape": "" } }, "showlegend": true, "legendgroup": "SRH", "offsetgroup": "SRH", "orientation": "v", "textposition": "auto", "hovertemplate": "toss_won=%{x}<br>season=%{y}<extra></extra>", "alignmentgroup": "True" }, { "name": "RR", "type": "bar", "xsrc": "abhi_plotly:53:a11d94", "ysrc": "abhi_plotly:53:39994d", "xaxis": "x", "yaxis": "y", "marker": { "color": "#19d3f3", "pattern": { "shape": "" } }, "showlegend": true, "legendgroup": "RR", "offsetgroup": "RR", "orientation": "v", "textposition": "auto", "hovertemplate": "toss_won=%{x}<br>season=%{y}<extra></extra>", "alignmentgroup": "True" }, { "name": "CSK", "type": "bar", "xsrc": "abhi_plotly:53:52d512", "ysrc": "abhi_plotly:53:c3ae59", "xaxis": "x", "yaxis": "y", "marker": { "color": "#FF6692", "pattern": { "shape": "" } }, "showlegend": true, "legendgroup": "CSK", "offsetgroup": "CSK", "orientation": "v", "textposition": "auto", "hovertemplate": "toss_won=%{x}<br>season=%{y}<extra></extra>", "alignmentgroup": "True" }, { "name": "KXIP", "type": "bar", "xsrc": "abhi_plotly:53:d16d9b", "ysrc": "abhi_plotly:53:166a91", "xaxis": "x", "yaxis": "y", "marker": { "color": "#B6E880", "pattern": { "shape": "" } }, "showlegend": true, "legendgroup": "KXIP", "offsetgroup": "KXIP", "orientation": "v", "textposition": "auto", "hovertemplate": "toss_won=%{x}<br>season=%{y}<extra></extra>", "alignmentgroup": "True" }, { "name": "PWI", "type": "bar", "xsrc": "abhi_plotly:53:7d251f", "ysrc": "abhi_plotly:53:b300b9", "xaxis": "x", "yaxis": "y", "marker": { "color": "#FF97FF", "pattern": { "shape": "" } }, "showlegend": true, "legendgroup": "PWI", "offsetgroup": "PWI", "orientation": "v", "textposition": "auto", "hovertemplate": "toss_won=%{x}<br>season=%{y}<extra></extra>", "alignmentgroup": "True" }, { "name": "GT", "type": "bar", "xsrc": "abhi_plotly:53:5a18a9", "ysrc": "abhi_plotly:53:3e0aeb", "xaxis": "x", "yaxis": "y", "marker": { "color": "#FECB52", "pattern": { "shape": "" } }, "showlegend": true, "legendgroup": "GT", "offsetgroup": "GT", "orientation": "v", "textposition": "auto", "hovertemplate": "toss_won=%{x}<br>season=%{y}<extra></extra>", "alignmentgroup": "True" }, { "name": "GL", "type": "bar", "xsrc": "abhi_plotly:53:2a1016", "ysrc": "abhi_plotly:53:4f1e4a", "xaxis": "x", "yaxis": "y", "marker": { "color": "#636efa", "pattern": { "shape": "" } }, "showlegend": true, "legendgroup": "GL", "offsetgroup": "GL", "orientation": "v", "textposition": "auto", "hovertemplate": "toss_won=%{x}<br>season=%{y}<extra></extra>", "alignmentgroup": "True" }, { "name": "RPS", "type": "bar", "xsrc": "abhi_plotly:53:c25ef5", "ysrc": "abhi_plotly:53:4f0d73", "xaxis": "x", "yaxis": "y", "marker": { "color": "#EF553B", "pattern": { "shape": "" } }, "showlegend": true, "legendgroup": "RPS", "offsetgroup": "RPS", "orientation": "v", "textposition": "auto", "hovertemplate": "toss_won=%{x}<br>season=%{y}<extra></extra>", "alignmentgroup": "True" }, { "name": "Kochi", "type": "bar", "xsrc": "abhi_plotly:53:231aab", "ysrc": "abhi_plotly:53:b60d5a", "xaxis": "x", "yaxis": "y", "marker": { "color": "#00cc96", "pattern": { "shape": "" } }, "showlegend": true, "legendgroup": "Kochi", "offsetgroup": "Kochi", "orientation": "v", "textposition": "auto", "hovertemplate": "toss_won=%{x}<br>season=%{y}<extra></extra>", "alignmentgroup": "True" }, { "name": "LSG", "type": "bar", "xsrc": "abhi_plotly:53:4ba179", "ysrc": "abhi_plotly:53:6b8366", "xaxis": "x", "yaxis": "y", "marker": { "color": "#ab63fa", "pattern": { "shape": "" } }, "showlegend": true, "legendgroup": "LSG", "offsetgroup": "LSG", "orientation": "v", "textposition": "auto", "hovertemplate": "toss_won=%{x}<br>season=%{y}<extra></extra>", "alignmentgroup": "True" }, { "name": "PBKS", "type": "bar", "xsrc": "abhi_plotly:53:f817b2", "ysrc": "abhi_plotly:53:56219b", "xaxis": "x", "yaxis": "y", "marker": { "color": "#FFA15A", "pattern": { "shape": "" } }, "showlegend": true, "legendgroup": "PBKS", "offsetgroup": "PBKS", "orientation": "v", "textposition": "auto", "hovertemplate": "toss_won=%{x}<br>season=%{y}<extra></extra>", "alignmentgroup": "True" } ], "layout": { "xaxis": { "title": { "text": "Teams" }, "anchor": "y", "domain": [ 0.0, 1.0 ], "categoryarray": [ "MI", "DC", "KKR", "RCB", "SRH", "RR", "CSK", "KXIP", "PWI", "GT", "GL", "RPS", "Kochi", "LSG", "PBKS" ], "categoryorder": "array" }, "yaxis": { "title": { "text": "Toss wins" }, "anchor": "x", "domain": [ 0.0, 1.0 ] }, "legend": { "title": { "text": "toss_won" }, "tracegroupgap": 0 }, "margin": { "t": 60 }, "barmode": "relative", "template": { "data": { "bar": [ { "type": "bar", "marker": { "line": { "color": "#E5ECF6", "width": 0.5 }, "pattern": { "size": 10, "fillmode": "overlay", "solidity": 0.2 } }, "error_x": { "color": "#2a3f5f" }, "error_y": { "color": "#2a3f5f" } } ], "pie": [ { "type": "pie", "automargin": true } ], "table": [ { "type": "table", "cells": { "fill": { "color": "#EBF0F8" }, "line": { "color": "white" } }, "header": { "fill": { "color": "#C8D4E3" }, "line": { "color": "white" } } } ], "carpet": [ { "type": "carpet", "aaxis": { "gridcolor": "white", "linecolor": "white", "endlinecolor": "#2a3f5f", "minorgridcolor": "white", "startlinecolor": "#2a3f5f" }, "baxis": { "gridcolor": "white", "linecolor": "white", "endlinecolor": "#2a3f5f", "minorgridcolor": "white", "startlinecolor": "#2a3f5f" } } ], "mesh3d": [ { "type": "mesh3d", "colorbar": { "ticks": "", "outlinewidth": 0 } } ], "contour": [ { "type": "contour", "colorbar": { "ticks": "", "outlinewidth": 0 }, "colorscale": [ [ 0.0, "#0d0887" ], [ 0.1111111111111111, "#46039f" ], [ 0.2222222222222222, "#7201a8" ], [ 0.3333333333333333, "#9c179e" ], [ 0.4444444444444444, "#bd3786" ], [ 0.5555555555555556, "#d8576b" ], [ 0.6666666666666666, "#ed7953" ], [ 0.7777777777777778, "#fb9f3a" ], [ 0.8888888888888888, "#fdca26" ], [ 1.0, "#f0f921" ] ] } ], "heatmap": [ { "type": "heatmap", "colorbar": { "ticks": "", "outlinewidth": 0 }, "colorscale": [ [ 0.0, "#0d0887" ], [ 0.1111111111111111, "#46039f" ], [ 0.2222222222222222, "#7201a8" ], [ 0.3333333333333333, "#9c179e" ], [ 0.4444444444444444, "#bd3786" ], [ 0.5555555555555556, "#d8576b" ], [ 0.6666666666666666, "#ed7953" ], [ 0.7777777777777778, "#fb9f3a" ], [ 0.8888888888888888, "#fdca26" ], [ 1.0, "#f0f921" ] ] } ], "scatter": [ { "type": "scatter", "fillpattern": { "size": 10, "fillmode": "overlay", "solidity": 0.2 } } ], "surface": [ { "type": "surface", "colorbar": { "ticks": "", "outlinewidth": 0 }, "colorscale": [ [ 0.0, "#0d0887" ], [ 0.1111111111111111, "#46039f" ], [ 0.2222222222222222, "#7201a8" ], [ 0.3333333333333333, "#9c179e" ], [ 0.4444444444444444, "#bd3786" ], [ 0.5555555555555556, "#d8576b" ], [ 0.6666666666666666, "#ed7953" ], [ 0.7777777777777778, "#fb9f3a" ], [ 0.8888888888888888, "#fdca26" ], [ 1.0, "#f0f921" ] ] } ], "barpolar": [ { "type": "barpolar", "marker": { "line": { "color": "#E5ECF6", "width": 0.5 }, "pattern": { "size": 10, "fillmode": "overlay", "solidity": 0.2 } } } ], "heatmapgl": [ { "type": "heatmapgl", "colorbar": { "ticks": "", "outlinewidth": 0 }, "colorscale": [ [ 0.0, "#0d0887" ], [ 0.1111111111111111, "#46039f" ], [ 0.2222222222222222, "#7201a8" ], [ 0.3333333333333333, "#9c179e" ], [ 0.4444444444444444, "#bd3786" ], [ 0.5555555555555556, "#d8576b" ], [ 0.6666666666666666, "#ed7953" ], [ 0.7777777777777778, "#fb9f3a" ], [ 0.8888888888888888, "#fdca26" ], [ 1.0, "#f0f921" ] ] } ], "histogram": [ { "type": "histogram", "marker": { "pattern": { "size": 10, "fillmode": "overlay", "solidity": 0.2 } } } ], "parcoords": [ { "line": { "colorbar": { "ticks": "", "outlinewidth": 0 } }, "type": "parcoords" } ], "scatter3d": [ { "line": { "colorbar": { "ticks": "", "outlinewidth": 0 } }, "type": "scatter3d", "marker": { "colorbar": { "ticks": "", "outlinewidth": 0 } } } ], "scattergl": [ { "type": "scattergl", "marker": { "colorbar": { "ticks": "", "outlinewidth": 0 } } } ], "choropleth": [ { "type": "choropleth", "colorbar": { "ticks": "", "outlinewidth": 0 } } ], "scattergeo": [ { "type": "scattergeo", "marker": { "colorbar": { "ticks": "", "outlinewidth": 0 } } } ], "histogram2d": [ { "type": "histogram2d", "colorbar": { "ticks": "", "outlinewidth": 0 }, "colorscale": [ [ 0.0, "#0d0887" ], [ 0.1111111111111111, "#46039f" ], [ 0.2222222222222222, "#7201a8" ], [ 0.3333333333333333, "#9c179e" ], [ 0.4444444444444444, "#bd3786" ], [ 0.5555555555555556, "#d8576b" ], [ 0.6666666666666666, "#ed7953" ], [ 0.7777777777777778, "#fb9f3a" ], [ 0.8888888888888888, "#fdca26" ], [ 1.0, "#f0f921" ] ] } ], "scatterpolar": [ { "type": "scatterpolar", "marker": { "colorbar": { "ticks": "", "outlinewidth": 0 } } } ], "contourcarpet": [ { "type": "contourcarpet", "colorbar": { "ticks": "", "outlinewidth": 0 } } ], "scattercarpet": [ { "type": "scattercarpet", "marker": { "colorbar": { "ticks": "", "outlinewidth": 0 } } } ], "scattermapbox": [ { "type": "scattermapbox", "marker": { "colorbar": { "ticks": "", "outlinewidth": 0 } } } ], "scatterpolargl": [ { "type": "scatterpolargl", "marker": { "colorbar": { "ticks": "", "outlinewidth": 0 } } } ], "scatterternary": [ { "type": "scatterternary", "marker": { "colorbar": { "ticks": "", "outlinewidth": 0 } } } ], "histogram2dcontour": [ { "type": "histogram2dcontour", "colorbar": { "ticks": "", "outlinewidth": 0 }, "colorscale": [ [ 0.0, "#0d0887" ], [ 0.1111111111111111, "#46039f" ], [ 0.2222222222222222, "#7201a8" ], [ 0.3333333333333333, "#9c179e" ], [ 0.4444444444444444, "#bd3786" ], [ 0.5555555555555556, "#d8576b" ], [ 0.6666666666666666, "#ed7953" ], [ 0.7777777777777778, "#fb9f3a" ], [ 0.8888888888888888, "#fdca26" ], [ 1.0, "#f0f921" ] ] } ] }, "layout": { "geo": { "bgcolor": "white", "showland": true, "lakecolor": "white", "landcolor": "#E5ECF6", "showlakes": true, "subunitcolor": "white" }, "font": { "color": "#2a3f5f" }, "polar": { "bgcolor": "#E5ECF6", "radialaxis": { "ticks": "", "gridcolor": "white", "linecolor": "white" }, "angularaxis": { "ticks": "", "gridcolor": "white", "linecolor": "white" } }, "scene": { "xaxis": { "ticks": "", "gridcolor": "white", "gridwidth": 2, "linecolor": "white", "zerolinecolor": "white", "showbackground": true, "backgroundcolor": "#E5ECF6" }, "yaxis": { "ticks": "", "gridcolor": "white", "gridwidth": 2, "linecolor": "white", "zerolinecolor": "white", "showbackground": true, "backgroundcolor": "#E5ECF6" }, "zaxis": { "ticks": "", "gridcolor": "white", "gridwidth": 2, "linecolor": "white", "zerolinecolor": "white", "showbackground": true, "backgroundcolor": "#E5ECF6" } }, "title": { "x": 0.05 }, "xaxis": { "ticks": "", "title": { "standoff": 15 }, "gridcolor": "white", "linecolor": "white", "automargin": true, "zerolinecolor": "white", "zerolinewidth": 2 }, "yaxis": { "ticks": "", "title": { "standoff": 15 }, "gridcolor": "white", "linecolor": "white", "automargin": true, "zerolinecolor": "white", "zerolinewidth": 2 }, "mapbox": { "style": "light" }, "ternary": { "aaxis": { "ticks": "", "gridcolor": "white", "linecolor": "white" }, "baxis": { "ticks": "", "gridcolor": "white", "linecolor": "white" }, "caxis": { "ticks": "", "gridcolor": "white", "linecolor": "white" }, "bgcolor": "#E5ECF6" }, "colorway": [ "#636efa", "#EF553B", "#00cc96", "#ab63fa", "#FFA15A", "#19d3f3", "#FF6692", "#B6E880", "#FF97FF", "#FECB52" ], "coloraxis": { "colorbar": { "ticks": "", "outlinewidth": 0 } }, "hovermode": "closest", "colorscale": { "diverging": [ [ 0, "#8e0152" ], [ 0.1, "#c51b7d" ], [ 0.2, "#de77ae" ], [ 0.3, "#f1b6da" ], [ 0.4, "#fde0ef" ], [ 0.5, "#f7f7f7" ], [ 0.6, "#e6f5d0" ], [ 0.7, "#b8e186" ], [ 0.8, "#7fbc41" ], [ 0.9, "#4d9221" ], [ 1, "#276419" ] ], "sequential": [ [ 0.0, "#0d0887" ], [ 0.1111111111111111, "#46039f" ], [ 0.2222222222222222, "#7201a8" ], [ 0.3333333333333333, "#9c179e" ], [ 0.4444444444444444, "#bd3786" ], [ 0.5555555555555556, "#d8576b" ], [ 0.6666666666666666, "#ed7953" ], [ 0.7777777777777778, "#fb9f3a" ], [ 0.8888888888888888, "#fdca26" ], [ 1.0, "#f0f921" ] ], "sequentialminus": [ [ 0.0, "#0d0887" ], [ 0.1111111111111111, "#46039f" ], [ 0.2222222222222222, "#7201a8" ], [ 0.3333333333333333, "#9c179e" ], [ 0.4444444444444444, "#bd3786" ], [ 0.5555555555555556, "#d8576b" ], [ 0.6666666666666666, "#ed7953" ], [ 0.7777777777777778, "#fb9f3a" ], [ 0.8888888888888888, "#fdca26" ], [ 1.0, "#f0f921" ] ] }, "hoverlabel": { "align": "left" }, "plot_bgcolor": "#E5ECF6", "paper_bgcolor": "white", "shapedefaults": { "line": { "color": "#2a3f5f" } }, "autotypenumbers": "strict", "annotationdefaults": { "arrowhead": 0, "arrowcolor": "#2a3f5f", "arrowwidth": 1 } } } } }, "height": null, "width": null, "user": { "profile_url": "https://chart-studio.plotly.com/~abhi_plotly", "avatar_url": "https://storage.googleapis.com/plotly-prod-profiles/23.jpg", "background_url": "https://storage.googleapis.com/plotly-prod-profiles/bg-10.jpg", "bio": "", "nickname": "", "website": "", "stream_tokens": null, "feature_set_id": null, "csrf_token": null, "date_joined": "2024-04-02 09:52:01", "mapbox_access_tokens": null, "has_password": null, "username": "abhi_plotly", "email": null, "is_active": null, "readonly": null, "is_dash_creator": null, "dash_created_count": null, "is_chart_creator": null, "charts_created_count": null } }, { "creation_time": "2024-04-02T10:53:04.502063Z", "comments": { "results": [], "count": 0 }, "parented": true, "embed_url": "https://chart-studio.plotly.com/~abhi_plotly/11.embed", "fid": "abhi_plotly:11", "filename": "MostPOMs", "filetype": "plot", "img_url": "https://storage.googleapis.com/plotly-prod-images/abhi_plotly/11/9_EYN4IWTXC4SXVB4XWBS7FBN32CO9KC.png", "image_urls": { "default": "https://storage.googleapis.com/plotly-prod-images/abhi_plotly/11/2_SQMW43B53KW4IS5Q2569QN361H2QOI.png", "block-thumb": "https://storage.googleapis.com/plotly-prod-images/abhi_plotly/11/8_80D5Q3CMZQLMFNZJKS0BW8U6ANXDTW.png", "list-thumb": "https://storage.googleapis.com/plotly-prod-images/abhi_plotly/11/9_EYN4IWTXC4SXVB4XWBS7FBN32CO9KC.png" }, "api_urls": { "files": "https://api.plotly.com/v2/files/abhi_plotly:11", "plots": "https://api.plotly.com/v2/plots/abhi_plotly:11", "parent": "https://api.plotly.com/v2/folders/home?user=abhi_plotly" }, "owner": "abhi_plotly", "parent": -1, "preview": "", "referencers": [], "references": [], "title": "", "views": 88, "web_url": "https://chart-studio.plotly.com/~abhi_plotly/11/", "world_readable": true, "date_modified": "2024-04-02T17:01:20.297Z", "stars": { "results": [], "count": 0 }, "collaborators": { "results": [], "count": 0 }, "subfolder_count": null, "refresh_interval": null, "organize_view_url": "https://chart-studio.plotly.com/~abhi_plotly/11/", "current_user_permission": "read", "is_theme": null, "is_template": null, "autosize": true, "caption": "", "figure": { "data": [ { "name": "AB de Villiers", "type": "bar", "xsrc": "abhi_plotly:52:f549c3", "ysrc": "abhi_plotly:52:2ad8cc", "xaxis": "x", "yaxis": "y", "marker": { "color": "#636efa", "pattern": { "shape": "" } }, "showlegend": true, "legendgroup": "AB de Villiers", "offsetgroup": "AB de Villiers", "orientation": "v", "textposition": "auto", "hovertemplate": "pom=%{x}<br>count=%{y}<extra></extra>", "alignmentgroup": "True" }, { "name": "Chris Gayle", "type": "bar", "xsrc": "abhi_plotly:52:729b66", "ysrc": "abhi_plotly:52:d18327", "xaxis": "x", "yaxis": "y", "marker": { "color": "#EF553B", "pattern": { "shape": "" } }, "showlegend": true, "legendgroup": "Chris Gayle", "offsetgroup": "Chris Gayle", "orientation": "v", "textposition": "auto", "hovertemplate": "pom=%{x}<br>count=%{y}<extra></extra>", "alignmentgroup": "True" }, { "name": "Rohit Sharma", "type": "bar", "xsrc": "abhi_plotly:52:8ca0be", "ysrc": "abhi_plotly:52:e010b8", "xaxis": "x", "yaxis": "y", "marker": { "color": "#00cc96", "pattern": { "shape": "" } }, "showlegend": true, "legendgroup": "Rohit Sharma", "offsetgroup": "Rohit Sharma", "orientation": "v", "textposition": "auto", "hovertemplate": "pom=%{x}<br>count=%{y}<extra></extra>", "alignmentgroup": "True" }, { "name": "David Warner", "type": "bar", "xsrc": "abhi_plotly:52:583b2d", "ysrc": "abhi_plotly:52:cedadc", "xaxis": "x", "yaxis": "y", "marker": { "color": "#ab63fa", "pattern": { "shape": "" } }, "showlegend": true, "legendgroup": "David Warner", "offsetgroup": "David Warner", "orientation": "v", "textposition": "auto", "hovertemplate": "pom=%{x}<br>count=%{y}<extra></extra>", "alignmentgroup": "True" }, { "name": "MS Dhoni", "type": "bar", "xsrc": "abhi_plotly:52:15e614", "ysrc": "abhi_plotly:52:c60e52", "xaxis": "x", "yaxis": "y", "marker": { "color": "#FFA15A", "pattern": { "shape": "" } }, "showlegend": true, "legendgroup": "MS Dhoni", "offsetgroup": "MS Dhoni", "orientation": "v", "textposition": "auto", "hovertemplate": "pom=%{x}<br>count=%{y}<extra></extra>", "alignmentgroup": "True" }, { "name": "Virat Kohli", "type": "bar", "xsrc": "abhi_plotly:52:45254c", "ysrc": "abhi_plotly:52:30a321", "xaxis": "x", "yaxis": "y", "marker": { "color": "#19d3f3", "pattern": { "shape": "" } }, "showlegend": true, "legendgroup": "Virat Kohli", "offsetgroup": "Virat Kohli", "orientation": "v", "textposition": "auto", "hovertemplate": "pom=%{x}<br>count=%{y}<extra></extra>", "alignmentgroup": "True" }, { "name": "Ravindra Jadeja", "type": "bar", "xsrc": "abhi_plotly:52:317854", "ysrc": "abhi_plotly:52:fc5faa", "xaxis": "x", "yaxis": "y", "marker": { "color": "#FF6692", "pattern": { "shape": "" } }, "showlegend": true, "legendgroup": "Ravindra Jadeja", "offsetgroup": "Ravindra Jadeja", "orientation": "v", "textposition": "auto", "hovertemplate": "pom=%{x}<br>count=%{y}<extra></extra>", "alignmentgroup": "True" }, { "name": "Yusuf Pathan", "type": "bar", "xsrc": "abhi_plotly:52:94aca1", "ysrc": "abhi_plotly:52:6b7df4", "xaxis": "x", "yaxis": "y", "marker": { "color": "#B6E880", "pattern": { "shape": "" } }, "showlegend": true, "legendgroup": "Yusuf Pathan", "offsetgroup": "Yusuf Pathan", "orientation": "v", "textposition": "auto", "hovertemplate": "pom=%{x}<br>count=%{y}<extra></extra>", "alignmentgroup": "True" }, { "name": "Shane Watson", "type": "bar", "xsrc": "abhi_plotly:52:3e39bf", "ysrc": "abhi_plotly:52:63c903", "xaxis": "x", "yaxis": "y", "marker": { "color": "#FF97FF", "pattern": { "shape": "" } }, "showlegend": true, "legendgroup": "Shane Watson", "offsetgroup": "Shane Watson", "orientation": "v", "textposition": "auto", "hovertemplate": "pom=%{x}<br>count=%{y}<extra></extra>", "alignmentgroup": "True" }, { "name": "Ajinkya Rahane", "type": "bar", "xsrc": "abhi_plotly:52:511939", "ysrc": "abhi_plotly:52:335936", "xaxis": "x", "yaxis": "y", "marker": { "color": "#FECB52", "pattern": { "shape": "" } }, "showlegend": true, "legendgroup": "Ajinkya Rahane", "offsetgroup": "Ajinkya Rahane", "orientation": "v", "textposition": "auto", "hovertemplate": "pom=%{x}<br>count=%{y}<extra></extra>", "alignmentgroup": "True" }, { "name": "KL Rahul", "type": "bar", "xsrc": "abhi_plotly:52:613e5b", "ysrc": "abhi_plotly:52:75bc0d", "xaxis": "x", "yaxis": "y", "marker": { "color": "#636efa", "pattern": { "shape": "" } }, "showlegend": true, "legendgroup": "KL Rahul", "offsetgroup": "KL Rahul", "orientation": "v", "textposition": "auto", "hovertemplate": "pom=%{x}<br>count=%{y}<extra></extra>", "alignmentgroup": "True" }, { "name": "Gautam Gambhir", "type": "bar", "xsrc": "abhi_plotly:52:00102c", "ysrc": "abhi_plotly:52:c185a9", "xaxis": "x", "yaxis": "y", "marker": { "color": "#EF553B", "pattern": { "shape": "" } }, "showlegend": true, "legendgroup": "Gautam Gambhir", "offsetgroup": "Gautam Gambhir", "orientation": "v", "textposition": "auto", "hovertemplate": "pom=%{x}<br>count=%{y}<extra></extra>", "alignmentgroup": "True" }, { "name": "Sunil Narine", "type": "bar", "xsrc": "abhi_plotly:52:9962e7", "ysrc": "abhi_plotly:52:b008aa", "xaxis": "x", "yaxis": "y", "marker": { "color": "#00cc96", "pattern": { "shape": "" } }, "showlegend": true, "legendgroup": "Sunil Narine", "offsetgroup": "Sunil Narine", "orientation": "v", "textposition": "auto", "hovertemplate": "pom=%{x}<br>count=%{y}<extra></extra>", "alignmentgroup": "True" }, { "name": "Kieron Pollard", "type": "bar", "xsrc": "abhi_plotly:52:c71c10", "ysrc": "abhi_plotly:52:4622f5", "xaxis": "x", "yaxis": "y", "marker": { "color": "#ab63fa", "pattern": { "shape": "" } }, "showlegend": true, "legendgroup": "Kieron Pollard", "offsetgroup": "Kieron Pollard", "orientation": "v", "textposition": "auto", "hovertemplate": "pom=%{x}<br>count=%{y}<extra></extra>", "alignmentgroup": "True" }, { "name": "Michael Hussey", "type": "bar", "xsrc": "abhi_plotly:52:546661", "ysrc": "abhi_plotly:52:288de8", "xaxis": "x", "yaxis": "y", "marker": { "color": "#FFA15A", "pattern": { "shape": "" } }, "showlegend": true, "legendgroup": "Michael Hussey", "offsetgroup": "Michael Hussey", "orientation": "v", "textposition": "auto", "hovertemplate": "pom=%{x}<br>count=%{y}<extra></extra>", "alignmentgroup": "True" } ], "layout": { "xaxis": { "title": { "text": "Player" }, "anchor": "y", "domain": [ 0.0, 1.0 ], "categoryarray": [ "AB de Villiers", "Chris Gayle", "Rohit Sharma", "David Warner", "MS Dhoni", "Virat Kohli", "Ravindra Jadeja", "Yusuf Pathan", "Shane Watson", "Ajinkya Rahane", "KL Rahul", "Gautam Gambhir", "Sunil Narine", "Kieron Pollard", "Michael Hussey" ], "categoryorder": "array" }, "yaxis": { "title": { "text": "Man of the Match awards" }, "anchor": "x", "domain": [ 0.0, 1.0 ] }, "legend": { "title": { "text": "pom" }, "tracegroupgap": 0 }, "margin": { "t": 60 }, "barmode": "relative", "template": { "data": { "bar": [ { "type": "bar", "marker": { "line": { "color": "#E5ECF6", "width": 0.5 }, "pattern": { "size": 10, "fillmode": "overlay", "solidity": 0.2 } }, "error_x": { "color": "#2a3f5f" }, "error_y": { "color": "#2a3f5f" } } ], "pie": [ { "type": "pie", "automargin": true } ], "table": [ { "type": "table", "cells": { "fill": { "color": "#EBF0F8" }, "line": { "color": "white" } }, "header": { "fill": { "color": "#C8D4E3" }, "line": { "color": "white" } } } ], "carpet": [ { "type": "carpet", "aaxis": { "gridcolor": "white", "linecolor": "white", "endlinecolor": "#2a3f5f", "minorgridcolor": "white", "startlinecolor": "#2a3f5f" }, "baxis": { "gridcolor": "white", "linecolor": "white", "endlinecolor": "#2a3f5f", "minorgridcolor": "white", "startlinecolor": "#2a3f5f" } } ], "mesh3d": [ { "type": "mesh3d", "colorbar": { "ticks": "", "outlinewidth": 0 } } ], "contour": [ { "type": "contour", "colorbar": { "ticks": "", "outlinewidth": 0 }, "colorscale": [ [ 0.0, "#0d0887" ], [ 0.1111111111111111, "#46039f" ], [ 0.2222222222222222, "#7201a8" ], [ 0.3333333333333333, "#9c179e" ], [ 0.4444444444444444, "#bd3786" ], [ 0.5555555555555556, "#d8576b" ], [ 0.6666666666666666, "#ed7953" ], [ 0.7777777777777778, "#fb9f3a" ], [ 0.8888888888888888, "#fdca26" ], [ 1.0, "#f0f921" ] ] } ], "heatmap": [ { "type": "heatmap", "colorbar": { "ticks": "", "outlinewidth": 0 }, "colorscale": [ [ 0.0, "#0d0887" ], [ 0.1111111111111111, "#46039f" ], [ 0.2222222222222222, "#7201a8" ], [ 0.3333333333333333, "#9c179e" ], [ 0.4444444444444444, "#bd3786" ], [ 0.5555555555555556, "#d8576b" ], [ 0.6666666666666666, "#ed7953" ], [ 0.7777777777777778, "#fb9f3a" ], [ 0.8888888888888888, "#fdca26" ], [ 1.0, "#f0f921" ] ] } ], "scatter": [ { "type": "scatter", "fillpattern": { "size": 10, "fillmode": "overlay", "solidity": 0.2 } } ], "surface": [ { "type": "surface", "colorbar": { "ticks": "", "outlinewidth": 0 }, "colorscale": [ [ 0.0, "#0d0887" ], [ 0.1111111111111111, "#46039f" ], [ 0.2222222222222222, "#7201a8" ], [ 0.3333333333333333, "#9c179e" ], [ 0.4444444444444444, "#bd3786" ], [ 0.5555555555555556, "#d8576b" ], [ 0.6666666666666666, "#ed7953" ], [ 0.7777777777777778, "#fb9f3a" ], [ 0.8888888888888888, "#fdca26" ], [ 1.0, "#f0f921" ] ] } ], "barpolar": [ { "type": "barpolar", "marker": { "line": { "color": "#E5ECF6", "width": 0.5 }, "pattern": { "size": 10, "fillmode": "overlay", "solidity": 0.2 } } } ], "heatmapgl": [ { "type": "heatmapgl", "colorbar": { "ticks": "", "outlinewidth": 0 }, "colorscale": [ [ 0.0, "#0d0887" ], [ 0.1111111111111111, "#46039f" ], [ 0.2222222222222222, "#7201a8" ], [ 0.3333333333333333, "#9c179e" ], [ 0.4444444444444444, "#bd3786" ], [ 0.5555555555555556, "#d8576b" ], [ 0.6666666666666666, "#ed7953" ], [ 0.7777777777777778, "#fb9f3a" ], [ 0.8888888888888888, "#fdca26" ], [ 1.0, "#f0f921" ] ] } ], "histogram": [ { "type": "histogram", "marker": { "pattern": { "size": 10, "fillmode": "overlay", "solidity": 0.2 } } } ], "parcoords": [ { "line": { "colorbar": { "ticks": "", "outlinewidth": 0 } }, "type": "parcoords" } ], "scatter3d": [ { "line": { "colorbar": { "ticks": "", "outlinewidth": 0 } }, "type": "scatter3d", "marker": { "colorbar": { "ticks": "", "outlinewidth": 0 } } } ], "scattergl": [ { "type": "scattergl", "marker": { "colorbar": { "ticks": "", "outlinewidth": 0 } } } ], "choropleth": [ { "type": "choropleth", "colorbar": { "ticks": "", "outlinewidth": 0 } } ], "scattergeo": [ { "type": "scattergeo", "marker": { "colorbar": { "ticks": "", "outlinewidth": 0 } } } ], "histogram2d": [ { "type": "histogram2d", "colorbar": { "ticks": "", "outlinewidth": 0 }, "colorscale": [ [ 0.0, "#0d0887" ], [ 0.1111111111111111, "#46039f" ], [ 0.2222222222222222, "#7201a8" ], [ 0.3333333333333333, "#9c179e" ], [ 0.4444444444444444, "#bd3786" ], [ 0.5555555555555556, "#d8576b" ], [ 0.6666666666666666, "#ed7953" ], [ 0.7777777777777778, "#fb9f3a" ], [ 0.8888888888888888, "#fdca26" ], [ 1.0, "#f0f921" ] ] } ], "scatterpolar": [ { "type": "scatterpolar", "marker": { "colorbar": { "ticks": "", "outlinewidth": 0 } } } ], "contourcarpet": [ { "type": "contourcarpet", "colorbar": { "ticks": "", "outlinewidth": 0 } } ], "scattercarpet": [ { "type": "scattercarpet", "marker": { "colorbar": { "ticks": "", "outlinewidth": 0 } } } ], "scattermapbox": [ { "type": "scattermapbox", "marker": { "colorbar": { "ticks": "", "outlinewidth": 0 } } } ], "scatterpolargl": [ { "type": "scatterpolargl", "marker": { "colorbar": { "ticks": "", "outlinewidth": 0 } } } ], "scatterternary": [ { "type": "scatterternary", "marker": { "colorbar": { "ticks": "", "outlinewidth": 0 } } } ], "histogram2dcontour": [ { "type": "histogram2dcontour", "colorbar": { "ticks": "", "outlinewidth": 0 }, "colorscale": [ [ 0.0, "#0d0887" ], [ 0.1111111111111111, "#46039f" ], [ 0.2222222222222222, "#7201a8" ], [ 0.3333333333333333, "#9c179e" ], [ 0.4444444444444444, "#bd3786" ], [ 0.5555555555555556, "#d8576b" ], [ 0.6666666666666666, "#ed7953" ], [ 0.7777777777777778, "#fb9f3a" ], [ 0.8888888888888888, "#fdca26" ], [ 1.0, "#f0f921" ] ] } ] }, "layout": { "geo": { "bgcolor": "white", "showland": true, "lakecolor": "white", "landcolor": "#E5ECF6", "showlakes": true, "subunitcolor": "white" }, "font": { "color": "#2a3f5f" }, "polar": { "bgcolor": "#E5ECF6", "radialaxis": { "ticks": "", "gridcolor": "white", "linecolor": "white" }, "angularaxis": { "ticks": "", "gridcolor": "white", "linecolor": "white" } }, "scene": { "xaxis": { "ticks": "", "gridcolor": "white", "gridwidth": 2, "linecolor": "white", "zerolinecolor": "white", "showbackground": true, "backgroundcolor": "#E5ECF6" }, "yaxis": { "ticks": "", "gridcolor": "white", "gridwidth": 2, "linecolor": "white", "zerolinecolor": "white", "showbackground": true, "backgroundcolor": "#E5ECF6" }, "zaxis": { "ticks": "", "gridcolor": "white", "gridwidth": 2, "linecolor": "white", "zerolinecolor": "white", "showbackground": true, "backgroundcolor": "#E5ECF6" } }, "title": { "x": 0.05 }, "xaxis": { "ticks": "", "title": { "standoff": 15 }, "gridcolor": "white", "linecolor": "white", "automargin": true, "zerolinecolor": "white", "zerolinewidth": 2 }, "yaxis": { "ticks": "", "title": { "standoff": 15 }, "gridcolor": "white", "linecolor": "white", "automargin": true, "zerolinecolor": "white", "zerolinewidth": 2 }, "mapbox": { "style": "light" }, "ternary": { "aaxis": { "ticks": "", "gridcolor": "white", "linecolor": "white" }, "baxis": { "ticks": "", "gridcolor": "white", "linecolor": "white" }, "caxis": { "ticks": "", "gridcolor": "white", "linecolor": "white" }, "bgcolor": "#E5ECF6" }, "colorway": [ "#636efa", "#EF553B", "#00cc96", "#ab63fa", "#FFA15A", "#19d3f3", "#FF6692", "#B6E880", "#FF97FF", "#FECB52" ], "coloraxis": { "colorbar": { "ticks": "", "outlinewidth": 0 } }, "hovermode": "closest", "colorscale": { "diverging": [ [ 0, "#8e0152" ], [ 0.1, "#c51b7d" ], [ 0.2, "#de77ae" ], [ 0.3, "#f1b6da" ], [ 0.4, "#fde0ef" ], [ 0.5, "#f7f7f7" ], [ 0.6, "#e6f5d0" ], [ 0.7, "#b8e186" ], [ 0.8, "#7fbc41" ], [ 0.9, "#4d9221" ], [ 1, "#276419" ] ], "sequential": [ [ 0.0, "#0d0887" ], [ 0.1111111111111111, "#46039f" ], [ 0.2222222222222222, "#7201a8" ], [ 0.3333333333333333, "#9c179e" ], [ 0.4444444444444444, "#bd3786" ], [ 0.5555555555555556, "#d8576b" ], [ 0.6666666666666666, "#ed7953" ], [ 0.7777777777777778, "#fb9f3a" ], [ 0.8888888888888888, "#fdca26" ], [ 1.0, "#f0f921" ] ], "sequentialminus": [ [ 0.0, "#0d0887" ], [ 0.1111111111111111, "#46039f" ], [ 0.2222222222222222, "#7201a8" ], [ 0.3333333333333333, "#9c179e" ], [ 0.4444444444444444, "#bd3786" ], [ 0.5555555555555556, "#d8576b" ], [ 0.6666666666666666, "#ed7953" ], [ 0.7777777777777778, "#fb9f3a" ], [ 0.8888888888888888, "#fdca26" ], [ 1.0, "#f0f921" ] ] }, "hoverlabel": { "align": "left" }, "plot_bgcolor": "#E5ECF6", "paper_bgcolor": "white", "shapedefaults": { "line": { "color": "#2a3f5f" } }, "autotypenumbers": "strict", "annotationdefaults": { "arrowhead": 0, "arrowcolor": "#2a3f5f", "arrowwidth": 1 } } } } }, "height": null, "width": null, "user": { "profile_url": "https://chart-studio.plotly.com/~abhi_plotly", "avatar_url": "https://storage.googleapis.com/plotly-prod-profiles/23.jpg", "background_url": "https://storage.googleapis.com/plotly-prod-profiles/bg-10.jpg", "bio": "", "nickname": "", "website": "", "stream_tokens": null, "feature_set_id": null, "csrf_token": null, "date_joined": "2024-04-02 09:52:01", "mapbox_access_tokens": null, "has_password": null, "username": "abhi_plotly", "email": null, "is_active": null, "readonly": null, "is_dash_creator": null, "dash_created_count": null, "is_chart_creator": null, "charts_created_count": null } }, { "creation_time": "2024-04-02T10:47:02.781777Z", "comments": { "results": [], "count": 0 }, "parented": true, "embed_url": "https://chart-studio.plotly.com/~abhi_plotly/8.embed", "fid": "abhi_plotly:8", "filename": "topWicketTakers", "filetype": "plot", "img_url": "https://storage.googleapis.com/plotly-prod-images/abhi_plotly/8/9_R5KAUJGVV3SNZIAHNLAMGOYR4VNW4R.png", "image_urls": { "default": "https://storage.googleapis.com/plotly-prod-images/abhi_plotly/8/2_QB9BVYAXOA7OIO9301CD76E32O29MO.png", "block-thumb": "https://storage.googleapis.com/plotly-prod-images/abhi_plotly/8/8_U16GXCIJF7W3SD3K4HOIUJIPXDNB4L.png", "list-thumb": "https://storage.googleapis.com/plotly-prod-images/abhi_plotly/8/9_R5KAUJGVV3SNZIAHNLAMGOYR4VNW4R.png" }, "api_urls": { "files": "https://api.plotly.com/v2/files/abhi_plotly:8", "plots": "https://api.plotly.com/v2/plots/abhi_plotly:8", "parent": "https://api.plotly.com/v2/folders/home?user=abhi_plotly" }, "owner": "abhi_plotly", "parent": -1, "preview": "", "referencers": [], "references": [], "title": "", "views": 76, "web_url": "https://chart-studio.plotly.com/~abhi_plotly/8/", "world_readable": true, "date_modified": "2024-04-02T17:02:58.367Z", "stars": { "results": [], "count": 0 }, "collaborators": { "results": [], "count": 0 }, "subfolder_count": null, "refresh_interval": null, "organize_view_url": "https://chart-studio.plotly.com/~abhi_plotly/8/", "current_user_permission": "read", "is_theme": null, "is_template": null, "autosize": true, "caption": "", "figure": { "data": [ { "name": "YS Chahal", "type": "bar", "xsrc": "abhi_plotly:56:8a245a", "ysrc": "abhi_plotly:56:18948d", "xaxis": "x", "yaxis": "y", "marker": { "color": "#636efa", "pattern": { "shape": "" } }, "showlegend": true, "legendgroup": "YS Chahal", "offsetgroup": "YS Chahal", "orientation": "v", "textposition": "auto", "hovertemplate": "Player=%{x}<br>Wkts=%{y}<extra></extra>", "alignmentgroup": "True" }, { "name": "DJ Bravo", "type": "bar", "xsrc": "abhi_plotly:56:d129b7", "ysrc": "abhi_plotly:56:cc6adb", "xaxis": "x", "yaxis": "y", "marker": { "color": "#EF553B", "pattern": { "shape": "" } }, "showlegend": true, "legendgroup": "DJ Bravo", "offsetgroup": "DJ Bravo", "orientation": "v", "textposition": "auto", "hovertemplate": "Player=%{x}<br>Wkts=%{y}<extra></extra>", "alignmentgroup": "True" }, { "name": "PP Chawla", "type": "bar", "xsrc": "abhi_plotly:56:90031e", "ysrc": "abhi_plotly:56:022826", "xaxis": "x", "yaxis": "y", "marker": { "color": "#00cc96", "pattern": { "shape": "" } }, "showlegend": true, "legendgroup": "PP Chawla", "offsetgroup": "PP Chawla", "orientation": "v", "textposition": "auto", "hovertemplate": "Player=%{x}<br>Wkts=%{y}<extra></extra>", "alignmentgroup": "True" }, { "name": "A Mishra", "type": "bar", "xsrc": "abhi_plotly:56:2f583f", "ysrc": "abhi_plotly:56:0555b9", "xaxis": "x", "yaxis": "y", "marker": { "color": "#ab63fa", "pattern": { "shape": "" } }, "showlegend": true, "legendgroup": "A Mishra", "offsetgroup": "A Mishra", "orientation": "v", "textposition": "auto", "hovertemplate": "Player=%{x}<br>Wkts=%{y}<extra></extra>", "alignmentgroup": "True" }, { "name": "R Ashwin", "type": "bar", "xsrc": "abhi_plotly:56:e52b68", "ysrc": "abhi_plotly:56:a9bd9a", "xaxis": "x", "yaxis": "y", "marker": { "color": "#FFA15A", "pattern": { "shape": "" } }, "showlegend": true, "legendgroup": "R Ashwin", "offsetgroup": "R Ashwin", "orientation": "v", "textposition": "auto", "hovertemplate": "Player=%{x}<br>Wkts=%{y}<extra></extra>", "alignmentgroup": "True" }, { "name": "SL Malinga", "type": "bar", "xsrc": "abhi_plotly:56:b92d33", "ysrc": "abhi_plotly:56:606797", "xaxis": "x", "yaxis": "y", "marker": { "color": "#19d3f3", "pattern": { "shape": "" } }, "showlegend": true, "legendgroup": "SL Malinga", "offsetgroup": "SL Malinga", "orientation": "v", "textposition": "auto", "hovertemplate": "Player=%{x}<br>Wkts=%{y}<extra></extra>", "alignmentgroup": "True" }, { "name": "B Kumar", "type": "bar", "xsrc": "abhi_plotly:56:008eb1", "ysrc": "abhi_plotly:56:bae0ed", "xaxis": "x", "yaxis": "y", "marker": { "color": "#FF6692", "pattern": { "shape": "" } }, "showlegend": true, "legendgroup": "B Kumar", "offsetgroup": "B Kumar", "orientation": "v", "textposition": "auto", "hovertemplate": "Player=%{x}<br>Wkts=%{y}<extra></extra>", "alignmentgroup": "True" }, { "name": "SP Narine", "type": "bar", "xsrc": "abhi_plotly:56:4129aa", "ysrc": "abhi_plotly:56:0e3d41", "xaxis": "x", "yaxis": "y", "marker": { "color": "#B6E880", "pattern": { "shape": "" } }, "showlegend": true, "legendgroup": "SP Narine", "offsetgroup": "SP Narine", "orientation": "v", "textposition": "auto", "hovertemplate": "Player=%{x}<br>Wkts=%{y}<extra></extra>", "alignmentgroup": "True" }, { "name": "RA Jadeja", "type": "bar", "xsrc": "abhi_plotly:56:0b8891", "ysrc": "abhi_plotly:56:49f8c6", "xaxis": "x", "yaxis": "y", "marker": { "color": "#FF97FF", "pattern": { "shape": "" } }, "showlegend": true, "legendgroup": "RA Jadeja", "offsetgroup": "RA Jadeja", "orientation": "v", "textposition": "auto", "hovertemplate": "Player=%{x}<br>Wkts=%{y}<extra></extra>", "alignmentgroup": "True" }, { "name": "Harbhajan Singh", "type": "bar", "xsrc": "abhi_plotly:56:a20e7f", "ysrc": "abhi_plotly:56:9e687e", "xaxis": "x", "yaxis": "y", "marker": { "color": "#FECB52", "pattern": { "shape": "" } }, "showlegend": true, "legendgroup": "Harbhajan Singh", "offsetgroup": "Harbhajan Singh", "orientation": "v", "textposition": "auto", "hovertemplate": "Player=%{x}<br>Wkts=%{y}<extra></extra>", "alignmentgroup": "True" }, { "name": "JJ Bumrah", "type": "bar", "xsrc": "abhi_plotly:56:5be4d8", "ysrc": "abhi_plotly:56:1d405d", "xaxis": "x", "yaxis": "y", "marker": { "color": "#636efa", "pattern": { "shape": "" } }, "showlegend": true, "legendgroup": "JJ Bumrah", "offsetgroup": "JJ Bumrah", "orientation": "v", "textposition": "auto", "hovertemplate": "Player=%{x}<br>Wkts=%{y}<extra></extra>", "alignmentgroup": "True" }, { "name": "Rashid Khan", "type": "bar", "xsrc": "abhi_plotly:56:652b26", "ysrc": "abhi_plotly:56:e52d84", "xaxis": "x", "yaxis": "y", "marker": { "color": "#EF553B", "pattern": { "shape": "" } }, "showlegend": true, "legendgroup": "Rashid Khan", "offsetgroup": "Rashid Khan", "orientation": "v", "textposition": "auto", "hovertemplate": "Player=%{x}<br>Wkts=%{y}<extra></extra>", "alignmentgroup": "True" }, { "name": "UT Yadav", "type": "bar", "xsrc": "abhi_plotly:56:41eeaf", "ysrc": "abhi_plotly:56:d0ae1b", "xaxis": "x", "yaxis": "y", "marker": { "color": "#00cc96", "pattern": { "shape": "" } }, "showlegend": true, "legendgroup": "UT Yadav", "offsetgroup": "UT Yadav", "orientation": "v", "textposition": "auto", "hovertemplate": "Player=%{x}<br>Wkts=%{y}<extra></extra>", "alignmentgroup": "True" }, { "name": "Mohammed Shami", "type": "bar", "xsrc": "abhi_plotly:56:db37ad", "ysrc": "abhi_plotly:56:d98cad", "xaxis": "x", "yaxis": "y", "marker": { "color": "#ab63fa", "pattern": { "shape": "" } }, "showlegend": true, "legendgroup": "Mohammed Shami", "offsetgroup": "Mohammed Shami", "orientation": "v", "textposition": "auto", "hovertemplate": "Player=%{x}<br>Wkts=%{y}<extra></extra>", "alignmentgroup": "True" }, { "name": "Sandeep Sharma", "type": "bar", "xsrc": "abhi_plotly:56:e47e34", "ysrc": "abhi_plotly:56:3f939a", "xaxis": "x", "yaxis": "y", "marker": { "color": "#FFA15A", "pattern": { "shape": "" } }, "showlegend": true, "legendgroup": "Sandeep Sharma", "offsetgroup": "Sandeep Sharma", "orientation": "v", "textposition": "auto", "hovertemplate": "Player=%{x}<br>Wkts=%{y}<extra></extra>", "alignmentgroup": "True" } ], "layout": { "xaxis": { "title": { "text": "Player" }, "anchor": "y", "domain": [ 0.0, 1.0 ], "categoryarray": [ "YS Chahal", "DJ Bravo", "PP Chawla", "A Mishra", "R Ashwin", "SL Malinga", "B Kumar", "SP Narine", "RA Jadeja", "Harbhajan Singh", "JJ Bumrah", "Rashid Khan", "UT Yadav", "Mohammed Shami", "Sandeep Sharma" ], "categoryorder": "array" }, "yaxis": { "title": { "text": "Wkts" }, "anchor": "x", "domain": [ 0.0, 1.0 ] }, "legend": { "title": { "text": "Player" }, "tracegroupgap": 0 }, "margin": { "t": 60 }, "barmode": "relative", "template": { "data": { "bar": [ { "type": "bar", "marker": { "line": { "color": "#E5ECF6", "width": 0.5 }, "pattern": { "size": 10, "fillmode": "overlay", "solidity": 0.2 } }, "error_x": { "color": "#2a3f5f" }, "error_y": { "color": "#2a3f5f" } } ], "pie": [ { "type": "pie", "automargin": true } ], "table": [ { "type": "table", "cells": { "fill": { "color": "#EBF0F8" }, "line": { "color": "white" } }, "header": { "fill": { "color": "#C8D4E3" }, "line": { "color": "white" } } } ], "carpet": [ { "type": "carpet", "aaxis": { "gridcolor": "white", "linecolor": "white", "endlinecolor": "#2a3f5f", "minorgridcolor": "white", "startlinecolor": "#2a3f5f" }, "baxis": { "gridcolor": "white", "linecolor": "white", "endlinecolor": "#2a3f5f", "minorgridcolor": "white", "startlinecolor": "#2a3f5f" } } ], "mesh3d": [ { "type": "mesh3d", "colorbar": { "ticks": "", "outlinewidth": 0 } } ], "contour": [ { "type": "contour", "colorbar": { "ticks": "", "outlinewidth": 0 }, "colorscale": [ [ 0.0, "#0d0887" ], [ 0.1111111111111111, "#46039f" ], [ 0.2222222222222222, "#7201a8" ], [ 0.3333333333333333, "#9c179e" ], [ 0.4444444444444444, "#bd3786" ], [ 0.5555555555555556, "#d8576b" ], [ 0.6666666666666666, "#ed7953" ], [ 0.7777777777777778, "#fb9f3a" ], [ 0.8888888888888888, "#fdca26" ], [ 1.0, "#f0f921" ] ] } ], "heatmap": [ { "type": "heatmap", "colorbar": { "ticks": "", "outlinewidth": 0 }, "colorscale": [ [ 0.0, "#0d0887" ], [ 0.1111111111111111, "#46039f" ], [ 0.2222222222222222, "#7201a8" ], [ 0.3333333333333333, "#9c179e" ], [ 0.4444444444444444, "#bd3786" ], [ 0.5555555555555556, "#d8576b" ], [ 0.6666666666666666, "#ed7953" ], [ 0.7777777777777778, "#fb9f3a" ], [ 0.8888888888888888, "#fdca26" ], [ 1.0, "#f0f921" ] ] } ], "scatter": [ { "type": "scatter", "fillpattern": { "size": 10, "fillmode": "overlay", "solidity": 0.2 } } ], "surface": [ { "type": "surface", "colorbar": { "ticks": "", "outlinewidth": 0 }, "colorscale": [ [ 0.0, "#0d0887" ], [ 0.1111111111111111, "#46039f" ], [ 0.2222222222222222, "#7201a8" ], [ 0.3333333333333333, "#9c179e" ], [ 0.4444444444444444, "#bd3786" ], [ 0.5555555555555556, "#d8576b" ], [ 0.6666666666666666, "#ed7953" ], [ 0.7777777777777778, "#fb9f3a" ], [ 0.8888888888888888, "#fdca26" ], [ 1.0, "#f0f921" ] ] } ], "barpolar": [ { "type": "barpolar", "marker": { "line": { "color": "#E5ECF6", "width": 0.5 }, "pattern": { "size": 10, "fillmode": "overlay", "solidity": 0.2 } } } ], "heatmapgl": [ { "type": "heatmapgl", "colorbar": { "ticks": "", "outlinewidth": 0 }, "colorscale": [ [ 0.0, "#0d0887" ], [ 0.1111111111111111, "#46039f" ], [ 0.2222222222222222, "#7201a8" ], [ 0.3333333333333333, "#9c179e" ], [ 0.4444444444444444, "#bd3786" ], [ 0.5555555555555556, "#d8576b" ], [ 0.6666666666666666, "#ed7953" ], [ 0.7777777777777778, "#fb9f3a" ], [ 0.8888888888888888, "#fdca26" ], [ 1.0, "#f0f921" ] ] } ], "histogram": [ { "type": "histogram", "marker": { "pattern": { "size": 10, "fillmode": "overlay", "solidity": 0.2 } } } ], "parcoords": [ { "line": { "colorbar": { "ticks": "", "outlinewidth": 0 } }, "type": "parcoords" } ], "scatter3d": [ { "line": { "colorbar": { "ticks": "", "outlinewidth": 0 } }, "type": "scatter3d", "marker": { "colorbar": { "ticks": "", "outlinewidth": 0 } } } ], "scattergl": [ { "type": "scattergl", "marker": { "colorbar": { "ticks": "", "outlinewidth": 0 } } } ], "choropleth": [ { "type": "choropleth", "colorbar": { "ticks": "", "outlinewidth": 0 } } ], "scattergeo": [ { "type": "scattergeo", "marker": { "colorbar": { "ticks": "", "outlinewidth": 0 } } } ], "histogram2d": [ { "type": "histogram2d", "colorbar": { "ticks": "", "outlinewidth": 0 }, "colorscale": [ [ 0.0, "#0d0887" ], [ 0.1111111111111111, "#46039f" ], [ 0.2222222222222222, "#7201a8" ], [ 0.3333333333333333, "#9c179e" ], [ 0.4444444444444444, "#bd3786" ], [ 0.5555555555555556, "#d8576b" ], [ 0.6666666666666666, "#ed7953" ], [ 0.7777777777777778, "#fb9f3a" ], [ 0.8888888888888888, "#fdca26" ], [ 1.0, "#f0f921" ] ] } ], "scatterpolar": [ { "type": "scatterpolar", "marker": { "colorbar": { "ticks": "", "outlinewidth": 0 } } } ], "contourcarpet": [ { "type": "contourcarpet", "colorbar": { "ticks": "", "outlinewidth": 0 } } ], "scattercarpet": [ { "type": "scattercarpet", "marker": { "colorbar": { "ticks": "", "outlinewidth": 0 } } } ], "scattermapbox": [ { "type": "scattermapbox", "marker": { "colorbar": { "ticks": "", "outlinewidth": 0 } } } ], "scatterpolargl": [ { "type": "scatterpolargl", "marker": { "colorbar": { "ticks": "", "outlinewidth": 0 } } } ], "scatterternary": [ { "type": "scatterternary", "marker": { "colorbar": { "ticks": "", "outlinewidth": 0 } } } ], "histogram2dcontour": [ { "type": "histogram2dcontour", "colorbar": { "ticks": "", "outlinewidth": 0 }, "colorscale": [ [ 0.0, "#0d0887" ], [ 0.1111111111111111, "#46039f" ], [ 0.2222222222222222, "#7201a8" ], [ 0.3333333333333333, "#9c179e" ], [ 0.4444444444444444, "#bd3786" ], [ 0.5555555555555556, "#d8576b" ], [ 0.6666666666666666, "#ed7953" ], [ 0.7777777777777778, "#fb9f3a" ], [ 0.8888888888888888, "#fdca26" ], [ 1.0, "#f0f921" ] ] } ] }, "layout": { "geo": { "bgcolor": "white", "showland": true, "lakecolor": "white", "landcolor": "#E5ECF6", "showlakes": true, "subunitcolor": "white" }, "font": { "color": "#2a3f5f" }, "polar": { "bgcolor": "#E5ECF6", "radialaxis": { "ticks": "", "gridcolor": "white", "linecolor": "white" }, "angularaxis": { "ticks": "", "gridcolor": "white", "linecolor": "white" } }, "scene": { "xaxis": { "ticks": "", "gridcolor": "white", "gridwidth": 2, "linecolor": "white", "zerolinecolor": "white", "showbackground": true, "backgroundcolor": "#E5ECF6" }, "yaxis": { "ticks": "", "gridcolor": "white", "gridwidth": 2, "linecolor": "white", "zerolinecolor": "white", "showbackground": true, "backgroundcolor": "#E5ECF6" }, "zaxis": { "ticks": "", "gridcolor": "white", "gridwidth": 2, "linecolor": "white", "zerolinecolor": "white", "showbackground": true, "backgroundcolor": "#E5ECF6" } }, "title": { "x": 0.05 }, "xaxis": { "ticks": "", "title": { "standoff": 15 }, "gridcolor": "white", "linecolor": "white", "automargin": true, "zerolinecolor": "white", "zerolinewidth": 2 }, "yaxis": { "ticks": "", "title": { "standoff": 15 }, "gridcolor": "white", "linecolor": "white", "automargin": true, "zerolinecolor": "white", "zerolinewidth": 2 }, "mapbox": { "style": "light" }, "ternary": { "aaxis": { "ticks": "", "gridcolor": "white", "linecolor": "white" }, "baxis": { "ticks": "", "gridcolor": "white", "linecolor": "white" }, "caxis": { "ticks": "", "gridcolor": "white", "linecolor": "white" }, "bgcolor": "#E5ECF6" }, "colorway": [ "#636efa", "#EF553B", "#00cc96", "#ab63fa", "#FFA15A", "#19d3f3", "#FF6692", "#B6E880", "#FF97FF", "#FECB52" ], "coloraxis": { "colorbar": { "ticks": "", "outlinewidth": 0 } }, "hovermode": "closest", "colorscale": { "diverging": [ [ 0, "#8e0152" ], [ 0.1, "#c51b7d" ], [ 0.2, "#de77ae" ], [ 0.3, "#f1b6da" ], [ 0.4, "#fde0ef" ], [ 0.5, "#f7f7f7" ], [ 0.6, "#e6f5d0" ], [ 0.7, "#b8e186" ], [ 0.8, "#7fbc41" ], [ 0.9, "#4d9221" ], [ 1, "#276419" ] ], "sequential": [ [ 0.0, "#0d0887" ], [ 0.1111111111111111, "#46039f" ], [ 0.2222222222222222, "#7201a8" ], [ 0.3333333333333333, "#9c179e" ], [ 0.4444444444444444, "#bd3786" ], [ 0.5555555555555556, "#d8576b" ], [ 0.6666666666666666, "#ed7953" ], [ 0.7777777777777778, "#fb9f3a" ], [ 0.8888888888888888, "#fdca26" ], [ 1.0, "#f0f921" ] ], "sequentialminus": [ [ 0.0, "#0d0887" ], [ 0.1111111111111111, "#46039f" ], [ 0.2222222222222222, "#7201a8" ], [ 0.3333333333333333, "#9c179e" ], [ 0.4444444444444444, "#bd3786" ], [ 0.5555555555555556, "#d8576b" ], [ 0.6666666666666666, "#ed7953" ], [ 0.7777777777777778, "#fb9f3a" ], [ 0.8888888888888888, "#fdca26" ], [ 1.0, "#f0f921" ] ] }, "hoverlabel": { "align": "left" }, "plot_bgcolor": "#E5ECF6", "paper_bgcolor": "white", "shapedefaults": { "line": { "color": "#2a3f5f" } }, "autotypenumbers": "strict", "annotationdefaults": { "arrowhead": 0, "arrowcolor": "#2a3f5f", "arrowwidth": 1 } } } } }, "height": null, "width": null, "user": { "profile_url": "https://chart-studio.plotly.com/~abhi_plotly", "avatar_url": "https://storage.googleapis.com/plotly-prod-profiles/23.jpg", "background_url": "https://storage.googleapis.com/plotly-prod-profiles/bg-10.jpg", "bio": "", "nickname": "", "website": "", "stream_tokens": null, "feature_set_id": null, "csrf_token": null, "date_joined": "2024-04-02 09:52:01", "mapbox_access_tokens": null, "has_password": null, "username": "abhi_plotly", "email": null, "is_active": null, "readonly": null, "is_dash_creator": null, "dash_created_count": null, "is_chart_creator": null, "charts_created_count": null } }, { "creation_time": "2024-04-02T10:42:44.773916Z", "comments": { "results": [], "count": 0 }, "parented": true, "embed_url": "https://chart-studio.plotly.com/~kirtisharma/198.embed", "fid": "kirtisharma:198", "filename": "plot from API (19)", "filetype": "plot", "img_url": "https://storage.googleapis.com/plotly-prod-images/kirtisharma/198/9_N0CVSMICDL241H9J9J58HYA8VDUSOI.png", "image_urls": { "default": "https://storage.googleapis.com/plotly-prod-images/kirtisharma/198/2_MIG82Q9PKYR9U3ZJD6E3OLJMGCHX81.png", "block-thumb": "https://storage.googleapis.com/plotly-prod-images/kirtisharma/198/8_4L10E9COTIY3XQHAINLP9IYUKJLSCQ.png", "list-thumb": "https://storage.googleapis.com/plotly-prod-images/kirtisharma/198/9_N0CVSMICDL241H9J9J58HYA8VDUSOI.png" }, "api_urls": { "files": "https://api.plotly.com/v2/files/kirtisharma:198", "plots": "https://api.plotly.com/v2/plots/kirtisharma:198", "parent": "https://api.plotly.com/v2/folders/home?user=kirtisharma" }, "owner": "kirtisharma", "parent": -1, "preview": "", "referencers": [], "references": [], "title": "RSSI", "views": 1, "web_url": "https://chart-studio.plotly.com/~kirtisharma/198/rssi/", "world_readable": true, "date_modified": "2024-04-02T10:42:45.052Z", "stars": { "results": [], "count": 0 }, "collaborators": { "results": [], "count": 0 }, "subfolder_count": null, "refresh_interval": null, "organize_view_url": "https://chart-studio.plotly.com/~kirtisharma/198/", "current_user_permission": "read", "is_theme": null, "is_template": null, "autosize": true, "caption": "", "figure": { "data": [ { "mode": "lines markers", "name": "RSSI", "type": "scatter", "xsrc": "kirtisharma:201:af6c50", "ysrc": "kirtisharma:201:2a982d" } ], "layout": {} }, "height": null, "width": null, "user": { "profile_url": "https://chart-studio.plotly.com/~kirtisharma", "avatar_url": "https://storage.googleapis.com/plotly-prod-profiles/25.jpg", "background_url": "https://storage.googleapis.com/plotly-prod-profiles/bg-12.jpg", "bio": "", "nickname": "", "website": "", "stream_tokens": null, "feature_set_id": null, "csrf_token": null, "date_joined": "2024-04-02 10:40:15", "mapbox_access_tokens": null, "has_password": null, "username": "kirtisharma", "email": null, "is_active": null, "readonly": null, "is_dash_creator": null, "dash_created_count": null, "is_chart_creator": null, "charts_created_count": null } } ] }
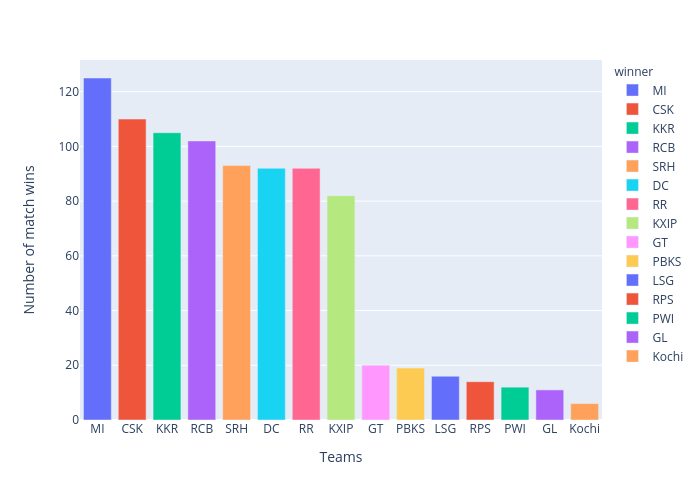
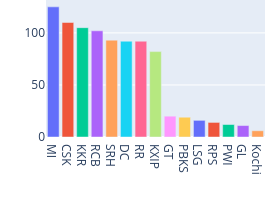
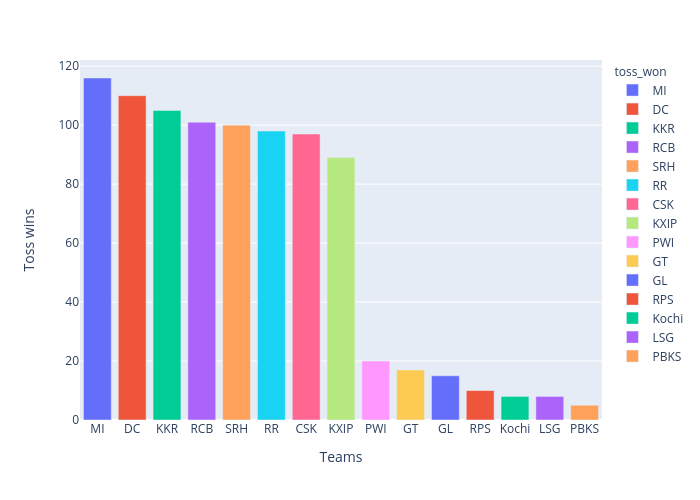
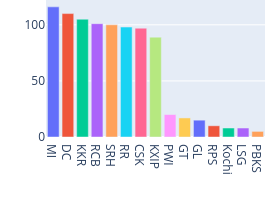
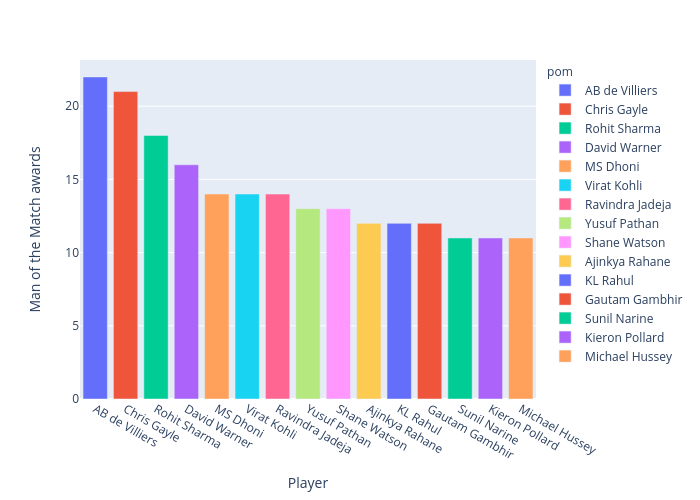
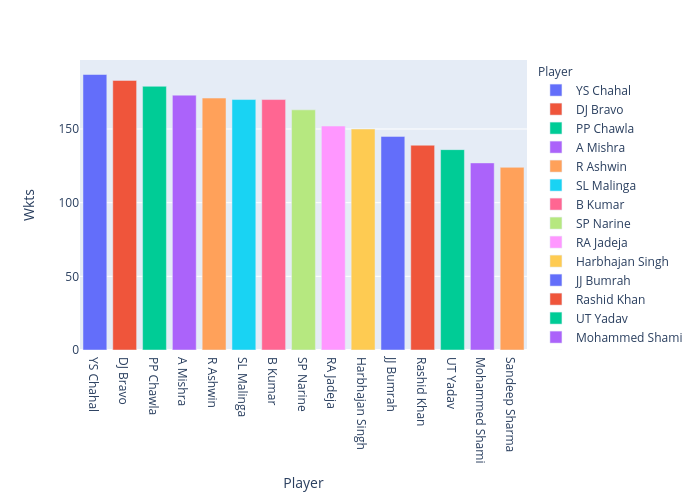