Plots List
Plots
This endpoint handles manipulation of Plotly plot files.
Reference
Authorization
Any user with or without a Plotly account may view public plots. For private plots, see authentication.
Actions
list
Listing all public plots can be done via a GET request to this endpoint.
By default, plots will be listed in order of date created. The order_by
query parameter is accepted at this endpoint. Currently, only ordering by
views is supported. It is possible to filter the plots by quality
with min_quality or max_quality as query parameter.
Example:
// GET https://api.plotly.com/v2/plots/ ---> 200

// GET https://api.plotly.com/v2/plots/?order_by=-views ---> 200

// GET https://api.plotly.com/v2/plots/?min_quality=5 ---> 200

// GET https://api.plotly.com/v2/plots/?max_quality=5 ---> 200
feed
Listing all handpicked feed plots can be done via a GET request to this endpoint. By default, plots will be listed in a random order.
Example:
// GET https://api.plotly.com/v2/plots/feed ---> 200
create
You can create new plot resources here. The only required field is 'figure'. Currently, the figure is restricted to only contain references to grid data. That is, this will fail if raw data arrays are passed in. To create and manipulate underlying grids for plots, see the grids endpoint.
Example:
// This fails because a figure field is required.
// POST https://api.plotly.com/v2/plots ---> 400 Bad Request
{}

// This fails because the figure has raw data
//POST https://api.plotly.com/v2/plots ---> 400 Bad Request
{
    "figure": {"data": [{"y": ['this', 'is', 'raw', 'data']}]}
}

// This succeeds because the figure has src keys, not raw data.
//POST https://api.plotly.com/v2/plots ---> 200 OK
{
    "figure": {"data": [{"ysrc": "sven:88:u8nd62"}]}
}
When creating a grid, you can optionally specify a source_fid to specify where a plot has come from:
- source_fid: the fid of a plot that was copied (and presumably edited) to produce this one
detail
There is a lot of meta information stored about plot files including filename, title, share_url, and content_url to name a few.
This information can only be reached with a GET to this endpoint.
Example:
// GET https://api.plotly.com/v2/plots/iheartgraphs:90
content
The contents of a plot can be downloaded via the content resource. The plot
content contains referenced grid/column data by default. If you wish to
return the raw grid/column data, the inline_data=true query must be included
in the request url. The Content-Type header will be appropriately set for the
response body.
Alternatively, you can set ?map_data=unreadable to append a mapping of
sources to data that belongs to grids which are unreadable for the
requestor. This is useful when you have read access to another users plot,
but that plot contains grid references which you don't have access to.
Examples:
// Returns referenced grid/column data
// GET https://api.plotly.com/v2/plots/iheartgraphs:90/content ---> 200 OK

// Returns full grid/column data
// GET https://api.plotly.com/v2/plots/iheartgraphs:90/content?inline_data=true ---> 200 OK

// Returns full grid/column data when requestor doesn't have permission
// to read the referenced grid.
// GET https://api.plotly.com/v2/plots/iheartgraphs:90/content?map_data=unreadable ---> 200 OK
GET /v2/plots?cursor=cj0xJnA9MjAyNC0wNC0wMiswOSUzQTEwJTNBNTYuMjAzNDY5JTJCMDAlM0EwMA%3D%3D&format=api
{ "next": "https://api.plot.ly/v2/plots?cursor=cD0yMDI0LTA0LTAyKzA5JTNBMjElM0ExMi45NTUwMjUlMkIwMCUzQTAw&format=api", "previous": "https://api.plot.ly/v2/plots?cursor=cj0xJnA9MjAyNC0wNC0wMisxMCUzQTMzJTNBMjEuNDA5MTk4JTJCMDAlM0EwMA%3D%3D&format=api", "results": [ { "creation_time": "2024-04-02T10:33:21.409198Z", "comments": { "results": [], "count": 0 }, "parented": true, "embed_url": "https://chart-studio.plotly.com/~kristin_24/3.embed", "fid": "kristin_24:3", "filename": "Plot 3", "filetype": "plot", "img_url": "https://storage.googleapis.com/plotly-prod-images/kristin_24/3/9_VOBDF1MOF5HKRRAWMEOK1DD39QVT4L.png", "image_urls": { "default": "https://storage.googleapis.com/plotly-prod-images/kristin_24/3/2_6Y7308JAI2YJOC0FNVOGV04HOZI2CC.png", "block-thumb": "https://storage.googleapis.com/plotly-prod-images/kristin_24/3/8_N7X37PHVHQLV93W6Z8AMF10RKLFLWQ.png", "list-thumb": "https://storage.googleapis.com/plotly-prod-images/kristin_24/3/9_VOBDF1MOF5HKRRAWMEOK1DD39QVT4L.png" }, "api_urls": { "files": "https://api.plotly.com/v2/files/kristin_24:3", "plots": "https://api.plotly.com/v2/plots/kristin_24:3", "parent": "https://api.plotly.com/v2/folders/home?user=kristin_24" }, "owner": "kristin_24", "parent": -1, "preview": "", "referencers": [], "references": [], "title": "", "views": 2, "web_url": "https://chart-studio.plotly.com/~kristin_24/3/", "world_readable": true, "date_modified": "2024-06-28T10:18:05.149Z", "stars": { "results": [], "count": 0 }, "collaborators": { "results": [], "count": 0 }, "subfolder_count": null, "refresh_interval": null, "organize_view_url": "https://chart-studio.plotly.com/~kristin_24/3/", "current_user_permission": "read", "is_theme": null, "is_template": false, "autosize": true, "caption": "", "figure": { "data": [ { "fill": "tozeroy", "line": { "dash": "solid", "color": "rgb(33, 33, 40)", "width": 2 }, "meta": { "columnNames": { "x": "A", "y": "B" } }, "mode": "lines", "name": "E<sub>PAR</sub> (Måsskjæret & Skarvøya)", "type": "scatter", "xsrc": "kristin_24:0:4574b8", "ysrc": "kristin_24:0:b62d48", "opacity": 0.8, "fillcolor": "rgba(220, 220, 228, 0.5)" }, { "line": { "dash": "dot", "color": "rgb(49, 131, 188)", "width": 5 }, "meta": { "columnNames": { "x": "A", "y": "B" } }, "mode": "lines", "name": "Temperature Måsskjæret", "type": "scatter", "xsrc": "kristin_24:1:384aec", "ysrc": "kristin_24:1:489534", "yaxis": "y2", "error_x": { "type": "percent", "color": "rgb(49, 131, 188)", "value": 10, "width": 4, "visible": false, "symmetric": true, "thickness": 2 }, "hoverlabel": { "align": "right" }, "stackgroup": null }, { "fill": "none", "line": { "dash": "dot", "color": "rgb(248, 131, 121)", "width": 5 }, "meta": { "columnNames": { "x": "A", "y": "B", "text": "A" } }, "mode": "lines", "name": "Temperature Skarvøya", "type": "scatter", "xsrc": "kristin_24:2:ecbfc8", "ysrc": "kristin_24:2:799cdc", "yaxis": "y2", "opacity": 1, "textsrc": "kristin_24:0:4574b8", "stackgroup": null } ], "frames": [], "layout": { "xaxis": { "side": "bottom", "type": "date", "range": [ "2022-10-08", "2023-08-21" ], "ticks": "outside", "title": { "font": { "size": 20 }, "text": "" }, "anchor": "y", "domain": [ 0, 1 ], "mirror": false, "showgrid": false, "showline": true, "tickfont": { "size": 23 }, "zeroline": false, "autorange": true, "linecolor": "rgb(52, 54, 56)", "linewidth": 2, "automargin": false, "fixedrange": false, "showspikes": false, "tickformat": "", "rangeslider": { "range": [ "2022-10-08", "2023-08-21" ], "yaxis": {}, "yaxis2": {}, "visible": false, "autorange": true }, "rangeselector": { "visible": false }, "showticklabels": true, "spikethickness": 5 }, "yaxis": { "side": "right", "type": "linear", "range": [ 0, 400 ], "ticks": "outside", "title": { "font": { "size": 24 }, "text": "E<sub>PAR </sub>(µmol m<sup>-2</sup> s<sup>-1</sup>)" }, "domain": [ 0, 1 ], "showgrid": false, "showline": true, "tickfont": { "size": 20 }, "zeroline": true, "autorange": false, "linecolor": "rgb(38, 38, 38)", "linewidth": 2, "tickangle": "auto", "showspikes": false, "spikethickness": 5 }, "legend": { "x": 0.26000000000000023, "y": 1.0048861283643893, "font": { "size": 20 }, "title": { "text": "<br>" }, "valign": "top", "xanchor": "right", "yanchor": "top", "traceorder": "normal" }, "yaxis2": { "side": "left", "type": "linear", "range": [ 0, 15.216666345555556 ], "ticks": "outside", "title": { "font": { "size": 24 }, "text": "Temperature (°C)" }, "domain": [ 0, 1 ], "showgrid": false, "showline": true, "tickfont": { "size": 20 }, "zeroline": false, "autorange": false, "linecolor": "rgb(39, 40, 41)", "linewidth": 2, "automargin": true, "fixedrange": false, "overlaying": "y", "showspikes": false, "spikethickness": 5 }, "autosize": true, "template": { "data": { "bar": [ { "type": "bar", "marker": { "colorbar": { "ticks": "", "outlinewidth": 0 } } } ], "table": [ { "type": "table", "cells": { "fill": { "color": "#EBF0F8" }, "line": { "color": "white" } }, "header": { "fill": { "color": "#C8D4E3" }, "line": { "color": "white" } } } ], "carpet": [ { "type": "carpet", "aaxis": { "gridcolor": "#C8D4E3", "linecolor": "#C8D4E3", "endlinecolor": "#2a3f5f", "minorgridcolor": "#C8D4E3", "startlinecolor": "#2a3f5f" }, "baxis": { "gridcolor": "#C8D4E3", "linecolor": "#C8D4E3", "endlinecolor": "#2a3f5f", "minorgridcolor": "#C8D4E3", "startlinecolor": "#2a3f5f" } } ], "mesh3d": [ { "type": "mesh3d", "colorbar": { "ticks": "", "outlinewidth": 0 } } ], "contour": [ { "type": "contour", "colorbar": { "ticks": "", "outlinewidth": 0 }, "autocolorscale": true } ], "heatmap": [ { "type": "heatmap", "colorbar": { "ticks": "", "outlinewidth": 0 }, "autocolorscale": true } ], "scatter": [ { "type": "scatter", "marker": { "colorbar": { "ticks": "", "outlinewidth": 0 } } } ], "surface": [ { "type": "surface", "colorbar": { "ticks": "", "outlinewidth": 0 } } ], "heatmapgl": [ { "type": "heatmapgl", "colorbar": { "ticks": "", "outlinewidth": 0 } } ], "histogram": [ { "type": "histogram", "marker": { "colorbar": { "ticks": "", "outlinewidth": 0 } } } ], "parcoords": [ { "line": { "colorbar": { "ticks": "", "outlinewidth": 0 } }, "type": "parcoords" } ], "scatter3d": [ { "type": "scatter3d", "marker": { "colorbar": { "ticks": "", "outlinewidth": 0 } } } ], "scattergl": [ { "type": "scattergl", "marker": { "colorbar": { "ticks": "", "outlinewidth": 0 } } } ], "choropleth": [ { "type": "choropleth", "colorbar": { "ticks": "", "outlinewidth": 0 } } ], "scattergeo": [ { "type": "scattergeo", "marker": { "colorbar": { "ticks": "", "outlinewidth": 0 } } } ], "histogram2d": [ { "type": "histogram2d", "colorbar": { "ticks": "", "outlinewidth": 0 }, "autocolorscale": true } ], "scatterpolar": [ { "type": "scatterpolar", "marker": { "colorbar": { "ticks": "", "outlinewidth": 0 } } } ], "contourcarpet": [ { "type": "contourcarpet", "colorbar": { "ticks": "", "outlinewidth": 0 } } ], "scattercarpet": [ { "type": "scattercarpet", "marker": { "colorbar": { "ticks": "", "outlinewidth": 0 } } } ], "scattermapbox": [ { "type": "scattermapbox", "marker": { "colorbar": { "ticks": "", "outlinewidth": 0 } } } ], "scatterpolargl": [ { "type": "scatterpolargl", "marker": { "colorbar": { "ticks": "", "outlinewidth": 0 } } } ], "scatterternary": [ { "type": "scatterternary", "marker": { "colorbar": { "ticks": "", "outlinewidth": 0 } } } ], "histogram2dcontour": [ { "type": "histogram2dcontour", "colorbar": { "ticks": "", "outlinewidth": 0 }, "autocolorscale": true } ] }, "layout": { "geo": { "bgcolor": "white", "showland": true, "lakecolor": "white", "landcolor": "white", "showlakes": true, "subunitcolor": "#C8D4E3" }, "font": { "color": "#2a3f5f" }, "polar": { "bgcolor": "white", "radialaxis": { "ticks": "", "gridcolor": "#EBF0F8", "linecolor": "#EBF0F8" }, "angularaxis": { "ticks": "", "gridcolor": "#EBF0F8", "linecolor": "#EBF0F8" } }, "scene": { "xaxis": { "ticks": "", "gridcolor": "#DFE8F3", "gridwidth": 2, "linecolor": "#EBF0F8", "zerolinecolor": "#EBF0F8", "showbackground": true, "backgroundcolor": "white" }, "yaxis": { "ticks": "", "gridcolor": "#DFE8F3", "gridwidth": 2, "linecolor": "#EBF0F8", "zerolinecolor": "#EBF0F8", "showbackground": true, "backgroundcolor": "white" }, "zaxis": { "ticks": "", "gridcolor": "#DFE8F3", "gridwidth": 2, "linecolor": "#EBF0F8", "zerolinecolor": "#EBF0F8", "showbackground": true, "backgroundcolor": "white" } }, "title": { "x": 0.05 }, "xaxis": { "ticks": "", "gridcolor": "#EBF0F8", "linecolor": "#EBF0F8", "automargin": true, "zerolinecolor": "#EBF0F8", "zerolinewidth": 2 }, "yaxis": { "ticks": "", "gridcolor": "#EBF0F8", "linecolor": "#EBF0F8", "automargin": true, "zerolinecolor": "#EBF0F8", "zerolinewidth": 2 }, "ternary": { "aaxis": { "ticks": "", "gridcolor": "#DFE8F3", "linecolor": "#A2B1C6" }, "baxis": { "ticks": "", "gridcolor": "#DFE8F3", "linecolor": "#A2B1C6" }, "caxis": { "ticks": "", "gridcolor": "#DFE8F3", "linecolor": "#A2B1C6" }, "bgcolor": "white" }, "colorway": [ "#636efa", "#EF553B", "#00cc96", "#ab63fa", "#19d3f3", "#e763fa", "#fecb52", "#ffa15a", "#ff6692", "#b6e880" ], "hovermode": "closest", "colorscale": { "diverging": [ [ 0, "#8e0152" ], [ 0.1, "#c51b7d" ], [ 0.2, "#de77ae" ], [ 0.3, "#f1b6da" ], [ 0.4, "#fde0ef" ], [ 0.5, "#f7f7f7" ], [ 0.6, "#e6f5d0" ], [ 0.7, "#b8e186" ], [ 0.8, "#7fbc41" ], [ 0.9, "#4d9221" ], [ 1, "#276419" ] ], "sequential": [ [ 0, "#0508b8" ], [ 0.0893854748603352, "#1910d8" ], [ 0.1787709497206704, "#3c19f0" ], [ 0.2681564245810056, "#6b1cfb" ], [ 0.3575418994413408, "#981cfd" ], [ 0.44692737430167595, "#bf1cfd" ], [ 0.5363128491620112, "#dd2bfd" ], [ 0.6256983240223464, "#f246fe" ], [ 0.7150837988826816, "#fc67fd" ], [ 0.8044692737430168, "#fe88fc" ], [ 0.8938547486033519, "#fea5fd" ], [ 0.9832402234636871, "#febefe" ], [ 1, "#fec3fe" ] ], "sequentialminus": [ [ 0, "#0508b8" ], [ 0.0893854748603352, "#1910d8" ], [ 0.1787709497206704, "#3c19f0" ], [ 0.2681564245810056, "#6b1cfb" ], [ 0.3575418994413408, "#981cfd" ], [ 0.44692737430167595, "#bf1cfd" ], [ 0.5363128491620112, "#dd2bfd" ], [ 0.6256983240223464, "#f246fe" ], [ 0.7150837988826816, "#fc67fd" ], [ 0.8044692737430168, "#fe88fc" ], [ 0.8938547486033519, "#fea5fd" ], [ 0.9832402234636871, "#febefe" ], [ 1, "#fec3fe" ] ] }, "plot_bgcolor": "white", "paper_bgcolor": "white", "shapedefaults": { "line": { "width": 0 }, "opacity": 0.4, "fillcolor": "#506784" }, "annotationdefaults": { "arrowhead": 0, "arrowcolor": "#506784", "arrowwidth": 1 } }, "themeRef": "PLOTLY_WHITE" }, "showlegend": true } }, "height": null, "width": null, "user": { "profile_url": "https://chart-studio.plotly.com/~kristin_24", "avatar_url": "https://storage.googleapis.com/plotly-prod-profiles/21.jpg", "background_url": "https://storage.googleapis.com/plotly-prod-profiles/bg-14.jpg", "bio": "", "nickname": "", "website": "", "stream_tokens": null, "feature_set_id": null, "csrf_token": null, "date_joined": "2024-04-02 07:23:22", "mapbox_access_tokens": null, "has_password": null, "username": "kristin_24", "email": null, "is_active": null, "readonly": null, "is_dash_creator": null, "dash_created_count": null, "is_chart_creator": null, "charts_created_count": null } }, { "creation_time": "2024-04-02T10:32:52.563362Z", "comments": { "results": [], "count": 0 }, "parented": true, "embed_url": "https://chart-studio.plotly.com/~superpotato2812/7.embed", "fid": "superpotato2812:7", "filename": "Plot 7", "filetype": "plot", "img_url": "https://storage.googleapis.com/plotly-prod-images/superpotato2812/7/9_CJ8GLV5S3M7FJ1HE428TGJU58NRKWR.png", "image_urls": { "default": "https://storage.googleapis.com/plotly-prod-images/superpotato2812/7/2_MEB6ZJ307B0A46W92JZ4KVVAB556SK.png", "block-thumb": "https://storage.googleapis.com/plotly-prod-images/superpotato2812/7/8_GFXKJJKHHP8Q88T92N75QEZD58S1IL.png", "list-thumb": "https://storage.googleapis.com/plotly-prod-images/superpotato2812/7/9_CJ8GLV5S3M7FJ1HE428TGJU58NRKWR.png" }, "api_urls": { "files": "https://api.plotly.com/v2/files/superpotato2812:7", "plots": "https://api.plotly.com/v2/plots/superpotato2812:7", "parent": "https://api.plotly.com/v2/folders/home?user=superpotato2812" }, "owner": "superpotato2812", "parent": -1, "preview": "", "referencers": [], "references": [], "title": "", "views": 1, "web_url": "https://chart-studio.plotly.com/~superpotato2812/7/", "world_readable": true, "date_modified": "2024-04-10T10:48:50.971Z", "stars": { "results": [], "count": 0 }, "collaborators": { "results": [], "count": 0 }, "subfolder_count": null, "refresh_interval": null, "organize_view_url": "https://chart-studio.plotly.com/~superpotato2812/7/", "current_user_permission": "read", "is_theme": null, "is_template": false, "autosize": true, "caption": "", "figure": { "data": [ { "meta": { "columnNames": { "x": "B", "y": "A", "text": "" } }, "mode": "markers", "type": "bar", "xsrc": "superpotato2812:6:ace759", "ysrc": "superpotato2812:6:b603a7", "hoverinfo": "x+y", "orientation": "h" } ], "frames": [], "layout": { "font": { "size": 28, "family": "Arial" }, "title": { "font": { "size": 35, "family": "Arial" }, "text": "Bearbeitungszeiten Szenario 5" }, "xaxis": { "type": "linear", "range": [ 0, 89.4578947368421 ], "title": { "font": { "size": 30, "family": "Arial" }, "text": "Bearbeitungszeit in Sekunden" }, "autorange": true }, "yaxis": { "type": "category", "range": [ -0.5, 1.5 ], "title": { "text": "" }, "autorange": true }, "bargap": 0.76, "barmode": "group", "autosize": true, "template": { "data": { "bar": [ { "type": "bar", "marker": { "colorbar": { "ticks": "", "outlinewidth": 0 } } } ], "table": [ { "type": "table", "cells": { "fill": { "color": "#EBF0F8" }, "line": { "color": "white" } }, "header": { "fill": { "color": "#C8D4E3" }, "line": { "color": "white" } } } ], "carpet": [ { "type": "carpet", "aaxis": { "gridcolor": "#C8D4E3", "linecolor": "#C8D4E3", "endlinecolor": "#2a3f5f", "minorgridcolor": "#C8D4E3", "startlinecolor": "#2a3f5f" }, "baxis": { "gridcolor": "#C8D4E3", "linecolor": "#C8D4E3", "endlinecolor": "#2a3f5f", "minorgridcolor": "#C8D4E3", "startlinecolor": "#2a3f5f" } } ], "mesh3d": [ { "type": "mesh3d", "colorbar": { "ticks": "", "outlinewidth": 0 } } ], "contour": [ { "type": "contour", "colorbar": { "ticks": "", "outlinewidth": 0 }, "autocolorscale": true } ], "heatmap": [ { "type": "heatmap", "colorbar": { "ticks": "", "outlinewidth": 0 }, "autocolorscale": true } ], "scatter": [ { "type": "scatter", "marker": { "colorbar": { "ticks": "", "outlinewidth": 0 } } } ], "surface": [ { "type": "surface", "colorbar": { "ticks": "", "outlinewidth": 0 } } ], "heatmapgl": [ { "type": "heatmapgl", "colorbar": { "ticks": "", "outlinewidth": 0 } } ], "histogram": [ { "type": "histogram", "marker": { "colorbar": { "ticks": "", "outlinewidth": 0 } } } ], "parcoords": [ { "line": { "colorbar": { "ticks": "", "outlinewidth": 0 } }, "type": "parcoords" } ], "scatter3d": [ { "type": "scatter3d", "marker": { "colorbar": { "ticks": "", "outlinewidth": 0 } } } ], "scattergl": [ { "type": "scattergl", "marker": { "colorbar": { "ticks": "", "outlinewidth": 0 } } } ], "choropleth": [ { "type": "choropleth", "colorbar": { "ticks": "", "outlinewidth": 0 } } ], "scattergeo": [ { "type": "scattergeo", "marker": { "colorbar": { "ticks": "", "outlinewidth": 0 } } } ], "histogram2d": [ { "type": "histogram2d", "colorbar": { "ticks": "", "outlinewidth": 0 }, "autocolorscale": true } ], "scatterpolar": [ { "type": "scatterpolar", "marker": { "colorbar": { "ticks": "", "outlinewidth": 0 } } } ], "contourcarpet": [ { "type": "contourcarpet", "colorbar": { "ticks": "", "outlinewidth": 0 } } ], "scattercarpet": [ { "type": "scattercarpet", "marker": { "colorbar": { "ticks": "", "outlinewidth": 0 } } } ], "scattermapbox": [ { "type": "scattermapbox", "marker": { "colorbar": { "ticks": "", "outlinewidth": 0 } } } ], "scatterpolargl": [ { "type": "scatterpolargl", "marker": { "colorbar": { "ticks": "", "outlinewidth": 0 } } } ], "scatterternary": [ { "type": "scatterternary", "marker": { "colorbar": { "ticks": "", "outlinewidth": 0 } } } ], "histogram2dcontour": [ { "type": "histogram2dcontour", "colorbar": { "ticks": "", "outlinewidth": 0 }, "autocolorscale": true } ] }, "layout": { "geo": { "bgcolor": "white", "showland": true, "lakecolor": "white", "landcolor": "white", "showlakes": true, "subunitcolor": "#C8D4E3" }, "font": { "color": "#2a3f5f" }, "polar": { "bgcolor": "white", "radialaxis": { "ticks": "", "gridcolor": "#EBF0F8", "linecolor": "#EBF0F8" }, "angularaxis": { "ticks": "", "gridcolor": "#EBF0F8", "linecolor": "#EBF0F8" } }, "scene": { "xaxis": { "ticks": "", "gridcolor": "#DFE8F3", "gridwidth": 2, "linecolor": "#EBF0F8", "zerolinecolor": "#EBF0F8", "showbackground": true, "backgroundcolor": "white" }, "yaxis": { "ticks": "", "gridcolor": "#DFE8F3", "gridwidth": 2, "linecolor": "#EBF0F8", "zerolinecolor": "#EBF0F8", "showbackground": true, "backgroundcolor": "white" }, "zaxis": { "ticks": "", "gridcolor": "#DFE8F3", "gridwidth": 2, "linecolor": "#EBF0F8", "zerolinecolor": "#EBF0F8", "showbackground": true, "backgroundcolor": "white" } }, "title": { "x": 0.05 }, "xaxis": { "ticks": "", "gridcolor": "#EBF0F8", "linecolor": "#EBF0F8", "automargin": true, "zerolinecolor": "#EBF0F8", "zerolinewidth": 2 }, "yaxis": { "ticks": "", "gridcolor": "#EBF0F8", "linecolor": "#EBF0F8", "automargin": true, "zerolinecolor": "#EBF0F8", "zerolinewidth": 2 }, "ternary": { "aaxis": { "ticks": "", "gridcolor": "#DFE8F3", "linecolor": "#A2B1C6" }, "baxis": { "ticks": "", "gridcolor": "#DFE8F3", "linecolor": "#A2B1C6" }, "caxis": { "ticks": "", "gridcolor": "#DFE8F3", "linecolor": "#A2B1C6" }, "bgcolor": "white" }, "colorway": [ "#636efa", "#EF553B", "#00cc96", "#ab63fa", "#19d3f3", "#e763fa", "#fecb52", "#ffa15a", "#ff6692", "#b6e880" ], "hovermode": "closest", "colorscale": { "diverging": [ [ 0, "#8e0152" ], [ 0.1, "#c51b7d" ], [ 0.2, "#de77ae" ], [ 0.3, "#f1b6da" ], [ 0.4, "#fde0ef" ], [ 0.5, "#f7f7f7" ], [ 0.6, "#e6f5d0" ], [ 0.7, "#b8e186" ], [ 0.8, "#7fbc41" ], [ 0.9, "#4d9221" ], [ 1, "#276419" ] ], "sequential": [ [ 0, "#0508b8" ], [ 0.0893854748603352, "#1910d8" ], [ 0.1787709497206704, "#3c19f0" ], [ 0.2681564245810056, "#6b1cfb" ], [ 0.3575418994413408, "#981cfd" ], [ 0.44692737430167595, "#bf1cfd" ], [ 0.5363128491620112, "#dd2bfd" ], [ 0.6256983240223464, "#f246fe" ], [ 0.7150837988826816, "#fc67fd" ], [ 0.8044692737430168, "#fe88fc" ], [ 0.8938547486033519, "#fea5fd" ], [ 0.9832402234636871, "#febefe" ], [ 1, "#fec3fe" ] ], "sequentialminus": [ [ 0, "#0508b8" ], [ 0.0893854748603352, "#1910d8" ], [ 0.1787709497206704, "#3c19f0" ], [ 0.2681564245810056, "#6b1cfb" ], [ 0.3575418994413408, "#981cfd" ], [ 0.44692737430167595, "#bf1cfd" ], [ 0.5363128491620112, "#dd2bfd" ], [ 0.6256983240223464, "#f246fe" ], [ 0.7150837988826816, "#fc67fd" ], [ 0.8044692737430168, "#fe88fc" ], [ 0.8938547486033519, "#fea5fd" ], [ 0.9832402234636871, "#febefe" ], [ 1, "#fec3fe" ] ] }, "plot_bgcolor": "white", "paper_bgcolor": "white", "shapedefaults": { "line": { "width": 0 }, "opacity": 0.4, "fillcolor": "#506784" }, "annotationdefaults": { "arrowhead": 0, "arrowcolor": "#506784", "arrowwidth": 1 } }, "themeRef": "PLOTLY_WHITE" } } }, "height": null, "width": null, "user": { "profile_url": "https://chart-studio.plotly.com/~superpotato2812", "avatar_url": "https://storage.googleapis.com/plotly-prod-profiles/53.jpg", "background_url": "https://storage.googleapis.com/plotly-prod-profiles/bg-5.jpg", "bio": "", "nickname": "", "website": "", "stream_tokens": null, "feature_set_id": null, "csrf_token": null, "date_joined": "2024-04-01 22:27:58", "mapbox_access_tokens": null, "has_password": null, "username": "superpotato2812", "email": null, "is_active": null, "readonly": null, "is_dash_creator": null, "dash_created_count": null, "is_chart_creator": null, "charts_created_count": null } }, { "creation_time": "2024-04-02T10:22:00.073161Z", "comments": { "results": [], "count": 0 }, "parented": true, "embed_url": "https://chart-studio.plotly.com/~fjgimeno/3.embed", "fid": "fjgimeno:3", "filename": "nodenodenode", "filetype": "plot", "img_url": "https://storage.googleapis.com/plotly-prod-images/fjgimeno/3/9_ZRBI0ZGQ6G1CWOJ9P9QGW9LY76X803.png", "image_urls": { "default": "https://storage.googleapis.com/plotly-prod-images/fjgimeno/3/2_DVBKGKF3E5Q8FA6686M8H2Z38IJ7HA.png", "block-thumb": "https://storage.googleapis.com/plotly-prod-images/fjgimeno/3/8_O1BWWXURTQ7AQ0I4436WQ6DYGY7CU2.png", "list-thumb": "https://storage.googleapis.com/plotly-prod-images/fjgimeno/3/9_ZRBI0ZGQ6G1CWOJ9P9QGW9LY76X803.png" }, "api_urls": { "files": "https://api.plotly.com/v2/files/fjgimeno:3", "plots": "https://api.plotly.com/v2/plots/fjgimeno:3", "parent": "https://api.plotly.com/v2/folders/home?user=fjgimeno" }, "owner": "fjgimeno", "parent": -1, "preview": "", "referencers": [], "references": [], "title": "", "views": 1, "web_url": "https://chart-studio.plotly.com/~fjgimeno/3/", "world_readable": true, "date_modified": "2024-04-02T10:25:24.318Z", "stars": { "results": [], "count": 0 }, "collaborators": { "results": [], "count": 0 }, "subfolder_count": null, "refresh_interval": null, "organize_view_url": "https://chart-studio.plotly.com/~fjgimeno/3/", "current_user_permission": "read", "is_theme": null, "is_template": null, "autosize": true, "caption": "", "figure": { "data": [ { "type": "bar", "xsrc": "fjgimeno:4:095a0b", "ysrc": "fjgimeno:4:71b569" } ], "layout": {} }, "height": null, "width": null, "user": { "profile_url": "https://chart-studio.plotly.com/~fjgimeno", "avatar_url": "https://storage.googleapis.com/plotly-prod-profiles/86.jpg", "background_url": "https://storage.googleapis.com/plotly-prod-profiles/bg-1.jpg", "bio": "", "nickname": "", "website": "", "stream_tokens": null, "feature_set_id": null, "csrf_token": null, "date_joined": "2024-04-02 10:01:58", "mapbox_access_tokens": null, "has_password": null, "username": "fjgimeno", "email": null, "is_active": null, "readonly": null, "is_dash_creator": null, "dash_created_count": null, "is_chart_creator": null, "charts_created_count": null } }, { "creation_time": "2024-04-02T10:19:05.278476Z", "comments": { "results": [], "count": 0 }, "parented": true, "embed_url": "https://chart-studio.plotly.com/~abhi_plotly/6.embed", "fid": "abhi_plotly:6", "filename": "Scorebytop10batsmen", "filetype": "plot", "img_url": "https://storage.googleapis.com/plotly-prod-images/abhi_plotly/6/9_RZ6KDX3C46GGV2911O772SKEP4C2O9.png", "image_urls": { "default": "https://storage.googleapis.com/plotly-prod-images/abhi_plotly/6/2_FVYEP9DLTUVEP2ES9FDQ35F9YGC8HS.png", "block-thumb": "https://storage.googleapis.com/plotly-prod-images/abhi_plotly/6/8_SF7UNBQZZ8TD6OHYGZ9J5EWW93ABX9.png", "list-thumb": "https://storage.googleapis.com/plotly-prod-images/abhi_plotly/6/9_RZ6KDX3C46GGV2911O772SKEP4C2O9.png" }, "api_urls": { "files": "https://api.plotly.com/v2/files/abhi_plotly:6", "plots": "https://api.plotly.com/v2/plots/abhi_plotly:6", "parent": "https://api.plotly.com/v2/folders/home?user=abhi_plotly" }, "owner": "abhi_plotly", "parent": -1, "preview": "", "referencers": [], "references": [], "title": "", "views": 81, "web_url": "https://chart-studio.plotly.com/~abhi_plotly/6/", "world_readable": true, "date_modified": "2024-04-02T16:56:10.019Z", "stars": { "results": [], "count": 0 }, "collaborators": { "results": [], "count": 0 }, "subfolder_count": null, "refresh_interval": null, "organize_view_url": "https://chart-studio.plotly.com/~abhi_plotly/6/", "current_user_permission": "read", "is_theme": null, "is_template": null, "autosize": true, "caption": "", "figure": { "data": [ { "name": "V Kohli", "type": "bar", "xsrc": "abhi_plotly:41:2d5064", "ysrc": "abhi_plotly:41:feff98", "xaxis": "x", "yaxis": "y", "marker": { "color": "#636efa", "pattern": { "shape": "" } }, "showlegend": true, "legendgroup": "V Kohli", "offsetgroup": "V Kohli", "orientation": "v", "textposition": "auto", "hovertemplate": "Player=%{x}<br>Runs=%{y}<extra></extra>", "alignmentgroup": "True" }, { "name": "S Dhawan", "type": "bar", "xsrc": "abhi_plotly:41:048f4d", "ysrc": "abhi_plotly:41:1f9ae8", "xaxis": "x", "yaxis": "y", "marker": { "color": "#EF553B", "pattern": { "shape": "" } }, "showlegend": true, "legendgroup": "S Dhawan", "offsetgroup": "S Dhawan", "orientation": "v", "textposition": "auto", "hovertemplate": "Player=%{x}<br>Runs=%{y}<extra></extra>", "alignmentgroup": "True" }, { "name": "DA Warner", "type": "bar", "xsrc": "abhi_plotly:41:ab3139", "ysrc": "abhi_plotly:41:2d454c", "xaxis": "x", "yaxis": "y", "marker": { "color": "#00cc96", "pattern": { "shape": "" } }, "showlegend": true, "legendgroup": "DA Warner", "offsetgroup": "DA Warner", "orientation": "v", "textposition": "auto", "hovertemplate": "Player=%{x}<br>Runs=%{y}<extra></extra>", "alignmentgroup": "True" }, { "name": "RG Sharma", "type": "bar", "xsrc": "abhi_plotly:41:b62969", "ysrc": "abhi_plotly:41:e4b1dd", "xaxis": "x", "yaxis": "y", "marker": { "color": "#ab63fa", "pattern": { "shape": "" } }, "showlegend": true, "legendgroup": "RG Sharma", "offsetgroup": "RG Sharma", "orientation": "v", "textposition": "auto", "hovertemplate": "Player=%{x}<br>Runs=%{y}<extra></extra>", "alignmentgroup": "True" }, { "name": "SK Raina", "type": "bar", "xsrc": "abhi_plotly:41:10ce74", "ysrc": "abhi_plotly:41:3224cb", "xaxis": "x", "yaxis": "y", "marker": { "color": "#FFA15A", "pattern": { "shape": "" } }, "showlegend": true, "legendgroup": "SK Raina", "offsetgroup": "SK Raina", "orientation": "v", "textposition": "auto", "hovertemplate": "Player=%{x}<br>Runs=%{y}<extra></extra>", "alignmentgroup": "True" }, { "name": "AB de Villiers", "type": "bar", "xsrc": "abhi_plotly:41:e828e4", "ysrc": "abhi_plotly:41:1c0b7b", "xaxis": "x", "yaxis": "y", "marker": { "color": "#19d3f3", "pattern": { "shape": "" } }, "showlegend": true, "legendgroup": "AB de Villiers", "offsetgroup": "AB de Villiers", "orientation": "v", "textposition": "auto", "hovertemplate": "Player=%{x}<br>Runs=%{y}<extra></extra>", "alignmentgroup": "True" }, { "name": "MS Dhoni", "type": "bar", "xsrc": "abhi_plotly:41:526c03", "ysrc": "abhi_plotly:41:4c0bc7", "xaxis": "x", "yaxis": "y", "marker": { "color": "#FF6692", "pattern": { "shape": "" } }, "showlegend": true, "legendgroup": "MS Dhoni", "offsetgroup": "MS Dhoni", "orientation": "v", "textposition": "auto", "hovertemplate": "Player=%{x}<br>Runs=%{y}<extra></extra>", "alignmentgroup": "True" }, { "name": "CH Gayle", "type": "bar", "xsrc": "abhi_plotly:41:c68bf1", "ysrc": "abhi_plotly:41:9df144", "xaxis": "x", "yaxis": "y", "marker": { "color": "#B6E880", "pattern": { "shape": "" } }, "showlegend": true, "legendgroup": "CH Gayle", "offsetgroup": "CH Gayle", "orientation": "v", "textposition": "auto", "hovertemplate": "Player=%{x}<br>Runs=%{y}<extra></extra>", "alignmentgroup": "True" }, { "name": "RV Uthappa", "type": "bar", "xsrc": "abhi_plotly:41:b801ee", "ysrc": "abhi_plotly:41:4bb51e", "xaxis": "x", "yaxis": "y", "marker": { "color": "#FF97FF", "pattern": { "shape": "" } }, "showlegend": true, "legendgroup": "RV Uthappa", "offsetgroup": "RV Uthappa", "orientation": "v", "textposition": "auto", "hovertemplate": "Player=%{x}<br>Runs=%{y}<extra></extra>", "alignmentgroup": "True" }, { "name": "KD Karthik", "type": "bar", "xsrc": "abhi_plotly:41:f517dd", "ysrc": "abhi_plotly:41:c05a0a", "xaxis": "x", "yaxis": "y", "marker": { "color": "#FECB52", "pattern": { "shape": "" } }, "showlegend": true, "legendgroup": "KD Karthik", "offsetgroup": "KD Karthik", "orientation": "v", "textposition": "auto", "hovertemplate": "Player=%{x}<br>Runs=%{y}<extra></extra>", "alignmentgroup": "True" }, { "name": "AM Rahane", "type": "bar", "xsrc": "abhi_plotly:41:d2ed3f", "ysrc": "abhi_plotly:41:d52cfa", "xaxis": "x", "yaxis": "y", "marker": { "color": "#636efa", "pattern": { "shape": "" } }, "showlegend": true, "legendgroup": "AM Rahane", "offsetgroup": "AM Rahane", "orientation": "v", "textposition": "auto", "hovertemplate": "Player=%{x}<br>Runs=%{y}<extra></extra>", "alignmentgroup": "True" }, { "name": "AT Rayudu", "type": "bar", "xsrc": "abhi_plotly:41:c4274b", "ysrc": "abhi_plotly:41:08286e", "xaxis": "x", "yaxis": "y", "marker": { "color": "#EF553B", "pattern": { "shape": "" } }, "showlegend": true, "legendgroup": "AT Rayudu", "offsetgroup": "AT Rayudu", "orientation": "v", "textposition": "auto", "hovertemplate": "Player=%{x}<br>Runs=%{y}<extra></extra>", "alignmentgroup": "True" }, { "name": "G Gambhir", "type": "bar", "xsrc": "abhi_plotly:41:7cb478", "ysrc": "abhi_plotly:41:a14db2", "xaxis": "x", "yaxis": "y", "marker": { "color": "#00cc96", "pattern": { "shape": "" } }, "showlegend": true, "legendgroup": "G Gambhir", "offsetgroup": "G Gambhir", "orientation": "v", "textposition": "auto", "hovertemplate": "Player=%{x}<br>Runs=%{y}<extra></extra>", "alignmentgroup": "True" }, { "name": "KL Rahul", "type": "bar", "xsrc": "abhi_plotly:41:038626", "ysrc": "abhi_plotly:41:82a055", "xaxis": "x", "yaxis": "y", "marker": { "color": "#ab63fa", "pattern": { "shape": "" } }, "showlegend": true, "legendgroup": "KL Rahul", "offsetgroup": "KL Rahul", "orientation": "v", "textposition": "auto", "hovertemplate": "Player=%{x}<br>Runs=%{y}<extra></extra>", "alignmentgroup": "True" }, { "name": "F du Plessis", "type": "bar", "xsrc": "abhi_plotly:41:314b41", "ysrc": "abhi_plotly:41:835292", "xaxis": "x", "yaxis": "y", "marker": { "color": "#FFA15A", "pattern": { "shape": "" } }, "showlegend": true, "legendgroup": "F du Plessis", "offsetgroup": "F du Plessis", "orientation": "v", "textposition": "auto", "hovertemplate": "Player=%{x}<br>Runs=%{y}<extra></extra>", "alignmentgroup": "True" } ], "layout": { "xaxis": { "title": { "text": "Player" }, "anchor": "y", "domain": [ 0.0, 1.0 ], "categoryarray": [ "V Kohli", "S Dhawan", "DA Warner", "RG Sharma", "SK Raina", "AB de Villiers", "MS Dhoni", "CH Gayle", "RV Uthappa", "KD Karthik", "AM Rahane", "AT Rayudu", "G Gambhir", "KL Rahul", "F du Plessis" ], "categoryorder": "array" }, "yaxis": { "title": { "text": "Runs" }, "anchor": "x", "domain": [ 0.0, 1.0 ] }, "legend": { "title": { "text": "Player" }, "tracegroupgap": 0 }, "margin": { "t": 60 }, "barmode": "relative", "template": { "data": { "bar": [ { "type": "bar", "marker": { "line": { "color": "#E5ECF6", "width": 0.5 }, "pattern": { "size": 10, "fillmode": "overlay", "solidity": 0.2 } }, "error_x": { "color": "#2a3f5f" }, "error_y": { "color": "#2a3f5f" } } ], "pie": [ { "type": "pie", "automargin": true } ], "table": [ { "type": "table", "cells": { "fill": { "color": "#EBF0F8" }, "line": { "color": "white" } }, "header": { "fill": { "color": "#C8D4E3" }, "line": { "color": "white" } } } ], "carpet": [ { "type": "carpet", "aaxis": { "gridcolor": "white", "linecolor": "white", "endlinecolor": "#2a3f5f", "minorgridcolor": "white", "startlinecolor": "#2a3f5f" }, "baxis": { "gridcolor": "white", "linecolor": "white", "endlinecolor": "#2a3f5f", "minorgridcolor": "white", "startlinecolor": "#2a3f5f" } } ], "mesh3d": [ { "type": "mesh3d", "colorbar": { "ticks": "", "outlinewidth": 0 } } ], "contour": [ { "type": "contour", "colorbar": { "ticks": "", "outlinewidth": 0 }, "colorscale": [ [ 0.0, "#0d0887" ], [ 0.1111111111111111, "#46039f" ], [ 0.2222222222222222, "#7201a8" ], [ 0.3333333333333333, "#9c179e" ], [ 0.4444444444444444, "#bd3786" ], [ 0.5555555555555556, "#d8576b" ], [ 0.6666666666666666, "#ed7953" ], [ 0.7777777777777778, "#fb9f3a" ], [ 0.8888888888888888, "#fdca26" ], [ 1.0, "#f0f921" ] ] } ], "heatmap": [ { "type": "heatmap", "colorbar": { "ticks": "", "outlinewidth": 0 }, "colorscale": [ [ 0.0, "#0d0887" ], [ 0.1111111111111111, "#46039f" ], [ 0.2222222222222222, "#7201a8" ], [ 0.3333333333333333, "#9c179e" ], [ 0.4444444444444444, "#bd3786" ], [ 0.5555555555555556, "#d8576b" ], [ 0.6666666666666666, "#ed7953" ], [ 0.7777777777777778, "#fb9f3a" ], [ 0.8888888888888888, "#fdca26" ], [ 1.0, "#f0f921" ] ] } ], "scatter": [ { "type": "scatter", "fillpattern": { "size": 10, "fillmode": "overlay", "solidity": 0.2 } } ], "surface": [ { "type": "surface", "colorbar": { "ticks": "", "outlinewidth": 0 }, "colorscale": [ [ 0.0, "#0d0887" ], [ 0.1111111111111111, "#46039f" ], [ 0.2222222222222222, "#7201a8" ], [ 0.3333333333333333, "#9c179e" ], [ 0.4444444444444444, "#bd3786" ], [ 0.5555555555555556, "#d8576b" ], [ 0.6666666666666666, "#ed7953" ], [ 0.7777777777777778, "#fb9f3a" ], [ 0.8888888888888888, "#fdca26" ], [ 1.0, "#f0f921" ] ] } ], "barpolar": [ { "type": "barpolar", "marker": { "line": { "color": "#E5ECF6", "width": 0.5 }, "pattern": { "size": 10, "fillmode": "overlay", "solidity": 0.2 } } } ], "heatmapgl": [ { "type": "heatmapgl", "colorbar": { "ticks": "", "outlinewidth": 0 }, "colorscale": [ [ 0.0, "#0d0887" ], [ 0.1111111111111111, "#46039f" ], [ 0.2222222222222222, "#7201a8" ], [ 0.3333333333333333, "#9c179e" ], [ 0.4444444444444444, "#bd3786" ], [ 0.5555555555555556, "#d8576b" ], [ 0.6666666666666666, "#ed7953" ], [ 0.7777777777777778, "#fb9f3a" ], [ 0.8888888888888888, "#fdca26" ], [ 1.0, "#f0f921" ] ] } ], "histogram": [ { "type": "histogram", "marker": { "pattern": { "size": 10, "fillmode": "overlay", "solidity": 0.2 } } } ], "parcoords": [ { "line": { "colorbar": { "ticks": "", "outlinewidth": 0 } }, "type": "parcoords" } ], "scatter3d": [ { "line": { "colorbar": { "ticks": "", "outlinewidth": 0 } }, "type": "scatter3d", "marker": { "colorbar": { "ticks": "", "outlinewidth": 0 } } } ], "scattergl": [ { "type": "scattergl", "marker": { "colorbar": { "ticks": "", "outlinewidth": 0 } } } ], "choropleth": [ { "type": "choropleth", "colorbar": { "ticks": "", "outlinewidth": 0 } } ], "scattergeo": [ { "type": "scattergeo", "marker": { "colorbar": { "ticks": "", "outlinewidth": 0 } } } ], "histogram2d": [ { "type": "histogram2d", "colorbar": { "ticks": "", "outlinewidth": 0 }, "colorscale": [ [ 0.0, "#0d0887" ], [ 0.1111111111111111, "#46039f" ], [ 0.2222222222222222, "#7201a8" ], [ 0.3333333333333333, "#9c179e" ], [ 0.4444444444444444, "#bd3786" ], [ 0.5555555555555556, "#d8576b" ], [ 0.6666666666666666, "#ed7953" ], [ 0.7777777777777778, "#fb9f3a" ], [ 0.8888888888888888, "#fdca26" ], [ 1.0, "#f0f921" ] ] } ], "scatterpolar": [ { "type": "scatterpolar", "marker": { "colorbar": { "ticks": "", "outlinewidth": 0 } } } ], "contourcarpet": [ { "type": "contourcarpet", "colorbar": { "ticks": "", "outlinewidth": 0 } } ], "scattercarpet": [ { "type": "scattercarpet", "marker": { "colorbar": { "ticks": "", "outlinewidth": 0 } } } ], "scattermapbox": [ { "type": "scattermapbox", "marker": { "colorbar": { "ticks": "", "outlinewidth": 0 } } } ], "scatterpolargl": [ { "type": "scatterpolargl", "marker": { "colorbar": { "ticks": "", "outlinewidth": 0 } } } ], "scatterternary": [ { "type": "scatterternary", "marker": { "colorbar": { "ticks": "", "outlinewidth": 0 } } } ], "histogram2dcontour": [ { "type": "histogram2dcontour", "colorbar": { "ticks": "", "outlinewidth": 0 }, "colorscale": [ [ 0.0, "#0d0887" ], [ 0.1111111111111111, "#46039f" ], [ 0.2222222222222222, "#7201a8" ], [ 0.3333333333333333, "#9c179e" ], [ 0.4444444444444444, "#bd3786" ], [ 0.5555555555555556, "#d8576b" ], [ 0.6666666666666666, "#ed7953" ], [ 0.7777777777777778, "#fb9f3a" ], [ 0.8888888888888888, "#fdca26" ], [ 1.0, "#f0f921" ] ] } ] }, "layout": { "geo": { "bgcolor": "white", "showland": true, "lakecolor": "white", "landcolor": "#E5ECF6", "showlakes": true, "subunitcolor": "white" }, "font": { "color": "#2a3f5f" }, "polar": { "bgcolor": "#E5ECF6", "radialaxis": { "ticks": "", "gridcolor": "white", "linecolor": "white" }, "angularaxis": { "ticks": "", "gridcolor": "white", "linecolor": "white" } }, "scene": { "xaxis": { "ticks": "", "gridcolor": "white", "gridwidth": 2, "linecolor": "white", "zerolinecolor": "white", "showbackground": true, "backgroundcolor": "#E5ECF6" }, "yaxis": { "ticks": "", "gridcolor": "white", "gridwidth": 2, "linecolor": "white", "zerolinecolor": "white", "showbackground": true, "backgroundcolor": "#E5ECF6" }, "zaxis": { "ticks": "", "gridcolor": "white", "gridwidth": 2, "linecolor": "white", "zerolinecolor": "white", "showbackground": true, "backgroundcolor": "#E5ECF6" } }, "title": { "x": 0.05 }, "xaxis": { "ticks": "", "title": { "standoff": 15 }, "gridcolor": "white", "linecolor": "white", "automargin": true, "zerolinecolor": "white", "zerolinewidth": 2 }, "yaxis": { "ticks": "", "title": { "standoff": 15 }, "gridcolor": "white", "linecolor": "white", "automargin": true, "zerolinecolor": "white", "zerolinewidth": 2 }, "mapbox": { "style": "light" }, "ternary": { "aaxis": { "ticks": "", "gridcolor": "white", "linecolor": "white" }, "baxis": { "ticks": "", "gridcolor": "white", "linecolor": "white" }, "caxis": { "ticks": "", "gridcolor": "white", "linecolor": "white" }, "bgcolor": "#E5ECF6" }, "colorway": [ "#636efa", "#EF553B", "#00cc96", "#ab63fa", "#FFA15A", "#19d3f3", "#FF6692", "#B6E880", "#FF97FF", "#FECB52" ], "coloraxis": { "colorbar": { "ticks": "", "outlinewidth": 0 } }, "hovermode": "closest", "colorscale": { "diverging": [ [ 0, "#8e0152" ], [ 0.1, "#c51b7d" ], [ 0.2, "#de77ae" ], [ 0.3, "#f1b6da" ], [ 0.4, "#fde0ef" ], [ 0.5, "#f7f7f7" ], [ 0.6, "#e6f5d0" ], [ 0.7, "#b8e186" ], [ 0.8, "#7fbc41" ], [ 0.9, "#4d9221" ], [ 1, "#276419" ] ], "sequential": [ [ 0.0, "#0d0887" ], [ 0.1111111111111111, "#46039f" ], [ 0.2222222222222222, "#7201a8" ], [ 0.3333333333333333, "#9c179e" ], [ 0.4444444444444444, "#bd3786" ], [ 0.5555555555555556, "#d8576b" ], [ 0.6666666666666666, "#ed7953" ], [ 0.7777777777777778, "#fb9f3a" ], [ 0.8888888888888888, "#fdca26" ], [ 1.0, "#f0f921" ] ], "sequentialminus": [ [ 0.0, "#0d0887" ], [ 0.1111111111111111, "#46039f" ], [ 0.2222222222222222, "#7201a8" ], [ 0.3333333333333333, "#9c179e" ], [ 0.4444444444444444, "#bd3786" ], [ 0.5555555555555556, "#d8576b" ], [ 0.6666666666666666, "#ed7953" ], [ 0.7777777777777778, "#fb9f3a" ], [ 0.8888888888888888, "#fdca26" ], [ 1.0, "#f0f921" ] ] }, "hoverlabel": { "align": "left" }, "plot_bgcolor": "#E5ECF6", "paper_bgcolor": "white", "shapedefaults": { "line": { "color": "#2a3f5f" } }, "autotypenumbers": "strict", "annotationdefaults": { "arrowhead": 0, "arrowcolor": "#2a3f5f", "arrowwidth": 1 } } } } }, "height": null, "width": null, "user": { "profile_url": "https://chart-studio.plotly.com/~abhi_plotly", "avatar_url": "https://storage.googleapis.com/plotly-prod-profiles/23.jpg", "background_url": "https://storage.googleapis.com/plotly-prod-profiles/bg-10.jpg", "bio": "", "nickname": "", "website": "", "stream_tokens": null, "feature_set_id": null, "csrf_token": null, "date_joined": "2024-04-02 09:52:01", "mapbox_access_tokens": null, "has_password": null, "username": "abhi_plotly", "email": null, "is_active": null, "readonly": null, "is_dash_creator": null, "dash_created_count": null, "is_chart_creator": null, "charts_created_count": null } }, { "creation_time": "2024-04-02T10:10:41.680333Z", "comments": { "results": [], "count": 0 }, "parented": true, "embed_url": "https://chart-studio.plotly.com/~abhi_plotly/3.embed", "fid": "abhi_plotly:3", "filename": "noOfWins", "filetype": "plot", "img_url": "https://storage.googleapis.com/plotly-prod-images/abhi_plotly/3/9_OUU9D53QPLODTKAREEO4Y4FHEUI5NG.png", "image_urls": { "default": "https://storage.googleapis.com/plotly-prod-images/abhi_plotly/3/2_1QOIBC60E9OGFY1AEX23SA23OXI3QW.png", "block-thumb": "https://storage.googleapis.com/plotly-prod-images/abhi_plotly/3/8_D79ZNFJ3SEYMNZ573IVTLSVFF6B0YS.png", "list-thumb": "https://storage.googleapis.com/plotly-prod-images/abhi_plotly/3/9_OUU9D53QPLODTKAREEO4Y4FHEUI5NG.png" }, "api_urls": { "files": "https://api.plotly.com/v2/files/abhi_plotly:3", "plots": "https://api.plotly.com/v2/plots/abhi_plotly:3", "parent": "https://api.plotly.com/v2/folders/home?user=abhi_plotly" }, "owner": "abhi_plotly", "parent": -1, "preview": "", "referencers": [], "references": [], "title": "", "views": 86, "web_url": "https://chart-studio.plotly.com/~abhi_plotly/3/", "world_readable": true, "date_modified": "2024-04-02T17:01:08.093Z", "stars": { "results": [], "count": 0 }, "collaborators": { "results": [], "count": 0 }, "subfolder_count": null, "refresh_interval": null, "organize_view_url": "https://chart-studio.plotly.com/~abhi_plotly/3/", "current_user_permission": "read", "is_theme": null, "is_template": null, "autosize": true, "caption": "", "figure": { "data": [ { "name": "Gujarat Titans", "type": "bar", "xsrc": "abhi_plotly:49:45f627", "ysrc": "abhi_plotly:49:e55836", "xaxis": "x", "yaxis": "y", "marker": { "color": "#636efa", "pattern": { "shape": "" } }, "showlegend": true, "legendgroup": "Gujarat Titans", "offsetgroup": "Gujarat Titans", "orientation": "v", "textposition": "auto", "hovertemplate": "Team=%{x}<br>Won=%{y}<extra></extra>", "alignmentgroup": "True" }, { "name": "Chennai Super Kings", "type": "bar", "xsrc": "abhi_plotly:49:ee1f19", "ysrc": "abhi_plotly:49:58a3d1", "xaxis": "x", "yaxis": "y", "marker": { "color": "#EF553B", "pattern": { "shape": "" } }, "showlegend": true, "legendgroup": "Chennai Super Kings", "offsetgroup": "Chennai Super Kings", "orientation": "v", "textposition": "auto", "hovertemplate": "Team=%{x}<br>Won=%{y}<extra></extra>", "alignmentgroup": "True" }, { "name": "Lucknow Super Giants", "type": "bar", "xsrc": "abhi_plotly:49:93739f", "ysrc": "abhi_plotly:49:270d32", "xaxis": "x", "yaxis": "y", "marker": { "color": "#00cc96", "pattern": { "shape": "" } }, "showlegend": true, "legendgroup": "Lucknow Super Giants", "offsetgroup": "Lucknow Super Giants", "orientation": "v", "textposition": "auto", "hovertemplate": "Team=%{x}<br>Won=%{y}<extra></extra>", "alignmentgroup": "True" }, { "name": "Mumbai Indians", "type": "bar", "xsrc": "abhi_plotly:49:b1da1e", "ysrc": "abhi_plotly:49:4e3064", "xaxis": "x", "yaxis": "y", "marker": { "color": "#ab63fa", "pattern": { "shape": "" } }, "showlegend": true, "legendgroup": "Mumbai Indians", "offsetgroup": "Mumbai Indians", "orientation": "v", "textposition": "auto", "hovertemplate": "Team=%{x}<br>Won=%{y}<extra></extra>", "alignmentgroup": "True" }, { "name": "Kolkata Knight Riders", "type": "bar", "xsrc": "abhi_plotly:49:4d29b2", "ysrc": "abhi_plotly:49:4bfdfc", "xaxis": "x", "yaxis": "y", "marker": { "color": "#FFA15A", "pattern": { "shape": "" } }, "showlegend": true, "legendgroup": "Kolkata Knight Riders", "offsetgroup": "Kolkata Knight Riders", "orientation": "v", "textposition": "auto", "hovertemplate": "Team=%{x}<br>Won=%{y}<extra></extra>", "alignmentgroup": "True" }, { "name": "Rajasthan Royals", "type": "bar", "xsrc": "abhi_plotly:49:fe406a", "ysrc": "abhi_plotly:49:832e7c", "xaxis": "x", "yaxis": "y", "marker": { "color": "#19d3f3", "pattern": { "shape": "" } }, "showlegend": true, "legendgroup": "Rajasthan Royals", "offsetgroup": "Rajasthan Royals", "orientation": "v", "textposition": "auto", "hovertemplate": "Team=%{x}<br>Won=%{y}<extra></extra>", "alignmentgroup": "True" }, { "name": "Rising Pune Supergiant", "type": "bar", "xsrc": "abhi_plotly:49:5103c8", "ysrc": "abhi_plotly:49:bbabb9", "xaxis": "x", "yaxis": "y", "marker": { "color": "#FF6692", "pattern": { "shape": "" } }, "showlegend": true, "legendgroup": "Rising Pune Supergiant", "offsetgroup": "Rising Pune Supergiant", "orientation": "v", "textposition": "auto", "hovertemplate": "Team=%{x}<br>Won=%{y}<extra></extra>", "alignmentgroup": "True" }, { "name": "Royal Challengers Bangalore", "type": "bar", "xsrc": "abhi_plotly:49:320aa1", "ysrc": "abhi_plotly:49:cfa003", "xaxis": "x", "yaxis": "y", "marker": { "color": "#B6E880", "pattern": { "shape": "" } }, "showlegend": true, "legendgroup": "Royal Challengers Bangalore", "offsetgroup": "Royal Challengers Bangalore", "orientation": "v", "textposition": "auto", "hovertemplate": "Team=%{x}<br>Won=%{y}<extra></extra>", "alignmentgroup": "True" }, { "name": "Sunrisers Hyderabad", "type": "bar", "xsrc": "abhi_plotly:49:7cfd98", "ysrc": "abhi_plotly:49:089526", "xaxis": "x", "yaxis": "y", "marker": { "color": "#FF97FF", "pattern": { "shape": "" } }, "showlegend": true, "legendgroup": "Sunrisers Hyderabad", "offsetgroup": "Sunrisers Hyderabad", "orientation": "v", "textposition": "auto", "hovertemplate": "Team=%{x}<br>Won=%{y}<extra></extra>", "alignmentgroup": "True" }, { "name": "Punjab Kings", "type": "bar", "xsrc": "abhi_plotly:49:14905d", "ysrc": "abhi_plotly:49:04f804", "xaxis": "x", "yaxis": "y", "marker": { "color": "#FECB52", "pattern": { "shape": "" } }, "showlegend": true, "legendgroup": "Punjab Kings", "offsetgroup": "Punjab Kings", "orientation": "v", "textposition": "auto", "hovertemplate": "Team=%{x}<br>Won=%{y}<extra></extra>", "alignmentgroup": "True" }, { "name": "Delhi Capitals", "type": "bar", "xsrc": "abhi_plotly:49:bf0b42", "ysrc": "abhi_plotly:49:336172", "xaxis": "x", "yaxis": "y", "marker": { "color": "#636efa", "pattern": { "shape": "" } }, "showlegend": true, "legendgroup": "Delhi Capitals", "offsetgroup": "Delhi Capitals", "orientation": "v", "textposition": "auto", "hovertemplate": "Team=%{x}<br>Won=%{y}<extra></extra>", "alignmentgroup": "True" }, { "name": "Gujarat Lions", "type": "bar", "xsrc": "abhi_plotly:49:c73cae", "ysrc": "abhi_plotly:49:165a15", "xaxis": "x", "yaxis": "y", "marker": { "color": "#EF553B", "pattern": { "shape": "" } }, "showlegend": true, "legendgroup": "Gujarat Lions", "offsetgroup": "Gujarat Lions", "orientation": "v", "textposition": "auto", "hovertemplate": "Team=%{x}<br>Won=%{y}<extra></extra>", "alignmentgroup": "True" }, { "name": "Kochi Tuskers Kerala", "type": "bar", "xsrc": "abhi_plotly:49:c2d3ab", "ysrc": "abhi_plotly:49:d5fa44", "xaxis": "x", "yaxis": "y", "marker": { "color": "#00cc96", "pattern": { "shape": "" } }, "showlegend": true, "legendgroup": "Kochi Tuskers Kerala", "offsetgroup": "Kochi Tuskers Kerala", "orientation": "v", "textposition": "auto", "hovertemplate": "Team=%{x}<br>Won=%{y}<extra></extra>", "alignmentgroup": "True" }, { "name": "Deccan Chargers", "type": "bar", "xsrc": "abhi_plotly:49:f6cee0", "ysrc": "abhi_plotly:49:b7b4c7", "xaxis": "x", "yaxis": "y", "marker": { "color": "#ab63fa", "pattern": { "shape": "" } }, "showlegend": true, "legendgroup": "Deccan Chargers", "offsetgroup": "Deccan Chargers", "orientation": "v", "textposition": "auto", "hovertemplate": "Team=%{x}<br>Won=%{y}<extra></extra>", "alignmentgroup": "True" }, { "name": "Pune Warriors", "type": "bar", "xsrc": "abhi_plotly:49:0997a9", "ysrc": "abhi_plotly:49:3d9e2a", "xaxis": "x", "yaxis": "y", "marker": { "color": "#FFA15A", "pattern": { "shape": "" } }, "showlegend": true, "legendgroup": "Pune Warriors", "offsetgroup": "Pune Warriors", "orientation": "v", "textposition": "auto", "hovertemplate": "Team=%{x}<br>Won=%{y}<extra></extra>", "alignmentgroup": "True" } ], "layout": { "xaxis": { "title": { "text": "Teams" }, "anchor": "y", "domain": [ 0.0, 1.0 ], "categoryarray": [ "Gujarat Titans", "Chennai Super Kings", "Lucknow Super Giants", "Mumbai Indians", "Kolkata Knight Riders", "Rajasthan Royals", "Rising Pune Supergiant", "Royal Challengers Bangalore", "Sunrisers Hyderabad", "Punjab Kings", "Delhi Capitals", "Gujarat Lions", "Kochi Tuskers Kerala", "Deccan Chargers", "Pune Warriors" ], "categoryorder": "array" }, "yaxis": { "title": { "text": "Wins" }, "anchor": "x", "domain": [ 0.0, 1.0 ] }, "legend": { "title": { "text": "Team" }, "tracegroupgap": 0 }, "margin": { "t": 60 }, "barmode": "relative", "template": { "data": { "bar": [ { "type": "bar", "marker": { "line": { "color": "#E5ECF6", "width": 0.5 }, "pattern": { "size": 10, "fillmode": "overlay", "solidity": 0.2 } }, "error_x": { "color": "#2a3f5f" }, "error_y": { "color": "#2a3f5f" } } ], "pie": [ { "type": "pie", "automargin": true } ], "table": [ { "type": "table", "cells": { "fill": { "color": "#EBF0F8" }, "line": { "color": "white" } }, "header": { "fill": { "color": "#C8D4E3" }, "line": { "color": "white" } } } ], "carpet": [ { "type": "carpet", "aaxis": { "gridcolor": "white", "linecolor": "white", "endlinecolor": "#2a3f5f", "minorgridcolor": "white", "startlinecolor": "#2a3f5f" }, "baxis": { "gridcolor": "white", "linecolor": "white", "endlinecolor": "#2a3f5f", "minorgridcolor": "white", "startlinecolor": "#2a3f5f" } } ], "mesh3d": [ { "type": "mesh3d", "colorbar": { "ticks": "", "outlinewidth": 0 } } ], "contour": [ { "type": "contour", "colorbar": { "ticks": "", "outlinewidth": 0 }, "colorscale": [ [ 0.0, "#0d0887" ], [ 0.1111111111111111, "#46039f" ], [ 0.2222222222222222, "#7201a8" ], [ 0.3333333333333333, "#9c179e" ], [ 0.4444444444444444, "#bd3786" ], [ 0.5555555555555556, "#d8576b" ], [ 0.6666666666666666, "#ed7953" ], [ 0.7777777777777778, "#fb9f3a" ], [ 0.8888888888888888, "#fdca26" ], [ 1.0, "#f0f921" ] ] } ], "heatmap": [ { "type": "heatmap", "colorbar": { "ticks": "", "outlinewidth": 0 }, "colorscale": [ [ 0.0, "#0d0887" ], [ 0.1111111111111111, "#46039f" ], [ 0.2222222222222222, "#7201a8" ], [ 0.3333333333333333, "#9c179e" ], [ 0.4444444444444444, "#bd3786" ], [ 0.5555555555555556, "#d8576b" ], [ 0.6666666666666666, "#ed7953" ], [ 0.7777777777777778, "#fb9f3a" ], [ 0.8888888888888888, "#fdca26" ], [ 1.0, "#f0f921" ] ] } ], "scatter": [ { "type": "scatter", "fillpattern": { "size": 10, "fillmode": "overlay", "solidity": 0.2 } } ], "surface": [ { "type": "surface", "colorbar": { "ticks": "", "outlinewidth": 0 }, "colorscale": [ [ 0.0, "#0d0887" ], [ 0.1111111111111111, "#46039f" ], [ 0.2222222222222222, "#7201a8" ], [ 0.3333333333333333, "#9c179e" ], [ 0.4444444444444444, "#bd3786" ], [ 0.5555555555555556, "#d8576b" ], [ 0.6666666666666666, "#ed7953" ], [ 0.7777777777777778, "#fb9f3a" ], [ 0.8888888888888888, "#fdca26" ], [ 1.0, "#f0f921" ] ] } ], "barpolar": [ { "type": "barpolar", "marker": { "line": { "color": "#E5ECF6", "width": 0.5 }, "pattern": { "size": 10, "fillmode": "overlay", "solidity": 0.2 } } } ], "heatmapgl": [ { "type": "heatmapgl", "colorbar": { "ticks": "", "outlinewidth": 0 }, "colorscale": [ [ 0.0, "#0d0887" ], [ 0.1111111111111111, "#46039f" ], [ 0.2222222222222222, "#7201a8" ], [ 0.3333333333333333, "#9c179e" ], [ 0.4444444444444444, "#bd3786" ], [ 0.5555555555555556, "#d8576b" ], [ 0.6666666666666666, "#ed7953" ], [ 0.7777777777777778, "#fb9f3a" ], [ 0.8888888888888888, "#fdca26" ], [ 1.0, "#f0f921" ] ] } ], "histogram": [ { "type": "histogram", "marker": { "pattern": { "size": 10, "fillmode": "overlay", "solidity": 0.2 } } } ], "parcoords": [ { "line": { "colorbar": { "ticks": "", "outlinewidth": 0 } }, "type": "parcoords" } ], "scatter3d": [ { "line": { "colorbar": { "ticks": "", "outlinewidth": 0 } }, "type": "scatter3d", "marker": { "colorbar": { "ticks": "", "outlinewidth": 0 } } } ], "scattergl": [ { "type": "scattergl", "marker": { "colorbar": { "ticks": "", "outlinewidth": 0 } } } ], "choropleth": [ { "type": "choropleth", "colorbar": { "ticks": "", "outlinewidth": 0 } } ], "scattergeo": [ { "type": "scattergeo", "marker": { "colorbar": { "ticks": "", "outlinewidth": 0 } } } ], "histogram2d": [ { "type": "histogram2d", "colorbar": { "ticks": "", "outlinewidth": 0 }, "colorscale": [ [ 0.0, "#0d0887" ], [ 0.1111111111111111, "#46039f" ], [ 0.2222222222222222, "#7201a8" ], [ 0.3333333333333333, "#9c179e" ], [ 0.4444444444444444, "#bd3786" ], [ 0.5555555555555556, "#d8576b" ], [ 0.6666666666666666, "#ed7953" ], [ 0.7777777777777778, "#fb9f3a" ], [ 0.8888888888888888, "#fdca26" ], [ 1.0, "#f0f921" ] ] } ], "scatterpolar": [ { "type": "scatterpolar", "marker": { "colorbar": { "ticks": "", "outlinewidth": 0 } } } ], "contourcarpet": [ { "type": "contourcarpet", "colorbar": { "ticks": "", "outlinewidth": 0 } } ], "scattercarpet": [ { "type": "scattercarpet", "marker": { "colorbar": { "ticks": "", "outlinewidth": 0 } } } ], "scattermapbox": [ { "type": "scattermapbox", "marker": { "colorbar": { "ticks": "", "outlinewidth": 0 } } } ], "scatterpolargl": [ { "type": "scatterpolargl", "marker": { "colorbar": { "ticks": "", "outlinewidth": 0 } } } ], "scatterternary": [ { "type": "scatterternary", "marker": { "colorbar": { "ticks": "", "outlinewidth": 0 } } } ], "histogram2dcontour": [ { "type": "histogram2dcontour", "colorbar": { "ticks": "", "outlinewidth": 0 }, "colorscale": [ [ 0.0, "#0d0887" ], [ 0.1111111111111111, "#46039f" ], [ 0.2222222222222222, "#7201a8" ], [ 0.3333333333333333, "#9c179e" ], [ 0.4444444444444444, "#bd3786" ], [ 0.5555555555555556, "#d8576b" ], [ 0.6666666666666666, "#ed7953" ], [ 0.7777777777777778, "#fb9f3a" ], [ 0.8888888888888888, "#fdca26" ], [ 1.0, "#f0f921" ] ] } ] }, "layout": { "geo": { "bgcolor": "white", "showland": true, "lakecolor": "white", "landcolor": "#E5ECF6", "showlakes": true, "subunitcolor": "white" }, "font": { "color": "#2a3f5f" }, "polar": { "bgcolor": "#E5ECF6", "radialaxis": { "ticks": "", "gridcolor": "white", "linecolor": "white" }, "angularaxis": { "ticks": "", "gridcolor": "white", "linecolor": "white" } }, "scene": { "xaxis": { "ticks": "", "gridcolor": "white", "gridwidth": 2, "linecolor": "white", "zerolinecolor": "white", "showbackground": true, "backgroundcolor": "#E5ECF6" }, "yaxis": { "ticks": "", "gridcolor": "white", "gridwidth": 2, "linecolor": "white", "zerolinecolor": "white", "showbackground": true, "backgroundcolor": "#E5ECF6" }, "zaxis": { "ticks": "", "gridcolor": "white", "gridwidth": 2, "linecolor": "white", "zerolinecolor": "white", "showbackground": true, "backgroundcolor": "#E5ECF6" } }, "title": { "x": 0.05 }, "xaxis": { "ticks": "", "title": { "standoff": 15 }, "gridcolor": "white", "linecolor": "white", "automargin": true, "zerolinecolor": "white", "zerolinewidth": 2 }, "yaxis": { "ticks": "", "title": { "standoff": 15 }, "gridcolor": "white", "linecolor": "white", "automargin": true, "zerolinecolor": "white", "zerolinewidth": 2 }, "mapbox": { "style": "light" }, "ternary": { "aaxis": { "ticks": "", "gridcolor": "white", "linecolor": "white" }, "baxis": { "ticks": "", "gridcolor": "white", "linecolor": "white" }, "caxis": { "ticks": "", "gridcolor": "white", "linecolor": "white" }, "bgcolor": "#E5ECF6" }, "colorway": [ "#636efa", "#EF553B", "#00cc96", "#ab63fa", "#FFA15A", "#19d3f3", "#FF6692", "#B6E880", "#FF97FF", "#FECB52" ], "coloraxis": { "colorbar": { "ticks": "", "outlinewidth": 0 } }, "hovermode": "closest", "colorscale": { "diverging": [ [ 0, "#8e0152" ], [ 0.1, "#c51b7d" ], [ 0.2, "#de77ae" ], [ 0.3, "#f1b6da" ], [ 0.4, "#fde0ef" ], [ 0.5, "#f7f7f7" ], [ 0.6, "#e6f5d0" ], [ 0.7, "#b8e186" ], [ 0.8, "#7fbc41" ], [ 0.9, "#4d9221" ], [ 1, "#276419" ] ], "sequential": [ [ 0.0, "#0d0887" ], [ 0.1111111111111111, "#46039f" ], [ 0.2222222222222222, "#7201a8" ], [ 0.3333333333333333, "#9c179e" ], [ 0.4444444444444444, "#bd3786" ], [ 0.5555555555555556, "#d8576b" ], [ 0.6666666666666666, "#ed7953" ], [ 0.7777777777777778, "#fb9f3a" ], [ 0.8888888888888888, "#fdca26" ], [ 1.0, "#f0f921" ] ], "sequentialminus": [ [ 0.0, "#0d0887" ], [ 0.1111111111111111, "#46039f" ], [ 0.2222222222222222, "#7201a8" ], [ 0.3333333333333333, "#9c179e" ], [ 0.4444444444444444, "#bd3786" ], [ 0.5555555555555556, "#d8576b" ], [ 0.6666666666666666, "#ed7953" ], [ 0.7777777777777778, "#fb9f3a" ], [ 0.8888888888888888, "#fdca26" ], [ 1.0, "#f0f921" ] ] }, "hoverlabel": { "align": "left" }, "plot_bgcolor": "#E5ECF6", "paper_bgcolor": "white", "shapedefaults": { "line": { "color": "#2a3f5f" } }, "autotypenumbers": "strict", "annotationdefaults": { "arrowhead": 0, "arrowcolor": "#2a3f5f", "arrowwidth": 1 } } } } }, "height": null, "width": null, "user": { "profile_url": "https://chart-studio.plotly.com/~abhi_plotly", "avatar_url": "https://storage.googleapis.com/plotly-prod-profiles/23.jpg", "background_url": "https://storage.googleapis.com/plotly-prod-profiles/bg-10.jpg", "bio": "", "nickname": "", "website": "", "stream_tokens": null, "feature_set_id": null, "csrf_token": null, "date_joined": "2024-04-02 09:52:01", "mapbox_access_tokens": null, "has_password": null, "username": "abhi_plotly", "email": null, "is_active": null, "readonly": null, "is_dash_creator": null, "dash_created_count": null, "is_chart_creator": null, "charts_created_count": null } }, { "creation_time": "2024-04-02T10:04:02.725784Z", "comments": { "results": [], "count": 0 }, "parented": true, "embed_url": "https://chart-studio.plotly.com/~fjgimeno/0.embed", "fid": "fjgimeno:0", "filename": "scatter-plot", "filetype": "plot", "img_url": "https://storage.googleapis.com/plotly-prod-images/fjgimeno/0/9_J92F9QRNQ9KOKGD7N7F18QFIA2SSEV.png", "image_urls": { "default": "https://storage.googleapis.com/plotly-prod-images/fjgimeno/0/2_WUYRWSKJEAKXWKQ9I0YK54Z75FGLXD.png", "block-thumb": "https://storage.googleapis.com/plotly-prod-images/fjgimeno/0/8_X66RJM0QTJI93RRB6W5A5TS1WYABYP.png", "list-thumb": "https://storage.googleapis.com/plotly-prod-images/fjgimeno/0/9_J92F9QRNQ9KOKGD7N7F18QFIA2SSEV.png" }, "api_urls": { "files": "https://api.plotly.com/v2/files/fjgimeno:0", "plots": "https://api.plotly.com/v2/plots/fjgimeno:0", "parent": "https://api.plotly.com/v2/folders/home?user=fjgimeno" }, "owner": "fjgimeno", "parent": -1, "preview": "", "referencers": [], "references": [], "title": "Gráfico de dispersión", "views": 1, "web_url": "https://chart-studio.plotly.com/~fjgimeno/0/grafico-de-dispersion/", "world_readable": true, "date_modified": "2024-04-02T10:19:28.089Z", "stars": { "results": [], "count": 0 }, "collaborators": { "results": [], "count": 0 }, "subfolder_count": null, "refresh_interval": null, "organize_view_url": "https://chart-studio.plotly.com/~fjgimeno/0/", "current_user_permission": "read", "is_theme": null, "is_template": null, "autosize": true, "caption": "", "figure": { "data": [ { "mode": "markers", "type": "scatter", "xsrc": "fjgimeno:1:6de192", "ysrc": "fjgimeno:1:078f7c" } ], "layout": { "title": "Gráfico de dispersión", "xaxis": { "title": "Eje X" }, "yaxis": { "title": "Eje Y" } } }, "height": null, "width": null, "user": { "profile_url": "https://chart-studio.plotly.com/~fjgimeno", "avatar_url": "https://storage.googleapis.com/plotly-prod-profiles/86.jpg", "background_url": "https://storage.googleapis.com/plotly-prod-profiles/bg-1.jpg", "bio": "", "nickname": "", "website": "", "stream_tokens": null, "feature_set_id": null, "csrf_token": null, "date_joined": "2024-04-02 10:01:58", "mapbox_access_tokens": null, "has_password": null, "username": "fjgimeno", "email": null, "is_active": null, "readonly": null, "is_dash_creator": null, "dash_created_count": null, "is_chart_creator": null, "charts_created_count": null } }, { "creation_time": "2024-04-02T09:58:12.454141Z", "comments": { "results": [], "count": 0 }, "parented": true, "embed_url": "https://chart-studio.plotly.com/~superpotato2812/5.embed", "fid": "superpotato2812:5", "filename": "Plot 5", "filetype": "plot", "img_url": "https://storage.googleapis.com/plotly-prod-images/superpotato2812/5/9_OSSULB3QTR0O32845C6KBTTOX1NWD7.png", "image_urls": { "default": "https://storage.googleapis.com/plotly-prod-images/superpotato2812/5/2_J9QUOE1Q5ER6SM62WOKLFLMW9O4H2H.png", "block-thumb": "https://storage.googleapis.com/plotly-prod-images/superpotato2812/5/8_JK5D0Y2TBJ9DLZB5KUWZKPJDA4UDTF.png", "list-thumb": "https://storage.googleapis.com/plotly-prod-images/superpotato2812/5/9_OSSULB3QTR0O32845C6KBTTOX1NWD7.png" }, "api_urls": { "files": "https://api.plotly.com/v2/files/superpotato2812:5", "plots": "https://api.plotly.com/v2/plots/superpotato2812:5", "parent": "https://api.plotly.com/v2/folders/home?user=superpotato2812" }, "owner": "superpotato2812", "parent": -1, "preview": "", "referencers": [], "references": [], "title": "", "views": 1, "web_url": "https://chart-studio.plotly.com/~superpotato2812/5/", "world_readable": true, "date_modified": "2024-04-15T12:12:57.790Z", "stars": { "results": [], "count": 0 }, "collaborators": { "results": [], "count": 0 }, "subfolder_count": null, "refresh_interval": null, "organize_view_url": "https://chart-studio.plotly.com/~superpotato2812/5/", "current_user_permission": "read", "is_theme": null, "is_template": false, "autosize": true, "caption": "", "figure": { "data": [ { "meta": { "columnNames": { "x": "G", "y": "F", "text": "", "marker": { "color": "" } } }, "mode": "lines", "name": "Child-Prozess", "type": "bar", "xsrc": "superpotato2812:4:7e1fcc", "ysrc": "superpotato2812:4:a5503e", "marker": { "meta": { "columnNames": { "color": "B" } }, "color": "#636efa" }, "visible": true, "hoverinfo": "x+y+text", "hoverlabel": { "align": "left" }, "orientation": "h", "autocolorscale": false }, { "meta": { "columnNames": { "x": "H", "y": "F" } }, "name": "Worker-Thread", "type": "bar", "xsrc": "superpotato2812:4:ec59f7", "ysrc": "superpotato2812:4:a5503e", "visible": true, "orientation": "h" } ], "frames": [], "layout": { "font": { "size": 28, "family": "Arial" }, "title": { "font": { "size": 35, "color": "rgb(3, 7, 15)" }, "text": "Bearbeitungszeiten Szenario 1-4 " }, "xaxis": { "type": "linear", "range": [ 0, 40.94631578947369 ], "title": { "font": { "size": 30 }, "text": "Bearbeitungszeit in Sekunden" }, "tickfont": { "size": 20 }, "autorange": true }, "yaxis": { "type": "category", "range": [ -0.5, 3.5 ], "title": { "text": "" }, "autorange": true }, "bargap": 0.5, "barmode": "group", "modebar": { "orientation": "h" }, "autosize": true, "template": { "data": { "bar": [ { "type": "bar", "marker": { "colorbar": { "ticks": "", "outlinewidth": 0 } } } ], "table": [ { "type": "table", "cells": { "fill": { "color": "#EBF0F8" }, "line": { "color": "white" } }, "header": { "fill": { "color": "#C8D4E3" }, "line": { "color": "white" } } } ], "carpet": [ { "type": "carpet", "aaxis": { "gridcolor": "#C8D4E3", "linecolor": "#C8D4E3", "endlinecolor": "#2a3f5f", "minorgridcolor": "#C8D4E3", "startlinecolor": "#2a3f5f" }, "baxis": { "gridcolor": "#C8D4E3", "linecolor": "#C8D4E3", "endlinecolor": "#2a3f5f", "minorgridcolor": "#C8D4E3", "startlinecolor": "#2a3f5f" } } ], "mesh3d": [ { "type": "mesh3d", "colorbar": { "ticks": "", "outlinewidth": 0 } } ], "contour": [ { "type": "contour", "colorbar": { "ticks": "", "outlinewidth": 0 }, "autocolorscale": true } ], "heatmap": [ { "type": "heatmap", "colorbar": { "ticks": "", "outlinewidth": 0 }, "autocolorscale": true } ], "scatter": [ { "type": "scatter", "marker": { "colorbar": { "ticks": "", "outlinewidth": 0 } } } ], "surface": [ { "type": "surface", "colorbar": { "ticks": "", "outlinewidth": 0 } } ], "heatmapgl": [ { "type": "heatmapgl", "colorbar": { "ticks": "", "outlinewidth": 0 } } ], "histogram": [ { "type": "histogram", "marker": { "colorbar": { "ticks": "", "outlinewidth": 0 } } } ], "parcoords": [ { "line": { "colorbar": { "ticks": "", "outlinewidth": 0 } }, "type": "parcoords" } ], "scatter3d": [ { "type": "scatter3d", "marker": { "colorbar": { "ticks": "", "outlinewidth": 0 } } } ], "scattergl": [ { "type": "scattergl", "marker": { "colorbar": { "ticks": "", "outlinewidth": 0 } } } ], "choropleth": [ { "type": "choropleth", "colorbar": { "ticks": "", "outlinewidth": 0 } } ], "scattergeo": [ { "type": "scattergeo", "marker": { "colorbar": { "ticks": "", "outlinewidth": 0 } } } ], "histogram2d": [ { "type": "histogram2d", "colorbar": { "ticks": "", "outlinewidth": 0 }, "autocolorscale": true } ], "scatterpolar": [ { "type": "scatterpolar", "marker": { "colorbar": { "ticks": "", "outlinewidth": 0 } } } ], "contourcarpet": [ { "type": "contourcarpet", "colorbar": { "ticks": "", "outlinewidth": 0 } } ], "scattercarpet": [ { "type": "scattercarpet", "marker": { "colorbar": { "ticks": "", "outlinewidth": 0 } } } ], "scattermapbox": [ { "type": "scattermapbox", "marker": { "colorbar": { "ticks": "", "outlinewidth": 0 } } } ], "scatterpolargl": [ { "type": "scatterpolargl", "marker": { "colorbar": { "ticks": "", "outlinewidth": 0 } } } ], "scatterternary": [ { "type": "scatterternary", "marker": { "colorbar": { "ticks": "", "outlinewidth": 0 } } } ], "histogram2dcontour": [ { "type": "histogram2dcontour", "colorbar": { "ticks": "", "outlinewidth": 0 }, "autocolorscale": true } ] }, "layout": { "geo": { "bgcolor": "white", "showland": true, "lakecolor": "white", "landcolor": "white", "showlakes": true, "subunitcolor": "#C8D4E3" }, "font": { "color": "#2a3f5f" }, "polar": { "bgcolor": "white", "radialaxis": { "ticks": "", "gridcolor": "#EBF0F8", "linecolor": "#EBF0F8" }, "angularaxis": { "ticks": "", "gridcolor": "#EBF0F8", "linecolor": "#EBF0F8" } }, "scene": { "xaxis": { "ticks": "", "gridcolor": "#DFE8F3", "gridwidth": 2, "linecolor": "#EBF0F8", "zerolinecolor": "#EBF0F8", "showbackground": true, "backgroundcolor": "white" }, "yaxis": { "ticks": "", "gridcolor": "#DFE8F3", "gridwidth": 2, "linecolor": "#EBF0F8", "zerolinecolor": "#EBF0F8", "showbackground": true, "backgroundcolor": "white" }, "zaxis": { "ticks": "", "gridcolor": "#DFE8F3", "gridwidth": 2, "linecolor": "#EBF0F8", "zerolinecolor": "#EBF0F8", "showbackground": true, "backgroundcolor": "white" } }, "title": { "x": 0.05 }, "xaxis": { "ticks": "", "gridcolor": "#EBF0F8", "linecolor": "#EBF0F8", "automargin": true, "zerolinecolor": "#EBF0F8", "zerolinewidth": 2 }, "yaxis": { "ticks": "", "gridcolor": "#EBF0F8", "linecolor": "#EBF0F8", "automargin": true, "zerolinecolor": "#EBF0F8", "zerolinewidth": 2 }, "ternary": { "aaxis": { "ticks": "", "gridcolor": "#DFE8F3", "linecolor": "#A2B1C6" }, "baxis": { "ticks": "", "gridcolor": "#DFE8F3", "linecolor": "#A2B1C6" }, "caxis": { "ticks": "", "gridcolor": "#DFE8F3", "linecolor": "#A2B1C6" }, "bgcolor": "white" }, "colorway": [ "#636efa", "#EF553B", "#00cc96", "#ab63fa", "#19d3f3", "#e763fa", "#fecb52", "#ffa15a", "#ff6692", "#b6e880" ], "hovermode": "closest", "colorscale": { "diverging": [ [ 0, "#8e0152" ], [ 0.1, "#c51b7d" ], [ 0.2, "#de77ae" ], [ 0.3, "#f1b6da" ], [ 0.4, "#fde0ef" ], [ 0.5, "#f7f7f7" ], [ 0.6, "#e6f5d0" ], [ 0.7, "#b8e186" ], [ 0.8, "#7fbc41" ], [ 0.9, "#4d9221" ], [ 1, "#276419" ] ], "sequential": [ [ 0, "#0508b8" ], [ 0.0893854748603352, "#1910d8" ], [ 0.1787709497206704, "#3c19f0" ], [ 0.2681564245810056, "#6b1cfb" ], [ 0.3575418994413408, "#981cfd" ], [ 0.44692737430167595, "#bf1cfd" ], [ 0.5363128491620112, "#dd2bfd" ], [ 0.6256983240223464, "#f246fe" ], [ 0.7150837988826816, "#fc67fd" ], [ 0.8044692737430168, "#fe88fc" ], [ 0.8938547486033519, "#fea5fd" ], [ 0.9832402234636871, "#febefe" ], [ 1, "#fec3fe" ] ], "sequentialminus": [ [ 0, "#0508b8" ], [ 0.0893854748603352, "#1910d8" ], [ 0.1787709497206704, "#3c19f0" ], [ 0.2681564245810056, "#6b1cfb" ], [ 0.3575418994413408, "#981cfd" ], [ 0.44692737430167595, "#bf1cfd" ], [ 0.5363128491620112, "#dd2bfd" ], [ 0.6256983240223464, "#f246fe" ], [ 0.7150837988826816, "#fc67fd" ], [ 0.8044692737430168, "#fe88fc" ], [ 0.8938547486033519, "#fea5fd" ], [ 0.9832402234636871, "#febefe" ], [ 1, "#fec3fe" ] ] }, "plot_bgcolor": "white", "paper_bgcolor": "white", "shapedefaults": { "line": { "width": 0 }, "opacity": 0.4, "fillcolor": "#506784" }, "annotationdefaults": { "arrowhead": 0, "arrowcolor": "#506784", "arrowwidth": 1 } }, "themeRef": "PLOTLY_WHITE" }, "bargroupgap": 0 } }, "height": null, "width": null, "user": { "profile_url": "https://chart-studio.plotly.com/~superpotato2812", "avatar_url": "https://storage.googleapis.com/plotly-prod-profiles/53.jpg", "background_url": "https://storage.googleapis.com/plotly-prod-profiles/bg-5.jpg", "bio": "", "nickname": "", "website": "", "stream_tokens": null, "feature_set_id": null, "csrf_token": null, "date_joined": "2024-04-01 22:27:58", "mapbox_access_tokens": null, "has_password": null, "username": "superpotato2812", "email": null, "is_active": null, "readonly": null, "is_dash_creator": null, "dash_created_count": null, "is_chart_creator": null, "charts_created_count": null } }, { "creation_time": "2024-04-02T09:57:23.290399Z", "comments": { "results": [], "count": 0 }, "parented": true, "embed_url": "https://chart-studio.plotly.com/~abhi_plotly/1.embed", "fid": "abhi_plotly:1", "filename": "IPLwins%", "filetype": "plot", "img_url": "https://storage.googleapis.com/plotly-prod-images/abhi_plotly/1/9_TLWE4E05HLBVM7606I0XZLPU7OBJAE.png", "image_urls": { "default": "https://storage.googleapis.com/plotly-prod-images/abhi_plotly/1/2_PEOODZCZR5H17NKN7J6T3EDJ2F9U5J.png", "block-thumb": "https://storage.googleapis.com/plotly-prod-images/abhi_plotly/1/8_97584U18SEYA9LNT8GNS522P43NHWW.png", "list-thumb": "https://storage.googleapis.com/plotly-prod-images/abhi_plotly/1/9_TLWE4E05HLBVM7606I0XZLPU7OBJAE.png" }, "api_urls": { "files": "https://api.plotly.com/v2/files/abhi_plotly:1", "plots": "https://api.plotly.com/v2/plots/abhi_plotly:1", "parent": "https://api.plotly.com/v2/folders/home?user=abhi_plotly" }, "owner": "abhi_plotly", "parent": -1, "preview": "", "referencers": [], "references": [], "title": "", "views": 124, "web_url": "https://chart-studio.plotly.com/~abhi_plotly/1/", "world_readable": true, "date_modified": "2024-04-02T17:01:04.353Z", "stars": { "results": [], "count": 0 }, "collaborators": { "results": [], "count": 0 }, "subfolder_count": null, "refresh_interval": null, "organize_view_url": "https://chart-studio.plotly.com/~abhi_plotly/1/", "current_user_permission": "read", "is_theme": null, "is_template": null, "autosize": true, "caption": "", "figure": { "data": [ { "name": "Gujarat Titans", "type": "bar", "xsrc": "abhi_plotly:48:e1d98b", "ysrc": "abhi_plotly:48:6d9a87", "xaxis": "x", "yaxis": "y", "marker": { "color": "#636efa", "pattern": { "shape": "" } }, "showlegend": true, "legendgroup": "Gujarat Titans", "offsetgroup": "Gujarat Titans", "orientation": "v", "textposition": "auto", "hovertemplate": "Team=%{x}<br>%W=%{y}<extra></extra>", "alignmentgroup": "True" }, { "name": "Chennai Super Kings", "type": "bar", "xsrc": "abhi_plotly:48:028567", "ysrc": "abhi_plotly:48:24719d", "xaxis": "x", "yaxis": "y", "marker": { "color": "#EF553B", "pattern": { "shape": "" } }, "showlegend": true, "legendgroup": "Chennai Super Kings", "offsetgroup": "Chennai Super Kings", "orientation": "v", "textposition": "auto", "hovertemplate": "Team=%{x}<br>%W=%{y}<extra></extra>", "alignmentgroup": "True" }, { "name": "Lucknow Super Giants", "type": "bar", "xsrc": "abhi_plotly:48:fb6d28", "ysrc": "abhi_plotly:48:0b5b6d", "xaxis": "x", "yaxis": "y", "marker": { "color": "#00cc96", "pattern": { "shape": "" } }, "showlegend": true, "legendgroup": "Lucknow Super Giants", "offsetgroup": "Lucknow Super Giants", "orientation": "v", "textposition": "auto", "hovertemplate": "Team=%{x}<br>%W=%{y}<extra></extra>", "alignmentgroup": "True" }, { "name": "Mumbai Indians", "type": "bar", "xsrc": "abhi_plotly:48:7ba08b", "ysrc": "abhi_plotly:48:17b791", "xaxis": "x", "yaxis": "y", "marker": { "color": "#ab63fa", "pattern": { "shape": "" } }, "showlegend": true, "legendgroup": "Mumbai Indians", "offsetgroup": "Mumbai Indians", "orientation": "v", "textposition": "auto", "hovertemplate": "Team=%{x}<br>%W=%{y}<extra></extra>", "alignmentgroup": "True" }, { "name": "Kolkata Knight Riders", "type": "bar", "xsrc": "abhi_plotly:48:b0166e", "ysrc": "abhi_plotly:48:7bf5b6", "xaxis": "x", "yaxis": "y", "marker": { "color": "#FFA15A", "pattern": { "shape": "" } }, "showlegend": true, "legendgroup": "Kolkata Knight Riders", "offsetgroup": "Kolkata Knight Riders", "orientation": "v", "textposition": "auto", "hovertemplate": "Team=%{x}<br>%W=%{y}<extra></extra>", "alignmentgroup": "True" }, { "name": "Rajasthan Royals", "type": "bar", "xsrc": "abhi_plotly:48:9bc6eb", "ysrc": "abhi_plotly:48:26cc92", "xaxis": "x", "yaxis": "y", "marker": { "color": "#19d3f3", "pattern": { "shape": "" } }, "showlegend": true, "legendgroup": "Rajasthan Royals", "offsetgroup": "Rajasthan Royals", "orientation": "v", "textposition": "auto", "hovertemplate": "Team=%{x}<br>%W=%{y}<extra></extra>", "alignmentgroup": "True" }, { "name": "Rising Pune Supergiant", "type": "bar", "xsrc": "abhi_plotly:48:8e4a10", "ysrc": "abhi_plotly:48:437033", "xaxis": "x", "yaxis": "y", "marker": { "color": "#FF6692", "pattern": { "shape": "" } }, "showlegend": true, "legendgroup": "Rising Pune Supergiant", "offsetgroup": "Rising Pune Supergiant", "orientation": "v", "textposition": "auto", "hovertemplate": "Team=%{x}<br>%W=%{y}<extra></extra>", "alignmentgroup": "True" }, { "name": "Royal Challengers Bangalore", "type": "bar", "xsrc": "abhi_plotly:48:39b822", "ysrc": "abhi_plotly:48:645d6e", "xaxis": "x", "yaxis": "y", "marker": { "color": "#B6E880", "pattern": { "shape": "" } }, "showlegend": true, "legendgroup": "Royal Challengers Bangalore", "offsetgroup": "Royal Challengers Bangalore", "orientation": "v", "textposition": "auto", "hovertemplate": "Team=%{x}<br>%W=%{y}<extra></extra>", "alignmentgroup": "True" }, { "name": "Sunrisers Hyderabad", "type": "bar", "xsrc": "abhi_plotly:48:e5650d", "ysrc": "abhi_plotly:48:9f5259", "xaxis": "x", "yaxis": "y", "marker": { "color": "#FF97FF", "pattern": { "shape": "" } }, "showlegend": true, "legendgroup": "Sunrisers Hyderabad", "offsetgroup": "Sunrisers Hyderabad", "orientation": "v", "textposition": "auto", "hovertemplate": "Team=%{x}<br>%W=%{y}<extra></extra>", "alignmentgroup": "True" }, { "name": "Punjab Kings", "type": "bar", "xsrc": "abhi_plotly:48:824c50", "ysrc": "abhi_plotly:48:e87c45", "xaxis": "x", "yaxis": "y", "marker": { "color": "#FECB52", "pattern": { "shape": "" } }, "showlegend": true, "legendgroup": "Punjab Kings", "offsetgroup": "Punjab Kings", "orientation": "v", "textposition": "auto", "hovertemplate": "Team=%{x}<br>%W=%{y}<extra></extra>", "alignmentgroup": "True" }, { "name": "Delhi Capitals", "type": "bar", "xsrc": "abhi_plotly:48:ddcf4f", "ysrc": "abhi_plotly:48:c63756", "xaxis": "x", "yaxis": "y", "marker": { "color": "#636efa", "pattern": { "shape": "" } }, "showlegend": true, "legendgroup": "Delhi Capitals", "offsetgroup": "Delhi Capitals", "orientation": "v", "textposition": "auto", "hovertemplate": "Team=%{x}<br>%W=%{y}<extra></extra>", "alignmentgroup": "True" }, { "name": "Gujarat Lions", "type": "bar", "xsrc": "abhi_plotly:48:19c9b4", "ysrc": "abhi_plotly:48:452cc9", "xaxis": "x", "yaxis": "y", "marker": { "color": "#EF553B", "pattern": { "shape": "" } }, "showlegend": true, "legendgroup": "Gujarat Lions", "offsetgroup": "Gujarat Lions", "orientation": "v", "textposition": "auto", "hovertemplate": "Team=%{x}<br>%W=%{y}<extra></extra>", "alignmentgroup": "True" }, { "name": "Kochi Tuskers Kerala", "type": "bar", "xsrc": "abhi_plotly:48:d7bae3", "ysrc": "abhi_plotly:48:a1c7a3", "xaxis": "x", "yaxis": "y", "marker": { "color": "#00cc96", "pattern": { "shape": "" } }, "showlegend": true, "legendgroup": "Kochi Tuskers Kerala", "offsetgroup": "Kochi Tuskers Kerala", "orientation": "v", "textposition": "auto", "hovertemplate": "Team=%{x}<br>%W=%{y}<extra></extra>", "alignmentgroup": "True" }, { "name": "Deccan Chargers", "type": "bar", "xsrc": "abhi_plotly:48:89d3fd", "ysrc": "abhi_plotly:48:2e71be", "xaxis": "x", "yaxis": "y", "marker": { "color": "#ab63fa", "pattern": { "shape": "" } }, "showlegend": true, "legendgroup": "Deccan Chargers", "offsetgroup": "Deccan Chargers", "orientation": "v", "textposition": "auto", "hovertemplate": "Team=%{x}<br>%W=%{y}<extra></extra>", "alignmentgroup": "True" }, { "name": "Pune Warriors", "type": "bar", "xsrc": "abhi_plotly:48:4cac86", "ysrc": "abhi_plotly:48:11c179", "xaxis": "x", "yaxis": "y", "marker": { "color": "#FFA15A", "pattern": { "shape": "" } }, "showlegend": true, "legendgroup": "Pune Warriors", "offsetgroup": "Pune Warriors", "orientation": "v", "textposition": "auto", "hovertemplate": "Team=%{x}<br>%W=%{y}<extra></extra>", "alignmentgroup": "True" } ], "layout": { "xaxis": { "title": { "text": "Teams" }, "anchor": "y", "domain": [ 0.0, 1.0 ], "categoryarray": [ "Gujarat Titans", "Chennai Super Kings", "Lucknow Super Giants", "Mumbai Indians", "Kolkata Knight Riders", "Rajasthan Royals", "Rising Pune Supergiant", "Royal Challengers Bangalore", "Sunrisers Hyderabad", "Punjab Kings", "Delhi Capitals", "Gujarat Lions", "Kochi Tuskers Kerala", "Deccan Chargers", "Pune Warriors" ], "categoryorder": "array" }, "yaxis": { "title": { "text": "Win Percentage" }, "anchor": "x", "domain": [ 0.0, 1.0 ] }, "legend": { "title": { "text": "Team" }, "tracegroupgap": 0 }, "margin": { "t": 60 }, "barmode": "relative", "template": { "data": { "bar": [ { "type": "bar", "marker": { "line": { "color": "#E5ECF6", "width": 0.5 }, "pattern": { "size": 10, "fillmode": "overlay", "solidity": 0.2 } }, "error_x": { "color": "#2a3f5f" }, "error_y": { "color": "#2a3f5f" } } ], "pie": [ { "type": "pie", "automargin": true } ], "table": [ { "type": "table", "cells": { "fill": { "color": "#EBF0F8" }, "line": { "color": "white" } }, "header": { "fill": { "color": "#C8D4E3" }, "line": { "color": "white" } } } ], "carpet": [ { "type": "carpet", "aaxis": { "gridcolor": "white", "linecolor": "white", "endlinecolor": "#2a3f5f", "minorgridcolor": "white", "startlinecolor": "#2a3f5f" }, "baxis": { "gridcolor": "white", "linecolor": "white", "endlinecolor": "#2a3f5f", "minorgridcolor": "white", "startlinecolor": "#2a3f5f" } } ], "mesh3d": [ { "type": "mesh3d", "colorbar": { "ticks": "", "outlinewidth": 0 } } ], "contour": [ { "type": "contour", "colorbar": { "ticks": "", "outlinewidth": 0 }, "colorscale": [ [ 0.0, "#0d0887" ], [ 0.1111111111111111, "#46039f" ], [ 0.2222222222222222, "#7201a8" ], [ 0.3333333333333333, "#9c179e" ], [ 0.4444444444444444, "#bd3786" ], [ 0.5555555555555556, "#d8576b" ], [ 0.6666666666666666, "#ed7953" ], [ 0.7777777777777778, "#fb9f3a" ], [ 0.8888888888888888, "#fdca26" ], [ 1.0, "#f0f921" ] ] } ], "heatmap": [ { "type": "heatmap", "colorbar": { "ticks": "", "outlinewidth": 0 }, "colorscale": [ [ 0.0, "#0d0887" ], [ 0.1111111111111111, "#46039f" ], [ 0.2222222222222222, "#7201a8" ], [ 0.3333333333333333, "#9c179e" ], [ 0.4444444444444444, "#bd3786" ], [ 0.5555555555555556, "#d8576b" ], [ 0.6666666666666666, "#ed7953" ], [ 0.7777777777777778, "#fb9f3a" ], [ 0.8888888888888888, "#fdca26" ], [ 1.0, "#f0f921" ] ] } ], "scatter": [ { "type": "scatter", "fillpattern": { "size": 10, "fillmode": "overlay", "solidity": 0.2 } } ], "surface": [ { "type": "surface", "colorbar": { "ticks": "", "outlinewidth": 0 }, "colorscale": [ [ 0.0, "#0d0887" ], [ 0.1111111111111111, "#46039f" ], [ 0.2222222222222222, "#7201a8" ], [ 0.3333333333333333, "#9c179e" ], [ 0.4444444444444444, "#bd3786" ], [ 0.5555555555555556, "#d8576b" ], [ 0.6666666666666666, "#ed7953" ], [ 0.7777777777777778, "#fb9f3a" ], [ 0.8888888888888888, "#fdca26" ], [ 1.0, "#f0f921" ] ] } ], "barpolar": [ { "type": "barpolar", "marker": { "line": { "color": "#E5ECF6", "width": 0.5 }, "pattern": { "size": 10, "fillmode": "overlay", "solidity": 0.2 } } } ], "heatmapgl": [ { "type": "heatmapgl", "colorbar": { "ticks": "", "outlinewidth": 0 }, "colorscale": [ [ 0.0, "#0d0887" ], [ 0.1111111111111111, "#46039f" ], [ 0.2222222222222222, "#7201a8" ], [ 0.3333333333333333, "#9c179e" ], [ 0.4444444444444444, "#bd3786" ], [ 0.5555555555555556, "#d8576b" ], [ 0.6666666666666666, "#ed7953" ], [ 0.7777777777777778, "#fb9f3a" ], [ 0.8888888888888888, "#fdca26" ], [ 1.0, "#f0f921" ] ] } ], "histogram": [ { "type": "histogram", "marker": { "pattern": { "size": 10, "fillmode": "overlay", "solidity": 0.2 } } } ], "parcoords": [ { "line": { "colorbar": { "ticks": "", "outlinewidth": 0 } }, "type": "parcoords" } ], "scatter3d": [ { "line": { "colorbar": { "ticks": "", "outlinewidth": 0 } }, "type": "scatter3d", "marker": { "colorbar": { "ticks": "", "outlinewidth": 0 } } } ], "scattergl": [ { "type": "scattergl", "marker": { "colorbar": { "ticks": "", "outlinewidth": 0 } } } ], "choropleth": [ { "type": "choropleth", "colorbar": { "ticks": "", "outlinewidth": 0 } } ], "scattergeo": [ { "type": "scattergeo", "marker": { "colorbar": { "ticks": "", "outlinewidth": 0 } } } ], "histogram2d": [ { "type": "histogram2d", "colorbar": { "ticks": "", "outlinewidth": 0 }, "colorscale": [ [ 0.0, "#0d0887" ], [ 0.1111111111111111, "#46039f" ], [ 0.2222222222222222, "#7201a8" ], [ 0.3333333333333333, "#9c179e" ], [ 0.4444444444444444, "#bd3786" ], [ 0.5555555555555556, "#d8576b" ], [ 0.6666666666666666, "#ed7953" ], [ 0.7777777777777778, "#fb9f3a" ], [ 0.8888888888888888, "#fdca26" ], [ 1.0, "#f0f921" ] ] } ], "scatterpolar": [ { "type": "scatterpolar", "marker": { "colorbar": { "ticks": "", "outlinewidth": 0 } } } ], "contourcarpet": [ { "type": "contourcarpet", "colorbar": { "ticks": "", "outlinewidth": 0 } } ], "scattercarpet": [ { "type": "scattercarpet", "marker": { "colorbar": { "ticks": "", "outlinewidth": 0 } } } ], "scattermapbox": [ { "type": "scattermapbox", "marker": { "colorbar": { "ticks": "", "outlinewidth": 0 } } } ], "scatterpolargl": [ { "type": "scatterpolargl", "marker": { "colorbar": { "ticks": "", "outlinewidth": 0 } } } ], "scatterternary": [ { "type": "scatterternary", "marker": { "colorbar": { "ticks": "", "outlinewidth": 0 } } } ], "histogram2dcontour": [ { "type": "histogram2dcontour", "colorbar": { "ticks": "", "outlinewidth": 0 }, "colorscale": [ [ 0.0, "#0d0887" ], [ 0.1111111111111111, "#46039f" ], [ 0.2222222222222222, "#7201a8" ], [ 0.3333333333333333, "#9c179e" ], [ 0.4444444444444444, "#bd3786" ], [ 0.5555555555555556, "#d8576b" ], [ 0.6666666666666666, "#ed7953" ], [ 0.7777777777777778, "#fb9f3a" ], [ 0.8888888888888888, "#fdca26" ], [ 1.0, "#f0f921" ] ] } ] }, "layout": { "geo": { "bgcolor": "white", "showland": true, "lakecolor": "white", "landcolor": "#E5ECF6", "showlakes": true, "subunitcolor": "white" }, "font": { "color": "#2a3f5f" }, "polar": { "bgcolor": "#E5ECF6", "radialaxis": { "ticks": "", "gridcolor": "white", "linecolor": "white" }, "angularaxis": { "ticks": "", "gridcolor": "white", "linecolor": "white" } }, "scene": { "xaxis": { "ticks": "", "gridcolor": "white", "gridwidth": 2, "linecolor": "white", "zerolinecolor": "white", "showbackground": true, "backgroundcolor": "#E5ECF6" }, "yaxis": { "ticks": "", "gridcolor": "white", "gridwidth": 2, "linecolor": "white", "zerolinecolor": "white", "showbackground": true, "backgroundcolor": "#E5ECF6" }, "zaxis": { "ticks": "", "gridcolor": "white", "gridwidth": 2, "linecolor": "white", "zerolinecolor": "white", "showbackground": true, "backgroundcolor": "#E5ECF6" } }, "title": { "x": 0.05 }, "xaxis": { "ticks": "", "title": { "standoff": 15 }, "gridcolor": "white", "linecolor": "white", "automargin": true, "zerolinecolor": "white", "zerolinewidth": 2 }, "yaxis": { "ticks": "", "title": { "standoff": 15 }, "gridcolor": "white", "linecolor": "white", "automargin": true, "zerolinecolor": "white", "zerolinewidth": 2 }, "mapbox": { "style": "light" }, "ternary": { "aaxis": { "ticks": "", "gridcolor": "white", "linecolor": "white" }, "baxis": { "ticks": "", "gridcolor": "white", "linecolor": "white" }, "caxis": { "ticks": "", "gridcolor": "white", "linecolor": "white" }, "bgcolor": "#E5ECF6" }, "colorway": [ "#636efa", "#EF553B", "#00cc96", "#ab63fa", "#FFA15A", "#19d3f3", "#FF6692", "#B6E880", "#FF97FF", "#FECB52" ], "coloraxis": { "colorbar": { "ticks": "", "outlinewidth": 0 } }, "hovermode": "closest", "colorscale": { "diverging": [ [ 0, "#8e0152" ], [ 0.1, "#c51b7d" ], [ 0.2, "#de77ae" ], [ 0.3, "#f1b6da" ], [ 0.4, "#fde0ef" ], [ 0.5, "#f7f7f7" ], [ 0.6, "#e6f5d0" ], [ 0.7, "#b8e186" ], [ 0.8, "#7fbc41" ], [ 0.9, "#4d9221" ], [ 1, "#276419" ] ], "sequential": [ [ 0.0, "#0d0887" ], [ 0.1111111111111111, "#46039f" ], [ 0.2222222222222222, "#7201a8" ], [ 0.3333333333333333, "#9c179e" ], [ 0.4444444444444444, "#bd3786" ], [ 0.5555555555555556, "#d8576b" ], [ 0.6666666666666666, "#ed7953" ], [ 0.7777777777777778, "#fb9f3a" ], [ 0.8888888888888888, "#fdca26" ], [ 1.0, "#f0f921" ] ], "sequentialminus": [ [ 0.0, "#0d0887" ], [ 0.1111111111111111, "#46039f" ], [ 0.2222222222222222, "#7201a8" ], [ 0.3333333333333333, "#9c179e" ], [ 0.4444444444444444, "#bd3786" ], [ 0.5555555555555556, "#d8576b" ], [ 0.6666666666666666, "#ed7953" ], [ 0.7777777777777778, "#fb9f3a" ], [ 0.8888888888888888, "#fdca26" ], [ 1.0, "#f0f921" ] ] }, "hoverlabel": { "align": "left" }, "plot_bgcolor": "#E5ECF6", "paper_bgcolor": "white", "shapedefaults": { "line": { "color": "#2a3f5f" } }, "autotypenumbers": "strict", "annotationdefaults": { "arrowhead": 0, "arrowcolor": "#2a3f5f", "arrowwidth": 1 } } } } }, "height": null, "width": null, "user": { "profile_url": "https://chart-studio.plotly.com/~abhi_plotly", "avatar_url": "https://storage.googleapis.com/plotly-prod-profiles/23.jpg", "background_url": "https://storage.googleapis.com/plotly-prod-profiles/bg-10.jpg", "bio": "", "nickname": "", "website": "", "stream_tokens": null, "feature_set_id": null, "csrf_token": null, "date_joined": "2024-04-02 09:52:01", "mapbox_access_tokens": null, "has_password": null, "username": "abhi_plotly", "email": null, "is_active": null, "readonly": null, "is_dash_creator": null, "dash_created_count": null, "is_chart_creator": null, "charts_created_count": null } }, { "creation_time": "2024-04-02T09:28:16.542899Z", "comments": { "results": [], "count": 0 }, "parented": true, "embed_url": "https://chart-studio.plotly.com/~W3771/1.embed", "fid": "W3771:1", "filename": "Plot 1", "filetype": "plot", "img_url": "https://storage.googleapis.com/plotly-prod-images/W3771/1/9_LQ747ZYMVC572KHRIEE504DFOQXP12.png", "image_urls": { "default": "https://storage.googleapis.com/plotly-prod-images/W3771/1/2_5ZVWLYS8QBP1ODQEBS2FLX7LK5RER4.png", "block-thumb": "https://storage.googleapis.com/plotly-prod-images/W3771/1/8_2Z5ERV471SXBBER2WESM4ZW0VNI7WM.png", "list-thumb": "https://storage.googleapis.com/plotly-prod-images/W3771/1/9_LQ747ZYMVC572KHRIEE504DFOQXP12.png" }, "api_urls": { "files": "https://api.plotly.com/v2/files/W3771:1", "plots": "https://api.plotly.com/v2/plots/W3771:1", "parent": "https://api.plotly.com/v2/folders/home?user=W3771" }, "owner": "W3771", "parent": -1, "preview": "", "referencers": [], "references": [], "title": "", "views": 1, "web_url": "https://chart-studio.plotly.com/~W3771/1/", "world_readable": true, "date_modified": "2024-04-02T09:28:16.556Z", "stars": { "results": [], "count": 0 }, "collaborators": { "results": [], "count": 0 }, "subfolder_count": null, "refresh_interval": null, "organize_view_url": "https://chart-studio.plotly.com/~W3771/1/", "current_user_permission": "read", "is_theme": null, "is_template": false, "autosize": true, "caption": "", "figure": { "data": [ { "meta": { "columnNames": { "x": "A", "y": "B", "z": "C - D - E - F" } }, "mode": "markers", "type": "heatmap", "xsrc": "W3771:0:f2a0ad", "ysrc": "W3771:0:b0ff70", "zsrc": "W3771:0:c4e543,f101a2,5c8705,899dec", "autocolorscale": true } ], "frames": [], "layout": { "xaxis": { "type": "category", "range": [ -0.5, 3.5 ], "autorange": true }, "yaxis": { "type": "category", "range": [ -0.5, 3.5 ], "autorange": true }, "autosize": true, "colorway": [ "#636efa", "#EF553B", "#00cc96", "#ab63fa", "#19d3f3", "#e763fa", "#fecb52", "#ffa15a", "#ff6692", "#b6e880" ], "template": { "data": { "bar": [ { "type": "bar", "marker": { "colorbar": { "ticks": "", "outlinewidth": 0 } } } ], "table": [ { "type": "table", "cells": { "fill": { "color": "#EBF0F8" }, "line": { "color": "white" } }, "header": { "fill": { "color": "#C8D4E3" }, "line": { "color": "white" } } } ], "carpet": [ { "type": "carpet", "aaxis": { "gridcolor": "#C8D4E3", "linecolor": "#C8D4E3", "endlinecolor": "#2a3f5f", "minorgridcolor": "#C8D4E3", "startlinecolor": "#2a3f5f" }, "baxis": { "gridcolor": "#C8D4E3", "linecolor": "#C8D4E3", "endlinecolor": "#2a3f5f", "minorgridcolor": "#C8D4E3", "startlinecolor": "#2a3f5f" } } ], "mesh3d": [ { "type": "mesh3d", "colorbar": { "ticks": "", "outlinewidth": 0 } } ], "contour": [ { "type": "contour", "colorbar": { "ticks": "", "outlinewidth": 0 }, "autocolorscale": true } ], "heatmap": [ { "type": "heatmap", "colorbar": { "ticks": "", "outlinewidth": 0 }, "autocolorscale": true } ], "scatter": [ { "type": "scatter", "marker": { "colorbar": { "ticks": "", "outlinewidth": 0 } } } ], "surface": [ { "type": "surface", "colorbar": { "ticks": "", "outlinewidth": 0 } } ], "heatmapgl": [ { "type": "heatmapgl", "colorbar": { "ticks": "", "outlinewidth": 0 } } ], "histogram": [ { "type": "histogram", "marker": { "colorbar": { "ticks": "", "outlinewidth": 0 } } } ], "parcoords": [ { "line": { "colorbar": { "ticks": "", "outlinewidth": 0 } }, "type": "parcoords" } ], "scatter3d": [ { "type": "scatter3d", "marker": { "colorbar": { "ticks": "", "outlinewidth": 0 } } } ], "scattergl": [ { "type": "scattergl", "marker": { "colorbar": { "ticks": "", "outlinewidth": 0 } } } ], "choropleth": [ { "type": "choropleth", "colorbar": { "ticks": "", "outlinewidth": 0 } } ], "scattergeo": [ { "type": "scattergeo", "marker": { "colorbar": { "ticks": "", "outlinewidth": 0 } } } ], "histogram2d": [ { "type": "histogram2d", "colorbar": { "ticks": "", "outlinewidth": 0 }, "autocolorscale": true } ], "scatterpolar": [ { "type": "scatterpolar", "marker": { "colorbar": { "ticks": "", "outlinewidth": 0 } } } ], "contourcarpet": [ { "type": "contourcarpet", "colorbar": { "ticks": "", "outlinewidth": 0 } } ], "scattercarpet": [ { "type": "scattercarpet", "marker": { "colorbar": { "ticks": "", "outlinewidth": 0 } } } ], "scattermapbox": [ { "type": "scattermapbox", "marker": { "colorbar": { "ticks": "", "outlinewidth": 0 } } } ], "scatterpolargl": [ { "type": "scatterpolargl", "marker": { "colorbar": { "ticks": "", "outlinewidth": 0 } } } ], "scatterternary": [ { "type": "scatterternary", "marker": { "colorbar": { "ticks": "", "outlinewidth": 0 } } } ], "histogram2dcontour": [ { "type": "histogram2dcontour", "colorbar": { "ticks": "", "outlinewidth": 0 }, "autocolorscale": true } ] }, "layout": { "geo": { "bgcolor": "white", "showland": true, "lakecolor": "white", "landcolor": "white", "showlakes": true, "subunitcolor": "#C8D4E3" }, "font": { "color": "#2a3f5f" }, "polar": { "bgcolor": "white", "radialaxis": { "ticks": "", "gridcolor": "#EBF0F8", "linecolor": "#EBF0F8" }, "angularaxis": { "ticks": "", "gridcolor": "#EBF0F8", "linecolor": "#EBF0F8" } }, "scene": { "xaxis": { "ticks": "", "gridcolor": "#DFE8F3", "gridwidth": 2, "linecolor": "#EBF0F8", "zerolinecolor": "#EBF0F8", "showbackground": true, "backgroundcolor": "white" }, "yaxis": { "ticks": "", "gridcolor": "#DFE8F3", "gridwidth": 2, "linecolor": "#EBF0F8", "zerolinecolor": "#EBF0F8", "showbackground": true, "backgroundcolor": "white" }, "zaxis": { "ticks": "", "gridcolor": "#DFE8F3", "gridwidth": 2, "linecolor": "#EBF0F8", "zerolinecolor": "#EBF0F8", "showbackground": true, "backgroundcolor": "white" } }, "title": { "x": 0.05 }, "xaxis": { "ticks": "", "gridcolor": "#EBF0F8", "linecolor": "#EBF0F8", "automargin": true, "zerolinecolor": "#EBF0F8", "zerolinewidth": 2 }, "yaxis": { "ticks": "", "gridcolor": "#EBF0F8", "linecolor": "#EBF0F8", "automargin": true, "zerolinecolor": "#EBF0F8", "zerolinewidth": 2 }, "ternary": { "aaxis": { "ticks": "", "gridcolor": "#DFE8F3", "linecolor": "#A2B1C6" }, "baxis": { "ticks": "", "gridcolor": "#DFE8F3", "linecolor": "#A2B1C6" }, "caxis": { "ticks": "", "gridcolor": "#DFE8F3", "linecolor": "#A2B1C6" }, "bgcolor": "white" }, "colorway": [ "#636efa", "#EF553B", "#00cc96", "#ab63fa", "#19d3f3", "#e763fa", "#fecb52", "#ffa15a", "#ff6692", "#b6e880" ], "hovermode": "closest", "colorscale": { "diverging": [ [ 0, "#8e0152" ], [ 0.1, "#c51b7d" ], [ 0.2, "#de77ae" ], [ 0.3, "#f1b6da" ], [ 0.4, "#fde0ef" ], [ 0.5, "#f7f7f7" ], [ 0.6, "#e6f5d0" ], [ 0.7, "#b8e186" ], [ 0.8, "#7fbc41" ], [ 0.9, "#4d9221" ], [ 1, "#276419" ] ], "sequential": [ [ 0, "#0508b8" ], [ 0.0893854748603352, "#1910d8" ], [ 0.1787709497206704, "#3c19f0" ], [ 0.2681564245810056, "#6b1cfb" ], [ 0.3575418994413408, "#981cfd" ], [ 0.44692737430167595, "#bf1cfd" ], [ 0.5363128491620112, "#dd2bfd" ], [ 0.6256983240223464, "#f246fe" ], [ 0.7150837988826816, "#fc67fd" ], [ 0.8044692737430168, "#fe88fc" ], [ 0.8938547486033519, "#fea5fd" ], [ 0.9832402234636871, "#febefe" ], [ 1, "#fec3fe" ] ], "sequentialminus": [ [ 0, "#0508b8" ], [ 0.0893854748603352, "#1910d8" ], [ 0.1787709497206704, "#3c19f0" ], [ 0.2681564245810056, "#6b1cfb" ], [ 0.3575418994413408, "#981cfd" ], [ 0.44692737430167595, "#bf1cfd" ], [ 0.5363128491620112, "#dd2bfd" ], [ 0.6256983240223464, "#f246fe" ], [ 0.7150837988826816, "#fc67fd" ], [ 0.8044692737430168, "#fe88fc" ], [ 0.8938547486033519, "#fea5fd" ], [ 0.9832402234636871, "#febefe" ], [ 1, "#fec3fe" ] ] }, "plot_bgcolor": "white", "paper_bgcolor": "white", "shapedefaults": { "line": { "width": 0 }, "opacity": 0.4, "fillcolor": "#506784" }, "annotationdefaults": { "arrowhead": 0, "arrowcolor": "#506784", "arrowwidth": 1 } }, "themeRef": "PLOTLY_WHITE" }, "colorscale": { "sequential": [ [ 0, "#ffffcc" ], [ 0.125, "#ffeda0" ], [ 0.25, "#fed976" ], [ 0.375, "#feb24c" ], [ 0.5, "#fd8d3c" ], [ 0.625, "#fc4e2a" ], [ 0.75, "#e31a1c" ], [ 0.875, "#bd0026" ], [ 1, "#800026" ] ] } } }, "height": null, "width": null, "user": { "profile_url": "https://chart-studio.plotly.com/~W3771", "avatar_url": "https://storage.googleapis.com/plotly-prod-profiles/20.jpg", "background_url": "https://storage.googleapis.com/plotly-prod-profiles/bg-10.jpg", "bio": "", "nickname": "", "website": "", "stream_tokens": null, "feature_set_id": null, "csrf_token": null, "date_joined": "2024-04-02 09:26:02", "mapbox_access_tokens": null, "has_password": null, "username": "W3771", "email": null, "is_active": null, "readonly": null, "is_dash_creator": null, "dash_created_count": null, "is_chart_creator": null, "charts_created_count": null } }, { "creation_time": "2024-04-02T09:21:12.955025Z", "comments": { "results": [], "count": 0 }, "parented": true, "embed_url": "https://chart-studio.plotly.com/~wzw_cloudpss/2.embed", "fid": "wzw_cloudpss:2", "filename": "Plot 2", "filetype": "plot", "img_url": "https://storage.googleapis.com/plotly-prod-images/wzw_cloudpss/2/9_GUOLESUG3D6M5K8T78RPMTVCVNUWWL.png", "image_urls": { "default": "https://storage.googleapis.com/plotly-prod-images/wzw_cloudpss/2/2_8JHXW8QGBC0G9SCS4N641XK8DTWDKZ.png", "block-thumb": "https://storage.googleapis.com/plotly-prod-images/wzw_cloudpss/2/8_H6RSORUK1FAOAPKQMDUIWK6PAPR2B1.png", "list-thumb": "https://storage.googleapis.com/plotly-prod-images/wzw_cloudpss/2/9_GUOLESUG3D6M5K8T78RPMTVCVNUWWL.png" }, "api_urls": { "files": "https://api.plotly.com/v2/files/wzw_cloudpss:2", "plots": "https://api.plotly.com/v2/plots/wzw_cloudpss:2", "parent": "https://api.plotly.com/v2/folders/home?user=wzw_cloudpss" }, "owner": "wzw_cloudpss", "parent": -1, "preview": "", "referencers": [], "references": [], "title": "", "views": 2, "web_url": "https://chart-studio.plotly.com/~wzw_cloudpss/2/", "world_readable": true, "date_modified": "2024-04-02T09:21:12.965Z", "stars": { "results": [], "count": 0 }, "collaborators": { "results": [], "count": 0 }, "subfolder_count": null, "refresh_interval": null, "organize_view_url": "https://chart-studio.plotly.com/~wzw_cloudpss/2/", "current_user_permission": "read", "is_theme": null, "is_template": false, "autosize": true, "caption": "", "figure": { "data": [ { "meta": { "columnNames": { "x": "x", "y": "y" } }, "mode": "lines", "name": "I:0", "type": "scatter", "xsrc": "wzw_cloudpss:1:f45020", "ysrc": "wzw_cloudpss:1:dd2df1" } ], "frames": [], "layout": { "title": { "text": "I" }, "xaxis": { "type": "linear", "range": [ 0.001000000000000002, 1.9990000000046284 ], "title": { "text": "时间/s" }, "autorange": true }, "yaxis": { "type": "linear", "range": [ -1.5210086752788596, 1.5206749039589895 ], "title": { "text": "电流/kA" }, "autorange": true }, "legend": { "x": 1, "y": 1, "xanchor": "auto", "yanchor": "auto" }, "margin": { "b": 50, "l": 80, "r": 30, "t": 50 }, "autosize": true, "hovermode": "x", "showlegend": true } }, "height": null, "width": null, "user": { "profile_url": "https://chart-studio.plotly.com/~wzw_cloudpss", "avatar_url": "https://storage.googleapis.com/plotly-prod-profiles/59.jpg", "background_url": "https://storage.googleapis.com/plotly-prod-profiles/bg-11.jpg", "bio": "", "nickname": "", "website": "", "stream_tokens": null, "feature_set_id": null, "csrf_token": null, "date_joined": "2024-04-02 07:47:56", "mapbox_access_tokens": null, "has_password": null, "username": "wzw_cloudpss", "email": null, "is_active": null, "readonly": null, "is_dash_creator": null, "dash_created_count": null, "is_chart_creator": null, "charts_created_count": null } } ] }
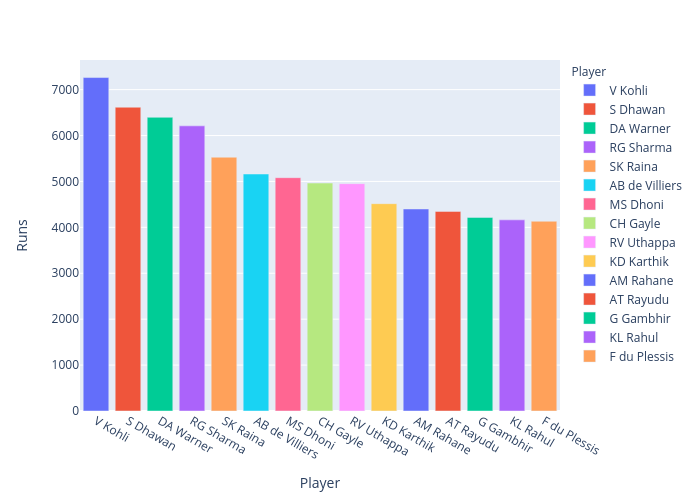
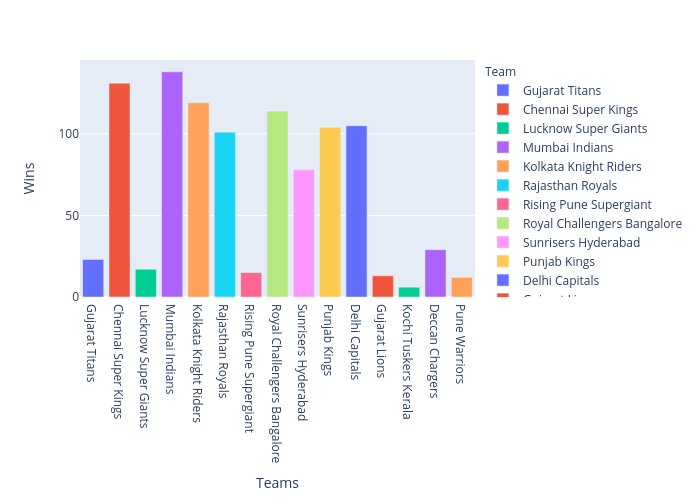
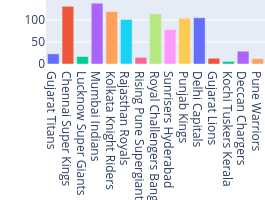
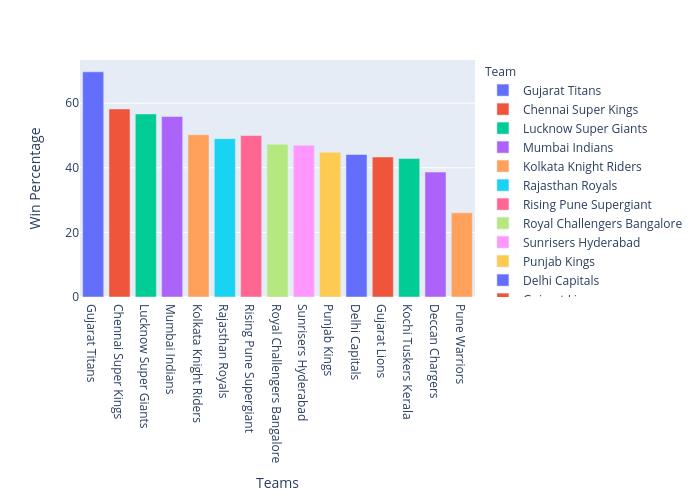