Plots List
Plots
This endpoint handles manipulation of Plotly plot files.
Reference
Authorization
Any user with or without a Plotly account may view public plots. For private plots, see authentication.
Actions
list
Listing all public plots can be done via a GET request to this endpoint.
By default, plots will be listed in order of date created. The order_by
query parameter is accepted at this endpoint. Currently, only ordering by
views is supported. It is possible to filter the plots by quality
with min_quality or max_quality as query parameter.
Example:
// GET https://api.plotly.com/v2/plots/ ---> 200

// GET https://api.plotly.com/v2/plots/?order_by=-views ---> 200

// GET https://api.plotly.com/v2/plots/?min_quality=5 ---> 200

// GET https://api.plotly.com/v2/plots/?max_quality=5 ---> 200
feed
Listing all handpicked feed plots can be done via a GET request to this endpoint. By default, plots will be listed in a random order.
Example:
// GET https://api.plotly.com/v2/plots/feed ---> 200
create
You can create new plot resources here. The only required field is 'figure'. Currently, the figure is restricted to only contain references to grid data. That is, this will fail if raw data arrays are passed in. To create and manipulate underlying grids for plots, see the grids endpoint.
Example:
// This fails because a figure field is required.
// POST https://api.plotly.com/v2/plots ---> 400 Bad Request
{}

// This fails because the figure has raw data
//POST https://api.plotly.com/v2/plots ---> 400 Bad Request
{
    "figure": {"data": [{"y": ['this', 'is', 'raw', 'data']}]}
}

// This succeeds because the figure has src keys, not raw data.
//POST https://api.plotly.com/v2/plots ---> 200 OK
{
    "figure": {"data": [{"ysrc": "sven:88:u8nd62"}]}
}
When creating a grid, you can optionally specify a source_fid to specify where a plot has come from:
- source_fid: the fid of a plot that was copied (and presumably edited) to produce this one
detail
There is a lot of meta information stored about plot files including filename, title, share_url, and content_url to name a few.
This information can only be reached with a GET to this endpoint.
Example:
// GET https://api.plotly.com/v2/plots/iheartgraphs:90
content
The contents of a plot can be downloaded via the content resource. The plot
content contains referenced grid/column data by default. If you wish to
return the raw grid/column data, the inline_data=true query must be included
in the request url. The Content-Type header will be appropriately set for the
response body.
Alternatively, you can set ?map_data=unreadable to append a mapping of
sources to data that belongs to grids which are unreadable for the
requestor. This is useful when you have read access to another users plot,
but that plot contains grid references which you don't have access to.
Examples:
// Returns referenced grid/column data
// GET https://api.plotly.com/v2/plots/iheartgraphs:90/content ---> 200 OK

// Returns full grid/column data
// GET https://api.plotly.com/v2/plots/iheartgraphs:90/content?inline_data=true ---> 200 OK

// Returns full grid/column data when requestor doesn't have permission
// to read the referenced grid.
// GET https://api.plotly.com/v2/plots/iheartgraphs:90/content?map_data=unreadable ---> 200 OK
GET /v2/plots?cursor=cj0xJnA9MjAyNC0wNC0wMiswNyUzQTQyJTNBMjguMDIwMzU3JTJCMDAlM0EwMA%3D%3D&format=api
{ "next": "https://api.plot.ly/v2/plots?cursor=cD0yMDI0LTA0LTAyKzA3JTNBNDQlM0E0Ny42NTQ0MTklMkIwMCUzQTAw&format=api", "previous": "https://api.plot.ly/v2/plots?cursor=cj0xJnA9MjAyNC0wNC0wMiswOSUzQTEwJTNBNTYuMjAzNDY5JTJCMDAlM0EwMA%3D%3D&format=api", "results": [ { "creation_time": "2024-04-02T09:10:56.203469Z", "comments": { "results": [], "count": 0 }, "parented": true, "embed_url": "https://chart-studio.plotly.com/~Cremita8898/1.embed", "fid": "Cremita8898:1", "filename": "figure20240403", "filetype": "plot", "img_url": "https://storage.googleapis.com/plotly-prod-images/Cremita8898/1/9_WCXI15B32E2TKGOV4M99PBWDNW5W89.png", "image_urls": { "default": "https://storage.googleapis.com/plotly-prod-images/Cremita8898/1/2_C39OI8TBSSL4HOBG8UKXPUXRFC5HCI.png", "block-thumb": "https://storage.googleapis.com/plotly-prod-images/Cremita8898/1/8_QJOT2PSAJ05VP5WYEF99CC3TMS3BXN.png", "list-thumb": "https://storage.googleapis.com/plotly-prod-images/Cremita8898/1/9_WCXI15B32E2TKGOV4M99PBWDNW5W89.png" }, "api_urls": { "files": "https://api.plotly.com/v2/files/Cremita8898:1", "plots": "https://api.plotly.com/v2/plots/Cremita8898:1", "parent": "https://api.plotly.com/v2/folders/home?user=Cremita8898" }, "owner": "Cremita8898", "parent": -1, "preview": "", "referencers": [], "references": [], "title": "", "views": 8, "web_url": "https://chart-studio.plotly.com/~Cremita8898/1/", "world_readable": true, "date_modified": "2024-04-02T10:10:36.931Z", "stars": { "results": [], "count": 0 }, "collaborators": { "results": [], "count": 0 }, "subfolder_count": null, "refresh_interval": null, "organize_view_url": "https://chart-studio.plotly.com/~Cremita8898/1/", "current_user_permission": "read", "is_theme": null, "is_template": null, "autosize": true, "caption": "", "figure": { "data": [ { "name": "Numerical Forecast", "type": "bar", "xsrc": "Cremita8898:14:9d0a8f", "ysrc": "Cremita8898:14:b633bc", "width": 0.1, "marker": { "color": "rgba(255,0,0,0.6)" }, "showlegend": true }, { "type": "bar", "xsrc": "Cremita8898:14:ad231b", "ysrc": "Cremita8898:14:4a74f6", "width": 0.1, "marker": { "color": "rgba(255,0,0,0.6)" }, "showlegend": false }, { "type": "bar", "xsrc": "Cremita8898:14:2c19d1", "ysrc": "Cremita8898:14:f6da89", "width": 0.1, "marker": { "color": "rgba(255,0,0,0.6)" }, "showlegend": false }, { "type": "bar", "xsrc": "Cremita8898:14:d53971", "ysrc": "Cremita8898:14:c9b4e7", "width": 0.1, "marker": { "color": "rgba(255,0,0,0.6)" }, "showlegend": false }, { "type": "bar", "xsrc": "Cremita8898:14:7b2e76", "ysrc": "Cremita8898:14:9fa073", "width": 0.1, "marker": { "color": "rgba(255,0,0,0.6)" }, "showlegend": false }, { "type": "bar", "xsrc": "Cremita8898:14:89f0e6", "ysrc": "Cremita8898:14:f9bb33", "width": 0.1, "marker": { "color": "rgba(255,0,0,0.6)" }, "showlegend": false }, { "type": "bar", "xsrc": "Cremita8898:14:8a3fac", "ysrc": "Cremita8898:14:e2aa60", "width": 0.1, "marker": { "color": "rgba(255,0,0,0.6)" }, "showlegend": false }, { "type": "bar", "xsrc": "Cremita8898:14:9bd4ca", "ysrc": "Cremita8898:14:26abe2", "width": 0.1, "marker": { "color": "rgba(255,0,0,0.6)" }, "showlegend": false }, { "type": "bar", "xsrc": "Cremita8898:14:03a944", "ysrc": "Cremita8898:14:ac7fc4", "width": 0.1, "marker": { "color": "rgba(255,0,0,0.6)" }, "showlegend": false }, { "type": "bar", "xsrc": "Cremita8898:14:04d6c1", "ysrc": "Cremita8898:14:6200cc", "width": 0.1, "marker": { "color": "rgba(255,0,0,0.6)" }, "showlegend": false }, { "type": "bar", "xsrc": "Cremita8898:14:f6cfe5", "ysrc": "Cremita8898:14:aa33e8", "width": 0.1, "marker": { "color": "rgba(255,0,0,0.6)" }, "showlegend": false }, { "type": "bar", "xsrc": "Cremita8898:14:58863c", "ysrc": "Cremita8898:14:51aad1", "width": 0.1, "marker": { "color": "rgba(255,0,0,0.6)" }, "showlegend": false }, { "type": "bar", "xsrc": "Cremita8898:14:22b759", "ysrc": "Cremita8898:14:c8bf6a", "width": 0.1, "marker": { "color": "rgba(255,0,0,0.6)" }, "showlegend": false }, { "type": "bar", "xsrc": "Cremita8898:14:235a13", "ysrc": "Cremita8898:14:e15a97", "width": 0.1, "marker": { "color": "rgba(255,0,0,0.6)" }, "showlegend": false }, { "type": "bar", "xsrc": "Cremita8898:14:c217b9", "ysrc": "Cremita8898:14:c108a3", "width": 0.1, "marker": { "color": "rgba(255,0,0,0.6)" }, "showlegend": false }, { "type": "bar", "xsrc": "Cremita8898:14:401766", "ysrc": "Cremita8898:14:c6cc2f", "width": 0.1, "marker": { "color": "rgba(255,0,0,0.6)" }, "showlegend": false }, { "type": "bar", "xsrc": "Cremita8898:14:13c48b", "ysrc": "Cremita8898:14:3743cd", "width": 0.1, "marker": { "color": "rgba(255,0,0,0.6)" }, "showlegend": false }, { "type": "bar", "xsrc": "Cremita8898:14:87e51d", "ysrc": "Cremita8898:14:c3de37", "width": 0.1, "marker": { "color": "rgba(255,0,0,0.6)" }, "showlegend": false }, { "type": "bar", "xsrc": "Cremita8898:14:1c6f46", "ysrc": "Cremita8898:14:342d18", "width": 0.1, "marker": { "color": "rgba(255,0,0,0.6)" }, "showlegend": false }, { "type": "bar", "xsrc": "Cremita8898:14:0ec3ca", "ysrc": "Cremita8898:14:d1a398", "width": 0.1, "marker": { "color": "rgba(255,0,0,0.6)" }, "showlegend": false }, { "type": "bar", "xsrc": "Cremita8898:14:a2e7ee", "ysrc": "Cremita8898:14:b61907", "width": 0.1, "marker": { "color": "rgba(255,0,0,0.6)" }, "showlegend": false }, { "type": "bar", "xsrc": "Cremita8898:14:65aff1", "ysrc": "Cremita8898:14:6cbb2c", "width": 0.1, "marker": { "color": "rgba(255,0,0,0.6)" }, "showlegend": false }, { "type": "bar", "xsrc": "Cremita8898:14:aaebd9", "ysrc": "Cremita8898:14:b35c45", "width": 0.1, "marker": { "color": "rgba(255,0,0,0.6)" }, "showlegend": false }, { "type": "bar", "xsrc": "Cremita8898:14:da4150", "ysrc": "Cremita8898:14:4f9e4f", "width": 0.1, "marker": { "color": "rgba(255,0,0,0.6)" }, "showlegend": false }, { "name": "Confidence Level", "type": "bar", "xsrc": "Cremita8898:14:fa345c", "ysrc": "Cremita8898:14:eb20b9", "showlegend": true }, { "name": "ClassPred_T1800", "type": "bar", "xsrc": "Cremita8898:14:8fdd0e", "ysrc": "Cremita8898:14:e6ea8c", "showlegend": false }, { "name": "ClassPred_T1600", "type": "bar", "xsrc": "Cremita8898:14:db0193", "ysrc": "Cremita8898:14:fb57e2", "showlegend": false }, { "name": "ClassPred_T1400", "type": "bar", "xsrc": "Cremita8898:14:831bc3", "ysrc": "Cremita8898:14:722df2", "showlegend": false }, { "name": "ClassPred_T1200", "type": "bar", "xsrc": "Cremita8898:14:399de6", "ysrc": "Cremita8898:14:6f96c1", "showlegend": false }, { "name": "ClassPred_T1000", "type": "bar", "xsrc": "Cremita8898:14:985ea2", "ysrc": "Cremita8898:14:d2bcc6", "showlegend": false }, { "name": "ClassPred_T800", "type": "bar", "xsrc": "Cremita8898:14:080000", "ysrc": "Cremita8898:14:e28f60", "showlegend": false }, { "name": "ClassPred_T600", "type": "bar", "xsrc": "Cremita8898:14:5e9090", "ysrc": "Cremita8898:14:915696", "showlegend": false }, { "name": "ClassPred_T400", "type": "bar", "xsrc": "Cremita8898:14:708eb7", "ysrc": "Cremita8898:14:7ef4a4", "showlegend": false }, { "name": "ClassPred_T200", "type": "bar", "xsrc": "Cremita8898:14:ee534c", "ysrc": "Cremita8898:14:bfd9fc", "showlegend": false } ], "layout": { "title": { "text": "VOL. DOWN CT Forecast for 2024-04-031" }, "xaxis": { "type": "category" }, "yaxis": { "title": { "text": "MW DOWN" } }, "shapes": [ { "x0": "PH-20240403-01", "x1": "PH-20240403-01", "y0": 205.856305055905, "y1": 204.856305055905, "line": { "color": "red", "width": 40 }, "type": "line" }, { "x0": "PH-20240403-02", "x1": "PH-20240403-02", "y0": 439.153870194238, "y1": 438.153870194238, "line": { "color": "red", "width": 40 }, "type": "line" }, { "x0": "PH-20240403-03", "x1": "PH-20240403-03", "y0": 586.630565361267, "y1": 585.630565361267, "line": { "color": "red", "width": 40 }, "type": "line" }, { "x0": "PH-20240403-04", "x1": "PH-20240403-04", "y0": 644.923461670622, "y1": 643.923461670622, "line": { "color": "red", "width": 40 }, "type": "line" }, { "x0": "PH-20240403-05", "x1": "PH-20240403-05", "y0": 364.993570480094, "y1": 363.993570480094, "line": { "color": "red", "width": 40 }, "type": "line" }, { "x0": "PH-20240403-06", "x1": "PH-20240403-06", "y0": 273.693932160365, "y1": 272.693932160365, "line": { "color": "red", "width": 40 }, "type": "line" }, { "x0": "PH-20240403-07", "x1": "PH-20240403-07", "y0": 271.181504387913, "y1": 270.181504387913, "line": { "color": "red", "width": 40 }, "type": "line" }, { "x0": "PH-20240403-08", "x1": "PH-20240403-08", "y0": 222.81414604832, "y1": 221.81414604832, "line": { "color": "red", "width": 40 }, "type": "line" }, { "x0": "PH-20240403-09", "x1": "PH-20240403-09", "y0": 518.714254903754, "y1": 517.714254903754, "line": { "color": "red", "width": 40 }, "type": "line" }, { "x0": "PH-20240403-10", "x1": "PH-20240403-10", "y0": 707.699413771317, "y1": 706.699413771317, "line": { "color": "red", "width": 40 }, "type": "line" }, { "x0": "PH-20240403-11", "x1": "PH-20240403-11", "y0": 704.864540022818, "y1": 703.864540022818, "line": { "color": "red", "width": 40 }, "type": "line" }, { "x0": "PH-20240403-12", "x1": "PH-20240403-12", "y0": 715.856463395243, "y1": 714.856463395243, "line": { "color": "red", "width": 40 }, "type": "line" }, { "x0": "PH-20240403-13", "x1": "PH-20240403-13", "y0": 705.46912419214, "y1": 704.46912419214, "line": { "color": "red", "width": 40 }, "type": "line" }, { "x0": "PH-20240403-14", "x1": "PH-20240403-14", "y0": 707.27473246224, "y1": 706.27473246224, "line": { "color": "red", "width": 40 }, "type": "line" }, { "x0": "PH-20240403-15", "x1": "PH-20240403-15", "y0": 704.316588432861, "y1": 703.316588432861, "line": { "color": "red", "width": 40 }, "type": "line" }, { "x0": "PH-20240403-16", "x1": "PH-20240403-16", "y0": 702.272460357037, "y1": 701.272460357037, "line": { "color": "red", "width": 40 }, "type": "line" }, { "x0": "PH-20240403-17", "x1": "PH-20240403-17", "y0": 685.315537634898, "y1": 684.315537634898, "line": { "color": "red", "width": 40 }, "type": "line" }, { "x0": "PH-20240403-18", "x1": "PH-20240403-18", "y0": 658.74929375734, "y1": 657.74929375734, "line": { "color": "red", "width": 40 }, "type": "line" }, { "x0": "PH-20240403-19", "x1": "PH-20240403-19", "y0": 282.166736563996, "y1": 281.166736563996, "line": { "color": "red", "width": 40 }, "type": "line" }, { "x0": "PH-20240403-20", "x1": "PH-20240403-20", "y0": 125.085524803281, "y1": 124.085524803281, "line": { "color": "red", "width": 40 }, "type": "line" }, { "x0": "PH-20240403-21", "x1": "PH-20240403-21", "y0": 222.416660758345, "y1": 221.416660758345, "line": { "color": "red", "width": 40 }, "type": "line" }, { "x0": "PH-20240403-22", "x1": "PH-20240403-22", "y0": 303.127174563001, "y1": 302.127174563001, "line": { "color": "red", "width": 40 }, "type": "line" }, { "x0": "PH-20240403-23", "x1": "PH-20240403-23", "y0": 432.443435817402, "y1": 431.443435817402, "line": { "color": "red", "width": 40 }, "type": "line" }, { "x0": "PH-20240403-24", "x1": "PH-20240403-24", "y0": 873.822061187077, "y1": 872.822061187077, "line": { "color": "red", "width": 40 }, "type": "line" } ], "barmode": "overlay", "template": { "data": { "bar": [ { "type": "bar", "marker": { "line": { "color": "#E5ECF6", "width": 0.5 }, "pattern": { "size": 10, "fillmode": "overlay", "solidity": 0.2 } }, "error_x": { "color": "#2a3f5f" }, "error_y": { "color": "#2a3f5f" } } ], "pie": [ { "type": "pie", "automargin": true } ], "table": [ { "type": "table", "cells": { "fill": { "color": "#EBF0F8" }, "line": { "color": "white" } }, "header": { "fill": { "color": "#C8D4E3" }, "line": { "color": "white" } } } ], "carpet": [ { "type": "carpet", "aaxis": { "gridcolor": "white", "linecolor": "white", "endlinecolor": "#2a3f5f", "minorgridcolor": "white", "startlinecolor": "#2a3f5f" }, "baxis": { "gridcolor": "white", "linecolor": "white", "endlinecolor": "#2a3f5f", "minorgridcolor": "white", "startlinecolor": "#2a3f5f" } } ], "mesh3d": [ { "type": "mesh3d", "colorbar": { "ticks": "", "outlinewidth": 0 } } ], "contour": [ { "type": "contour", "colorbar": { "ticks": "", "outlinewidth": 0 }, "colorscale": [ [ 0.0, "#0d0887" ], [ 0.1111111111111111, "#46039f" ], [ 0.2222222222222222, "#7201a8" ], [ 0.3333333333333333, "#9c179e" ], [ 0.4444444444444444, "#bd3786" ], [ 0.5555555555555556, "#d8576b" ], [ 0.6666666666666666, "#ed7953" ], [ 0.7777777777777778, "#fb9f3a" ], [ 0.8888888888888888, "#fdca26" ], [ 1.0, "#f0f921" ] ] } ], "heatmap": [ { "type": "heatmap", "colorbar": { "ticks": "", "outlinewidth": 0 }, "colorscale": [ [ 0.0, "#0d0887" ], [ 0.1111111111111111, "#46039f" ], [ 0.2222222222222222, "#7201a8" ], [ 0.3333333333333333, "#9c179e" ], [ 0.4444444444444444, "#bd3786" ], [ 0.5555555555555556, "#d8576b" ], [ 0.6666666666666666, "#ed7953" ], [ 0.7777777777777778, "#fb9f3a" ], [ 0.8888888888888888, "#fdca26" ], [ 1.0, "#f0f921" ] ] } ], "scatter": [ { "type": "scatter", "fillpattern": { "size": 10, "fillmode": "overlay", "solidity": 0.2 } } ], "surface": [ { "type": "surface", "colorbar": { "ticks": "", "outlinewidth": 0 }, "colorscale": [ [ 0.0, "#0d0887" ], [ 0.1111111111111111, "#46039f" ], [ 0.2222222222222222, "#7201a8" ], [ 0.3333333333333333, "#9c179e" ], [ 0.4444444444444444, "#bd3786" ], [ 0.5555555555555556, "#d8576b" ], [ 0.6666666666666666, "#ed7953" ], [ 0.7777777777777778, "#fb9f3a" ], [ 0.8888888888888888, "#fdca26" ], [ 1.0, "#f0f921" ] ] } ], "barpolar": [ { "type": "barpolar", "marker": { "line": { "color": "#E5ECF6", "width": 0.5 }, "pattern": { "size": 10, "fillmode": "overlay", "solidity": 0.2 } } } ], "heatmapgl": [ { "type": "heatmapgl", "colorbar": { "ticks": "", "outlinewidth": 0 }, "colorscale": [ [ 0.0, "#0d0887" ], [ 0.1111111111111111, "#46039f" ], [ 0.2222222222222222, "#7201a8" ], [ 0.3333333333333333, "#9c179e" ], [ 0.4444444444444444, "#bd3786" ], [ 0.5555555555555556, "#d8576b" ], [ 0.6666666666666666, "#ed7953" ], [ 0.7777777777777778, "#fb9f3a" ], [ 0.8888888888888888, "#fdca26" ], [ 1.0, "#f0f921" ] ] } ], "histogram": [ { "type": "histogram", "marker": { "pattern": { "size": 10, "fillmode": "overlay", "solidity": 0.2 } } } ], "parcoords": [ { "line": { "colorbar": { "ticks": "", "outlinewidth": 0 } }, "type": "parcoords" } ], "scatter3d": [ { "line": { "colorbar": { "ticks": "", "outlinewidth": 0 } }, "type": "scatter3d", "marker": { "colorbar": { "ticks": "", "outlinewidth": 0 } } } ], "scattergl": [ { "type": "scattergl", "marker": { "colorbar": { "ticks": "", "outlinewidth": 0 } } } ], "choropleth": [ { "type": "choropleth", "colorbar": { "ticks": "", "outlinewidth": 0 } } ], "scattergeo": [ { "type": "scattergeo", "marker": { "colorbar": { "ticks": "", "outlinewidth": 0 } } } ], "histogram2d": [ { "type": "histogram2d", "colorbar": { "ticks": "", "outlinewidth": 0 }, "colorscale": [ [ 0.0, "#0d0887" ], [ 0.1111111111111111, "#46039f" ], [ 0.2222222222222222, "#7201a8" ], [ 0.3333333333333333, "#9c179e" ], [ 0.4444444444444444, "#bd3786" ], [ 0.5555555555555556, "#d8576b" ], [ 0.6666666666666666, "#ed7953" ], [ 0.7777777777777778, "#fb9f3a" ], [ 0.8888888888888888, "#fdca26" ], [ 1.0, "#f0f921" ] ] } ], "scatterpolar": [ { "type": "scatterpolar", "marker": { "colorbar": { "ticks": "", "outlinewidth": 0 } } } ], "contourcarpet": [ { "type": "contourcarpet", "colorbar": { "ticks": "", "outlinewidth": 0 } } ], "scattercarpet": [ { "type": "scattercarpet", "marker": { "colorbar": { "ticks": "", "outlinewidth": 0 } } } ], "scattermapbox": [ { "type": "scattermapbox", "marker": { "colorbar": { "ticks": "", "outlinewidth": 0 } } } ], "scatterpolargl": [ { "type": "scatterpolargl", "marker": { "colorbar": { "ticks": "", "outlinewidth": 0 } } } ], "scatterternary": [ { "type": "scatterternary", "marker": { "colorbar": { "ticks": "", "outlinewidth": 0 } } } ], "histogram2dcontour": [ { "type": "histogram2dcontour", "colorbar": { "ticks": "", "outlinewidth": 0 }, "colorscale": [ [ 0.0, "#0d0887" ], [ 0.1111111111111111, "#46039f" ], [ 0.2222222222222222, "#7201a8" ], [ 0.3333333333333333, "#9c179e" ], [ 0.4444444444444444, "#bd3786" ], [ 0.5555555555555556, "#d8576b" ], [ 0.6666666666666666, "#ed7953" ], [ 0.7777777777777778, "#fb9f3a" ], [ 0.8888888888888888, "#fdca26" ], [ 1.0, "#f0f921" ] ] } ] }, "layout": { "geo": { "bgcolor": "white", "showland": true, "lakecolor": "white", "landcolor": "#E5ECF6", "showlakes": true, "subunitcolor": "white" }, "font": { "color": "#2a3f5f" }, "polar": { "bgcolor": "#E5ECF6", "radialaxis": { "ticks": "", "gridcolor": "white", "linecolor": "white" }, "angularaxis": { "ticks": "", "gridcolor": "white", "linecolor": "white" } }, "scene": { "xaxis": { "ticks": "", "gridcolor": "white", "gridwidth": 2, "linecolor": "white", "zerolinecolor": "white", "showbackground": true, "backgroundcolor": "#E5ECF6" }, "yaxis": { "ticks": "", "gridcolor": "white", "gridwidth": 2, "linecolor": "white", "zerolinecolor": "white", "showbackground": true, "backgroundcolor": "#E5ECF6" }, "zaxis": { "ticks": "", "gridcolor": "white", "gridwidth": 2, "linecolor": "white", "zerolinecolor": "white", "showbackground": true, "backgroundcolor": "#E5ECF6" } }, "title": { "x": 0.05 }, "xaxis": { "ticks": "", "title": { "standoff": 15 }, "gridcolor": "white", "linecolor": "white", "automargin": true, "zerolinecolor": "white", "zerolinewidth": 2 }, "yaxis": { "ticks": "", "title": { "standoff": 15 }, "gridcolor": "white", "linecolor": "white", "automargin": true, "zerolinecolor": "white", "zerolinewidth": 2 }, "mapbox": { "style": "light" }, "ternary": { "aaxis": { "ticks": "", "gridcolor": "white", "linecolor": "white" }, "baxis": { "ticks": "", "gridcolor": "white", "linecolor": "white" }, "caxis": { "ticks": "", "gridcolor": "white", "linecolor": "white" }, "bgcolor": "#E5ECF6" }, "colorway": [ "#636efa", "#EF553B", "#00cc96", "#ab63fa", "#FFA15A", "#19d3f3", "#FF6692", "#B6E880", "#FF97FF", "#FECB52" ], "coloraxis": { "colorbar": { "ticks": "", "outlinewidth": 0 } }, "hovermode": "closest", "colorscale": { "diverging": [ [ 0, "#8e0152" ], [ 0.1, "#c51b7d" ], [ 0.2, "#de77ae" ], [ 0.3, "#f1b6da" ], [ 0.4, "#fde0ef" ], [ 0.5, "#f7f7f7" ], [ 0.6, "#e6f5d0" ], [ 0.7, "#b8e186" ], [ 0.8, "#7fbc41" ], [ 0.9, "#4d9221" ], [ 1, "#276419" ] ], "sequential": [ [ 0.0, "#0d0887" ], [ 0.1111111111111111, "#46039f" ], [ 0.2222222222222222, "#7201a8" ], [ 0.3333333333333333, "#9c179e" ], [ 0.4444444444444444, "#bd3786" ], [ 0.5555555555555556, "#d8576b" ], [ 0.6666666666666666, "#ed7953" ], [ 0.7777777777777778, "#fb9f3a" ], [ 0.8888888888888888, "#fdca26" ], [ 1.0, "#f0f921" ] ], "sequentialminus": [ [ 0.0, "#0d0887" ], [ 0.1111111111111111, "#46039f" ], [ 0.2222222222222222, "#7201a8" ], [ 0.3333333333333333, "#9c179e" ], [ 0.4444444444444444, "#bd3786" ], [ 0.5555555555555556, "#d8576b" ], [ 0.6666666666666666, "#ed7953" ], [ 0.7777777777777778, "#fb9f3a" ], [ 0.8888888888888888, "#fdca26" ], [ 1.0, "#f0f921" ] ] }, "hoverlabel": { "align": "left" }, "plot_bgcolor": "#E5ECF6", "paper_bgcolor": "white", "shapedefaults": { "line": { "color": "#2a3f5f" } }, "autotypenumbers": "strict", "annotationdefaults": { "arrowhead": 0, "arrowcolor": "#2a3f5f", "arrowwidth": 1 } } }, "annotations": [ { "x": "PH-20240403-01", "y": 210.856305055905, "font": { "size": 20, "color": "black", "family": "Arial" }, "text": "201", "yshift": 10, "showarrow": false }, { "x": "PH-20240403-02", "y": 444.153870194238, "font": { "size": 20, "color": "black", "family": "Arial" }, "text": "434", "yshift": 10, "showarrow": false }, { "x": "PH-20240403-03", "y": 591.630565361267, "font": { "size": 20, "color": "black", "family": "Arial" }, "text": "582", "yshift": 10, "showarrow": false }, { "x": "PH-20240403-04", "y": 649.923461670622, "font": { "size": 20, "color": "black", "family": "Arial" }, "text": "640", "yshift": 10, "showarrow": false }, { "x": "PH-20240403-05", "y": 369.993570480094, "font": { "size": 20, "color": "black", "family": "Arial" }, "text": "360", "yshift": 10, "showarrow": false }, { "x": "PH-20240403-06", "y": 278.693932160365, "font": { "size": 20, "color": "black", "family": "Arial" }, "text": "269", "yshift": 10, "showarrow": false }, { "x": "PH-20240403-07", "y": 276.181504387913, "font": { "size": 20, "color": "black", "family": "Arial" }, "text": "266", "yshift": 10, "showarrow": false }, { "x": "PH-20240403-08", "y": 227.81414604832, "font": { "size": 20, "color": "black", "family": "Arial" }, "text": "218", "yshift": 10, "showarrow": false }, { "x": "PH-20240403-09", "y": 523.714254903754, "font": { "size": 20, "color": "black", "family": "Arial" }, "text": "514", "yshift": 10, "showarrow": false }, { "x": "PH-20240403-10", "y": 712.699413771317, "font": { "size": 20, "color": "black", "family": "Arial" }, "text": "703", "yshift": 10, "showarrow": false }, { "x": "PH-20240403-11", "y": 709.864540022818, "font": { "size": 20, "color": "black", "family": "Arial" }, "text": "700", "yshift": 10, "showarrow": false }, { "x": "PH-20240403-12", "y": 720.856463395243, "font": { "size": 20, "color": "black", "family": "Arial" }, "text": "711", "yshift": 10, "showarrow": false }, { "x": "PH-20240403-13", "y": 710.46912419214, "font": { "size": 20, "color": "black", "family": "Arial" }, "text": "700", "yshift": 10, "showarrow": false }, { "x": "PH-20240403-14", "y": 712.27473246224, "font": { "size": 20, "color": "black", "family": "Arial" }, "text": "702", "yshift": 10, "showarrow": false }, { "x": "PH-20240403-15", "y": 709.316588432861, "font": { "size": 20, "color": "black", "family": "Arial" }, "text": "699", "yshift": 10, "showarrow": false }, { "x": "PH-20240403-16", "y": 707.272460357037, "font": { "size": 20, "color": "black", "family": "Arial" }, "text": "697", "yshift": 10, "showarrow": false }, { "x": "PH-20240403-17", "y": 690.315537634898, "font": { "size": 20, "color": "black", "family": "Arial" }, "text": "680", "yshift": 10, "showarrow": false }, { "x": "PH-20240403-18", "y": 663.74929375734, "font": { "size": 20, "color": "black", "family": "Arial" }, "text": "654", "yshift": 10, "showarrow": false }, { "x": "PH-20240403-19", "y": 287.166736563996, "font": { "size": 20, "color": "black", "family": "Arial" }, "text": "277", "yshift": 10, "showarrow": false }, { "x": "PH-20240403-20", "y": 130.085524803281, "font": { "size": 20, "color": "black", "family": "Arial" }, "text": "120", "yshift": 10, "showarrow": false }, { "x": "PH-20240403-21", "y": 227.416660758345, "font": { "size": 20, "color": "black", "family": "Arial" }, "text": "217", "yshift": 10, "showarrow": false }, { "x": "PH-20240403-22", "y": 308.127174563001, "font": { "size": 20, "color": "black", "family": "Arial" }, "text": "298", "yshift": 10, "showarrow": false }, { "x": "PH-20240403-23", "y": 437.443435817402, "font": { "size": 20, "color": "black", "family": "Arial" }, "text": "427", "yshift": 10, "showarrow": false }, { "x": "PH-20240403-24", "y": 878.822061187077, "font": { "size": 20, "color": "black", "family": "Arial" }, "text": "869", "yshift": 10, "showarrow": false } ] } }, "height": null, "width": null, "user": { "profile_url": "https://chart-studio.plotly.com/~Cremita8898", "avatar_url": "https://storage.googleapis.com/plotly-prod-profiles/39.jpg", "background_url": "https://storage.googleapis.com/plotly-prod-profiles/bg-3.jpg", "bio": "", "nickname": "", "website": "", "stream_tokens": null, "feature_set_id": null, "csrf_token": null, "date_joined": "2024-04-02 09:10:13", "mapbox_access_tokens": null, "has_password": null, "username": "Cremita8898", "email": null, "is_active": null, "readonly": null, "is_dash_creator": null, "dash_created_count": null, "is_chart_creator": null, "charts_created_count": null } }, { "creation_time": "2024-04-02T09:08:32.039961Z", "comments": { "results": [], "count": 0 }, "parented": true, "embed_url": "https://chart-studio.plotly.com/~hkumar30/1.embed", "fid": "hkumar30:1", "filename": "Sprint 4", "filetype": "plot", "img_url": "https://api.plotly.com/v2/files/hkumar30:1/image?image_name=list-thumb", "image_urls": { "default": "https://storage.googleapis.com/plotly-prod-images/hkumar30/1/2_8TQXC6X2DHGH0POXLSXDED5ZGL84RR.png", "block-thumb": "https://storage.googleapis.com/plotly-prod-images/hkumar30/1/8_OSMW3F472X0G4Y38NZZII9P6615TUL.png", "list-thumb": "https://api.plotly.com/v2/files/hkumar30:1/image?image_name=list-thumb" }, "api_urls": { "files": "https://api.plotly.com/v2/files/hkumar30:1", "plots": "https://api.plotly.com/v2/plots/hkumar30:1", "parent": "https://api.plotly.com/v2/folders/home?user=hkumar30" }, "owner": "hkumar30", "parent": -1, "preview": "", "referencers": [], "references": [], "title": "", "views": 1, "web_url": "https://chart-studio.plotly.com/~hkumar30/1/", "world_readable": true, "date_modified": "2024-10-07T02:13:58.479Z", "stars": { "results": [], "count": 0 }, "collaborators": { "results": [], "count": 0 }, "subfolder_count": null, "refresh_interval": null, "organize_view_url": "https://chart-studio.plotly.com/~hkumar30/1/", "current_user_permission": "read", "is_theme": null, "is_template": false, "autosize": true, "caption": "", "figure": { "data": [ { "meta": { "columnNames": { "x": "A", "y": "B" } }, "mode": "lines", "name": "Harsh", "type": "scatter", "xsrc": "hkumar30:0:68aa18", "ysrc": "hkumar30:0:59baa7", "visible": true }, { "meta": { "columnNames": { "x": "A", "y": "C" } }, "mode": "lines", "name": "Julia", "type": "scatter", "xsrc": "hkumar30:0:68aa18", "ysrc": "hkumar30:0:fa515b", "stackgroup": null }, { "meta": { "columnNames": { "x": "A", "y": "D" } }, "mode": "lines", "name": "Guna", "type": "scatter", "xsrc": "hkumar30:0:68aa18", "ysrc": "hkumar30:0:6f03b1", "stackgroup": null }, { "meta": { "columnNames": { "x": "A", "y": "E" } }, "mode": "lines", "name": "Peshal", "type": "scatter", "xsrc": "hkumar30:0:68aa18", "ysrc": "hkumar30:0:3862ab", "orientation": "v" }, { "meta": { "columnNames": { "x": "A", "y": "F" } }, "mode": "lines", "name": "Total", "type": "scatter", "xsrc": "hkumar30:0:68aa18", "ysrc": "hkumar30:0:bbb1cb", "stackgroup": null } ], "frames": [], "layout": { "title": { "x": 0.05, "text": "Sprint Velocities" }, "xaxis": { "side": "bottom", "type": "linear", "range": [ 0, 4 ], "title": { "text": "Sprint" }, "domain": [ 0, 1 ], "nticks": 4, "autorange": false, "gridwidth": 1, "fixedrange": false, "showspikes": false, "rangeslider": { "range": [ 0, 3 ], "yaxis": {}, "visible": false, "autorange": true }, "zerolinewidth": 2 }, "yaxis": { "side": "left", "type": "linear", "range": [ 5, 12 ], "title": { "text": "Velocity" }, "domain": [ 0, 1 ], "autorange": false, "fixedrange": false, "showspikes": false }, "legend": { "x": 0.2731379731379734, "y": 1.1215430267062316, "font": { "size": 14, "family": "Balto" }, "title": { "text": "<br>" }, "borderwidth": 0, "orientation": "h" }, "margin": { "t": 100 }, "autosize": true, "dragmode": "zoom", "template": { "data": { "bar": [ { "type": "bar", "marker": { "colorbar": { "ticks": "", "outlinewidth": 0 } } } ], "table": [ { "type": "table", "cells": { "fill": { "color": "#EBF0F8" }, "line": { "color": "white" } }, "header": { "fill": { "color": "#C8D4E3" }, "line": { "color": "white" } } } ], "carpet": [ { "type": "carpet", "aaxis": { "gridcolor": "#C8D4E3", "linecolor": "#C8D4E3", "endlinecolor": "#2a3f5f", "minorgridcolor": "#C8D4E3", "startlinecolor": "#2a3f5f" }, "baxis": { "gridcolor": "#C8D4E3", "linecolor": "#C8D4E3", "endlinecolor": "#2a3f5f", "minorgridcolor": "#C8D4E3", "startlinecolor": "#2a3f5f" } } ], "mesh3d": [ { "type": "mesh3d", "colorbar": { "ticks": "", "outlinewidth": 0 } } ], "contour": [ { "type": "contour", "colorbar": { "ticks": "", "outlinewidth": 0 }, "autocolorscale": true } ], "heatmap": [ { "type": "heatmap", "colorbar": { "ticks": "", "outlinewidth": 0 }, "autocolorscale": true } ], "scatter": [ { "type": "scatter", "marker": { "colorbar": { "ticks": "", "outlinewidth": 0 } } } ], "surface": [ { "type": "surface", "colorbar": { "ticks": "", "outlinewidth": 0 } } ], "heatmapgl": [ { "type": "heatmapgl", "colorbar": { "ticks": "", "outlinewidth": 0 } } ], "histogram": [ { "type": "histogram", "marker": { "colorbar": { "ticks": "", "outlinewidth": 0 } } } ], "parcoords": [ { "line": { "colorbar": { "ticks": "", "outlinewidth": 0 } }, "type": "parcoords" } ], "scatter3d": [ { "type": "scatter3d", "marker": { "colorbar": { "ticks": "", "outlinewidth": 0 } } } ], "scattergl": [ { "type": "scattergl", "marker": { "colorbar": { "ticks": "", "outlinewidth": 0 } } } ], "choropleth": [ { "type": "choropleth", "colorbar": { "ticks": "", "outlinewidth": 0 } } ], "scattergeo": [ { "type": "scattergeo", "marker": { "colorbar": { "ticks": "", "outlinewidth": 0 } } } ], "histogram2d": [ { "type": "histogram2d", "colorbar": { "ticks": "", "outlinewidth": 0 }, "autocolorscale": true } ], "scatterpolar": [ { "type": "scatterpolar", "marker": { "colorbar": { "ticks": "", "outlinewidth": 0 } } } ], "contourcarpet": [ { "type": "contourcarpet", "colorbar": { "ticks": "", "outlinewidth": 0 } } ], "scattercarpet": [ { "type": "scattercarpet", "marker": { "colorbar": { "ticks": "", "outlinewidth": 0 } } } ], "scattermapbox": [ { "type": "scattermapbox", "marker": { "colorbar": { "ticks": "", "outlinewidth": 0 } } } ], "scatterpolargl": [ { "type": "scatterpolargl", "marker": { "colorbar": { "ticks": "", "outlinewidth": 0 } } } ], "scatterternary": [ { "type": "scatterternary", "marker": { "colorbar": { "ticks": "", "outlinewidth": 0 } } } ], "histogram2dcontour": [ { "type": "histogram2dcontour", "colorbar": { "ticks": "", "outlinewidth": 0 }, "autocolorscale": true } ] }, "layout": { "geo": { "bgcolor": "white", "showland": true, "lakecolor": "white", "landcolor": "white", "showlakes": true, "subunitcolor": "#C8D4E3" }, "font": { "color": "#2a3f5f" }, "polar": { "bgcolor": "white", "radialaxis": { "ticks": "", "gridcolor": "#EBF0F8", "linecolor": "#EBF0F8" }, "angularaxis": { "ticks": "", "gridcolor": "#EBF0F8", "linecolor": "#EBF0F8" } }, "scene": { "xaxis": { "ticks": "", "gridcolor": "#DFE8F3", "gridwidth": 2, "linecolor": "#EBF0F8", "zerolinecolor": "#EBF0F8", "showbackground": true, "backgroundcolor": "white" }, "yaxis": { "ticks": "", "gridcolor": "#DFE8F3", "gridwidth": 2, "linecolor": "#EBF0F8", "zerolinecolor": "#EBF0F8", "showbackground": true, "backgroundcolor": "white" }, "zaxis": { "ticks": "", "gridcolor": "#DFE8F3", "gridwidth": 2, "linecolor": "#EBF0F8", "zerolinecolor": "#EBF0F8", "showbackground": true, "backgroundcolor": "white" } }, "title": { "x": 0.05 }, "xaxis": { "ticks": "", "gridcolor": "#EBF0F8", "linecolor": "#EBF0F8", "automargin": true, "zerolinecolor": "#EBF0F8", "zerolinewidth": 2 }, "yaxis": { "ticks": "", "gridcolor": "#EBF0F8", "linecolor": "#EBF0F8", "automargin": true, "zerolinecolor": "#EBF0F8", "zerolinewidth": 2 }, "ternary": { "aaxis": { "ticks": "", "gridcolor": "#DFE8F3", "linecolor": "#A2B1C6" }, "baxis": { "ticks": "", "gridcolor": "#DFE8F3", "linecolor": "#A2B1C6" }, "caxis": { "ticks": "", "gridcolor": "#DFE8F3", "linecolor": "#A2B1C6" }, "bgcolor": "white" }, "colorway": [ "#636efa", "#EF553B", "#00cc96", "#ab63fa", "#19d3f3", "#e763fa", "#fecb52", "#ffa15a", "#ff6692", "#b6e880" ], "hovermode": "closest", "colorscale": { "diverging": [ [ 0, "#8e0152" ], [ 0.1, "#c51b7d" ], [ 0.2, "#de77ae" ], [ 0.3, "#f1b6da" ], [ 0.4, "#fde0ef" ], [ 0.5, "#f7f7f7" ], [ 0.6, "#e6f5d0" ], [ 0.7, "#b8e186" ], [ 0.8, "#7fbc41" ], [ 0.9, "#4d9221" ], [ 1, "#276419" ] ], "sequential": [ [ 0, "#0508b8" ], [ 0.0893854748603352, "#1910d8" ], [ 0.1787709497206704, "#3c19f0" ], [ 0.2681564245810056, "#6b1cfb" ], [ 0.3575418994413408, "#981cfd" ], [ 0.44692737430167595, "#bf1cfd" ], [ 0.5363128491620112, "#dd2bfd" ], [ 0.6256983240223464, "#f246fe" ], [ 0.7150837988826816, "#fc67fd" ], [ 0.8044692737430168, "#fe88fc" ], [ 0.8938547486033519, "#fea5fd" ], [ 0.9832402234636871, "#febefe" ], [ 1, "#fec3fe" ] ], "sequentialminus": [ [ 0, "#0508b8" ], [ 0.0893854748603352, "#1910d8" ], [ 0.1787709497206704, "#3c19f0" ], [ 0.2681564245810056, "#6b1cfb" ], [ 0.3575418994413408, "#981cfd" ], [ 0.44692737430167595, "#bf1cfd" ], [ 0.5363128491620112, "#dd2bfd" ], [ 0.6256983240223464, "#f246fe" ], [ 0.7150837988826816, "#fc67fd" ], [ 0.8044692737430168, "#fe88fc" ], [ 0.8938547486033519, "#fea5fd" ], [ 0.9832402234636871, "#febefe" ], [ 1, "#fec3fe" ] ] }, "plot_bgcolor": "white", "paper_bgcolor": "white", "shapedefaults": { "line": { "width": 0 }, "opacity": 0.4, "fillcolor": "#506784" }, "annotationdefaults": { "arrowhead": 0, "arrowcolor": "#506784", "arrowwidth": 1 } }, "themeRef": "PLOTLY_WHITE" }, "hovermode": "closest" } }, "height": null, "width": null, "user": { "profile_url": "https://chart-studio.plotly.com/~hkumar30", "avatar_url": "https://storage.googleapis.com/plotly-prod-profiles/89.jpg", "background_url": "https://storage.googleapis.com/plotly-prod-profiles/bg-5.jpg", "bio": "", "nickname": "", "website": "", "stream_tokens": null, "feature_set_id": null, "csrf_token": null, "date_joined": "2024-04-02 09:08:03", "mapbox_access_tokens": null, "has_password": null, "username": "hkumar30", "email": null, "is_active": null, "readonly": null, "is_dash_creator": null, "dash_created_count": null, "is_chart_creator": null, "charts_created_count": null } }, { "creation_time": "2024-04-02T08:56:34.765915Z", "comments": { "results": [], "count": 0 }, "parented": true, "embed_url": "https://chart-studio.plotly.com/~Esanta/54.embed", "fid": "Esanta:54", "filename": "plot from API (27)", "filetype": "plot", "img_url": "https://storage.googleapis.com/plotly-prod-images/Esanta/54/9_SP7XPJY7FWME9M2DOMBWTF656AYD9O.png", "image_urls": { "default": "https://storage.googleapis.com/plotly-prod-images/Esanta/54/2_P9YDLL9P6YRDX11ILZPSHJ0LF7FV9K.png", "block-thumb": "https://storage.googleapis.com/plotly-prod-images/Esanta/54/8_FTER2J8P4UB948IAGBFEEDNGIEGUB6.png", "list-thumb": "https://storage.googleapis.com/plotly-prod-images/Esanta/54/9_SP7XPJY7FWME9M2DOMBWTF656AYD9O.png" }, "api_urls": { "files": "https://api.plotly.com/v2/files/Esanta:54", "plots": "https://api.plotly.com/v2/plots/Esanta:54", "parent": "https://api.plotly.com/v2/folders/home?user=Esanta" }, "owner": "Esanta", "parent": -1, "preview": "", "referencers": [], "references": [], "title": "Systolic vs Diastolic", "views": 2, "web_url": "https://chart-studio.plotly.com/~Esanta/54/systolic-vs-diastolic/", "world_readable": true, "date_modified": "2024-06-19T07:09:35.416Z", "stars": { "results": [], "count": 0 }, "collaborators": { "results": [], "count": 0 }, "subfolder_count": null, "refresh_interval": null, "organize_view_url": "https://chart-studio.plotly.com/~Esanta/54/", "current_user_permission": "read", "is_theme": null, "is_template": null, "autosize": true, "caption": "", "figure": { "data": [ { "line": { "color": "blue" }, "mode": "lines markers", "name": "Systolic", "type": "scatter", "xsrc": "Esanta:55:9b2252", "ysrc": "Esanta:55:04d187", "textsrc": "Esanta:55:16be48" }, { "line": { "color": "green" }, "mode": "lines markers", "name": "Diastolic", "type": "scatter", "xsrc": "Esanta:55:9b2252", "ysrc": "Esanta:55:f47752", "textsrc": "Esanta:55:16be48" } ], "layout": {} }, "height": null, "width": null, "user": { "profile_url": "https://chart-studio.plotly.com/~Esanta", "avatar_url": "https://storage.googleapis.com/plotly-prod-profiles/69.jpg", "background_url": "https://storage.googleapis.com/plotly-prod-profiles/bg-11.jpg", "bio": "", "nickname": "", "website": "", "stream_tokens": null, "feature_set_id": null, "csrf_token": null, "date_joined": "2024-03-27 19:43:48", "mapbox_access_tokens": null, "has_password": null, "username": "Esanta", "email": null, "is_active": null, "readonly": null, "is_dash_creator": null, "dash_created_count": null, "is_chart_creator": null, "charts_created_count": null } }, { "creation_time": "2024-04-02T08:49:08.108376Z", "comments": { "results": [], "count": 0 }, "parented": true, "embed_url": "https://chart-studio.plotly.com/~beneelaa/1.embed", "fid": "beneelaa:1", "filename": "G2U_P", "filetype": "plot", "img_url": "https://storage.googleapis.com/plotly-prod-images/beneelaa/1/9_KK7YE522AIT2NQBJP6LMNAF11NHEFH.png", "image_urls": { "default": "https://storage.googleapis.com/plotly-prod-images/beneelaa/1/2_AFLYA31BMY6373GJ9AHUXA9CM4LPND.png", "block-thumb": "https://storage.googleapis.com/plotly-prod-images/beneelaa/1/8_PQ6BR4E7RQAO62NJ99GNAC35QSQJTW.png", "list-thumb": "https://storage.googleapis.com/plotly-prod-images/beneelaa/1/9_KK7YE522AIT2NQBJP6LMNAF11NHEFH.png" }, "api_urls": { "files": "https://api.plotly.com/v2/files/beneelaa:1", "plots": "https://api.plotly.com/v2/plots/beneelaa:1", "parent": "https://api.plotly.com/v2/folders/home?user=beneelaa" }, "owner": "beneelaa", "parent": -1, "preview": "", "referencers": [], "references": [], "title": "", "views": 2, "web_url": "https://chart-studio.plotly.com/~beneelaa/1/", "world_readable": true, "date_modified": "2024-04-03T00:51:27.684Z", "stars": { "results": [], "count": 0 }, "collaborators": { "results": [], "count": 0 }, "subfolder_count": null, "refresh_interval": null, "organize_view_url": "https://chart-studio.plotly.com/~beneelaa/1/", "current_user_permission": "read", "is_theme": null, "is_template": false, "autosize": true, "caption": "", "figure": { "data": [ { "mode": "lines", "type": "scatter" }, { "meta": { "columnNames": { "x": "1100.000000", "y": "0.375538" } }, "mode": "lines", "type": "scatter", "xsrc": "beneelaa:0:606558", "ysrc": "beneelaa:0:7fb0d4", "stackgroup": null } ], "frames": [], "layout": { "title": { "text": "G2U_A" }, "xaxis": { "type": "linear", "range": [ 190, 1099.95 ], "autorange": true }, "yaxis": { "type": "linear", "range": [ -0.0851758888888889, 1.2492218888888889 ], "autorange": true }, "autosize": true, "template": { "data": { "bar": [ { "type": "bar", "marker": { "colorbar": { "ticks": "", "outlinewidth": 0 } } } ], "table": [ { "type": "table", "cells": { "fill": { "color": "#EBF0F8" }, "line": { "color": "white" } }, "header": { "fill": { "color": "#C8D4E3" }, "line": { "color": "white" } } } ], "carpet": [ { "type": "carpet", "aaxis": { "gridcolor": "#C8D4E3", "linecolor": "#C8D4E3", "endlinecolor": "#2a3f5f", "minorgridcolor": "#C8D4E3", "startlinecolor": "#2a3f5f" }, "baxis": { "gridcolor": "#C8D4E3", "linecolor": "#C8D4E3", "endlinecolor": "#2a3f5f", "minorgridcolor": "#C8D4E3", "startlinecolor": "#2a3f5f" } } ], "mesh3d": [ { "type": "mesh3d", "colorbar": { "ticks": "", "outlinewidth": 0 } } ], "contour": [ { "type": "contour", "colorbar": { "ticks": "", "outlinewidth": 0 }, "autocolorscale": true } ], "heatmap": [ { "type": "heatmap", "colorbar": { "ticks": "", "outlinewidth": 0 }, "autocolorscale": true } ], "scatter": [ { "type": "scatter", "marker": { "colorbar": { "ticks": "", "outlinewidth": 0 } } } ], "surface": [ { "type": "surface", "colorbar": { "ticks": "", "outlinewidth": 0 } } ], "heatmapgl": [ { "type": "heatmapgl", "colorbar": { "ticks": "", "outlinewidth": 0 } } ], "histogram": [ { "type": "histogram", "marker": { "colorbar": { "ticks": "", "outlinewidth": 0 } } } ], "parcoords": [ { "line": { "colorbar": { "ticks": "", "outlinewidth": 0 } }, "type": "parcoords" } ], "scatter3d": [ { "type": "scatter3d", "marker": { "colorbar": { "ticks": "", "outlinewidth": 0 } } } ], "scattergl": [ { "type": "scattergl", "marker": { "colorbar": { "ticks": "", "outlinewidth": 0 } } } ], "choropleth": [ { "type": "choropleth", "colorbar": { "ticks": "", "outlinewidth": 0 } } ], "scattergeo": [ { "type": "scattergeo", "marker": { "colorbar": { "ticks": "", "outlinewidth": 0 } } } ], "histogram2d": [ { "type": "histogram2d", "colorbar": { "ticks": "", "outlinewidth": 0 }, "autocolorscale": true } ], "scatterpolar": [ { "type": "scatterpolar", "marker": { "colorbar": { "ticks": "", "outlinewidth": 0 } } } ], "contourcarpet": [ { "type": "contourcarpet", "colorbar": { "ticks": "", "outlinewidth": 0 } } ], "scattercarpet": [ { "type": "scattercarpet", "marker": { "colorbar": { "ticks": "", "outlinewidth": 0 } } } ], "scattermapbox": [ { "type": "scattermapbox", "marker": { "colorbar": { "ticks": "", "outlinewidth": 0 } } } ], "scatterpolargl": [ { "type": "scatterpolargl", "marker": { "colorbar": { "ticks": "", "outlinewidth": 0 } } } ], "scatterternary": [ { "type": "scatterternary", "marker": { "colorbar": { "ticks": "", "outlinewidth": 0 } } } ], "histogram2dcontour": [ { "type": "histogram2dcontour", "colorbar": { "ticks": "", "outlinewidth": 0 }, "autocolorscale": true } ] }, "layout": { "geo": { "bgcolor": "white", "showland": true, "lakecolor": "white", "landcolor": "white", "showlakes": true, "subunitcolor": "#C8D4E3" }, "font": { "color": "#2a3f5f" }, "polar": { "bgcolor": "white", "radialaxis": { "ticks": "", "gridcolor": "#EBF0F8", "linecolor": "#EBF0F8" }, "angularaxis": { "ticks": "", "gridcolor": "#EBF0F8", "linecolor": "#EBF0F8" } }, "scene": { "xaxis": { "ticks": "", "gridcolor": "#DFE8F3", "gridwidth": 2, "linecolor": "#EBF0F8", "zerolinecolor": "#EBF0F8", "showbackground": true, "backgroundcolor": "white" }, "yaxis": { "ticks": "", "gridcolor": "#DFE8F3", "gridwidth": 2, "linecolor": "#EBF0F8", "zerolinecolor": "#EBF0F8", "showbackground": true, "backgroundcolor": "white" }, "zaxis": { "ticks": "", "gridcolor": "#DFE8F3", "gridwidth": 2, "linecolor": "#EBF0F8", "zerolinecolor": "#EBF0F8", "showbackground": true, "backgroundcolor": "white" } }, "title": { "x": 0.05 }, "xaxis": { "ticks": "", "gridcolor": "#EBF0F8", "linecolor": "#EBF0F8", "automargin": true, "zerolinecolor": "#EBF0F8", "zerolinewidth": 2 }, "yaxis": { "ticks": "", "gridcolor": "#EBF0F8", "linecolor": "#EBF0F8", "automargin": true, "zerolinecolor": "#EBF0F8", "zerolinewidth": 2 }, "ternary": { "aaxis": { "ticks": "", "gridcolor": "#DFE8F3", "linecolor": "#A2B1C6" }, "baxis": { "ticks": "", "gridcolor": "#DFE8F3", "linecolor": "#A2B1C6" }, "caxis": { "ticks": "", "gridcolor": "#DFE8F3", "linecolor": "#A2B1C6" }, "bgcolor": "white" }, "colorway": [ "#636efa", "#EF553B", "#00cc96", "#ab63fa", "#19d3f3", "#e763fa", "#fecb52", "#ffa15a", "#ff6692", "#b6e880" ], "hovermode": "closest", "colorscale": { "diverging": [ [ 0, "#8e0152" ], [ 0.1, "#c51b7d" ], [ 0.2, "#de77ae" ], [ 0.3, "#f1b6da" ], [ 0.4, "#fde0ef" ], [ 0.5, "#f7f7f7" ], [ 0.6, "#e6f5d0" ], [ 0.7, "#b8e186" ], [ 0.8, "#7fbc41" ], [ 0.9, "#4d9221" ], [ 1, "#276419" ] ], "sequential": [ [ 0, "#0508b8" ], [ 0.0893854748603352, "#1910d8" ], [ 0.1787709497206704, "#3c19f0" ], [ 0.2681564245810056, "#6b1cfb" ], [ 0.3575418994413408, "#981cfd" ], [ 0.44692737430167595, "#bf1cfd" ], [ 0.5363128491620112, "#dd2bfd" ], [ 0.6256983240223464, "#f246fe" ], [ 0.7150837988826816, "#fc67fd" ], [ 0.8044692737430168, "#fe88fc" ], [ 0.8938547486033519, "#fea5fd" ], [ 0.9832402234636871, "#febefe" ], [ 1, "#fec3fe" ] ], "sequentialminus": [ [ 0, "#0508b8" ], [ 0.0893854748603352, "#1910d8" ], [ 0.1787709497206704, "#3c19f0" ], [ 0.2681564245810056, "#6b1cfb" ], [ 0.3575418994413408, "#981cfd" ], [ 0.44692737430167595, "#bf1cfd" ], [ 0.5363128491620112, "#dd2bfd" ], [ 0.6256983240223464, "#f246fe" ], [ 0.7150837988826816, "#fc67fd" ], [ 0.8044692737430168, "#fe88fc" ], [ 0.8938547486033519, "#fea5fd" ], [ 0.9832402234636871, "#febefe" ], [ 1, "#fec3fe" ] ] }, "plot_bgcolor": "white", "paper_bgcolor": "white", "shapedefaults": { "line": { "width": 0 }, "opacity": 0.4, "fillcolor": "#506784" }, "annotationdefaults": { "arrowhead": 0, "arrowcolor": "#506784", "arrowwidth": 1 } }, "themeRef": "PLOTLY_WHITE" } } }, "height": null, "width": null, "user": { "profile_url": "https://chart-studio.plotly.com/~beneelaa", "avatar_url": "https://storage.googleapis.com/plotly-prod-profiles/34.jpg", "background_url": "https://storage.googleapis.com/plotly-prod-profiles/bg-5.jpg", "bio": "", "nickname": "", "website": "", "stream_tokens": null, "feature_set_id": null, "csrf_token": null, "date_joined": "2024-04-02 08:41:59", "mapbox_access_tokens": null, "has_password": null, "username": "beneelaa", "email": null, "is_active": null, "readonly": null, "is_dash_creator": null, "dash_created_count": null, "is_chart_creator": null, "charts_created_count": null } }, { "creation_time": "2024-04-02T08:47:50.014058Z", "comments": { "results": [], "count": 0 }, "parented": true, "embed_url": "https://chart-studio.plotly.com/~RedEagle2004/1.embed", "fid": "RedEagle2004:1", "filename": "Plot 1", "filetype": "plot", "img_url": "https://storage.googleapis.com/plotly-prod-images/RedEagle2004/1/9_79A47KC1GUKKEWOXNI771R83I5WKMW.png", "image_urls": { "default": "https://storage.googleapis.com/plotly-prod-images/RedEagle2004/1/2_1GZGJDRS8G9K1DZRCYWRRJ726SWC32.png", "block-thumb": "https://storage.googleapis.com/plotly-prod-images/RedEagle2004/1/8_IMLBMKOU03MHLDVOK1QZX9685CEN0G.png", "list-thumb": "https://storage.googleapis.com/plotly-prod-images/RedEagle2004/1/9_79A47KC1GUKKEWOXNI771R83I5WKMW.png" }, "api_urls": { "files": "https://api.plotly.com/v2/files/RedEagle2004:1", "plots": "https://api.plotly.com/v2/plots/RedEagle2004:1", "parent": "https://api.plotly.com/v2/folders/home?user=RedEagle2004" }, "owner": "RedEagle2004", "parent": -1, "preview": "", "referencers": [], "references": [], "title": "", "views": 2, "web_url": "https://chart-studio.plotly.com/~RedEagle2004/1/", "world_readable": true, "date_modified": "2024-04-02T08:47:50.024Z", "stars": { "results": [], "count": 0 }, "collaborators": { "results": [], "count": 0 }, "subfolder_count": null, "refresh_interval": null, "organize_view_url": "https://chart-studio.plotly.com/~RedEagle2004/1/", "current_user_permission": "read", "is_theme": null, "is_template": false, "autosize": true, "caption": "", "figure": { "data": [ { "meta": { "columnNames": { "x": "B", "y": "A" } }, "mode": "lines", "type": "scatter", "xsrc": "RedEagle2004:0:36c975", "ysrc": "RedEagle2004:0:c28fcc" } ], "frames": [], "layout": { "title": { "text": "BTE VS BP" }, "xaxis": { "type": "linear", "range": [ 0, 4.289 ], "title": { "text": "BRAKE POWER (BP)" }, "autorange": true }, "yaxis": { "type": "linear", "range": [ -1.607222222222222, 30.537222222222223 ], "title": { "text": "BRAKE THERMAL EFFICIENCY (BTE)" }, "autorange": true }, "autosize": true, "template": { "data": { "bar": [ { "type": "bar", "marker": { "colorbar": { "ticks": "", "outlinewidth": 0 } } } ], "table": [ { "type": "table", "cells": { "fill": { "color": "#EBF0F8" }, "line": { "color": "white" } }, "header": { "fill": { "color": "#C8D4E3" }, "line": { "color": "white" } } } ], "carpet": [ { "type": "carpet", "aaxis": { "gridcolor": "#C8D4E3", "linecolor": "#C8D4E3", "endlinecolor": "#2a3f5f", "minorgridcolor": "#C8D4E3", "startlinecolor": "#2a3f5f" }, "baxis": { "gridcolor": "#C8D4E3", "linecolor": "#C8D4E3", "endlinecolor": "#2a3f5f", "minorgridcolor": "#C8D4E3", "startlinecolor": "#2a3f5f" } } ], "mesh3d": [ { "type": "mesh3d", "colorbar": { "ticks": "", "outlinewidth": 0 } } ], "contour": [ { "type": "contour", "colorbar": { "ticks": "", "outlinewidth": 0 }, "autocolorscale": true } ], "heatmap": [ { "type": "heatmap", "colorbar": { "ticks": "", "outlinewidth": 0 }, "autocolorscale": true } ], "scatter": [ { "type": "scatter", "marker": { "colorbar": { "ticks": "", "outlinewidth": 0 } } } ], "surface": [ { "type": "surface", "colorbar": { "ticks": "", "outlinewidth": 0 } } ], "heatmapgl": [ { "type": "heatmapgl", "colorbar": { "ticks": "", "outlinewidth": 0 } } ], "histogram": [ { "type": "histogram", "marker": { "colorbar": { "ticks": "", "outlinewidth": 0 } } } ], "parcoords": [ { "line": { "colorbar": { "ticks": "", "outlinewidth": 0 } }, "type": "parcoords" } ], "scatter3d": [ { "type": "scatter3d", "marker": { "colorbar": { "ticks": "", "outlinewidth": 0 } } } ], "scattergl": [ { "type": "scattergl", "marker": { "colorbar": { "ticks": "", "outlinewidth": 0 } } } ], "choropleth": [ { "type": "choropleth", "colorbar": { "ticks": "", "outlinewidth": 0 } } ], "scattergeo": [ { "type": "scattergeo", "marker": { "colorbar": { "ticks": "", "outlinewidth": 0 } } } ], "histogram2d": [ { "type": "histogram2d", "colorbar": { "ticks": "", "outlinewidth": 0 }, "autocolorscale": true } ], "scatterpolar": [ { "type": "scatterpolar", "marker": { "colorbar": { "ticks": "", "outlinewidth": 0 } } } ], "contourcarpet": [ { "type": "contourcarpet", "colorbar": { "ticks": "", "outlinewidth": 0 } } ], "scattercarpet": [ { "type": "scattercarpet", "marker": { "colorbar": { "ticks": "", "outlinewidth": 0 } } } ], "scattermapbox": [ { "type": "scattermapbox", "marker": { "colorbar": { "ticks": "", "outlinewidth": 0 } } } ], "scatterpolargl": [ { "type": "scatterpolargl", "marker": { "colorbar": { "ticks": "", "outlinewidth": 0 } } } ], "scatterternary": [ { "type": "scatterternary", "marker": { "colorbar": { "ticks": "", "outlinewidth": 0 } } } ], "histogram2dcontour": [ { "type": "histogram2dcontour", "colorbar": { "ticks": "", "outlinewidth": 0 }, "autocolorscale": true } ] }, "layout": { "geo": { "bgcolor": "white", "showland": true, "lakecolor": "white", "landcolor": "white", "showlakes": true, "subunitcolor": "#C8D4E3" }, "font": { "color": "#2a3f5f" }, "polar": { "bgcolor": "white", "radialaxis": { "ticks": "", "gridcolor": "#EBF0F8", "linecolor": "#EBF0F8" }, "angularaxis": { "ticks": "", "gridcolor": "#EBF0F8", "linecolor": "#EBF0F8" } }, "scene": { "xaxis": { "ticks": "", "gridcolor": "#DFE8F3", "gridwidth": 2, "linecolor": "#EBF0F8", "zerolinecolor": "#EBF0F8", "showbackground": true, "backgroundcolor": "white" }, "yaxis": { "ticks": "", "gridcolor": "#DFE8F3", "gridwidth": 2, "linecolor": "#EBF0F8", "zerolinecolor": "#EBF0F8", "showbackground": true, "backgroundcolor": "white" }, "zaxis": { "ticks": "", "gridcolor": "#DFE8F3", "gridwidth": 2, "linecolor": "#EBF0F8", "zerolinecolor": "#EBF0F8", "showbackground": true, "backgroundcolor": "white" } }, "title": { "x": 0.05 }, "xaxis": { "ticks": "", "gridcolor": "#EBF0F8", "linecolor": "#EBF0F8", "automargin": true, "zerolinecolor": "#EBF0F8", "zerolinewidth": 2 }, "yaxis": { "ticks": "", "gridcolor": "#EBF0F8", "linecolor": "#EBF0F8", "automargin": true, "zerolinecolor": "#EBF0F8", "zerolinewidth": 2 }, "ternary": { "aaxis": { "ticks": "", "gridcolor": "#DFE8F3", "linecolor": "#A2B1C6" }, "baxis": { "ticks": "", "gridcolor": "#DFE8F3", "linecolor": "#A2B1C6" }, "caxis": { "ticks": "", "gridcolor": "#DFE8F3", "linecolor": "#A2B1C6" }, "bgcolor": "white" }, "colorway": [ "#636efa", "#EF553B", "#00cc96", "#ab63fa", "#19d3f3", "#e763fa", "#fecb52", "#ffa15a", "#ff6692", "#b6e880" ], "hovermode": "closest", "colorscale": { "diverging": [ [ 0, "#8e0152" ], [ 0.1, "#c51b7d" ], [ 0.2, "#de77ae" ], [ 0.3, "#f1b6da" ], [ 0.4, "#fde0ef" ], [ 0.5, "#f7f7f7" ], [ 0.6, "#e6f5d0" ], [ 0.7, "#b8e186" ], [ 0.8, "#7fbc41" ], [ 0.9, "#4d9221" ], [ 1, "#276419" ] ], "sequential": [ [ 0, "#0508b8" ], [ 0.0893854748603352, "#1910d8" ], [ 0.1787709497206704, "#3c19f0" ], [ 0.2681564245810056, "#6b1cfb" ], [ 0.3575418994413408, "#981cfd" ], [ 0.44692737430167595, "#bf1cfd" ], [ 0.5363128491620112, "#dd2bfd" ], [ 0.6256983240223464, "#f246fe" ], [ 0.7150837988826816, "#fc67fd" ], [ 0.8044692737430168, "#fe88fc" ], [ 0.8938547486033519, "#fea5fd" ], [ 0.9832402234636871, "#febefe" ], [ 1, "#fec3fe" ] ], "sequentialminus": [ [ 0, "#0508b8" ], [ 0.0893854748603352, "#1910d8" ], [ 0.1787709497206704, "#3c19f0" ], [ 0.2681564245810056, "#6b1cfb" ], [ 0.3575418994413408, "#981cfd" ], [ 0.44692737430167595, "#bf1cfd" ], [ 0.5363128491620112, "#dd2bfd" ], [ 0.6256983240223464, "#f246fe" ], [ 0.7150837988826816, "#fc67fd" ], [ 0.8044692737430168, "#fe88fc" ], [ 0.8938547486033519, "#fea5fd" ], [ 0.9832402234636871, "#febefe" ], [ 1, "#fec3fe" ] ] }, "plot_bgcolor": "white", "paper_bgcolor": "white", "shapedefaults": { "line": { "width": 0 }, "opacity": 0.4, "fillcolor": "#506784" }, "annotationdefaults": { "arrowhead": 0, "arrowcolor": "#506784", "arrowwidth": 1 } }, "themeRef": "PLOTLY_WHITE" } } }, "height": null, "width": null, "user": { "profile_url": "https://chart-studio.plotly.com/~RedEagle2004", "avatar_url": "https://storage.googleapis.com/plotly-prod-profiles/92.jpg", "background_url": "https://storage.googleapis.com/plotly-prod-profiles/bg-2.jpg", "bio": "", "nickname": "", "website": "", "stream_tokens": null, "feature_set_id": null, "csrf_token": null, "date_joined": "2024-04-02 08:46:49", "mapbox_access_tokens": null, "has_password": null, "username": "RedEagle2004", "email": null, "is_active": null, "readonly": null, "is_dash_creator": null, "dash_created_count": null, "is_chart_creator": null, "charts_created_count": null } }, { "creation_time": "2024-04-02T08:07:10.188927Z", "comments": { "results": [], "count": 0 }, "parented": true, "embed_url": "https://chart-studio.plotly.com/~daylin/1.embed", "fid": "daylin:1", "filename": "Beer's Law plot", "filetype": "plot", "img_url": "https://storage.googleapis.com/plotly-prod-images/daylin/1/9_33F5OZ7FRKQ8X2P05DD18QRL19GLOI.png", "image_urls": { "default": "https://storage.googleapis.com/plotly-prod-images/daylin/1/2_FMPRLAHOE7J0S0E5XJ4FM4MSZNB3MM.png", "block-thumb": "https://storage.googleapis.com/plotly-prod-images/daylin/1/8_L7SOEH2ZSJH4C3G68WR762KL0D660X.png", "list-thumb": "https://storage.googleapis.com/plotly-prod-images/daylin/1/9_33F5OZ7FRKQ8X2P05DD18QRL19GLOI.png" }, "api_urls": { "files": "https://api.plotly.com/v2/files/daylin:1", "plots": "https://api.plotly.com/v2/plots/daylin:1", "parent": "https://api.plotly.com/v2/folders/home?user=daylin" }, "owner": "daylin", "parent": -1, "preview": "", "referencers": [], "references": [], "title": "", "views": 2, "web_url": "https://chart-studio.plotly.com/~daylin/1/", "world_readable": true, "date_modified": "2024-04-02T08:07:16.908Z", "stars": { "results": [], "count": 0 }, "collaborators": { "results": [ { "profile_url": "https://chart-studio.plotly.com/~daylin", "avatar_url": "https://storage.googleapis.com/plotly-prod-profiles/5.jpg", "background_url": "https://storage.googleapis.com/plotly-prod-profiles/bg-7.jpg", "bio": "", "nickname": "", "website": "", "stream_tokens": null, "feature_set_id": null, "csrf_token": null, "date_joined": "2024-04-02 08:06:23", "mapbox_access_tokens": null, "has_password": null, "username": "daylin", "email": null, "is_active": null, "readonly": false, "is_dash_creator": null, "dash_created_count": null, "is_chart_creator": null, "charts_created_count": null } ], "count": 1 }, "subfolder_count": null, "refresh_interval": null, "organize_view_url": "https://chart-studio.plotly.com/~daylin/1/", "current_user_permission": "read", "is_theme": null, "is_template": false, "autosize": true, "caption": "", "figure": { "data": [ { "uid": "f610cb", "meta": { "columnNames": { "x": "x", "y": "y" } }, "mode": "lines", "name": "Col2", "type": "scatter", "xsrc": "daylin:0:372817", "ysrc": "daylin:0:ab11fb" }, { "mode": "lines", "type": "scatter", "stackgroup": null } ], "frames": [], "layout": { "title": { "text": "Beer's Law Plot" }, "width": 1121, "xaxis": { "type": "linear", "range": [ -0.024684179517390034, 0.13223394971050823 ], "title": { "text": "FeSCN2+" }, "autorange": false }, "yaxis": { "type": "linear", "range": [ -0.4571111111111111, 1.2051111111111115 ], "title": { "text": "Absorbance " }, "autorange": false }, "height": 496, "autosize": true, "dragmode": "select", "annotations": [ { "x": 0.05206484487986937, "y": 0.49509118815456843, "font": { "size": 14 }, "text": "y = 9.280608x -0.002428" } ] } }, "height": 496, "width": 1121, "user": { "profile_url": "https://chart-studio.plotly.com/~daylin", "avatar_url": "https://storage.googleapis.com/plotly-prod-profiles/5.jpg", "background_url": "https://storage.googleapis.com/plotly-prod-profiles/bg-7.jpg", "bio": "", "nickname": "", "website": "", "stream_tokens": null, "feature_set_id": null, "csrf_token": null, "date_joined": "2024-04-02 08:06:23", "mapbox_access_tokens": null, "has_password": null, "username": "daylin", "email": null, "is_active": null, "readonly": null, "is_dash_creator": null, "dash_created_count": null, "is_chart_creator": null, "charts_created_count": null } }, { "creation_time": "2024-04-02T07:59:10.718009Z", "comments": { "results": [], "count": 0 }, "parented": true, "embed_url": "https://chart-studio.plotly.com/~haoyusimon927/23.embed", "fid": "haoyusimon927:23", "filename": "debiased", "filetype": "plot", "img_url": "https://storage.googleapis.com/plotly-prod-images/haoyusimon927/23/9_VB2757W57JR0W6BDO4KCEFRQBCC0Y7.png", "image_urls": { "default": "https://storage.googleapis.com/plotly-prod-images/haoyusimon927/23/2_UGMEILZDZ8A6WWMTDT44TH6ZH1SAO0.png", "block-thumb": "https://storage.googleapis.com/plotly-prod-images/haoyusimon927/23/8_FDMZ1HF5MO6MUUGH88FWANJOHLBZ9X.png", "list-thumb": "https://storage.googleapis.com/plotly-prod-images/haoyusimon927/23/9_VB2757W57JR0W6BDO4KCEFRQBCC0Y7.png" }, "api_urls": { "files": "https://api.plotly.com/v2/files/haoyusimon927:23", "plots": "https://api.plotly.com/v2/plots/haoyusimon927:23", "parent": "https://api.plotly.com/v2/folders/home?user=haoyusimon927" }, "owner": "haoyusimon927", "parent": -1, "preview": "", "referencers": [], "references": [], "title": "", "views": 1, "web_url": "https://chart-studio.plotly.com/~haoyusimon927/23/", "world_readable": true, "date_modified": "2024-04-03T06:05:36.322Z", "stars": { "results": [], "count": 0 }, "collaborators": { "results": [], "count": 0 }, "subfolder_count": null, "refresh_interval": null, "organize_view_url": "https://chart-studio.plotly.com/~haoyusimon927/23/", "current_user_permission": "read", "is_theme": null, "is_template": false, "autosize": true, "caption": "", "figure": { "data": [ { "meta": { "columnNames": { "x": "d", "y": "Test", "text": "sig", "marker": { "color": "sig" }, "error_x": { "array": "sig" }, "textposition": "Model" } }, "mode": "markers", "name": "CLIP-Original", "type": "bar", "xsrc": "haoyusimon927:19:2dcd56", "ysrc": "haoyusimon927:19:240e25", "marker": { "meta": { "columnNames": { "color": "sig" } }, "color": "rgb(200, 36, 35)", "opacity": 1 }, "error_x": { "type": "percent", "color": "#444", "value": 50, "width": 4, "visible": false, "symmetric": true, "thickness": 2 }, "textsrc": "haoyusimon927:19:719adb", "visible": true, "textfont": { "size": 12 }, "textangle": "auto", "cliponaxis": false, "hoverlabel": { "align": "auto" }, "orientation": "h", "textposition": "outside", "texttemplate": "", "constraintext": "outside", "selectedpoints": [ 0, 4, 7 ] }, { "meta": { "columnNames": { "x": "d", "y": "Test", "text": "sig", "textposition": "" } }, "name": "Image-Text", "type": "bar", "xsrc": "haoyusimon927:20:f91d0c", "ysrc": "haoyusimon927:20:09c0c4", "xaxis": "x3", "yaxis": "y", "marker": { "color": "rgb(201, 36, 35)", "opacity": 1 }, "textsrc": "haoyusimon927:20:d22056", "visible": true, "cliponaxis": false, "showlegend": false, "orientation": "h", "textposition": "outside", "constraintext": "outside", "selectedpoints": [ 4, 7 ] }, { "meta": { "columnNames": { "x": "d", "y": "Test", "text": "sig" } }, "name": "Text-Image", "type": "bar", "xsrc": "haoyusimon927:21:a49ade", "ysrc": "haoyusimon927:21:03b40e", "xaxis": "x4", "yaxis": "y", "marker": { "color": "rgb(200, 36, 35)" }, "textsrc": "haoyusimon927:21:36a044", "visible": true, "cliponaxis": false, "showlegend": false, "orientation": "h", "textposition": "outside", "selectedpoints": [ 0, 1, 4, 7 ] }, { "meta": { "columnNames": { "x": "effect_size", "y": "Test", "text": "sig", "marker": { "color": "opacity" } } }, "name": "Text-Text", "type": "bar", "xsrc": "haoyusimon927:22:3be2d8", "ysrc": "haoyusimon927:22:182a74", "xaxis": "x2", "yaxis": "y", "marker": { "meta": { "columnNames": { "color": "opacity" } }, "color": "rgb(200, 36, 35)", "opacity": 1 }, "textsrc": "haoyusimon927:22:412b06", "visible": true, "cliponaxis": false, "showlegend": false, "orientation": "h", "textposition": "outside", "autocolorscale": false, "selectedpoints": [ 3, 4, 6 ] }, { "meta": { "columnNames": { "x": "d", "y": "Test", "text": "sig" } }, "name": "CLIP-VL-Debiased", "type": "bar", "xsrc": "haoyusimon927:31:e1e3a9", "ysrc": "haoyusimon927:24:c5ca53", "marker": { "color": "rgb(248, 172, 140)" }, "textsrc": "haoyusimon927:31:51ab1c", "visible": true, "cliponaxis": false, "orientation": "h", "textposition": "outside", "selectedpoints": [ 0, 4, 7 ] }, { "meta": { "columnNames": { "x": "d", "y": "Test", "text": "sig" } }, "name": "CLIP-Clipped", "type": "bar", "xsrc": "haoyusimon927:27:7feadc", "ysrc": "haoyusimon927:24:c5ca53", "marker": { "color": "rgb(154, 201, 219)" }, "textsrc": "haoyusimon927:27:853b9f", "visible": true, "cliponaxis": false, "orientation": "h", "textposition": "outside", "selectedpoints": [ 0, 4 ] }, { "meta": { "columnNames": { "x": "d", "y": "Test", "text": "sig" } }, "name": "CLIP-Prompt-Debiased", "type": "bar", "xsrc": "haoyusimon927:34:93d634", "ysrc": "haoyusimon927:24:c5ca53", "marker": { "color": "rgb(40, 120, 181)" }, "textsrc": "haoyusimon927:34:cbc5d3", "visible": true, "cliponaxis": false, "orientation": "h", "textposition": "outside", "selectedpoints": [ 0, 4, 7 ] }, { "meta": { "columnNames": { "x": "d", "y": "Test", "text": "sig" } }, "type": "bar", "xsrc": "haoyusimon927:35:b31e37", "ysrc": "haoyusimon927:24:c5ca53", "xaxis": "x3", "marker": { "color": "rgb(248, 172, 140)", "opacity": 1 }, "textsrc": "haoyusimon927:35:0bfde6", "visible": true, "cliponaxis": false, "showlegend": false, "orientation": "h", "textposition": "outside", "selectedpoints": [ 4, 7 ] }, { "meta": { "columnNames": { "x": "d", "y": "Test", "text": "sig" } }, "type": "bar", "xsrc": "haoyusimon927:33:ad1eed", "ysrc": "haoyusimon927:24:c5ca53", "xaxis": "x3", "marker": { "color": "rgb(154, 201, 219)" }, "textsrc": "haoyusimon927:33:a0e0c7", "visible": true, "cliponaxis": false, "showlegend": false, "orientation": "h", "textposition": "outside", "selectedpoints": [ 5 ] }, { "meta": { "columnNames": { "x": "d", "y": "Test", "text": "sig" } }, "type": "bar", "xsrc": "haoyusimon927:32:b62bf4", "ysrc": "haoyusimon927:24:c5ca53", "xaxis": "x3", "marker": { "color": "rgb(40, 120, 181)", "opacity": 1 }, "textsrc": "haoyusimon927:32:ef4f7c", "visible": true, "cliponaxis": false, "showlegend": false, "orientation": "h", "textposition": "outside", "selectedpoints": [ 4, 6, 7 ] }, { "type": "bar", "showlegend": false, "orientation": "v" }, { "meta": { "columnNames": { "x": "d", "y": "Test", "text": "sig" } }, "type": "bar", "xsrc": "haoyusimon927:30:0f6154", "ysrc": "haoyusimon927:24:c5ca53", "xaxis": "x4", "marker": { "color": "rgb(248, 172, 140)" }, "textsrc": "haoyusimon927:30:53bf63", "visible": true, "cliponaxis": false, "showlegend": false, "orientation": "h", "textposition": "outside", "selectedpoints": [ 0, 1, 4 ] }, { "meta": { "columnNames": { "x": "d", "y": "Test", "text": "sig" } }, "type": "bar", "xsrc": "haoyusimon927:29:b335ae", "ysrc": "haoyusimon927:24:c5ca53", "xaxis": "x4", "marker": { "color": "rgb(154, 201, 219)" }, "textsrc": "haoyusimon927:29:82471f", "visible": true, "cliponaxis": false, "showlegend": false, "orientation": "h", "textposition": "outside", "selectedpoints": [ 1 ] }, { "meta": { "columnNames": { "x": "d", "y": "Test", "text": "sig" } }, "type": "bar", "xsrc": "haoyusimon927:28:341d36", "ysrc": "haoyusimon927:24:c5ca53", "xaxis": "x4", "marker": { "color": "rgb(40, 120, 181)" }, "textsrc": "haoyusimon927:28:71f23d", "visible": true, "cliponaxis": false, "showlegend": false, "orientation": "h", "textposition": "outside", "selectedpoints": [ 0, 7 ] }, { "meta": { "columnNames": { "x": "effect_size", "y": "Test", "text": "I" } }, "type": "bar", "xsrc": "haoyusimon927:25:db4ebc", "ysrc": "haoyusimon927:24:c5ca53", "xaxis": "x2", "marker": { "color": "rgb(248, 172, 140)" }, "textsrc": "haoyusimon927:25:ff7ffb", "visible": true, "cliponaxis": false, "showlegend": false, "orientation": "h", "textposition": "outside", "selectedpoints": [ 3, 4, 6 ] }, { "meta": { "columnNames": { "x": "effect_size", "y": "Test", "text": "sig" } }, "type": "bar", "xsrc": "haoyusimon927:24:0af138", "ysrc": "haoyusimon927:24:c5ca53", "xaxis": "x2", "marker": { "color": "rgb(154, 201, 219)" }, "textsrc": "haoyusimon927:24:44bfbc", "visible": true, "cliponaxis": false, "showlegend": false, "orientation": "h", "textposition": "outside", "selectedpoints": [ 3, 6 ] }, { "meta": { "columnNames": { "x": "effect_size", "y": "Test", "text": "sig" } }, "type": "bar", "xsrc": "haoyusimon927:26:71a8fd", "ysrc": "haoyusimon927:24:c5ca53", "xaxis": "x2", "marker": { "color": "rgb(40, 120, 181)" }, "textsrc": "haoyusimon927:26:e7ac0e", "visible": true, "cliponaxis": false, "showlegend": false, "orientation": "h", "textposition": "outside", "selectedpoints": [ 3, 4, 6 ] } ], "frames": [], "layout": { "font": { "family": "Droid Sans" }, "title": { "x": 0.4, "text": "Comparison of Biases After Debiasing" }, "xaxis": { "type": "linear", "range": [ -2, 2 ], "title": { "font": { "size": 16, "family": "Droid Sans" }, "text": "Effect Size" }, "domain": [ 0, 0.15 ], "showgrid": true, "showline": false, "autorange": false, "fixedrange": true, "overlaying": false, "showspikes": false }, "yaxis": { "side": "left", "type": "category", "range": [ -0.5, 7.5 ], "title": { "font": { "size": 16 }, "text": "Test" }, "domain": [ 0, 1 ], "autorange": false, "overlaying": false, "showspikes": false }, "legend": { "x": 0.75, "y": 1, "font": { "family": "Droid Sans" } }, "xaxis2": { "side": "bottom", "type": "linear", "range": [ -2, 2 ], "title": { "font": { "size": 16 }, "text": "Effect Size" }, "anchor": "y", "domain": [ 0.6, 0.75 ], "autorange": false, "overlaying": false }, "xaxis3": { "side": "bottom", "type": "linear", "range": [ -2, 2 ], "title": { "font": { "size": 16 }, "text": "Effect Size" }, "domain": [ 0.2, 0.35 ], "autorange": false, "overlaying": false }, "xaxis4": { "side": "bottom", "type": "linear", "range": [ -2, 2 ], "title": { "font": { "size": 16 }, "text": "Effect Size" }, "domain": [ 0.4, 0.55 ], "autorange": false, "overlaying": false }, "barmode": "group", "autosize": true, "colorway": [ "#636efa", "#EF553B", "#00cc96", "#ab63fa", "#19d3f3", "#e763fa", "#fecb52", "#ffa15a", "#ff6692", "#b6e880" ], "dragmode": "pan", "template": { "data": { "bar": [ { "type": "bar", "marker": { "colorbar": { "ticks": "", "outlinewidth": 0 } } } ], "table": [ { "type": "table", "cells": { "fill": { "color": "#EBF0F8" }, "line": { "color": "white" } }, "header": { "fill": { "color": "#C8D4E3" }, "line": { "color": "white" } } } ], "carpet": [ { "type": "carpet", "aaxis": { "gridcolor": "#C8D4E3", "linecolor": "#C8D4E3", "endlinecolor": "#2a3f5f", "minorgridcolor": "#C8D4E3", "startlinecolor": "#2a3f5f" }, "baxis": { "gridcolor": "#C8D4E3", "linecolor": "#C8D4E3", "endlinecolor": "#2a3f5f", "minorgridcolor": "#C8D4E3", "startlinecolor": "#2a3f5f" } } ], "mesh3d": [ { "type": "mesh3d", "colorbar": { "ticks": "", "outlinewidth": 0 } } ], "contour": [ { "type": "contour", "colorbar": { "ticks": "", "outlinewidth": 0 }, "autocolorscale": true } ], "heatmap": [ { "type": "heatmap", "colorbar": { "ticks": "", "outlinewidth": 0 }, "autocolorscale": true } ], "scatter": [ { "type": "scatter", "marker": { "colorbar": { "ticks": "", "outlinewidth": 0 } } } ], "surface": [ { "type": "surface", "colorbar": { "ticks": "", "outlinewidth": 0 } } ], "heatmapgl": [ { "type": "heatmapgl", "colorbar": { "ticks": "", "outlinewidth": 0 } } ], "histogram": [ { "type": "histogram", "marker": { "colorbar": { "ticks": "", "outlinewidth": 0 } } } ], "parcoords": [ { "line": { "colorbar": { "ticks": "", "outlinewidth": 0 } }, "type": "parcoords" } ], "scatter3d": [ { "type": "scatter3d", "marker": { "colorbar": { "ticks": "", "outlinewidth": 0 } } } ], "scattergl": [ { "type": "scattergl", "marker": { "colorbar": { "ticks": "", "outlinewidth": 0 } } } ], "choropleth": [ { "type": "choropleth", "colorbar": { "ticks": "", "outlinewidth": 0 } } ], "scattergeo": [ { "type": "scattergeo", "marker": { "colorbar": { "ticks": "", "outlinewidth": 0 } } } ], "histogram2d": [ { "type": "histogram2d", "colorbar": { "ticks": "", "outlinewidth": 0 }, "autocolorscale": true } ], "scatterpolar": [ { "type": "scatterpolar", "marker": { "colorbar": { "ticks": "", "outlinewidth": 0 } } } ], "contourcarpet": [ { "type": "contourcarpet", "colorbar": { "ticks": "", "outlinewidth": 0 } } ], "scattercarpet": [ { "type": "scattercarpet", "marker": { "colorbar": { "ticks": "", "outlinewidth": 0 } } } ], "scattermapbox": [ { "type": "scattermapbox", "marker": { "colorbar": { "ticks": "", "outlinewidth": 0 } } } ], "scatterpolargl": [ { "type": "scatterpolargl", "marker": { "colorbar": { "ticks": "", "outlinewidth": 0 } } } ], "scatterternary": [ { "type": "scatterternary", "marker": { "colorbar": { "ticks": "", "outlinewidth": 0 } } } ], "histogram2dcontour": [ { "type": "histogram2dcontour", "colorbar": { "ticks": "", "outlinewidth": 0 }, "autocolorscale": true } ] }, "layout": { "geo": { "bgcolor": "white", "showland": true, "lakecolor": "white", "landcolor": "white", "showlakes": true, "subunitcolor": "#C8D4E3" }, "font": { "color": "#2a3f5f" }, "polar": { "bgcolor": "white", "radialaxis": { "ticks": "", "gridcolor": "#EBF0F8", "linecolor": "#EBF0F8" }, "angularaxis": { "ticks": "", "gridcolor": "#EBF0F8", "linecolor": "#EBF0F8" } }, "scene": { "xaxis": { "ticks": "", "gridcolor": "#DFE8F3", "gridwidth": 2, "linecolor": "#EBF0F8", "zerolinecolor": "#EBF0F8", "showbackground": true, "backgroundcolor": "white" }, "yaxis": { "ticks": "", "gridcolor": "#DFE8F3", "gridwidth": 2, "linecolor": "#EBF0F8", "zerolinecolor": "#EBF0F8", "showbackground": true, "backgroundcolor": "white" }, "zaxis": { "ticks": "", "gridcolor": "#DFE8F3", "gridwidth": 2, "linecolor": "#EBF0F8", "zerolinecolor": "#EBF0F8", "showbackground": true, "backgroundcolor": "white" } }, "title": { "x": 0.05 }, "xaxis": { "ticks": "", "gridcolor": "#EBF0F8", "linecolor": "#EBF0F8", "automargin": true, "zerolinecolor": "#EBF0F8", "zerolinewidth": 2 }, "yaxis": { "ticks": "", "gridcolor": "#EBF0F8", "linecolor": "#EBF0F8", "automargin": true, "zerolinecolor": "#EBF0F8", "zerolinewidth": 2 }, "ternary": { "aaxis": { "ticks": "", "gridcolor": "#DFE8F3", "linecolor": "#A2B1C6" }, "baxis": { "ticks": "", "gridcolor": "#DFE8F3", "linecolor": "#A2B1C6" }, "caxis": { "ticks": "", "gridcolor": "#DFE8F3", "linecolor": "#A2B1C6" }, "bgcolor": "white" }, "colorway": [ "#636efa", "#EF553B", "#00cc96", "#ab63fa", "#19d3f3", "#e763fa", "#fecb52", "#ffa15a", "#ff6692", "#b6e880" ], "hovermode": "closest", "colorscale": { "diverging": [ [ 0, "#8e0152" ], [ 0.1, "#c51b7d" ], [ 0.2, "#de77ae" ], [ 0.3, "#f1b6da" ], [ 0.4, "#fde0ef" ], [ 0.5, "#f7f7f7" ], [ 0.6, "#e6f5d0" ], [ 0.7, "#b8e186" ], [ 0.8, "#7fbc41" ], [ 0.9, "#4d9221" ], [ 1, "#276419" ] ], "sequential": [ [ 0, "#0508b8" ], [ 0.0893854748603352, "#1910d8" ], [ 0.1787709497206704, "#3c19f0" ], [ 0.2681564245810056, "#6b1cfb" ], [ 0.3575418994413408, "#981cfd" ], [ 0.44692737430167595, "#bf1cfd" ], [ 0.5363128491620112, "#dd2bfd" ], [ 0.6256983240223464, "#f246fe" ], [ 0.7150837988826816, "#fc67fd" ], [ 0.8044692737430168, "#fe88fc" ], [ 0.8938547486033519, "#fea5fd" ], [ 0.9832402234636871, "#febefe" ], [ 1, "#fec3fe" ] ], "sequentialminus": [ [ 0, "#0508b8" ], [ 0.0893854748603352, "#1910d8" ], [ 0.1787709497206704, "#3c19f0" ], [ 0.2681564245810056, "#6b1cfb" ], [ 0.3575418994413408, "#981cfd" ], [ 0.44692737430167595, "#bf1cfd" ], [ 0.5363128491620112, "#dd2bfd" ], [ 0.6256983240223464, "#f246fe" ], [ 0.7150837988826816, "#fc67fd" ], [ 0.8044692737430168, "#fe88fc" ], [ 0.8938547486033519, "#fea5fd" ], [ 0.9832402234636871, "#febefe" ], [ 1, "#fec3fe" ] ] }, "plot_bgcolor": "white", "paper_bgcolor": "white", "shapedefaults": { "line": { "width": 0 }, "opacity": 0.4, "fillcolor": "#506784" }, "annotationdefaults": { "arrowhead": 0, "arrowcolor": "#506784", "arrowwidth": 1 } }, "themeRef": "PLOTLY_WHITE" }, "colorscale": { "diverging": [ [ 0, "#9e0142" ], [ 0.1, "#d53e4f" ], [ 0.2, "#f46d43" ], [ 0.3, "#fdae61" ], [ 0.4, "#fee08b" ], [ 0.5, "#ffffbf" ], [ 0.6, "#e6f598" ], [ 0.7, "#abdda4" ], [ 0.8, "#66c2a5" ], [ 0.9, "#3288bd" ], [ 1, "#5e4fa2" ] ], "sequentialminus": [ [ 0, "#440154" ], [ 0.1111111111111111, "#482878" ], [ 0.2222222222222222, "#3e4989" ], [ 0.3333333333333333, "#31688e" ], [ 0.4444444444444444, "#26828e" ], [ 0.5555555555555556, "#1f9e89" ], [ 0.6666666666666666, "#35b779" ], [ 0.7777777777777778, "#6ece58" ], [ 0.8888888888888888, "#b5de2b" ], [ 1, "#fde725" ] ] }, "showlegend": true, "annotations": [] } }, "height": null, "width": null, "user": { "profile_url": "https://chart-studio.plotly.com/~haoyusimon927", "avatar_url": "https://storage.googleapis.com/plotly-prod-profiles/98.jpg", "background_url": "https://storage.googleapis.com/plotly-prod-profiles/bg-4.jpg", "bio": "", "nickname": "", "website": "", "stream_tokens": null, "feature_set_id": null, "csrf_token": null, "date_joined": "2024-04-02 04:46:51", "mapbox_access_tokens": null, "has_password": null, "username": "haoyusimon927", "email": null, "is_active": null, "readonly": null, "is_dash_creator": null, "dash_created_count": null, "is_chart_creator": null, "charts_created_count": null } }, { "creation_time": "2024-04-02T07:52:15.861455Z", "comments": { "results": [], "count": 0 }, "parented": true, "embed_url": "https://chart-studio.plotly.com/~m.nikolaevich.m/1.embed", "fid": "m.nikolaevich.m:1", "filename": "Plot 1", "filetype": "plot", "img_url": "https://storage.googleapis.com/plotly-prod-images/m.nikolaevich.m/1/9_4TSDVF2I0X6IU7D97O4SIU0DMCYG1A.png", "image_urls": { "default": "https://storage.googleapis.com/plotly-prod-images/m.nikolaevich.m/1/2_QF42ND0OUQJTJ6LAIH4ZTKBXMF6FOH.png", "block-thumb": "https://storage.googleapis.com/plotly-prod-images/m.nikolaevich.m/1/8_265TDTFXRPGG4ZP26SGKBPC94JYSBC.png", "list-thumb": "https://storage.googleapis.com/plotly-prod-images/m.nikolaevich.m/1/9_4TSDVF2I0X6IU7D97O4SIU0DMCYG1A.png" }, "api_urls": { "files": "https://api.plotly.com/v2/files/m.nikolaevich.m:1", "plots": "https://api.plotly.com/v2/plots/m.nikolaevich.m:1", "parent": "https://api.plotly.com/v2/folders/home?user=m.nikolaevich.m" }, "owner": "m.nikolaevich.m", "parent": -1, "preview": "", "referencers": [], "references": [], "title": "", "views": 1, "web_url": "https://chart-studio.plotly.com/~m.nikolaevich.m/1/", "world_readable": true, "date_modified": "2024-04-02T07:52:15.873Z", "stars": { "results": [], "count": 0 }, "collaborators": { "results": [], "count": 0 }, "subfolder_count": null, "refresh_interval": null, "organize_view_url": "https://chart-studio.plotly.com/~m.nikolaevich.m/1/", "current_user_permission": "read", "is_theme": null, "is_template": false, "autosize": true, "caption": "", "figure": { "data": [ { "meta": { "columnNames": { "x": "A - B", "y": "B" } }, "mode": "lines", "type": "scatter", "xsrc": "m.nikolaevich.m:0:68a187,62acbf*", "ysrc": "m.nikolaevich.m:0:62acbf" } ], "frames": [], "layout": { "xaxis": { "type": "multicategory", "range": [ 0, 16.846950517836593 ], "title": { "text": "Date" }, "autorange": false }, "yaxis": { "type": "linear", "range": [ 0.6027777777777779, 4.747222222222223 ], "title": { "text": "Price EUR" }, "autorange": false }, "autosize": true, "dragmode": "zoom", "template": { "data": { "bar": [ { "type": "bar", "marker": { "colorbar": { "ticks": "", "outlinewidth": 0 } } } ], "table": [ { "type": "table", "cells": { "fill": { "color": "#EBF0F8" }, "line": { "color": "white" } }, "header": { "fill": { "color": "#C8D4E3" }, "line": { "color": "white" } } } ], "carpet": [ { "type": "carpet", "aaxis": { "gridcolor": "#C8D4E3", "linecolor": "#C8D4E3", "endlinecolor": "#2a3f5f", "minorgridcolor": "#C8D4E3", "startlinecolor": "#2a3f5f" }, "baxis": { "gridcolor": "#C8D4E3", "linecolor": "#C8D4E3", "endlinecolor": "#2a3f5f", "minorgridcolor": "#C8D4E3", "startlinecolor": "#2a3f5f" } } ], "mesh3d": [ { "type": "mesh3d", "colorbar": { "ticks": "", "outlinewidth": 0 } } ], "contour": [ { "type": "contour", "colorbar": { "ticks": "", "outlinewidth": 0 }, "autocolorscale": true } ], "heatmap": [ { "type": "heatmap", "colorbar": { "ticks": "", "outlinewidth": 0 }, "autocolorscale": true } ], "scatter": [ { "type": "scatter", "marker": { "colorbar": { "ticks": "", "outlinewidth": 0 } } } ], "surface": [ { "type": "surface", "colorbar": { "ticks": "", "outlinewidth": 0 } } ], "heatmapgl": [ { "type": "heatmapgl", "colorbar": { "ticks": "", "outlinewidth": 0 } } ], "histogram": [ { "type": "histogram", "marker": { "colorbar": { "ticks": "", "outlinewidth": 0 } } } ], "parcoords": [ { "line": { "colorbar": { "ticks": "", "outlinewidth": 0 } }, "type": "parcoords" } ], "scatter3d": [ { "type": "scatter3d", "marker": { "colorbar": { "ticks": "", "outlinewidth": 0 } } } ], "scattergl": [ { "type": "scattergl", "marker": { "colorbar": { "ticks": "", "outlinewidth": 0 } } } ], "choropleth": [ { "type": "choropleth", "colorbar": { "ticks": "", "outlinewidth": 0 } } ], "scattergeo": [ { "type": "scattergeo", "marker": { "colorbar": { "ticks": "", "outlinewidth": 0 } } } ], "histogram2d": [ { "type": "histogram2d", "colorbar": { "ticks": "", "outlinewidth": 0 }, "autocolorscale": true } ], "scatterpolar": [ { "type": "scatterpolar", "marker": { "colorbar": { "ticks": "", "outlinewidth": 0 } } } ], "contourcarpet": [ { "type": "contourcarpet", "colorbar": { "ticks": "", "outlinewidth": 0 } } ], "scattercarpet": [ { "type": "scattercarpet", "marker": { "colorbar": { "ticks": "", "outlinewidth": 0 } } } ], "scattermapbox": [ { "type": "scattermapbox", "marker": { "colorbar": { "ticks": "", "outlinewidth": 0 } } } ], "scatterpolargl": [ { "type": "scatterpolargl", "marker": { "colorbar": { "ticks": "", "outlinewidth": 0 } } } ], "scatterternary": [ { "type": "scatterternary", "marker": { "colorbar": { "ticks": "", "outlinewidth": 0 } } } ], "histogram2dcontour": [ { "type": "histogram2dcontour", "colorbar": { "ticks": "", "outlinewidth": 0 }, "autocolorscale": true } ] }, "layout": { "geo": { "bgcolor": "white", "showland": true, "lakecolor": "white", "landcolor": "white", "showlakes": true, "subunitcolor": "#C8D4E3" }, "font": { "color": "#2a3f5f" }, "polar": { "bgcolor": "white", "radialaxis": { "ticks": "", "gridcolor": "#EBF0F8", "linecolor": "#EBF0F8" }, "angularaxis": { "ticks": "", "gridcolor": "#EBF0F8", "linecolor": "#EBF0F8" } }, "scene": { "xaxis": { "ticks": "", "gridcolor": "#DFE8F3", "gridwidth": 2, "linecolor": "#EBF0F8", "zerolinecolor": "#EBF0F8", "showbackground": true, "backgroundcolor": "white" }, "yaxis": { "ticks": "", "gridcolor": "#DFE8F3", "gridwidth": 2, "linecolor": "#EBF0F8", "zerolinecolor": "#EBF0F8", "showbackground": true, "backgroundcolor": "white" }, "zaxis": { "ticks": "", "gridcolor": "#DFE8F3", "gridwidth": 2, "linecolor": "#EBF0F8", "zerolinecolor": "#EBF0F8", "showbackground": true, "backgroundcolor": "white" } }, "title": { "x": 0.05 }, "xaxis": { "ticks": "", "gridcolor": "#EBF0F8", "linecolor": "#EBF0F8", "automargin": true, "zerolinecolor": "#EBF0F8", "zerolinewidth": 2 }, "yaxis": { "ticks": "", "gridcolor": "#EBF0F8", "linecolor": "#EBF0F8", "automargin": true, "zerolinecolor": "#EBF0F8", "zerolinewidth": 2 }, "ternary": { "aaxis": { "ticks": "", "gridcolor": "#DFE8F3", "linecolor": "#A2B1C6" }, "baxis": { "ticks": "", "gridcolor": "#DFE8F3", "linecolor": "#A2B1C6" }, "caxis": { "ticks": "", "gridcolor": "#DFE8F3", "linecolor": "#A2B1C6" }, "bgcolor": "white" }, "colorway": [ "#636efa", "#EF553B", "#00cc96", "#ab63fa", "#19d3f3", "#e763fa", "#fecb52", "#ffa15a", "#ff6692", "#b6e880" ], "hovermode": "closest", "colorscale": { "diverging": [ [ 0, "#8e0152" ], [ 0.1, "#c51b7d" ], [ 0.2, "#de77ae" ], [ 0.3, "#f1b6da" ], [ 0.4, "#fde0ef" ], [ 0.5, "#f7f7f7" ], [ 0.6, "#e6f5d0" ], [ 0.7, "#b8e186" ], [ 0.8, "#7fbc41" ], [ 0.9, "#4d9221" ], [ 1, "#276419" ] ], "sequential": [ [ 0, "#0508b8" ], [ 0.0893854748603352, "#1910d8" ], [ 0.1787709497206704, "#3c19f0" ], [ 0.2681564245810056, "#6b1cfb" ], [ 0.3575418994413408, "#981cfd" ], [ 0.44692737430167595, "#bf1cfd" ], [ 0.5363128491620112, "#dd2bfd" ], [ 0.6256983240223464, "#f246fe" ], [ 0.7150837988826816, "#fc67fd" ], [ 0.8044692737430168, "#fe88fc" ], [ 0.8938547486033519, "#fea5fd" ], [ 0.9832402234636871, "#febefe" ], [ 1, "#fec3fe" ] ], "sequentialminus": [ [ 0, "#0508b8" ], [ 0.0893854748603352, "#1910d8" ], [ 0.1787709497206704, "#3c19f0" ], [ 0.2681564245810056, "#6b1cfb" ], [ 0.3575418994413408, "#981cfd" ], [ 0.44692737430167595, "#bf1cfd" ], [ 0.5363128491620112, "#dd2bfd" ], [ 0.6256983240223464, "#f246fe" ], [ 0.7150837988826816, "#fc67fd" ], [ 0.8044692737430168, "#fe88fc" ], [ 0.8938547486033519, "#fea5fd" ], [ 0.9832402234636871, "#febefe" ], [ 1, "#fec3fe" ] ] }, "plot_bgcolor": "white", "paper_bgcolor": "white", "shapedefaults": { "line": { "width": 0 }, "opacity": 0.4, "fillcolor": "#506784" }, "annotationdefaults": { "arrowhead": 0, "arrowcolor": "#506784", "arrowwidth": 1 } }, "themeRef": "PLOTLY_WHITE" } } }, "height": null, "width": null, "user": { "profile_url": "https://chart-studio.plotly.com/~m.nikolaevich.m", "avatar_url": "https://storage.googleapis.com/plotly-prod-profiles/38.jpg", "background_url": "https://storage.googleapis.com/plotly-prod-profiles/bg-8.jpg", "bio": "", "nickname": "", "website": "", "stream_tokens": null, "feature_set_id": null, "csrf_token": null, "date_joined": "2024-04-02 07:51:40", "mapbox_access_tokens": null, "has_password": null, "username": "m.nikolaevich.m", "email": null, "is_active": null, "readonly": null, "is_dash_creator": null, "dash_created_count": null, "is_chart_creator": null, "charts_created_count": null } }, { "creation_time": "2024-04-02T07:48:37.493862Z", "comments": { "results": [], "count": 0 }, "parented": true, "embed_url": "https://chart-studio.plotly.com/~Korbelz/3.embed", "fid": "Korbelz:3", "filename": "Plot 3", "filetype": "plot", "img_url": "https://storage.googleapis.com/plotly-prod-images/Korbelz/3/9_MDLJ91JOUL35SOZ31JTUOQLCTXGBWZ.png", "image_urls": { "default": "https://storage.googleapis.com/plotly-prod-images/Korbelz/3/2_96XYKK2Z05L9CQ9Q82DU5566PAOTN1.png", "block-thumb": "https://storage.googleapis.com/plotly-prod-images/Korbelz/3/8_GR6J9POQWK80NVDOH6TAF2YB4KCPVL.png", "list-thumb": "https://storage.googleapis.com/plotly-prod-images/Korbelz/3/9_MDLJ91JOUL35SOZ31JTUOQLCTXGBWZ.png" }, "api_urls": { "files": "https://api.plotly.com/v2/files/Korbelz:3", "plots": "https://api.plotly.com/v2/plots/Korbelz:3", "parent": "https://api.plotly.com/v2/folders/home?user=Korbelz" }, "owner": "Korbelz", "parent": -1, "preview": "", "referencers": [], "references": [], "title": "", "views": 1, "web_url": "https://chart-studio.plotly.com/~Korbelz/3/", "world_readable": true, "date_modified": "2024-04-02T07:50:43.610Z", "stars": { "results": [], "count": 0 }, "collaborators": { "results": [], "count": 0 }, "subfolder_count": null, "refresh_interval": null, "organize_view_url": "https://chart-studio.plotly.com/~Korbelz/3/", "current_user_permission": "read", "is_theme": null, "is_template": false, "autosize": true, "caption": "", "figure": { "data": [ { "meta": { "columnNames": { "x": "A", "y": "B", "z": "C", "lat": "A", "lon": "B" } }, "mode": "markers", "type": "scatter3d", "xsrc": "Korbelz:2:5212c5", "ysrc": "Korbelz:2:ada913", "zsrc": "Korbelz:2:45962c", "latsrc": "Korbelz:2:5212c5", "lonsrc": "Korbelz:2:ada913", "sizeref": 1, "contours": { "end": 0.08, "size": 0.02, "start": -0.2 }, "autocontour": true, "autocolorscale": true } ], "frames": [], "layout": { "geo": {}, "polar": { "radialaxis": { "range": [ 0, 1 ], "autorange": true }, "angularaxis": {} }, "scene": { "camera": { "up": { "x": 0, "y": 0, "z": 1 }, "eye": { "x": 1.6954969366563564, "y": 1.7041410381202222, "z": 1.5856041071472726 }, "center": { "x": 0, "y": 0, "z": 0 }, "projection": { "type": "perspective" } }, "aspectmode": "auto", "aspectratio": { "x": 1, "y": 1, "z": 1 } }, "title": { "text": "Raw base location data" }, "xaxis": { "type": "linear", "range": [ 810.8905268595038, 28527.229473140498 ], "autorange": true }, "yaxis": { "type": "linear", "range": [ 5169.844433188616, 24891.045566811383 ], "autorange": true }, "mapbox": {}, "autosize": true, "template": { "data": { "bar": [ { "type": "bar", "marker": { "colorbar": { "ticks": "", "outlinewidth": 0 } } } ], "table": [ { "type": "table", "cells": { "fill": { "color": "#506784" }, "line": { "color": "rgb(17,17,17)" } }, "header": { "fill": { "color": "#2a3f5f" }, "line": { "color": "rgb(17,17,17)" } } } ], "carpet": [ { "type": "carpet", "aaxis": { "gridcolor": "#506784", "linecolor": "#506784", "endlinecolor": "#A2B1C6", "minorgridcolor": "#506784", "startlinecolor": "#A2B1C6" }, "baxis": { "gridcolor": "#506784", "linecolor": "#506784", "endlinecolor": "#A2B1C6", "minorgridcolor": "#506784", "startlinecolor": "#A2B1C6" } } ], "mesh3d": [ { "type": "mesh3d", "colorbar": { "ticks": "", "outlinewidth": 0 } } ], "contour": [ { "type": "contour", "colorbar": { "ticks": "", "outlinewidth": 0 }, "autocolorscale": true } ], "heatmap": [ { "type": "heatmap", "colorbar": { "ticks": "", "outlinewidth": 0 }, "autocolorscale": true } ], "scatter": [ { "type": "scatter", "marker": { "colorbar": { "ticks": "", "outlinewidth": 0 } } } ], "surface": [ { "type": "surface", "colorbar": { "ticks": "", "outlinewidth": 0 } } ], "heatmapgl": [ { "type": "heatmapgl", "colorbar": { "ticks": "", "outlinewidth": 0 } } ], "histogram": [ { "type": "histogram", "marker": { "colorbar": { "ticks": "", "outlinewidth": 0 } } } ], "parcoords": [ { "line": { "colorbar": { "ticks": "", "outlinewidth": 0 } }, "type": "parcoords" } ], "scatter3d": [ { "type": "scatter3d", "marker": { "colorbar": { "ticks": "", "outlinewidth": 0 } } } ], "scattergl": [ { "type": "scattergl", "marker": { "colorbar": { "ticks": "", "outlinewidth": 0 } } } ], "choropleth": [ { "type": "choropleth", "colorbar": { "ticks": "", "outlinewidth": 0 } } ], "scattergeo": [ { "type": "scattergeo", "marker": { "colorbar": { "ticks": "", "outlinewidth": 0 } } } ], "histogram2d": [ { "type": "histogram2d", "colorbar": { "ticks": "", "outlinewidth": 0 }, "autocolorscale": true } ], "scatterpolar": [ { "type": "scatterpolar", "marker": { "colorbar": { "ticks": "", "outlinewidth": 0 } } } ], "contourcarpet": [ { "type": "contourcarpet", "colorbar": { "ticks": "", "outlinewidth": 0 } } ], "scattercarpet": [ { "type": "scattercarpet", "marker": { "colorbar": { "ticks": "", "outlinewidth": 0 } } } ], "scattermapbox": [ { "type": "scattermapbox", "marker": { "colorbar": { "ticks": "", "outlinewidth": 0 } } } ], "scatterpolargl": [ { "type": "scatterpolargl", "marker": { "colorbar": { "ticks": "", "outlinewidth": 0 } } } ], "scatterternary": [ { "type": "scatterternary", "marker": { "colorbar": { "ticks": "", "outlinewidth": 0 } } } ], "histogram2dcontour": [ { "type": "histogram2dcontour", "colorbar": { "ticks": "", "outlinewidth": 0 }, "autocolorscale": true } ] }, "layout": { "geo": { "bgcolor": "rgb(17,17,17)", "showland": true, "lakecolor": "rgb(17,17,17)", "landcolor": "rgb(17,17,17)", "showlakes": true, "subunitcolor": "#506784" }, "font": { "color": "#f2f5fa" }, "polar": { "bgcolor": "rgb(17,17,17)", "radialaxis": { "ticks": "", "gridcolor": "#506784", "linecolor": "#506784" }, "angularaxis": { "ticks": "", "gridcolor": "#506784", "linecolor": "#506784" } }, "scene": { "xaxis": { "ticks": "", "gridcolor": "#506784", "gridwidth": 2, "linecolor": "#506784", "zerolinecolor": "#C8D4E3", "showbackground": true, "backgroundcolor": "rgb(17,17,17)" }, "yaxis": { "ticks": "", "gridcolor": "#506784", "gridwidth": 2, "linecolor": "#506784", "zerolinecolor": "#C8D4E3", "showbackground": true, "backgroundcolor": "rgb(17,17,17)" }, "zaxis": { "ticks": "", "gridcolor": "#506784", "gridwidth": 2, "linecolor": "#506784", "zerolinecolor": "#C8D4E3", "showbackground": true, "backgroundcolor": "rgb(17,17,17)" } }, "title": { "x": 0.05 }, "xaxis": { "ticks": "", "gridcolor": "#283442", "linecolor": "#506784", "automargin": true, "zerolinecolor": "#283442", "zerolinewidth": 2 }, "yaxis": { "ticks": "", "gridcolor": "#283442", "linecolor": "#506784", "automargin": true, "zerolinecolor": "#283442", "zerolinewidth": 2 }, "ternary": { "aaxis": { "ticks": "", "gridcolor": "#506784", "linecolor": "#506784" }, "baxis": { "ticks": "", "gridcolor": "#506784", "linecolor": "#506784" }, "caxis": { "ticks": "", "gridcolor": "#506784", "linecolor": "#506784" }, "bgcolor": "rgb(17,17,17)" }, "colorway": [ "#636efa", "#EF553B", "#00cc96", "#ab63fa", "#19d3f3", "#e763fa", "#fecb52", "#ffa15a", "#ff6692", "#b6e880" ], "hovermode": "closest", "colorscale": { "diverging": [ [ 0, "#8e0152" ], [ 0.1, "#c51b7d" ], [ 0.2, "#de77ae" ], [ 0.3, "#f1b6da" ], [ 0.4, "#fde0ef" ], [ 0.5, "#f7f7f7" ], [ 0.6, "#e6f5d0" ], [ 0.7, "#b8e186" ], [ 0.8, "#7fbc41" ], [ 0.9, "#4d9221" ], [ 1, "#276419" ] ], "sequential": [ [ 0, "#0508b8" ], [ 0.0893854748603352, "#1910d8" ], [ 0.1787709497206704, "#3c19f0" ], [ 0.2681564245810056, "#6b1cfb" ], [ 0.3575418994413408, "#981cfd" ], [ 0.44692737430167595, "#bf1cfd" ], [ 0.5363128491620112, "#dd2bfd" ], [ 0.6256983240223464, "#f246fe" ], [ 0.7150837988826816, "#fc67fd" ], [ 0.8044692737430168, "#fe88fc" ], [ 0.8938547486033519, "#fea5fd" ], [ 0.9832402234636871, "#febefe" ], [ 1, "#fec3fe" ] ], "sequentialminus": [ [ 0, "#0508b8" ], [ 0.0893854748603352, "#1910d8" ], [ 0.1787709497206704, "#3c19f0" ], [ 0.2681564245810056, "#6b1cfb" ], [ 0.3575418994413408, "#981cfd" ], [ 0.44692737430167595, "#bf1cfd" ], [ 0.5363128491620112, "#dd2bfd" ], [ 0.6256983240223464, "#f246fe" ], [ 0.7150837988826816, "#fc67fd" ], [ 0.8044692737430168, "#fe88fc" ], [ 0.8938547486033519, "#fea5fd" ], [ 0.9832402234636871, "#febefe" ], [ 1, "#fec3fe" ] ] }, "plot_bgcolor": "rgb(17,17,17)", "paper_bgcolor": "rgb(17,17,17)", "shapedefaults": { "line": { "width": 0 }, "opacity": 0.4, "fillcolor": "#f2f5fa" }, "sliderdefaults": { "bgcolor": "#C8D4E3", "tickwidth": 0, "bordercolor": "rgb(17,17,17)", "borderwidth": 1 }, "annotationdefaults": { "arrowhead": 0, "arrowcolor": "#f2f5fa", "arrowwidth": 1 }, "updatemenudefaults": { "bgcolor": "#506784", "borderwidth": 0 } }, "themeRef": "PLOTLY_DARK" } } }, "height": null, "width": null, "user": { "profile_url": "https://chart-studio.plotly.com/~Korbelz", "avatar_url": "https://storage.googleapis.com/plotly-prod-profiles/48.jpg", "background_url": "https://storage.googleapis.com/plotly-prod-profiles/bg-14.jpg", "bio": "", "nickname": "", "website": "", "stream_tokens": null, "feature_set_id": null, "csrf_token": null, "date_joined": "2024-04-02 02:24:43", "mapbox_access_tokens": null, "has_password": null, "username": "Korbelz", "email": null, "is_active": null, "readonly": null, "is_dash_creator": null, "dash_created_count": null, "is_chart_creator": null, "charts_created_count": null } }, { "creation_time": "2024-04-02T07:44:47.654419Z", "comments": { "results": [], "count": 0 }, "parented": true, "embed_url": "https://chart-studio.plotly.com/~beinzheans/1.embed", "fid": "beinzheans:1", "filename": "Plot 1", "filetype": "plot", "img_url": "https://storage.googleapis.com/plotly-prod-images/beinzheans/1/9_Z06K1AJD2498YVM7CX30LPKQZLGHQ8.png", "image_urls": { "default": "https://storage.googleapis.com/plotly-prod-images/beinzheans/1/2_Q4JZIAVZ8WKMCWF6D1L2TQHN5RX1N6.png", "block-thumb": "https://storage.googleapis.com/plotly-prod-images/beinzheans/1/8_873ZPSNMN80ECUX0TR6GBFKUE205WN.png", "list-thumb": "https://storage.googleapis.com/plotly-prod-images/beinzheans/1/9_Z06K1AJD2498YVM7CX30LPKQZLGHQ8.png" }, "api_urls": { "files": "https://api.plotly.com/v2/files/beinzheans:1", "plots": "https://api.plotly.com/v2/plots/beinzheans:1", "parent": "https://api.plotly.com/v2/folders/home?user=beinzheans" }, "owner": "beinzheans", "parent": -1, "preview": "", "referencers": [], "references": [], "title": "", "views": 2, "web_url": "https://chart-studio.plotly.com/~beinzheans/1/", "world_readable": true, "date_modified": "2024-04-02T07:44:47.666Z", "stars": { "results": [], "count": 0 }, "collaborators": { "results": [], "count": 0 }, "subfolder_count": null, "refresh_interval": null, "organize_view_url": "https://chart-studio.plotly.com/~beinzheans/1/", "current_user_permission": "read", "is_theme": null, "is_template": false, "autosize": true, "caption": "", "figure": { "data": [ { "uid": "562632", "meta": { "columnNames": { "x": "A", "y": "B" } }, "mode": "lines", "type": "scatter", "xsrc": "beinzheans:0:2407cd", "ysrc": "beinzheans:0:50101f" } ], "frames": [], "layout": { "title": { "text": "Concentration of NaOH(aq) against time" }, "xaxis": { "type": "linear", "range": [ 0, 12 ], "title": { "text": "Time (min)" }, "autorange": true, "showspikes": false }, "yaxis": { "type": "linear", "range": [ 0.009999999999999998, 0.21000000000000002 ], "title": { "text": "Concentration of NaOH(aq) (M)" }, "autorange": true, "showspikes": false }, "autosize": true, "dragmode": "zoom", "template": { "data": { "bar": [ { "type": "bar", "marker": { "colorbar": { "ticks": "", "outlinewidth": 0 } } } ], "table": [ { "type": "table", "cells": { "fill": { "color": "#EBF0F8" }, "line": { "color": "white" } }, "header": { "fill": { "color": "#C8D4E3" }, "line": { "color": "white" } } } ], "carpet": [ { "type": "carpet", "aaxis": { "gridcolor": "#C8D4E3", "linecolor": "#C8D4E3", "endlinecolor": "#2a3f5f", "minorgridcolor": "#C8D4E3", "startlinecolor": "#2a3f5f" }, "baxis": { "gridcolor": "#C8D4E3", "linecolor": "#C8D4E3", "endlinecolor": "#2a3f5f", "minorgridcolor": "#C8D4E3", "startlinecolor": "#2a3f5f" } } ], "mesh3d": [ { "type": "mesh3d", "colorbar": { "ticks": "", "outlinewidth": 0 } } ], "contour": [ { "type": "contour", "colorbar": { "ticks": "", "outlinewidth": 0 }, "autocolorscale": true } ], "heatmap": [ { "type": "heatmap", "colorbar": { "ticks": "", "outlinewidth": 0 }, "autocolorscale": true } ], "scatter": [ { "type": "scatter", "marker": { "colorbar": { "ticks": "", "outlinewidth": 0 } } } ], "surface": [ { "type": "surface", "colorbar": { "ticks": "", "outlinewidth": 0 } } ], "heatmapgl": [ { "type": "heatmapgl", "colorbar": { "ticks": "", "outlinewidth": 0 } } ], "histogram": [ { "type": "histogram", "marker": { "colorbar": { "ticks": "", "outlinewidth": 0 } } } ], "parcoords": [ { "line": { "colorbar": { "ticks": "", "outlinewidth": 0 } }, "type": "parcoords" } ], "scatter3d": [ { "type": "scatter3d", "marker": { "colorbar": { "ticks": "", "outlinewidth": 0 } } } ], "scattergl": [ { "type": "scattergl", "marker": { "colorbar": { "ticks": "", "outlinewidth": 0 } } } ], "choropleth": [ { "type": "choropleth", "colorbar": { "ticks": "", "outlinewidth": 0 } } ], "scattergeo": [ { "type": "scattergeo", "marker": { "colorbar": { "ticks": "", "outlinewidth": 0 } } } ], "histogram2d": [ { "type": "histogram2d", "colorbar": { "ticks": "", "outlinewidth": 0 }, "autocolorscale": true } ], "scatterpolar": [ { "type": "scatterpolar", "marker": { "colorbar": { "ticks": "", "outlinewidth": 0 } } } ], "contourcarpet": [ { "type": "contourcarpet", "colorbar": { "ticks": "", "outlinewidth": 0 } } ], "scattercarpet": [ { "type": "scattercarpet", "marker": { "colorbar": { "ticks": "", "outlinewidth": 0 } } } ], "scattermapbox": [ { "type": "scattermapbox", "marker": { "colorbar": { "ticks": "", "outlinewidth": 0 } } } ], "scatterpolargl": [ { "type": "scatterpolargl", "marker": { "colorbar": { "ticks": "", "outlinewidth": 0 } } } ], "scatterternary": [ { "type": "scatterternary", "marker": { "colorbar": { "ticks": "", "outlinewidth": 0 } } } ], "histogram2dcontour": [ { "type": "histogram2dcontour", "colorbar": { "ticks": "", "outlinewidth": 0 }, "autocolorscale": true } ] }, "layout": { "geo": { "bgcolor": "white", "showland": true, "lakecolor": "white", "landcolor": "white", "showlakes": true, "subunitcolor": "#C8D4E3" }, "font": { "color": "#2a3f5f" }, "polar": { "bgcolor": "white", "radialaxis": { "ticks": "", "gridcolor": "#EBF0F8", "linecolor": "#EBF0F8" }, "angularaxis": { "ticks": "", "gridcolor": "#EBF0F8", "linecolor": "#EBF0F8" } }, "scene": { "xaxis": { "ticks": "", "gridcolor": "#DFE8F3", "gridwidth": 2, "linecolor": "#EBF0F8", "zerolinecolor": "#EBF0F8", "showbackground": true, "backgroundcolor": "white" }, "yaxis": { "ticks": "", "gridcolor": "#DFE8F3", "gridwidth": 2, "linecolor": "#EBF0F8", "zerolinecolor": "#EBF0F8", "showbackground": true, "backgroundcolor": "white" }, "zaxis": { "ticks": "", "gridcolor": "#DFE8F3", "gridwidth": 2, "linecolor": "#EBF0F8", "zerolinecolor": "#EBF0F8", "showbackground": true, "backgroundcolor": "white" } }, "title": { "x": 0.05 }, "xaxis": { "ticks": "", "gridcolor": "#EBF0F8", "linecolor": "#EBF0F8", "automargin": true, "zerolinecolor": "#EBF0F8", "zerolinewidth": 2 }, "yaxis": { "ticks": "", "gridcolor": "#EBF0F8", "linecolor": "#EBF0F8", "automargin": true, "zerolinecolor": "#EBF0F8", "zerolinewidth": 2 }, "ternary": { "aaxis": { "ticks": "", "gridcolor": "#DFE8F3", "linecolor": "#A2B1C6" }, "baxis": { "ticks": "", "gridcolor": "#DFE8F3", "linecolor": "#A2B1C6" }, "caxis": { "ticks": "", "gridcolor": "#DFE8F3", "linecolor": "#A2B1C6" }, "bgcolor": "white" }, "colorway": [ "#636efa", "#EF553B", "#00cc96", "#ab63fa", "#19d3f3", "#e763fa", "#fecb52", "#ffa15a", "#ff6692", "#b6e880" ], "hovermode": "closest", "colorscale": { "diverging": [ [ 0, "#8e0152" ], [ 0.1, "#c51b7d" ], [ 0.2, "#de77ae" ], [ 0.3, "#f1b6da" ], [ 0.4, "#fde0ef" ], [ 0.5, "#f7f7f7" ], [ 0.6, "#e6f5d0" ], [ 0.7, "#b8e186" ], [ 0.8, "#7fbc41" ], [ 0.9, "#4d9221" ], [ 1, "#276419" ] ], "sequential": [ [ 0, "#0508b8" ], [ 0.0893854748603352, "#1910d8" ], [ 0.1787709497206704, "#3c19f0" ], [ 0.2681564245810056, "#6b1cfb" ], [ 0.3575418994413408, "#981cfd" ], [ 0.44692737430167595, "#bf1cfd" ], [ 0.5363128491620112, "#dd2bfd" ], [ 0.6256983240223464, "#f246fe" ], [ 0.7150837988826816, "#fc67fd" ], [ 0.8044692737430168, "#fe88fc" ], [ 0.8938547486033519, "#fea5fd" ], [ 0.9832402234636871, "#febefe" ], [ 1, "#fec3fe" ] ], "sequentialminus": [ [ 0, "#0508b8" ], [ 0.0893854748603352, "#1910d8" ], [ 0.1787709497206704, "#3c19f0" ], [ 0.2681564245810056, "#6b1cfb" ], [ 0.3575418994413408, "#981cfd" ], [ 0.44692737430167595, "#bf1cfd" ], [ 0.5363128491620112, "#dd2bfd" ], [ 0.6256983240223464, "#f246fe" ], [ 0.7150837988826816, "#fc67fd" ], [ 0.8044692737430168, "#fe88fc" ], [ 0.8938547486033519, "#fea5fd" ], [ 0.9832402234636871, "#febefe" ], [ 1, "#fec3fe" ] ] }, "plot_bgcolor": "white", "paper_bgcolor": "white", "shapedefaults": { "line": { "width": 0 }, "opacity": 0.4, "fillcolor": "#506784" }, "annotationdefaults": { "arrowhead": 0, "arrowcolor": "#506784", "arrowwidth": 1 } }, "themeRef": "PLOTLY_WHITE" } } }, "height": null, "width": null, "user": { "profile_url": "https://chart-studio.plotly.com/~beinzheans", "avatar_url": "https://storage.googleapis.com/plotly-prod-profiles/51.jpg", "background_url": "https://storage.googleapis.com/plotly-prod-profiles/bg-3.jpg", "bio": "", "nickname": "", "website": "", "stream_tokens": null, "feature_set_id": null, "csrf_token": null, "date_joined": "2024-04-02 07:43:43", "mapbox_access_tokens": null, "has_password": null, "username": "beinzheans", "email": null, "is_active": null, "readonly": null, "is_dash_creator": null, "dash_created_count": null, "is_chart_creator": null, "charts_created_count": null } } ] }
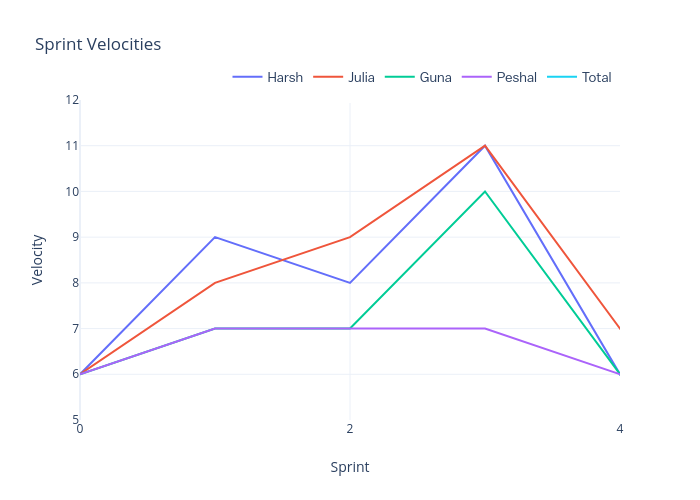
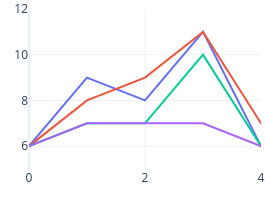
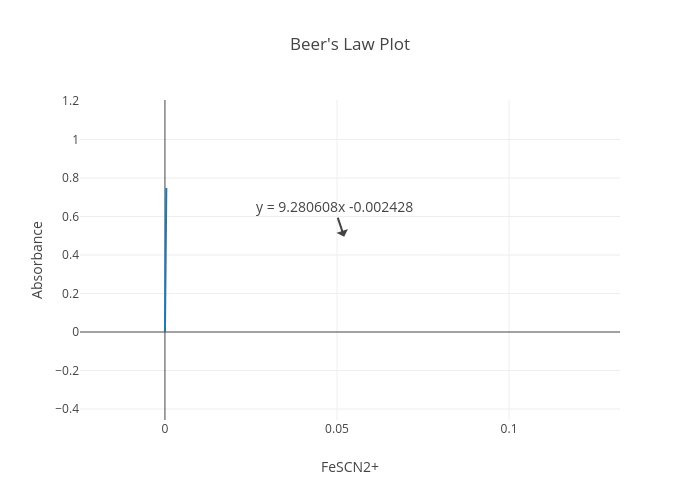
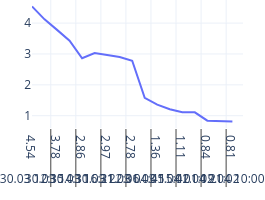
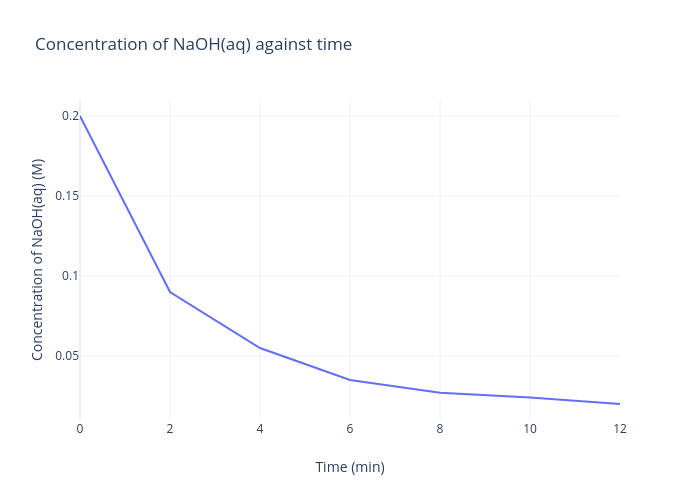