Plots List
Plots
This endpoint handles manipulation of Plotly plot files.
Reference
Authorization
Any user with or without a Plotly account may view public plots. For private plots, see authentication.
Actions
list
Listing all public plots can be done via a GET request to this endpoint.
By default, plots will be listed in order of date created. The order_by
query parameter is accepted at this endpoint. Currently, only ordering by
views is supported. It is possible to filter the plots by quality
with min_quality or max_quality as query parameter.
Example:
// GET https://api.plotly.com/v2/plots/ ---> 200

// GET https://api.plotly.com/v2/plots/?order_by=-views ---> 200

// GET https://api.plotly.com/v2/plots/?min_quality=5 ---> 200

// GET https://api.plotly.com/v2/plots/?max_quality=5 ---> 200
feed
Listing all handpicked feed plots can be done via a GET request to this endpoint. By default, plots will be listed in a random order.
Example:
// GET https://api.plotly.com/v2/plots/feed ---> 200
create
You can create new plot resources here. The only required field is 'figure'. Currently, the figure is restricted to only contain references to grid data. That is, this will fail if raw data arrays are passed in. To create and manipulate underlying grids for plots, see the grids endpoint.
Example:
// This fails because a figure field is required.
// POST https://api.plotly.com/v2/plots ---> 400 Bad Request
{}

// This fails because the figure has raw data
//POST https://api.plotly.com/v2/plots ---> 400 Bad Request
{
    "figure": {"data": [{"y": ['this', 'is', 'raw', 'data']}]}
}

// This succeeds because the figure has src keys, not raw data.
//POST https://api.plotly.com/v2/plots ---> 200 OK
{
    "figure": {"data": [{"ysrc": "sven:88:u8nd62"}]}
}
When creating a grid, you can optionally specify a source_fid to specify where a plot has come from:
- source_fid: the fid of a plot that was copied (and presumably edited) to produce this one
detail
There is a lot of meta information stored about plot files including filename, title, share_url, and content_url to name a few.
This information can only be reached with a GET to this endpoint.
Example:
// GET https://api.plotly.com/v2/plots/iheartgraphs:90
content
The contents of a plot can be downloaded via the content resource. The plot
content contains referenced grid/column data by default. If you wish to
return the raw grid/column data, the inline_data=true query must be included
in the request url. The Content-Type header will be appropriately set for the
response body.
Alternatively, you can set ?map_data=unreadable to append a mapping of
sources to data that belongs to grids which are unreadable for the
requestor. This is useful when you have read access to another users plot,
but that plot contains grid references which you don't have access to.
Examples:
// Returns referenced grid/column data
// GET https://api.plotly.com/v2/plots/iheartgraphs:90/content ---> 200 OK

// Returns full grid/column data
// GET https://api.plotly.com/v2/plots/iheartgraphs:90/content?inline_data=true ---> 200 OK

// Returns full grid/column data when requestor doesn't have permission
// to read the referenced grid.
// GET https://api.plotly.com/v2/plots/iheartgraphs:90/content?map_data=unreadable ---> 200 OK
GET /v2/plots?cursor=cj0xJnA9MjAyNC0wNC0wMSsxMyUzQTMyJTNBMzIuNjg0MDk5JTJCMDAlM0EwMA%3D%3D&format=api
{ "next": "https://api.plot.ly/v2/plots?cursor=cD0yMDI0LTA0LTAxKzEzJTNBMzclM0EzNi43ODg0NzclMkIwMCUzQTAw&format=api", "previous": "https://api.plot.ly/v2/plots?cursor=cj0xJnA9MjAyNC0wNC0wMSsxNSUzQTEwJTNBMTIuNDc1NDgzJTJCMDAlM0EwMA%3D%3D&format=api", "results": [ { "creation_time": "2024-04-01T15:10:12.475483Z", "comments": { "results": [], "count": 0 }, "parented": true, "embed_url": "https://chart-studio.plotly.com/~Yermo/1.embed", "fid": "Yermo:1", "filename": "Plot 1", "filetype": "plot", "img_url": "https://storage.googleapis.com/plotly-prod-images/Yermo/1/9_SJ09E3E4VH0V58K3FJ5E0JBHO2ZWN2.png", "image_urls": { "default": "https://storage.googleapis.com/plotly-prod-images/Yermo/1/2_TDN5QD9VIFA093MH3LJYE6D710RC2G.png", "block-thumb": "https://storage.googleapis.com/plotly-prod-images/Yermo/1/8_3JSI74OX29E4CYZXAGJP1G5XZN4D4U.png", "list-thumb": "https://storage.googleapis.com/plotly-prod-images/Yermo/1/9_SJ09E3E4VH0V58K3FJ5E0JBHO2ZWN2.png" }, "api_urls": { "files": "https://api.plotly.com/v2/files/Yermo:1", "plots": "https://api.plotly.com/v2/plots/Yermo:1", "parent": "https://api.plotly.com/v2/folders/home?user=Yermo" }, "owner": "Yermo", "parent": -1, "preview": "", "referencers": [], "references": [], "title": "", "views": 2, "web_url": "https://chart-studio.plotly.com/~Yermo/1/", "world_readable": true, "date_modified": "2024-04-01T15:10:12.485Z", "stars": { "results": [], "count": 0 }, "collaborators": { "results": [], "count": 0 }, "subfolder_count": null, "refresh_interval": null, "organize_view_url": "https://chart-studio.plotly.com/~Yermo/1/", "current_user_permission": "read", "is_theme": null, "is_template": null, "autosize": true, "caption": "", "figure": { "data": [ { "name": "Men", "type": "bar", "xsrc": "Yermo:0:dede41", "ysrc": "Yermo:0:a3d27b", "marker": { "color": "powderblue" }, "hoverinfo": "x", "orientation": "h" }, { "name": "Women", "type": "bar", "xsrc": "Yermo:0:10f5a1", "ysrc": "Yermo:0:1b358e", "marker": { "color": "seagreen" }, "textsrc": "Yermo:0:decb41", "hoverinfo": "text", "orientation": "h" }, { "type": "bar", "xsrc": "Yermo:0:25fad6", "ysrc": "Yermo:0:b102cb", "marker": { "color": "teal" }, "opacity": 0.5, "hoverinfo": "x", "showlegend": false, "orientation": "h" }, { "type": "bar", "xsrc": "Yermo:0:53ff3f", "ysrc": "Yermo:0:619c67", "marker": { "color": "darkgreen" }, "opacity": 0.5, "textsrc": "Yermo:0:ac4e0a", "hoverinfo": "text", "showlegend": false, "orientation": "h" } ], "layout": { "xaxis": { "range": [ -1200, 1200 ], "title": { "text": "Number" }, "ticktext": [ 1000, 700, 300, 0, 300, 700, 1000 ], "tickvals": [ -1000, -700, -300, 0, 300, 700, 1000 ] }, "yaxis": { "title": { "text": "Age" } }, "bargap": 0.1, "barmode": "overlay", "template": { "data": { "bar": [ { "type": "bar", "marker": { "line": { "color": "#E5ECF6", "width": 0.5 }, "pattern": { "size": 10, "fillmode": "overlay", "solidity": 0.2 } }, "error_x": { "color": "#2a3f5f" }, "error_y": { "color": "#2a3f5f" } } ], "pie": [ { "type": "pie", "automargin": true } ], "table": [ { "type": "table", "cells": { "fill": { "color": "#EBF0F8" }, "line": { "color": "white" } }, "header": { "fill": { "color": "#C8D4E3" }, "line": { "color": "white" } } } ], "carpet": [ { "type": "carpet", "aaxis": { "gridcolor": "white", "linecolor": "white", "endlinecolor": "#2a3f5f", "minorgridcolor": "white", "startlinecolor": "#2a3f5f" }, "baxis": { "gridcolor": "white", "linecolor": "white", "endlinecolor": "#2a3f5f", "minorgridcolor": "white", "startlinecolor": "#2a3f5f" } } ], "mesh3d": [ { "type": "mesh3d", "colorbar": { "ticks": "", "outlinewidth": 0 } } ], "contour": [ { "type": "contour", "colorbar": { "ticks": "", "outlinewidth": 0 }, "colorscale": [ [ 0.0, "#0d0887" ], [ 0.1111111111111111, "#46039f" ], [ 0.2222222222222222, "#7201a8" ], [ 0.3333333333333333, "#9c179e" ], [ 0.4444444444444444, "#bd3786" ], [ 0.5555555555555556, "#d8576b" ], [ 0.6666666666666666, "#ed7953" ], [ 0.7777777777777778, "#fb9f3a" ], [ 0.8888888888888888, "#fdca26" ], [ 1.0, "#f0f921" ] ] } ], "heatmap": [ { "type": "heatmap", "colorbar": { "ticks": "", "outlinewidth": 0 }, "colorscale": [ [ 0.0, "#0d0887" ], [ 0.1111111111111111, "#46039f" ], [ 0.2222222222222222, "#7201a8" ], [ 0.3333333333333333, "#9c179e" ], [ 0.4444444444444444, "#bd3786" ], [ 0.5555555555555556, "#d8576b" ], [ 0.6666666666666666, "#ed7953" ], [ 0.7777777777777778, "#fb9f3a" ], [ 0.8888888888888888, "#fdca26" ], [ 1.0, "#f0f921" ] ] } ], "scatter": [ { "type": "scatter", "fillpattern": { "size": 10, "fillmode": "overlay", "solidity": 0.2 } } ], "surface": [ { "type": "surface", "colorbar": { "ticks": "", "outlinewidth": 0 }, "colorscale": [ [ 0.0, "#0d0887" ], [ 0.1111111111111111, "#46039f" ], [ 0.2222222222222222, "#7201a8" ], [ 0.3333333333333333, "#9c179e" ], [ 0.4444444444444444, "#bd3786" ], [ 0.5555555555555556, "#d8576b" ], [ 0.6666666666666666, "#ed7953" ], [ 0.7777777777777778, "#fb9f3a" ], [ 0.8888888888888888, "#fdca26" ], [ 1.0, "#f0f921" ] ] } ], "barpolar": [ { "type": "barpolar", "marker": { "line": { "color": "#E5ECF6", "width": 0.5 }, "pattern": { "size": 10, "fillmode": "overlay", "solidity": 0.2 } } } ], "heatmapgl": [ { "type": "heatmapgl", "colorbar": { "ticks": "", "outlinewidth": 0 }, "colorscale": [ [ 0.0, "#0d0887" ], [ 0.1111111111111111, "#46039f" ], [ 0.2222222222222222, "#7201a8" ], [ 0.3333333333333333, "#9c179e" ], [ 0.4444444444444444, "#bd3786" ], [ 0.5555555555555556, "#d8576b" ], [ 0.6666666666666666, "#ed7953" ], [ 0.7777777777777778, "#fb9f3a" ], [ 0.8888888888888888, "#fdca26" ], [ 1.0, "#f0f921" ] ] } ], "histogram": [ { "type": "histogram", "marker": { "pattern": { "size": 10, "fillmode": "overlay", "solidity": 0.2 } } } ], "parcoords": [ { "line": { "colorbar": { "ticks": "", "outlinewidth": 0 } }, "type": "parcoords" } ], "scatter3d": [ { "line": { "colorbar": { "ticks": "", "outlinewidth": 0 } }, "type": "scatter3d", "marker": { "colorbar": { "ticks": "", "outlinewidth": 0 } } } ], "scattergl": [ { "type": "scattergl", "marker": { "colorbar": { "ticks": "", "outlinewidth": 0 } } } ], "choropleth": [ { "type": "choropleth", "colorbar": { "ticks": "", "outlinewidth": 0 } } ], "scattergeo": [ { "type": "scattergeo", "marker": { "colorbar": { "ticks": "", "outlinewidth": 0 } } } ], "histogram2d": [ { "type": "histogram2d", "colorbar": { "ticks": "", "outlinewidth": 0 }, "colorscale": [ [ 0.0, "#0d0887" ], [ 0.1111111111111111, "#46039f" ], [ 0.2222222222222222, "#7201a8" ], [ 0.3333333333333333, "#9c179e" ], [ 0.4444444444444444, "#bd3786" ], [ 0.5555555555555556, "#d8576b" ], [ 0.6666666666666666, "#ed7953" ], [ 0.7777777777777778, "#fb9f3a" ], [ 0.8888888888888888, "#fdca26" ], [ 1.0, "#f0f921" ] ] } ], "scatterpolar": [ { "type": "scatterpolar", "marker": { "colorbar": { "ticks": "", "outlinewidth": 0 } } } ], "contourcarpet": [ { "type": "contourcarpet", "colorbar": { "ticks": "", "outlinewidth": 0 } } ], "scattercarpet": [ { "type": "scattercarpet", "marker": { "colorbar": { "ticks": "", "outlinewidth": 0 } } } ], "scattermapbox": [ { "type": "scattermapbox", "marker": { "colorbar": { "ticks": "", "outlinewidth": 0 } } } ], "scatterpolargl": [ { "type": "scatterpolargl", "marker": { "colorbar": { "ticks": "", "outlinewidth": 0 } } } ], "scatterternary": [ { "type": "scatterternary", "marker": { "colorbar": { "ticks": "", "outlinewidth": 0 } } } ], "histogram2dcontour": [ { "type": "histogram2dcontour", "colorbar": { "ticks": "", "outlinewidth": 0 }, "colorscale": [ [ 0.0, "#0d0887" ], [ 0.1111111111111111, "#46039f" ], [ 0.2222222222222222, "#7201a8" ], [ 0.3333333333333333, "#9c179e" ], [ 0.4444444444444444, "#bd3786" ], [ 0.5555555555555556, "#d8576b" ], [ 0.6666666666666666, "#ed7953" ], [ 0.7777777777777778, "#fb9f3a" ], [ 0.8888888888888888, "#fdca26" ], [ 1.0, "#f0f921" ] ] } ] }, "layout": { "geo": { "bgcolor": "white", "showland": true, "lakecolor": "white", "landcolor": "#E5ECF6", "showlakes": true, "subunitcolor": "white" }, "font": { "color": "#2a3f5f" }, "polar": { "bgcolor": "#E5ECF6", "radialaxis": { "ticks": "", "gridcolor": "white", "linecolor": "white" }, "angularaxis": { "ticks": "", "gridcolor": "white", "linecolor": "white" } }, "scene": { "xaxis": { "ticks": "", "gridcolor": "white", "gridwidth": 2, "linecolor": "white", "zerolinecolor": "white", "showbackground": true, "backgroundcolor": "#E5ECF6" }, "yaxis": { "ticks": "", "gridcolor": "white", "gridwidth": 2, "linecolor": "white", "zerolinecolor": "white", "showbackground": true, "backgroundcolor": "#E5ECF6" }, "zaxis": { "ticks": "", "gridcolor": "white", "gridwidth": 2, "linecolor": "white", "zerolinecolor": "white", "showbackground": true, "backgroundcolor": "#E5ECF6" } }, "title": { "x": 0.05 }, "xaxis": { "ticks": "", "title": { "standoff": 15 }, "gridcolor": "white", "linecolor": "white", "automargin": true, "zerolinecolor": "white", "zerolinewidth": 2 }, "yaxis": { "ticks": "", "title": { "standoff": 15 }, "gridcolor": "white", "linecolor": "white", "automargin": true, "zerolinecolor": "white", "zerolinewidth": 2 }, "mapbox": { "style": "light" }, "ternary": { "aaxis": { "ticks": "", "gridcolor": "white", "linecolor": "white" }, "baxis": { "ticks": "", "gridcolor": "white", "linecolor": "white" }, "caxis": { "ticks": "", "gridcolor": "white", "linecolor": "white" }, "bgcolor": "#E5ECF6" }, "colorway": [ "#636efa", "#EF553B", "#00cc96", "#ab63fa", "#FFA15A", "#19d3f3", "#FF6692", "#B6E880", "#FF97FF", "#FECB52" ], "coloraxis": { "colorbar": { "ticks": "", "outlinewidth": 0 } }, "hovermode": "closest", "colorscale": { "diverging": [ [ 0, "#8e0152" ], [ 0.1, "#c51b7d" ], [ 0.2, "#de77ae" ], [ 0.3, "#f1b6da" ], [ 0.4, "#fde0ef" ], [ 0.5, "#f7f7f7" ], [ 0.6, "#e6f5d0" ], [ 0.7, "#b8e186" ], [ 0.8, "#7fbc41" ], [ 0.9, "#4d9221" ], [ 1, "#276419" ] ], "sequential": [ [ 0.0, "#0d0887" ], [ 0.1111111111111111, "#46039f" ], [ 0.2222222222222222, "#7201a8" ], [ 0.3333333333333333, "#9c179e" ], [ 0.4444444444444444, "#bd3786" ], [ 0.5555555555555556, "#d8576b" ], [ 0.6666666666666666, "#ed7953" ], [ 0.7777777777777778, "#fb9f3a" ], [ 0.8888888888888888, "#fdca26" ], [ 1.0, "#f0f921" ] ], "sequentialminus": [ [ 0.0, "#0d0887" ], [ 0.1111111111111111, "#46039f" ], [ 0.2222222222222222, "#7201a8" ], [ 0.3333333333333333, "#9c179e" ], [ 0.4444444444444444, "#bd3786" ], [ 0.5555555555555556, "#d8576b" ], [ 0.6666666666666666, "#ed7953" ], [ 0.7777777777777778, "#fb9f3a" ], [ 0.8888888888888888, "#fdca26" ], [ 1.0, "#f0f921" ] ] }, "hoverlabel": { "align": "left" }, "plot_bgcolor": "#E5ECF6", "paper_bgcolor": "white", "shapedefaults": { "line": { "color": "#2a3f5f" } }, "autotypenumbers": "strict", "annotationdefaults": { "arrowhead": 0, "arrowcolor": "#2a3f5f", "arrowwidth": 1 } } } } }, "height": null, "width": null, "user": { "profile_url": "https://chart-studio.plotly.com/~Yermo", "avatar_url": "https://storage.googleapis.com/plotly-prod-profiles/19.jpg", "background_url": "https://storage.googleapis.com/plotly-prod-profiles/bg-14.jpg", "bio": "", "nickname": "", "website": "", "stream_tokens": null, "feature_set_id": null, "csrf_token": null, "date_joined": "2024-04-01 15:02:14", "mapbox_access_tokens": null, "has_password": null, "username": "Yermo", "email": null, "is_active": null, "readonly": null, "is_dash_creator": null, "dash_created_count": null, "is_chart_creator": null, "charts_created_count": null } }, { "creation_time": "2024-04-01T15:08:58.574078Z", "comments": { "results": [], "count": 0 }, "parented": true, "embed_url": "https://chart-studio.plotly.com/~patelfarukh/1.embed", "fid": "patelfarukh:1", "filename": "Plot 1", "filetype": "plot", "img_url": "https://storage.googleapis.com/plotly-prod-images/patelfarukh/1/9_AANAKEG8AT74BYLKXG71SC11Y5RRNH.png", "image_urls": { "default": "https://storage.googleapis.com/plotly-prod-images/patelfarukh/1/2_XFVT4NYYTDA0W94FI7VLKH71W5UKR1.png", "block-thumb": "https://storage.googleapis.com/plotly-prod-images/patelfarukh/1/8_LXC5CK0EN70YBX263UODLLHONP6X15.png", "list-thumb": "https://storage.googleapis.com/plotly-prod-images/patelfarukh/1/9_AANAKEG8AT74BYLKXG71SC11Y5RRNH.png" }, "api_urls": { "files": "https://api.plotly.com/v2/files/patelfarukh:1", "plots": "https://api.plotly.com/v2/plots/patelfarukh:1", "parent": "https://api.plotly.com/v2/folders/home?user=patelfarukh" }, "owner": "patelfarukh", "parent": -1, "preview": "", "referencers": [], "references": [], "title": "", "views": 3, "web_url": "https://chart-studio.plotly.com/~patelfarukh/1/", "world_readable": true, "date_modified": "2024-04-01T15:08:58.591Z", "stars": { "results": [], "count": 0 }, "collaborators": { "results": [], "count": 0 }, "subfolder_count": null, "refresh_interval": null, "organize_view_url": "https://chart-studio.plotly.com/~patelfarukh/1/", "current_user_permission": "read", "is_theme": null, "is_template": false, "autosize": true, "caption": "", "figure": { "data": [ { "meta": { "columnNames": { "x": "A", "y": "B" } }, "mode": "lines", "type": "scatter", "xsrc": "patelfarukh:0:e41bee", "ysrc": "patelfarukh:0:6dce25" }, { "meta": { "columnNames": { "x": "A", "y": "C" } }, "mode": "lines", "type": "scatter", "xsrc": "patelfarukh:0:e41bee", "ysrc": "patelfarukh:0:6f06cc", "xaxis": "x", "stackgroup": null }, { "meta": { "columnNames": { "x": "A", "y": "D" } }, "mode": "lines", "type": "scatter", "xsrc": "patelfarukh:0:e41bee", "ysrc": "patelfarukh:0:a59f93", "stackgroup": null } ], "frames": [], "layout": { "title": { "text": "Click to enter Plot title" }, "xaxis": { "type": "linear", "range": [ 1, 5 ], "title": { "text": " voltage VDS" }, "autorange": true }, "yaxis": { "type": "linear", "range": [ -0.021111111111111247, 7.401111111111112 ], "title": { "text": "current Id" }, "autorange": true }, "autosize": true, "template": { "data": { "bar": [ { "type": "bar", "marker": { "colorbar": { "ticks": "", "outlinewidth": 0 } } } ], "table": [ { "type": "table", "cells": { "fill": { "color": "#EBF0F8" }, "line": { "color": "white" } }, "header": { "fill": { "color": "#C8D4E3" }, "line": { "color": "white" } } } ], "carpet": [ { "type": "carpet", "aaxis": { "gridcolor": "#C8D4E3", "linecolor": "#C8D4E3", "endlinecolor": "#2a3f5f", "minorgridcolor": "#C8D4E3", "startlinecolor": "#2a3f5f" }, "baxis": { "gridcolor": "#C8D4E3", "linecolor": "#C8D4E3", "endlinecolor": "#2a3f5f", "minorgridcolor": "#C8D4E3", "startlinecolor": "#2a3f5f" } } ], "mesh3d": [ { "type": "mesh3d", "colorbar": { "ticks": "", "outlinewidth": 0 } } ], "contour": [ { "type": "contour", "colorbar": { "ticks": "", "outlinewidth": 0 }, "autocolorscale": true } ], "heatmap": [ { "type": "heatmap", "colorbar": { "ticks": "", "outlinewidth": 0 }, "autocolorscale": true } ], "scatter": [ { "type": "scatter", "marker": { "colorbar": { "ticks": "", "outlinewidth": 0 } } } ], "surface": [ { "type": "surface", "colorbar": { "ticks": "", "outlinewidth": 0 } } ], "heatmapgl": [ { "type": "heatmapgl", "colorbar": { "ticks": "", "outlinewidth": 0 } } ], "histogram": [ { "type": "histogram", "marker": { "colorbar": { "ticks": "", "outlinewidth": 0 } } } ], "parcoords": [ { "line": { "colorbar": { "ticks": "", "outlinewidth": 0 } }, "type": "parcoords" } ], "scatter3d": [ { "type": "scatter3d", "marker": { "colorbar": { "ticks": "", "outlinewidth": 0 } } } ], "scattergl": [ { "type": "scattergl", "marker": { "colorbar": { "ticks": "", "outlinewidth": 0 } } } ], "choropleth": [ { "type": "choropleth", "colorbar": { "ticks": "", "outlinewidth": 0 } } ], "scattergeo": [ { "type": "scattergeo", "marker": { "colorbar": { "ticks": "", "outlinewidth": 0 } } } ], "histogram2d": [ { "type": "histogram2d", "colorbar": { "ticks": "", "outlinewidth": 0 }, "autocolorscale": true } ], "scatterpolar": [ { "type": "scatterpolar", "marker": { "colorbar": { "ticks": "", "outlinewidth": 0 } } } ], "contourcarpet": [ { "type": "contourcarpet", "colorbar": { "ticks": "", "outlinewidth": 0 } } ], "scattercarpet": [ { "type": "scattercarpet", "marker": { "colorbar": { "ticks": "", "outlinewidth": 0 } } } ], "scattermapbox": [ { "type": "scattermapbox", "marker": { "colorbar": { "ticks": "", "outlinewidth": 0 } } } ], "scatterpolargl": [ { "type": "scatterpolargl", "marker": { "colorbar": { "ticks": "", "outlinewidth": 0 } } } ], "scatterternary": [ { "type": "scatterternary", "marker": { "colorbar": { "ticks": "", "outlinewidth": 0 } } } ], "histogram2dcontour": [ { "type": "histogram2dcontour", "colorbar": { "ticks": "", "outlinewidth": 0 }, "autocolorscale": true } ] }, "layout": { "geo": { "bgcolor": "white", "showland": true, "lakecolor": "white", "landcolor": "white", "showlakes": true, "subunitcolor": "#C8D4E3" }, "font": { "color": "#2a3f5f" }, "polar": { "bgcolor": "white", "radialaxis": { "ticks": "", "gridcolor": "#EBF0F8", "linecolor": "#EBF0F8" }, "angularaxis": { "ticks": "", "gridcolor": "#EBF0F8", "linecolor": "#EBF0F8" } }, "scene": { "xaxis": { "ticks": "", "gridcolor": "#DFE8F3", "gridwidth": 2, "linecolor": "#EBF0F8", "zerolinecolor": "#EBF0F8", "showbackground": true, "backgroundcolor": "white" }, "yaxis": { "ticks": "", "gridcolor": "#DFE8F3", "gridwidth": 2, "linecolor": "#EBF0F8", "zerolinecolor": "#EBF0F8", "showbackground": true, "backgroundcolor": "white" }, "zaxis": { "ticks": "", "gridcolor": "#DFE8F3", "gridwidth": 2, "linecolor": "#EBF0F8", "zerolinecolor": "#EBF0F8", "showbackground": true, "backgroundcolor": "white" } }, "title": { "x": 0.05 }, "xaxis": { "ticks": "", "gridcolor": "#EBF0F8", "linecolor": "#EBF0F8", "automargin": true, "zerolinecolor": "#EBF0F8", "zerolinewidth": 2 }, "yaxis": { "ticks": "", "gridcolor": "#EBF0F8", "linecolor": "#EBF0F8", "automargin": true, "zerolinecolor": "#EBF0F8", "zerolinewidth": 2 }, "ternary": { "aaxis": { "ticks": "", "gridcolor": "#DFE8F3", "linecolor": "#A2B1C6" }, "baxis": { "ticks": "", "gridcolor": "#DFE8F3", "linecolor": "#A2B1C6" }, "caxis": { "ticks": "", "gridcolor": "#DFE8F3", "linecolor": "#A2B1C6" }, "bgcolor": "white" }, "colorway": [ "#636efa", "#EF553B", "#00cc96", "#ab63fa", "#19d3f3", "#e763fa", "#fecb52", "#ffa15a", "#ff6692", "#b6e880" ], "hovermode": "closest", "colorscale": { "diverging": [ [ 0, "#8e0152" ], [ 0.1, "#c51b7d" ], [ 0.2, "#de77ae" ], [ 0.3, "#f1b6da" ], [ 0.4, "#fde0ef" ], [ 0.5, "#f7f7f7" ], [ 0.6, "#e6f5d0" ], [ 0.7, "#b8e186" ], [ 0.8, "#7fbc41" ], [ 0.9, "#4d9221" ], [ 1, "#276419" ] ], "sequential": [ [ 0, "#0508b8" ], [ 0.0893854748603352, "#1910d8" ], [ 0.1787709497206704, "#3c19f0" ], [ 0.2681564245810056, "#6b1cfb" ], [ 0.3575418994413408, "#981cfd" ], [ 0.44692737430167595, "#bf1cfd" ], [ 0.5363128491620112, "#dd2bfd" ], [ 0.6256983240223464, "#f246fe" ], [ 0.7150837988826816, "#fc67fd" ], [ 0.8044692737430168, "#fe88fc" ], [ 0.8938547486033519, "#fea5fd" ], [ 0.9832402234636871, "#febefe" ], [ 1, "#fec3fe" ] ], "sequentialminus": [ [ 0, "#0508b8" ], [ 0.0893854748603352, "#1910d8" ], [ 0.1787709497206704, "#3c19f0" ], [ 0.2681564245810056, "#6b1cfb" ], [ 0.3575418994413408, "#981cfd" ], [ 0.44692737430167595, "#bf1cfd" ], [ 0.5363128491620112, "#dd2bfd" ], [ 0.6256983240223464, "#f246fe" ], [ 0.7150837988826816, "#fc67fd" ], [ 0.8044692737430168, "#fe88fc" ], [ 0.8938547486033519, "#fea5fd" ], [ 0.9832402234636871, "#febefe" ], [ 1, "#fec3fe" ] ] }, "plot_bgcolor": "white", "paper_bgcolor": "white", "shapedefaults": { "line": { "width": 0 }, "opacity": 0.4, "fillcolor": "#506784" }, "annotationdefaults": { "arrowhead": 0, "arrowcolor": "#506784", "arrowwidth": 1 } }, "themeRef": "PLOTLY_WHITE" } } }, "height": null, "width": null, "user": { "profile_url": "https://chart-studio.plotly.com/~patelfarukh", "avatar_url": "https://storage.googleapis.com/plotly-prod-profiles/67.jpg", "background_url": "https://storage.googleapis.com/plotly-prod-profiles/bg-9.jpg", "bio": "", "nickname": "", "website": "", "stream_tokens": null, "feature_set_id": null, "csrf_token": null, "date_joined": "2024-04-01 15:08:31", "mapbox_access_tokens": null, "has_password": null, "username": "patelfarukh", "email": null, "is_active": null, "readonly": null, "is_dash_creator": null, "dash_created_count": null, "is_chart_creator": null, "charts_created_count": null } }, { "creation_time": "2024-04-01T14:56:22.056253Z", "comments": { "results": [], "count": 0 }, "parented": true, "embed_url": "https://chart-studio.plotly.com/~kubix448/52.embed", "fid": "kubix448:52", "filename": "SmallerDataSizeLine", "filetype": "plot", "img_url": "https://storage.googleapis.com/plotly-prod-images/kubix448/52/9_OV99ZV40FBGGHZ7QC8IEQUZ8LXDI0K.png", "image_urls": { "default": "https://storage.googleapis.com/plotly-prod-images/kubix448/52/2_O5ZVKUKO4TGSQEH2YWU1JGK05PD1QW.png", "block-thumb": "https://storage.googleapis.com/plotly-prod-images/kubix448/52/8_SNJDNAIPPU51CEGZJX0BI3NIZDHSLY.png", "list-thumb": "https://storage.googleapis.com/plotly-prod-images/kubix448/52/9_OV99ZV40FBGGHZ7QC8IEQUZ8LXDI0K.png" }, "api_urls": { "files": "https://api.plotly.com/v2/files/kubix448:52", "plots": "https://api.plotly.com/v2/plots/kubix448:52", "parent": "https://api.plotly.com/v2/folders/home?user=kubix448" }, "owner": "kubix448", "parent": -1, "preview": "", "referencers": [], "references": [], "title": "", "views": 2, "web_url": "https://chart-studio.plotly.com/~kubix448/52/", "world_readable": true, "date_modified": "2024-04-05T16:42:21.127Z", "stars": { "results": [], "count": 0 }, "collaborators": { "results": [], "count": 0 }, "subfolder_count": null, "refresh_interval": null, "organize_view_url": "https://chart-studio.plotly.com/~kubix448/52/", "current_user_permission": "read", "is_theme": null, "is_template": false, "autosize": true, "caption": "", "figure": { "data": [ { "line": { "width": 4 }, "meta": { "columnNames": { "x": "B", "y": "C" } }, "mode": "lines", "name": "SSA", "type": "scatter", "xsrc": "kubix448:43:b13611", "ysrc": "kubix448:43:42bc1b", "boxpoints": false, "transforms": [ { "meta": { "columnNames": { "target": "B" } }, "type": "filter", "value": "100", "enabled": true, "operation": "<=", "targetsrc": "kubix448:43:b13611" }, { "meta": { "columnNames": { "groups": "B" } }, "type": "aggregate", "groupssrc": "kubix448:43:b13611", "aggregations": [ null, { "func": "avg", "target": "y", "enabled": true } ] } ] }, { "line": { "width": 4 }, "meta": { "columnNames": { "x": "B", "y": "G" } }, "mode": "lines", "name": "Holt-Winters", "type": "scatter", "xsrc": "kubix448:43:b13611", "ysrc": "kubix448:43:5e03f3", "boxpoints": false, "transforms": [ { "meta": { "columnNames": { "target": "B" } }, "type": "filter", "value": "100", "enabled": true, "operation": "<=", "targetsrc": "kubix448:43:b13611" }, { "meta": { "columnNames": { "groups": "B" } }, "type": "aggregate", "groupssrc": "kubix448:43:b13611", "aggregations": [ null, { "func": "avg", "target": "y", "enabled": true } ] } ] }, { "line": { "width": 4 }, "meta": { "columnNames": { "x": "B", "y": "E" } }, "mode": "lines", "name": "Linární Regrese", "type": "scatter", "xsrc": "kubix448:43:b13611", "ysrc": "kubix448:43:87278c", "opacity": 1, "showlegend": true, "stackgroup": null, "transforms": [ { "meta": { "columnNames": { "target": "B" } }, "type": "filter", "value": "100", "enabled": true, "operation": "<=", "targetsrc": "kubix448:43:b13611" }, { "meta": { "columnNames": { "groups": "B" } }, "type": "aggregate", "groupssrc": "kubix448:43:b13611", "aggregations": [ null, { "func": "avg", "target": "y", "enabled": true } ] } ] }, { "line": { "width": 4 }, "meta": { "columnNames": { "x": "B", "y": "I" } }, "mode": "lines", "name": "ARIMA", "type": "scatter", "xsrc": "kubix448:43:b13611", "ysrc": "kubix448:43:b78013", "boxpoints": false, "showlegend": true, "transforms": [ { "meta": { "columnNames": { "target": "B" } }, "type": "filter", "value": "100", "enabled": false, "operation": "<=", "targetsrc": "kubix448:43:b13611" }, { "meta": { "columnNames": { "groups": "B" } }, "type": "aggregate", "groupssrc": "kubix448:43:b13611", "aggregations": [ null, { "func": "avg", "target": "y", "enabled": true } ] } ] } ], "frames": [], "layout": { "title": { "font": { "size": 36 }, "text": "Rozsahy 25-100 dnů" }, "xaxis": { "type": "linear", "dtick": 25, "range": [ 25, 100 ], "title": { "font": { "size": 36 }, "text": "Velikost vstupních dat (Dny s hodinovou frekvencí)" }, "showline": true, "tickfont": { "size": 28 }, "tickmode": "linear", "autorange": true, "gridcolor": "rgb(179, 188, 199)", "linecolor": "rgb(179, 188, 199)", "showspikes": false }, "yaxis": { "type": "linear", "range": [ 50, 90 ], "title": { "font": { "size": 36 }, "text": "Naměřená chyba MAPE (%)" }, "showline": true, "tickfont": { "size": 28 }, "autorange": false, "gridcolor": "rgb(179, 188, 199)", "linecolor": "rgb(179, 188, 199)", "showspikes": false }, "legend": { "font": { "size": 26 } }, "boxmode": "group", "autosize": true, "template": { "data": { "bar": [ { "type": "bar", "marker": { "colorbar": { "ticks": "", "outlinewidth": 0 } } } ], "table": [ { "type": "table", "cells": { "fill": { "color": "#EBF0F8" }, "line": { "color": "white" } }, "header": { "fill": { "color": "#C8D4E3" }, "line": { "color": "white" } } } ], "carpet": [ { "type": "carpet", "aaxis": { "gridcolor": "#C8D4E3", "linecolor": "#C8D4E3", "endlinecolor": "#2a3f5f", "minorgridcolor": "#C8D4E3", "startlinecolor": "#2a3f5f" }, "baxis": { "gridcolor": "#C8D4E3", "linecolor": "#C8D4E3", "endlinecolor": "#2a3f5f", "minorgridcolor": "#C8D4E3", "startlinecolor": "#2a3f5f" } } ], "mesh3d": [ { "type": "mesh3d", "colorbar": { "ticks": "", "outlinewidth": 0 } } ], "contour": [ { "type": "contour", "colorbar": { "ticks": "", "outlinewidth": 0 }, "autocolorscale": true } ], "heatmap": [ { "type": "heatmap", "colorbar": { "ticks": "", "outlinewidth": 0 }, "autocolorscale": true } ], "scatter": [ { "type": "scatter", "marker": { "colorbar": { "ticks": "", "outlinewidth": 0 } } } ], "surface": [ { "type": "surface", "colorbar": { "ticks": "", "outlinewidth": 0 } } ], "heatmapgl": [ { "type": "heatmapgl", "colorbar": { "ticks": "", "outlinewidth": 0 } } ], "histogram": [ { "type": "histogram", "marker": { "colorbar": { "ticks": "", "outlinewidth": 0 } } } ], "parcoords": [ { "line": { "colorbar": { "ticks": "", "outlinewidth": 0 } }, "type": "parcoords" } ], "scatter3d": [ { "type": "scatter3d", "marker": { "colorbar": { "ticks": "", "outlinewidth": 0 } } } ], "scattergl": [ { "type": "scattergl", "marker": { "colorbar": { "ticks": "", "outlinewidth": 0 } } } ], "choropleth": [ { "type": "choropleth", "colorbar": { "ticks": "", "outlinewidth": 0 } } ], "scattergeo": [ { "type": "scattergeo", "marker": { "colorbar": { "ticks": "", "outlinewidth": 0 } } } ], "histogram2d": [ { "type": "histogram2d", "colorbar": { "ticks": "", "outlinewidth": 0 }, "autocolorscale": true } ], "scatterpolar": [ { "type": "scatterpolar", "marker": { "colorbar": { "ticks": "", "outlinewidth": 0 } } } ], "contourcarpet": [ { "type": "contourcarpet", "colorbar": { "ticks": "", "outlinewidth": 0 } } ], "scattercarpet": [ { "type": "scattercarpet", "marker": { "colorbar": { "ticks": "", "outlinewidth": 0 } } } ], "scattermapbox": [ { "type": "scattermapbox", "marker": { "colorbar": { "ticks": "", "outlinewidth": 0 } } } ], "scatterpolargl": [ { "type": "scatterpolargl", "marker": { "colorbar": { "ticks": "", "outlinewidth": 0 } } } ], "scatterternary": [ { "type": "scatterternary", "marker": { "colorbar": { "ticks": "", "outlinewidth": 0 } } } ], "histogram2dcontour": [ { "type": "histogram2dcontour", "colorbar": { "ticks": "", "outlinewidth": 0 }, "autocolorscale": true } ] }, "layout": { "geo": { "bgcolor": "white", "showland": true, "lakecolor": "white", "landcolor": "white", "showlakes": true, "subunitcolor": "#C8D4E3" }, "font": { "color": "#2a3f5f" }, "polar": { "bgcolor": "white", "radialaxis": { "ticks": "", "gridcolor": "#EBF0F8", "linecolor": "#EBF0F8" }, "angularaxis": { "ticks": "", "gridcolor": "#EBF0F8", "linecolor": "#EBF0F8" } }, "scene": { "xaxis": { "ticks": "", "gridcolor": "#DFE8F3", "gridwidth": 2, "linecolor": "#EBF0F8", "zerolinecolor": "#EBF0F8", "showbackground": true, "backgroundcolor": "white" }, "yaxis": { "ticks": "", "gridcolor": "#DFE8F3", "gridwidth": 2, "linecolor": "#EBF0F8", "zerolinecolor": "#EBF0F8", "showbackground": true, "backgroundcolor": "white" }, "zaxis": { "ticks": "", "gridcolor": "#DFE8F3", "gridwidth": 2, "linecolor": "#EBF0F8", "zerolinecolor": "#EBF0F8", "showbackground": true, "backgroundcolor": "white" } }, "title": { "x": 0.05 }, "xaxis": { "ticks": "", "gridcolor": "#EBF0F8", "linecolor": "#EBF0F8", "automargin": true, "zerolinecolor": "#EBF0F8", "zerolinewidth": 2 }, "yaxis": { "ticks": "", "gridcolor": "#EBF0F8", "linecolor": "#EBF0F8", "automargin": true, "zerolinecolor": "#EBF0F8", "zerolinewidth": 2 }, "ternary": { "aaxis": { "ticks": "", "gridcolor": "#DFE8F3", "linecolor": "#A2B1C6" }, "baxis": { "ticks": "", "gridcolor": "#DFE8F3", "linecolor": "#A2B1C6" }, "caxis": { "ticks": "", "gridcolor": "#DFE8F3", "linecolor": "#A2B1C6" }, "bgcolor": "white" }, "colorway": [ "#636efa", "#EF553B", "#00cc96", "#ab63fa", "#19d3f3", "#e763fa", "#fecb52", "#ffa15a", "#ff6692", "#b6e880" ], "hovermode": "closest", "colorscale": { "diverging": [ [ 0, "#8e0152" ], [ 0.1, "#c51b7d" ], [ 0.2, "#de77ae" ], [ 0.3, "#f1b6da" ], [ 0.4, "#fde0ef" ], [ 0.5, "#f7f7f7" ], [ 0.6, "#e6f5d0" ], [ 0.7, "#b8e186" ], [ 0.8, "#7fbc41" ], [ 0.9, "#4d9221" ], [ 1, "#276419" ] ], "sequential": [ [ 0, "#0508b8" ], [ 0.0893854748603352, "#1910d8" ], [ 0.1787709497206704, "#3c19f0" ], [ 0.2681564245810056, "#6b1cfb" ], [ 0.3575418994413408, "#981cfd" ], [ 0.44692737430167595, "#bf1cfd" ], [ 0.5363128491620112, "#dd2bfd" ], [ 0.6256983240223464, "#f246fe" ], [ 0.7150837988826816, "#fc67fd" ], [ 0.8044692737430168, "#fe88fc" ], [ 0.8938547486033519, "#fea5fd" ], [ 0.9832402234636871, "#febefe" ], [ 1, "#fec3fe" ] ], "sequentialminus": [ [ 0, "#0508b8" ], [ 0.0893854748603352, "#1910d8" ], [ 0.1787709497206704, "#3c19f0" ], [ 0.2681564245810056, "#6b1cfb" ], [ 0.3575418994413408, "#981cfd" ], [ 0.44692737430167595, "#bf1cfd" ], [ 0.5363128491620112, "#dd2bfd" ], [ 0.6256983240223464, "#f246fe" ], [ 0.7150837988826816, "#fc67fd" ], [ 0.8044692737430168, "#fe88fc" ], [ 0.8938547486033519, "#fea5fd" ], [ 0.9832402234636871, "#febefe" ], [ 1, "#fec3fe" ] ] }, "plot_bgcolor": "white", "paper_bgcolor": "white", "shapedefaults": { "line": { "width": 0 }, "opacity": 0.4, "fillcolor": "#506784" }, "annotationdefaults": { "arrowhead": 0, "arrowcolor": "#506784", "arrowwidth": 1 } }, "themeRef": "PLOTLY_WHITE" } } }, "height": null, "width": null, "user": { "profile_url": "https://chart-studio.plotly.com/~kubix448", "avatar_url": "https://storage.googleapis.com/plotly-prod-profiles/25.jpg", "background_url": "https://storage.googleapis.com/plotly-prod-profiles/bg-9.jpg", "bio": "", "nickname": "", "website": "", "stream_tokens": null, "feature_set_id": null, "csrf_token": null, "date_joined": "2024-03-02 14:31:02", "mapbox_access_tokens": null, "has_password": null, "username": "kubix448", "email": null, "is_active": null, "readonly": null, "is_dash_creator": null, "dash_created_count": null, "is_chart_creator": null, "charts_created_count": null } }, { "creation_time": "2024-04-01T14:52:22.268888Z", "comments": { "results": [], "count": 0 }, "parented": true, "embed_url": "https://chart-studio.plotly.com/~kubix448/51.embed", "fid": "kubix448:51", "filename": "DataSizePlot", "filetype": "plot", "img_url": "https://storage.googleapis.com/plotly-prod-images/kubix448/51/9_LHOLL14414VF6851Z4V1N134LRHW7R.png", "image_urls": { "default": "https://storage.googleapis.com/plotly-prod-images/kubix448/51/2_GVF2XXVPVL85LVC5M3ZFRR4URDNRZI.png", "block-thumb": "https://storage.googleapis.com/plotly-prod-images/kubix448/51/8_CM74KYMO105E8RZQKP6LMSKG0M609J.png", "list-thumb": "https://storage.googleapis.com/plotly-prod-images/kubix448/51/9_LHOLL14414VF6851Z4V1N134LRHW7R.png" }, "api_urls": { "files": "https://api.plotly.com/v2/files/kubix448:51", "plots": "https://api.plotly.com/v2/plots/kubix448:51", "parent": "https://api.plotly.com/v2/folders/home?user=kubix448" }, "owner": "kubix448", "parent": -1, "preview": "", "referencers": [], "references": [], "title": "", "views": 1, "web_url": "https://chart-studio.plotly.com/~kubix448/51/", "world_readable": true, "date_modified": "2024-04-01T15:18:52.926Z", "stars": { "results": [], "count": 0 }, "collaborators": { "results": [], "count": 0 }, "subfolder_count": null, "refresh_interval": null, "organize_view_url": "https://chart-studio.plotly.com/~kubix448/51/", "current_user_permission": "read", "is_theme": null, "is_template": false, "autosize": true, "caption": "", "figure": { "data": [ { "meta": { "columnNames": { "x": "B", "y": "C" } }, "mode": "lines", "name": "SSA", "type": "box", "xsrc": "kubix448:43:b13611", "ysrc": "kubix448:43:42bc1b", "boxpoints": false, "transforms": [ { "meta": { "columnNames": { "target": "B" } }, "type": "filter", "value": "75", "enabled": true, "operation": ">", "targetsrc": "kubix448:43:b13611" } ] }, { "meta": { "columnNames": { "x": "B", "y": "G" } }, "mode": "lines", "name": "Holt-Winters", "type": "box", "xsrc": "kubix448:43:b13611", "ysrc": "kubix448:43:5e03f3", "boxpoints": false, "stackgroup": null, "transforms": [ { "meta": { "columnNames": { "target": "B" } }, "type": "filter", "value": "75", "enabled": true, "operation": ">", "targetsrc": "kubix448:43:b13611" } ] }, { "meta": { "columnNames": { "x": "B", "y": "I" } }, "mode": "lines", "name": "ARIMA", "type": "box", "xsrc": "kubix448:43:b13611", "ysrc": "kubix448:43:b78013", "opacity": 0, "boxpoints": false, "showlegend": false, "stackgroup": null, "transforms": [ { "meta": { "columnNames": { "target": "B" } }, "type": "filter", "value": "75", "enabled": true, "operation": ">", "targetsrc": "kubix448:43:b13611" } ] }, { "meta": { "columnNames": { "x": "B", "y": "E" } }, "mode": "lines", "name": "Linární Regrese", "type": "box", "xsrc": "kubix448:43:b13611", "ysrc": "kubix448:43:87278c", "opacity": 0, "boxpoints": false, "showlegend": false, "stackgroup": null, "transforms": [ { "meta": { "columnNames": { "target": "B" } }, "type": "filter", "value": "75", "operation": ">", "targetsrc": "kubix448:43:b13611" } ] } ], "frames": [], "layout": { "title": { "font": { "size": 36 }, "text": "Reakce metod na velikost vstupních dat" }, "xaxis": { "type": "linear", "range": [ 50, 650 ], "title": { "font": { "size": 36 }, "text": "Velikost vstupních dat (Dny s hodinovou frekvencí)" }, "showline": true, "tickfont": { "size": 28 }, "autorange": true, "gridcolor": "rgb(179, 188, 199)", "linecolor": "rgb(179, 188, 199)", "showspikes": false }, "yaxis": { "type": "linear", "range": [ 30.457222222222217, 123.71277777777777 ], "title": { "font": { "size": 36 }, "text": "Naměřená chyba MAPE (%)" }, "showline": true, "tickfont": { "size": 24 }, "autorange": true, "gridcolor": "rgb(179, 188, 199)", "linecolor": "rgb(179, 188, 199)", "showspikes": false }, "legend": { "font": { "size": 26 } }, "boxmode": "group", "autosize": true, "template": { "data": { "bar": [ { "type": "bar", "marker": { "colorbar": { "ticks": "", "outlinewidth": 0 } } } ], "table": [ { "type": "table", "cells": { "fill": { "color": "#EBF0F8" }, "line": { "color": "white" } }, "header": { "fill": { "color": "#C8D4E3" }, "line": { "color": "white" } } } ], "carpet": [ { "type": "carpet", "aaxis": { "gridcolor": "#C8D4E3", "linecolor": "#C8D4E3", "endlinecolor": "#2a3f5f", "minorgridcolor": "#C8D4E3", "startlinecolor": "#2a3f5f" }, "baxis": { "gridcolor": "#C8D4E3", "linecolor": "#C8D4E3", "endlinecolor": "#2a3f5f", "minorgridcolor": "#C8D4E3", "startlinecolor": "#2a3f5f" } } ], "mesh3d": [ { "type": "mesh3d", "colorbar": { "ticks": "", "outlinewidth": 0 } } ], "contour": [ { "type": "contour", "colorbar": { "ticks": "", "outlinewidth": 0 }, "autocolorscale": true } ], "heatmap": [ { "type": "heatmap", "colorbar": { "ticks": "", "outlinewidth": 0 }, "autocolorscale": true } ], "scatter": [ { "type": "scatter", "marker": { "colorbar": { "ticks": "", "outlinewidth": 0 } } } ], "surface": [ { "type": "surface", "colorbar": { "ticks": "", "outlinewidth": 0 } } ], "heatmapgl": [ { "type": "heatmapgl", "colorbar": { "ticks": "", "outlinewidth": 0 } } ], "histogram": [ { "type": "histogram", "marker": { "colorbar": { "ticks": "", "outlinewidth": 0 } } } ], "parcoords": [ { "line": { "colorbar": { "ticks": "", "outlinewidth": 0 } }, "type": "parcoords" } ], "scatter3d": [ { "type": "scatter3d", "marker": { "colorbar": { "ticks": "", "outlinewidth": 0 } } } ], "scattergl": [ { "type": "scattergl", "marker": { "colorbar": { "ticks": "", "outlinewidth": 0 } } } ], "choropleth": [ { "type": "choropleth", "colorbar": { "ticks": "", "outlinewidth": 0 } } ], "scattergeo": [ { "type": "scattergeo", "marker": { "colorbar": { "ticks": "", "outlinewidth": 0 } } } ], "histogram2d": [ { "type": "histogram2d", "colorbar": { "ticks": "", "outlinewidth": 0 }, "autocolorscale": true } ], "scatterpolar": [ { "type": "scatterpolar", "marker": { "colorbar": { "ticks": "", "outlinewidth": 0 } } } ], "contourcarpet": [ { "type": "contourcarpet", "colorbar": { "ticks": "", "outlinewidth": 0 } } ], "scattercarpet": [ { "type": "scattercarpet", "marker": { "colorbar": { "ticks": "", "outlinewidth": 0 } } } ], "scattermapbox": [ { "type": "scattermapbox", "marker": { "colorbar": { "ticks": "", "outlinewidth": 0 } } } ], "scatterpolargl": [ { "type": "scatterpolargl", "marker": { "colorbar": { "ticks": "", "outlinewidth": 0 } } } ], "scatterternary": [ { "type": "scatterternary", "marker": { "colorbar": { "ticks": "", "outlinewidth": 0 } } } ], "histogram2dcontour": [ { "type": "histogram2dcontour", "colorbar": { "ticks": "", "outlinewidth": 0 }, "autocolorscale": true } ] }, "layout": { "geo": { "bgcolor": "white", "showland": true, "lakecolor": "white", "landcolor": "white", "showlakes": true, "subunitcolor": "#C8D4E3" }, "font": { "color": "#2a3f5f" }, "polar": { "bgcolor": "white", "radialaxis": { "ticks": "", "gridcolor": "#EBF0F8", "linecolor": "#EBF0F8" }, "angularaxis": { "ticks": "", "gridcolor": "#EBF0F8", "linecolor": "#EBF0F8" } }, "scene": { "xaxis": { "ticks": "", "gridcolor": "#DFE8F3", "gridwidth": 2, "linecolor": "#EBF0F8", "zerolinecolor": "#EBF0F8", "showbackground": true, "backgroundcolor": "white" }, "yaxis": { "ticks": "", "gridcolor": "#DFE8F3", "gridwidth": 2, "linecolor": "#EBF0F8", "zerolinecolor": "#EBF0F8", "showbackground": true, "backgroundcolor": "white" }, "zaxis": { "ticks": "", "gridcolor": "#DFE8F3", "gridwidth": 2, "linecolor": "#EBF0F8", "zerolinecolor": "#EBF0F8", "showbackground": true, "backgroundcolor": "white" } }, "title": { "x": 0.05 }, "xaxis": { "ticks": "", "gridcolor": "#EBF0F8", "linecolor": "#EBF0F8", "automargin": true, "zerolinecolor": "#EBF0F8", "zerolinewidth": 2 }, "yaxis": { "ticks": "", "gridcolor": "#EBF0F8", "linecolor": "#EBF0F8", "automargin": true, "zerolinecolor": "#EBF0F8", "zerolinewidth": 2 }, "ternary": { "aaxis": { "ticks": "", "gridcolor": "#DFE8F3", "linecolor": "#A2B1C6" }, "baxis": { "ticks": "", "gridcolor": "#DFE8F3", "linecolor": "#A2B1C6" }, "caxis": { "ticks": "", "gridcolor": "#DFE8F3", "linecolor": "#A2B1C6" }, "bgcolor": "white" }, "colorway": [ "#636efa", "#EF553B", "#00cc96", "#ab63fa", "#19d3f3", "#e763fa", "#fecb52", "#ffa15a", "#ff6692", "#b6e880" ], "hovermode": "closest", "colorscale": { "diverging": [ [ 0, "#8e0152" ], [ 0.1, "#c51b7d" ], [ 0.2, "#de77ae" ], [ 0.3, "#f1b6da" ], [ 0.4, "#fde0ef" ], [ 0.5, "#f7f7f7" ], [ 0.6, "#e6f5d0" ], [ 0.7, "#b8e186" ], [ 0.8, "#7fbc41" ], [ 0.9, "#4d9221" ], [ 1, "#276419" ] ], "sequential": [ [ 0, "#0508b8" ], [ 0.0893854748603352, "#1910d8" ], [ 0.1787709497206704, "#3c19f0" ], [ 0.2681564245810056, "#6b1cfb" ], [ 0.3575418994413408, "#981cfd" ], [ 0.44692737430167595, "#bf1cfd" ], [ 0.5363128491620112, "#dd2bfd" ], [ 0.6256983240223464, "#f246fe" ], [ 0.7150837988826816, "#fc67fd" ], [ 0.8044692737430168, "#fe88fc" ], [ 0.8938547486033519, "#fea5fd" ], [ 0.9832402234636871, "#febefe" ], [ 1, "#fec3fe" ] ], "sequentialminus": [ [ 0, "#0508b8" ], [ 0.0893854748603352, "#1910d8" ], [ 0.1787709497206704, "#3c19f0" ], [ 0.2681564245810056, "#6b1cfb" ], [ 0.3575418994413408, "#981cfd" ], [ 0.44692737430167595, "#bf1cfd" ], [ 0.5363128491620112, "#dd2bfd" ], [ 0.6256983240223464, "#f246fe" ], [ 0.7150837988826816, "#fc67fd" ], [ 0.8044692737430168, "#fe88fc" ], [ 0.8938547486033519, "#fea5fd" ], [ 0.9832402234636871, "#febefe" ], [ 1, "#fec3fe" ] ] }, "plot_bgcolor": "white", "paper_bgcolor": "white", "shapedefaults": { "line": { "width": 0 }, "opacity": 0.4, "fillcolor": "#506784" }, "annotationdefaults": { "arrowhead": 0, "arrowcolor": "#506784", "arrowwidth": 1 } }, "themeRef": "PLOTLY_WHITE" } } }, "height": null, "width": null, "user": { "profile_url": "https://chart-studio.plotly.com/~kubix448", "avatar_url": "https://storage.googleapis.com/plotly-prod-profiles/25.jpg", "background_url": "https://storage.googleapis.com/plotly-prod-profiles/bg-9.jpg", "bio": "", "nickname": "", "website": "", "stream_tokens": null, "feature_set_id": null, "csrf_token": null, "date_joined": "2024-03-02 14:31:02", "mapbox_access_tokens": null, "has_password": null, "username": "kubix448", "email": null, "is_active": null, "readonly": null, "is_dash_creator": null, "dash_created_count": null, "is_chart_creator": null, "charts_created_count": null } }, { "creation_time": "2024-04-01T14:28:42.192323Z", "comments": { "results": [], "count": 0 }, "parented": true, "embed_url": "https://chart-studio.plotly.com/~lmalves/305.embed", "fid": "lmalves:305", "filename": "MeD- Gráfico 4.1.3 - Sul", "filetype": "plot", "img_url": "https://storage.googleapis.com/plotly-prod-images/lmalves/305/9_KUQQ5ZPYK2UXZD3HOA3J7078IC7HFA.png", "image_urls": { "default": "https://storage.googleapis.com/plotly-prod-images/lmalves/305/2_28U2MNTFPQ6L8ZJ81XA44O7SX2IK2Z.png", "block-thumb": "https://storage.googleapis.com/plotly-prod-images/lmalves/305/8_P320MZH0YMWV9X1T3NECWC4MXVTQSH.png", "list-thumb": "https://storage.googleapis.com/plotly-prod-images/lmalves/305/9_KUQQ5ZPYK2UXZD3HOA3J7078IC7HFA.png" }, "api_urls": { "files": "https://api.plotly.com/v2/files/lmalves:305", "plots": "https://api.plotly.com/v2/plots/lmalves:305", "parent": "https://api.plotly.com/v2/folders/home?user=lmalves" }, "owner": "lmalves", "parent": -1, "preview": "", "referencers": [], "references": [], "title": "", "views": 130, "web_url": "https://chart-studio.plotly.com/~lmalves/305/", "world_readable": true, "date_modified": "2024-05-15T18:05:52.814Z", "stars": { "results": [], "count": 0 }, "collaborators": { "results": [], "count": 0 }, "subfolder_count": null, "refresh_interval": null, "organize_view_url": "https://chart-studio.plotly.com/~lmalves/305/", "current_user_permission": "read", "is_theme": null, "is_template": false, "autosize": false, "caption": "", "figure": { "data": [ { "line": { "width": 3 }, "meta": { "columnNames": { "r": "B", "text": "C", "theta": "A" } }, "name": "Mestres", "rsrc": "lmalves:304:07026e", "type": "scatterpolar", "marker": { "size": 8, "color": "rgb(2, 149, 100)", "symbol": "circle" }, "textsrc": "lmalves:304:1fcdef", "thetasrc": "lmalves:304:84b236", "hoverinfo": "text", "hoverlabel": { "align": "left" }, "showlegend": true }, { "fill": "none", "line": { "color": "rgb(111, 45, 141)", "width": 3 }, "meta": { "columnNames": { "r": "F", "text": "G", "theta": "A" } }, "name": "Doutores", "rsrc": "lmalves:304:886e40", "type": "scatterpolar", "marker": { "size": 8, "color": "rgb(111, 45, 141)", "symbol": "square" }, "subplot": "polar2", "textsrc": "lmalves:304:80eb76", "thetasrc": "lmalves:304:84b236", "hoverinfo": "text", "thetaunit": "degrees", "cliponaxis": false, "hoverlabel": { "align": "left" } } ], "frames": [], "layout": { "font": { "size": 13, "family": "Roboto" }, "polar": { "domain": { "x": [ 0, 0.35 ], "y": [ 0, 1 ] }, "radialaxis": { "type": "linear", "range": [ 0, 2 ], "title": { "font": { "size": 13 }, "text": "<br>" }, "ticklen": 5, "autorange": false, "direction": "clockwise", "tickangle": 45, "ticksuffix": "", "minexponent": 3, "separatethousands": false }, "angularaxis": { "type": "category", "dtick": 1, "range": [ 1, 4 ], "nticks": 0, "ticklen": 5, "showgrid": true, "showline": true, "tickmode": "linear", "autorange": false, "direction": "clockwise", "gridwidth": 1, "linewidth": 1, "tickangle": "auto", "tickwidth": 1, "ticksuffix": "", "showticklabels": true } }, "title": { "x": 0.5, "font": { "size": 13 }, "text": "" }, "width": 800, "xaxis": { "range": [ -1, 6 ], "autorange": true }, "yaxis": { "range": [ -1, 4 ], "autorange": true }, "bargap": 0.9995, "height": 400, "legend": { "x": 0.5, "y": -0.25, "font": { "size": 12.9 }, "valign": "middle", "xanchor": "center", "yanchor": "bottom", "traceorder": "normal", "borderwidth": 0, "orientation": "h" }, "margin": { "b": 25, "l": 100, "r": 100, "t": 50, "pad": 0 }, "polar2": { "domain": { "x": [ 0.65, 1 ], "y": [ 0, 1 ] }, "radialaxis": { "type": "linear", "angle": 0, "range": [ 0, 2 ], "title": { "text": "" }, "tickmode": 45, "autorange": false, "direction": "clockwise", "tickangle": 45 }, "angularaxis": { "type": "category", "dtick": 1, "range": [ 1, 4 ], "tick0": 0, "nticks": 0, "rotation": 90.11199850425879, "showline": true, "tickmode": "auto", "autorange": false, "direction": "clockwise", "gridwidth": 1, "linewidth": 1, "tickangle": "auto" } }, "autosize": false, "dragmode": "lasso", "hovermode": "closest", "hoverlabel": { "font": { "family": "Roboto" } }, "separators": ",.", "showlegend": true, "uniformtext": { "mode": false } } }, "height": 400, "width": 800, "user": { "profile_url": "https://chart-studio.plotly.com/~lmalves", "avatar_url": "https://storage.googleapis.com/plotly-prod-profiles/69.jpg", "background_url": "https://storage.googleapis.com/plotly-prod-profiles/bg-1.jpg", "bio": "", "nickname": "", "website": "", "stream_tokens": null, "feature_set_id": null, "csrf_token": null, "date_joined": "2019-11-28 13:10:38", "mapbox_access_tokens": null, "has_password": null, "username": "lmalves", "email": null, "is_active": null, "readonly": null, "is_dash_creator": null, "dash_created_count": null, "is_chart_creator": null, "charts_created_count": null } }, { "creation_time": "2024-04-01T14:26:39.830641Z", "comments": { "results": [], "count": 0 }, "parented": true, "embed_url": "https://chart-studio.plotly.com/~17a.patel/2.embed", "fid": "17a.patel:2", "filename": "Plot 2", "filetype": "plot", "img_url": "https://storage.googleapis.com/plotly-prod-images/17a.patel/2/9_YFBT36ZPZ5BP9JSLLRL3NQIUH8LGOH.png", "image_urls": { "default": "https://storage.googleapis.com/plotly-prod-images/17a.patel/2/2_ICJLJK07WK3GW3WUKMFET9OI3BCHCX.png", "block-thumb": "https://storage.googleapis.com/plotly-prod-images/17a.patel/2/8_YSRKJG8D0RXLRP4TTZKOW76RMQOKRW.png", "list-thumb": "https://storage.googleapis.com/plotly-prod-images/17a.patel/2/9_YFBT36ZPZ5BP9JSLLRL3NQIUH8LGOH.png" }, "api_urls": { "files": "https://api.plotly.com/v2/files/17a.patel:2", "plots": "https://api.plotly.com/v2/plots/17a.patel:2", "parent": "https://api.plotly.com/v2/folders/home?user=17a.patel" }, "owner": "17a.patel", "parent": -1, "preview": "", "referencers": [], "references": [], "title": "", "views": 4, "web_url": "https://chart-studio.plotly.com/~17a.patel/2/", "world_readable": true, "date_modified": "2024-04-01T14:26:39.871Z", "stars": { "results": [], "count": 0 }, "collaborators": { "results": [], "count": 0 }, "subfolder_count": null, "refresh_interval": null, "organize_view_url": "https://chart-studio.plotly.com/~17a.patel/2/", "current_user_permission": "read", "is_theme": null, "is_template": false, "autosize": true, "caption": "", "figure": { "data": [ { "meta": { "columnNames": { "x": "Right hand", "y": "Reaction time", "error_x": { "array": "Add", "arrayminus": "Min" }, "error_y": { "array": "S.D", "arrayminus": "" } } }, "mode": "markers", "type": "bar", "xsrc": "17a.patel:0:1d2a13", "ysrc": "17a.patel:0:95af91", "marker": { "color": "rgb(244, 18, 21)" }, "error_x": { "meta": { "columnNames": { "array": "Add", "arrayminus": "Min" } }, "type": "data", "visible": true, "arraysrc": "17a.patel:0:c1feb0", "symmetric": false, "copy_ystyle": true, "arrayminussrc": "17a.patel:0:86871b" }, "error_y": { "meta": { "columnNames": { "array": "S.D" } }, "type": "data", "color": "#444", "width": 15, "visible": true, "arraysrc": "17a.patel:0:318c01", "traceref": 0, "symmetric": true, "thickness": 3, "tracerefminus": 0 }, "orientation": "v" } ], "frames": [], "layout": { "font": { "size": 20 }, "title": { "text": "Reaction time for right hand with error bars" }, "xaxis": { "type": "category", "range": [ -0.5, 4.5 ], "title": { "font": { "size": 20 }, "text": "Participants " }, "tickfont": { "size": 15 }, "autorange": true, "showspikes": false }, "yaxis": { "type": "linear", "range": [ -12.898729277777777, 17.49872927777778 ], "title": { "font": { "size": 20 }, "text": "Reaction time (cm/s)" }, "autorange": true, "showspikes": false }, "autosize": true, "colorway": [ "#fbb4ae", "#b3cde3", "#ccebc5", "#decbe4", "#fed9a6", "#ffffcc", "#e5d8bd", "#fddaec", "#f2f2f2" ], "template": { "data": { "bar": [ { "type": "bar", "marker": { "colorbar": { "ticks": "", "outlinewidth": 0 } } } ], "table": [ { "type": "table", "cells": { "fill": { "color": "#EBF0F8" }, "line": { "color": "white" } }, "header": { "fill": { "color": "#C8D4E3" }, "line": { "color": "white" } } } ], "carpet": [ { "type": "carpet", "aaxis": { "gridcolor": "#C8D4E3", "linecolor": "#C8D4E3", "endlinecolor": "#2a3f5f", "minorgridcolor": "#C8D4E3", "startlinecolor": "#2a3f5f" }, "baxis": { "gridcolor": "#C8D4E3", "linecolor": "#C8D4E3", "endlinecolor": "#2a3f5f", "minorgridcolor": "#C8D4E3", "startlinecolor": "#2a3f5f" } } ], "mesh3d": [ { "type": "mesh3d", "colorbar": { "ticks": "", "outlinewidth": 0 } } ], "contour": [ { "type": "contour", "colorbar": { "ticks": "", "outlinewidth": 0 }, "autocolorscale": true } ], "heatmap": [ { "type": "heatmap", "colorbar": { "ticks": "", "outlinewidth": 0 }, "autocolorscale": true } ], "scatter": [ { "type": "scatter", "marker": { "colorbar": { "ticks": "", "outlinewidth": 0 } } } ], "surface": [ { "type": "surface", "colorbar": { "ticks": "", "outlinewidth": 0 } } ], "heatmapgl": [ { "type": "heatmapgl", "colorbar": { "ticks": "", "outlinewidth": 0 } } ], "histogram": [ { "type": "histogram", "marker": { "colorbar": { "ticks": "", "outlinewidth": 0 } } } ], "parcoords": [ { "line": { "colorbar": { "ticks": "", "outlinewidth": 0 } }, "type": "parcoords" } ], "scatter3d": [ { "type": "scatter3d", "marker": { "colorbar": { "ticks": "", "outlinewidth": 0 } } } ], "scattergl": [ { "type": "scattergl", "marker": { "colorbar": { "ticks": "", "outlinewidth": 0 } } } ], "choropleth": [ { "type": "choropleth", "colorbar": { "ticks": "", "outlinewidth": 0 } } ], "scattergeo": [ { "type": "scattergeo", "marker": { "colorbar": { "ticks": "", "outlinewidth": 0 } } } ], "histogram2d": [ { "type": "histogram2d", "colorbar": { "ticks": "", "outlinewidth": 0 }, "autocolorscale": true } ], "scatterpolar": [ { "type": "scatterpolar", "marker": { "colorbar": { "ticks": "", "outlinewidth": 0 } } } ], "contourcarpet": [ { "type": "contourcarpet", "colorbar": { "ticks": "", "outlinewidth": 0 } } ], "scattercarpet": [ { "type": "scattercarpet", "marker": { "colorbar": { "ticks": "", "outlinewidth": 0 } } } ], "scattermapbox": [ { "type": "scattermapbox", "marker": { "colorbar": { "ticks": "", "outlinewidth": 0 } } } ], "scatterpolargl": [ { "type": "scatterpolargl", "marker": { "colorbar": { "ticks": "", "outlinewidth": 0 } } } ], "scatterternary": [ { "type": "scatterternary", "marker": { "colorbar": { "ticks": "", "outlinewidth": 0 } } } ], "histogram2dcontour": [ { "type": "histogram2dcontour", "colorbar": { "ticks": "", "outlinewidth": 0 }, "autocolorscale": true } ] }, "layout": { "geo": { "bgcolor": "white", "showland": true, "lakecolor": "white", "landcolor": "white", "showlakes": true, "subunitcolor": "#C8D4E3" }, "font": { "color": "#2a3f5f" }, "polar": { "bgcolor": "white", "radialaxis": { "ticks": "", "gridcolor": "#EBF0F8", "linecolor": "#EBF0F8" }, "angularaxis": { "ticks": "", "gridcolor": "#EBF0F8", "linecolor": "#EBF0F8" } }, "scene": { "xaxis": { "ticks": "", "gridcolor": "#DFE8F3", "gridwidth": 2, "linecolor": "#EBF0F8", "zerolinecolor": "#EBF0F8", "showbackground": true, "backgroundcolor": "white" }, "yaxis": { "ticks": "", "gridcolor": "#DFE8F3", "gridwidth": 2, "linecolor": "#EBF0F8", "zerolinecolor": "#EBF0F8", "showbackground": true, "backgroundcolor": "white" }, "zaxis": { "ticks": "", "gridcolor": "#DFE8F3", "gridwidth": 2, "linecolor": "#EBF0F8", "zerolinecolor": "#EBF0F8", "showbackground": true, "backgroundcolor": "white" } }, "title": { "x": 0.05 }, "xaxis": { "ticks": "", "gridcolor": "#EBF0F8", "linecolor": "#EBF0F8", "automargin": true, "zerolinecolor": "#EBF0F8", "zerolinewidth": 2 }, "yaxis": { "ticks": "", "gridcolor": "#EBF0F8", "linecolor": "#EBF0F8", "automargin": true, "zerolinecolor": "#EBF0F8", "zerolinewidth": 2 }, "ternary": { "aaxis": { "ticks": "", "gridcolor": "#DFE8F3", "linecolor": "#A2B1C6" }, "baxis": { "ticks": "", "gridcolor": "#DFE8F3", "linecolor": "#A2B1C6" }, "caxis": { "ticks": "", "gridcolor": "#DFE8F3", "linecolor": "#A2B1C6" }, "bgcolor": "white" }, "colorway": [ "#636efa", "#EF553B", "#00cc96", "#ab63fa", "#19d3f3", "#e763fa", "#fecb52", "#ffa15a", "#ff6692", "#b6e880" ], "hovermode": "closest", "colorscale": { "diverging": [ [ 0, "#8e0152" ], [ 0.1, "#c51b7d" ], [ 0.2, "#de77ae" ], [ 0.3, "#f1b6da" ], [ 0.4, "#fde0ef" ], [ 0.5, "#f7f7f7" ], [ 0.6, "#e6f5d0" ], [ 0.7, "#b8e186" ], [ 0.8, "#7fbc41" ], [ 0.9, "#4d9221" ], [ 1, "#276419" ] ], "sequential": [ [ 0, "#0508b8" ], [ 0.0893854748603352, "#1910d8" ], [ 0.1787709497206704, "#3c19f0" ], [ 0.2681564245810056, "#6b1cfb" ], [ 0.3575418994413408, "#981cfd" ], [ 0.44692737430167595, "#bf1cfd" ], [ 0.5363128491620112, "#dd2bfd" ], [ 0.6256983240223464, "#f246fe" ], [ 0.7150837988826816, "#fc67fd" ], [ 0.8044692737430168, "#fe88fc" ], [ 0.8938547486033519, "#fea5fd" ], [ 0.9832402234636871, "#febefe" ], [ 1, "#fec3fe" ] ], "sequentialminus": [ [ 0, "#0508b8" ], [ 0.0893854748603352, "#1910d8" ], [ 0.1787709497206704, "#3c19f0" ], [ 0.2681564245810056, "#6b1cfb" ], [ 0.3575418994413408, "#981cfd" ], [ 0.44692737430167595, "#bf1cfd" ], [ 0.5363128491620112, "#dd2bfd" ], [ 0.6256983240223464, "#f246fe" ], [ 0.7150837988826816, "#fc67fd" ], [ 0.8044692737430168, "#fe88fc" ], [ 0.8938547486033519, "#fea5fd" ], [ 0.9832402234636871, "#febefe" ], [ 1, "#fec3fe" ] ] }, "plot_bgcolor": "white", "paper_bgcolor": "white", "shapedefaults": { "line": { "width": 0 }, "opacity": 0.4, "fillcolor": "#506784" }, "annotationdefaults": { "arrowhead": 0, "arrowcolor": "#506784", "arrowwidth": 1 } }, "themeRef": "PLOTLY_WHITE" }, "colorscale": { "sequential": [ [ 0, "#440154" ], [ 0.1111111111111111, "#482878" ], [ 0.2222222222222222, "#3e4989" ], [ 0.3333333333333333, "#31688e" ], [ 0.4444444444444444, "#26828e" ], [ 0.5555555555555556, "#1f9e89" ], [ 0.6666666666666666, "#35b779" ], [ 0.7777777777777778, "#6ece58" ], [ 0.8888888888888888, "#b5de2b" ], [ 1, "#fde725" ] ] }, "plot_bgcolor": "rgb(255, 255, 255)", "paper_bgcolor": "rgb(255, 255, 255)" } }, "height": null, "width": null, "user": { "profile_url": "https://chart-studio.plotly.com/~17a.patel", "avatar_url": "https://storage.googleapis.com/plotly-prod-profiles/26.jpg", "background_url": "https://storage.googleapis.com/plotly-prod-profiles/bg-0.jpg", "bio": "", "nickname": "", "website": "", "stream_tokens": null, "feature_set_id": null, "csrf_token": null, "date_joined": "2024-02-07 14:46:44", "mapbox_access_tokens": null, "has_password": null, "username": "17a.patel", "email": null, "is_active": null, "readonly": null, "is_dash_creator": null, "dash_created_count": null, "is_chart_creator": null, "charts_created_count": null } }, { "creation_time": "2024-04-01T14:10:58.946603Z", "comments": { "results": [], "count": 0 }, "parented": true, "embed_url": "https://chart-studio.plotly.com/~macred1023/228.embed", "fid": "macred1023:228", "filename": "MR 3-28", "filetype": "plot", "img_url": "https://storage.googleapis.com/plotly-prod-images/macred1023/228/9_I3JHBT9NXH2BSADJ25RTGJOA7OLBDK.png", "image_urls": { "default": "https://storage.googleapis.com/plotly-prod-images/macred1023/228/2_OKT4YW2FWXNJWS1GZJOWXVS3I2ZAPR.png", "block-thumb": "https://storage.googleapis.com/plotly-prod-images/macred1023/228/8_ZL8J0WIME6TZR4WXRE79OKH77PLKL7.png", "list-thumb": "https://storage.googleapis.com/plotly-prod-images/macred1023/228/9_I3JHBT9NXH2BSADJ25RTGJOA7OLBDK.png" }, "api_urls": { "files": "https://api.plotly.com/v2/files/macred1023:228", "plots": "https://api.plotly.com/v2/plots/macred1023:228", "parent": "https://api.plotly.com/v2/folders/home?user=macred1023" }, "owner": "macred1023", "parent": -1, "preview": "", "referencers": [], "references": [], "title": "", "views": 2, "web_url": "https://chart-studio.plotly.com/~macred1023/228/", "world_readable": true, "date_modified": "2024-04-15T14:28:56.163Z", "stars": { "results": [], "count": 0 }, "collaborators": { "results": [], "count": 0 }, "subfolder_count": null, "refresh_interval": null, "organize_view_url": "https://chart-studio.plotly.com/~macred1023/228/", "current_user_permission": "read", "is_theme": null, "is_template": false, "autosize": true, "caption": "", "figure": { "data": [ { "meta": { "columnNames": { "x": "Created as New Dataset", "y": "Sample 383 By Analyst Date Monday" } }, "mode": "lines", "type": "scatter", "xsrc": "macred1023:227:a31d3b", "ysrc": "macred1023:227:e7f2d5" } ], "frames": [], "layout": { "title": { "text": "MR 12 3/28 furnace 100 C" }, "xaxis": { "type": "linear", "range": [ 4000, 650 ], "title": { "text": "cm-1" }, "autorange": false }, "yaxis": { "type": "linear", "range": [ 46.30611111111111, 101.7838888888889 ], "title": { "text": "% intensity" }, "autorange": true }, "autosize": true, "template": { "data": { "bar": [ { "type": "bar", "marker": { "colorbar": { "ticks": "", "outlinewidth": 0 } } } ], "table": [ { "type": "table", "cells": { "fill": { "color": "#EBF0F8" }, "line": { "color": "white" } }, "header": { "fill": { "color": "#C8D4E3" }, "line": { "color": "white" } } } ], "carpet": [ { "type": "carpet", "aaxis": { "gridcolor": "#C8D4E3", "linecolor": "#C8D4E3", "endlinecolor": "#2a3f5f", "minorgridcolor": "#C8D4E3", "startlinecolor": "#2a3f5f" }, "baxis": { "gridcolor": "#C8D4E3", "linecolor": "#C8D4E3", "endlinecolor": "#2a3f5f", "minorgridcolor": "#C8D4E3", "startlinecolor": "#2a3f5f" } } ], "mesh3d": [ { "type": "mesh3d", "colorbar": { "ticks": "", "outlinewidth": 0 } } ], "contour": [ { "type": "contour", "colorbar": { "ticks": "", "outlinewidth": 0 }, "autocolorscale": true } ], "heatmap": [ { "type": "heatmap", "colorbar": { "ticks": "", "outlinewidth": 0 }, "autocolorscale": true } ], "scatter": [ { "type": "scatter", "marker": { "colorbar": { "ticks": "", "outlinewidth": 0 } } } ], "surface": [ { "type": "surface", "colorbar": { "ticks": "", "outlinewidth": 0 } } ], "heatmapgl": [ { "type": "heatmapgl", "colorbar": { "ticks": "", "outlinewidth": 0 } } ], "histogram": [ { "type": "histogram", "marker": { "colorbar": { "ticks": "", "outlinewidth": 0 } } } ], "parcoords": [ { "line": { "colorbar": { "ticks": "", "outlinewidth": 0 } }, "type": "parcoords" } ], "scatter3d": [ { "type": "scatter3d", "marker": { "colorbar": { "ticks": "", "outlinewidth": 0 } } } ], "scattergl": [ { "type": "scattergl", "marker": { "colorbar": { "ticks": "", "outlinewidth": 0 } } } ], "choropleth": [ { "type": "choropleth", "colorbar": { "ticks": "", "outlinewidth": 0 } } ], "scattergeo": [ { "type": "scattergeo", "marker": { "colorbar": { "ticks": "", "outlinewidth": 0 } } } ], "histogram2d": [ { "type": "histogram2d", "colorbar": { "ticks": "", "outlinewidth": 0 }, "autocolorscale": true } ], "scatterpolar": [ { "type": "scatterpolar", "marker": { "colorbar": { "ticks": "", "outlinewidth": 0 } } } ], "contourcarpet": [ { "type": "contourcarpet", "colorbar": { "ticks": "", "outlinewidth": 0 } } ], "scattercarpet": [ { "type": "scattercarpet", "marker": { "colorbar": { "ticks": "", "outlinewidth": 0 } } } ], "scattermapbox": [ { "type": "scattermapbox", "marker": { "colorbar": { "ticks": "", "outlinewidth": 0 } } } ], "scatterpolargl": [ { "type": "scatterpolargl", "marker": { "colorbar": { "ticks": "", "outlinewidth": 0 } } } ], "scatterternary": [ { "type": "scatterternary", "marker": { "colorbar": { "ticks": "", "outlinewidth": 0 } } } ], "histogram2dcontour": [ { "type": "histogram2dcontour", "colorbar": { "ticks": "", "outlinewidth": 0 }, "autocolorscale": true } ] }, "layout": { "geo": { "bgcolor": "white", "showland": true, "lakecolor": "white", "landcolor": "white", "showlakes": true, "subunitcolor": "#C8D4E3" }, "font": { "color": "#2a3f5f" }, "polar": { "bgcolor": "white", "radialaxis": { "ticks": "", "gridcolor": "#EBF0F8", "linecolor": "#EBF0F8" }, "angularaxis": { "ticks": "", "gridcolor": "#EBF0F8", "linecolor": "#EBF0F8" } }, "scene": { "xaxis": { "ticks": "", "gridcolor": "#DFE8F3", "gridwidth": 2, "linecolor": "#EBF0F8", "zerolinecolor": "#EBF0F8", "showbackground": true, "backgroundcolor": "white" }, "yaxis": { "ticks": "", "gridcolor": "#DFE8F3", "gridwidth": 2, "linecolor": "#EBF0F8", "zerolinecolor": "#EBF0F8", "showbackground": true, "backgroundcolor": "white" }, "zaxis": { "ticks": "", "gridcolor": "#DFE8F3", "gridwidth": 2, "linecolor": "#EBF0F8", "zerolinecolor": "#EBF0F8", "showbackground": true, "backgroundcolor": "white" } }, "title": { "x": 0.05 }, "xaxis": { "ticks": "", "gridcolor": "#EBF0F8", "linecolor": "#EBF0F8", "automargin": true, "zerolinecolor": "#EBF0F8", "zerolinewidth": 2 }, "yaxis": { "ticks": "", "gridcolor": "#EBF0F8", "linecolor": "#EBF0F8", "automargin": true, "zerolinecolor": "#EBF0F8", "zerolinewidth": 2 }, "ternary": { "aaxis": { "ticks": "", "gridcolor": "#DFE8F3", "linecolor": "#A2B1C6" }, "baxis": { "ticks": "", "gridcolor": "#DFE8F3", "linecolor": "#A2B1C6" }, "caxis": { "ticks": "", "gridcolor": "#DFE8F3", "linecolor": "#A2B1C6" }, "bgcolor": "white" }, "colorway": [ "#636efa", "#EF553B", "#00cc96", "#ab63fa", "#19d3f3", "#e763fa", "#fecb52", "#ffa15a", "#ff6692", "#b6e880" ], "hovermode": "closest", "colorscale": { "diverging": [ [ 0, "#8e0152" ], [ 0.1, "#c51b7d" ], [ 0.2, "#de77ae" ], [ 0.3, "#f1b6da" ], [ 0.4, "#fde0ef" ], [ 0.5, "#f7f7f7" ], [ 0.6, "#e6f5d0" ], [ 0.7, "#b8e186" ], [ 0.8, "#7fbc41" ], [ 0.9, "#4d9221" ], [ 1, "#276419" ] ], "sequential": [ [ 0, "#0508b8" ], [ 0.0893854748603352, "#1910d8" ], [ 0.1787709497206704, "#3c19f0" ], [ 0.2681564245810056, "#6b1cfb" ], [ 0.3575418994413408, "#981cfd" ], [ 0.44692737430167595, "#bf1cfd" ], [ 0.5363128491620112, "#dd2bfd" ], [ 0.6256983240223464, "#f246fe" ], [ 0.7150837988826816, "#fc67fd" ], [ 0.8044692737430168, "#fe88fc" ], [ 0.8938547486033519, "#fea5fd" ], [ 0.9832402234636871, "#febefe" ], [ 1, "#fec3fe" ] ], "sequentialminus": [ [ 0, "#0508b8" ], [ 0.0893854748603352, "#1910d8" ], [ 0.1787709497206704, "#3c19f0" ], [ 0.2681564245810056, "#6b1cfb" ], [ 0.3575418994413408, "#981cfd" ], [ 0.44692737430167595, "#bf1cfd" ], [ 0.5363128491620112, "#dd2bfd" ], [ 0.6256983240223464, "#f246fe" ], [ 0.7150837988826816, "#fc67fd" ], [ 0.8044692737430168, "#fe88fc" ], [ 0.8938547486033519, "#fea5fd" ], [ 0.9832402234636871, "#febefe" ], [ 1, "#fec3fe" ] ] }, "plot_bgcolor": "white", "paper_bgcolor": "white", "shapedefaults": { "line": { "width": 0 }, "opacity": 0.4, "fillcolor": "#506784" }, "annotationdefaults": { "arrowhead": 0, "arrowcolor": "#506784", "arrowwidth": 1 } }, "themeRef": "PLOTLY_WHITE" } } }, "height": null, "width": null, "user": { "profile_url": "https://chart-studio.plotly.com/~macred1023", "avatar_url": "https://storage.googleapis.com/plotly-prod-profiles/20.jpg", "background_url": "https://storage.googleapis.com/plotly-prod-profiles/bg-9.jpg", "bio": "", "nickname": "", "website": "", "stream_tokens": null, "feature_set_id": null, "csrf_token": null, "date_joined": "2021-09-30 16:13:47", "mapbox_access_tokens": null, "has_password": null, "username": "macred1023", "email": null, "is_active": null, "readonly": null, "is_dash_creator": null, "dash_created_count": null, "is_chart_creator": null, "charts_created_count": null } }, { "creation_time": "2024-04-01T14:01:19.993340Z", "comments": { "results": [], "count": 0 }, "parented": true, "embed_url": "https://chart-studio.plotly.com/~LeventeKaszai/1.embed", "fid": "LeventeKaszai:1", "filename": "interactive_scatter", "filetype": "plot", "img_url": "https://storage.googleapis.com/plotly-prod-images/LeventeKaszai/1/9_2CQ7UPRV95EU86UPDCTH8B0Q4XOQP7.png", "image_urls": { "default": "https://storage.googleapis.com/plotly-prod-images/LeventeKaszai/1/2_UZKCGUYIEWD9T7AVN2OQNF49KQFB15.png", "block-thumb": "https://storage.googleapis.com/plotly-prod-images/LeventeKaszai/1/8_ZXFX81CT0KLS61L42UF29STUEN1ARA.png", "list-thumb": "https://storage.googleapis.com/plotly-prod-images/LeventeKaszai/1/9_2CQ7UPRV95EU86UPDCTH8B0Q4XOQP7.png" }, "api_urls": { "files": "https://api.plotly.com/v2/files/LeventeKaszai:1", "plots": "https://api.plotly.com/v2/plots/LeventeKaszai:1", "parent": "https://api.plotly.com/v2/folders/home?user=LeventeKaszai" }, "owner": "LeventeKaszai", "parent": -1, "preview": "", "referencers": [], "references": [], "title": "", "views": 6, "web_url": "https://chart-studio.plotly.com/~LeventeKaszai/1/", "world_readable": true, "date_modified": "2024-04-01T14:01:20.007Z", "stars": { "results": [], "count": 0 }, "collaborators": { "results": [], "count": 0 }, "subfolder_count": null, "refresh_interval": null, "organize_view_url": "https://chart-studio.plotly.com/~LeventeKaszai/1/", "current_user_permission": "read", "is_theme": null, "is_template": null, "autosize": true, "caption": "", "figure": { "data": [ { "mode": "markers", "name": "520", "text": "xG: 1.01<br />xA: 0.29<br />data$`Minutes played`: 520", "type": "scatter", "xsrc": "LeventeKaszai:0:20c4c4", "ysrc": "LeventeKaszai:0:8e6912", "frame": null, "xaxis": "x", "yaxis": "y", "marker": { "line": { "color": "rgba(0,0,0,1)", "width": 1.8897637795275593 }, "size": 7.559055118110237, "color": "rgba(0,0,0,1)", "symbol": "circle", "opacity": 1, "autocolorscale": false }, "hoveron": "points", "hoverinfo": "text", "showlegend": true, "legendgroup": "520" }, { "mode": "markers", "name": "538", "text": "xG: 1.71<br />xA: 0.45<br />data$`Minutes played`: 538", "type": "scatter", "xsrc": "LeventeKaszai:0:e4e6cb", "ysrc": "LeventeKaszai:0:ce3ad2", "frame": null, "xaxis": "x", "yaxis": "y", "marker": { "line": { "color": "rgba(0,0,0,1)", "width": 1.8897637795275593 }, "size": 8.378527852247466, "color": "rgba(0,0,0,1)", "symbol": "circle", "opacity": 1, "autocolorscale": false }, "hoveron": "points", "hoverinfo": "text", "showlegend": true, "legendgroup": "538" }, { "mode": "markers", "name": "655", "text": "xG: 1.75<br />xA: 0.36<br />data$`Minutes played`: 655", "type": "scatter", "xsrc": "LeventeKaszai:0:b4c493", "ysrc": "LeventeKaszai:0:8276eb", "frame": null, "xaxis": "x", "yaxis": "y", "marker": { "line": { "color": "rgba(0,0,0,1)", "width": 1.8897637795275593 }, "size": 9.124699647831948, "color": "rgba(0,0,0,1)", "symbol": "circle", "opacity": 1, "autocolorscale": false }, "hoveron": "points", "hoverinfo": "text", "showlegend": true, "legendgroup": "655" }, { "mode": "markers", "name": "677", "text": "xG: 3.34<br />xA: 2.87<br />data$`Minutes played`: 677", "type": "scatter", "xsrc": "LeventeKaszai:0:9ca874", "ysrc": "LeventeKaszai:0:9c5623", "frame": null, "xaxis": "x", "yaxis": "y", "marker": { "line": { "color": "rgba(0,0,0,1)", "width": 1.8897637795275593 }, "size": 9.81430376315113, "color": "rgba(0,0,0,1)", "symbol": "circle", "opacity": 1, "autocolorscale": false }, "hoveron": "points", "hoverinfo": "text", "showlegend": true, "legendgroup": "677" }, { "mode": "markers", "name": "689", "text": "xG: 2.98<br />xA: 0.44<br />data$`Minutes played`: 689", "type": "scatter", "xsrc": "LeventeKaszai:0:8583b1", "ysrc": "LeventeKaszai:0:f6f7df", "frame": null, "xaxis": "x", "yaxis": "y", "marker": { "line": { "color": "rgba(0,0,0,1)", "width": 1.8897637795275593 }, "size": 10.458535894075249, "color": "rgba(0,0,0,1)", "symbol": "circle", "opacity": 1, "autocolorscale": false }, "hoveron": "points", "hoverinfo": "text", "showlegend": true, "legendgroup": "689" }, { "mode": "markers", "name": "721", "text": "xG: 3.70<br />xA: 0.61<br />data$`Minutes played`: 721", "type": "scatter", "xsrc": "LeventeKaszai:0:08f233", "ysrc": "LeventeKaszai:0:d1b816", "frame": null, "xaxis": "x", "yaxis": "y", "marker": { "line": { "color": "rgba(0,0,0,1)", "width": 1.8897637795275593 }, "size": 11.065323661778645, "color": "rgba(0,0,0,1)", "symbol": "circle", "opacity": 1, "autocolorscale": false }, "hoveron": "points", "hoverinfo": "text", "showlegend": true, "legendgroup": "721" }, { "mode": "markers", "name": "823", "text": "xG: 1.50<br />xA: 1.33<br />data$`Minutes played`: 823", "type": "scatter", "xsrc": "LeventeKaszai:0:969284", "ysrc": "LeventeKaszai:0:e0fafb", "frame": null, "xaxis": "x", "yaxis": "y", "marker": { "line": { "color": "rgba(0,0,0,1)", "width": 1.8897637795275593 }, "size": 11.640524147656595, "color": "rgba(0,0,0,1)", "symbol": "circle", "opacity": 1, "autocolorscale": false }, "hoveron": "points", "hoverinfo": "text", "showlegend": true, "legendgroup": "823" }, { "mode": "markers", "name": "831", "text": "xG: 2.61<br />xA: 0.33<br />data$`Minutes played`: 831", "type": "scatter", "xsrc": "LeventeKaszai:0:77377e", "ysrc": "LeventeKaszai:0:bcaff6", "frame": null, "xaxis": "x", "yaxis": "y", "marker": { "line": { "color": "rgba(0,0,0,1)", "width": 1.8897637795275593 }, "size": 12.188610139160012, "color": "rgba(0,0,0,1)", "symbol": "circle", "opacity": 1, "autocolorscale": false }, "hoveron": "points", "hoverinfo": "text", "showlegend": true, "legendgroup": "831" }, { "mode": "markers", "name": "897", "text": "xG: 4.98<br />xA: 0.59<br />data$`Minutes played`: 897", "type": "scatter", "xsrc": "LeventeKaszai:0:adf385", "ysrc": "LeventeKaszai:0:e6436f", "frame": null, "xaxis": "x", "yaxis": "y", "marker": { "line": { "color": "rgba(0,0,0,1)", "width": 1.8897637795275593 }, "size": 12.713088995861398, "color": "rgba(0,0,0,1)", "symbol": "circle", "opacity": 1, "autocolorscale": false }, "hoveron": "points", "hoverinfo": "text", "showlegend": true, "legendgroup": "897" }, { "mode": "markers", "name": "898", "text": "xG: 5.12<br />xA: 1.14<br />data$`Minutes played`: 898", "type": "scatter", "xsrc": "LeventeKaszai:0:e91617", "ysrc": "LeventeKaszai:0:3bcc69", "frame": null, "xaxis": "x", "yaxis": "y", "marker": { "line": { "color": "rgba(0,0,0,1)", "width": 1.8897637795275593 }, "size": 13.216771410179954, "color": "rgba(0,0,0,1)", "symbol": "circle", "opacity": 1, "autocolorscale": false }, "hoveron": "points", "hoverinfo": "text", "showlegend": true, "legendgroup": "898" }, { "mode": "markers", "name": "914", "text": "xG: 0.60<br />xA: 2.31<br />data$`Minutes played`: 914", "type": "scatter", "xsrc": "LeventeKaszai:0:5358f2", "ysrc": "LeventeKaszai:0:16fca6", "frame": null, "xaxis": "x", "yaxis": "y", "marker": { "line": { "color": "rgba(0,0,0,1)", "width": 1.8897637795275593 }, "size": 13.701950999810506, "color": "rgba(0,0,0,1)", "symbol": "circle", "opacity": 1, "autocolorscale": false }, "hoveron": "points", "hoverinfo": "text", "showlegend": true, "legendgroup": "914" }, { "mode": "markers", "name": "927", "text": "xG: 1.53<br />xA: 0.86<br />data$`Minutes played`: 927", "type": "scatter", "xsrc": "LeventeKaszai:0:4cc0bd", "ysrc": "LeventeKaszai:0:993ead", "frame": null, "xaxis": "x", "yaxis": "y", "marker": { "line": { "color": "rgba(0,0,0,1)", "width": 1.8897637795275593 }, "size": 14.170528426754808, "color": "rgba(0,0,0,1)", "symbol": "circle", "opacity": 1, "autocolorscale": false }, "hoveron": "points", "hoverinfo": "text", "showlegend": true, "legendgroup": "927" }, { "mode": "markers", "name": "943", "text": "xG: 5.74<br />xA: 1.07<br />data$`Minutes played`: 943", "type": "scatter", "xsrc": "LeventeKaszai:0:374d3c", "ysrc": "LeventeKaszai:0:e1486c", "frame": null, "xaxis": "x", "yaxis": "y", "marker": { "line": { "color": "rgba(0,0,0,1)", "width": 1.8897637795275593 }, "size": 14.624099650430589, "color": "rgba(0,0,0,1)", "symbol": "circle", "opacity": 1, "autocolorscale": false }, "hoveron": "points", "hoverinfo": "text", "showlegend": true, "legendgroup": "943" }, { "mode": "markers", "name": "974", "text": "xG: 0.61<br />xA: 0.02<br />data$`Minutes played`: 974", "type": "scatter", "xsrc": "LeventeKaszai:0:bcc2b4", "ysrc": "LeventeKaszai:0:ffcedb", "frame": null, "xaxis": "x", "yaxis": "y", "marker": { "line": { "color": "rgba(0,0,0,1)", "width": 1.8897637795275593 }, "size": 15.064020222967772, "color": "rgba(0,0,0,1)", "symbol": "circle", "opacity": 1, "autocolorscale": false }, "hoveron": "points", "hoverinfo": "text", "showlegend": true, "legendgroup": "974" }, { "mode": "markers", "name": "982", "text": "xG: 4.49<br />xA: 1.38<br />data$`Minutes played`: 982", "type": "scatter", "xsrc": "LeventeKaszai:0:d9bc33", "ysrc": "LeventeKaszai:0:4f8ece", "frame": null, "xaxis": "x", "yaxis": "y", "marker": { "line": { "color": "rgba(0,0,0,1)", "width": 1.8897637795275593 }, "size": 15.4914531264901, "color": "rgba(0,0,0,1)", "symbol": "circle", "opacity": 1, "autocolorscale": false }, "hoveron": "points", "hoverinfo": "text", "showlegend": true, "legendgroup": "982" }, { "mode": "markers", "name": "1006", "text": "xG: 2.14<br />xA: 0.29<br />data$`Minutes played`: 1006", "type": "scatter", "xsrc": "LeventeKaszai:0:3bc010", "ysrc": "LeventeKaszai:0:0ade81", "frame": null, "xaxis": "x", "yaxis": "y", "marker": { "line": { "color": "rgba(0,0,0,1)", "width": 1.8897637795275593 }, "size": 15.907405026040482, "color": "rgba(0,0,0,1)", "symbol": "circle", "opacity": 1, "autocolorscale": false }, "hoveron": "points", "hoverinfo": "text", "showlegend": true, "legendgroup": "1006" }, { "mode": "markers", "name": "1090", "text": "xG: 2.41<br />xA: 1.47<br />data$`Minutes played`: 1090", "type": "scatter", "xsrc": "LeventeKaszai:0:4f43b2", "ysrc": "LeventeKaszai:0:a5f5d7", "frame": null, "xaxis": "x", "yaxis": "y", "marker": { "line": { "color": "rgba(0,0,0,1)", "width": 1.8897637795275593 }, "size": 16.312754192801282, "color": "rgba(0,0,0,1)", "symbol": "circle", "opacity": 1, "autocolorscale": false }, "hoveron": "points", "hoverinfo": "text", "showlegend": true, "legendgroup": "1090" }, { "mode": "markers", "name": "1098", "text": "xG: 1.28<br />xA: 1.54<br />data$`Minutes played`: 1098", "type": "scatter", "xsrc": "LeventeKaszai:0:010159", "ysrc": "LeventeKaszai:0:f54d9d", "frame": null, "xaxis": "x", "yaxis": "y", "marker": { "line": { "color": "rgba(0,0,0,1)", "width": 1.8897637795275593 }, "size": 16.708272323822527, "color": "rgba(0,0,0,1)", "symbol": "circle", "opacity": 1, "autocolorscale": false }, "hoveron": "points", "hoverinfo": "text", "showlegend": true, "legendgroup": "1098" }, { "mode": "markers", "name": "1120", "text": "xG: 6.12<br />xA: 0.98<br />data$`Minutes played`: 1120", "type": "scatter", "xsrc": "LeventeKaszai:0:840e20", "ysrc": "LeventeKaszai:0:0bffae", "frame": null, "xaxis": "x", "yaxis": "y", "marker": { "line": { "color": "rgba(0,0,0,1)", "width": 1.8897637795275593 }, "size": 17.09464181371671, "color": "rgba(0,0,0,1)", "symbol": "circle", "opacity": 1, "autocolorscale": false }, "hoveron": "points", "hoverinfo": "text", "showlegend": true, "legendgroup": "1120" }, { "mode": "markers", "name": "1175", "text": "xG: 4.92<br />xA: 1.63<br />data$`Minutes played`: 1175", "type": "scatter", "xsrc": "LeventeKaszai:0:067f78", "ysrc": "LeventeKaszai:0:f6313e", "frame": null, "xaxis": "x", "yaxis": "y", "marker": { "line": { "color": "rgba(0,0,0,1)", "width": 1.8897637795275593 }, "size": 17.472469585938036, "color": "rgba(0,0,0,1)", "symbol": "circle", "opacity": 1, "autocolorscale": false }, "hoveron": "points", "hoverinfo": "text", "showlegend": true, "legendgroup": "1175" }, { "mode": "markers", "name": "1180", "text": "xG: 1.29<br />xA: 1.67<br />data$`Minutes played`: 1180", "type": "scatter", "xsrc": "LeventeKaszai:0:297a25", "ysrc": "LeventeKaszai:0:5a6727", "frame": null, "xaxis": "x", "yaxis": "y", "marker": { "line": { "color": "rgba(0,0,0,1)", "width": 1.8897637795275593 }, "size": 17.842298285921228, "color": "rgba(0,0,0,1)", "symbol": "circle", "opacity": 1, "autocolorscale": false }, "hoveron": "points", "hoverinfo": "text", "showlegend": true, "legendgroup": "1180" }, { "mode": "markers", "name": "1237", "text": "xG: 8.82<br />xA: 1.86<br />data$`Minutes played`: 1237", "type": "scatter", "xsrc": "LeventeKaszai:0:48bbd4", "ysrc": "LeventeKaszai:0:a638aa", "frame": null, "xaxis": "x", "yaxis": "y", "marker": { "line": { "color": "rgba(0,0,0,1)", "width": 1.8897637795275593 }, "size": 18.204615426205677, "color": "rgba(0,0,0,1)", "symbol": "circle", "opacity": 1, "autocolorscale": false }, "hoveron": "points", "hoverinfo": "text", "showlegend": true, "legendgroup": "1237" }, { "mode": "markers", "name": "1289", "text": "xG: 7.01<br />xA: 0.36<br />data$`Minutes played`: 1289", "type": "scatter", "xsrc": "LeventeKaszai:0:17096e", "ysrc": "LeventeKaszai:0:13b5b9", "frame": null, "xaxis": "x", "yaxis": "y", "marker": { "line": { "color": "rgba(0,0,0,1)", "width": 1.8897637795275593 }, "size": 18.559860923732796, "color": "rgba(0,0,0,1)", "symbol": "circle", "opacity": 1, "autocolorscale": false }, "hoveron": "points", "hoverinfo": "text", "showlegend": true, "legendgroup": "1289" }, { "mode": "markers", "name": "1302", "text": "xG: 4.69<br />xA: 1.12<br />data$`Minutes played`: 1302", "type": "scatter", "xsrc": "LeventeKaszai:0:730c79", "ysrc": "LeventeKaszai:0:c08f40", "frame": null, "xaxis": "x", "yaxis": "y", "marker": { "line": { "color": "rgba(0,0,0,1)", "width": 1.8897637795275593 }, "size": 18.90843336187749, "color": "rgba(0,0,0,1)", "symbol": "circle", "opacity": 1, "autocolorscale": false }, "hoveron": "points", "hoverinfo": "text", "showlegend": true, "legendgroup": "1302" }, { "mode": "markers", "name": "1331", "text": "xG: 4.99<br />xA: 1.01<br />data$`Minutes played`: 1331", "type": "scatter", "xsrc": "LeventeKaszai:0:43265c", "ysrc": "LeventeKaszai:0:4a9bb3", "frame": null, "xaxis": "x", "yaxis": "y", "marker": { "line": { "color": "rgba(0,0,0,1)", "width": 1.8897637795275593 }, "size": 19.250695231414877, "color": "rgba(0,0,0,1)", "symbol": "circle", "opacity": 1, "autocolorscale": false }, "hoveron": "points", "hoverinfo": "text", "showlegend": true, "legendgroup": "1331" }, { "mode": "markers", "name": "1370", "text": "xG: 9.24<br />xA: 1.33<br />data$`Minutes played`: 1370", "type": "scatter", "xsrc": "LeventeKaszai:0:8970bd", "ysrc": "LeventeKaszai:0:3e6eac", "frame": null, "xaxis": "x", "yaxis": "y", "marker": { "line": { "color": "rgba(0,0,0,1)", "width": 1.8897637795275593 }, "size": 19.586977346826068, "color": "rgba(0,0,0,1)", "symbol": "circle", "opacity": 1, "autocolorscale": false }, "hoveron": "points", "hoverinfo": "text", "showlegend": true, "legendgroup": "1370" }, { "mode": "markers", "name": "1437", "text": "xG: 7.78<br />xA: 1.90<br />data$`Minutes played`: 1437", "type": "scatter", "xsrc": "LeventeKaszai:0:b39251", "ysrc": "LeventeKaszai:0:b10236", "frame": null, "xaxis": "x", "yaxis": "y", "marker": { "line": { "color": "rgba(0,0,0,1)", "width": 1.8897637795275593 }, "size": 19.91758259120156, "color": "rgba(0,0,0,1)", "symbol": "circle", "opacity": 1, "autocolorscale": false }, "hoveron": "points", "hoverinfo": "text", "showlegend": true, "legendgroup": "1437" }, { "mode": "markers", "name": "1563", "text": "xG: 6.83<br />xA: 1.73<br />data$`Minutes played`: 1563", "type": "scatter", "xsrc": "LeventeKaszai:0:7179b1", "ysrc": "LeventeKaszai:0:171403", "frame": null, "xaxis": "x", "yaxis": "y", "marker": { "line": { "color": "rgba(0,0,0,1)", "width": 1.8897637795275593 }, "size": 20.242789110436178, "color": "rgba(0,0,0,1)", "symbol": "circle", "opacity": 1, "autocolorscale": false }, "hoveron": "points", "hoverinfo": "text", "showlegend": true, "legendgroup": "1563" }, { "mode": "markers", "name": "1613", "text": "xG: 3.11<br />xA: 2.71<br />data$`Minutes played`: 1613", "type": "scatter", "xsrc": "LeventeKaszai:0:f2e2bc", "ysrc": "LeventeKaszai:0:855fff", "frame": null, "xaxis": "x", "yaxis": "y", "marker": { "line": { "color": "rgba(0,0,0,1)", "width": 1.8897637795275593 }, "size": 20.56285305257642, "color": "rgba(0,0,0,1)", "symbol": "circle", "opacity": 1, "autocolorscale": false }, "hoveron": "points", "hoverinfo": "text", "showlegend": true, "legendgroup": "1613" }, { "mode": "markers", "name": "1692", "text": "xG: 6.18<br />xA: 1.85<br />data$`Minutes played`: 1692", "type": "scatter", "xsrc": "LeventeKaszai:0:93e6d9", "ysrc": "LeventeKaszai:0:1ef050", "frame": null, "xaxis": "x", "yaxis": "y", "marker": { "line": { "color": "rgba(0,0,0,1)", "width": 1.8897637795275593 }, "size": 20.878010929063844, "color": "rgba(0,0,0,1)", "symbol": "circle", "opacity": 1, "autocolorscale": false }, "hoveron": "points", "hoverinfo": "text", "showlegend": true, "legendgroup": "1692" }, { "mode": "markers", "name": "1699", "text": "xG: 5.96<br />xA: 0.67<br />data$`Minutes played`: 1699", "type": "scatter", "xsrc": "LeventeKaszai:0:370d9a", "ysrc": "LeventeKaszai:0:bd7d15", "frame": null, "xaxis": "x", "yaxis": "y", "marker": { "line": { "color": "rgba(0,0,0,1)", "width": 1.8897637795275593 }, "size": 21.188481659769, "color": "rgba(0,0,0,1)", "symbol": "circle", "opacity": 1, "autocolorscale": false }, "hoveron": "points", "hoverinfo": "text", "showlegend": true, "legendgroup": "1699" }, { "mode": "markers", "name": "1758", "text": "xG: 3.96<br />xA: 0.66<br />data$`Minutes played`: 1758", "type": "scatter", "xsrc": "LeventeKaszai:0:bc869c", "ysrc": "LeventeKaszai:0:854d25", "frame": null, "xaxis": "x", "yaxis": "y", "marker": { "line": { "color": "rgba(0,0,0,1)", "width": 1.8897637795275593 }, "size": 21.494468352081313, "color": "rgba(0,0,0,1)", "symbol": "circle", "opacity": 1, "autocolorscale": false }, "hoveron": "points", "hoverinfo": "text", "showlegend": true, "legendgroup": "1758" }, { "mode": "markers", "name": "1917", "text": "xG: 4.68<br />xA: 2.53<br />data$`Minutes played`: 1917", "type": "scatter", "xsrc": "LeventeKaszai:0:729d0b", "ysrc": "LeventeKaszai:0:0b9647", "frame": null, "xaxis": "x", "yaxis": "y", "marker": { "line": { "color": "rgba(0,0,0,1)", "width": 1.8897637795275593 }, "size": 21.79615985514153, "color": "rgba(0,0,0,1)", "symbol": "circle", "opacity": 1, "autocolorscale": false }, "hoveron": "points", "hoverinfo": "text", "showlegend": true, "legendgroup": "1917" }, { "mode": "markers", "name": "1943", "text": "xG: 3.72<br />xA: 3.40<br />data$`Minutes played`: 1943", "type": "scatter", "xsrc": "LeventeKaszai:0:626a62", "ysrc": "LeventeKaszai:0:ae3970", "frame": null, "xaxis": "x", "yaxis": "y", "marker": { "line": { "color": "rgba(0,0,0,1)", "width": 1.8897637795275593 }, "size": 22.093732123005864, "color": "rgba(0,0,0,1)", "symbol": "circle", "opacity": 1, "autocolorscale": false }, "hoveron": "points", "hoverinfo": "text", "showlegend": true, "legendgroup": "1943" }, { "mode": "markers", "name": "2003", "text": "xG: 5.60<br />xA: 2.86<br />data$`Minutes played`: 2003", "type": "scatter", "xsrc": "LeventeKaszai:0:d54fd8", "ysrc": "LeventeKaszai:0:fc27b8", "frame": null, "xaxis": "x", "yaxis": "y", "marker": { "line": { "color": "rgba(0,0,0,1)", "width": 1.8897637795275593 }, "size": 22.38734941468952, "color": "rgba(0,0,0,1)", "symbol": "circle", "opacity": 1, "autocolorscale": false }, "hoveron": "points", "hoverinfo": "text", "showlegend": true, "legendgroup": "2003" }, { "mode": "markers", "name": "2033", "text": "xG: 12.23<br />xA: 0.61<br />data$`Minutes played`: 2033", "type": "scatter", "xsrc": "LeventeKaszai:0:6ca563", "ysrc": "LeventeKaszai:0:0a5d4d", "frame": null, "xaxis": "x", "yaxis": "y", "marker": { "line": { "color": "rgba(0,0,0,1)", "width": 1.8897637795275593 }, "size": 22.67716535433071, "color": "rgba(0,0,0,1)", "symbol": "circle", "opacity": 1, "autocolorscale": false }, "hoveron": "points", "hoverinfo": "text", "showlegend": true, "legendgroup": "2033" } ], "layout": { "font": { "size": 14.611872146118724, "color": "rgba(0,0,0,1)", "family": "" }, "xaxis": { "type": "linear", "range": [ 0.01849999999999996, 12.8115 ], "ticks": "outside", "title": { "font": { "size": 14.611872146118724, "color": "rgba(0,0,0,1)", "family": "" }, "text": "xG" }, "anchor": "y", "domain": [ 0, 1 ], "nticks": null, "ticklen": 3.652968036529681, "showgrid": true, "showline": false, "tickfont": { "size": 11.68949771689498, "color": "rgba(77,77,77,1)", "family": "" }, "tickmode": "array", "ticktext": [ "2.5", "5.0", "7.5", "10.0", "12.5" ], "tickvals": [ 2.5, 5, 7.5, 10, 12.5 ], "zeroline": false, "autorange": false, "gridcolor": "rgba(255,255,255,1)", "gridwidth": 0.66417600664176, "linecolor": null, "linewidth": 0, "tickangle": 0, "tickcolor": "rgba(51,51,51,1)", "tickwidth": 0.66417600664176, "automargin": true, "hoverformat": ".2f", "categoryarray": [ "2.5", "5.0", "7.5", "10.0", "12.5" ], "categoryorder": "array", "showticklabels": true }, "yaxis": { "type": "linear", "range": [ -0.14900000000000002, 3.569 ], "ticks": "outside", "title": { "font": { "size": 14.611872146118724, "color": "rgba(0,0,0,1)", "family": "" }, "text": "xA" }, "anchor": "x", "domain": [ 0, 1 ], "nticks": null, "ticklen": 3.652968036529681, "showgrid": true, "showline": false, "tickfont": { "size": 11.68949771689498, "color": "rgba(77,77,77,1)", "family": "" }, "tickmode": "array", "ticktext": [ "0", "1", "2", "3" ], "tickvals": [ 0, 1, 2, 3 ], "zeroline": false, "autorange": false, "gridcolor": "rgba(255,255,255,1)", "gridwidth": 0.66417600664176, "linecolor": null, "linewidth": 0, "tickangle": 0, "tickcolor": "rgba(51,51,51,1)", "tickwidth": 0.66417600664176, "automargin": true, "hoverformat": ".2f", "categoryarray": [ "0", "1", "2", "3" ], "categoryorder": "array", "showticklabels": true }, "legend": { "font": { "size": 11.68949771689498, "color": "rgba(0,0,0,1)", "family": "" }, "title": { "font": { "size": 14.611872146118724, "color": "rgba(0,0,0,1)", "family": "" }, "text": "data$`Minutes played`" }, "bgcolor": "rgba(255,255,255,1)", "bordercolor": "transparent", "borderwidth": 1.8897637795275593 }, "margin": { "b": 40.42384916213324, "l": 31.415525114155255, "r": 7.305936073059362, "t": 26.469511262589855 }, "shapes": [ { "x0": 0, "x1": 1, "y0": 0, "y1": 1, "line": { "color": null, "width": 0, "linetype": [] }, "type": "rect", "xref": "paper", "yref": "paper", "fillcolor": null } ], "barmode": "relative", "hovermode": "closest", "showlegend": true, "plot_bgcolor": "rgba(235,235,235,1)", "paper_bgcolor": "rgba(255,255,255,1)" } }, "height": null, "width": null, "user": { "profile_url": "https://chart-studio.plotly.com/~LeventeKaszai", "avatar_url": "https://storage.googleapis.com/plotly-prod-profiles/57.jpg", "background_url": "https://storage.googleapis.com/plotly-prod-profiles/bg-6.jpg", "bio": "", "nickname": "", "website": "", "stream_tokens": null, "feature_set_id": null, "csrf_token": null, "date_joined": "2024-04-01 13:56:28", "mapbox_access_tokens": null, "has_password": null, "username": "LeventeKaszai", "email": null, "is_active": null, "readonly": null, "is_dash_creator": null, "dash_created_count": null, "is_chart_creator": null, "charts_created_count": null } }, { "creation_time": "2024-04-01T13:38:24.911929Z", "comments": { "results": [], "count": 0 }, "parented": true, "embed_url": "https://chart-studio.plotly.com/~kbsnom/15.embed", "fid": "kbsnom:15", "filename": "Plotly Playground 2024-04-01 22:38:21", "filetype": "plot", "img_url": "https://storage.googleapis.com/plotly-prod-images/kbsnom/15/9_OUENTXCW9MH1HZ9WCIRK1F9Z21BWUZ.png", "image_urls": { "default": "https://storage.googleapis.com/plotly-prod-images/kbsnom/15/2_D37W1DOV7RC98RAE9KIDLZIRS3WWBU.png", "block-thumb": "https://storage.googleapis.com/plotly-prod-images/kbsnom/15/8_J1Z76FNDYGIKIDUPV1FXT4XW7ALB6P.png", "list-thumb": "https://storage.googleapis.com/plotly-prod-images/kbsnom/15/9_OUENTXCW9MH1HZ9WCIRK1F9Z21BWUZ.png" }, "api_urls": { "files": "https://api.plotly.com/v2/files/kbsnom:15", "plots": "https://api.plotly.com/v2/plots/kbsnom:15", "parent": "https://api.plotly.com/v2/folders/home?user=kbsnom" }, "owner": "kbsnom", "parent": -1, "preview": "", "referencers": [], "references": [], "title": "", "views": 2, "web_url": "https://chart-studio.plotly.com/~kbsnom/15/", "world_readable": true, "date_modified": "2024-04-01T13:38:24.921Z", "stars": { "results": [], "count": 0 }, "collaborators": { "results": [], "count": 0 }, "subfolder_count": null, "refresh_interval": null, "organize_view_url": "https://chart-studio.plotly.com/~kbsnom/15/", "current_user_permission": "read", "is_theme": null, "is_template": null, "autosize": true, "caption": "", "figure": { "data": [ { "line": { "dash": "solid", "color": "rgba(55, 128, 191, 1.0)", "shape": "linear", "width": 1.3 }, "mode": "lines", "name": "BOLL(close,20)", "text": "", "type": "scatter", "xsrc": "kbsnom:14:22f278", "ysrc": "kbsnom:14:a2d0f7", "yaxis": "y2", "showlegend": true, "legendgroup": "BOLL(close,20)" }, { "line": { "dash": "solid", "color": "rgba(55, 128, 191, 0.8999999999999999)", "shape": "linear", "width": 1.3 }, "mode": "lines", "name": "UPPER(close,20)", "text": "", "type": "scatter", "xsrc": "kbsnom:14:042c53", "ysrc": "kbsnom:14:1e1c72", "yaxis": "y2", "showlegend": false, "legendgroup": "BOLL(close,20)" }, { "fill": "tonexty", "line": { "dash": "solid", "color": "rgba(55, 128, 191, 0.7999999999999998)", "shape": "linear", "width": 1.3 }, "mode": "lines", "name": "LOWER(close,20)", "text": "", "type": "scatter", "xsrc": "kbsnom:14:4feb34", "ysrc": "kbsnom:14:123fff", "yaxis": "y2", "fillcolor": "rgba(55, 128, 191, 0.1)", "showlegend": false, "legendgroup": "BOLL(close,20)" }, { "name": "GS", "type": "candlestick", "xsrc": "kbsnom:14:5806fd", "yaxis": "y2", "lowsrc": "kbsnom:14:80249a", "highsrc": "kbsnom:14:958f09", "opensrc": "kbsnom:14:34ec11", "closesrc": "kbsnom:14:1b744a", "decreasing": { "line": { "color": "#808080" } }, "increasing": { "line": { "color": "#17BECF" } }, "showlegend": true } ], "layout": { "title": { "font": { "color": "#4D5663" }, "text": "First Quant Figure" }, "xaxis": { "title": { "font": { "color": "#4D5663" }, "text": "" }, "anchor": "y2", "showgrid": true, "tickfont": { "color": "#4D5663" }, "gridcolor": "#E1E5ED", "rangeslider": { "visible": false }, "rangeselector": { "x": 0, "y": 0.9, "font": { "size": 13 }, "bgcolor": "rgba(150, 200, 250, 1)", "buttons": [ { "step": "month", "count": 1, "label": "1m", "stepmode": "backward" }, { "step": "year", "count": 1, "label": "1y", "stepmode": "backward" } ], "visible": false }, "zerolinecolor": "#E1E5ED" }, "yaxis": { "title": { "font": { "color": "#4D5663" }, "text": "" }, "showgrid": true, "tickfont": { "color": "#4D5663" }, "gridcolor": "#E1E5ED", "zerolinecolor": "#E1E5ED", "showticklabels": false }, "legend": { "x": 0.3, "y": 0.95, "font": { "color": "#4D5663" }, "bgcolor": "#F5F6F9", "yanchor": "bottom", "orientation": "h" }, "margin": { "b": 30, "l": 30, "r": 30, "t": 30 }, "yaxis2": { "title": { "font": { "color": "#4D5663" }, "text": "" }, "domain": [ 0.0, 0.9 ], "showgrid": true, "tickfont": { "color": "#4D5663" }, "gridcolor": "#E1E5ED", "zerolinecolor": "#E1E5ED" }, "template": { "data": { "bar": [ { "type": "bar", "marker": { "line": { "color": "#E5ECF6", "width": 0.5 }, "pattern": { "size": 10, "fillmode": "overlay", "solidity": 0.2 } }, "error_x": { "color": "#2a3f5f" }, "error_y": { "color": "#2a3f5f" } } ], "pie": [ { "type": "pie", "automargin": true } ], "table": [ { "type": "table", "cells": { "fill": { "color": "#EBF0F8" }, "line": { "color": "white" } }, "header": { "fill": { "color": "#C8D4E3" }, "line": { "color": "white" } } } ], "carpet": [ { "type": "carpet", "aaxis": { "gridcolor": "white", "linecolor": "white", "endlinecolor": "#2a3f5f", "minorgridcolor": "white", "startlinecolor": "#2a3f5f" }, "baxis": { "gridcolor": "white", "linecolor": "white", "endlinecolor": "#2a3f5f", "minorgridcolor": "white", "startlinecolor": "#2a3f5f" } } ], "mesh3d": [ { "type": "mesh3d", "colorbar": { "ticks": "", "outlinewidth": 0 } } ], "contour": [ { "type": "contour", "colorbar": { "ticks": "", "outlinewidth": 0 }, "colorscale": [ [ 0.0, "#0d0887" ], [ 0.1111111111111111, "#46039f" ], [ 0.2222222222222222, "#7201a8" ], [ 0.3333333333333333, "#9c179e" ], [ 0.4444444444444444, "#bd3786" ], [ 0.5555555555555556, "#d8576b" ], [ 0.6666666666666666, "#ed7953" ], [ 0.7777777777777778, "#fb9f3a" ], [ 0.8888888888888888, "#fdca26" ], [ 1.0, "#f0f921" ] ] } ], "heatmap": [ { "type": "heatmap", "colorbar": { "ticks": "", "outlinewidth": 0 }, "colorscale": [ [ 0.0, "#0d0887" ], [ 0.1111111111111111, "#46039f" ], [ 0.2222222222222222, "#7201a8" ], [ 0.3333333333333333, "#9c179e" ], [ 0.4444444444444444, "#bd3786" ], [ 0.5555555555555556, "#d8576b" ], [ 0.6666666666666666, "#ed7953" ], [ 0.7777777777777778, "#fb9f3a" ], [ 0.8888888888888888, "#fdca26" ], [ 1.0, "#f0f921" ] ] } ], "scatter": [ { "type": "scatter", "fillpattern": { "size": 10, "fillmode": "overlay", "solidity": 0.2 } } ], "surface": [ { "type": "surface", "colorbar": { "ticks": "", "outlinewidth": 0 }, "colorscale": [ [ 0.0, "#0d0887" ], [ 0.1111111111111111, "#46039f" ], [ 0.2222222222222222, "#7201a8" ], [ 0.3333333333333333, "#9c179e" ], [ 0.4444444444444444, "#bd3786" ], [ 0.5555555555555556, "#d8576b" ], [ 0.6666666666666666, "#ed7953" ], [ 0.7777777777777778, "#fb9f3a" ], [ 0.8888888888888888, "#fdca26" ], [ 1.0, "#f0f921" ] ] } ], "barpolar": [ { "type": "barpolar", "marker": { "line": { "color": "#E5ECF6", "width": 0.5 }, "pattern": { "size": 10, "fillmode": "overlay", "solidity": 0.2 } } } ], "heatmapgl": [ { "type": "heatmapgl", "colorbar": { "ticks": "", "outlinewidth": 0 }, "colorscale": [ [ 0.0, "#0d0887" ], [ 0.1111111111111111, "#46039f" ], [ 0.2222222222222222, "#7201a8" ], [ 0.3333333333333333, "#9c179e" ], [ 0.4444444444444444, "#bd3786" ], [ 0.5555555555555556, "#d8576b" ], [ 0.6666666666666666, "#ed7953" ], [ 0.7777777777777778, "#fb9f3a" ], [ 0.8888888888888888, "#fdca26" ], [ 1.0, "#f0f921" ] ] } ], "histogram": [ { "type": "histogram", "marker": { "pattern": { "size": 10, "fillmode": "overlay", "solidity": 0.2 } } } ], "parcoords": [ { "line": { "colorbar": { "ticks": "", "outlinewidth": 0 } }, "type": "parcoords" } ], "scatter3d": [ { "line": { "colorbar": { "ticks": "", "outlinewidth": 0 } }, "type": "scatter3d", "marker": { "colorbar": { "ticks": "", "outlinewidth": 0 } } } ], "scattergl": [ { "type": "scattergl", "marker": { "colorbar": { "ticks": "", "outlinewidth": 0 } } } ], "choropleth": [ { "type": "choropleth", "colorbar": { "ticks": "", "outlinewidth": 0 } } ], "scattergeo": [ { "type": "scattergeo", "marker": { "colorbar": { "ticks": "", "outlinewidth": 0 } } } ], "histogram2d": [ { "type": "histogram2d", "colorbar": { "ticks": "", "outlinewidth": 0 }, "colorscale": [ [ 0.0, "#0d0887" ], [ 0.1111111111111111, "#46039f" ], [ 0.2222222222222222, "#7201a8" ], [ 0.3333333333333333, "#9c179e" ], [ 0.4444444444444444, "#bd3786" ], [ 0.5555555555555556, "#d8576b" ], [ 0.6666666666666666, "#ed7953" ], [ 0.7777777777777778, "#fb9f3a" ], [ 0.8888888888888888, "#fdca26" ], [ 1.0, "#f0f921" ] ] } ], "scatterpolar": [ { "type": "scatterpolar", "marker": { "colorbar": { "ticks": "", "outlinewidth": 0 } } } ], "contourcarpet": [ { "type": "contourcarpet", "colorbar": { "ticks": "", "outlinewidth": 0 } } ], "scattercarpet": [ { "type": "scattercarpet", "marker": { "colorbar": { "ticks": "", "outlinewidth": 0 } } } ], "scattermapbox": [ { "type": "scattermapbox", "marker": { "colorbar": { "ticks": "", "outlinewidth": 0 } } } ], "scatterpolargl": [ { "type": "scatterpolargl", "marker": { "colorbar": { "ticks": "", "outlinewidth": 0 } } } ], "scatterternary": [ { "type": "scatterternary", "marker": { "colorbar": { "ticks": "", "outlinewidth": 0 } } } ], "histogram2dcontour": [ { "type": "histogram2dcontour", "colorbar": { "ticks": "", "outlinewidth": 0 }, "colorscale": [ [ 0.0, "#0d0887" ], [ 0.1111111111111111, "#46039f" ], [ 0.2222222222222222, "#7201a8" ], [ 0.3333333333333333, "#9c179e" ], [ 0.4444444444444444, "#bd3786" ], [ 0.5555555555555556, "#d8576b" ], [ 0.6666666666666666, "#ed7953" ], [ 0.7777777777777778, "#fb9f3a" ], [ 0.8888888888888888, "#fdca26" ], [ 1.0, "#f0f921" ] ] } ] }, "layout": { "geo": { "bgcolor": "white", "showland": true, "lakecolor": "white", "landcolor": "#E5ECF6", "showlakes": true, "subunitcolor": "white" }, "font": { "color": "#2a3f5f" }, "polar": { "bgcolor": "#E5ECF6", "radialaxis": { "ticks": "", "gridcolor": "white", "linecolor": "white" }, "angularaxis": { "ticks": "", "gridcolor": "white", "linecolor": "white" } }, "scene": { "xaxis": { "ticks": "", "gridcolor": "white", "gridwidth": 2, "linecolor": "white", "zerolinecolor": "white", "showbackground": true, "backgroundcolor": "#E5ECF6" }, "yaxis": { "ticks": "", "gridcolor": "white", "gridwidth": 2, "linecolor": "white", "zerolinecolor": "white", "showbackground": true, "backgroundcolor": "#E5ECF6" }, "zaxis": { "ticks": "", "gridcolor": "white", "gridwidth": 2, "linecolor": "white", "zerolinecolor": "white", "showbackground": true, "backgroundcolor": "#E5ECF6" } }, "title": { "x": 0.05 }, "xaxis": { "ticks": "", "title": { "standoff": 15 }, "gridcolor": "white", "linecolor": "white", "automargin": true, "zerolinecolor": "white", "zerolinewidth": 2 }, "yaxis": { "ticks": "", "title": { "standoff": 15 }, "gridcolor": "white", "linecolor": "white", "automargin": true, "zerolinecolor": "white", "zerolinewidth": 2 }, "mapbox": { "style": "light" }, "ternary": { "aaxis": { "ticks": "", "gridcolor": "white", "linecolor": "white" }, "baxis": { "ticks": "", "gridcolor": "white", "linecolor": "white" }, "caxis": { "ticks": "", "gridcolor": "white", "linecolor": "white" }, "bgcolor": "#E5ECF6" }, "colorway": [ "#636efa", "#EF553B", "#00cc96", "#ab63fa", "#FFA15A", "#19d3f3", "#FF6692", "#B6E880", "#FF97FF", "#FECB52" ], "coloraxis": { "colorbar": { "ticks": "", "outlinewidth": 0 } }, "hovermode": "closest", "colorscale": { "diverging": [ [ 0, "#8e0152" ], [ 0.1, "#c51b7d" ], [ 0.2, "#de77ae" ], [ 0.3, "#f1b6da" ], [ 0.4, "#fde0ef" ], [ 0.5, "#f7f7f7" ], [ 0.6, "#e6f5d0" ], [ 0.7, "#b8e186" ], [ 0.8, "#7fbc41" ], [ 0.9, "#4d9221" ], [ 1, "#276419" ] ], "sequential": [ [ 0.0, "#0d0887" ], [ 0.1111111111111111, "#46039f" ], [ 0.2222222222222222, "#7201a8" ], [ 0.3333333333333333, "#9c179e" ], [ 0.4444444444444444, "#bd3786" ], [ 0.5555555555555556, "#d8576b" ], [ 0.6666666666666666, "#ed7953" ], [ 0.7777777777777778, "#fb9f3a" ], [ 0.8888888888888888, "#fdca26" ], [ 1.0, "#f0f921" ] ], "sequentialminus": [ [ 0.0, "#0d0887" ], [ 0.1111111111111111, "#46039f" ], [ 0.2222222222222222, "#7201a8" ], [ 0.3333333333333333, "#9c179e" ], [ 0.4444444444444444, "#bd3786" ], [ 0.5555555555555556, "#d8576b" ], [ 0.6666666666666666, "#ed7953" ], [ 0.7777777777777778, "#fb9f3a" ], [ 0.8888888888888888, "#fdca26" ], [ 1.0, "#f0f921" ] ] }, "hoverlabel": { "align": "left" }, "plot_bgcolor": "#E5ECF6", "paper_bgcolor": "white", "shapedefaults": { "line": { "color": "#2a3f5f" } }, "autotypenumbers": "strict", "annotationdefaults": { "arrowhead": 0, "arrowcolor": "#2a3f5f", "arrowwidth": 1 } } }, "showlegend": true, "plot_bgcolor": "#F5F6F9", "paper_bgcolor": "#F5F6F9" } }, "height": null, "width": null, "user": { "profile_url": "https://chart-studio.plotly.com/~kbsnom", "avatar_url": "https://storage.googleapis.com/plotly-prod-profiles/91.jpg", "background_url": "https://storage.googleapis.com/plotly-prod-profiles/bg-10.jpg", "bio": "", "nickname": "", "website": "", "stream_tokens": null, "feature_set_id": null, "csrf_token": null, "date_joined": "2024-03-31 12:11:20", "mapbox_access_tokens": null, "has_password": null, "username": "kbsnom", "email": null, "is_active": null, "readonly": null, "is_dash_creator": null, "dash_created_count": null, "is_chart_creator": null, "charts_created_count": null } }, { "creation_time": "2024-04-01T13:37:36.788477Z", "comments": { "results": [], "count": 0 }, "parented": true, "embed_url": "https://chart-studio.plotly.com/~jooooyn17/12.embed", "fid": "jooooyn17:12", "filename": "total number of genes (2)", "filetype": "plot", "img_url": "https://storage.googleapis.com/plotly-prod-images/jooooyn17/12/9_ARJ1YD6GGOVSZZAYGDAPR0TI70EUJJ.png", "image_urls": { "default": "https://storage.googleapis.com/plotly-prod-images/jooooyn17/12/2_D5H4ZLZYOID0D4I4M68L48VLINB66J.png", "block-thumb": "https://storage.googleapis.com/plotly-prod-images/jooooyn17/12/8_3Y0VWEL0M3ASUVJ1KIR1A6NSMRDPXH.png", "list-thumb": "https://storage.googleapis.com/plotly-prod-images/jooooyn17/12/9_ARJ1YD6GGOVSZZAYGDAPR0TI70EUJJ.png" }, "api_urls": { "files": "https://api.plotly.com/v2/files/jooooyn17:12", "plots": "https://api.plotly.com/v2/plots/jooooyn17:12", "parent": "https://api.plotly.com/v2/folders/home?user=jooooyn17" }, "owner": "jooooyn17", "parent": -1, "preview": "", "referencers": [], "references": [], "title": "", "views": 2, "web_url": "https://chart-studio.plotly.com/~jooooyn17/12/", "world_readable": true, "date_modified": "2024-04-01T13:37:36.797Z", "stars": { "results": [], "count": 0 }, "collaborators": { "results": [], "count": 0 }, "subfolder_count": null, "refresh_interval": null, "organize_view_url": "https://chart-studio.plotly.com/~jooooyn17/12/", "current_user_permission": "read", "is_theme": null, "is_template": false, "autosize": true, "caption": "", "figure": { "data": [ { "line": { "color": "rgb(179, 179, 179)" }, "meta": { "columnNames": { "y": "A" } }, "mode": "markers+lines", "name": "SE", "type": "scatter", "ysrc": "jooooyn17:11:1823ef" }, { "line": { "color": "rgb(231, 138, 195)" }, "meta": { "columnNames": { "y": "B" } }, "mode": "markers+lines", "name": "SR", "type": "scatter", "ysrc": "jooooyn17:11:257ec4", "stackgroup": null } ], "frames": [], "layout": { "font": { "size": 14, "color": "rgb(0, 0, 0)" }, "xaxis": { "type": "linear", "range": [ 0.4516441005802708, 9.548355899419729 ], "ticks": "outside", "title": { "font": { "size": 20 }, "text": "Time" }, "nticks": 9, "showline": true, "tickfont": { "size": 15 }, "tickmode": "linear", "zeroline": false, "autorange": false, "linecolor": "rgb(0, 0, 0)", "linewidth": 2, "rangeslider": { "range": [ -0.3161873156342182, 5.3161873156342185 ], "yaxis": {}, "visible": false, "autorange": true }, "zerolinewidth": 1, "exponentformat": "B", "separatethousands": false }, "yaxis": { "type": "linear", "range": [ 182382.78349282296, 268486.21650717704 ], "tick0": 0, "ticks": "outside", "title": { "font": { "size": 20 }, "text": "Total number of edges" }, "showline": true, "tickfont": { "size": 15 }, "tickmode": "auto", "autorange": true, "linecolor": "rgb(0, 0, 0)", "linewidth": 2, "exponentformat": "SI", "separatethousands": true }, "legend": { "x": 0.020000000000000018, "y": 1.02 }, "margin": { "b": 500, "t": 120 }, "modebar": { "orientation": "h" }, "autosize": true, "template": { "data": { "bar": [ { "type": "bar", "marker": { "colorbar": { "ticks": "", "outlinewidth": 0 } } } ], "table": [ { "type": "table", "cells": { "fill": { "color": "#EBF0F8" }, "line": { "color": "white" } }, "header": { "fill": { "color": "#C8D4E3" }, "line": { "color": "white" } } } ], "carpet": [ { "type": "carpet", "aaxis": { "gridcolor": "#C8D4E3", "linecolor": "#C8D4E3", "endlinecolor": "#2a3f5f", "minorgridcolor": "#C8D4E3", "startlinecolor": "#2a3f5f" }, "baxis": { "gridcolor": "#C8D4E3", "linecolor": "#C8D4E3", "endlinecolor": "#2a3f5f", "minorgridcolor": "#C8D4E3", "startlinecolor": "#2a3f5f" } } ], "mesh3d": [ { "type": "mesh3d", "colorbar": { "ticks": "", "outlinewidth": 0 } } ], "contour": [ { "type": "contour", "colorbar": { "ticks": "", "outlinewidth": 0 }, "autocolorscale": true } ], "heatmap": [ { "type": "heatmap", "colorbar": { "ticks": "", "outlinewidth": 0 }, "autocolorscale": true } ], "scatter": [ { "type": "scatter", "marker": { "colorbar": { "ticks": "", "outlinewidth": 0 } } } ], "surface": [ { "type": "surface", "colorbar": { "ticks": "", "outlinewidth": 0 } } ], "heatmapgl": [ { "type": "heatmapgl", "colorbar": { "ticks": "", "outlinewidth": 0 } } ], "histogram": [ { "type": "histogram", "marker": { "colorbar": { "ticks": "", "outlinewidth": 0 } } } ], "parcoords": [ { "line": { "colorbar": { "ticks": "", "outlinewidth": 0 } }, "type": "parcoords" } ], "scatter3d": [ { "type": "scatter3d", "marker": { "colorbar": { "ticks": "", "outlinewidth": 0 } } } ], "scattergl": [ { "type": "scattergl", "marker": { "colorbar": { "ticks": "", "outlinewidth": 0 } } } ], "choropleth": [ { "type": "choropleth", "colorbar": { "ticks": "", "outlinewidth": 0 } } ], "scattergeo": [ { "type": "scattergeo", "marker": { "colorbar": { "ticks": "", "outlinewidth": 0 } } } ], "histogram2d": [ { "type": "histogram2d", "colorbar": { "ticks": "", "outlinewidth": 0 }, "autocolorscale": true } ], "scatterpolar": [ { "type": "scatterpolar", "marker": { "colorbar": { "ticks": "", "outlinewidth": 0 } } } ], "contourcarpet": [ { "type": "contourcarpet", "colorbar": { "ticks": "", "outlinewidth": 0 } } ], "scattercarpet": [ { "type": "scattercarpet", "marker": { "colorbar": { "ticks": "", "outlinewidth": 0 } } } ], "scattermapbox": [ { "type": "scattermapbox", "marker": { "colorbar": { "ticks": "", "outlinewidth": 0 } } } ], "scatterpolargl": [ { "type": "scatterpolargl", "marker": { "colorbar": { "ticks": "", "outlinewidth": 0 } } } ], "scatterternary": [ { "type": "scatterternary", "marker": { "colorbar": { "ticks": "", "outlinewidth": 0 } } } ], "histogram2dcontour": [ { "type": "histogram2dcontour", "colorbar": { "ticks": "", "outlinewidth": 0 }, "autocolorscale": true } ] }, "layout": { "geo": { "bgcolor": "white", "showland": true, "lakecolor": "white", "landcolor": "white", "showlakes": true, "subunitcolor": "#C8D4E3" }, "font": { "color": "#2a3f5f" }, "polar": { "bgcolor": "white", "radialaxis": { "ticks": "", "gridcolor": "#EBF0F8", "linecolor": "#EBF0F8" }, "angularaxis": { "ticks": "", "gridcolor": "#EBF0F8", "linecolor": "#EBF0F8" } }, "scene": { "xaxis": { "ticks": "", "gridcolor": "#DFE8F3", "gridwidth": 2, "linecolor": "#EBF0F8", "zerolinecolor": "#EBF0F8", "showbackground": true, "backgroundcolor": "white" }, "yaxis": { "ticks": "", "gridcolor": "#DFE8F3", "gridwidth": 2, "linecolor": "#EBF0F8", "zerolinecolor": "#EBF0F8", "showbackground": true, "backgroundcolor": "white" }, "zaxis": { "ticks": "", "gridcolor": "#DFE8F3", "gridwidth": 2, "linecolor": "#EBF0F8", "zerolinecolor": "#EBF0F8", "showbackground": true, "backgroundcolor": "white" } }, "title": { "x": 0.05 }, "xaxis": { "ticks": "", "gridcolor": "#EBF0F8", "linecolor": "#EBF0F8", "automargin": true, "zerolinecolor": "#EBF0F8", "zerolinewidth": 2 }, "yaxis": { "ticks": "", "gridcolor": "#EBF0F8", "linecolor": "#EBF0F8", "automargin": true, "zerolinecolor": "#EBF0F8", "zerolinewidth": 2 }, "ternary": { "aaxis": { "ticks": "", "gridcolor": "#DFE8F3", "linecolor": "#A2B1C6" }, "baxis": { "ticks": "", "gridcolor": "#DFE8F3", "linecolor": "#A2B1C6" }, "caxis": { "ticks": "", "gridcolor": "#DFE8F3", "linecolor": "#A2B1C6" }, "bgcolor": "white" }, "colorway": [ "#636efa", "#EF553B", "#00cc96", "#ab63fa", "#19d3f3", "#e763fa", "#fecb52", "#ffa15a", "#ff6692", "#b6e880" ], "hovermode": "closest", "colorscale": { "diverging": [ [ 0, "#8e0152" ], [ 0.1, "#c51b7d" ], [ 0.2, "#de77ae" ], [ 0.3, "#f1b6da" ], [ 0.4, "#fde0ef" ], [ 0.5, "#f7f7f7" ], [ 0.6, "#e6f5d0" ], [ 0.7, "#b8e186" ], [ 0.8, "#7fbc41" ], [ 0.9, "#4d9221" ], [ 1, "#276419" ] ], "sequential": [ [ 0, "#0508b8" ], [ 0.0893854748603352, "#1910d8" ], [ 0.1787709497206704, "#3c19f0" ], [ 0.2681564245810056, "#6b1cfb" ], [ 0.3575418994413408, "#981cfd" ], [ 0.44692737430167595, "#bf1cfd" ], [ 0.5363128491620112, "#dd2bfd" ], [ 0.6256983240223464, "#f246fe" ], [ 0.7150837988826816, "#fc67fd" ], [ 0.8044692737430168, "#fe88fc" ], [ 0.8938547486033519, "#fea5fd" ], [ 0.9832402234636871, "#febefe" ], [ 1, "#fec3fe" ] ], "sequentialminus": [ [ 0, "#0508b8" ], [ 0.0893854748603352, "#1910d8" ], [ 0.1787709497206704, "#3c19f0" ], [ 0.2681564245810056, "#6b1cfb" ], [ 0.3575418994413408, "#981cfd" ], [ 0.44692737430167595, "#bf1cfd" ], [ 0.5363128491620112, "#dd2bfd" ], [ 0.6256983240223464, "#f246fe" ], [ 0.7150837988826816, "#fc67fd" ], [ 0.8044692737430168, "#fe88fc" ], [ 0.8938547486033519, "#fea5fd" ], [ 0.9832402234636871, "#febefe" ], [ 1, "#fec3fe" ] ] }, "plot_bgcolor": "white", "paper_bgcolor": "white", "shapedefaults": { "line": { "width": 0 }, "opacity": 0.4, "fillcolor": "#506784" }, "annotationdefaults": { "arrowhead": 0, "arrowcolor": "#506784", "arrowwidth": 1 } }, "themeRef": "PLOTLY_WHITE" } } }, "height": null, "width": null, "user": { "profile_url": "https://chart-studio.plotly.com/~jooooyn17", "avatar_url": "https://storage.googleapis.com/plotly-prod-profiles/63.jpg", "background_url": "https://storage.googleapis.com/plotly-prod-profiles/bg-9.jpg", "bio": "", "nickname": "", "website": "", "stream_tokens": null, "feature_set_id": null, "csrf_token": null, "date_joined": "2024-04-01 05:58:28", "mapbox_access_tokens": null, "has_password": null, "username": "jooooyn17", "email": null, "is_active": null, "readonly": null, "is_dash_creator": null, "dash_created_count": null, "is_chart_creator": null, "charts_created_count": null } } ] }
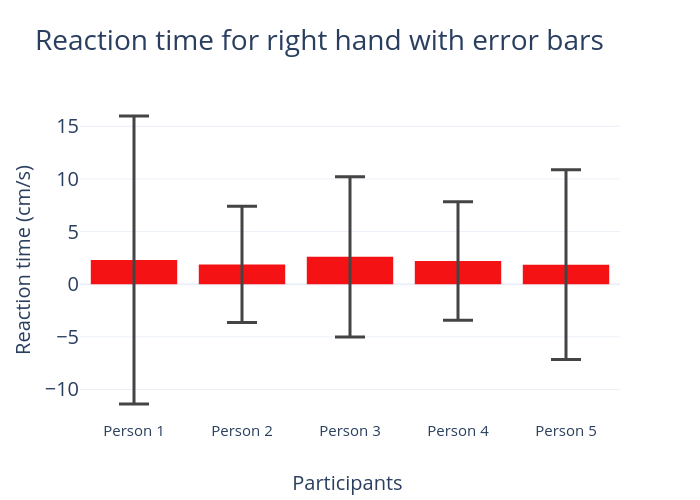