Plots List
Plots
This endpoint handles manipulation of Plotly plot files.
Reference
Authorization
Any user with or without a Plotly account may view public plots. For private plots, see authentication.
Actions
list
Listing all public plots can be done via a GET request to this endpoint.
By default, plots will be listed in order of date created. The order_by
query parameter is accepted at this endpoint. Currently, only ordering by
views is supported. It is possible to filter the plots by quality
with min_quality or max_quality as query parameter.
Example:
// GET https://api.plotly.com/v2/plots/ ---> 200

// GET https://api.plotly.com/v2/plots/?order_by=-views ---> 200

// GET https://api.plotly.com/v2/plots/?min_quality=5 ---> 200

// GET https://api.plotly.com/v2/plots/?max_quality=5 ---> 200
feed
Listing all handpicked feed plots can be done via a GET request to this endpoint. By default, plots will be listed in a random order.
Example:
// GET https://api.plotly.com/v2/plots/feed ---> 200
create
You can create new plot resources here. The only required field is 'figure'. Currently, the figure is restricted to only contain references to grid data. That is, this will fail if raw data arrays are passed in. To create and manipulate underlying grids for plots, see the grids endpoint.
Example:
// This fails because a figure field is required.
// POST https://api.plotly.com/v2/plots ---> 400 Bad Request
{}

// This fails because the figure has raw data
//POST https://api.plotly.com/v2/plots ---> 400 Bad Request
{
    "figure": {"data": [{"y": ['this', 'is', 'raw', 'data']}]}
}

// This succeeds because the figure has src keys, not raw data.
//POST https://api.plotly.com/v2/plots ---> 200 OK
{
    "figure": {"data": [{"ysrc": "sven:88:u8nd62"}]}
}
When creating a grid, you can optionally specify a source_fid to specify where a plot has come from:
- source_fid: the fid of a plot that was copied (and presumably edited) to produce this one
detail
There is a lot of meta information stored about plot files including filename, title, share_url, and content_url to name a few.
This information can only be reached with a GET to this endpoint.
Example:
// GET https://api.plotly.com/v2/plots/iheartgraphs:90
content
The contents of a plot can be downloaded via the content resource. The plot
content contains referenced grid/column data by default. If you wish to
return the raw grid/column data, the inline_data=true query must be included
in the request url. The Content-Type header will be appropriately set for the
response body.
Alternatively, you can set ?map_data=unreadable to append a mapping of
sources to data that belongs to grids which are unreadable for the
requestor. This is useful when you have read access to another users plot,
but that plot contains grid references which you don't have access to.
Examples:
// Returns referenced grid/column data
// GET https://api.plotly.com/v2/plots/iheartgraphs:90/content ---> 200 OK

// Returns full grid/column data
// GET https://api.plotly.com/v2/plots/iheartgraphs:90/content?inline_data=true ---> 200 OK

// Returns full grid/column data when requestor doesn't have permission
// to read the referenced grid.
// GET https://api.plotly.com/v2/plots/iheartgraphs:90/content?map_data=unreadable ---> 200 OK
GET /v2/plots?cursor=cj0xJnA9MjAyNC0wMy0yMisxMSUzQTA3JTNBMDYuNTk0NDQ3JTJCMDAlM0EwMA%3D%3D&format=api
{ "next": "https://api.plot.ly/v2/plots?cursor=cD0yMDI0LTAzLTIyKzExJTNBMTUlM0EzNC44NTgyMjglMkIwMCUzQTAw&format=api", "previous": "https://api.plot.ly/v2/plots?cursor=cj0xJnA9MjAyNC0wMy0yMisxNCUzQTQzJTNBNDQuNTE2OTIxJTJCMDAlM0EwMA%3D%3D&format=api", "results": [ { "creation_time": "2024-03-22T14:43:44.516921Z", "comments": { "results": [], "count": 0 }, "parented": true, "embed_url": "https://chart-studio.plotly.com/~kde3375/100.embed", "fid": "kde3375:100", "filename": "Eureka submission for each sector", "filetype": "plot", "img_url": "https://storage.googleapis.com/plotly-prod-images/kde3375/100/9_5GIXN1GXPVCK75P4ZAGT4IS0KT80HT.png", "image_urls": { "default": "https://storage.googleapis.com/plotly-prod-images/kde3375/100/2_UM8SQXRZDQF7DETZ50Y1S8Y5MXWNZQ.png", "block-thumb": "https://storage.googleapis.com/plotly-prod-images/kde3375/100/8_2073HJVPNEEX3WJUBA8DRHB6RH8FC3.png", "list-thumb": "https://storage.googleapis.com/plotly-prod-images/kde3375/100/9_5GIXN1GXPVCK75P4ZAGT4IS0KT80HT.png" }, "api_urls": { "files": "https://api.plotly.com/v2/files/kde3375:100", "plots": "https://api.plotly.com/v2/plots/kde3375:100", "parent": "https://api.plotly.com/v2/folders/home?user=kde3375" }, "owner": "kde3375", "parent": -1, "preview": "", "referencers": [], "references": [], "title": "", "views": 5, "web_url": "https://chart-studio.plotly.com/~kde3375/100/", "world_readable": true, "date_modified": "2024-03-22T14:45:44.843Z", "stars": { "results": [], "count": 0 }, "collaborators": { "results": [], "count": 0 }, "subfolder_count": null, "refresh_interval": null, "organize_view_url": "https://chart-studio.plotly.com/~kde3375/100/", "current_user_permission": "read", "is_theme": null, "is_template": false, "autosize": true, "caption": "", "figure": { "data": [ { "meta": { "columnNames": { "x": "data.0.x", "y": "data.0.y", "marker": { "color": "data.0.y" } } }, "name": "", "type": "bar", "xsrc": "kde3375:99:149941", "ysrc": "kde3375:99:693396", "xaxis": "x", "yaxis": "y", "marker": { "meta": { "columnNames": { "color": "data.0.y" } }, "pattern": { "shape": "" }, "colorsrc": "kde3375:99:693396", "colorscale": [ [ 0, "#ffffe5" ], [ 0.125, "#f7fcb9" ], [ 0.25, "#d9f0a3" ], [ 0.375, "#addd8e" ], [ 0.5, "#78c679" ], [ 0.625, "#41ab5d" ], [ 0.75, "#238443" ], [ 0.875, "#006837" ], [ 1, "#004529" ] ] }, "textfont": { "size": 10 }, "textangle": 0, "cliponaxis": false, "showlegend": false, "legendgroup": "", "offsetgroup": "", "orientation": "v", "textposition": "outside", "texttemplate": "%{y:.2s}", "hovertemplate": "sector=%{x}<br>count=%{y}<extra></extra>", "alignmentgroup": "True", "autocolorscale": false } ], "frames": [], "layout": { "title": { "text": "Eureka submission for each sector" }, "xaxis": { "type": "category", "range": [ -0.5, 18.5 ], "title": { "text": "sector" }, "anchor": "y", "domain": [ 0, 1 ], "tickfont": { "size": 10 }, "tickmode": "linear", "autorange": true, "tickangle": 30 }, "yaxis": { "type": "linear", "range": [ 0, 53.68421052631579 ], "title": { "text": "count" }, "anchor": "x", "domain": [ 0, 1 ], "autorange": true }, "legend": { "tracegroupgap": 0 }, "barmode": "relative", "autosize": true, "template": { "data": { "bar": [ { "type": "bar", "marker": { "line": { "color": "#E5ECF6", "width": 0.5 }, "pattern": { "size": 10, "fillmode": "overlay", "solidity": 0.2 } }, "error_x": { "color": "#2a3f5f" }, "error_y": { "color": "#2a3f5f" } } ], "pie": [ { "type": "pie", "automargin": true } ], "table": [ { "type": "table", "cells": { "fill": { "color": "#EBF0F8" }, "line": { "color": "white" } }, "header": { "fill": { "color": "#C8D4E3" }, "line": { "color": "white" } } } ], "carpet": [ { "type": "carpet", "aaxis": { "gridcolor": "white", "linecolor": "white", "endlinecolor": "#2a3f5f", "minorgridcolor": "white", "startlinecolor": "#2a3f5f" }, "baxis": { "gridcolor": "white", "linecolor": "white", "endlinecolor": "#2a3f5f", "minorgridcolor": "white", "startlinecolor": "#2a3f5f" } } ], "mesh3d": [ { "type": "mesh3d", "colorbar": { "ticks": "", "outlinewidth": 0 } } ], "contour": [ { "type": "contour", "colorbar": { "ticks": "", "outlinewidth": 0 }, "colorscale": [ [ 0, "#0d0887" ], [ 0.1111111111111111, "#46039f" ], [ 0.2222222222222222, "#7201a8" ], [ 0.3333333333333333, "#9c179e" ], [ 0.4444444444444444, "#bd3786" ], [ 0.5555555555555556, "#d8576b" ], [ 0.6666666666666666, "#ed7953" ], [ 0.7777777777777778, "#fb9f3a" ], [ 0.8888888888888888, "#fdca26" ], [ 1, "#f0f921" ] ] } ], "heatmap": [ { "type": "heatmap", "colorbar": { "ticks": "", "outlinewidth": 0 }, "colorscale": [ [ 0, "#0d0887" ], [ 0.1111111111111111, "#46039f" ], [ 0.2222222222222222, "#7201a8" ], [ 0.3333333333333333, "#9c179e" ], [ 0.4444444444444444, "#bd3786" ], [ 0.5555555555555556, "#d8576b" ], [ 0.6666666666666666, "#ed7953" ], [ 0.7777777777777778, "#fb9f3a" ], [ 0.8888888888888888, "#fdca26" ], [ 1, "#f0f921" ] ] } ], "scatter": [ { "type": "scatter", "fillpattern": { "size": 10, "fillmode": "overlay", "solidity": 0.2 } } ], "surface": [ { "type": "surface", "colorbar": { "ticks": "", "outlinewidth": 0 }, "colorscale": [ [ 0, "#0d0887" ], [ 0.1111111111111111, "#46039f" ], [ 0.2222222222222222, "#7201a8" ], [ 0.3333333333333333, "#9c179e" ], [ 0.4444444444444444, "#bd3786" ], [ 0.5555555555555556, "#d8576b" ], [ 0.6666666666666666, "#ed7953" ], [ 0.7777777777777778, "#fb9f3a" ], [ 0.8888888888888888, "#fdca26" ], [ 1, "#f0f921" ] ] } ], "barpolar": [ { "type": "barpolar", "marker": { "line": { "color": "#E5ECF6", "width": 0.5 }, "pattern": { "size": 10, "fillmode": "overlay", "solidity": 0.2 } } } ], "heatmapgl": [ { "type": "heatmapgl", "colorbar": { "ticks": "", "outlinewidth": 0 }, "colorscale": [ [ 0, "#0d0887" ], [ 0.1111111111111111, "#46039f" ], [ 0.2222222222222222, "#7201a8" ], [ 0.3333333333333333, "#9c179e" ], [ 0.4444444444444444, "#bd3786" ], [ 0.5555555555555556, "#d8576b" ], [ 0.6666666666666666, "#ed7953" ], [ 0.7777777777777778, "#fb9f3a" ], [ 0.8888888888888888, "#fdca26" ], [ 1, "#f0f921" ] ] } ], "histogram": [ { "type": "histogram", "marker": { "pattern": { "size": 10, "fillmode": "overlay", "solidity": 0.2 } } } ], "parcoords": [ { "line": { "colorbar": { "ticks": "", "outlinewidth": 0 } }, "type": "parcoords" } ], "scatter3d": [ { "line": { "colorbar": { "ticks": "", "outlinewidth": 0 } }, "type": "scatter3d", "marker": { "colorbar": { "ticks": "", "outlinewidth": 0 } } } ], "scattergl": [ { "type": "scattergl", "marker": { "colorbar": { "ticks": "", "outlinewidth": 0 } } } ], "choropleth": [ { "type": "choropleth", "colorbar": { "ticks": "", "outlinewidth": 0 } } ], "scattergeo": [ { "type": "scattergeo", "marker": { "colorbar": { "ticks": "", "outlinewidth": 0 } } } ], "histogram2d": [ { "type": "histogram2d", "colorbar": { "ticks": "", "outlinewidth": 0 }, "colorscale": [ [ 0, "#0d0887" ], [ 0.1111111111111111, "#46039f" ], [ 0.2222222222222222, "#7201a8" ], [ 0.3333333333333333, "#9c179e" ], [ 0.4444444444444444, "#bd3786" ], [ 0.5555555555555556, "#d8576b" ], [ 0.6666666666666666, "#ed7953" ], [ 0.7777777777777778, "#fb9f3a" ], [ 0.8888888888888888, "#fdca26" ], [ 1, "#f0f921" ] ] } ], "scatterpolar": [ { "type": "scatterpolar", "marker": { "colorbar": { "ticks": "", "outlinewidth": 0 } } } ], "contourcarpet": [ { "type": "contourcarpet", "colorbar": { "ticks": "", "outlinewidth": 0 } } ], "scattercarpet": [ { "type": "scattercarpet", "marker": { "colorbar": { "ticks": "", "outlinewidth": 0 } } } ], "scattermapbox": [ { "type": "scattermapbox", "marker": { "colorbar": { "ticks": "", "outlinewidth": 0 } } } ], "scatterpolargl": [ { "type": "scatterpolargl", "marker": { "colorbar": { "ticks": "", "outlinewidth": 0 } } } ], "scatterternary": [ { "type": "scatterternary", "marker": { "colorbar": { "ticks": "", "outlinewidth": 0 } } } ], "histogram2dcontour": [ { "type": "histogram2dcontour", "colorbar": { "ticks": "", "outlinewidth": 0 }, "colorscale": [ [ 0, "#0d0887" ], [ 0.1111111111111111, "#46039f" ], [ 0.2222222222222222, "#7201a8" ], [ 0.3333333333333333, "#9c179e" ], [ 0.4444444444444444, "#bd3786" ], [ 0.5555555555555556, "#d8576b" ], [ 0.6666666666666666, "#ed7953" ], [ 0.7777777777777778, "#fb9f3a" ], [ 0.8888888888888888, "#fdca26" ], [ 1, "#f0f921" ] ] } ] }, "layout": { "geo": { "bgcolor": "white", "showland": true, "lakecolor": "white", "landcolor": "#E5ECF6", "showlakes": true, "subunitcolor": "white" }, "font": { "color": "#2a3f5f" }, "polar": { "bgcolor": "#E5ECF6", "radialaxis": { "ticks": "", "gridcolor": "white", "linecolor": "white" }, "angularaxis": { "ticks": "", "gridcolor": "white", "linecolor": "white" } }, "scene": { "xaxis": { "ticks": "", "gridcolor": "white", "gridwidth": 2, "linecolor": "white", "zerolinecolor": "white", "showbackground": true, "backgroundcolor": "#E5ECF6" }, "yaxis": { "ticks": "", "gridcolor": "white", "gridwidth": 2, "linecolor": "white", "zerolinecolor": "white", "showbackground": true, "backgroundcolor": "#E5ECF6" }, "zaxis": { "ticks": "", "gridcolor": "white", "gridwidth": 2, "linecolor": "white", "zerolinecolor": "white", "showbackground": true, "backgroundcolor": "#E5ECF6" } }, "title": { "x": 0.05 }, "xaxis": { "ticks": "", "title": { "standoff": 15 }, "gridcolor": "white", "linecolor": "white", "automargin": true, "zerolinecolor": "white", "zerolinewidth": 2 }, "yaxis": { "ticks": "", "title": { "standoff": 15 }, "gridcolor": "white", "linecolor": "white", "automargin": true, "zerolinecolor": "white", "zerolinewidth": 2 }, "mapbox": { "style": "light" }, "ternary": { "aaxis": { "ticks": "", "gridcolor": "white", "linecolor": "white" }, "baxis": { "ticks": "", "gridcolor": "white", "linecolor": "white" }, "caxis": { "ticks": "", "gridcolor": "white", "linecolor": "white" }, "bgcolor": "#E5ECF6" }, "colorway": [ "#636efa", "#EF553B", "#00cc96", "#ab63fa", "#FFA15A", "#19d3f3", "#FF6692", "#B6E880", "#FF97FF", "#FECB52" ], "coloraxis": { "colorbar": { "ticks": "", "outlinewidth": 0 } }, "hovermode": "closest", "colorscale": { "diverging": [ [ 0, "#8e0152" ], [ 0.1, "#c51b7d" ], [ 0.2, "#de77ae" ], [ 0.3, "#f1b6da" ], [ 0.4, "#fde0ef" ], [ 0.5, "#f7f7f7" ], [ 0.6, "#e6f5d0" ], [ 0.7, "#b8e186" ], [ 0.8, "#7fbc41" ], [ 0.9, "#4d9221" ], [ 1, "#276419" ] ], "sequential": [ [ 0, "#0d0887" ], [ 0.1111111111111111, "#46039f" ], [ 0.2222222222222222, "#7201a8" ], [ 0.3333333333333333, "#9c179e" ], [ 0.4444444444444444, "#bd3786" ], [ 0.5555555555555556, "#d8576b" ], [ 0.6666666666666666, "#ed7953" ], [ 0.7777777777777778, "#fb9f3a" ], [ 0.8888888888888888, "#fdca26" ], [ 1, "#f0f921" ] ], "sequentialminus": [ [ 0, "#0d0887" ], [ 0.1111111111111111, "#46039f" ], [ 0.2222222222222222, "#7201a8" ], [ 0.3333333333333333, "#9c179e" ], [ 0.4444444444444444, "#bd3786" ], [ 0.5555555555555556, "#d8576b" ], [ 0.6666666666666666, "#ed7953" ], [ 0.7777777777777778, "#fb9f3a" ], [ 0.8888888888888888, "#fdca26" ], [ 1, "#f0f921" ] ] }, "hoverlabel": { "align": "left" }, "plot_bgcolor": "#E5ECF6", "paper_bgcolor": "white", "shapedefaults": { "line": { "color": "#2a3f5f" } }, "autotypenumbers": "strict", "annotationdefaults": { "arrowhead": 0, "arrowcolor": "#2a3f5f", "arrowwidth": 1 } } } } }, "height": null, "width": null, "user": { "profile_url": "https://chart-studio.plotly.com/~kde3375", "avatar_url": "https://storage.googleapis.com/plotly-prod-profiles/89.jpg", "background_url": "https://storage.googleapis.com/plotly-prod-profiles/bg-6.jpg", "bio": "", "nickname": "", "website": "", "stream_tokens": null, "feature_set_id": null, "csrf_token": null, "date_joined": "2021-10-07 04:58:13", "mapbox_access_tokens": null, "has_password": null, "username": "kde3375", "email": null, "is_active": null, "readonly": null, "is_dash_creator": null, "dash_created_count": null, "is_chart_creator": null, "charts_created_count": null } }, { "creation_time": "2024-03-22T14:43:13.439009Z", "comments": { "results": [], "count": 0 }, "parented": true, "embed_url": "https://chart-studio.plotly.com/~dchaussabel/235.embed", "fid": "dchaussabel:235", "filename": "M10.1 - GSE60424 by Cell Type", "filetype": "plot", "img_url": "https://storage.googleapis.com/plotly-prod-images/dchaussabel/235/9_X60FWLJRLCTI8IHFOYCPTK1IA6GNLR.png", "image_urls": { "default": "https://storage.googleapis.com/plotly-prod-images/dchaussabel/235/2_N69CF3HRHW9TFCL65ZTUU5NU7DOURU.png", "block-thumb": "https://storage.googleapis.com/plotly-prod-images/dchaussabel/235/8_KKWV0J4WYC2WNF6J9F6C80JQRBG820.png", "list-thumb": "https://storage.googleapis.com/plotly-prod-images/dchaussabel/235/9_X60FWLJRLCTI8IHFOYCPTK1IA6GNLR.png" }, "api_urls": { "files": "https://api.plotly.com/v2/files/dchaussabel:235", "plots": "https://api.plotly.com/v2/plots/dchaussabel:235", "parent": "https://api.plotly.com/v2/folders/home?user=dchaussabel" }, "owner": "dchaussabel", "parent": -1, "preview": "", "referencers": [], "references": [], "title": "", "views": 3, "web_url": "https://chart-studio.plotly.com/~dchaussabel/235/", "world_readable": true, "date_modified": "2024-03-22T16:38:30.538Z", "stars": { "results": [], "count": 0 }, "collaborators": { "results": [], "count": 0 }, "subfolder_count": null, "refresh_interval": null, "organize_view_url": "https://chart-studio.plotly.com/~dchaussabel/235/", "current_user_permission": "read", "is_theme": null, "is_template": false, "autosize": true, "caption": "", "figure": { "data": [ { "line": { "width": 1 }, "meta": { "columnNames": { "x": "A", "y": "C" } }, "mode": "markers", "name": "ZBP1", "type": "box", "xsrc": "dchaussabel:234:cd52f2", "ysrc": "dchaussabel:234:31d3ff", "jitter": 0.8, "marker": { "line": { "color": "rgb(115, 114, 114)", "width": 0.5 }, "size": 8 }, "pointpos": -2, "boxpoints": "all", "whiskerwidth": 0.5 }, { "line": { "width": 1 }, "meta": { "columnNames": { "x": "A", "y": "D" } }, "name": "OAS2", "type": "box", "xsrc": "dchaussabel:234:cd52f2", "ysrc": "dchaussabel:234:2b2cc5", "jitter": 0.8, "marker": { "line": { "color": "rgb(115, 114, 114)", "width": 0.5 }, "size": 8 }, "pointpos": -2, "boxpoints": "all", "whiskerwidth": 0.5 }, { "line": { "width": 1 }, "meta": { "columnNames": { "x": "A", "y": "E" } }, "name": "IFIH1", "type": "box", "xsrc": "dchaussabel:234:cd52f2", "ysrc": "dchaussabel:234:e858e5", "jitter": 0.8, "marker": { "line": { "color": "rgb(115, 114, 114)", "width": 0.5 }, "size": 8 }, "pointpos": -2, "boxpoints": "all", "whiskerwidth": 0.5 }, { "line": { "width": 1 }, "meta": { "columnNames": { "x": "A", "y": "F" } }, "name": "IRF7", "type": "box", "xsrc": "dchaussabel:234:cd52f2", "ysrc": "dchaussabel:234:9c54a7", "jitter": 0.8, "marker": { "line": { "color": "rgb(115, 114, 114)", "width": 0.5 }, "size": 8 }, "pointpos": -2, "boxpoints": "all", "whiskerwidth": 0.5 }, { "line": { "width": 1 }, "meta": { "columnNames": { "x": "A", "y": "G" } }, "name": "STAT1", "type": "box", "xsrc": "dchaussabel:234:cd52f2", "ysrc": "dchaussabel:234:55f029", "jitter": 0.8, "marker": { "line": { "color": "rgb(115, 114, 114)", "width": 0.5 }, "size": 8 }, "pointpos": -2, "boxpoints": "all", "whiskerwidth": 0.5 } ], "frames": [], "layout": { "xaxis": { "type": "category", "range": [ 0.06642302864040378, 7.891240893229453 ], "title": { "font": { "size": 18 }, "text": "<br>" }, "tickfont": { "size": 17 }, "autorange": true }, "yaxis": { "type": "linear", "range": [ -161.6905555555556, 3079.1205555555557 ], "title": { "font": { "size": 18 }, "text": "Normalized Counts (RNA-seq)" }, "tickfont": { "size": 15 }, "autorange": true }, "boxgap": 0.37, "legend": { "x": 0.28402366863905326, "y": 0.9223880597014925, "font": { "size": 18 }, "xanchor": "auto", "yanchor": "auto", "orientation": "h" }, "autosize": true, "template": { "data": { "bar": [ { "type": "bar", "marker": { "colorbar": { "ticks": "", "outlinewidth": 0 } } } ], "table": [ { "type": "table", "cells": { "fill": { "color": "#EBF0F8" }, "line": { "color": "white" } }, "header": { "fill": { "color": "#C8D4E3" }, "line": { "color": "white" } } } ], "carpet": [ { "type": "carpet", "aaxis": { "gridcolor": "#C8D4E3", "linecolor": "#C8D4E3", "endlinecolor": "#2a3f5f", "minorgridcolor": "#C8D4E3", "startlinecolor": "#2a3f5f" }, "baxis": { "gridcolor": "#C8D4E3", "linecolor": "#C8D4E3", "endlinecolor": "#2a3f5f", "minorgridcolor": "#C8D4E3", "startlinecolor": "#2a3f5f" } } ], "mesh3d": [ { "type": "mesh3d", "colorbar": { "ticks": "", "outlinewidth": 0 } } ], "contour": [ { "type": "contour", "colorbar": { "ticks": "", "outlinewidth": 0 }, "autocolorscale": true } ], "heatmap": [ { "type": "heatmap", "colorbar": { "ticks": "", "outlinewidth": 0 }, "autocolorscale": true } ], "scatter": [ { "type": "scatter", "marker": { "colorbar": { "ticks": "", "outlinewidth": 0 } } } ], "surface": [ { "type": "surface", "colorbar": { "ticks": "", "outlinewidth": 0 } } ], "heatmapgl": [ { "type": "heatmapgl", "colorbar": { "ticks": "", "outlinewidth": 0 } } ], "histogram": [ { "type": "histogram", "marker": { "colorbar": { "ticks": "", "outlinewidth": 0 } } } ], "parcoords": [ { "line": { "colorbar": { "ticks": "", "outlinewidth": 0 } }, "type": "parcoords" } ], "scatter3d": [ { "type": "scatter3d", "marker": { "colorbar": { "ticks": "", "outlinewidth": 0 } } } ], "scattergl": [ { "type": "scattergl", "marker": { "colorbar": { "ticks": "", "outlinewidth": 0 } } } ], "choropleth": [ { "type": "choropleth", "colorbar": { "ticks": "", "outlinewidth": 0 } } ], "scattergeo": [ { "type": "scattergeo", "marker": { "colorbar": { "ticks": "", "outlinewidth": 0 } } } ], "histogram2d": [ { "type": "histogram2d", "colorbar": { "ticks": "", "outlinewidth": 0 }, "autocolorscale": true } ], "scatterpolar": [ { "type": "scatterpolar", "marker": { "colorbar": { "ticks": "", "outlinewidth": 0 } } } ], "contourcarpet": [ { "type": "contourcarpet", "colorbar": { "ticks": "", "outlinewidth": 0 } } ], "scattercarpet": [ { "type": "scattercarpet", "marker": { "colorbar": { "ticks": "", "outlinewidth": 0 } } } ], "scattermapbox": [ { "type": "scattermapbox", "marker": { "colorbar": { "ticks": "", "outlinewidth": 0 } } } ], "scatterpolargl": [ { "type": "scatterpolargl", "marker": { "colorbar": { "ticks": "", "outlinewidth": 0 } } } ], "scatterternary": [ { "type": "scatterternary", "marker": { "colorbar": { "ticks": "", "outlinewidth": 0 } } } ], "histogram2dcontour": [ { "type": "histogram2dcontour", "colorbar": { "ticks": "", "outlinewidth": 0 }, "autocolorscale": true } ] }, "layout": { "geo": { "bgcolor": "white", "showland": true, "lakecolor": "white", "landcolor": "white", "showlakes": true, "subunitcolor": "#C8D4E3" }, "font": { "color": "#2a3f5f" }, "polar": { "bgcolor": "white", "radialaxis": { "ticks": "", "gridcolor": "#EBF0F8", "linecolor": "#EBF0F8" }, "angularaxis": { "ticks": "", "gridcolor": "#EBF0F8", "linecolor": "#EBF0F8" } }, "scene": { "xaxis": { "ticks": "", "gridcolor": "#DFE8F3", "gridwidth": 2, "linecolor": "#EBF0F8", "zerolinecolor": "#EBF0F8", "showbackground": true, "backgroundcolor": "white" }, "yaxis": { "ticks": "", "gridcolor": "#DFE8F3", "gridwidth": 2, "linecolor": "#EBF0F8", "zerolinecolor": "#EBF0F8", "showbackground": true, "backgroundcolor": "white" }, "zaxis": { "ticks": "", "gridcolor": "#DFE8F3", "gridwidth": 2, "linecolor": "#EBF0F8", "zerolinecolor": "#EBF0F8", "showbackground": true, "backgroundcolor": "white" } }, "title": { "x": 0.05 }, "xaxis": { "ticks": "", "gridcolor": "#EBF0F8", "linecolor": "#EBF0F8", "automargin": true, "zerolinecolor": "#EBF0F8", "zerolinewidth": 2 }, "yaxis": { "ticks": "", "gridcolor": "#EBF0F8", "linecolor": "#EBF0F8", "automargin": true, "zerolinecolor": "#EBF0F8", "zerolinewidth": 2 }, "ternary": { "aaxis": { "ticks": "", "gridcolor": "#DFE8F3", "linecolor": "#A2B1C6" }, "baxis": { "ticks": "", "gridcolor": "#DFE8F3", "linecolor": "#A2B1C6" }, "caxis": { "ticks": "", "gridcolor": "#DFE8F3", "linecolor": "#A2B1C6" }, "bgcolor": "white" }, "colorway": [ "#636efa", "#EF553B", "#00cc96", "#ab63fa", "#19d3f3", "#e763fa", "#fecb52", "#ffa15a", "#ff6692", "#b6e880" ], "hovermode": "closest", "colorscale": { "diverging": [ [ 0, "#8e0152" ], [ 0.1, "#c51b7d" ], [ 0.2, "#de77ae" ], [ 0.3, "#f1b6da" ], [ 0.4, "#fde0ef" ], [ 0.5, "#f7f7f7" ], [ 0.6, "#e6f5d0" ], [ 0.7, "#b8e186" ], [ 0.8, "#7fbc41" ], [ 0.9, "#4d9221" ], [ 1, "#276419" ] ], "sequential": [ [ 0, "#0508b8" ], [ 0.0893854748603352, "#1910d8" ], [ 0.1787709497206704, "#3c19f0" ], [ 0.2681564245810056, "#6b1cfb" ], [ 0.3575418994413408, "#981cfd" ], [ 0.44692737430167595, "#bf1cfd" ], [ 0.5363128491620112, "#dd2bfd" ], [ 0.6256983240223464, "#f246fe" ], [ 0.7150837988826816, "#fc67fd" ], [ 0.8044692737430168, "#fe88fc" ], [ 0.8938547486033519, "#fea5fd" ], [ 0.9832402234636871, "#febefe" ], [ 1, "#fec3fe" ] ], "sequentialminus": [ [ 0, "#0508b8" ], [ 0.0893854748603352, "#1910d8" ], [ 0.1787709497206704, "#3c19f0" ], [ 0.2681564245810056, "#6b1cfb" ], [ 0.3575418994413408, "#981cfd" ], [ 0.44692737430167595, "#bf1cfd" ], [ 0.5363128491620112, "#dd2bfd" ], [ 0.6256983240223464, "#f246fe" ], [ 0.7150837988826816, "#fc67fd" ], [ 0.8044692737430168, "#fe88fc" ], [ 0.8938547486033519, "#fea5fd" ], [ 0.9832402234636871, "#febefe" ], [ 1, "#fec3fe" ] ] }, "plot_bgcolor": "white", "paper_bgcolor": "white", "shapedefaults": { "line": { "width": 0 }, "opacity": 0.4, "fillcolor": "#506784" }, "annotationdefaults": { "arrowhead": 0, "arrowcolor": "#506784", "arrowwidth": 1 } }, "themeRef": "PLOTLY_WHITE" }, "boxgroupgap": 0.42 } }, "height": null, "width": null, "user": { "profile_url": "https://chart-studio.plotly.com/~dchaussabel", "avatar_url": "https://storage.googleapis.com/plotly-prod-profiles/75.jpg", "background_url": "https://storage.googleapis.com/plotly-prod-profiles/bg-2.jpg", "bio": "", "nickname": "", "website": "", "stream_tokens": null, "feature_set_id": null, "csrf_token": null, "date_joined": "2018-10-10 08:43:45", "mapbox_access_tokens": null, "has_password": null, "username": "dchaussabel", "email": null, "is_active": null, "readonly": null, "is_dash_creator": null, "dash_created_count": null, "is_chart_creator": null, "charts_created_count": null } }, { "creation_time": "2024-03-22T14:42:49.400398Z", "comments": { "results": [], "count": 0 }, "parented": true, "embed_url": "https://chart-studio.plotly.com/~23hyyuyy/1.embed", "fid": "23hyyuyy:1", "filename": "Plot 1", "filetype": "plot", "img_url": "https://storage.googleapis.com/plotly-prod-images/23hyyuyy/1/9_H3X0ZIOQ7E4JD51F0LSTK4XD9JZ2NO.png", "image_urls": { "default": "https://storage.googleapis.com/plotly-prod-images/23hyyuyy/1/2_0JWOUQ3JM9A9G481TOLJCI4FGTLV8C.png", "block-thumb": "https://storage.googleapis.com/plotly-prod-images/23hyyuyy/1/8_IC9LFXB54Z0ZZJNRUHCIHU0APHRDH4.png", "list-thumb": "https://storage.googleapis.com/plotly-prod-images/23hyyuyy/1/9_H3X0ZIOQ7E4JD51F0LSTK4XD9JZ2NO.png" }, "api_urls": { "files": "https://api.plotly.com/v2/files/23hyyuyy:1", "plots": "https://api.plotly.com/v2/plots/23hyyuyy:1", "parent": "https://api.plotly.com/v2/folders/home?user=23hyyuyy" }, "owner": "23hyyuyy", "parent": -1, "preview": "", "referencers": [], "references": [], "title": "", "views": 1, "web_url": "https://chart-studio.plotly.com/~23hyyuyy/1/", "world_readable": true, "date_modified": "2024-03-22T14:42:49.416Z", "stars": { "results": [], "count": 0 }, "collaborators": { "results": [], "count": 0 }, "subfolder_count": null, "refresh_interval": null, "organize_view_url": "https://chart-studio.plotly.com/~23hyyuyy/1/", "current_user_permission": "read", "is_theme": null, "is_template": false, "autosize": true, "caption": "", "figure": { "data": [ { "meta": { "columnNames": { "x": "B", "y": "A" } }, "mode": "markers", "type": "scatter", "xsrc": "23hyyuyy:0:629be1", "ysrc": "23hyyuyy:0:efd3d3" } ], "frames": [], "layout": { "xaxis": { "type": "linear", "range": [ 0.38809200603318256, 0.6389758672699849 ], "autorange": false }, "yaxis": { "type": "linear", "range": [ 1.534890322580645, 2.523958064516129 ], "autorange": false }, "shapes": [ { "line": { "color": "#444444" }, "opacity": 0.3, "fillcolor": "#7f7f7f" } ], "autosize": true, "template": { "data": { "bar": [ { "type": "bar", "marker": { "colorbar": { "ticks": "", "outlinewidth": 0 } } } ], "table": [ { "type": "table", "cells": { "fill": { "color": "#EBF0F8" }, "line": { "color": "white" } }, "header": { "fill": { "color": "#C8D4E3" }, "line": { "color": "white" } } } ], "carpet": [ { "type": "carpet", "aaxis": { "gridcolor": "#C8D4E3", "linecolor": "#C8D4E3", "endlinecolor": "#2a3f5f", "minorgridcolor": "#C8D4E3", "startlinecolor": "#2a3f5f" }, "baxis": { "gridcolor": "#C8D4E3", "linecolor": "#C8D4E3", "endlinecolor": "#2a3f5f", "minorgridcolor": "#C8D4E3", "startlinecolor": "#2a3f5f" } } ], "mesh3d": [ { "type": "mesh3d", "colorbar": { "ticks": "", "outlinewidth": 0 } } ], "contour": [ { "type": "contour", "colorbar": { "ticks": "", "outlinewidth": 0 }, "autocolorscale": true } ], "heatmap": [ { "type": "heatmap", "colorbar": { "ticks": "", "outlinewidth": 0 }, "autocolorscale": true } ], "scatter": [ { "type": "scatter", "marker": { "colorbar": { "ticks": "", "outlinewidth": 0 } } } ], "surface": [ { "type": "surface", "colorbar": { "ticks": "", "outlinewidth": 0 } } ], "heatmapgl": [ { "type": "heatmapgl", "colorbar": { "ticks": "", "outlinewidth": 0 } } ], "histogram": [ { "type": "histogram", "marker": { "colorbar": { "ticks": "", "outlinewidth": 0 } } } ], "parcoords": [ { "line": { "colorbar": { "ticks": "", "outlinewidth": 0 } }, "type": "parcoords" } ], "scatter3d": [ { "type": "scatter3d", "marker": { "colorbar": { "ticks": "", "outlinewidth": 0 } } } ], "scattergl": [ { "type": "scattergl", "marker": { "colorbar": { "ticks": "", "outlinewidth": 0 } } } ], "choropleth": [ { "type": "choropleth", "colorbar": { "ticks": "", "outlinewidth": 0 } } ], "scattergeo": [ { "type": "scattergeo", "marker": { "colorbar": { "ticks": "", "outlinewidth": 0 } } } ], "histogram2d": [ { "type": "histogram2d", "colorbar": { "ticks": "", "outlinewidth": 0 }, "autocolorscale": true } ], "scatterpolar": [ { "type": "scatterpolar", "marker": { "colorbar": { "ticks": "", "outlinewidth": 0 } } } ], "contourcarpet": [ { "type": "contourcarpet", "colorbar": { "ticks": "", "outlinewidth": 0 } } ], "scattercarpet": [ { "type": "scattercarpet", "marker": { "colorbar": { "ticks": "", "outlinewidth": 0 } } } ], "scattermapbox": [ { "type": "scattermapbox", "marker": { "colorbar": { "ticks": "", "outlinewidth": 0 } } } ], "scatterpolargl": [ { "type": "scatterpolargl", "marker": { "colorbar": { "ticks": "", "outlinewidth": 0 } } } ], "scatterternary": [ { "type": "scatterternary", "marker": { "colorbar": { "ticks": "", "outlinewidth": 0 } } } ], "histogram2dcontour": [ { "type": "histogram2dcontour", "colorbar": { "ticks": "", "outlinewidth": 0 }, "autocolorscale": true } ] }, "layout": { "geo": { "bgcolor": "white", "showland": true, "lakecolor": "white", "landcolor": "white", "showlakes": true, "subunitcolor": "#C8D4E3" }, "font": { "color": "#2a3f5f" }, "polar": { "bgcolor": "white", "radialaxis": { "ticks": "", "gridcolor": "#EBF0F8", "linecolor": "#EBF0F8" }, "angularaxis": { "ticks": "", "gridcolor": "#EBF0F8", "linecolor": "#EBF0F8" } }, "scene": { "xaxis": { "ticks": "", "gridcolor": "#DFE8F3", "gridwidth": 2, "linecolor": "#EBF0F8", "zerolinecolor": "#EBF0F8", "showbackground": true, "backgroundcolor": "white" }, "yaxis": { "ticks": "", "gridcolor": "#DFE8F3", "gridwidth": 2, "linecolor": "#EBF0F8", "zerolinecolor": "#EBF0F8", "showbackground": true, "backgroundcolor": "white" }, "zaxis": { "ticks": "", "gridcolor": "#DFE8F3", "gridwidth": 2, "linecolor": "#EBF0F8", "zerolinecolor": "#EBF0F8", "showbackground": true, "backgroundcolor": "white" } }, "title": { "x": 0.05 }, "xaxis": { "ticks": "", "gridcolor": "#EBF0F8", "linecolor": "#EBF0F8", "automargin": true, "zerolinecolor": "#EBF0F8", "zerolinewidth": 2 }, "yaxis": { "ticks": "", "gridcolor": "#EBF0F8", "linecolor": "#EBF0F8", "automargin": true, "zerolinecolor": "#EBF0F8", "zerolinewidth": 2 }, "ternary": { "aaxis": { "ticks": "", "gridcolor": "#DFE8F3", "linecolor": "#A2B1C6" }, "baxis": { "ticks": "", "gridcolor": "#DFE8F3", "linecolor": "#A2B1C6" }, "caxis": { "ticks": "", "gridcolor": "#DFE8F3", "linecolor": "#A2B1C6" }, "bgcolor": "white" }, "colorway": [ "#636efa", "#EF553B", "#00cc96", "#ab63fa", "#19d3f3", "#e763fa", "#fecb52", "#ffa15a", "#ff6692", "#b6e880" ], "hovermode": "closest", "colorscale": { "diverging": [ [ 0, "#8e0152" ], [ 0.1, "#c51b7d" ], [ 0.2, "#de77ae" ], [ 0.3, "#f1b6da" ], [ 0.4, "#fde0ef" ], [ 0.5, "#f7f7f7" ], [ 0.6, "#e6f5d0" ], [ 0.7, "#b8e186" ], [ 0.8, "#7fbc41" ], [ 0.9, "#4d9221" ], [ 1, "#276419" ] ], "sequential": [ [ 0, "#0508b8" ], [ 0.0893854748603352, "#1910d8" ], [ 0.1787709497206704, "#3c19f0" ], [ 0.2681564245810056, "#6b1cfb" ], [ 0.3575418994413408, "#981cfd" ], [ 0.44692737430167595, "#bf1cfd" ], [ 0.5363128491620112, "#dd2bfd" ], [ 0.6256983240223464, "#f246fe" ], [ 0.7150837988826816, "#fc67fd" ], [ 0.8044692737430168, "#fe88fc" ], [ 0.8938547486033519, "#fea5fd" ], [ 0.9832402234636871, "#febefe" ], [ 1, "#fec3fe" ] ], "sequentialminus": [ [ 0, "#0508b8" ], [ 0.0893854748603352, "#1910d8" ], [ 0.1787709497206704, "#3c19f0" ], [ 0.2681564245810056, "#6b1cfb" ], [ 0.3575418994413408, "#981cfd" ], [ 0.44692737430167595, "#bf1cfd" ], [ 0.5363128491620112, "#dd2bfd" ], [ 0.6256983240223464, "#f246fe" ], [ 0.7150837988826816, "#fc67fd" ], [ 0.8044692737430168, "#fe88fc" ], [ 0.8938547486033519, "#fea5fd" ], [ 0.9832402234636871, "#febefe" ], [ 1, "#fec3fe" ] ] }, "plot_bgcolor": "white", "paper_bgcolor": "white", "shapedefaults": { "line": { "width": 0 }, "opacity": 0.4, "fillcolor": "#506784" }, "annotationdefaults": { "arrowhead": 0, "arrowcolor": "#506784", "arrowwidth": 1 } }, "themeRef": "PLOTLY_WHITE" }, "colorscale": { "sequential": [ [ 0, "#000004" ], [ 0.1111111111111111, "#1b0c41" ], [ 0.2222222222222222, "#4a0c6b" ], [ 0.3333333333333333, "#781c6d" ], [ 0.4444444444444444, "#a52c60" ], [ 0.5555555555555556, "#cf4446" ], [ 0.6666666666666666, "#ed6925" ], [ 0.7777777777777778, "#fb9b06" ], [ 0.8888888888888888, "#f7d13d" ], [ 1, "#fcffa4" ] ] } } }, "height": null, "width": null, "user": { "profile_url": "https://chart-studio.plotly.com/~23hyyuyy", "avatar_url": "https://storage.googleapis.com/plotly-prod-profiles/37.jpg", "background_url": "https://storage.googleapis.com/plotly-prod-profiles/bg-0.jpg", "bio": "", "nickname": "", "website": "", "stream_tokens": null, "feature_set_id": null, "csrf_token": null, "date_joined": "2024-03-22 14:36:57", "mapbox_access_tokens": null, "has_password": null, "username": "23hyyuyy", "email": null, "is_active": null, "readonly": null, "is_dash_creator": null, "dash_created_count": null, "is_chart_creator": null, "charts_created_count": null } }, { "creation_time": "2024-03-22T14:23:13.608024Z", "comments": { "results": [], "count": 0 }, "parented": true, "embed_url": "https://chart-studio.plotly.com/~kde3375/98.embed", "fid": "kde3375:98", "filename": "Eureka submission for each country", "filetype": "plot", "img_url": "https://storage.googleapis.com/plotly-prod-images/kde3375/98/9_S982BH8P0QCS3ZY01TXVHLMYB2M3Z7.png", "image_urls": { "default": "https://storage.googleapis.com/plotly-prod-images/kde3375/98/2_UC41ZC20MX6NVT7YQ1TTU920OP6C4B.png", "block-thumb": "https://storage.googleapis.com/plotly-prod-images/kde3375/98/8_2LCIC787JCLU4DKOBIAWYR3W72YBMR.png", "list-thumb": "https://storage.googleapis.com/plotly-prod-images/kde3375/98/9_S982BH8P0QCS3ZY01TXVHLMYB2M3Z7.png" }, "api_urls": { "files": "https://api.plotly.com/v2/files/kde3375:98", "plots": "https://api.plotly.com/v2/plots/kde3375:98", "parent": "https://api.plotly.com/v2/folders/home?user=kde3375" }, "owner": "kde3375", "parent": -1, "preview": "", "referencers": [], "references": [], "title": "", "views": 7, "web_url": "https://chart-studio.plotly.com/~kde3375/98/", "world_readable": true, "date_modified": "2024-03-22T14:28:18.083Z", "stars": { "results": [], "count": 0 }, "collaborators": { "results": [], "count": 0 }, "subfolder_count": null, "refresh_interval": null, "organize_view_url": "https://chart-studio.plotly.com/~kde3375/98/", "current_user_permission": "read", "is_theme": null, "is_template": false, "autosize": true, "caption": "", "figure": { "data": [ { "meta": { "columnNames": { "x": "data.0.x", "y": "data.0.y", "marker": { "color": "data.0.y" } } }, "name": "", "type": "bar", "xsrc": "kde3375:97:18d725", "ysrc": "kde3375:97:5bce81", "xaxis": "x", "yaxis": "y", "marker": { "meta": { "columnNames": { "color": "data.0.y" } }, "cauto": true, "pattern": { "shape": "" }, "colorsrc": "kde3375:97:5bce81", "showscale": false, "colorscale": [ [ 0, "#f7f4f9" ], [ 0.125, "#e7e1ef" ], [ 0.25, "#d4b9da" ], [ 0.375, "#c994c7" ], [ 0.5, "#df65b0" ], [ 0.625, "#e7298a" ], [ 0.75, "#ce1256" ], [ 0.875, "#980043" ], [ 1, "#67001f" ] ], "reversescale": false }, "textfont": { "size": 10 }, "textangle": 0, "cliponaxis": false, "showlegend": false, "legendgroup": "", "offsetgroup": "", "orientation": "v", "textposition": "outside", "texttemplate": "%{y:.2s}", "hovertemplate": "country=%{x}<br>count=%{y}<extra></extra>", "alignmentgroup": "True", "autocolorscale": false } ], "frames": [], "layout": { "title": { "text": "Eureka submission for each country" }, "xaxis": { "type": "category", "range": [ -0.5, 26.5 ], "title": { "text": "country" }, "anchor": "y", "domain": [ 0, 1 ], "tickfont": { "size": 10 }, "tickmode": "linear", "autorange": true, "tickangle": -45 }, "yaxis": { "type": "linear", "range": [ 0, 82.10526315789474 ], "title": { "text": "count" }, "anchor": "x", "domain": [ 0, 1 ], "autorange": true }, "legend": { "tracegroupgap": 0 }, "barmode": "relative", "colorway": [ "#1f77b4", "#ff7f0e", "#2ca02c", "#d62728", "#9467bd", "#8c564b", "#e377c2", "#7f7f7f", "#bcbd22", "#17becf" ], "template": { "data": { "bar": [ { "type": "bar", "marker": { "line": { "color": "#E5ECF6", "width": 0.5 }, "pattern": { "size": 10, "fillmode": "overlay", "solidity": 0.2 } }, "error_x": { "color": "#2a3f5f" }, "error_y": { "color": "#2a3f5f" } } ], "pie": [ { "type": "pie", "automargin": true } ], "table": [ { "type": "table", "cells": { "fill": { "color": "#EBF0F8" }, "line": { "color": "white" } }, "header": { "fill": { "color": "#C8D4E3" }, "line": { "color": "white" } } } ], "carpet": [ { "type": "carpet", "aaxis": { "gridcolor": "white", "linecolor": "white", "endlinecolor": "#2a3f5f", "minorgridcolor": "white", "startlinecolor": "#2a3f5f" }, "baxis": { "gridcolor": "white", "linecolor": "white", "endlinecolor": "#2a3f5f", "minorgridcolor": "white", "startlinecolor": "#2a3f5f" } } ], "mesh3d": [ { "type": "mesh3d", "colorbar": { "ticks": "", "outlinewidth": 0 } } ], "contour": [ { "type": "contour", "colorbar": { "ticks": "", "outlinewidth": 0 }, "colorscale": [ [ 0, "#0d0887" ], [ 0.1111111111111111, "#46039f" ], [ 0.2222222222222222, "#7201a8" ], [ 0.3333333333333333, "#9c179e" ], [ 0.4444444444444444, "#bd3786" ], [ 0.5555555555555556, "#d8576b" ], [ 0.6666666666666666, "#ed7953" ], [ 0.7777777777777778, "#fb9f3a" ], [ 0.8888888888888888, "#fdca26" ], [ 1, "#f0f921" ] ] } ], "heatmap": [ { "type": "heatmap", "colorbar": { "ticks": "", "outlinewidth": 0 }, "colorscale": [ [ 0, "#0d0887" ], [ 0.1111111111111111, "#46039f" ], [ 0.2222222222222222, "#7201a8" ], [ 0.3333333333333333, "#9c179e" ], [ 0.4444444444444444, "#bd3786" ], [ 0.5555555555555556, "#d8576b" ], [ 0.6666666666666666, "#ed7953" ], [ 0.7777777777777778, "#fb9f3a" ], [ 0.8888888888888888, "#fdca26" ], [ 1, "#f0f921" ] ] } ], "scatter": [ { "type": "scatter", "fillpattern": { "size": 10, "fillmode": "overlay", "solidity": 0.2 } } ], "surface": [ { "type": "surface", "colorbar": { "ticks": "", "outlinewidth": 0 }, "colorscale": [ [ 0, "#0d0887" ], [ 0.1111111111111111, "#46039f" ], [ 0.2222222222222222, "#7201a8" ], [ 0.3333333333333333, "#9c179e" ], [ 0.4444444444444444, "#bd3786" ], [ 0.5555555555555556, "#d8576b" ], [ 0.6666666666666666, "#ed7953" ], [ 0.7777777777777778, "#fb9f3a" ], [ 0.8888888888888888, "#fdca26" ], [ 1, "#f0f921" ] ] } ], "barpolar": [ { "type": "barpolar", "marker": { "line": { "color": "#E5ECF6", "width": 0.5 }, "pattern": { "size": 10, "fillmode": "overlay", "solidity": 0.2 } } } ], "heatmapgl": [ { "type": "heatmapgl", "colorbar": { "ticks": "", "outlinewidth": 0 }, "colorscale": [ [ 0, "#0d0887" ], [ 0.1111111111111111, "#46039f" ], [ 0.2222222222222222, "#7201a8" ], [ 0.3333333333333333, "#9c179e" ], [ 0.4444444444444444, "#bd3786" ], [ 0.5555555555555556, "#d8576b" ], [ 0.6666666666666666, "#ed7953" ], [ 0.7777777777777778, "#fb9f3a" ], [ 0.8888888888888888, "#fdca26" ], [ 1, "#f0f921" ] ] } ], "histogram": [ { "type": "histogram", "marker": { "pattern": { "size": 10, "fillmode": "overlay", "solidity": 0.2 } } } ], "parcoords": [ { "line": { "colorbar": { "ticks": "", "outlinewidth": 0 } }, "type": "parcoords" } ], "scatter3d": [ { "line": { "colorbar": { "ticks": "", "outlinewidth": 0 } }, "type": "scatter3d", "marker": { "colorbar": { "ticks": "", "outlinewidth": 0 } } } ], "scattergl": [ { "type": "scattergl", "marker": { "colorbar": { "ticks": "", "outlinewidth": 0 } } } ], "choropleth": [ { "type": "choropleth", "colorbar": { "ticks": "", "outlinewidth": 0 } } ], "scattergeo": [ { "type": "scattergeo", "marker": { "colorbar": { "ticks": "", "outlinewidth": 0 } } } ], "histogram2d": [ { "type": "histogram2d", "colorbar": { "ticks": "", "outlinewidth": 0 }, "colorscale": [ [ 0, "#0d0887" ], [ 0.1111111111111111, "#46039f" ], [ 0.2222222222222222, "#7201a8" ], [ 0.3333333333333333, "#9c179e" ], [ 0.4444444444444444, "#bd3786" ], [ 0.5555555555555556, "#d8576b" ], [ 0.6666666666666666, "#ed7953" ], [ 0.7777777777777778, "#fb9f3a" ], [ 0.8888888888888888, "#fdca26" ], [ 1, "#f0f921" ] ] } ], "scatterpolar": [ { "type": "scatterpolar", "marker": { "colorbar": { "ticks": "", "outlinewidth": 0 } } } ], "contourcarpet": [ { "type": "contourcarpet", "colorbar": { "ticks": "", "outlinewidth": 0 } } ], "scattercarpet": [ { "type": "scattercarpet", "marker": { "colorbar": { "ticks": "", "outlinewidth": 0 } } } ], "scattermapbox": [ { "type": "scattermapbox", "marker": { "colorbar": { "ticks": "", "outlinewidth": 0 } } } ], "scatterpolargl": [ { "type": "scatterpolargl", "marker": { "colorbar": { "ticks": "", "outlinewidth": 0 } } } ], "scatterternary": [ { "type": "scatterternary", "marker": { "colorbar": { "ticks": "", "outlinewidth": 0 } } } ], "histogram2dcontour": [ { "type": "histogram2dcontour", "colorbar": { "ticks": "", "outlinewidth": 0 }, "colorscale": [ [ 0, "#0d0887" ], [ 0.1111111111111111, "#46039f" ], [ 0.2222222222222222, "#7201a8" ], [ 0.3333333333333333, "#9c179e" ], [ 0.4444444444444444, "#bd3786" ], [ 0.5555555555555556, "#d8576b" ], [ 0.6666666666666666, "#ed7953" ], [ 0.7777777777777778, "#fb9f3a" ], [ 0.8888888888888888, "#fdca26" ], [ 1, "#f0f921" ] ] } ] }, "layout": { "geo": { "bgcolor": "white", "showland": true, "lakecolor": "white", "landcolor": "#E5ECF6", "showlakes": true, "subunitcolor": "white" }, "font": { "color": "#2a3f5f" }, "polar": { "bgcolor": "#E5ECF6", "radialaxis": { "ticks": "", "gridcolor": "white", "linecolor": "white" }, "angularaxis": { "ticks": "", "gridcolor": "white", "linecolor": "white" } }, "scene": { "xaxis": { "ticks": "", "gridcolor": "white", "gridwidth": 2, "linecolor": "white", "zerolinecolor": "white", "showbackground": true, "backgroundcolor": "#E5ECF6" }, "yaxis": { "ticks": "", "gridcolor": "white", "gridwidth": 2, "linecolor": "white", "zerolinecolor": "white", "showbackground": true, "backgroundcolor": "#E5ECF6" }, "zaxis": { "ticks": "", "gridcolor": "white", "gridwidth": 2, "linecolor": "white", "zerolinecolor": "white", "showbackground": true, "backgroundcolor": "#E5ECF6" } }, "title": { "x": 0.05 }, "xaxis": { "ticks": "", "title": { "standoff": 15 }, "gridcolor": "white", "linecolor": "white", "automargin": true, "zerolinecolor": "white", "zerolinewidth": 2 }, "yaxis": { "ticks": "", "title": { "standoff": 15 }, "gridcolor": "white", "linecolor": "white", "automargin": true, "zerolinecolor": "white", "zerolinewidth": 2 }, "mapbox": { "style": "light" }, "ternary": { "aaxis": { "ticks": "", "gridcolor": "white", "linecolor": "white" }, "baxis": { "ticks": "", "gridcolor": "white", "linecolor": "white" }, "caxis": { "ticks": "", "gridcolor": "white", "linecolor": "white" }, "bgcolor": "#E5ECF6" }, "colorway": [ "#636efa", "#EF553B", "#00cc96", "#ab63fa", "#FFA15A", "#19d3f3", "#FF6692", "#B6E880", "#FF97FF", "#FECB52" ], "coloraxis": { "colorbar": { "ticks": "", "outlinewidth": 0 } }, "hovermode": "closest", "colorscale": { "diverging": [ [ 0, "#8e0152" ], [ 0.1, "#c51b7d" ], [ 0.2, "#de77ae" ], [ 0.3, "#f1b6da" ], [ 0.4, "#fde0ef" ], [ 0.5, "#f7f7f7" ], [ 0.6, "#e6f5d0" ], [ 0.7, "#b8e186" ], [ 0.8, "#7fbc41" ], [ 0.9, "#4d9221" ], [ 1, "#276419" ] ], "sequential": [ [ 0, "#0d0887" ], [ 0.1111111111111111, "#46039f" ], [ 0.2222222222222222, "#7201a8" ], [ 0.3333333333333333, "#9c179e" ], [ 0.4444444444444444, "#bd3786" ], [ 0.5555555555555556, "#d8576b" ], [ 0.6666666666666666, "#ed7953" ], [ 0.7777777777777778, "#fb9f3a" ], [ 0.8888888888888888, "#fdca26" ], [ 1, "#f0f921" ] ], "sequentialminus": [ [ 0, "#0d0887" ], [ 0.1111111111111111, "#46039f" ], [ 0.2222222222222222, "#7201a8" ], [ 0.3333333333333333, "#9c179e" ], [ 0.4444444444444444, "#bd3786" ], [ 0.5555555555555556, "#d8576b" ], [ 0.6666666666666666, "#ed7953" ], [ 0.7777777777777778, "#fb9f3a" ], [ 0.8888888888888888, "#fdca26" ], [ 1, "#f0f921" ] ] }, "hoverlabel": { "align": "left" }, "plot_bgcolor": "#E5ECF6", "paper_bgcolor": "white", "shapedefaults": { "line": { "color": "#2a3f5f" } }, "autotypenumbers": "strict", "annotationdefaults": { "arrowhead": 0, "arrowcolor": "#2a3f5f", "arrowwidth": 1 } } }, "colorscale": { "diverging": [ [ 0, "#a50026" ], [ 0.1, "#d73027" ], [ 0.2, "#f46d43" ], [ 0.3, "#fdae61" ], [ 0.4, "#fee090" ], [ 0.5, "#ffffbf" ], [ 0.6, "#e0f3f8" ], [ 0.7, "#abd9e9" ], [ 0.8, "#74add1" ], [ 0.9, "#4575b4" ], [ 1, "#313695" ] ], "sequential": [ [ 0, "#0d0887" ], [ 0.1111111111111111, "#46039f" ], [ 0.2222222222222222, "#7201a8" ], [ 0.3333333333333333, "#9c179e" ], [ 0.4444444444444444, "#bd3786" ], [ 0.5555555555555556, "#d8576b" ], [ 0.6666666666666666, "#ed7953" ], [ 0.7777777777777778, "#fb9f3a" ], [ 0.8888888888888888, "#fdca26" ], [ 1, "#f0f921" ] ] }, "paper_bgcolor": "rgb(254, 254, 254)" } }, "height": null, "width": null, "user": { "profile_url": "https://chart-studio.plotly.com/~kde3375", "avatar_url": "https://storage.googleapis.com/plotly-prod-profiles/89.jpg", "background_url": "https://storage.googleapis.com/plotly-prod-profiles/bg-6.jpg", "bio": "", "nickname": "", "website": "", "stream_tokens": null, "feature_set_id": null, "csrf_token": null, "date_joined": "2021-10-07 04:58:13", "mapbox_access_tokens": null, "has_password": null, "username": "kde3375", "email": null, "is_active": null, "readonly": null, "is_dash_creator": null, "dash_created_count": null, "is_chart_creator": null, "charts_created_count": null } }, { "creation_time": "2024-03-22T14:21:14.058537Z", "comments": { "results": [], "count": 0 }, "parented": true, "embed_url": "https://chart-studio.plotly.com/~dionchu/84.embed", "fid": "dionchu:84", "filename": "20240322_passthrough", "filetype": "plot", "img_url": "https://storage.googleapis.com/plotly-prod-images/dionchu/84/9_OLWL1WOIKHNSWOVHS5Z9RLS4FTECF3.png", "image_urls": { "default": "https://storage.googleapis.com/plotly-prod-images/dionchu/84/2_UGSVBJT480RC6IUOR6RQ13129UIEHA.png", "block-thumb": "https://storage.googleapis.com/plotly-prod-images/dionchu/84/8_ZI0JPSR7591JFTSN5J155FO2DHAKXI.png", "list-thumb": "https://storage.googleapis.com/plotly-prod-images/dionchu/84/9_OLWL1WOIKHNSWOVHS5Z9RLS4FTECF3.png" }, "api_urls": { "files": "https://api.plotly.com/v2/files/dionchu:84", "plots": "https://api.plotly.com/v2/plots/dionchu:84", "parent": "https://api.plotly.com/v2/folders/home?user=dionchu" }, "owner": "dionchu", "parent": -1, "preview": "", "referencers": [], "references": [], "title": "", "views": 4, "web_url": "https://chart-studio.plotly.com/~dionchu/84/", "world_readable": true, "date_modified": "2024-03-22T14:21:14.086Z", "stars": { "results": [], "count": 0 }, "collaborators": { "results": [], "count": 0 }, "subfolder_count": null, "refresh_interval": null, "organize_view_url": "https://chart-studio.plotly.com/~dionchu/84/", "current_user_permission": "read", "is_theme": null, "is_template": false, "autosize": true, "caption": "", "figure": { "data": [ { "meta": { "columnNames": { "x": "A", "y": "B" } }, "mode": "none", "name": "Passthrough (percent)", "type": "scatter", "xsrc": "dionchu:83:f3f56a", "ysrc": "dionchu:83:8d6040", "stackgroup": 1 }, { "line": { "color": "rgb(1, 1, 1)", "width": 1 }, "meta": { "columnNames": { "x": "A", "y": "C" } }, "mode": "markers", "name": "100%", "type": "scatter", "xsrc": "dionchu:83:f3f56a", "ysrc": "dionchu:83:6e3f72", "marker": { "size": 1 } } ], "frames": [], "layout": { "title": { "text": "Passthrough rate: Aave V3 borrow / 3mo ETH basis" }, "xaxis": { "type": "category", "range": [ -15.82586149213784, 282.82586149213785 ], "title": { "text": "Date" }, "autorange": true }, "yaxis": { "range": [ 33, 150 ], "title": { "text": "Passthrough (percent)" }, "autorange": false }, "autosize": true, "template": { "data": { "bar": [ { "type": "bar", "marker": { "colorbar": { "ticks": "", "outlinewidth": 0 } } } ], "table": [ { "type": "table", "cells": { "fill": { "color": "#EBF0F8" }, "line": { "color": "white" } }, "header": { "fill": { "color": "#C8D4E3" }, "line": { "color": "white" } } } ], "carpet": [ { "type": "carpet", "aaxis": { "gridcolor": "#C8D4E3", "linecolor": "#C8D4E3", "endlinecolor": "#2a3f5f", "minorgridcolor": "#C8D4E3", "startlinecolor": "#2a3f5f" }, "baxis": { "gridcolor": "#C8D4E3", "linecolor": "#C8D4E3", "endlinecolor": "#2a3f5f", "minorgridcolor": "#C8D4E3", "startlinecolor": "#2a3f5f" } } ], "mesh3d": [ { "type": "mesh3d", "colorbar": { "ticks": "", "outlinewidth": 0 } } ], "contour": [ { "type": "contour", "colorbar": { "ticks": "", "outlinewidth": 0 }, "autocolorscale": true } ], "heatmap": [ { "type": "heatmap", "colorbar": { "ticks": "", "outlinewidth": 0 }, "autocolorscale": true } ], "scatter": [ { "type": "scatter", "marker": { "colorbar": { "ticks": "", "outlinewidth": 0 } } } ], "surface": [ { "type": "surface", "colorbar": { "ticks": "", "outlinewidth": 0 } } ], "heatmapgl": [ { "type": "heatmapgl", "colorbar": { "ticks": "", "outlinewidth": 0 } } ], "histogram": [ { "type": "histogram", "marker": { "colorbar": { "ticks": "", "outlinewidth": 0 } } } ], "parcoords": [ { "line": { "colorbar": { "ticks": "", "outlinewidth": 0 } }, "type": "parcoords" } ], "scatter3d": [ { "type": "scatter3d", "marker": { "colorbar": { "ticks": "", "outlinewidth": 0 } } } ], "scattergl": [ { "type": "scattergl", "marker": { "colorbar": { "ticks": "", "outlinewidth": 0 } } } ], "choropleth": [ { "type": "choropleth", "colorbar": { "ticks": "", "outlinewidth": 0 } } ], "scattergeo": [ { "type": "scattergeo", "marker": { "colorbar": { "ticks": "", "outlinewidth": 0 } } } ], "histogram2d": [ { "type": "histogram2d", "colorbar": { "ticks": "", "outlinewidth": 0 }, "autocolorscale": true } ], "scatterpolar": [ { "type": "scatterpolar", "marker": { "colorbar": { "ticks": "", "outlinewidth": 0 } } } ], "contourcarpet": [ { "type": "contourcarpet", "colorbar": { "ticks": "", "outlinewidth": 0 } } ], "scattercarpet": [ { "type": "scattercarpet", "marker": { "colorbar": { "ticks": "", "outlinewidth": 0 } } } ], "scattermapbox": [ { "type": "scattermapbox", "marker": { "colorbar": { "ticks": "", "outlinewidth": 0 } } } ], "scatterpolargl": [ { "type": "scatterpolargl", "marker": { "colorbar": { "ticks": "", "outlinewidth": 0 } } } ], "scatterternary": [ { "type": "scatterternary", "marker": { "colorbar": { "ticks": "", "outlinewidth": 0 } } } ], "histogram2dcontour": [ { "type": "histogram2dcontour", "colorbar": { "ticks": "", "outlinewidth": 0 }, "autocolorscale": true } ] }, "layout": { "geo": { "bgcolor": "white", "showland": true, "lakecolor": "white", "landcolor": "white", "showlakes": true, "subunitcolor": "#C8D4E3" }, "font": { "color": "#2a3f5f" }, "polar": { "bgcolor": "white", "radialaxis": { "ticks": "", "gridcolor": "#EBF0F8", "linecolor": "#EBF0F8" }, "angularaxis": { "ticks": "", "gridcolor": "#EBF0F8", "linecolor": "#EBF0F8" } }, "scene": { "xaxis": { "ticks": "", "gridcolor": "#DFE8F3", "gridwidth": 2, "linecolor": "#EBF0F8", "zerolinecolor": "#EBF0F8", "showbackground": true, "backgroundcolor": "white" }, "yaxis": { "ticks": "", "gridcolor": "#DFE8F3", "gridwidth": 2, "linecolor": "#EBF0F8", "zerolinecolor": "#EBF0F8", "showbackground": true, "backgroundcolor": "white" }, "zaxis": { "ticks": "", "gridcolor": "#DFE8F3", "gridwidth": 2, "linecolor": "#EBF0F8", "zerolinecolor": "#EBF0F8", "showbackground": true, "backgroundcolor": "white" } }, "title": { "x": 0.05 }, "xaxis": { "ticks": "", "gridcolor": "#EBF0F8", "linecolor": "#EBF0F8", "automargin": true, "zerolinecolor": "#EBF0F8", "zerolinewidth": 2 }, "yaxis": { "ticks": "", "gridcolor": "#EBF0F8", "linecolor": "#EBF0F8", "automargin": true, "zerolinecolor": "#EBF0F8", "zerolinewidth": 2 }, "ternary": { "aaxis": { "ticks": "", "gridcolor": "#DFE8F3", "linecolor": "#A2B1C6" }, "baxis": { "ticks": "", "gridcolor": "#DFE8F3", "linecolor": "#A2B1C6" }, "caxis": { "ticks": "", "gridcolor": "#DFE8F3", "linecolor": "#A2B1C6" }, "bgcolor": "white" }, "colorway": [ "#636efa", "#EF553B", "#00cc96", "#ab63fa", "#19d3f3", "#e763fa", "#fecb52", "#ffa15a", "#ff6692", "#b6e880" ], "hovermode": "closest", "colorscale": { "diverging": [ [ 0, "#8e0152" ], [ 0.1, "#c51b7d" ], [ 0.2, "#de77ae" ], [ 0.3, "#f1b6da" ], [ 0.4, "#fde0ef" ], [ 0.5, "#f7f7f7" ], [ 0.6, "#e6f5d0" ], [ 0.7, "#b8e186" ], [ 0.8, "#7fbc41" ], [ 0.9, "#4d9221" ], [ 1, "#276419" ] ], "sequential": [ [ 0, "#0508b8" ], [ 0.0893854748603352, "#1910d8" ], [ 0.1787709497206704, "#3c19f0" ], [ 0.2681564245810056, "#6b1cfb" ], [ 0.3575418994413408, "#981cfd" ], [ 0.44692737430167595, "#bf1cfd" ], [ 0.5363128491620112, "#dd2bfd" ], [ 0.6256983240223464, "#f246fe" ], [ 0.7150837988826816, "#fc67fd" ], [ 0.8044692737430168, "#fe88fc" ], [ 0.8938547486033519, "#fea5fd" ], [ 0.9832402234636871, "#febefe" ], [ 1, "#fec3fe" ] ], "sequentialminus": [ [ 0, "#0508b8" ], [ 0.0893854748603352, "#1910d8" ], [ 0.1787709497206704, "#3c19f0" ], [ 0.2681564245810056, "#6b1cfb" ], [ 0.3575418994413408, "#981cfd" ], [ 0.44692737430167595, "#bf1cfd" ], [ 0.5363128491620112, "#dd2bfd" ], [ 0.6256983240223464, "#f246fe" ], [ 0.7150837988826816, "#fc67fd" ], [ 0.8044692737430168, "#fe88fc" ], [ 0.8938547486033519, "#fea5fd" ], [ 0.9832402234636871, "#febefe" ], [ 1, "#fec3fe" ] ] }, "plot_bgcolor": "white", "paper_bgcolor": "white", "shapedefaults": { "line": { "width": 0 }, "opacity": 0.4, "fillcolor": "#506784" }, "annotationdefaults": { "arrowhead": 0, "arrowcolor": "#506784", "arrowwidth": 1 } }, "themeRef": "PLOTLY_WHITE" } } }, "height": null, "width": null, "user": { "profile_url": "https://chart-studio.plotly.com/~dionchu", "avatar_url": "https://storage.googleapis.com/plotly-prod-profiles/17.jpg", "background_url": "https://storage.googleapis.com/plotly-prod-profiles/bg-5.jpg", "bio": "", "nickname": "", "website": "", "stream_tokens": null, "feature_set_id": null, "csrf_token": null, "date_joined": "2023-10-20 19:36:55", "mapbox_access_tokens": null, "has_password": null, "username": "dionchu", "email": null, "is_active": null, "readonly": null, "is_dash_creator": null, "dash_created_count": null, "is_chart_creator": null, "charts_created_count": null } }, { "creation_time": "2024-03-22T14:19:49.999078Z", "comments": { "results": [], "count": 0 }, "parented": true, "embed_url": "https://chart-studio.plotly.com/~dionchu/82.embed", "fid": "dionchu:82", "filename": "20240322_basis", "filetype": "plot", "img_url": "https://storage.googleapis.com/plotly-prod-images/dionchu/82/9_8Q9JC0BZLQG8KHP19F24HF8F1GN53H.png", "image_urls": { "default": "https://storage.googleapis.com/plotly-prod-images/dionchu/82/2_UQYBH464XA2FXZTFDOX3S52LNF868J.png", "block-thumb": "https://storage.googleapis.com/plotly-prod-images/dionchu/82/8_J3A8QEQJTNJ53GD5BN2HJC38BU4YK3.png", "list-thumb": "https://storage.googleapis.com/plotly-prod-images/dionchu/82/9_8Q9JC0BZLQG8KHP19F24HF8F1GN53H.png" }, "api_urls": { "files": "https://api.plotly.com/v2/files/dionchu:82", "plots": "https://api.plotly.com/v2/plots/dionchu:82", "parent": "https://api.plotly.com/v2/folders/home?user=dionchu" }, "owner": "dionchu", "parent": -1, "preview": "", "referencers": [], "references": [], "title": "", "views": 3, "web_url": "https://chart-studio.plotly.com/~dionchu/82/", "world_readable": true, "date_modified": "2024-03-22T14:19:50.039Z", "stars": { "results": [], "count": 0 }, "collaborators": { "results": [], "count": 0 }, "subfolder_count": null, "refresh_interval": null, "organize_view_url": "https://chart-studio.plotly.com/~dionchu/82/", "current_user_permission": "read", "is_theme": null, "is_template": false, "autosize": true, "caption": "", "figure": { "data": [ { "line": { "color": "rgb(167, 91, 162)" }, "meta": { "columnNames": { "x": "A", "y": "B" } }, "mode": "lines", "name": "<b>Aave Borrow</b><br>correlation 100.00%", "type": "scatter", "xsrc": "dionchu:81:babb02", "ysrc": "dionchu:81:397f1d" }, { "line": { "color": "rgb(68, 170, 192)" }, "meta": { "columnNames": { "x": "A", "y": "C" } }, "mode": "lines", "name": "<b>3mo Basis (ETH)</b><br>correlation 91.80%", "type": "scatter", "xsrc": "dionchu:81:babb02", "ysrc": "dionchu:81:39d25f", "stackgroup": null }, { "line": { "color": "rgb(132, 137, 137)" }, "meta": { "columnNames": { "x": "A", "y": "D" } }, "mode": "lines", "name": "<b>Perp Funding</b><br>correlation 89.74%", "type": "scatter", "xsrc": "dionchu:81:babb02", "ysrc": "dionchu:81:e67c11", "stackgroup": null } ], "frames": [], "layout": { "title": { "text": "DeFi money markets vs. ETH derivatives funding rates" }, "xaxis": { "type": "category", "range": [ 0, 267 ], "autorange": true }, "yaxis": { "range": [ 1.0199999999999996, 30.82 ], "autorange": true }, "autosize": true, "template": { "data": { "bar": [ { "type": "bar", "marker": { "colorbar": { "ticks": "", "outlinewidth": 0 } } } ], "table": [ { "type": "table", "cells": { "fill": { "color": "#EBF0F8" }, "line": { "color": "white" } }, "header": { "fill": { "color": "#C8D4E3" }, "line": { "color": "white" } } } ], "carpet": [ { "type": "carpet", "aaxis": { "gridcolor": "#C8D4E3", "linecolor": "#C8D4E3", "endlinecolor": "#2a3f5f", "minorgridcolor": "#C8D4E3", "startlinecolor": "#2a3f5f" }, "baxis": { "gridcolor": "#C8D4E3", "linecolor": "#C8D4E3", "endlinecolor": "#2a3f5f", "minorgridcolor": "#C8D4E3", "startlinecolor": "#2a3f5f" } } ], "mesh3d": [ { "type": "mesh3d", "colorbar": { "ticks": "", "outlinewidth": 0 } } ], "contour": [ { "type": "contour", "colorbar": { "ticks": "", "outlinewidth": 0 }, "autocolorscale": true } ], "heatmap": [ { "type": "heatmap", "colorbar": { "ticks": "", "outlinewidth": 0 }, "autocolorscale": true } ], "scatter": [ { "type": "scatter", "marker": { "colorbar": { "ticks": "", "outlinewidth": 0 } } } ], "surface": [ { "type": "surface", "colorbar": { "ticks": "", "outlinewidth": 0 } } ], "heatmapgl": [ { "type": "heatmapgl", "colorbar": { "ticks": "", "outlinewidth": 0 } } ], "histogram": [ { "type": "histogram", "marker": { "colorbar": { "ticks": "", "outlinewidth": 0 } } } ], "parcoords": [ { "line": { "colorbar": { "ticks": "", "outlinewidth": 0 } }, "type": "parcoords" } ], "scatter3d": [ { "type": "scatter3d", "marker": { "colorbar": { "ticks": "", "outlinewidth": 0 } } } ], "scattergl": [ { "type": "scattergl", "marker": { "colorbar": { "ticks": "", "outlinewidth": 0 } } } ], "choropleth": [ { "type": "choropleth", "colorbar": { "ticks": "", "outlinewidth": 0 } } ], "scattergeo": [ { "type": "scattergeo", "marker": { "colorbar": { "ticks": "", "outlinewidth": 0 } } } ], "histogram2d": [ { "type": "histogram2d", "colorbar": { "ticks": "", "outlinewidth": 0 }, "autocolorscale": true } ], "scatterpolar": [ { "type": "scatterpolar", "marker": { "colorbar": { "ticks": "", "outlinewidth": 0 } } } ], "contourcarpet": [ { "type": "contourcarpet", "colorbar": { "ticks": "", "outlinewidth": 0 } } ], "scattercarpet": [ { "type": "scattercarpet", "marker": { "colorbar": { "ticks": "", "outlinewidth": 0 } } } ], "scattermapbox": [ { "type": "scattermapbox", "marker": { "colorbar": { "ticks": "", "outlinewidth": 0 } } } ], "scatterpolargl": [ { "type": "scatterpolargl", "marker": { "colorbar": { "ticks": "", "outlinewidth": 0 } } } ], "scatterternary": [ { "type": "scatterternary", "marker": { "colorbar": { "ticks": "", "outlinewidth": 0 } } } ], "histogram2dcontour": [ { "type": "histogram2dcontour", "colorbar": { "ticks": "", "outlinewidth": 0 }, "autocolorscale": true } ] }, "layout": { "geo": { "bgcolor": "white", "showland": true, "lakecolor": "white", "landcolor": "white", "showlakes": true, "subunitcolor": "#C8D4E3" }, "font": { "color": "#2a3f5f" }, "polar": { "bgcolor": "white", "radialaxis": { "ticks": "", "gridcolor": "#EBF0F8", "linecolor": "#EBF0F8" }, "angularaxis": { "ticks": "", "gridcolor": "#EBF0F8", "linecolor": "#EBF0F8" } }, "scene": { "xaxis": { "ticks": "", "gridcolor": "#DFE8F3", "gridwidth": 2, "linecolor": "#EBF0F8", "zerolinecolor": "#EBF0F8", "showbackground": true, "backgroundcolor": "white" }, "yaxis": { "ticks": "", "gridcolor": "#DFE8F3", "gridwidth": 2, "linecolor": "#EBF0F8", "zerolinecolor": "#EBF0F8", "showbackground": true, "backgroundcolor": "white" }, "zaxis": { "ticks": "", "gridcolor": "#DFE8F3", "gridwidth": 2, "linecolor": "#EBF0F8", "zerolinecolor": "#EBF0F8", "showbackground": true, "backgroundcolor": "white" } }, "title": { "x": 0.05 }, "xaxis": { "ticks": "", "gridcolor": "#EBF0F8", "linecolor": "#EBF0F8", "automargin": true, "zerolinecolor": "#EBF0F8", "zerolinewidth": 2 }, "yaxis": { "ticks": "", "gridcolor": "#EBF0F8", "linecolor": "#EBF0F8", "automargin": true, "zerolinecolor": "#EBF0F8", "zerolinewidth": 2 }, "ternary": { "aaxis": { "ticks": "", "gridcolor": "#DFE8F3", "linecolor": "#A2B1C6" }, "baxis": { "ticks": "", "gridcolor": "#DFE8F3", "linecolor": "#A2B1C6" }, "caxis": { "ticks": "", "gridcolor": "#DFE8F3", "linecolor": "#A2B1C6" }, "bgcolor": "white" }, "colorway": [ "#636efa", "#EF553B", "#00cc96", "#ab63fa", "#19d3f3", "#e763fa", "#fecb52", "#ffa15a", "#ff6692", "#b6e880" ], "hovermode": "closest", "colorscale": { "diverging": [ [ 0, "#8e0152" ], [ 0.1, "#c51b7d" ], [ 0.2, "#de77ae" ], [ 0.3, "#f1b6da" ], [ 0.4, "#fde0ef" ], [ 0.5, "#f7f7f7" ], [ 0.6, "#e6f5d0" ], [ 0.7, "#b8e186" ], [ 0.8, "#7fbc41" ], [ 0.9, "#4d9221" ], [ 1, "#276419" ] ], "sequential": [ [ 0, "#0508b8" ], [ 0.0893854748603352, "#1910d8" ], [ 0.1787709497206704, "#3c19f0" ], [ 0.2681564245810056, "#6b1cfb" ], [ 0.3575418994413408, "#981cfd" ], [ 0.44692737430167595, "#bf1cfd" ], [ 0.5363128491620112, "#dd2bfd" ], [ 0.6256983240223464, "#f246fe" ], [ 0.7150837988826816, "#fc67fd" ], [ 0.8044692737430168, "#fe88fc" ], [ 0.8938547486033519, "#fea5fd" ], [ 0.9832402234636871, "#febefe" ], [ 1, "#fec3fe" ] ], "sequentialminus": [ [ 0, "#0508b8" ], [ 0.0893854748603352, "#1910d8" ], [ 0.1787709497206704, "#3c19f0" ], [ 0.2681564245810056, "#6b1cfb" ], [ 0.3575418994413408, "#981cfd" ], [ 0.44692737430167595, "#bf1cfd" ], [ 0.5363128491620112, "#dd2bfd" ], [ 0.6256983240223464, "#f246fe" ], [ 0.7150837988826816, "#fc67fd" ], [ 0.8044692737430168, "#fe88fc" ], [ 0.8938547486033519, "#fea5fd" ], [ 0.9832402234636871, "#febefe" ], [ 1, "#fec3fe" ] ] }, "plot_bgcolor": "white", "paper_bgcolor": "white", "shapedefaults": { "line": { "width": 0 }, "opacity": 0.4, "fillcolor": "#506784" }, "annotationdefaults": { "arrowhead": 0, "arrowcolor": "#506784", "arrowwidth": 1 } }, "themeRef": "PLOTLY_WHITE" } } }, "height": null, "width": null, "user": { "profile_url": "https://chart-studio.plotly.com/~dionchu", "avatar_url": "https://storage.googleapis.com/plotly-prod-profiles/17.jpg", "background_url": "https://storage.googleapis.com/plotly-prod-profiles/bg-5.jpg", "bio": "", "nickname": "", "website": "", "stream_tokens": null, "feature_set_id": null, "csrf_token": null, "date_joined": "2023-10-20 19:36:55", "mapbox_access_tokens": null, "has_password": null, "username": "dionchu", "email": null, "is_active": null, "readonly": null, "is_dash_creator": null, "dash_created_count": null, "is_chart_creator": null, "charts_created_count": null } }, { "creation_time": "2024-03-22T14:17:25.784085Z", "comments": { "results": [], "count": 0 }, "parented": true, "embed_url": "https://chart-studio.plotly.com/~dionchu/80.embed", "fid": "dionchu:80", "filename": "20240322", "filetype": "plot", "img_url": "https://storage.googleapis.com/plotly-prod-images/dionchu/80/9_X8G00EAZ2FX3ZPD00B7Q6XODAKRQ3I.png", "image_urls": { "default": "https://storage.googleapis.com/plotly-prod-images/dionchu/80/2_71JLMBGAJ7MB7HKS693X1X3SK7F1EA.png", "block-thumb": "https://storage.googleapis.com/plotly-prod-images/dionchu/80/8_CHHJIV4WQV2ERBB3B02P6F1SLGCBU8.png", "list-thumb": "https://storage.googleapis.com/plotly-prod-images/dionchu/80/9_X8G00EAZ2FX3ZPD00B7Q6XODAKRQ3I.png" }, "api_urls": { "files": "https://api.plotly.com/v2/files/dionchu:80", "plots": "https://api.plotly.com/v2/plots/dionchu:80", "parent": "https://api.plotly.com/v2/folders/home?user=dionchu" }, "owner": "dionchu", "parent": -1, "preview": "", "referencers": [], "references": [], "title": "", "views": 3, "web_url": "https://chart-studio.plotly.com/~dionchu/80/", "world_readable": true, "date_modified": "2024-03-22T14:17:25.802Z", "stars": { "results": [], "count": 0 }, "collaborators": { "results": [], "count": 0 }, "subfolder_count": null, "refresh_interval": null, "organize_view_url": "https://chart-studio.plotly.com/~dionchu/80/", "current_user_permission": "read", "is_theme": null, "is_template": false, "autosize": true, "caption": "", "figure": { "data": [ { "uid": "e5f816", "meta": { "columnNames": { "x": "C", "y": "B" } }, "mode": "lines", "name": "Clearing Volume - wETH/wstETH", "type": "bar", "xsrc": "dionchu:79:08677e", "ysrc": "dionchu:79:786746", "xaxis": "x", "yaxis": "y2", "marker": { "color": "rgb(92, 58, 214)", "opacity": 1 }, "opacity": 0.5, "stackgroup": null, "orientation": "v" }, { "uid": "fc1e4a", "line": { "color": "rgb(92, 58, 214)" }, "meta": { "columnNames": { "x": "C", "y": "A" } }, "mode": "markers+lines", "name": "Clearing Rate - wETH/wstETH<br>", "type": "scatter", "xsrc": "dionchu:79:08677e", "ysrc": "dionchu:79:e1ebad", "opacity": 1 }, { "uid": "a767bc", "line": { "color": "rgb(92, 58, 214)", "width": 2 }, "meta": { "columnNames": { "x": "C", "y": "D" } }, "mode": "markers+lines", "name": "Clearing Rate - USDC/sDAI", "type": "scatter", "xsrc": "dionchu:79:08677e", "ysrc": "dionchu:79:005407", "xaxis": "x2", "yaxis": "y3", "stackgroup": null, "connectgaps": false }, { "uid": "7f8dba", "meta": { "columnNames": { "x": "C", "y": "E" } }, "mode": "lines", "name": "Clearing Volume - USDC/sDAI", "type": "bar", "xsrc": "dionchu:79:08677e", "ysrc": "dionchu:79:5dda60", "xaxis": "x2", "yaxis": "y4", "marker": { "color": "rgb(92, 58, 214)", "opacity": 1 }, "opacity": 0.5, "stackgroup": null, "orientation": "v" }, { "uid": "d1c0cf", "meta": { "columnNames": { "x": "C", "y": "F" } }, "name": "Clearing Volume - USDC/wstETH", "type": "bar", "xsrc": "dionchu:79:08677e", "ysrc": "dionchu:79:07ac4d", "xaxis": "x2", "yaxis": "y4", "marker": { "color": "rgb(99, 209, 207)", "opacity": 0.75 }, "visible": true, "orientation": "v" }, { "uid": "e60dcb", "meta": { "columnNames": { "x": "C", "y": "G" } }, "mode": "markers+lines", "name": "Clearing Rate - USDC/wstETH", "type": "scatter", "xsrc": "dionchu:79:08677e", "ysrc": "dionchu:79:57e433", "xaxis": "x2", "yaxis": "y3", "marker": { "color": "rgb(99, 209, 207)" }, "orientation": "v" }, { "uid": "c172a0", "line": { "color": "rgb(99, 209, 207)" }, "meta": { "columnNames": { "x": "C", "y": "I" } }, "mode": "markers+lines", "name": "Clearing Rate - wETH/wstETH (12wk)", "type": "scatter", "xsrc": "dionchu:79:08677e", "ysrc": "dionchu:79:63f182", "xaxis": "x", "yaxis": "y", "connectgaps": true }, { "uid": "778fcb", "meta": { "columnNames": { "x": "C", "y": "H" } }, "mode": "lines", "name": "Clearing Volume - wETH/wstETH (12wk)", "type": "bar", "xsrc": "dionchu:79:08677e", "ysrc": "dionchu:79:13a947", "yaxis": "y2", "marker": { "color": "rgb(99, 209, 207)", "opacity": 0.75 }, "stackgroup": null, "orientation": "v" }, { "meta": { "columnNames": { "x": "C", "y": "J" } }, "name": "Clearing Volume - USDC/wSTBT", "type": "bar", "xsrc": "dionchu:79:08677e", "ysrc": "dionchu:79:e077fc", "xaxis": "x2", "yaxis": "y4", "marker": { "color": "rgb(99, 209, 207)", "opacity": 0.5 }, "orientation": "v" }, { "meta": { "columnNames": { "x": "C", "y": "P" } }, "name": "Clearing Volume - wETH/weETH 5mo", "type": "bar", "xsrc": "dionchu:79:08677e", "ysrc": "dionchu:79:b94d3a", "xaxis": "x", "yaxis": "y2", "marker": { "color": "rgb(44, 188, 252)", "opacity": 0.5 }, "orientation": "v" }, { "meta": { "columnNames": { "x": "C", "y": "R" } }, "name": "<b>Clearing Volume - wETH/weETH</b>", "type": "bar", "xsrc": "dionchu:79:08677e", "ysrc": "dionchu:79:0c2d52", "yaxis": "y2", "marker": { "color": "rgb(180, 92, 252)", "opacity": 0.5 }, "orientation": "v" }, { "meta": { "columnNames": { "x": "C", "y": "Q" } }, "mode": "markers+lines", "name": "<b>Clearing Rate - wETH/weETH 5mo</b>", "type": "scatter", "xsrc": "dionchu:79:08677e", "ysrc": "dionchu:79:c2fb18", "yaxis": "y", "marker": { "color": "rgb(44, 188, 252)" }, "orientation": "v" }, { "line": { "width": 2 }, "meta": { "columnNames": { "x": "C", "y": "S" } }, "mode": "markers+lines", "name": "<b>Clearing Rate - wETH/weETH</b>", "type": "scatter", "xsrc": "dionchu:79:08677e", "ysrc": "dionchu:79:14c1cf", "marker": { "color": "rgb(180, 92, 252)" }, "opacity": 1, "stackgroup": null }, { "line": { "color": "rgb(4, 156, 244)" }, "meta": { "columnNames": { "x": "C", "y": "M" } }, "mode": "markers+lines", "name": "Clearing Rate - USDC/wstETH High LTV", "type": "scatter", "xsrc": "dionchu:79:08677e", "ysrc": "dionchu:79:fce36d", "xaxis": "x2", "yaxis": "y3", "connectgaps": true, "orientation": "v" }, { "line": { "color": "rgb(244, 148, 68)" }, "meta": { "columnNames": { "x": "C", "y": "O" } }, "mode": "markers+lines", "name": "<b>Clearing Rate - USDC/wBTC</b>", "type": "scatter", "xsrc": "dionchu:79:08677e", "ysrc": "dionchu:79:098b0f", "xaxis": "x2", "yaxis": "y3", "stackgroup": null, "connectgaps": true }, { "meta": { "columnNames": { "x": "C", "y": "L" } }, "mode": "markers", "name": "Clearing Volume - USDC/wstETH High LTV", "type": "bar", "xsrc": "dionchu:79:08677e", "ysrc": "dionchu:79:ada8f0", "xaxis": "x2", "yaxis": "y4", "marker": { "color": "rgb(4, 156, 244)", "opacity": 0.5 }, "stackgroup": null, "orientation": "v" }, { "meta": { "columnNames": { "x": "C", "y": "N" } }, "mode": "markers+lines", "name": "Clearing Volume - USDC/wBTC", "type": "bar", "xsrc": "dionchu:79:08677e", "ysrc": "dionchu:79:c3ba07", "xaxis": "x2", "yaxis": "y4", "marker": { "color": "rgb(244, 148, 68)" }, "opacity": 0.5, "orientation": "v" } ], "frames": [], "layout": { "title": { "text": "<br>" }, "xaxis": { "side": "bottom", "type": "category", "range": [ 3.255142750704574, 32 ], "ticks": "", "title": { "text": "<br>" }, "anchor": "free", "domain": [ 0.55, 1 ], "showline": false, "autorange": false, "overlaying": false, "showspikes": true, "rangeslider": { "range": [ -0.6703160504028094, 10.670316050402809 ], "yaxis": {}, "yaxis2": {}, "visible": false, "autorange": true } }, "yaxis": { "type": "linear", "range": [ 0.10971069182389953, 16.26103144654088 ], "title": { "text": "<br>" }, "domain": [ 0, 1 ], "showgrid": true, "showline": false, "tickmode": "linear", "autorange": false, "gridcolor": "rgb(238, 238, 238)", "gridwidth": 1, "overlaying": false, "tickformat": "" }, "images": [ { "x": 0.5, "y": 0.5, "layer": "above", "sizex": 1, "sizey": 1, "source": "data:image/png;base64,iVBORw0KGgoAAAANSUhEUgAABdwAAAXcCAYAAAA4NUxkAAAACXBIWXMAAC4jAAAuIwF4pT92AAA1LklEQVR4nOzdPYildxmH4WfCRHSXJbu4EASVhYUQU2hhikQEbZZgtLOZQkSL+LGlFkL6BTttkiKNIBZbiRammT5K0FbQbZLWxtZuLE5ACIr7cc/5n/fsdcGpBub9TTNw7nmYc3JxcTEAAAAAAMCTeWb1AAAAAAAAOAaCOwAAAAAABAR3AAAAAAAICO4AAAAAABAQ3AEAAAAAICC4AwAAAABAQHAHAAAAAICA4A4AAAAAAAHBHQAAAAAAAoI7AAAAAAAEBHcAAAAAAAgI7gAAAAAAEBDcAQAAAAAgILgDAAAAAEBAcAcAAAAAgIDgDgAAAAAAAcEdAAAAAAACgjsAAAAAAAQEdwAAAAAACAjuAAAAAAAQENwBAAAAACAguAMAAAAAQEBwBwAAAACAgOAOAAAAAAABwR0AAAAAAAKCOwAAAAAABAR3AAAAAAAICO4AAAAAABAQ3AEAAAAAICC4AwAAAABAQHAHAAAAAICA4A4AAAAAAAHBHQAAAAAAAoI7AAAAAAAEBHcAAAAAAAgI7gAAAAAAEBDcAQAAAAAgILgDAAAAAEBAcAcAAAAAgIDgDgAAAAAAAcEdAAAAAAACgjsAAAAAAAQEdwAAAAAACAjuAAAAAAAQENwBAAAAACAguAMAAAAAQEBwBwAAAACAgOAOAAAAAAABwR0AAAAAAAKCOwAAAAAABAR3AAAAAAAInK4e8LBOzs4v+xG3ZubVmXlpZl746PX8zFyfmU9d9sMBAAAAAA7cv2bmnzPzj5n528z8fWb+OjN/nJkPLvPBF/fvXOa3z2wmuF+Ck5l5ZWa+MzOvzy64AwAAAADw331yZj7z0etLH/vaBzPz7sz8Zmb+NDMXe112IJ7GfylzY2benJkHM/PezNwdsR0AAAAA4Encml1rfW927fXN2bXYp8rTFNxvzszPZ+bDmbk3M7fXzgEAAAAAOEq3Z9dgP5xdk725ds7+PA3B/ZnZ/WXlwcz8bGaurZ0DAAAAAPBUuDa7Jvtgdo326Hv0sf+AL87M+zPz1uw+/BQAAAAAgP26PrtG+/7smu3ROubg/r2Z+cvMfHnxDgAAAAAAdq32z7Nrt0fpGIP7szPzzsz8amauLN4CAAAAAMB/XJ1du31ndi33qBxbcL8yM7+bmTcW7wAAAAAA4H97Y2Z+P0d2NH1Mwf3KzLw7M6+vHgIAAAAAwP/1jZn5wxxRdD+W4P7szPx2Zr62eggAAAAAAA/t67Nru59YvCNxLMH9lzPz2uoRAAAAAAA8stdm5herRxSOIbh/d2burh4BAAAAAMBjuzu71rtpWw/uX5iZt1ePAAAAAADgib09u+a7WVsO7s/MzK9n5urqIQAAAAAAPLGrs2u+m+3Wmx0+Mz+cmZdXjwAAAAAAIPPy7NrvJm01uN+cmXurRwAAAAAAkLs3M59ePeJxbDW4/2RmbqweAQAAAABA7sbM/HT1iMexxeB+fXafWAsAAAAAwHG6O7sWvClbDO4/mpnnVo8AAAAAAODSPDczP1494lFtMbh/f/UAAAAAAAAu3Q9mYw17U2Nn5pWZeWH1CAAAAAAALt2tmfnq6hGPYmvB/Wz1AAAAAAAA9ubbqwc8iq0F92+tHgAAAAAAwN58c/WAR7Gl4P65mbm9egQAAAAAAHtze2Y+u3rEw9pScH919QAAAAAAAPbuK6sHPKwtBfcvrh4AAAAAAMDebaYNbym4v7h6AAAAAAAAe/fS6gEPa0vB/dbqAQAAAAAA7N3nVw94WFsK7s+vHgAAAAAAwN5tpg1vKbhfWz0AAAAAAIC920wb3lJwv7p6AAAAAAAAe7eZNryl4H66egAAAAAAAHu3mTa8peAOAAAAAAAHS3AHAAAAAICA4A4AAAAAAAHBHQAAAAAAAoI7AAAAAAAEBHcAAAAAAAgI7gAAAAAAEBDcAQAAAAAgILgDAAAAAEBAcAcAAAAAgIDgDgAAAAAAAcEdAAAAAAACgjsAAAAAAAQEdwAAAAAACAjuAAAAAAAQENwBAAAAACAguAMAAAAAQEBwBwAAAACAgOAOAAAAAAABwR0AAAAAAAKCOwAAAAAABAR3AAAAAAAICO4AAAAAABAQ3AEAAAAAICC4AwAAAABAQHAHAAAAAICA4A4AAAAAAAHBHQAAAAAAAoI7AAAAAAAEBHcAAAAAAAgI7gAAAAAAEBDcAQAAAAAgILgDAAAAAEBAcAcAAAAAgIDgDgAAAAAAAcEdAAAAAAACgjsAAAAAAAQEdwAAAAAACAjuAAAAAAAQENwBAAAAACAguAMAAAAAQEBwBwAAAACAgOAOAAAAAAABwR0AAAAAAAKCOwAAAAAABAR3AAAAAAAICO4AAAAAABAQ3AEAAAAAICC4AwAAAABAQHAHAAAAAICA4A4AAAAAAAHBHQAAAAAAAoI7AAAAAAAEBHcAAAAAAAgI7gAAAAAAEBDcAQAAAAAgILgDAAAAAEBAcAcAAAAAgIDgDgAAAAAAAcEdAAAAAAACgjsAAAAAAAQEdwAAAAAACAjuAAAAAAAQENwBAAAAACAguAMAAAAAQEBwBwAAAACAgOAOAAAAAAABwR0AAAAAAAKCOwAAAAAABAR3AAAAAAAICO4AAAAAABAQ3AEAAAAAICC4AwAAAABAQHAHAAAAAICA4A4AAAAAAAHBHQAAAAAAAoI7AAAAAAAEBHcAAAAAAAgI7gAAAAAAEBDcAQAAAAAgILgDAAAAAEBAcAcAAAAAgIDgDgAAAAAAAcEdAAAAAAACgjsAAAAAAAQEdwAAAAAACAjuAAAAAAAQENwBAAAAACAguAMAAAAAQEBwBwAAAACAgOAOAAAAAAABwR0AAAAAAAKCOwAAAAAABAR3AAAAAAAICO4AAAAAABAQ3AEAAAAAICC4AwAAAABAQHAHAAAAAICA4A4AAAAAAAHBHQAAAAAAAoI7AAAAAAAEBHcAAAAAAAgI7gAAAAAAEBDcAQAAAAAgILgDAAAAAEBAcAcAAAAAgIDgDgAAAAAAAcEdAAAAAAACgjsAAAAAAAQEdwAAAAAACAjuAAAAAAAQENwBAAAAACAguAMAAAAAQOB09QDYoov7d1ZPAACA5U7OzldPWMr7AuCYPe2/4+FxuXAHAAAAAICA4A4AAAAAAAHBHQAAAAAAAoI7AAAAAAAEBHcAAAAAAAgI7gAAAAAAEBDcAQAAAAAgILgDAAAAAEBAcAcAAAAAgIDgDgAAAAAAAcEdAAAAAAACgjsAAAAAAAQEdwAAAAAACAjuAAAAAAAQENwBAAAAACAguAMAAAAAQEBwBwAAAACAgOAOAAAAAAABwR0AAAAAAAKCOwAAAAAABAR3AAAAAAAICO4AAAAAABAQ3AEAAAAAICC4AwAAAABAQHAHAAAAAICA4A4AAAAAAAHBHQAAAAAAAoI7AAAAAAAEBHcAAAAAAAgI7gAAAAAAEBDcAQAAAAAgILgDAAAAAEBAcAcAAAAAgIDgDgAAAAAAAcEdAAAAAAACgjsAAAAAAAQEdwAAAAAACAjuAAAAAAAQENwBAAAAACAguAMAAAAAQEBwBwAAAACAgOAOAAAAAAABwR0AAAAAAAKCOwAAAAAABAR3AAAAAAAICO4AAAAAABAQ3AEAAAAAICC4AwAAAABAQHAHAAAAAICA4A4AAAAAAAHBHQAAAAAAAoI7AAAAAAAEBHcAAAAAAAgI7gAAAAAAEBDcAQAAAAAgILgDAAAAAEBAcAcAAAAAgIDgDgAAAAAAAcEdAAAAAAACgjsAAAAAAAQEdwAAAAAACAjuAAAAAAAQENwBAAAAACAguAMAAAAAQEBwBwAAAACAgOAOAAAAAAABwR0AAAAAAAKCOwAAAAAABAR3AAAAAAAICO4AAAAAABAQ3AEAAAAAICC4AwAAAABAQHAHAAAAAICA4A4AAAAAAAHBHQAAAAAAAoI7AAAAAAAEBHcAAAAAAAgI7gAAAAAAEBDcAQAAAAAgILgDAAAAAEBAcAcAAAAAgIDgDgAAAAAAAcEdAAAAAAACgjsAAAAAAAQEdwAAAAAACAjuAAAAAAAQENwBAAAAACAguAMAAAAAQEBwBwAAAACAgOAOAAAAAAABwR0AAAAAAAKCOwAAAAAABAR3AAAAAAAICO4AAAAAABAQ3AEAAAAAICC4AwAAAABAQHAHAAAAAICA4A4AAAAAAAHBHQAAAAAAAoI7AAAAAAAEBHcAAAAAAAgI7gAAAAAAEBDcAQAAAAAgILgDAAAAAEBAcAcAAAAAgIDgDgAAAAAAAcEdAAAAAAACgjsAAAAAAAQEdwAAAAAACAjuAAAAAAAQENwBAAAAACAguAMAAAAAQEBwBwAAAACAgOAOAAAAAAABwR0AAAAAAAKCOwAAAAAABAR3AAAAAAAICO4AAAAAABAQ3AEAAAAAICC4AwAAAABAQHAHAAAAAICA4A4AAAAAAAHBHQAAAAAAAoI7AAAAAAAEBHcAAAAAAAgI7gAAAAAAEBDcAQAAAAAgILgDAAAAAEBAcAcAAAAAgIDgDgAAAAAAAcEdAAAAAAACgjsAAAAAAAQEdwAAAAAACAjuAAAAAAAQENwBAAAAACAguAMAAAAAQEBwBwAAAACAgOAOAAAAAAABwR0AAAAAAAKCOwAAAAAABAR3AAAAAAAICO4AAAAAABAQ3AEAAAAAICC4AwAAAABAQHAHAAAAAICA4A4AAAAAAAHBHQAAAAAAAoI7AAAAAAAEBHcAAAAAAAgI7gAAAAAAEBDcAQAAAAAgILgDAAAAAEBAcAcAAAAAgIDgDgAAAAAAAcEdAAAAAAACgjsAAAAAAAQEdwAAAAAACAjuAAAAAAAQENwBAAAAACAguAMAAAAAQEBwBwAAAACAgOAOAAAAAAABwR0AAAAAAAKCOwAAAAAABAR3AAAAAAAICO4AAAAAABAQ3AEAAAAAICC4AwAAAABAQHAHAAAAAICA4A4AAAAAAAHBHQAAAAAAAoI7AAAAAAAEBHcAAAAAAAgI7gAAAAAAEBDcAQAAAAAgILgDAAAAAEBAcAcAAAAAgIDgDgAAAAAAAcEdAAAAAAACgjsAAAAAAAQEdwAAAAAACJyuHgBbdHJ2vnoCAACwmPcFAMDHuXAHAAAAAICA4A4AAAAAAAHBHQAAAAAAAoI7AAAAAAAEBHcAAAAAAAgI7gAAAAAAEBDcAQAAAAAgILgDAAAAAEBAcAcAAAAAgIDgDgAAAAAAAcEdAAAAAAACgjsAAAAAAAQEdwAAAAAACAjuAAAAAAAQENwBAAAAACAguAMAAAAAQEBwBwAAAACAgOAOAAAAAAABwR0AAAAAAAKCOwAAAAAABAR3AAAAAAAICO4AAAAAABAQ3AEAAAAAICC4AwAAAABAQHAHAAAAAICA4A4AAAAAAAHBHQAAAAAAAoI7AAAAAAAEBHcAAAAAAAgI7gAAAAAAEBDcAQAAAAAgILgDAAAAAEBAcAcAAAAAgIDgDgAAAAAAAcEdAAAAAAACgjsAAAAAAAQEdwAAAAAACAjuAAAAAAAQENwBAAAAACAguAMAAAAAQEBwBwAAAACAgOAOAAAAAAABwR0AAAAAAAKCOwAAAAAABAR3AAAAAAAICO4AAAAAABAQ3AEAAAAAICC4AwAAAABAQHAHAAAAAICA4A4AAAAAAAHBHQAAAAAAAoI7AAAAAAAEBHcAAAAAAAgI7gAAAAAAEBDcAQAAAAAgILgDAAAAAEBAcAcAAAAAgIDgDgAAAAAAAcEdAAAAAAACgjsAAAAAAAQEdwAAAAAACAjuAAAAAAAQENwBAAAAACAguAMAAAAAQEBwBwAAAACAgOAOAAAAAAABwR0AAAAAAAKCOwAAAAAABAR3AAAAAAAICO4AAAAAABAQ3AEAAAAAICC4AwAAAABAQHAHAAAAAICA4A4AAAAAAAHBHQAAAAAAAoI7AAAAAAAEBHcAAAAAAAgI7gAAAAAAEBDcAQAAAAAgILgDAAAAAEBAcAcAAAAAgIDgDgAAAAAAAcEdAAAAAAACgjsAAAAAAAQEdwAAAAAACAjuAAAAAAAQENwBAAAAACAguAMAAAAAQEBwBwAAAACAgOAOAAAAAAABwR0AAAAAAAKCOwAAAAAABAR3AAAAAAAICO4AAAAAABAQ3AEAAAAAICC4AwAAAABAQHAHAAAAAICA4A4AAAAAAAHBHQAAAAAAAoI7AAAAAAAEBHcAAAAAAAgI7gAAAAAAEBDcAQAAAAAgILgDAAAAAEBAcAcAAAAAgIDgDgAAAAAAAcEdAAAAAAACgjsAAAAAAAQEdwAAAAAACAjuAAAAAAAQENwBAAAAACAguAMAAAAAQEBwBwAAAACAgOAOAAAAAAABwR0AAAAAAAKCOwAAAAAABAR3AAAAAAAICO4AAAAAABAQ3AEAAAAAICC4AwAAAABAQHAHAAAAAICA4A4AAAAAAAHBHQAAAAAAAoI7AAAAAAAEBHcAAAAAAAicrh4AAHDoLu7fWT0B4CCdnJ2vngAAcFBcuAMAAAAAQEBwBwAAAACAgOAOAAAAAAABwR0AAAAAAAKCOwAAAAAABAR3AAAAAAAICO4AAAAAABAQ3AEAAAAAICC4AwAAAABAQHAHAAAAAICA4A4AAAAAAAHBHQAAAAAAAoI7AAAAAAAEBHcAAAAAAAgI7gAAAAAAEBDcAQAAAAAgILgDAAAAAEBAcAcAAAAAgIDgDgAAAAAAAcEdAAAAAAACgjsAAAAAAAQEdwAAAAAACAjuAAAAAAAQENwBAAAAACAguAMAAAAAQEBwBwAAAACAgOAOAAAAAAABwR0AAAAAAAKCOwAAAAAABAR3AAAAAAAICO4AAAAAABAQ3AEAAAAAICC4AwAAAABAQHAHAAAAAICA4A4AAAAAAAHBHQAAAAAAAoI7AAAAAAAEBHcAAAAAAAgI7gAAAAAAEBDcAQAAAAAgILgDAAAAAEBAcAcAAAAAgIDgDgAAAAAAAcEdAAAAAAACgjsAAAAAAAQEdwAAAAAACAjuAAAAAAAQENwBAAAAACAguAMAAAAAQEBwBwAAAACAgOAOAAAAAAABwR0AAAAAAAKCOwAAAAAABAR3AAAAAAAICO4AAAAAABAQ3AEAAAAAICC4AwAAAABAQHAHAAAAAICA4A4AAAAAAAHBHQAAAAAAAoI7AAAAAAAEBHcAAAAAAAgI7gAAAAAAEBDcAQAAAAAgILgDAAAAAEBAcAcAAAAAgIDgDgAAAAAAAcEdAAAAAAACgjsAAAAAAAQEdwAAAAAACAjuAAAAAAAQENwBAAAAACAguAMAAAAAQEBwBwAAAACAgOAOAAAAAAABwR0AAAAAAAKCOwAAAAAABAR3AAAAAAAICO4AAAAAABAQ3AEAAAAAICC4AwAAAABAQHAHAAAAAICA4A4AAAAAAAHBHQAAAAAAAoI7AAAAAAAEBHcAAAAAAAgI7gAAAAAAEBDcAQAAAAAgILgDAAAAAEBAcAcAAAAAgIDgDgAAAAAAAcEdAAAAAAACgjsAAAAAAAQEdwAAAAAACAjuAAAAAAAQENwBAAAAACAguAMAAAAAQEBwBwAAAACAgOAOAAAAAAABwR0AAAAAAAKCOwAAAAAABAR3AAAAAAAICO4AAAAAABAQ3AEAAAAAICC4AwAAAABAQHAHAAAAAICA4A4AAAAAAAHBHQAAAAAAAoI7AAAAAAAEBHcAAAAAAAgI7gAAAAAAEBDcAQAAAAAgILgDAAAAAEBAcAcAAAAAgIDgDgAAAAAAAcEdAAAAAAACgjsAAAAAAAQEdwAAAAAACAjuAAAAAAAQENwBAAAAACAguAMAAAAAQEBwBwAAAACAgOAOAAAAAAABwR0AAAAAAAKCOwAAAAAABAR3AAAAAAAICO4AAAAAABAQ3AEAAAAAICC4AwAAAABAQHAHAAAAAICA4A4AAAAAAAHBHQAAAAAAAoI7AAAAAAAEBHcAAAAAAAgI7gAAAAAAEBDcAQAAAAAgILgDAAAAAEBAcAcAAAAAgIDgDgAAAAAAAcEdAAAAAAACgjsAAAAAAAQEdwAAAAAACAjuAAAAAAAQENwBAAAAACAguAMAAAAAQEBwBwAAAACAgOAOAAAAAAABwR0AAAAAAAKCOwAAAAAABAR3AAAAAAAICO4AAAAAABAQ3AEAAAAAICC4AwAAAABAQHAHAAAAAICA4A4AAAAAAAHBHQAAAAAAAoI7AAAAAAAEBHcAAAAAAAgI7gAAAAAAEBDcAQAAAAAgILgDAAAAAEBAcAcAAAAAgIDgDgAAAAAAAcEdAAAAAAACgjsAAAAAAAQEdwAAAAAACAjuAAAAAAAQENwBAAAAACAguAMAAAAAQEBwBwAAAACAgOAOAAAAAAABwR0AAAAAAAKCOwAAAAAABAR3AAAAAAAICO4AAAAAABAQ3AEAAAAAICC4AwAAAABAQHAHAAAAAICA4A4AAAAAAAHBHQAAAAAAAoI7AAAAAAAETlcPAAA4dCdn56snAAAAsAEu3AEAAAAAICC4AwAAAABAQHAHAAAAAICA4A4AAAAAAAHBHQAAAAAAAoI7AAAAAAAEBHcAAAAAAAgI7gAAAAAAEBDcAQAAAAAgILgDAAAAAEBAcAcAAAAAgIDgDgAAAAAAAcEdAAAAAAACgjsAAAAAAAQEdwAAAAAACAjuAAAAAAAQENwBAAAAACAguAMAAAAAQEBwBwAAAACAgOAOAAAAAAABwR0AAAAAAAKCOwAAAAAABAR3AAAAAAAICO4AAAAAABAQ3AEAAAAAICC4AwAAAABAQHAHAAAAAICA4A4AAAAAAAHBHQAAAAAAAoI7AAAAAAAEBHcAAAAAAAgI7gAAAAAAEBDcAQAAAAAgILgDAAAAAEBAcAcAAAAAgIDgDgAAAAAAAcEdAAAAAAACgjsAAAAAAAQEdwAAAAAACAjuAAAAAAAQENwBAAAAACAguAMAAAAAQEBwBwAAAACAgOAOAAAAAAABwR0AAAAAAAKCOwAAAAAABAR3AAAAAAAICO4AAAAAABAQ3AEAAAAAICC4AwAAAABAQHAHAAAAAICA4A4AAAAAAAHBHQAAAAAAAoI7AAAAAAAEBHcAAAAAAAgI7gAAAAAAEBDcAQAAAAAgILgDAAAAAEBAcAcAAAAAgIDgDgAAAAAAAcEdAAAAAAACgjsAAAAAAAQEdwAAAAAACAjuAAAAAAAQENwBAAAAACAguAMAAAAAQEBwBwAAAACAgOAOAAAAAAABwR0AAAAAAAKCOwAAAAAABAR3AAAAAAAICO4AAAAAABAQ3AEAAAAAICC4AwAAAABAQHAHAAAAAICA4A4AAAAAAAHBHQAAAAAAAoI7AAAAAAAEBHcAAAAAAAgI7gAAAAAAEBDcAQAAAAAgILgDAAAAAEBAcAcAAAAAgIDgDgAAAAAAAcEdAAAAAAACgjsAAAAAAAQEdwAAAAAACAjuAAAAAAAQENwBAAAAACAguAMAAAAAQEBwBwAAAACAgOAOAAAAAAABwR0AAAAAAAKCOwAAAAAABAR3AAAAAAAICO4AAAAAABAQ3AEAAAAAICC4AwAAAABAQHAHAAAAAICA4A4AAAAAAAHBHQAAAAAAAoI7AAAAAAAEBHcAAAAAAAgI7gAAAAAAEBDcAQAAAAAgILgDAAAAAEBAcAcAAAAAgIDgDgAAAAAAAcEdAAAAAAACgjsAAAAAAAQEdwAAAAAACAjuAAAAAAAQENwBAAAAACAguAMAAAAAQEBwBwAAAACAgOAOAAAAAAABwR0AAAAAAAKCOwAAAAAABAR3AAAAAAAICO4AAAAAABAQ3AEAAAAAICC4AwAAAABAQHAHAAAAAICA4A4AAAAAAIHT1QMAAA7Nxf07qycAHKSTs/PVEwAADpoLdwAAAAAACAjuAAAAAAAQENwBAAAAACAguAMAAAAAQEBwBwAAAACAgOAOAAAAAAABwR0AAAAAAAKCOwAAAAAABAR3AAAAAAAICO4AAAAAABAQ3AEAAAAAICC4AwAAAABAQHAHAAAAAICA4A4AAAAAAAHBHQAAAAAAAoI7AAAAAAAEBHcAAAAAAAgI7gAAAAAAEBDcAQAAAAAgILgDAAAAAEBAcAcAAAAAgIDgDgAAAAAAAcEdAAAAAAACgjsAAAAAAAQEdwAAAAAACAjuAAAAAAAQENwBAAAAACAguAMAAAAAQEBwBwAAAACAgOAOAAAAAAABwR0AAAAAAAKCOwAAAAAABAR3AAAAAAAICO4AAAAAABAQ3AEAAAAAICC4AwAAAABAQHAHAAAAAICA4A4AAAAAAAHBHQAAAAAAAoI7AAAAAAAEBHcAAAAAAAgI7gAAAAAAEBDcAQAAAAAgILgDAAAAAEBAcAcAAAAAgIDgDgAAAAAAAcEdAAAAAAACgjsAAAAAAAQEdwAAAAAACAjuAAAAAAAQENwBAAAAACAguAMAAAAAQEBwBwAAAACAgOAOAAAAAAABwR0AAAAAAAKCOwAAAAAABAR3AAAAAAAICO4AAAAAABAQ3AEAAAAAICC4AwAAAABAQHAHAAAAAICA4A4AAAAAAAHBHQAAAAAAAoI7AAAAAAAEBHcAAAAAAAgI7gAAAAAAEBDcAQAAAAAgILgDAAAAAEBAcAcAAAAAgIDgDgAAAAAAAcEdAAAAAAACgjsAAAAAAAQEdwAAAAAACAjuAAAAAAAQENwBAAAAACAguAMAAAAAQEBwBwAAAACAgOAOAAAAAAABwR0AAAAAAAKCOwAAAAAABAR3AAAAAAAICO4AAAAAABAQ3AEAAAAAICC4AwAAAABAQHAHAAAAAICA4A4AAAAAAAHBHQAAAAAAAoI7AAAAAAAEBHcAAAAAAAgI7gAAAAAAEBDcAQAAAAAgILgDAAAAAEBAcAcAAAAAgIDgDgAAAAAAAcEdAAAAAAACgjsAAAAAAAQEdwAAAAAACAjuAAAAAAAQENwBAAAAACAguAMAAAAAQEBwBwAAAACAgOAOAAAAAAABwR0AAAAAAAKCOwAAAAAABAR3AAAAAAAICO4AAAAAABAQ3AEAAAAAICC4AwAAAABAQHAHAAAAAICA4A4AAAAAAAHBHQAAAAAAAoI7AAAAAAAEBHcAAAAAAAgI7gAAAAAAEBDcAQAAAAAgILgDAAAAAEBAcAcAAAAAgIDgDgAAAAAAAcEdAAAAAAACgjsAAAAAAAQEdwAAAAAACAjuAAAAAAAQENwBAAAAACAguAMAAAAAQEBwBwAAAACAgOAOAAAAAAABwR0AAAAAAAKCOwAAAAAABAR3AAAAAAAICO4AAAAAABAQ3AEAAAAAICC4AwAAAABAQHAHAAAAAICA4A4AAAAAAAHBHQAAAAAAAoI7AAAAAAAEBHcAAAAAAAgI7gAAAAAAEBDcAQAAAAAgILgDAAAAAEBAcAcAAAAAgIDgDgAAAAAAAcEdAAAAAAACgjsAAAAAAAQEdwAAAAAACAjuAAAAAAAQENwBAAAAACAguAMAAAAAQEBwBwAAAACAgOAOAAAAAAABwR0AAAAAAAKCOwAAAAAABAR3AAAAAAAICO4AAAAAABAQ3AEAAAAAICC4AwAAAABAQHAHAAAAAICA4A4AAAAAAAHBHQAAAAAAAoI7AAAAAAAEBHcAAAAAAAgI7gAAAAAAEBDcAQAAAAAgILgDAAAAAEBAcAcAAAAAgIDgDgAAAAAAAcEdAAAAAAACgjsAAAAAAAQEdwAAAAAACAjuAAAAAAAQENwBAAAAACAguAMAAAAAQEBwBwAAAACAgOAOAAAAAAABwR0AAAAAAAKCOwAAAAAABAR3AAAAAAAICO4AAAAAABAQ3AEAAAAAICC4AwAAAABAQHAHAAAAAIDA6eoBAACH5uTsfPUEAAAANsiFOwAAAAAABAR3AAAAAAAICO4AAAAAABAQ3AEAAAAAICC4AwAAAABAQHAHAAAAAICA4A4AAAAAAAHBHQAAAAAAAoI7AAAAAAAEBHcAAAAAAAgI7gAAAAAAEBDcAQAAAAAgILgDAAAAAEBAcAcAAAAAgIDgDgAAAAAAAcEdAAAAAAACgjsAAAAAAAQEdwAAAAAACAjuAAAAAAAQENwBAAAAACAguAMAAAAAQEBwBwAAAACAgOAOAAAAAAABwR0AAAAAAAKCOwAAAAAABAR3AAAAAAAICO4AAAAAABAQ3AEAAAAAICC4AwAAAABAQHAHAAAAAICA4A4AAAAAAAHBHQAAAAAAAoI7AAAAAAAEBHcAAAAAAAgI7gAAAAAAEBDcAQAAAAAgILgDAAAAAEBAcAcAAAAAgIDgDgAAAAAAAcEdAAAAAAACgjsAAAAAAAQEdwAAAAAACAjuAAAAAAAQENwBAAAAACAguAMAAAAAQEBwBwAAAACAgOAOAAAAAAABwR0AAAAAAAKCOwAAAAAABAR3AAAAAAAICO4AAAAAABAQ3AEAAAAAICC4AwAAAABAQHAHAAAAAICA4A4AAAAAAAHBHQAAAAAAAoI7AAAAAAAEBHcAAAAAAAgI7gAAAAAAEBDcAQAAAAAgILgDAAAAAEBAcAcAAAAAgIDgDgAAAAAAAcEdAAAAAAACgjsAAAAAAAQEdwAAAAAACAjuAAAAAAAQENwBAAAAACAguAMAAAAAQEBwBwAAAACAgOAOAAAAAAABwR0AAAAAAAKCOwAAAAAABAR3AAAAAAAICO4AAAAAABAQ3AEAAAAAICC4AwAAAABAQHAHAAAAAICA4A4AAAAAAAHBHQAAAAAAAoI7AAAAAAAEBHcAAAAAAAgI7gAAAAAAEBDcAQAAAAAgILgDAAAAAEBAcAcAAAAAgIDgDgAAAAAAAcEdAAAAAAACgjsAAAAAAAQEdwAAAAAACAjuAAAAAAAQENwBAAAAACAguAMAAAAAQEBwBwAAAACAgOAOAAAAAAABwR0AAAAAAAKCOwAAAAAABAR3AAAAAAAICO4AAAAAABAQ3AEAAAAAICC4AwAAAABAQHAHAAAAAICA4A4AAAAAAAHBHQAAAAAAAoI7AAAAAAAEBHcAAAAAAAgI7gAAAAAAEBDcAQAAAAAgILgDAAAAAEBAcAcAAAAAgIDgDgAAAAAAAcEdAAAAAAACgjsAAAAAAAQEdwAAAAAACAjuAAAAAAAQENwBAAAAACAguAMAAAAAQEBwBwAAAACAgOAOAAAAAAABwR0AAAAAAAKCOwAAAAAABAR3AAAAAAAICO4AAAAAABAQ3AEAAAAAIHC6egAAwKG5uH9n9QSAg3Rydr56AgDAQXPhDgAAAAAAAcEdAAAAAAACgjsAAAAAAAQEdwAAAAAACAjuAAAAAAAQENwBAAAAACAguAMAAAAAQEBwBwAAAACAgOAOAAAAAAABwR0AAAAAAAKCOwAAAAAABAR3AAAAAAAICO4AAAAAABAQ3AEAAAAAICC4AwAAAABAQHAHAAAAAICA4A4AAAAAAAHBHQAAAAAAAoI7AAAAAAAEBHcAAAAAAAgI7gAAAAAAEBDcAQAAAAAgILgDAAAAAEBAcAcAAAAAgIDgDgAAAAAAAcEdAAAAAAACgjsAAAAAAAQEdwAAAAAACAjuAAAAAAAQENwBAAAAACAguAMAAAAAQEBwBwAAAACAgOAOAAAAAAABwR0AAAAAAAKCOwAAAAAABAR3AAAAAAAICO4AAAAAABAQ3AEAAAAAICC4AwAAAABAQHAHAAAAAICA4A4AAAAAAAHBHQAAAAAAAoI7AAAAAAAEBHcAAAAAAAgI7gAAAAAAEBDcAQAAAAAgILgDAAAAAEBAcAcAAAAAgIDgDgAAAAAAAcEdAAAAAAACgjsAAAAAAAQEdwAAAAAACAjuAAAAAAAQENwBAAAAACAguAMAAAAAQEBwBwAAAACAgOAOAAAAAAABwR0AAAAAAAKCOwAAAAAABAR3AAAAAAAICO4AAAAAABAQ3AEAAAAAICC4AwAAAABAQHAHAAAAAICA4A4AAAAAAAHBHQAAAAAAAoI7AAAAAAAEBHcAAAAAAAgI7gAAAAAAEBDcAQAAAAAgILgDAAAAAEBAcAcAAAAAgIDgDgAAAAAAAcEdAAAAAAACgjsAAAAAAAQEdwAAAAAACAjuAAAAAAAQENwBAAAAACAguAMAAAAAQEBwBwAAAACAgOAOAAAAAAABwR0AAAAAAAKCOwAAAAAABAR3AAAAAAAICO4AAAAAABAQ3AEAAAAAICC4AwAAAABAQHAHAAAAAICA4A4AAAAAAAHBHQAAAAAAAoI7AAAAAAAEBHcAAAAAAAgI7gAAAAAAEBDcAQAAAAAgILgDAAAAAEBAcAcAAAAAgIDgDgAAAAAAAcEdAAAAAAACgjsAAAAAAAQEdwAAAAAACAjuAAAAAAAQENwBAAAAACAguAMAAAAAQEBwBwAAAACAgOAOAAAAAAABwR0AAAAAAAKCOwAAAAAABAR3AAAAAAAICO4AAAAAABAQ3AEAAAAAICC4AwAAAABAQHAHAAAAAICA4A4AAAAAAAHBHQAAAAAAAoI7AAAAAAAEBHcAAAAAAAgI7gAAAAAAEBDcAQAAAAAgILgDAAAAAEBAcAcAAAAAgIDgDgAAAAAAAcEdAAAAAAACgjsAAAAAAAQEdwAAAAAACAjuAAAAAAAQENwBAAAAACAguAMAAAAAQEBwBwAAAACAgOAOAAAAAAABwR0AAAAAAAKCOwAAAAAABAR3AAAAAAAICO4AAAAAABAQ3AEAAAAAICC4AwAAAABAQHAHAAAAAICA4A4AAAAAAAHBHQAAAAAAAoI7AAAAAAAEBHcAAAAAAAgI7gAAAAAAEBDcAQAAAAAgILgDAAAAAEBAcAcAAAAAgIDgDgAAAAAAAcEdAAAAAAACgjsAAAAAAAQEdwAAAAAACAjuAAAAAAAQENwBAAAAACAguAMAAAAAQEBwBwAAAACAgOAOAAAAAAABwR0AAAAAAAKCOwAAAAAABAR3AAAAAAAICO4AAAAAABAQ3AEAAAAAICC4AwAAAABAQHAHAAAAAICA4A4AAAAAAAHBHQAAAAAAAoI7AAAAAAAEBHcAAAAAAAgI7gAAAAAAEBDcAQAAAAAgILgDAAAAAEBAcAcAAAAAgIDgDgAAAAAAAcEdAAAAAAACgjsAAAAAAAQEdwAAAAAACAjuAAAAAAAQENwBAAAAACAguAMAAAAAQEBwBwAAAACAgOAOAAAAAAABwR0AAAAAAAKCOwAAAAAABAR3AAAAAAAICO4AAAAAABA4XT0AAODQnJydr54AAADABrlwBwAAAACAgOAOAAAAAAABwR0AAAAAAAKCOwAAAAAABAR3AAAAAAAICO4AAAAAABAQ3AEAAAAAICC4AwAAAABAQHAHAAAAAICA4A4AAAAAAAHBHQAAAAAAAoI7AAAAAAAEBHcAAAAAAAgI7gAAAAAAEBDcAQAAAAAgILgDAAAAAEBAcAcAAAAAgIDgDgAAAAAAAcEdAAAAAAACgjsAAAAAAAQEdwAAAAAACAjuAAAAAAAQENwBAAAAACAguAMAAAAAQEBwBwAAAACAgOAOAAAAAAABwR0AAAAAAAKCOwAAAAAABAR3AAAAAAAICO4AAAAAABAQ3AEAAAAAICC4AwAAAABAQHAHAAAAAICA4A4AAAAAAAHBHQAAAAAAAoI7AAAAAAAEBHcAAAAAAAgI7gAAAAAAEBDcAQAAAAAgILgDAAAAAEBAcAcAAAAAgIDgDgAAAPDv9u7Y1csqAOP4E/Un9AdY2NDU0CAtzo3RHxA0FOQeBUJLU1FtCZGFjUGTRIubRS41FJJB3LKaJAlRUxBvt+HVMbz3+vg7nvd+PnD2h3f8vnAOABQI7gAAAAAAUCC4AwAAAABAgeAOAAAAAAAFgjsAAAAAABQI7gAAAAAAUCC4AwAAAABAgeAOAAAAAAAFgjsAAAAAABQI7gAAAAAAUCC4AwAAAABAgeAOAAAAAAAFgjsAAAAAABQI7gAAAAAAUCC4AwAAAABAgeAOAAAAAAAFgjsAAAAAABQI7gAAAAAAUCC4AwAAAABAgeAOAAAAAAAFgjsAAAAAABQI7gAAAAAAUCC4AwAAAABAgeAOAAAAAAAFgjsAAAAAABQI7gAAAAAAUCC4AwAAAABAgeAOAAAAAAAFgjsAAAAAABQI7gAAAAAAUCC4AwAAAABAgeAOAAAAAAAFgjsAAAAAABQI7gAAAAAAUCC4AwAAAABAgeAOAAAAAAAFgjsAAAAAABQI7gAAAAAAUCC4AwAAAABAgeAOAAAAAAAFgjsAAAAAABQI7gAAAAAAUCC4AwAAAABAgeAOAAAAAAAFgjsAAAAAABQI7gAAAAAAUCC4AwAAAABAgeAOAAAAAAAFgjsAAAAAABQI7gAAAAAAUCC4AwAAAABAgeAOAAAAAAAFgjsAAAAAABQI7gAAAAAAUCC4AwAAAABAgeAOAAAAAAAFgjsAAAAAABQI7gAAAAAAUCC4AwAAAABAgeAOAAAAAAAFgjsAAAAAABQI7gAAAAAAUCC4AwAAAABAgeAOAAAAAAAFgjsAAAAAABQI7gAAAAAAUCC4AwAAAABAgeAOAAAAAAAFgjsAAAAAABQI7gAAAAAAUCC4AwAAAABAgeAOAAAAAAAFMwX37dEDAAAAAADYuNujB+zWTMH9+ugBAAAAAABs3D+jB+zWTMH92ugBAAAAAABs3DRteKbgfmn0AAAAAAAANm6aNjxTcP999AAAAAAAADbuj9EDdmum4P7z6AEAAAAAAGzchdEDdmum4P7D6AEAAAAAAGzcNG14puB+bvQAAAAAAAA2bpo2PFNw/zPJ1ugRAAAAAABszFaWNjyFmYJ7knw5egAAAAAAABvz1egBezFbcP989AAAAAAAADbmi9ED9mK24H4uyS+jRwAAAAAA8MBdTPLN6BF7MVtwT5JTowcAAAAAAPDAnUzy7+gRezFjcD+R5OroEQAAAAAAPDBXk3w4esRezRjcr2SJ7gAAAAAArNOJLC14KjMG9yT5IBN+bAAAAAAA7ulKkvdHj9iPWYP7X0mOjx4BAAAAAEDd8SSXR4/Yj1mDe5J8lOS70SMAAAAAAKj5Pkv7ndLMwX07yUtJboweAgAAAADAfbuRpflujx6yXzMH9yS5kOTY6BEAAAAAANy3Y0l+Gj3ifswe3JPksySfjh4BAAAAAMC+fZKl9U5tDcE9SV5Lcmb0CAAAAAAA9uxMVnKTyVqC+60kLyQ5O3gHAAAAAAC7dzZL2701eEfFWoJ7slyo/3yS06OHAAAAAABwT6ezNN0bo4e0rCm4J8nNJC8mOTl6CAAAAAAA/+vjLC335ughTWsL7kmyneSVJC9nRX9GAAAAAABW4EaWdvtqlpa7KmsM7nedSnIkyY+DdwAAAAAAsLTaI1na7SqtObgnyfkkzyZ5I8n1wVsAAAAAAA6i60nezNJqzw/e8kCtPbgnye0k7yY5nOS9JNfGzgEAAAAAOBCuZWmyh5O8k6XVrtpBCO53XUryepJDSd5KsjV0DQAAAADAOm1labCHsjTZS0PXbNBBCu53/Z3k7SRPJTma5ESSiyMHAQAAAABM7mKW1no0S3t9O0uLPVAeGz1goJ0kX985SfJkkueSPJPk6SRPJHn8znl0xEAAAAAAgIfIdpLLd85vSS5keQj12yS/Dtz10HhkZ2dn9AYAAAAAAJjeQbxSBgAAAAAA6gR3AAAAAAAoENwBAAAAAKBAcAcAAAAAgALBHQAAAAAACgR3AAAAAAAoENwBAAAAAKBAcAcAAAAAgALBHQAAAAAACgR3AAAAAAAoENwBAAAAAKBAcAcAAAAAgALBHQAAAAAACgR3AAAAAAAoENwBAAAAAKBAcAcAAAAAgALBHQAAAAAACgR3AAAAAAAoENwBAAAAAKBAcAcAAAAAgALBHQAAAAAACgR3AAAAAAAoENwBAAAAAKBAcAcAAAAAgALBHQAAAAAACgR3AAAAAAAoENwBAAAAAKBAcAcAAAAAgALBHQAAAAAACgR3AAAAAAAoENwBAAAAAKBAcAcAAAAAgALBHQAAAAAACgR3AAAAAAAoENwBAAAAAKBAcAcAAAAAgALBHQAAAAAACgR3AAAAAAAoENwBAAAAAKBAcAcAAAAAgALBHQAAAAAACgR3AAAAAAAoENwBAAAAAKBAcAcAAAAAgALBHQAAAAAACgR3AAAAAAAoENwBAAAAAKBAcAcAAAAAgALBHQAAAAAACgR3AAAAAAAoENwBAAAAAKDgP46JziHWmXq4AAAAAElFTkSuQmCC", "visible": false, "xanchor": "center", "yanchor": "middle" } ], "legend": { "x": 0.37689872425790677, "y": 2.735632183908046, "valign": "top", "xanchor": "right", "yanchor": "bottom", "itemsizing": "trace", "traceorder": "normal", "orientation": "h" }, "xaxis2": { "side": "bottom", "type": "category", "range": [ 0.3765865450280672, 32 ], "title": { "text": "<br>" }, "anchor": "free", "domain": [ 0, 0.45 ], "autorange": false, "overlaying": false, "showspikes": false }, "yaxis2": { "side": "right", "type": "linear", "range": [ -9.826567562416649, 1016.588526777206 ], "title": { "text": "ETH Volume" }, "domain": [ 0, 1 ], "showgrid": false, "autorange": false, "overlaying": "y" }, "yaxis3": { "side": "left", "type": "linear", "range": [ -0.0756603773584906, 13 ], "title": { "text": "Clearing Rate" }, "anchor": "x2", "domain": [ 0, 1 ], "showgrid": true, "zeroline": false, "autorange": false, "overlaying": false, "zerolinecolor": "rgb(234, 234, 234)", "zerolinewidth": 1 }, "yaxis4": { "side": "right", "type": "linear", "range": [ -37735.849056603765, 3000000 ], "title": { "text": "USDC Volume" }, "anchor": "x2", "showgrid": false, "showline": false, "zeroline": false, "autorange": false, "overlaying": "y3" }, "barmode": "stack", "autosize": true, "dragmode": "pan", "showlegend": false, "annotations": [] } }, "height": null, "width": null, "user": { "profile_url": "https://chart-studio.plotly.com/~dionchu", "avatar_url": "https://storage.googleapis.com/plotly-prod-profiles/17.jpg", "background_url": "https://storage.googleapis.com/plotly-prod-profiles/bg-5.jpg", "bio": "", "nickname": "", "website": "", "stream_tokens": null, "feature_set_id": null, "csrf_token": null, "date_joined": "2023-10-20 19:36:55", "mapbox_access_tokens": null, "has_password": null, "username": "dionchu", "email": null, "is_active": null, "readonly": null, "is_dash_creator": null, "dash_created_count": null, "is_chart_creator": null, "charts_created_count": null } }, { "creation_time": "2024-03-22T13:45:15.239086Z", "comments": { "results": [], "count": 0 }, "parented": true, "embed_url": "https://chart-studio.plotly.com/~alebustam/20.embed", "fid": "alebustam:20", "filename": "Prod_divisiones_porcentaje", "filetype": "plot", "img_url": "https://storage.googleapis.com/plotly-prod-images/alebustam/20/9_C9OWEJQEQP0IKZ3IPM0A2757ZLJZ03.png", "image_urls": { "default": "https://storage.googleapis.com/plotly-prod-images/alebustam/20/2_ZINS4RKP8X044M7ZUJBVXBNZ4VDPYT.png", "block-thumb": "https://storage.googleapis.com/plotly-prod-images/alebustam/20/8_NYSK1ANL7RH94YPOZFXBU5XLWQGO81.png", "list-thumb": "https://storage.googleapis.com/plotly-prod-images/alebustam/20/9_C9OWEJQEQP0IKZ3IPM0A2757ZLJZ03.png" }, "api_urls": { "files": "https://api.plotly.com/v2/files/alebustam:20", "plots": "https://api.plotly.com/v2/plots/alebustam:20", "parent": "https://api.plotly.com/v2/folders/home?user=alebustam" }, "owner": "alebustam", "parent": -1, "preview": "", "referencers": [], "references": [], "title": "", "views": 16, "web_url": "https://chart-studio.plotly.com/~alebustam/20/", "world_readable": true, "date_modified": "2024-03-22T13:45:15.256Z", "stars": { "results": [], "count": 0 }, "collaborators": { "results": [], "count": 0 }, "subfolder_count": null, "refresh_interval": null, "organize_view_url": "https://chart-studio.plotly.com/~alebustam/20/", "current_user_permission": "read", "is_theme": null, "is_template": null, "autosize": true, "caption": "", "figure": { "data": [ { "name": "División Comercio internacional, integración e infraestructura", "type": "bar", "xsrc": "alebustam:19:da7a84", "ysrc": "alebustam:19:ece696", "marker": { "color": "#104E7F" }, "hovertemplatesrc": "alebustam:19:ea9767" }, { "name": "División Producción e Innovación", "type": "bar", "xsrc": "alebustam:19:09eba3", "ysrc": "alebustam:19:bcc7d7", "marker": { "color": "#8D29E1" }, "hovertemplatesrc": "alebustam:19:5ba719" }, { "name": "División Políticas macroeconómicas y crecimiento", "type": "bar", "xsrc": "alebustam:19:5f9bf2", "ysrc": "alebustam:19:0cce84", "marker": { "color": "#F50D2D" }, "hovertemplatesrc": "alebustam:19:070ee8" }, { "name": "División Desarrollo social e igualdad", "type": "bar", "xsrc": "alebustam:19:34e7ed", "ysrc": "alebustam:19:dbfc9f", "marker": { "color": "#060DF7" }, "hovertemplatesrc": "alebustam:19:1ffade" }, { "name": "División Igualdad de género y autonomía de las mujeres", "type": "bar", "xsrc": "alebustam:19:a00c89", "ysrc": "alebustam:19:6509d8", "marker": { "color": "#E999FF" }, "hovertemplatesrc": "alebustam:19:8c4325" }, { "name": "División Población y desarrollo", "type": "bar", "xsrc": "alebustam:19:3be80c", "ysrc": "alebustam:19:c29cfe", "marker": { "color": "#FFC300" }, "hovertemplatesrc": "alebustam:19:044f56" }, { "name": "División Desarrollo sostenible y asentamientos humanos", "type": "bar", "xsrc": "alebustam:19:11ceb3", "ysrc": "alebustam:19:e85d7b", "marker": { "color": "#88FF01" }, "hovertemplatesrc": "alebustam:19:9a88da" }, { "name": "División Recursos naturales", "type": "bar", "xsrc": "alebustam:19:6fd291", "ysrc": "alebustam:19:5f583f", "marker": { "color": "#8A4B2E" }, "hovertemplatesrc": "alebustam:19:9c077a" }, { "name": "División Planificación y gestión pública para el desarrollo", "type": "bar", "xsrc": "alebustam:19:d7f949", "ysrc": "alebustam:19:7ffff2", "marker": { "color": "#F3FA0B" }, "hovertemplatesrc": "alebustam:19:c29ac7" }, { "name": "División Estadísticas", "type": "bar", "xsrc": "alebustam:19:d7d24b", "ysrc": "alebustam:19:4831cf", "marker": { "color": "#FF7012" }, "hovertemplatesrc": "alebustam:19:fcd63d" } ], "layout": { "title": { "text": "Porcentaje de productos por división" }, "xaxis": { "title": { "text": "Producto" } }, "yaxis": { "title": { "text": "Porcentaje" } }, "barmode": "stack", "autosize": true, "template": { "data": { "bar": [ { "type": "bar", "marker": { "line": { "color": "#E5ECF6", "width": 0.5 }, "pattern": { "size": 10, "fillmode": "overlay", "solidity": 0.2 } }, "error_x": { "color": "#2a3f5f" }, "error_y": { "color": "#2a3f5f" } } ], "pie": [ { "type": "pie", "automargin": true } ], "table": [ { "type": "table", "cells": { "fill": { "color": "#EBF0F8" }, "line": { "color": "white" } }, "header": { "fill": { "color": "#C8D4E3" }, "line": { "color": "white" } } } ], "carpet": [ { "type": "carpet", "aaxis": { "gridcolor": "white", "linecolor": "white", "endlinecolor": "#2a3f5f", "minorgridcolor": "white", "startlinecolor": "#2a3f5f" }, "baxis": { "gridcolor": "white", "linecolor": "white", "endlinecolor": "#2a3f5f", "minorgridcolor": "white", "startlinecolor": "#2a3f5f" } } ], "mesh3d": [ { "type": "mesh3d", "colorbar": { "ticks": "", "outlinewidth": 0 } } ], "contour": [ { "type": "contour", "colorbar": { "ticks": "", "outlinewidth": 0 }, "colorscale": [ [ 0.0, "#0d0887" ], [ 0.1111111111111111, "#46039f" ], [ 0.2222222222222222, "#7201a8" ], [ 0.3333333333333333, "#9c179e" ], [ 0.4444444444444444, "#bd3786" ], [ 0.5555555555555556, "#d8576b" ], [ 0.6666666666666666, "#ed7953" ], [ 0.7777777777777778, "#fb9f3a" ], [ 0.8888888888888888, "#fdca26" ], [ 1.0, "#f0f921" ] ] } ], "heatmap": [ { "type": "heatmap", "colorbar": { "ticks": "", "outlinewidth": 0 }, "colorscale": [ [ 0.0, "#0d0887" ], [ 0.1111111111111111, "#46039f" ], [ 0.2222222222222222, "#7201a8" ], [ 0.3333333333333333, "#9c179e" ], [ 0.4444444444444444, "#bd3786" ], [ 0.5555555555555556, "#d8576b" ], [ 0.6666666666666666, "#ed7953" ], [ 0.7777777777777778, "#fb9f3a" ], [ 0.8888888888888888, "#fdca26" ], [ 1.0, "#f0f921" ] ] } ], "scatter": [ { "type": "scatter", "fillpattern": { "size": 10, "fillmode": "overlay", "solidity": 0.2 } } ], "surface": [ { "type": "surface", "colorbar": { "ticks": "", "outlinewidth": 0 }, "colorscale": [ [ 0.0, "#0d0887" ], [ 0.1111111111111111, "#46039f" ], [ 0.2222222222222222, "#7201a8" ], [ 0.3333333333333333, "#9c179e" ], [ 0.4444444444444444, "#bd3786" ], [ 0.5555555555555556, "#d8576b" ], [ 0.6666666666666666, "#ed7953" ], [ 0.7777777777777778, "#fb9f3a" ], [ 0.8888888888888888, "#fdca26" ], [ 1.0, "#f0f921" ] ] } ], "barpolar": [ { "type": "barpolar", "marker": { "line": { "color": "#E5ECF6", "width": 0.5 }, "pattern": { "size": 10, "fillmode": "overlay", "solidity": 0.2 } } } ], "heatmapgl": [ { "type": "heatmapgl", "colorbar": { "ticks": "", "outlinewidth": 0 }, "colorscale": [ [ 0.0, "#0d0887" ], [ 0.1111111111111111, "#46039f" ], [ 0.2222222222222222, "#7201a8" ], [ 0.3333333333333333, "#9c179e" ], [ 0.4444444444444444, "#bd3786" ], [ 0.5555555555555556, "#d8576b" ], [ 0.6666666666666666, "#ed7953" ], [ 0.7777777777777778, "#fb9f3a" ], [ 0.8888888888888888, "#fdca26" ], [ 1.0, "#f0f921" ] ] } ], "histogram": [ { "type": "histogram", "marker": { "pattern": { "size": 10, "fillmode": "overlay", "solidity": 0.2 } } } ], "parcoords": [ { "line": { "colorbar": { "ticks": "", "outlinewidth": 0 } }, "type": "parcoords" } ], "scatter3d": [ { "line": { "colorbar": { "ticks": "", "outlinewidth": 0 } }, "type": "scatter3d", "marker": { "colorbar": { "ticks": "", "outlinewidth": 0 } } } ], "scattergl": [ { "type": "scattergl", "marker": { "colorbar": { "ticks": "", "outlinewidth": 0 } } } ], "choropleth": [ { "type": "choropleth", "colorbar": { "ticks": "", "outlinewidth": 0 } } ], "scattergeo": [ { "type": "scattergeo", "marker": { "colorbar": { "ticks": "", "outlinewidth": 0 } } } ], "histogram2d": [ { "type": "histogram2d", "colorbar": { "ticks": "", "outlinewidth": 0 }, "colorscale": [ [ 0.0, "#0d0887" ], [ 0.1111111111111111, "#46039f" ], [ 0.2222222222222222, "#7201a8" ], [ 0.3333333333333333, "#9c179e" ], [ 0.4444444444444444, "#bd3786" ], [ 0.5555555555555556, "#d8576b" ], [ 0.6666666666666666, "#ed7953" ], [ 0.7777777777777778, "#fb9f3a" ], [ 0.8888888888888888, "#fdca26" ], [ 1.0, "#f0f921" ] ] } ], "scatterpolar": [ { "type": "scatterpolar", "marker": { "colorbar": { "ticks": "", "outlinewidth": 0 } } } ], "contourcarpet": [ { "type": "contourcarpet", "colorbar": { "ticks": "", "outlinewidth": 0 } } ], "scattercarpet": [ { "type": "scattercarpet", "marker": { "colorbar": { "ticks": "", "outlinewidth": 0 } } } ], "scattermapbox": [ { "type": "scattermapbox", "marker": { "colorbar": { "ticks": "", "outlinewidth": 0 } } } ], "scatterpolargl": [ { "type": "scatterpolargl", "marker": { "colorbar": { "ticks": "", "outlinewidth": 0 } } } ], "scatterternary": [ { "type": "scatterternary", "marker": { "colorbar": { "ticks": "", "outlinewidth": 0 } } } ], "histogram2dcontour": [ { "type": "histogram2dcontour", "colorbar": { "ticks": "", "outlinewidth": 0 }, "colorscale": [ [ 0.0, "#0d0887" ], [ 0.1111111111111111, "#46039f" ], [ 0.2222222222222222, "#7201a8" ], [ 0.3333333333333333, "#9c179e" ], [ 0.4444444444444444, "#bd3786" ], [ 0.5555555555555556, "#d8576b" ], [ 0.6666666666666666, "#ed7953" ], [ 0.7777777777777778, "#fb9f3a" ], [ 0.8888888888888888, "#fdca26" ], [ 1.0, "#f0f921" ] ] } ] }, "layout": { "geo": { "bgcolor": "white", "showland": true, "lakecolor": "white", "landcolor": "#E5ECF6", "showlakes": true, "subunitcolor": "white" }, "font": { "color": "#2a3f5f" }, "polar": { "bgcolor": "#E5ECF6", "radialaxis": { "ticks": "", "gridcolor": "white", "linecolor": "white" }, "angularaxis": { "ticks": "", "gridcolor": "white", "linecolor": "white" } }, "scene": { "xaxis": { "ticks": "", "gridcolor": "white", "gridwidth": 2, "linecolor": "white", "zerolinecolor": "white", "showbackground": true, "backgroundcolor": "#E5ECF6" }, "yaxis": { "ticks": "", "gridcolor": "white", "gridwidth": 2, "linecolor": "white", "zerolinecolor": "white", "showbackground": true, "backgroundcolor": "#E5ECF6" }, "zaxis": { "ticks": "", "gridcolor": "white", "gridwidth": 2, "linecolor": "white", "zerolinecolor": "white", "showbackground": true, "backgroundcolor": "#E5ECF6" } }, "title": { "x": 0.05 }, "xaxis": { "ticks": "", "title": { "standoff": 15 }, "gridcolor": "white", "linecolor": "white", "automargin": true, "zerolinecolor": "white", "zerolinewidth": 2 }, "yaxis": { "ticks": "", "title": { "standoff": 15 }, "gridcolor": "white", "linecolor": "white", "automargin": true, "zerolinecolor": "white", "zerolinewidth": 2 }, "mapbox": { "style": "light" }, "ternary": { "aaxis": { "ticks": "", "gridcolor": "white", "linecolor": "white" }, "baxis": { "ticks": "", "gridcolor": "white", "linecolor": "white" }, "caxis": { "ticks": "", "gridcolor": "white", "linecolor": "white" }, "bgcolor": "#E5ECF6" }, "colorway": [ "#636efa", "#EF553B", "#00cc96", "#ab63fa", "#FFA15A", "#19d3f3", "#FF6692", "#B6E880", "#FF97FF", "#FECB52" ], "coloraxis": { "colorbar": { "ticks": "", "outlinewidth": 0 } }, "hovermode": "closest", "colorscale": { "diverging": [ [ 0, "#8e0152" ], [ 0.1, "#c51b7d" ], [ 0.2, "#de77ae" ], [ 0.3, "#f1b6da" ], [ 0.4, "#fde0ef" ], [ 0.5, "#f7f7f7" ], [ 0.6, "#e6f5d0" ], [ 0.7, "#b8e186" ], [ 0.8, "#7fbc41" ], [ 0.9, "#4d9221" ], [ 1, "#276419" ] ], "sequential": [ [ 0.0, "#0d0887" ], [ 0.1111111111111111, "#46039f" ], [ 0.2222222222222222, "#7201a8" ], [ 0.3333333333333333, "#9c179e" ], [ 0.4444444444444444, "#bd3786" ], [ 0.5555555555555556, "#d8576b" ], [ 0.6666666666666666, "#ed7953" ], [ 0.7777777777777778, "#fb9f3a" ], [ 0.8888888888888888, "#fdca26" ], [ 1.0, "#f0f921" ] ], "sequentialminus": [ [ 0.0, "#0d0887" ], [ 0.1111111111111111, "#46039f" ], [ 0.2222222222222222, "#7201a8" ], [ 0.3333333333333333, "#9c179e" ], [ 0.4444444444444444, "#bd3786" ], [ 0.5555555555555556, "#d8576b" ], [ 0.6666666666666666, "#ed7953" ], [ 0.7777777777777778, "#fb9f3a" ], [ 0.8888888888888888, "#fdca26" ], [ 1.0, "#f0f921" ] ] }, "hoverlabel": { "align": "left" }, "plot_bgcolor": "#E5ECF6", "paper_bgcolor": "white", "shapedefaults": { "line": { "color": "#2a3f5f" } }, "autotypenumbers": "strict", "annotationdefaults": { "arrowhead": 0, "arrowcolor": "#2a3f5f", "arrowwidth": 1 } } } } }, "height": null, "width": null, "user": { "profile_url": "https://chart-studio.plotly.com/~alebustam", "avatar_url": "https://storage.googleapis.com/plotly-prod-profiles/38.jpg", "background_url": "https://storage.googleapis.com/plotly-prod-profiles/bg-6.jpg", "bio": "", "nickname": "", "website": "", "stream_tokens": null, "feature_set_id": null, "csrf_token": null, "date_joined": "2023-12-20 09:37:03", "mapbox_access_tokens": null, "has_password": null, "username": "alebustam", "email": null, "is_active": null, "readonly": null, "is_dash_creator": null, "dash_created_count": null, "is_chart_creator": null, "charts_created_count": null } }, { "creation_time": "2024-03-22T12:53:33.882821Z", "comments": { "results": [], "count": 0 }, "parented": true, "embed_url": "https://chart-studio.plotly.com/~MichielVanmunster/8.embed", "fid": "MichielVanmunster:8", "filename": "Plot 8", "filetype": "plot", "img_url": "https://storage.googleapis.com/plotly-prod-images/MichielVanmunster/8/9_GOHDG01M6Z4UQV5MQMP4EAE6518HAR.png", "image_urls": { "default": "https://storage.googleapis.com/plotly-prod-images/MichielVanmunster/8/2_CM3HOMWPSNMO092I6O9D35C3FNOX8Q.png", "block-thumb": "https://storage.googleapis.com/plotly-prod-images/MichielVanmunster/8/8_XCFT9NVJSTWK33EH5ZQDJ488CBRL8J.png", "list-thumb": "https://storage.googleapis.com/plotly-prod-images/MichielVanmunster/8/9_GOHDG01M6Z4UQV5MQMP4EAE6518HAR.png" }, "api_urls": { "files": "https://api.plotly.com/v2/files/MichielVanmunster:8", "plots": "https://api.plotly.com/v2/plots/MichielVanmunster:8", "parent": "https://api.plotly.com/v2/folders/home?user=MichielVanmunster" }, "owner": "MichielVanmunster", "parent": -1, "preview": "", "referencers": [], "references": [], "title": "", "views": 1, "web_url": "https://chart-studio.plotly.com/~MichielVanmunster/8/", "world_readable": true, "date_modified": "2024-03-22T12:53:33.912Z", "stars": { "results": [], "count": 0 }, "collaborators": { "results": [], "count": 0 }, "subfolder_count": null, "refresh_interval": null, "organize_view_url": "https://chart-studio.plotly.com/~MichielVanmunster/8/", "current_user_permission": "read", "is_theme": null, "is_template": false, "autosize": true, "caption": "", "figure": { "data": [ { "meta": { "columnNames": { "x": "TIME", "y": " CURRENT (A)" } }, "mode": "lines", "type": "scatter", "xsrc": "MichielVanmunster:7:9c0cfa", "ysrc": "MichielVanmunster:7:6a97b4" } ], "frames": [], "layout": { "title": { "text": "TC_22: Current measured over time" }, "xaxis": { "type": "category", "range": [ 0, 458 ], "autorange": true }, "yaxis": { "type": "linear", "range": [ -0.556, 10.564 ], "title": { "text": "Current (A)" }, "autorange": true }, "autosize": true, "template": { "data": { "bar": [ { "type": "bar", "marker": { "colorbar": { "ticks": "", "outlinewidth": 0 } } } ], "table": [ { "type": "table", "cells": { "fill": { "color": "#EBF0F8" }, "line": { "color": "white" } }, "header": { "fill": { "color": "#C8D4E3" }, "line": { "color": "white" } } } ], "carpet": [ { "type": "carpet", "aaxis": { "gridcolor": "#C8D4E3", "linecolor": "#C8D4E3", "endlinecolor": "#2a3f5f", "minorgridcolor": "#C8D4E3", "startlinecolor": "#2a3f5f" }, "baxis": { "gridcolor": "#C8D4E3", "linecolor": "#C8D4E3", "endlinecolor": "#2a3f5f", "minorgridcolor": "#C8D4E3", "startlinecolor": "#2a3f5f" } } ], "mesh3d": [ { "type": "mesh3d", "colorbar": { "ticks": "", "outlinewidth": 0 } } ], "contour": [ { "type": "contour", "colorbar": { "ticks": "", "outlinewidth": 0 }, "autocolorscale": true } ], "heatmap": [ { "type": "heatmap", "colorbar": { "ticks": "", "outlinewidth": 0 }, "autocolorscale": true } ], "scatter": [ { "type": "scatter", "marker": { "colorbar": { "ticks": "", "outlinewidth": 0 } } } ], "surface": [ { "type": "surface", "colorbar": { "ticks": "", "outlinewidth": 0 } } ], "heatmapgl": [ { "type": "heatmapgl", "colorbar": { "ticks": "", "outlinewidth": 0 } } ], "histogram": [ { "type": "histogram", "marker": { "colorbar": { "ticks": "", "outlinewidth": 0 } } } ], "parcoords": [ { "line": { "colorbar": { "ticks": "", "outlinewidth": 0 } }, "type": "parcoords" } ], "scatter3d": [ { "type": "scatter3d", "marker": { "colorbar": { "ticks": "", "outlinewidth": 0 } } } ], "scattergl": [ { "type": "scattergl", "marker": { "colorbar": { "ticks": "", "outlinewidth": 0 } } } ], "choropleth": [ { "type": "choropleth", "colorbar": { "ticks": "", "outlinewidth": 0 } } ], "scattergeo": [ { "type": "scattergeo", "marker": { "colorbar": { "ticks": "", "outlinewidth": 0 } } } ], "histogram2d": [ { "type": "histogram2d", "colorbar": { "ticks": "", "outlinewidth": 0 }, "autocolorscale": true } ], "scatterpolar": [ { "type": "scatterpolar", "marker": { "colorbar": { "ticks": "", "outlinewidth": 0 } } } ], "contourcarpet": [ { "type": "contourcarpet", "colorbar": { "ticks": "", "outlinewidth": 0 } } ], "scattercarpet": [ { "type": "scattercarpet", "marker": { "colorbar": { "ticks": "", "outlinewidth": 0 } } } ], "scattermapbox": [ { "type": "scattermapbox", "marker": { "colorbar": { "ticks": "", "outlinewidth": 0 } } } ], "scatterpolargl": [ { "type": "scatterpolargl", "marker": { "colorbar": { "ticks": "", "outlinewidth": 0 } } } ], "scatterternary": [ { "type": "scatterternary", "marker": { "colorbar": { "ticks": "", "outlinewidth": 0 } } } ], "histogram2dcontour": [ { "type": "histogram2dcontour", "colorbar": { "ticks": "", "outlinewidth": 0 }, "autocolorscale": true } ] }, "layout": { "geo": { "bgcolor": "white", "showland": true, "lakecolor": "white", "landcolor": "white", "showlakes": true, "subunitcolor": "#C8D4E3" }, "font": { "color": "#2a3f5f" }, "polar": { "bgcolor": "white", "radialaxis": { "ticks": "", "gridcolor": "#EBF0F8", "linecolor": "#EBF0F8" }, "angularaxis": { "ticks": "", "gridcolor": "#EBF0F8", "linecolor": "#EBF0F8" } }, "scene": { "xaxis": { "ticks": "", "gridcolor": "#DFE8F3", "gridwidth": 2, "linecolor": "#EBF0F8", "zerolinecolor": "#EBF0F8", "showbackground": true, "backgroundcolor": "white" }, "yaxis": { "ticks": "", "gridcolor": "#DFE8F3", "gridwidth": 2, "linecolor": "#EBF0F8", "zerolinecolor": "#EBF0F8", "showbackground": true, "backgroundcolor": "white" }, "zaxis": { "ticks": "", "gridcolor": "#DFE8F3", "gridwidth": 2, "linecolor": "#EBF0F8", "zerolinecolor": "#EBF0F8", "showbackground": true, "backgroundcolor": "white" } }, "title": { "x": 0.05 }, "xaxis": { "ticks": "", "gridcolor": "#EBF0F8", "linecolor": "#EBF0F8", "automargin": true, "zerolinecolor": "#EBF0F8", "zerolinewidth": 2 }, "yaxis": { "ticks": "", "gridcolor": "#EBF0F8", "linecolor": "#EBF0F8", "automargin": true, "zerolinecolor": "#EBF0F8", "zerolinewidth": 2 }, "ternary": { "aaxis": { "ticks": "", "gridcolor": "#DFE8F3", "linecolor": "#A2B1C6" }, "baxis": { "ticks": "", "gridcolor": "#DFE8F3", "linecolor": "#A2B1C6" }, "caxis": { "ticks": "", "gridcolor": "#DFE8F3", "linecolor": "#A2B1C6" }, "bgcolor": "white" }, "colorway": [ "#636efa", "#EF553B", "#00cc96", "#ab63fa", "#19d3f3", "#e763fa", "#fecb52", "#ffa15a", "#ff6692", "#b6e880" ], "hovermode": "closest", "colorscale": { "diverging": [ [ 0, "#8e0152" ], [ 0.1, "#c51b7d" ], [ 0.2, "#de77ae" ], [ 0.3, "#f1b6da" ], [ 0.4, "#fde0ef" ], [ 0.5, "#f7f7f7" ], [ 0.6, "#e6f5d0" ], [ 0.7, "#b8e186" ], [ 0.8, "#7fbc41" ], [ 0.9, "#4d9221" ], [ 1, "#276419" ] ], "sequential": [ [ 0, "#0508b8" ], [ 0.0893854748603352, "#1910d8" ], [ 0.1787709497206704, "#3c19f0" ], [ 0.2681564245810056, "#6b1cfb" ], [ 0.3575418994413408, "#981cfd" ], [ 0.44692737430167595, "#bf1cfd" ], [ 0.5363128491620112, "#dd2bfd" ], [ 0.6256983240223464, "#f246fe" ], [ 0.7150837988826816, "#fc67fd" ], [ 0.8044692737430168, "#fe88fc" ], [ 0.8938547486033519, "#fea5fd" ], [ 0.9832402234636871, "#febefe" ], [ 1, "#fec3fe" ] ], "sequentialminus": [ [ 0, "#0508b8" ], [ 0.0893854748603352, "#1910d8" ], [ 0.1787709497206704, "#3c19f0" ], [ 0.2681564245810056, "#6b1cfb" ], [ 0.3575418994413408, "#981cfd" ], [ 0.44692737430167595, "#bf1cfd" ], [ 0.5363128491620112, "#dd2bfd" ], [ 0.6256983240223464, "#f246fe" ], [ 0.7150837988826816, "#fc67fd" ], [ 0.8044692737430168, "#fe88fc" ], [ 0.8938547486033519, "#fea5fd" ], [ 0.9832402234636871, "#febefe" ], [ 1, "#fec3fe" ] ] }, "plot_bgcolor": "white", "paper_bgcolor": "white", "shapedefaults": { "line": { "width": 0 }, "opacity": 0.4, "fillcolor": "#506784" }, "annotationdefaults": { "arrowhead": 0, "arrowcolor": "#506784", "arrowwidth": 1 } }, "themeRef": "PLOTLY_WHITE" } } }, "height": null, "width": null, "user": { "profile_url": "https://chart-studio.plotly.com/~MichielVanmunster", "avatar_url": "https://storage.googleapis.com/plotly-prod-profiles/24.jpg", "background_url": "https://storage.googleapis.com/plotly-prod-profiles/bg-12.jpg", "bio": "", "nickname": "", "website": "", "stream_tokens": null, "feature_set_id": null, "csrf_token": null, "date_joined": "2023-08-29 14:52:13", "mapbox_access_tokens": null, "has_password": null, "username": "MichielVanmunster", "email": null, "is_active": null, "readonly": null, "is_dash_creator": null, "dash_created_count": null, "is_chart_creator": null, "charts_created_count": null } }, { "creation_time": "2024-03-22T11:15:34.858228Z", "comments": { "results": [], "count": 0 }, "parented": true, "embed_url": "https://chart-studio.plotly.com/~yuc279/6.embed", "fid": "yuc279:6", "filename": "dx-dt-time", "filetype": "plot", "img_url": "https://storage.googleapis.com/plotly-prod-images/yuc279/6/9_8X6F0JOYNJCO5SDNHWXZ2NK81E5OTB.png", "image_urls": { "default": "https://storage.googleapis.com/plotly-prod-images/yuc279/6/2_3MLFKC3MAUQSWNTAFMDVRVP7AZ88R7.png", "block-thumb": "https://storage.googleapis.com/plotly-prod-images/yuc279/6/8_RZ4TWXW3FNBHWFZRDE6MBEWWOG4CEF.png", "list-thumb": "https://storage.googleapis.com/plotly-prod-images/yuc279/6/9_8X6F0JOYNJCO5SDNHWXZ2NK81E5OTB.png" }, "api_urls": { "files": "https://api.plotly.com/v2/files/yuc279:6", "plots": "https://api.plotly.com/v2/plots/yuc279:6", "parent": "https://api.plotly.com/v2/folders/home?user=yuc279" }, "owner": "yuc279", "parent": -1, "preview": "", "referencers": [], "references": [], "title": "", "views": 14, "web_url": "https://chart-studio.plotly.com/~yuc279/6/", "world_readable": true, "date_modified": "2024-03-22T11:15:34.869Z", "stars": { "results": [], "count": 0 }, "collaborators": { "results": [], "count": 0 }, "subfolder_count": null, "refresh_interval": null, "organize_view_url": "https://chart-studio.plotly.com/~yuc279/6/", "current_user_permission": "read", "is_theme": null, "is_template": null, "autosize": true, "caption": "", "figure": { "data": [ { "mode": "markers", "type": "scatter3d", "xsrc": "yuc279:5:6874da", "ysrc": "yuc279:5:c895c7", "zsrc": "yuc279:5:e7b6ef", "marker": { "size": 12, "opacity": 0.8, "colorbar": { "title": { "text": "error" } }, "colorsrc": "yuc279:5:8d98fc", "colorscale": [ [ 0.0, "#440154" ], [ 0.1111111111111111, "#482878" ], [ 0.2222222222222222, "#3e4989" ], [ 0.3333333333333333, "#31688e" ], [ 0.4444444444444444, "#26828e" ], [ 0.5555555555555556, "#1f9e89" ], [ 0.6666666666666666, "#35b779" ], [ 0.7777777777777778, "#6ece58" ], [ 0.8888888888888888, "#b5de2b" ], [ 1.0, "#fde725" ] ] } } ], "layout": { "template": { "data": { "bar": [ { "type": "bar", "marker": { "line": { "color": "#E5ECF6", "width": 0.5 }, "pattern": { "size": 10, "fillmode": "overlay", "solidity": 0.2 } }, "error_x": { "color": "#2a3f5f" }, "error_y": { "color": "#2a3f5f" } } ], "pie": [ { "type": "pie", "automargin": true } ], "table": [ { "type": "table", "cells": { "fill": { "color": "#EBF0F8" }, "line": { "color": "white" } }, "header": { "fill": { "color": "#C8D4E3" }, "line": { "color": "white" } } } ], "carpet": [ { "type": "carpet", "aaxis": { "gridcolor": "white", "linecolor": "white", "endlinecolor": "#2a3f5f", "minorgridcolor": "white", "startlinecolor": "#2a3f5f" }, "baxis": { "gridcolor": "white", "linecolor": "white", "endlinecolor": "#2a3f5f", "minorgridcolor": "white", "startlinecolor": "#2a3f5f" } } ], "mesh3d": [ { "type": "mesh3d", "colorbar": { "ticks": "", "outlinewidth": 0 } } ], "contour": [ { "type": "contour", "colorbar": { "ticks": "", "outlinewidth": 0 }, "colorscale": [ [ 0.0, "#0d0887" ], [ 0.1111111111111111, "#46039f" ], [ 0.2222222222222222, "#7201a8" ], [ 0.3333333333333333, "#9c179e" ], [ 0.4444444444444444, "#bd3786" ], [ 0.5555555555555556, "#d8576b" ], [ 0.6666666666666666, "#ed7953" ], [ 0.7777777777777778, "#fb9f3a" ], [ 0.8888888888888888, "#fdca26" ], [ 1.0, "#f0f921" ] ] } ], "heatmap": [ { "type": "heatmap", "colorbar": { "ticks": "", "outlinewidth": 0 }, "colorscale": [ [ 0.0, "#0d0887" ], [ 0.1111111111111111, "#46039f" ], [ 0.2222222222222222, "#7201a8" ], [ 0.3333333333333333, "#9c179e" ], [ 0.4444444444444444, "#bd3786" ], [ 0.5555555555555556, "#d8576b" ], [ 0.6666666666666666, "#ed7953" ], [ 0.7777777777777778, "#fb9f3a" ], [ 0.8888888888888888, "#fdca26" ], [ 1.0, "#f0f921" ] ] } ], "scatter": [ { "type": "scatter", "fillpattern": { "size": 10, "fillmode": "overlay", "solidity": 0.2 } } ], "surface": [ { "type": "surface", "colorbar": { "ticks": "", "outlinewidth": 0 }, "colorscale": [ [ 0.0, "#0d0887" ], [ 0.1111111111111111, "#46039f" ], [ 0.2222222222222222, "#7201a8" ], [ 0.3333333333333333, "#9c179e" ], [ 0.4444444444444444, "#bd3786" ], [ 0.5555555555555556, "#d8576b" ], [ 0.6666666666666666, "#ed7953" ], [ 0.7777777777777778, "#fb9f3a" ], [ 0.8888888888888888, "#fdca26" ], [ 1.0, "#f0f921" ] ] } ], "barpolar": [ { "type": "barpolar", "marker": { "line": { "color": "#E5ECF6", "width": 0.5 }, "pattern": { "size": 10, "fillmode": "overlay", "solidity": 0.2 } } } ], "heatmapgl": [ { "type": "heatmapgl", "colorbar": { "ticks": "", "outlinewidth": 0 }, "colorscale": [ [ 0.0, "#0d0887" ], [ 0.1111111111111111, "#46039f" ], [ 0.2222222222222222, "#7201a8" ], [ 0.3333333333333333, "#9c179e" ], [ 0.4444444444444444, "#bd3786" ], [ 0.5555555555555556, "#d8576b" ], [ 0.6666666666666666, "#ed7953" ], [ 0.7777777777777778, "#fb9f3a" ], [ 0.8888888888888888, "#fdca26" ], [ 1.0, "#f0f921" ] ] } ], "histogram": [ { "type": "histogram", "marker": { "pattern": { "size": 10, "fillmode": "overlay", "solidity": 0.2 } } } ], "parcoords": [ { "line": { "colorbar": { "ticks": "", "outlinewidth": 0 } }, "type": "parcoords" } ], "scatter3d": [ { "line": { "colorbar": { "ticks": "", "outlinewidth": 0 } }, "type": "scatter3d", "marker": { "colorbar": { "ticks": "", "outlinewidth": 0 } } } ], "scattergl": [ { "type": "scattergl", "marker": { "colorbar": { "ticks": "", "outlinewidth": 0 } } } ], "choropleth": [ { "type": "choropleth", "colorbar": { "ticks": "", "outlinewidth": 0 } } ], "scattergeo": [ { "type": "scattergeo", "marker": { "colorbar": { "ticks": "", "outlinewidth": 0 } } } ], "histogram2d": [ { "type": "histogram2d", "colorbar": { "ticks": "", "outlinewidth": 0 }, "colorscale": [ [ 0.0, "#0d0887" ], [ 0.1111111111111111, "#46039f" ], [ 0.2222222222222222, "#7201a8" ], [ 0.3333333333333333, "#9c179e" ], [ 0.4444444444444444, "#bd3786" ], [ 0.5555555555555556, "#d8576b" ], [ 0.6666666666666666, "#ed7953" ], [ 0.7777777777777778, "#fb9f3a" ], [ 0.8888888888888888, "#fdca26" ], [ 1.0, "#f0f921" ] ] } ], "scatterpolar": [ { "type": "scatterpolar", "marker": { "colorbar": { "ticks": "", "outlinewidth": 0 } } } ], "contourcarpet": [ { "type": "contourcarpet", "colorbar": { "ticks": "", "outlinewidth": 0 } } ], "scattercarpet": [ { "type": "scattercarpet", "marker": { "colorbar": { "ticks": "", "outlinewidth": 0 } } } ], "scattermapbox": [ { "type": "scattermapbox", "marker": { "colorbar": { "ticks": "", "outlinewidth": 0 } } } ], "scatterpolargl": [ { "type": "scatterpolargl", "marker": { "colorbar": { "ticks": "", "outlinewidth": 0 } } } ], "scatterternary": [ { "type": "scatterternary", "marker": { "colorbar": { "ticks": "", "outlinewidth": 0 } } } ], "histogram2dcontour": [ { "type": "histogram2dcontour", "colorbar": { "ticks": "", "outlinewidth": 0 }, "colorscale": [ [ 0.0, "#0d0887" ], [ 0.1111111111111111, "#46039f" ], [ 0.2222222222222222, "#7201a8" ], [ 0.3333333333333333, "#9c179e" ], [ 0.4444444444444444, "#bd3786" ], [ 0.5555555555555556, "#d8576b" ], [ 0.6666666666666666, "#ed7953" ], [ 0.7777777777777778, "#fb9f3a" ], [ 0.8888888888888888, "#fdca26" ], [ 1.0, "#f0f921" ] ] } ] }, "layout": { "geo": { "bgcolor": "white", "showland": true, "lakecolor": "white", "landcolor": "#E5ECF6", "showlakes": true, "subunitcolor": "white" }, "font": { "color": "#2a3f5f" }, "polar": { "bgcolor": "#E5ECF6", "radialaxis": { "ticks": "", "gridcolor": "white", "linecolor": "white" }, "angularaxis": { "ticks": "", "gridcolor": "white", "linecolor": "white" } }, "scene": { "xaxis": { "ticks": "", "gridcolor": "white", "gridwidth": 2, "linecolor": "white", "zerolinecolor": "white", "showbackground": true, "backgroundcolor": "#E5ECF6" }, "yaxis": { "ticks": "", "gridcolor": "white", "gridwidth": 2, "linecolor": "white", "zerolinecolor": "white", "showbackground": true, "backgroundcolor": "#E5ECF6" }, "zaxis": { "ticks": "", "gridcolor": "white", "gridwidth": 2, "linecolor": "white", "zerolinecolor": "white", "showbackground": true, "backgroundcolor": "#E5ECF6" } }, "title": { "x": 0.05 }, "xaxis": { "ticks": "", "title": { "standoff": 15 }, "gridcolor": "white", "linecolor": "white", "automargin": true, "zerolinecolor": "white", "zerolinewidth": 2 }, "yaxis": { "ticks": "", "title": { "standoff": 15 }, "gridcolor": "white", "linecolor": "white", "automargin": true, "zerolinecolor": "white", "zerolinewidth": 2 }, "mapbox": { "style": "light" }, "ternary": { "aaxis": { "ticks": "", "gridcolor": "white", "linecolor": "white" }, "baxis": { "ticks": "", "gridcolor": "white", "linecolor": "white" }, "caxis": { "ticks": "", "gridcolor": "white", "linecolor": "white" }, "bgcolor": "#E5ECF6" }, "colorway": [ "#636efa", "#EF553B", "#00cc96", "#ab63fa", "#FFA15A", "#19d3f3", "#FF6692", "#B6E880", "#FF97FF", "#FECB52" ], "coloraxis": { "colorbar": { "ticks": "", "outlinewidth": 0 } }, "hovermode": "closest", "colorscale": { "diverging": [ [ 0, "#8e0152" ], [ 0.1, "#c51b7d" ], [ 0.2, "#de77ae" ], [ 0.3, "#f1b6da" ], [ 0.4, "#fde0ef" ], [ 0.5, "#f7f7f7" ], [ 0.6, "#e6f5d0" ], [ 0.7, "#b8e186" ], [ 0.8, "#7fbc41" ], [ 0.9, "#4d9221" ], [ 1, "#276419" ] ], "sequential": [ [ 0.0, "#0d0887" ], [ 0.1111111111111111, "#46039f" ], [ 0.2222222222222222, "#7201a8" ], [ 0.3333333333333333, "#9c179e" ], [ 0.4444444444444444, "#bd3786" ], [ 0.5555555555555556, "#d8576b" ], [ 0.6666666666666666, "#ed7953" ], [ 0.7777777777777778, "#fb9f3a" ], [ 0.8888888888888888, "#fdca26" ], [ 1.0, "#f0f921" ] ], "sequentialminus": [ [ 0.0, "#0d0887" ], [ 0.1111111111111111, "#46039f" ], [ 0.2222222222222222, "#7201a8" ], [ 0.3333333333333333, "#9c179e" ], [ 0.4444444444444444, "#bd3786" ], [ 0.5555555555555556, "#d8576b" ], [ 0.6666666666666666, "#ed7953" ], [ 0.7777777777777778, "#fb9f3a" ], [ 0.8888888888888888, "#fdca26" ], [ 1.0, "#f0f921" ] ] }, "hoverlabel": { "align": "left" }, "plot_bgcolor": "#E5ECF6", "paper_bgcolor": "white", "shapedefaults": { "line": { "color": "#2a3f5f" } }, "autotypenumbers": "strict", "annotationdefaults": { "arrowhead": 0, "arrowcolor": "#2a3f5f", "arrowwidth": 1 } } } } }, "height": null, "width": null, "user": { "profile_url": "https://chart-studio.plotly.com/~yuc279", "avatar_url": "https://storage.googleapis.com/plotly-prod-profiles/69.jpg", "background_url": "https://storage.googleapis.com/plotly-prod-profiles/bg-2.jpg", "bio": "", "nickname": "", "website": "", "stream_tokens": null, "feature_set_id": null, "csrf_token": null, "date_joined": "2024-03-22 10:56:40", "mapbox_access_tokens": null, "has_password": null, "username": "yuc279", "email": null, "is_active": null, "readonly": null, "is_dash_creator": null, "dash_created_count": null, "is_chart_creator": null, "charts_created_count": null } } ] }
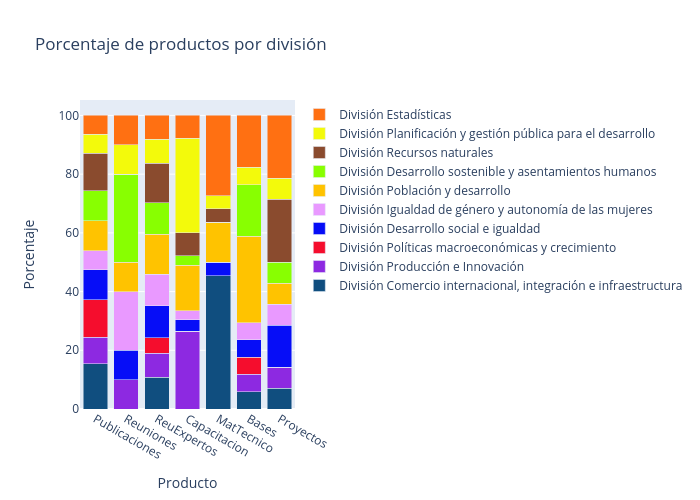