Plots List
Plots
This endpoint handles manipulation of Plotly plot files.
Reference
Authorization
Any user with or without a Plotly account may view public plots. For private plots, see authentication.
Actions
list
Listing all public plots can be done via a GET request to this endpoint.
By default, plots will be listed in order of date created. The order_by
query parameter is accepted at this endpoint. Currently, only ordering by
views is supported. It is possible to filter the plots by quality
with min_quality or max_quality as query parameter.
Example:
// GET https://api.plotly.com/v2/plots/ ---> 200

// GET https://api.plotly.com/v2/plots/?order_by=-views ---> 200

// GET https://api.plotly.com/v2/plots/?min_quality=5 ---> 200

// GET https://api.plotly.com/v2/plots/?max_quality=5 ---> 200
feed
Listing all handpicked feed plots can be done via a GET request to this endpoint. By default, plots will be listed in a random order.
Example:
// GET https://api.plotly.com/v2/plots/feed ---> 200
create
You can create new plot resources here. The only required field is 'figure'. Currently, the figure is restricted to only contain references to grid data. That is, this will fail if raw data arrays are passed in. To create and manipulate underlying grids for plots, see the grids endpoint.
Example:
// This fails because a figure field is required.
// POST https://api.plotly.com/v2/plots ---> 400 Bad Request
{}

// This fails because the figure has raw data
//POST https://api.plotly.com/v2/plots ---> 400 Bad Request
{
    "figure": {"data": [{"y": ['this', 'is', 'raw', 'data']}]}
}

// This succeeds because the figure has src keys, not raw data.
//POST https://api.plotly.com/v2/plots ---> 200 OK
{
    "figure": {"data": [{"ysrc": "sven:88:u8nd62"}]}
}
When creating a grid, you can optionally specify a source_fid to specify where a plot has come from:
- source_fid: the fid of a plot that was copied (and presumably edited) to produce this one
detail
There is a lot of meta information stored about plot files including filename, title, share_url, and content_url to name a few.
This information can only be reached with a GET to this endpoint.
Example:
// GET https://api.plotly.com/v2/plots/iheartgraphs:90
content
The contents of a plot can be downloaded via the content resource. The plot
content contains referenced grid/column data by default. If you wish to
return the raw grid/column data, the inline_data=true query must be included
in the request url. The Content-Type header will be appropriately set for the
response body.
Alternatively, you can set ?map_data=unreadable to append a mapping of
sources to data that belongs to grids which are unreadable for the
requestor. This is useful when you have read access to another users plot,
but that plot contains grid references which you don't have access to.
Examples:
// Returns referenced grid/column data
// GET https://api.plotly.com/v2/plots/iheartgraphs:90/content ---> 200 OK

// Returns full grid/column data
// GET https://api.plotly.com/v2/plots/iheartgraphs:90/content?inline_data=true ---> 200 OK

// Returns full grid/column data when requestor doesn't have permission
// to read the referenced grid.
// GET https://api.plotly.com/v2/plots/iheartgraphs:90/content?map_data=unreadable ---> 200 OK
GET /v2/plots?cursor=cj0xJnA9MjAyNC0wMy0yMiswNyUzQTA1JTNBMjguNzQxNDI5JTJCMDAlM0EwMA%3D%3D&format=api
{ "next": "https://api.plot.ly/v2/plots?cursor=cD0yMDI0LTAzLTIyKzA3JTNBMDYlM0E1NC4xNzMxNTElMkIwMCUzQTAw&format=api", "previous": "https://api.plot.ly/v2/plots?cursor=cj0xJnA9MjAyNC0wMy0yMiswNyUzQTQ1JTNBMTYuNTM3MzUxJTJCMDAlM0EwMA%3D%3D&format=api", "results": [ { "creation_time": "2024-03-22T07:45:16.537351Z", "comments": { "results": [], "count": 0 }, "parented": true, "embed_url": "https://chart-studio.plotly.com/~k_guney/6.embed", "fid": "k_guney:6", "filename": "Plot 6", "filetype": "plot", "img_url": "https://storage.googleapis.com/plotly-prod-images/k_guney/6/9_22581RLELROMTUOVU8B1XE1KOG9M3P.png", "image_urls": { "default": "https://storage.googleapis.com/plotly-prod-images/k_guney/6/2_QI853H8IUC8CL98Q4HUKJCEMIQDRRL.png", "block-thumb": "https://storage.googleapis.com/plotly-prod-images/k_guney/6/8_IMGR80X9ATZHMKEDVLTK3X2B1F9YZ0.png", "list-thumb": "https://storage.googleapis.com/plotly-prod-images/k_guney/6/9_22581RLELROMTUOVU8B1XE1KOG9M3P.png" }, "api_urls": { "files": "https://api.plotly.com/v2/files/k_guney:6", "plots": "https://api.plotly.com/v2/plots/k_guney:6", "parent": "https://api.plotly.com/v2/folders/home?user=k_guney" }, "owner": "k_guney", "parent": -1, "preview": "", "referencers": [], "references": [], "title": "", "views": 2, "web_url": "https://chart-studio.plotly.com/~k_guney/6/", "world_readable": true, "date_modified": "2024-03-22T07:45:16.550Z", "stars": { "results": [], "count": 0 }, "collaborators": { "results": [], "count": 0 }, "subfolder_count": null, "refresh_interval": null, "organize_view_url": "https://chart-studio.plotly.com/~k_guney/6/", "current_user_permission": "read", "is_theme": null, "is_template": false, "autosize": true, "caption": "", "figure": { "data": [ { "meta": { "columnNames": { "x": "OTHER_RELIGIOUS_GROUPS" } }, "mode": "markers", "type": "histogram", "xsrc": "k_guney:5:77eea1", "marker": { "line": { "width": 3 }, "color": "rgb(202, 78, 64)" } } ], "frames": [], "layout": { "title": { "text": "Diğer Din Grupları Değişkeninin Histogram Grafiği" }, "xaxis": { "type": "linear", "range": [ -0.5, 44.5 ], "title": { "text": "OTHER_RELIGIOUS_GROUPS" }, "autorange": true }, "yaxis": { "range": [ 0, 58.94736842105263 ], "title": { "text": "Click to enter Y axis title" }, "autorange": true }, "autosize": true, "template": { "data": { "bar": [ { "type": "bar", "marker": { "colorbar": { "ticks": "", "outlinewidth": 0 } } } ], "table": [ { "type": "table", "cells": { "fill": { "color": "#506784" }, "line": { "color": "rgb(17,17,17)" } }, "header": { "fill": { "color": "#2a3f5f" }, "line": { "color": "rgb(17,17,17)" } } } ], "carpet": [ { "type": "carpet", "aaxis": { "gridcolor": "#506784", "linecolor": "#506784", "endlinecolor": "#A2B1C6", "minorgridcolor": "#506784", "startlinecolor": "#A2B1C6" }, "baxis": { "gridcolor": "#506784", "linecolor": "#506784", "endlinecolor": "#A2B1C6", "minorgridcolor": "#506784", "startlinecolor": "#A2B1C6" } } ], "mesh3d": [ { "type": "mesh3d", "colorbar": { "ticks": "", "outlinewidth": 0 } } ], "contour": [ { "type": "contour", "colorbar": { "ticks": "", "outlinewidth": 0 }, "autocolorscale": true } ], "heatmap": [ { "type": "heatmap", "colorbar": { "ticks": "", "outlinewidth": 0 }, "autocolorscale": true } ], "scatter": [ { "type": "scatter", "marker": { "colorbar": { "ticks": "", "outlinewidth": 0 } } } ], "surface": [ { "type": "surface", "colorbar": { "ticks": "", "outlinewidth": 0 } } ], "heatmapgl": [ { "type": "heatmapgl", "colorbar": { "ticks": "", "outlinewidth": 0 } } ], "histogram": [ { "type": "histogram", "marker": { "colorbar": { "ticks": "", "outlinewidth": 0 } } } ], "parcoords": [ { "line": { "colorbar": { "ticks": "", "outlinewidth": 0 } }, "type": "parcoords" } ], "scatter3d": [ { "type": "scatter3d", "marker": { "colorbar": { "ticks": "", "outlinewidth": 0 } } } ], "scattergl": [ { "type": "scattergl", "marker": { "colorbar": { "ticks": "", "outlinewidth": 0 } } } ], "choropleth": [ { "type": "choropleth", "colorbar": { "ticks": "", "outlinewidth": 0 } } ], "scattergeo": [ { "type": "scattergeo", "marker": { "colorbar": { "ticks": "", "outlinewidth": 0 } } } ], "histogram2d": [ { "type": "histogram2d", "colorbar": { "ticks": "", "outlinewidth": 0 }, "autocolorscale": true } ], "scatterpolar": [ { "type": "scatterpolar", "marker": { "colorbar": { "ticks": "", "outlinewidth": 0 } } } ], "contourcarpet": [ { "type": "contourcarpet", "colorbar": { "ticks": "", "outlinewidth": 0 } } ], "scattercarpet": [ { "type": "scattercarpet", "marker": { "colorbar": { "ticks": "", "outlinewidth": 0 } } } ], "scattermapbox": [ { "type": "scattermapbox", "marker": { "colorbar": { "ticks": "", "outlinewidth": 0 } } } ], "scatterpolargl": [ { "type": "scatterpolargl", "marker": { "colorbar": { "ticks": "", "outlinewidth": 0 } } } ], "scatterternary": [ { "type": "scatterternary", "marker": { "colorbar": { "ticks": "", "outlinewidth": 0 } } } ], "histogram2dcontour": [ { "type": "histogram2dcontour", "colorbar": { "ticks": "", "outlinewidth": 0 }, "autocolorscale": true } ] }, "layout": { "geo": { "bgcolor": "rgb(17,17,17)", "showland": true, "lakecolor": "rgb(17,17,17)", "landcolor": "rgb(17,17,17)", "showlakes": true, "subunitcolor": "#506784" }, "font": { "color": "#f2f5fa" }, "polar": { "bgcolor": "rgb(17,17,17)", "radialaxis": { "ticks": "", "gridcolor": "#506784", "linecolor": "#506784" }, "angularaxis": { "ticks": "", "gridcolor": "#506784", "linecolor": "#506784" } }, "scene": { "xaxis": { "ticks": "", "gridcolor": "#506784", "gridwidth": 2, "linecolor": "#506784", "zerolinecolor": "#C8D4E3", "showbackground": true, "backgroundcolor": "rgb(17,17,17)" }, "yaxis": { "ticks": "", "gridcolor": "#506784", "gridwidth": 2, "linecolor": "#506784", "zerolinecolor": "#C8D4E3", "showbackground": true, "backgroundcolor": "rgb(17,17,17)" }, "zaxis": { "ticks": "", "gridcolor": "#506784", "gridwidth": 2, "linecolor": "#506784", "zerolinecolor": "#C8D4E3", "showbackground": true, "backgroundcolor": "rgb(17,17,17)" } }, "title": { "x": 0.05 }, "xaxis": { "ticks": "", "gridcolor": "#283442", "linecolor": "#506784", "automargin": true, "zerolinecolor": "#283442", "zerolinewidth": 2 }, "yaxis": { "ticks": "", "gridcolor": "#283442", "linecolor": "#506784", "automargin": true, "zerolinecolor": "#283442", "zerolinewidth": 2 }, "ternary": { "aaxis": { "ticks": "", "gridcolor": "#506784", "linecolor": "#506784" }, "baxis": { "ticks": "", "gridcolor": "#506784", "linecolor": "#506784" }, "caxis": { "ticks": "", "gridcolor": "#506784", "linecolor": "#506784" }, "bgcolor": "rgb(17,17,17)" }, "colorway": [ "#636efa", "#EF553B", "#00cc96", "#ab63fa", "#19d3f3", "#e763fa", "#fecb52", "#ffa15a", "#ff6692", "#b6e880" ], "hovermode": "closest", "colorscale": { "diverging": [ [ 0, "#8e0152" ], [ 0.1, "#c51b7d" ], [ 0.2, "#de77ae" ], [ 0.3, "#f1b6da" ], [ 0.4, "#fde0ef" ], [ 0.5, "#f7f7f7" ], [ 0.6, "#e6f5d0" ], [ 0.7, "#b8e186" ], [ 0.8, "#7fbc41" ], [ 0.9, "#4d9221" ], [ 1, "#276419" ] ], "sequential": [ [ 0, "#0508b8" ], [ 0.0893854748603352, "#1910d8" ], [ 0.1787709497206704, "#3c19f0" ], [ 0.2681564245810056, "#6b1cfb" ], [ 0.3575418994413408, "#981cfd" ], [ 0.44692737430167595, "#bf1cfd" ], [ 0.5363128491620112, "#dd2bfd" ], [ 0.6256983240223464, "#f246fe" ], [ 0.7150837988826816, "#fc67fd" ], [ 0.8044692737430168, "#fe88fc" ], [ 0.8938547486033519, "#fea5fd" ], [ 0.9832402234636871, "#febefe" ], [ 1, "#fec3fe" ] ], "sequentialminus": [ [ 0, "#0508b8" ], [ 0.0893854748603352, "#1910d8" ], [ 0.1787709497206704, "#3c19f0" ], [ 0.2681564245810056, "#6b1cfb" ], [ 0.3575418994413408, "#981cfd" ], [ 0.44692737430167595, "#bf1cfd" ], [ 0.5363128491620112, "#dd2bfd" ], [ 0.6256983240223464, "#f246fe" ], [ 0.7150837988826816, "#fc67fd" ], [ 0.8044692737430168, "#fe88fc" ], [ 0.8938547486033519, "#fea5fd" ], [ 0.9832402234636871, "#febefe" ], [ 1, "#fec3fe" ] ] }, "plot_bgcolor": "rgb(17,17,17)", "paper_bgcolor": "rgb(17,17,17)", "shapedefaults": { "line": { "width": 0 }, "opacity": 0.4, "fillcolor": "#f2f5fa" }, "sliderdefaults": { "bgcolor": "#C8D4E3", "tickwidth": 0, "bordercolor": "rgb(17,17,17)", "borderwidth": 1 }, "annotationdefaults": { "arrowhead": 0, "arrowcolor": "#f2f5fa", "arrowwidth": 1 }, "updatemenudefaults": { "bgcolor": "#506784", "borderwidth": 0 } }, "themeRef": "PLOTLY_DARK" } } }, "height": null, "width": null, "user": { "profile_url": "https://chart-studio.plotly.com/~k_guney", "avatar_url": "https://storage.googleapis.com/plotly-prod-profiles/51.jpg", "background_url": "https://storage.googleapis.com/plotly-prod-profiles/bg-1.jpg", "bio": "", "nickname": "", "website": "", "stream_tokens": null, "feature_set_id": null, "csrf_token": null, "date_joined": "2024-03-20 09:29:50", "mapbox_access_tokens": null, "has_password": null, "username": "k_guney", "email": null, "is_active": null, "readonly": null, "is_dash_creator": null, "dash_created_count": null, "is_chart_creator": null, "charts_created_count": null } }, { "creation_time": "2024-03-22T07:39:13.976292Z", "comments": { "results": [], "count": 0 }, "parented": true, "embed_url": "https://chart-studio.plotly.com/~Kush07/1.embed", "fid": "Kush07:1", "filename": "Lab9", "filetype": "plot", "img_url": "https://storage.googleapis.com/plotly-prod-images/Kush07/1/9_WENC6OPKI5IQWAWWV83A8Y4C56PALN.png", "image_urls": { "default": "https://storage.googleapis.com/plotly-prod-images/Kush07/1/2_2V7OGHFRNTGV7OBP6M5HQBWHPO7LWB.png", "block-thumb": "https://storage.googleapis.com/plotly-prod-images/Kush07/1/8_YCU39JEMPTW0DNDIPWVMNJ7T6S56AP.png", "list-thumb": "https://storage.googleapis.com/plotly-prod-images/Kush07/1/9_WENC6OPKI5IQWAWWV83A8Y4C56PALN.png" }, "api_urls": { "files": "https://api.plotly.com/v2/files/Kush07:1", "plots": "https://api.plotly.com/v2/plots/Kush07:1", "parent": "https://api.plotly.com/v2/folders/home?user=Kush07" }, "owner": "Kush07", "parent": -1, "preview": "", "referencers": [], "references": [], "title": "", "views": 2, "web_url": "https://chart-studio.plotly.com/~Kush07/1/", "world_readable": true, "date_modified": "2024-03-22T07:39:13.988Z", "stars": { "results": [], "count": 0 }, "collaborators": { "results": [], "count": 0 }, "subfolder_count": null, "refresh_interval": null, "organize_view_url": "https://chart-studio.plotly.com/~Kush07/1/", "current_user_permission": "read", "is_theme": null, "is_template": false, "autosize": true, "caption": "", "figure": { "data": [ { "meta": { "columnNames": { "x": "A", "y": "B" } }, "mode": "lines", "name": "Aqua", "type": "scatter", "xsrc": "Kush07:0:2fb355", "ysrc": "Kush07:0:73cd7b" }, { "meta": { "columnNames": { "x": "A", "y": "C" } }, "mode": "lines", "name": "Ammonia", "type": "scatter", "xsrc": "Kush07:0:2fb355", "ysrc": "Kush07:0:d7ab49", "stackgroup": null }, { "meta": { "columnNames": { "x": "A", "y": "D" } }, "mode": "lines", "name": "EthyleneDiamine", "type": "scatter", "xsrc": "Kush07:0:2fb355", "ysrc": "Kush07:0:8a1692", "stackgroup": null } ], "frames": [], "layout": { "title": { "text": "For Ni Complexes" }, "xaxis": { "type": "linear", "range": [ 400, 1000 ], "autorange": true }, "yaxis": { "type": "linear", "range": [ -0.1874444444444444, 2.6414444444444443 ], "autorange": true }, "autosize": true, "template": { "data": { "bar": [ { "type": "bar", "marker": { "colorbar": { "ticks": "", "outlinewidth": 0 } } } ], "table": [ { "type": "table", "cells": { "fill": { "color": "#EBF0F8" }, "line": { "color": "white" } }, "header": { "fill": { "color": "#C8D4E3" }, "line": { "color": "white" } } } ], "carpet": [ { "type": "carpet", "aaxis": { "gridcolor": "#C8D4E3", "linecolor": "#C8D4E3", "endlinecolor": "#2a3f5f", "minorgridcolor": "#C8D4E3", "startlinecolor": "#2a3f5f" }, "baxis": { "gridcolor": "#C8D4E3", "linecolor": "#C8D4E3", "endlinecolor": "#2a3f5f", "minorgridcolor": "#C8D4E3", "startlinecolor": "#2a3f5f" } } ], "mesh3d": [ { "type": "mesh3d", "colorbar": { "ticks": "", "outlinewidth": 0 } } ], "contour": [ { "type": "contour", "colorbar": { "ticks": "", "outlinewidth": 0 }, "autocolorscale": true } ], "heatmap": [ { "type": "heatmap", "colorbar": { "ticks": "", "outlinewidth": 0 }, "autocolorscale": true } ], "scatter": [ { "type": "scatter", "marker": { "colorbar": { "ticks": "", "outlinewidth": 0 } } } ], "surface": [ { "type": "surface", "colorbar": { "ticks": "", "outlinewidth": 0 } } ], "heatmapgl": [ { "type": "heatmapgl", "colorbar": { "ticks": "", "outlinewidth": 0 } } ], "histogram": [ { "type": "histogram", "marker": { "colorbar": { "ticks": "", "outlinewidth": 0 } } } ], "parcoords": [ { "line": { "colorbar": { "ticks": "", "outlinewidth": 0 } }, "type": "parcoords" } ], "scatter3d": [ { "type": "scatter3d", "marker": { "colorbar": { "ticks": "", "outlinewidth": 0 } } } ], "scattergl": [ { "type": "scattergl", "marker": { "colorbar": { "ticks": "", "outlinewidth": 0 } } } ], "choropleth": [ { "type": "choropleth", "colorbar": { "ticks": "", "outlinewidth": 0 } } ], "scattergeo": [ { "type": "scattergeo", "marker": { "colorbar": { "ticks": "", "outlinewidth": 0 } } } ], "histogram2d": [ { "type": "histogram2d", "colorbar": { "ticks": "", "outlinewidth": 0 }, "autocolorscale": true } ], "scatterpolar": [ { "type": "scatterpolar", "marker": { "colorbar": { "ticks": "", "outlinewidth": 0 } } } ], "contourcarpet": [ { "type": "contourcarpet", "colorbar": { "ticks": "", "outlinewidth": 0 } } ], "scattercarpet": [ { "type": "scattercarpet", "marker": { "colorbar": { "ticks": "", "outlinewidth": 0 } } } ], "scattermapbox": [ { "type": "scattermapbox", "marker": { "colorbar": { "ticks": "", "outlinewidth": 0 } } } ], "scatterpolargl": [ { "type": "scatterpolargl", "marker": { "colorbar": { "ticks": "", "outlinewidth": 0 } } } ], "scatterternary": [ { "type": "scatterternary", "marker": { "colorbar": { "ticks": "", "outlinewidth": 0 } } } ], "histogram2dcontour": [ { "type": "histogram2dcontour", "colorbar": { "ticks": "", "outlinewidth": 0 }, "autocolorscale": true } ] }, "layout": { "geo": { "bgcolor": "white", "showland": true, "lakecolor": "white", "landcolor": "white", "showlakes": true, "subunitcolor": "#C8D4E3" }, "font": { "color": "#2a3f5f" }, "polar": { "bgcolor": "white", "radialaxis": { "ticks": "", "gridcolor": "#EBF0F8", "linecolor": "#EBF0F8" }, "angularaxis": { "ticks": "", "gridcolor": "#EBF0F8", "linecolor": "#EBF0F8" } }, "scene": { "xaxis": { "ticks": "", "gridcolor": "#DFE8F3", "gridwidth": 2, "linecolor": "#EBF0F8", "zerolinecolor": "#EBF0F8", "showbackground": true, "backgroundcolor": "white" }, "yaxis": { "ticks": "", "gridcolor": "#DFE8F3", "gridwidth": 2, "linecolor": "#EBF0F8", "zerolinecolor": "#EBF0F8", "showbackground": true, "backgroundcolor": "white" }, "zaxis": { "ticks": "", "gridcolor": "#DFE8F3", "gridwidth": 2, "linecolor": "#EBF0F8", "zerolinecolor": "#EBF0F8", "showbackground": true, "backgroundcolor": "white" } }, "title": { "x": 0.05 }, "xaxis": { "ticks": "", "gridcolor": "#EBF0F8", "linecolor": "#EBF0F8", "automargin": true, "zerolinecolor": "#EBF0F8", "zerolinewidth": 2 }, "yaxis": { "ticks": "", "gridcolor": "#EBF0F8", "linecolor": "#EBF0F8", "automargin": true, "zerolinecolor": "#EBF0F8", "zerolinewidth": 2 }, "ternary": { "aaxis": { "ticks": "", "gridcolor": "#DFE8F3", "linecolor": "#A2B1C6" }, "baxis": { "ticks": "", "gridcolor": "#DFE8F3", "linecolor": "#A2B1C6" }, "caxis": { "ticks": "", "gridcolor": "#DFE8F3", "linecolor": "#A2B1C6" }, "bgcolor": "white" }, "colorway": [ "#636efa", "#EF553B", "#00cc96", "#ab63fa", "#19d3f3", "#e763fa", "#fecb52", "#ffa15a", "#ff6692", "#b6e880" ], "hovermode": "closest", "colorscale": { "diverging": [ [ 0, "#8e0152" ], [ 0.1, "#c51b7d" ], [ 0.2, "#de77ae" ], [ 0.3, "#f1b6da" ], [ 0.4, "#fde0ef" ], [ 0.5, "#f7f7f7" ], [ 0.6, "#e6f5d0" ], [ 0.7, "#b8e186" ], [ 0.8, "#7fbc41" ], [ 0.9, "#4d9221" ], [ 1, "#276419" ] ], "sequential": [ [ 0, "#0508b8" ], [ 0.0893854748603352, "#1910d8" ], [ 0.1787709497206704, "#3c19f0" ], [ 0.2681564245810056, "#6b1cfb" ], [ 0.3575418994413408, "#981cfd" ], [ 0.44692737430167595, "#bf1cfd" ], [ 0.5363128491620112, "#dd2bfd" ], [ 0.6256983240223464, "#f246fe" ], [ 0.7150837988826816, "#fc67fd" ], [ 0.8044692737430168, "#fe88fc" ], [ 0.8938547486033519, "#fea5fd" ], [ 0.9832402234636871, "#febefe" ], [ 1, "#fec3fe" ] ], "sequentialminus": [ [ 0, "#0508b8" ], [ 0.0893854748603352, "#1910d8" ], [ 0.1787709497206704, "#3c19f0" ], [ 0.2681564245810056, "#6b1cfb" ], [ 0.3575418994413408, "#981cfd" ], [ 0.44692737430167595, "#bf1cfd" ], [ 0.5363128491620112, "#dd2bfd" ], [ 0.6256983240223464, "#f246fe" ], [ 0.7150837988826816, "#fc67fd" ], [ 0.8044692737430168, "#fe88fc" ], [ 0.8938547486033519, "#fea5fd" ], [ 0.9832402234636871, "#febefe" ], [ 1, "#fec3fe" ] ] }, "plot_bgcolor": "white", "paper_bgcolor": "white", "shapedefaults": { "line": { "width": 0 }, "opacity": 0.4, "fillcolor": "#506784" }, "annotationdefaults": { "arrowhead": 0, "arrowcolor": "#506784", "arrowwidth": 1 } }, "themeRef": "PLOTLY_WHITE" }, "hovermode": "x" } }, "height": null, "width": null, "user": { "profile_url": "https://chart-studio.plotly.com/~Kush07", "avatar_url": "https://storage.googleapis.com/plotly-prod-profiles/53.jpg", "background_url": "https://storage.googleapis.com/plotly-prod-profiles/bg-7.jpg", "bio": "", "nickname": "", "website": "", "stream_tokens": null, "feature_set_id": null, "csrf_token": null, "date_joined": "2024-03-22 07:13:40", "mapbox_access_tokens": null, "has_password": null, "username": "Kush07", "email": null, "is_active": null, "readonly": null, "is_dash_creator": null, "dash_created_count": null, "is_chart_creator": null, "charts_created_count": null } }, { "creation_time": "2024-03-22T07:26:00.824654Z", "comments": { "results": [], "count": 0 }, "parented": true, "embed_url": "https://chart-studio.plotly.com/~asongupup/118.embed", "fid": "asongupup:118", "filename": "filteredC8", "filetype": "plot", "img_url": "https://storage.googleapis.com/plotly-prod-images/asongupup/118/9_CIE8K4L12JKYPDTLBUP087A7KBAE60.png", "image_urls": { "default": "https://storage.googleapis.com/plotly-prod-images/asongupup/118/2_27ZGL8IFKOAWKI4P0NO5F24SJZD42T.png", "block-thumb": "https://storage.googleapis.com/plotly-prod-images/asongupup/118/8_4GTKGRA5KGRTVM0MV4V6I0UZAPQAK7.png", "list-thumb": "https://storage.googleapis.com/plotly-prod-images/asongupup/118/9_CIE8K4L12JKYPDTLBUP087A7KBAE60.png" }, "api_urls": { "files": "https://api.plotly.com/v2/files/asongupup:118", "plots": "https://api.plotly.com/v2/plots/asongupup:118", "parent": "https://api.plotly.com/v2/folders/home?user=asongupup" }, "owner": "asongupup", "parent": -1, "preview": "", "referencers": [], "references": [], "title": "filteredC8", "views": 1, "web_url": "https://chart-studio.plotly.com/~asongupup/118/filteredc8/", "world_readable": true, "date_modified": "2024-03-22T07:26:01.477Z", "stars": { "results": [], "count": 0 }, "collaborators": { "results": [], "count": 0 }, "subfolder_count": null, "refresh_interval": null, "organize_view_url": "https://chart-studio.plotly.com/~asongupup/118/", "current_user_permission": "read", "is_theme": null, "is_template": null, "autosize": false, "caption": "", "figure": { "data": [ { "line": { "dash": "solid", "color": "rgb(0,113.985,188.955)", "width": 0.5 }, "mode": "lines", "name": "", "type": "scatter", "xsrc": "asongupup:119:b88ebf", "ysrc": "asongupup:119:d17d66", "xaxis": "x1", "yaxis": "y1", "marker": { "line": { "width": 0.5 }, "size": 3.6, "color": "rgb(0,113.985,188.955)" }, "visible": true, "showlegend": false }, { "line": { "dash": "solid", "color": "rgb(0,113.985,188.955)", "width": 0.5 }, "mode": "lines", "name": "-频谱图", "type": "scatter", "xsrc": "asongupup:119:47b62c", "ysrc": "asongupup:119:b65096", "xaxis": "x2", "yaxis": "y2", "marker": { "line": { "width": 0.5 }, "size": 3.6, "color": "rgb(0,113.985,188.955)" }, "visible": true, "showlegend": true } ], "layout": { "title": "filteredC8", "width": 840, "height": 630, "legend": { "x": 0.731309522276833, "y": 0.392050106993014, "font": { "size": 8, "color": "rgb(0,0,0_)", "family": "Arial, sans-serif" }, "xref": "paper", "yref": "paper", "bgcolor": "rgb(255,255,255)", "xanchor": "left", "yanchor": "bottom", "traceorder": "normal", "bordercolor": "rgb(38.25,38.25,38.25)", "borderwidth": 0.5 }, "margin": { "b": 0, "l": 0, "r": 0, "t": 0, "pad": 0 }, "scene1": { "domain": { "x": [ 0.13, 0.905 ], "y": [ 0.583837209302326, 0.925 ] } }, "scene2": { "domain": { "x": [ 0.13, 0.905 ], "y": [ 0.11, 0.451162790697674 ] } }, "xaxis1": { "side": "bottom", "type": "linear", "range": [ 0, 50 ], "ticks": "inside", "title": "time(s)", "anchor": "y1", "domain": [ 0.13, 0.905 ], "mirror": "ticks", "ticklen": 6.51, "showgrid": false, "showline": true, "tickfont": { "size": 9, "color": "rgb(38.250000,38.250000,38.250000)", "family": "Arial, sans-serif" }, "tickmode": "array", "ticktext": [ "0", "5", "10", "15", "20", "25", "30", "35", "40", "45", "50" ], "tickvals": [ 0, 5, 10, 15, 20, 25, 30, 35, 40, 45, 50 ], "zeroline": false, "autorange": false, "gridcolor": "rgba(38.250000,,38.250000,38.250000,0.150000)", "linecolor": "rgb(38.250000,38.250000,38.250000)", "linewidth": 1, "tickangle": 0, "tickcolor": "rgb(38.250000,38.250000,38.250000)", "tickwidth": 1, "titlefont": { "size": 9.9, "color": "rgb(38.250000,38.250000,38.250000)", "family": "Arial, sans-serif" }, "exponentformat": "none", "showticklabels": true }, "xaxis2": { "side": "bottom", "type": "linear", "range": [ 0, 250 ], "ticks": "inside", "title": "频率(Hz)", "anchor": "y2", "domain": [ 0.13, 0.905 ], "mirror": "ticks", "ticklen": 6.51, "showgrid": false, "showline": true, "tickfont": { "size": 9, "color": "rgb(38.250000,38.250000,38.250000)", "family": "Arial, sans-serif" }, "tickmode": "array", "ticktext": [ "0", "50", "100", "150", "200", "250" ], "tickvals": [ 0, 50, 100, 150, 200, 250 ], "zeroline": false, "autorange": false, "gridcolor": "rgba(38.250000,,38.250000,38.250000,0.150000)", "linecolor": "rgb(38.250000,38.250000,38.250000)", "linewidth": 1, "tickangle": 0, "tickcolor": "rgb(38.250000,38.250000,38.250000)", "tickwidth": 1, "titlefont": { "size": 9.9, "color": "rgb(38.250000,38.250000,38.250000)", "family": "Arial, sans-serif" }, "exponentformat": "none", "showticklabels": true }, "yaxis1": { "side": "left", "type": "linear", "range": [ -360.44088992065, 6282.37656058143 ], "ticks": "inside", "title": "uV", "anchor": "x1", "domain": [ 0.583837209302326, 0.925 ], "mirror": "ticks", "ticklen": 6.51, "showgrid": false, "showline": true, "tickfont": { "size": 9, "color": "rgb(38.250000,38.250000,38.250000)", "family": "Arial, sans-serif" }, "tickmode": "array", "ticktext": [ "0", "2000", "4000", "6000" ], "tickvals": [ 0, 2000, 4000, 6000 ], "zeroline": false, "autorange": false, "gridcolor": "rgba(38.250000,,38.250000,38.250000,0.150000)", "linecolor": "rgb(38.250000,38.250000,38.250000)", "linewidth": 1, "tickangle": 0, "tickcolor": "rgb(38.250000,38.250000,38.250000)", "tickwidth": 1, "titlefont": { "size": 9.9, "color": "rgb(38.250000,38.250000,38.250000)", "family": "Arial, sans-serif" }, "exponentformat": "none", "showticklabels": true }, "yaxis2": { "side": "left", "type": "linear", "range": [ 0, 150000000 ], "ticks": "inside", "title": "幅度", "anchor": "x2", "domain": [ 0.11, 0.451162790697674 ], "mirror": "ticks", "ticklen": 6.51, "showgrid": false, "showline": true, "tickfont": { "size": 9, "color": "rgb(38.250000,38.250000,38.250000)", "family": "Arial, sans-serif" }, "tickmode": "array", "ticktext": [ "0", "5", "10", "15" ], "tickvals": [ 0, 50000000, 100000000, 150000000 ], "zeroline": false, "autorange": false, "gridcolor": "rgba(38.250000,,38.250000,38.250000,0.150000)", "linecolor": "rgb(38.250000,38.250000,38.250000)", "linewidth": 1, "tickangle": 0, "tickcolor": "rgb(38.250000,38.250000,38.250000)", "tickwidth": 1, "titlefont": { "size": 9.9, "color": "rgb(38.250000,38.250000,38.250000)", "family": "Arial, sans-serif" }, "exponentformat": "none", "showticklabels": true }, "autosize": false, "hovermode": "closest", "titlefont": { "color": "rgba(0,0,0,0)" }, "showlegend": true, "annotations": [ { "x": 0.5175, "y": 0.935, "font": { "size": 9.9, "color": "rgb(0,0,0)", "family": "Arial, sans-serif" }, "text": "filteredC8", "xref": "paper", "yref": "paper", "align": "center", "xanchor": "center", "yanchor": "bottom", "borderpad": 3, "showarrow": false, "textangle": 0, "bordercolor": "rgba(0,0,0,0)", "borderwidth": 0.5 }, { "x": 0.5175, "y": 0.461162790697674, "font": { "size": 9.9, "color": "rgb(0,0,0)", "family": "Arial, sans-serif" }, "text": "<b></b>", "xref": "paper", "yref": "paper", "align": "center", "xanchor": "center", "yanchor": "bottom", "borderpad": 3, "showarrow": false, "textangle": 0, "bordercolor": "rgba(0,0,0,0)", "borderwidth": 0.5 }, { "x": 0, "y": 150000000, "font": { "size": 9, "color": "rgb(38.250000,38.250000,38.250000)", "family": "Arial, sans-serif" }, "text": "x10^7", "xref": "x2", "yref": "y2", "xanchor": "left", "yanchor": "bottom", "showarrow": false } ], "paper_bgcolor": "rgb(255,255,255)" } }, "height": 630, "width": 840, "user": { "profile_url": "https://chart-studio.plotly.com/~asongupup", "avatar_url": "https://storage.googleapis.com/plotly-prod-profiles/6.jpg", "background_url": "https://storage.googleapis.com/plotly-prod-profiles/bg-5.jpg", "bio": "", "nickname": "", "website": "", "stream_tokens": null, "feature_set_id": null, "csrf_token": null, "date_joined": "2024-02-27 02:46:05", "mapbox_access_tokens": null, "has_password": null, "username": "asongupup", "email": null, "is_active": null, "readonly": null, "is_dash_creator": null, "dash_created_count": null, "is_chart_creator": null, "charts_created_count": null } }, { "creation_time": "2024-03-22T07:25:55.956153Z", "comments": { "results": [], "count": 0 }, "parented": true, "embed_url": "https://chart-studio.plotly.com/~asongupup/116.embed", "fid": "asongupup:116", "filename": "filteredC7", "filetype": "plot", "img_url": "https://storage.googleapis.com/plotly-prod-images/asongupup/116/9_0Y1NSWLAPZHK7XJWVYAME493X3MMF8.png", "image_urls": { "default": "https://storage.googleapis.com/plotly-prod-images/asongupup/116/2_FBK1G9XPYJPTT6ZLH7LMMC7WEWL1WN.png", "block-thumb": "https://storage.googleapis.com/plotly-prod-images/asongupup/116/8_Z9FMLQNI1WF8WKYJSFC11B1SZD0667.png", "list-thumb": "https://storage.googleapis.com/plotly-prod-images/asongupup/116/9_0Y1NSWLAPZHK7XJWVYAME493X3MMF8.png" }, "api_urls": { "files": "https://api.plotly.com/v2/files/asongupup:116", "plots": "https://api.plotly.com/v2/plots/asongupup:116", "parent": "https://api.plotly.com/v2/folders/home?user=asongupup" }, "owner": "asongupup", "parent": -1, "preview": "", "referencers": [], "references": [], "title": "filteredC7", "views": 3, "web_url": "https://chart-studio.plotly.com/~asongupup/116/filteredc7/", "world_readable": true, "date_modified": "2024-03-22T07:25:56.609Z", "stars": { "results": [], "count": 0 }, "collaborators": { "results": [], "count": 0 }, "subfolder_count": null, "refresh_interval": null, "organize_view_url": "https://chart-studio.plotly.com/~asongupup/116/", "current_user_permission": "read", "is_theme": null, "is_template": null, "autosize": false, "caption": "", "figure": { "data": [ { "line": { "dash": "solid", "color": "rgb(0,113.985,188.955)", "width": 0.5 }, "mode": "lines", "name": "", "type": "scatter", "xsrc": "asongupup:117:799670", "ysrc": "asongupup:117:1776ae", "xaxis": "x1", "yaxis": "y1", "marker": { "line": { "width": 0.5 }, "size": 3.6, "color": "rgb(0,113.985,188.955)" }, "visible": true, "showlegend": false }, { "line": { "dash": "solid", "color": "rgb(0,113.985,188.955)", "width": 0.5 }, "mode": "lines", "name": "-频谱图", "type": "scatter", "xsrc": "asongupup:117:4e0312", "ysrc": "asongupup:117:8ac23c", "xaxis": "x2", "yaxis": "y2", "marker": { "line": { "width": 0.5 }, "size": 3.6, "color": "rgb(0,113.985,188.955)" }, "visible": true, "showlegend": true } ], "layout": { "title": "filteredC7", "width": 840, "height": 630, "legend": { "x": 0.731309522276833, "y": 0.392050106993014, "font": { "size": 8, "color": "rgb(0,0,0_)", "family": "Arial, sans-serif" }, "xref": "paper", "yref": "paper", "bgcolor": "rgb(255,255,255)", "xanchor": "left", "yanchor": "bottom", "traceorder": "normal", "bordercolor": "rgb(38.25,38.25,38.25)", "borderwidth": 0.5 }, "margin": { "b": 0, "l": 0, "r": 0, "t": 0, "pad": 0 }, "scene1": { "domain": { "x": [ 0.13, 0.905 ], "y": [ 0.583837209302326, 0.925 ] } }, "scene2": { "domain": { "x": [ 0.13, 0.905 ], "y": [ 0.11, 0.451162790697674 ] } }, "xaxis1": { "side": "bottom", "type": "linear", "range": [ 0, 50 ], "ticks": "inside", "title": "time(s)", "anchor": "y1", "domain": [ 0.13, 0.905 ], "mirror": "ticks", "ticklen": 6.51, "showgrid": false, "showline": true, "tickfont": { "size": 9, "color": "rgb(38.250000,38.250000,38.250000)", "family": "Arial, sans-serif" }, "tickmode": "array", "ticktext": [ "0", "5", "10", "15", "20", "25", "30", "35", "40", "45", "50" ], "tickvals": [ 0, 5, 10, 15, 20, 25, 30, 35, 40, 45, 50 ], "zeroline": false, "autorange": false, "gridcolor": "rgba(38.250000,,38.250000,38.250000,0.150000)", "linecolor": "rgb(38.250000,38.250000,38.250000)", "linewidth": 1, "tickangle": 0, "tickcolor": "rgb(38.250000,38.250000,38.250000)", "tickwidth": 1, "titlefont": { "size": 9.9, "color": "rgb(38.250000,38.250000,38.250000)", "family": "Arial, sans-serif" }, "exponentformat": "none", "showticklabels": true }, "xaxis2": { "side": "bottom", "type": "linear", "range": [ 0, 250 ], "ticks": "inside", "title": "频率(Hz)", "anchor": "y2", "domain": [ 0.13, 0.905 ], "mirror": "ticks", "ticklen": 6.51, "showgrid": false, "showline": true, "tickfont": { "size": 9, "color": "rgb(38.250000,38.250000,38.250000)", "family": "Arial, sans-serif" }, "tickmode": "array", "ticktext": [ "0", "50", "100", "150", "200", "250" ], "tickvals": [ 0, 50, 100, 150, 200, 250 ], "zeroline": false, "autorange": false, "gridcolor": "rgba(38.250000,,38.250000,38.250000,0.150000)", "linecolor": "rgb(38.250000,38.250000,38.250000)", "linewidth": 1, "tickangle": 0, "tickcolor": "rgb(38.250000,38.250000,38.250000)", "tickwidth": 1, "titlefont": { "size": 9.9, "color": "rgb(38.250000,38.250000,38.250000)", "family": "Arial, sans-serif" }, "exponentformat": "none", "showticklabels": true }, "yaxis1": { "side": "left", "type": "linear", "range": [ -358.635371992354, 6251.10964693568 ], "ticks": "inside", "title": "uV", "anchor": "x1", "domain": [ 0.583837209302326, 0.925 ], "mirror": "ticks", "ticklen": 6.51, "showgrid": false, "showline": true, "tickfont": { "size": 9, "color": "rgb(38.250000,38.250000,38.250000)", "family": "Arial, sans-serif" }, "tickmode": "array", "ticktext": [ "0", "2000", "4000", "6000" ], "tickvals": [ 0, 2000, 4000, 6000 ], "zeroline": false, "autorange": false, "gridcolor": "rgba(38.250000,,38.250000,38.250000,0.150000)", "linecolor": "rgb(38.250000,38.250000,38.250000)", "linewidth": 1, "tickangle": 0, "tickcolor": "rgb(38.250000,38.250000,38.250000)", "tickwidth": 1, "titlefont": { "size": 9.9, "color": "rgb(38.250000,38.250000,38.250000)", "family": "Arial, sans-serif" }, "exponentformat": "none", "showticklabels": true }, "yaxis2": { "side": "left", "type": "linear", "range": [ 0, 150000000 ], "ticks": "inside", "title": "幅度", "anchor": "x2", "domain": [ 0.11, 0.451162790697674 ], "mirror": "ticks", "ticklen": 6.51, "showgrid": false, "showline": true, "tickfont": { "size": 9, "color": "rgb(38.250000,38.250000,38.250000)", "family": "Arial, sans-serif" }, "tickmode": "array", "ticktext": [ "0", "5", "10", "15" ], "tickvals": [ 0, 50000000, 100000000, 150000000 ], "zeroline": false, "autorange": false, "gridcolor": "rgba(38.250000,,38.250000,38.250000,0.150000)", "linecolor": "rgb(38.250000,38.250000,38.250000)", "linewidth": 1, "tickangle": 0, "tickcolor": "rgb(38.250000,38.250000,38.250000)", "tickwidth": 1, "titlefont": { "size": 9.9, "color": "rgb(38.250000,38.250000,38.250000)", "family": "Arial, sans-serif" }, "exponentformat": "none", "showticklabels": true }, "autosize": false, "hovermode": "closest", "titlefont": { "color": "rgba(0,0,0,0)" }, "showlegend": true, "annotations": [ { "x": 0.5175, "y": 0.935, "font": { "size": 9.9, "color": "rgb(0,0,0)", "family": "Arial, sans-serif" }, "text": "filteredC7", "xref": "paper", "yref": "paper", "align": "center", "xanchor": "center", "yanchor": "bottom", "borderpad": 3, "showarrow": false, "textangle": 0, "bordercolor": "rgba(0,0,0,0)", "borderwidth": 0.5 }, { "x": 0.5175, "y": 0.461162790697674, "font": { "size": 9.9, "color": "rgb(0,0,0)", "family": "Arial, sans-serif" }, "text": "<b></b>", "xref": "paper", "yref": "paper", "align": "center", "xanchor": "center", "yanchor": "bottom", "borderpad": 3, "showarrow": false, "textangle": 0, "bordercolor": "rgba(0,0,0,0)", "borderwidth": 0.5 }, { "x": 0, "y": 150000000, "font": { "size": 9, "color": "rgb(38.250000,38.250000,38.250000)", "family": "Arial, sans-serif" }, "text": "x10^7", "xref": "x2", "yref": "y2", "xanchor": "left", "yanchor": "bottom", "showarrow": false } ], "paper_bgcolor": "rgb(255,255,255)" } }, "height": 630, "width": 840, "user": { "profile_url": "https://chart-studio.plotly.com/~asongupup", "avatar_url": "https://storage.googleapis.com/plotly-prod-profiles/6.jpg", "background_url": "https://storage.googleapis.com/plotly-prod-profiles/bg-5.jpg", "bio": "", "nickname": "", "website": "", "stream_tokens": null, "feature_set_id": null, "csrf_token": null, "date_joined": "2024-02-27 02:46:05", "mapbox_access_tokens": null, "has_password": null, "username": "asongupup", "email": null, "is_active": null, "readonly": null, "is_dash_creator": null, "dash_created_count": null, "is_chart_creator": null, "charts_created_count": null } }, { "creation_time": "2024-03-22T07:25:51.254719Z", "comments": { "results": [], "count": 0 }, "parented": true, "embed_url": "https://chart-studio.plotly.com/~asongupup/114.embed", "fid": "asongupup:114", "filename": "filteredC2", "filetype": "plot", "img_url": "https://storage.googleapis.com/plotly-prod-images/asongupup/114/9_OLNAUP5XJ2FS5J2Q5JJUKCXWNVNXX5.png", "image_urls": { "default": "https://storage.googleapis.com/plotly-prod-images/asongupup/114/2_NAV06T3CKTH9IJD0P0JG9A8MBQ3RTA.png", "block-thumb": "https://storage.googleapis.com/plotly-prod-images/asongupup/114/8_89TFTD2CPLE39KJ2NXNMW4AFAC5M7R.png", "list-thumb": "https://storage.googleapis.com/plotly-prod-images/asongupup/114/9_OLNAUP5XJ2FS5J2Q5JJUKCXWNVNXX5.png" }, "api_urls": { "files": "https://api.plotly.com/v2/files/asongupup:114", "plots": "https://api.plotly.com/v2/plots/asongupup:114", "parent": "https://api.plotly.com/v2/folders/home?user=asongupup" }, "owner": "asongupup", "parent": -1, "preview": "", "referencers": [], "references": [], "title": "filteredC2", "views": 3, "web_url": "https://chart-studio.plotly.com/~asongupup/114/filteredc2/", "world_readable": true, "date_modified": "2024-03-22T07:25:51.861Z", "stars": { "results": [], "count": 0 }, "collaborators": { "results": [], "count": 0 }, "subfolder_count": null, "refresh_interval": null, "organize_view_url": "https://chart-studio.plotly.com/~asongupup/114/", "current_user_permission": "read", "is_theme": null, "is_template": null, "autosize": false, "caption": "", "figure": { "data": [ { "line": { "dash": "solid", "color": "rgb(0,113.985,188.955)", "width": 0.5 }, "mode": "lines", "name": "", "type": "scatter", "xsrc": "asongupup:115:4a864c", "ysrc": "asongupup:115:f61274", "xaxis": "x1", "yaxis": "y1", "marker": { "line": { "width": 0.5 }, "size": 3.6, "color": "rgb(0,113.985,188.955)" }, "visible": true, "showlegend": false }, { "line": { "dash": "solid", "color": "rgb(0,113.985,188.955)", "width": 0.5 }, "mode": "lines", "name": "-频谱图", "type": "scatter", "xsrc": "asongupup:115:2a7ae2", "ysrc": "asongupup:115:7b1c69", "xaxis": "x2", "yaxis": "y2", "marker": { "line": { "width": 0.5 }, "size": 3.6, "color": "rgb(0,113.985,188.955)" }, "visible": true, "showlegend": true } ], "layout": { "title": "filteredC2", "width": 840, "height": 630, "legend": { "x": 0.731309522276833, "y": 0.392050106993014, "font": { "size": 8, "color": "rgb(0,0,0_)", "family": "Arial, sans-serif" }, "xref": "paper", "yref": "paper", "bgcolor": "rgb(255,255,255)", "xanchor": "left", "yanchor": "bottom", "traceorder": "normal", "bordercolor": "rgb(38.25,38.25,38.25)", "borderwidth": 0.5 }, "margin": { "b": 0, "l": 0, "r": 0, "t": 0, "pad": 0 }, "scene1": { "domain": { "x": [ 0.13, 0.905 ], "y": [ 0.583837209302326, 0.925 ] } }, "scene2": { "domain": { "x": [ 0.13, 0.905 ], "y": [ 0.11, 0.451162790697674 ] } }, "xaxis1": { "side": "bottom", "type": "linear", "range": [ 0, 50 ], "ticks": "inside", "title": "time(s)", "anchor": "y1", "domain": [ 0.13, 0.905 ], "mirror": "ticks", "ticklen": 6.51, "showgrid": false, "showline": true, "tickfont": { "size": 9, "color": "rgb(38.250000,38.250000,38.250000)", "family": "Arial, sans-serif" }, "tickmode": "array", "ticktext": [ "0", "5", "10", "15", "20", "25", "30", "35", "40", "45", "50" ], "tickvals": [ 0, 5, 10, 15, 20, 25, 30, 35, 40, 45, 50 ], "zeroline": false, "autorange": false, "gridcolor": "rgba(38.250000,,38.250000,38.250000,0.150000)", "linecolor": "rgb(38.250000,38.250000,38.250000)", "linewidth": 1, "tickangle": 0, "tickcolor": "rgb(38.250000,38.250000,38.250000)", "tickwidth": 1, "titlefont": { "size": 9.9, "color": "rgb(38.250000,38.250000,38.250000)", "family": "Arial, sans-serif" }, "exponentformat": "none", "showticklabels": true }, "xaxis2": { "side": "bottom", "type": "linear", "range": [ 0, 250 ], "ticks": "inside", "title": "频率(Hz)", "anchor": "y2", "domain": [ 0.13, 0.905 ], "mirror": "ticks", "ticklen": 6.51, "showgrid": false, "showline": true, "tickfont": { "size": 9, "color": "rgb(38.250000,38.250000,38.250000)", "family": "Arial, sans-serif" }, "tickmode": "array", "ticktext": [ "0", "50", "100", "150", "200", "250" ], "tickvals": [ 0, 50, 100, 150, 200, 250 ], "zeroline": false, "autorange": false, "gridcolor": "rgba(38.250000,,38.250000,38.250000,0.150000)", "linecolor": "rgb(38.250000,38.250000,38.250000)", "linewidth": 1, "tickangle": 0, "tickcolor": "rgb(38.250000,38.250000,38.250000)", "tickwidth": 1, "titlefont": { "size": 9.9, "color": "rgb(38.250000,38.250000,38.250000)", "family": "Arial, sans-serif" }, "exponentformat": "none", "showticklabels": true }, "yaxis1": { "side": "left", "type": "linear", "range": [ -358.454667130081, 6247.89738191565 ], "ticks": "inside", "title": "uV", "anchor": "x1", "domain": [ 0.583837209302326, 0.925 ], "mirror": "ticks", "ticklen": 6.51, "showgrid": false, "showline": true, "tickfont": { "size": 9, "color": "rgb(38.250000,38.250000,38.250000)", "family": "Arial, sans-serif" }, "tickmode": "array", "ticktext": [ "0", "2000", "4000", "6000" ], "tickvals": [ 0, 2000, 4000, 6000 ], "zeroline": false, "autorange": false, "gridcolor": "rgba(38.250000,,38.250000,38.250000,0.150000)", "linecolor": "rgb(38.250000,38.250000,38.250000)", "linewidth": 1, "tickangle": 0, "tickcolor": "rgb(38.250000,38.250000,38.250000)", "tickwidth": 1, "titlefont": { "size": 9.9, "color": "rgb(38.250000,38.250000,38.250000)", "family": "Arial, sans-serif" }, "exponentformat": "none", "showticklabels": true }, "yaxis2": { "side": "left", "type": "linear", "range": [ 0, 150000000 ], "ticks": "inside", "title": "幅度", "anchor": "x2", "domain": [ 0.11, 0.451162790697674 ], "mirror": "ticks", "ticklen": 6.51, "showgrid": false, "showline": true, "tickfont": { "size": 9, "color": "rgb(38.250000,38.250000,38.250000)", "family": "Arial, sans-serif" }, "tickmode": "array", "ticktext": [ "0", "5", "10", "15" ], "tickvals": [ 0, 50000000, 100000000, 150000000 ], "zeroline": false, "autorange": false, "gridcolor": "rgba(38.250000,,38.250000,38.250000,0.150000)", "linecolor": "rgb(38.250000,38.250000,38.250000)", "linewidth": 1, "tickangle": 0, "tickcolor": "rgb(38.250000,38.250000,38.250000)", "tickwidth": 1, "titlefont": { "size": 9.9, "color": "rgb(38.250000,38.250000,38.250000)", "family": "Arial, sans-serif" }, "exponentformat": "none", "showticklabels": true }, "autosize": false, "hovermode": "closest", "titlefont": { "color": "rgba(0,0,0,0)" }, "showlegend": true, "annotations": [ { "x": 0.5175, "y": 0.935, "font": { "size": 9.9, "color": "rgb(0,0,0)", "family": "Arial, sans-serif" }, "text": "filteredC2", "xref": "paper", "yref": "paper", "align": "center", "xanchor": "center", "yanchor": "bottom", "borderpad": 3, "showarrow": false, "textangle": 0, "bordercolor": "rgba(0,0,0,0)", "borderwidth": 0.5 }, { "x": 0.5175, "y": 0.461162790697674, "font": { "size": 9.9, "color": "rgb(0,0,0)", "family": "Arial, sans-serif" }, "text": "<b></b>", "xref": "paper", "yref": "paper", "align": "center", "xanchor": "center", "yanchor": "bottom", "borderpad": 3, "showarrow": false, "textangle": 0, "bordercolor": "rgba(0,0,0,0)", "borderwidth": 0.5 }, { "x": 0, "y": 150000000, "font": { "size": 9, "color": "rgb(38.250000,38.250000,38.250000)", "family": "Arial, sans-serif" }, "text": "x10^7", "xref": "x2", "yref": "y2", "xanchor": "left", "yanchor": "bottom", "showarrow": false } ], "paper_bgcolor": "rgb(255,255,255)" } }, "height": 630, "width": 840, "user": { "profile_url": "https://chart-studio.plotly.com/~asongupup", "avatar_url": "https://storage.googleapis.com/plotly-prod-profiles/6.jpg", "background_url": "https://storage.googleapis.com/plotly-prod-profiles/bg-5.jpg", "bio": "", "nickname": "", "website": "", "stream_tokens": null, "feature_set_id": null, "csrf_token": null, "date_joined": "2024-02-27 02:46:05", "mapbox_access_tokens": null, "has_password": null, "username": "asongupup", "email": null, "is_active": null, "readonly": null, "is_dash_creator": null, "dash_created_count": null, "is_chart_creator": null, "charts_created_count": null } }, { "creation_time": "2024-03-22T07:22:38.034125Z", "comments": { "results": [], "count": 0 }, "parented": true, "embed_url": "https://chart-studio.plotly.com/~bayreuthss/203.embed", "fid": "bayreuthss:203", "filename": "ECCM 3D Strength", "filetype": "plot", "img_url": "https://storage.googleapis.com/plotly-prod-images/bayreuthss/203/9_YOKRTXK5GXX9A9VF2LL53JWV8VNFLC.png", "image_urls": { "default": "https://storage.googleapis.com/plotly-prod-images/bayreuthss/203/2_KBNRZXV4PF9GUFZ2675OY219H0BNVN.png", "block-thumb": "https://storage.googleapis.com/plotly-prod-images/bayreuthss/203/8_N79F2Z6HG81LDXCZ4A41BQ2KY8RW7I.png", "list-thumb": "https://storage.googleapis.com/plotly-prod-images/bayreuthss/203/9_YOKRTXK5GXX9A9VF2LL53JWV8VNFLC.png" }, "api_urls": { "files": "https://api.plotly.com/v2/files/bayreuthss:203", "plots": "https://api.plotly.com/v2/plots/bayreuthss:203", "parent": "https://api.plotly.com/v2/folders/home?user=bayreuthss" }, "owner": "bayreuthss", "parent": -1, "preview": "", "referencers": [], "references": [], "title": "", "views": 2, "web_url": "https://chart-studio.plotly.com/~bayreuthss/203/", "world_readable": true, "date_modified": "2025-01-10T09:26:47.262Z", "stars": { "results": [], "count": 0 }, "collaborators": { "results": [], "count": 0 }, "subfolder_count": null, "refresh_interval": null, "organize_view_url": "https://chart-studio.plotly.com/~bayreuthss/203/", "current_user_permission": "read", "is_theme": null, "is_template": false, "autosize": true, "caption": "", "figure": { "data": [ { "line": { "dash": "dash" }, "meta": { "columnNames": { "x": "C", "y": "B", "z": "A", "error_x": { "array": "D" } } }, "mode": "markers+lines", "name": "E100:GF-BD", "type": "scatter3d", "xsrc": "bayreuthss:202:ac3c91", "ysrc": "bayreuthss:202:18d545", "zsrc": "bayreuthss:202:a48007", "marker": { "color": "rgb(1, 13, 9)" }, "error_x": { "meta": { "columnNames": { "array": "D" } }, "type": "data", "width": 4, "visible": true, "arraysrc": "bayreuthss:202:c33734", "symmetric": true, "thickness": 2 } }, { "line": { "dash": "dash" }, "meta": { "columnNames": { "x": "G", "y": "F", "z": "E", "error_x": { "array": "H" } } }, "mode": "markers+lines", "name": "E90InSi2APP8:GF-BD", "type": "scatter3d", "xsrc": "bayreuthss:202:f49d30", "ysrc": "bayreuthss:202:d87336", "zsrc": "bayreuthss:202:9b273f", "scene": "scene", "marker": { "color": "rgb(255, 165, 0)" }, "error_x": { "meta": { "columnNames": { "array": "H" } }, "type": "data", "width": 4, "visible": true, "arraysrc": "bayreuthss:202:d38e12", "symmetric": true } }, { "line": { "dash": "dash" }, "meta": { "columnNames": { "x": "K", "y": "J", "z": "I", "error_x": { "array": "L" } } }, "mode": "markers+lines", "name": "E70InSi6APP24:GF-BD", "type": "scatter3d", "xsrc": "bayreuthss:202:14023f", "ysrc": "bayreuthss:202:830722", "zsrc": "bayreuthss:202:3be5cc", "marker": { "line": { "color": "rgb(204, 107, 0)", "width": 0 }, "size": 8, "color": "rgb(204, 107, 0)" }, "error_x": { "meta": { "columnNames": { "array": "L" } }, "type": "data", "width": 4, "visible": true, "arraysrc": "bayreuthss:202:ebc9f7", "symmetric": true }, "visible": true, "connectgaps": false }, { "line": { "dash": "dash" }, "meta": { "columnNames": { "x": "O", "y": "N", "z": "M", "error_x": { "array": "P" } } }, "mode": "markers+lines", "name": "E50InSi10APP40:GF-BD", "type": "scatter3d", "xsrc": "bayreuthss:202:553d26", "ysrc": "bayreuthss:202:132fc8", "zsrc": "bayreuthss:202:4d2add", "marker": { "color": "rgb(227, 97, 50)" }, "error_x": { "meta": { "columnNames": { "array": "P" } }, "type": "data", "width": 4, "visible": true, "arraysrc": "bayreuthss:202:6ebd79", "symmetric": true }, "visible": true } ], "frames": [], "layout": { "scene": { "xaxis": { "type": "linear", "ticks": "outside", "title": { "font": { "size": 20, "family": "Times New Roman" }, "text": "Flexural Strength [MPa]" }, "showline": true, "tickfont": { "size": 14, "family": "Times New Roman" }, "linecolor": "rgb(34, 35, 36)", "tickangle": 45, "tickformat": "", "exponentformat": "E" }, "yaxis": { "type": "linear", "ticks": "outside", "title": { "font": { "size": 20, "family": "Times New Roman" }, "text": "Time [min]" }, "showline": true, "tickfont": { "size": 14, "color": "rgb(37, 201, 75)", "family": "Times New Roman" }, "gridcolor": "rgb(166, 237, 182)", "linecolor": "rgb(34, 35, 36)", "tickangle": 45, "tickformat": "", "exponentformat": "E" }, "zaxis": { "type": "linear", "ticks": "outside", "title": { "font": { "size": 20, "family": "Times New Roman" }, "text": "Heat flux [kW/m<sup>2</sup>]" }, "showline": true, "tickfont": { "size": 14, "color": "rgb(186, 36, 144)", "family": "Times New Roman" }, "gridcolor": "rgb(222, 171, 208)", "linecolor": "rgb(34, 35, 36)", "tickangle": 45, "tickformat": "", "exponentformat": "E" }, "camera": { "up": { "x": 0.9347553336898715, "y": -0.3141867072997305, "z": -0.16588905658448666 }, "eye": { "x": 0.5623493936124211, "y": 1.8602313428751627, "z": 0.8594154154695532 }, "center": { "x": -0.25759539124447584, "y": -0.25624873659989106, "z": 0.24769420956373994 }, "projection": { "type": "perspective" } }, "dragmode": "orbit", "aspectmode": "auto", "aspectratio": { "x": 1, "y": 1, "z": 1 } }, "xaxis": { "type": "linear", "range": [ -10.824679431634284, 247.27277460105134 ], "autorange": true }, "yaxis": { "type": "linear", "range": [ -0.32869012707722384, 5.328690127077224 ], "autorange": true }, "legend": { "x": 0.6787667913546425, "y": 1.0009079087798378, "font": { "size": 20, "family": "Times New Roman" }, "borderwidth": 2 }, "autosize": true, "dragmode": "zoom", "template": { "data": { "bar": [ { "type": "bar", "marker": { "colorbar": { "ticks": "", "outlinewidth": 0 } } } ], "table": [ { "type": "table", "cells": { "fill": { "color": "#EBF0F8" }, "line": { "color": "white" } }, "header": { "fill": { "color": "#C8D4E3" }, "line": { "color": "white" } } } ], "carpet": [ { "type": "carpet", "aaxis": { "gridcolor": "#C8D4E3", "linecolor": "#C8D4E3", "endlinecolor": "#2a3f5f", "minorgridcolor": "#C8D4E3", "startlinecolor": "#2a3f5f" }, "baxis": { "gridcolor": "#C8D4E3", "linecolor": "#C8D4E3", "endlinecolor": "#2a3f5f", "minorgridcolor": "#C8D4E3", "startlinecolor": "#2a3f5f" } } ], "mesh3d": [ { "type": "mesh3d", "colorbar": { "ticks": "", "outlinewidth": 0 } } ], "contour": [ { "type": "contour", "colorbar": { "ticks": "", "outlinewidth": 0 }, "autocolorscale": true } ], "heatmap": [ { "type": "heatmap", "colorbar": { "ticks": "", "outlinewidth": 0 }, "autocolorscale": true } ], "scatter": [ { "type": "scatter", "marker": { "colorbar": { "ticks": "", "outlinewidth": 0 } } } ], "surface": [ { "type": "surface", "colorbar": { "ticks": "", "outlinewidth": 0 } } ], "heatmapgl": [ { "type": "heatmapgl", "colorbar": { "ticks": "", "outlinewidth": 0 } } ], "histogram": [ { "type": "histogram", "marker": { "colorbar": { "ticks": "", "outlinewidth": 0 } } } ], "parcoords": [ { "line": { "colorbar": { "ticks": "", "outlinewidth": 0 } }, "type": "parcoords" } ], "scatter3d": [ { "type": "scatter3d", "marker": { "colorbar": { "ticks": "", "outlinewidth": 0 } } } ], "scattergl": [ { "type": "scattergl", "marker": { "colorbar": { "ticks": "", "outlinewidth": 0 } } } ], "choropleth": [ { "type": "choropleth", "colorbar": { "ticks": "", "outlinewidth": 0 } } ], "scattergeo": [ { "type": "scattergeo", "marker": { "colorbar": { "ticks": "", "outlinewidth": 0 } } } ], "histogram2d": [ { "type": "histogram2d", "colorbar": { "ticks": "", "outlinewidth": 0 }, "autocolorscale": true } ], "scatterpolar": [ { "type": "scatterpolar", "marker": { "colorbar": { "ticks": "", "outlinewidth": 0 } } } ], "contourcarpet": [ { "type": "contourcarpet", "colorbar": { "ticks": "", "outlinewidth": 0 } } ], "scattercarpet": [ { "type": "scattercarpet", "marker": { "colorbar": { "ticks": "", "outlinewidth": 0 } } } ], "scattermapbox": [ { "type": "scattermapbox", "marker": { "colorbar": { "ticks": "", "outlinewidth": 0 } } } ], "scatterpolargl": [ { "type": "scatterpolargl", "marker": { "colorbar": { "ticks": "", "outlinewidth": 0 } } } ], "scatterternary": [ { "type": "scatterternary", "marker": { "colorbar": { "ticks": "", "outlinewidth": 0 } } } ], "histogram2dcontour": [ { "type": "histogram2dcontour", "colorbar": { "ticks": "", "outlinewidth": 0 }, "autocolorscale": true } ] }, "layout": { "geo": { "bgcolor": "white", "showland": true, "lakecolor": "white", "landcolor": "white", "showlakes": true, "subunitcolor": "#C8D4E3" }, "font": { "color": "#2a3f5f" }, "polar": { "bgcolor": "white", "radialaxis": { "ticks": "", "gridcolor": "#EBF0F8", "linecolor": "#EBF0F8" }, "angularaxis": { "ticks": "", "gridcolor": "#EBF0F8", "linecolor": "#EBF0F8" } }, "scene": { "xaxis": { "ticks": "", "gridcolor": "#DFE8F3", "gridwidth": 2, "linecolor": "#EBF0F8", "zerolinecolor": "#EBF0F8", "showbackground": true, "backgroundcolor": "white" }, "yaxis": { "ticks": "", "gridcolor": "#DFE8F3", "gridwidth": 2, "linecolor": "#EBF0F8", "zerolinecolor": "#EBF0F8", "showbackground": true, "backgroundcolor": "white" }, "zaxis": { "ticks": "", "gridcolor": "#DFE8F3", "gridwidth": 2, "linecolor": "#EBF0F8", "zerolinecolor": "#EBF0F8", "showbackground": true, "backgroundcolor": "white" } }, "title": { "x": 0.05 }, "xaxis": { "ticks": "", "gridcolor": "#EBF0F8", "linecolor": "#EBF0F8", "automargin": true, "zerolinecolor": "#EBF0F8", "zerolinewidth": 2 }, "yaxis": { "ticks": "", "gridcolor": "#EBF0F8", "linecolor": "#EBF0F8", "automargin": true, "zerolinecolor": "#EBF0F8", "zerolinewidth": 2 }, "ternary": { "aaxis": { "ticks": "", "gridcolor": "#DFE8F3", "linecolor": "#A2B1C6" }, "baxis": { "ticks": "", "gridcolor": "#DFE8F3", "linecolor": "#A2B1C6" }, "caxis": { "ticks": "", "gridcolor": "#DFE8F3", "linecolor": "#A2B1C6" }, "bgcolor": "white" }, "colorway": [ "#636efa", "#EF553B", "#00cc96", "#ab63fa", "#19d3f3", "#e763fa", "#fecb52", "#ffa15a", "#ff6692", "#b6e880" ], "hovermode": "closest", "colorscale": { "diverging": [ [ 0, "#8e0152" ], [ 0.1, "#c51b7d" ], [ 0.2, "#de77ae" ], [ 0.3, "#f1b6da" ], [ 0.4, "#fde0ef" ], [ 0.5, "#f7f7f7" ], [ 0.6, "#e6f5d0" ], [ 0.7, "#b8e186" ], [ 0.8, "#7fbc41" ], [ 0.9, "#4d9221" ], [ 1, "#276419" ] ], "sequential": [ [ 0, "#0508b8" ], [ 0.0893854748603352, "#1910d8" ], [ 0.1787709497206704, "#3c19f0" ], [ 0.2681564245810056, "#6b1cfb" ], [ 0.3575418994413408, "#981cfd" ], [ 0.44692737430167595, "#bf1cfd" ], [ 0.5363128491620112, "#dd2bfd" ], [ 0.6256983240223464, "#f246fe" ], [ 0.7150837988826816, "#fc67fd" ], [ 0.8044692737430168, "#fe88fc" ], [ 0.8938547486033519, "#fea5fd" ], [ 0.9832402234636871, "#febefe" ], [ 1, "#fec3fe" ] ], "sequentialminus": [ [ 0, "#0508b8" ], [ 0.0893854748603352, "#1910d8" ], [ 0.1787709497206704, "#3c19f0" ], [ 0.2681564245810056, "#6b1cfb" ], [ 0.3575418994413408, "#981cfd" ], [ 0.44692737430167595, "#bf1cfd" ], [ 0.5363128491620112, "#dd2bfd" ], [ 0.6256983240223464, "#f246fe" ], [ 0.7150837988826816, "#fc67fd" ], [ 0.8044692737430168, "#fe88fc" ], [ 0.8938547486033519, "#fea5fd" ], [ 0.9832402234636871, "#febefe" ], [ 1, "#fec3fe" ] ] }, "plot_bgcolor": "white", "paper_bgcolor": "white", "shapedefaults": { "line": { "width": 0 }, "opacity": 0.4, "fillcolor": "#506784" }, "annotationdefaults": { "arrowhead": 0, "arrowcolor": "#506784", "arrowwidth": 1 } }, "themeRef": "PLOTLY_WHITE" } } }, "height": null, "width": null, "user": { "profile_url": "https://chart-studio.plotly.com/~bayreuthss", "avatar_url": "https://storage.googleapis.com/plotly-prod-profiles/25.jpg", "background_url": "https://storage.googleapis.com/plotly-prod-profiles/bg-10.jpg", "bio": "", "nickname": "unnamedss", "website": "", "stream_tokens": null, "feature_set_id": null, "csrf_token": null, "date_joined": "2022-02-18 10:12:23", "mapbox_access_tokens": null, "has_password": null, "username": "bayreuthss", "email": null, "is_active": null, "readonly": null, "is_dash_creator": null, "dash_created_count": null, "is_chart_creator": null, "charts_created_count": null } }, { "creation_time": "2024-03-22T07:22:20.633250Z", "comments": { "results": [], "count": 0 }, "parented": true, "embed_url": "https://chart-studio.plotly.com/~asongupup/112.embed", "fid": "asongupup:112", "filename": "filteredC1", "filetype": "plot", "img_url": "https://storage.googleapis.com/plotly-prod-images/asongupup/112/9_TJ7I19P8MUQUSB8IIUS2R3BO5H3FBR.png", "image_urls": { "default": "https://storage.googleapis.com/plotly-prod-images/asongupup/112/2_1QO4ZWCZGDNORINWT7114WU5MB6NQ0.png", "block-thumb": "https://storage.googleapis.com/plotly-prod-images/asongupup/112/8_4MRUGHTZR908OVC01KGGUIFDS20412.png", "list-thumb": "https://storage.googleapis.com/plotly-prod-images/asongupup/112/9_TJ7I19P8MUQUSB8IIUS2R3BO5H3FBR.png" }, "api_urls": { "files": "https://api.plotly.com/v2/files/asongupup:112", "plots": "https://api.plotly.com/v2/plots/asongupup:112", "parent": "https://api.plotly.com/v2/folders/home?user=asongupup" }, "owner": "asongupup", "parent": -1, "preview": "", "referencers": [], "references": [], "title": "filteredC1", "views": 1, "web_url": "https://chart-studio.plotly.com/~asongupup/112/filteredc1/", "world_readable": true, "date_modified": "2024-03-22T07:22:21.279Z", "stars": { "results": [], "count": 0 }, "collaborators": { "results": [], "count": 0 }, "subfolder_count": null, "refresh_interval": null, "organize_view_url": "https://chart-studio.plotly.com/~asongupup/112/", "current_user_permission": "read", "is_theme": null, "is_template": null, "autosize": false, "caption": "", "figure": { "data": [ { "line": { "dash": "solid", "color": "rgb(0,113.985,188.955)", "width": 0.5 }, "mode": "lines", "name": "", "type": "scatter", "xsrc": "asongupup:113:a87af7", "ysrc": "asongupup:113:d5b624", "xaxis": "x1", "yaxis": "y1", "marker": { "line": { "width": 0.5 }, "size": 3.6, "color": "rgb(0,113.985,188.955)" }, "visible": true, "showlegend": false }, { "line": { "dash": "solid", "color": "rgb(0,113.985,188.955)", "width": 0.5 }, "mode": "lines", "name": "-频谱图", "type": "scatter", "xsrc": "asongupup:113:e165cb", "ysrc": "asongupup:113:933e92", "xaxis": "x2", "yaxis": "y2", "marker": { "line": { "width": 0.5 }, "size": 3.6, "color": "rgb(0,113.985,188.955)" }, "visible": true, "showlegend": true } ], "layout": { "title": "filteredC1", "width": 840, "height": 630, "legend": { "x": 0.731309522276833, "y": 0.392050106993014, "font": { "size": 8, "color": "rgb(0,0,0_)", "family": "Arial, sans-serif" }, "xref": "paper", "yref": "paper", "bgcolor": "rgb(255,255,255)", "xanchor": "left", "yanchor": "bottom", "traceorder": "normal", "bordercolor": "rgb(38.25,38.25,38.25)", "borderwidth": 0.5 }, "margin": { "b": 0, "l": 0, "r": 0, "t": 0, "pad": 0 }, "scene1": { "domain": { "x": [ 0.13, 0.905 ], "y": [ 0.583837209302326, 0.925 ] } }, "scene2": { "domain": { "x": [ 0.13, 0.905 ], "y": [ 0.11, 0.451162790697674 ] } }, "xaxis1": { "side": "bottom", "type": "linear", "range": [ 0, 50 ], "ticks": "inside", "title": "time(s)", "anchor": "y1", "domain": [ 0.13, 0.905 ], "mirror": "ticks", "ticklen": 6.51, "showgrid": false, "showline": true, "tickfont": { "size": 9, "color": "rgb(38.250000,38.250000,38.250000)", "family": "Arial, sans-serif" }, "tickmode": "array", "ticktext": [ "0", "5", "10", "15", "20", "25", "30", "35", "40", "45", "50" ], "tickvals": [ 0, 5, 10, 15, 20, 25, 30, 35, 40, 45, 50 ], "zeroline": false, "autorange": false, "gridcolor": "rgba(38.250000,,38.250000,38.250000,0.150000)", "linecolor": "rgb(38.250000,38.250000,38.250000)", "linewidth": 1, "tickangle": 0, "tickcolor": "rgb(38.250000,38.250000,38.250000)", "tickwidth": 1, "titlefont": { "size": 9.9, "color": "rgb(38.250000,38.250000,38.250000)", "family": "Arial, sans-serif" }, "exponentformat": "none", "showticklabels": true }, "xaxis2": { "side": "bottom", "type": "linear", "range": [ 0, 250 ], "ticks": "inside", "title": "频率(Hz)", "anchor": "y2", "domain": [ 0.13, 0.905 ], "mirror": "ticks", "ticklen": 6.51, "showgrid": false, "showline": true, "tickfont": { "size": 9, "color": "rgb(38.250000,38.250000,38.250000)", "family": "Arial, sans-serif" }, "tickmode": "array", "ticktext": [ "0", "50", "100", "150", "200", "250" ], "tickvals": [ 0, 50, 100, 150, 200, 250 ], "zeroline": false, "autorange": false, "gridcolor": "rgba(38.250000,,38.250000,38.250000,0.150000)", "linecolor": "rgb(38.250000,38.250000,38.250000)", "linewidth": 1, "tickangle": 0, "tickcolor": "rgb(38.250000,38.250000,38.250000)", "tickwidth": 1, "titlefont": { "size": 9.9, "color": "rgb(38.250000,38.250000,38.250000)", "family": "Arial, sans-serif" }, "exponentformat": "none", "showticklabels": true }, "yaxis1": { "side": "left", "type": "linear", "range": [ -358.673127306904, 6251.4401579442 ], "ticks": "inside", "title": "uV", "anchor": "x1", "domain": [ 0.583837209302326, 0.925 ], "mirror": "ticks", "ticklen": 6.51, "showgrid": false, "showline": true, "tickfont": { "size": 9, "color": "rgb(38.250000,38.250000,38.250000)", "family": "Arial, sans-serif" }, "tickmode": "array", "ticktext": [ "0", "2000", "4000", "6000" ], "tickvals": [ 0, 2000, 4000, 6000 ], "zeroline": false, "autorange": false, "gridcolor": "rgba(38.250000,,38.250000,38.250000,0.150000)", "linecolor": "rgb(38.250000,38.250000,38.250000)", "linewidth": 1, "tickangle": 0, "tickcolor": "rgb(38.250000,38.250000,38.250000)", "tickwidth": 1, "titlefont": { "size": 9.9, "color": "rgb(38.250000,38.250000,38.250000)", "family": "Arial, sans-serif" }, "exponentformat": "none", "showticklabels": true }, "yaxis2": { "side": "left", "type": "linear", "range": [ 0, 150000000 ], "ticks": "inside", "title": "幅度", "anchor": "x2", "domain": [ 0.11, 0.451162790697674 ], "mirror": "ticks", "ticklen": 6.51, "showgrid": false, "showline": true, "tickfont": { "size": 9, "color": "rgb(38.250000,38.250000,38.250000)", "family": "Arial, sans-serif" }, "tickmode": "array", "ticktext": [ "0", "5", "10", "15" ], "tickvals": [ 0, 50000000, 100000000, 150000000 ], "zeroline": false, "autorange": false, "gridcolor": "rgba(38.250000,,38.250000,38.250000,0.150000)", "linecolor": "rgb(38.250000,38.250000,38.250000)", "linewidth": 1, "tickangle": 0, "tickcolor": "rgb(38.250000,38.250000,38.250000)", "tickwidth": 1, "titlefont": { "size": 9.9, "color": "rgb(38.250000,38.250000,38.250000)", "family": "Arial, sans-serif" }, "exponentformat": "none", "showticklabels": true }, "autosize": false, "hovermode": "closest", "titlefont": { "color": "rgba(0,0,0,0)" }, "showlegend": true, "annotations": [ { "x": 0.5175, "y": 0.935, "font": { "size": 9.9, "color": "rgb(0,0,0)", "family": "Arial, sans-serif" }, "text": "filteredC1", "xref": "paper", "yref": "paper", "align": "center", "xanchor": "center", "yanchor": "bottom", "borderpad": 3, "showarrow": false, "textangle": 0, "bordercolor": "rgba(0,0,0,0)", "borderwidth": 0.5 }, { "x": 0.5175, "y": 0.461162790697674, "font": { "size": 9.9, "color": "rgb(0,0,0)", "family": "Arial, sans-serif" }, "text": "<b></b>", "xref": "paper", "yref": "paper", "align": "center", "xanchor": "center", "yanchor": "bottom", "borderpad": 3, "showarrow": false, "textangle": 0, "bordercolor": "rgba(0,0,0,0)", "borderwidth": 0.5 }, { "x": 0, "y": 150000000, "font": { "size": 9, "color": "rgb(38.250000,38.250000,38.250000)", "family": "Arial, sans-serif" }, "text": "x10^7", "xref": "x2", "yref": "y2", "xanchor": "left", "yanchor": "bottom", "showarrow": false } ], "paper_bgcolor": "rgb(255,255,255)" } }, "height": 630, "width": 840, "user": { "profile_url": "https://chart-studio.plotly.com/~asongupup", "avatar_url": "https://storage.googleapis.com/plotly-prod-profiles/6.jpg", "background_url": "https://storage.googleapis.com/plotly-prod-profiles/bg-5.jpg", "bio": "", "nickname": "", "website": "", "stream_tokens": null, "feature_set_id": null, "csrf_token": null, "date_joined": "2024-02-27 02:46:05", "mapbox_access_tokens": null, "has_password": null, "username": "asongupup", "email": null, "is_active": null, "readonly": null, "is_dash_creator": null, "dash_created_count": null, "is_chart_creator": null, "charts_created_count": null } }, { "creation_time": "2024-03-22T07:21:52.232936Z", "comments": { "results": [], "count": 0 }, "parented": true, "embed_url": "https://chart-studio.plotly.com/~bayreuthss/201.embed", "fid": "bayreuthss:201", "filename": "ECCM phrr vs Ef pre", "filetype": "plot", "img_url": "https://storage.googleapis.com/plotly-prod-images/bayreuthss/201/9_PRVJ40OXS0S98H47R4LWQCZZYJCLYD.png", "image_urls": { "default": "https://storage.googleapis.com/plotly-prod-images/bayreuthss/201/2_DA8M6QQG0R3682QM43I737UFUTB6KK.png", "block-thumb": "https://storage.googleapis.com/plotly-prod-images/bayreuthss/201/8_69834CXKBO5K9YHBBW8NXVJ7YUKQQI.png", "list-thumb": "https://storage.googleapis.com/plotly-prod-images/bayreuthss/201/9_PRVJ40OXS0S98H47R4LWQCZZYJCLYD.png" }, "api_urls": { "files": "https://api.plotly.com/v2/files/bayreuthss:201", "plots": "https://api.plotly.com/v2/plots/bayreuthss:201", "parent": "https://api.plotly.com/v2/folders/home?user=bayreuthss" }, "owner": "bayreuthss", "parent": -1, "preview": "", "referencers": [], "references": [], "title": "", "views": 5, "web_url": "https://chart-studio.plotly.com/~bayreuthss/201/", "world_readable": true, "date_modified": "2024-03-22T07:21:52.249Z", "stars": { "results": [], "count": 0 }, "collaborators": { "results": [], "count": 0 }, "subfolder_count": null, "refresh_interval": null, "organize_view_url": "https://chart-studio.plotly.com/~bayreuthss/201/", "current_user_permission": "read", "is_theme": null, "is_template": false, "autosize": true, "caption": "", "figure": { "data": [ { "line": { "dash": "dot" }, "meta": { "columnNames": { "x": "A", "y": "B" } }, "mode": "markers+lines", "name": "pHRR", "type": "scatter", "xsrc": "bayreuthss:200:1cfcee", "ysrc": "bayreuthss:200:98e904", "marker": { "size": 10, "color": "rgb(76, 77, 84)" } }, { "line": { "dash": "dot" }, "meta": { "columnNames": { "x": "A", "y": "C" } }, "mode": "markers+lines", "name": "Pre-fire flexural modulus", "type": "scatter", "xsrc": "bayreuthss:200:1cfcee", "ysrc": "bayreuthss:200:aecbd9", "yaxis": "y2", "marker": { "size": 10, "color": "rgb(106, 239, 59)" }, "stackgroup": null } ], "frames": [], "layout": { "xaxis": { "type": "linear", "range": [ -3.2569693624068456, 53.25696936240685 ], "title": { "font": { "size": 25, "family": "Times New Roman" }, "text": "% APP + InSi in resin matrix<br>" }, "showgrid": false, "showline": true, "tickfont": { "size": 20, "family": "Times New Roman" }, "zeroline": false, "autorange": true, "linecolor": "rgb(40, 41, 43)", "linewidth": 2 }, "yaxis": { "type": "linear", "range": [ -12.768625560931866, 416.0946905862616 ], "title": { "font": { "size": 25, "family": "Times New Roman" }, "text": "Peak heat release rate [kW/m<sup>2</sup>]" }, "showgrid": false, "showline": true, "tickfont": { "size": 20, "family": "Times New Roman" }, "zeroline": false, "autorange": false, "linecolor": "rgb(40, 41, 43)", "linewidth": 2 }, "legend": { "x": 0.6113744862762287, "y": 0.9610812675463529, "font": { "size": 25, "family": "Times New Roman" }, "borderwidth": 1 }, "yaxis2": { "side": "right", "type": "linear", "range": [ -1.6506957367373154, 31.21404311519642 ], "title": { "font": { "size": 25, "family": "Times New Roman" }, "text": "Pre-fire flexural modulus [GPa]" }, "showgrid": false, "showline": true, "tickfont": { "size": 20, "family": "Times New Roman" }, "zeroline": false, "autorange": false, "linecolor": "rgb(40, 41, 43)", "linewidth": 2, "overlaying": "y" }, "autosize": true, "template": { "data": { "bar": [ { "type": "bar", "marker": { "colorbar": { "ticks": "", "outlinewidth": 0 } } } ], "table": [ { "type": "table", "cells": { "fill": { "color": "#EBF0F8" }, "line": { "color": "white" } }, "header": { "fill": { "color": "#C8D4E3" }, "line": { "color": "white" } } } ], "carpet": [ { "type": "carpet", "aaxis": { "gridcolor": "#C8D4E3", "linecolor": "#C8D4E3", "endlinecolor": "#2a3f5f", "minorgridcolor": "#C8D4E3", "startlinecolor": "#2a3f5f" }, "baxis": { "gridcolor": "#C8D4E3", "linecolor": "#C8D4E3", "endlinecolor": "#2a3f5f", "minorgridcolor": "#C8D4E3", "startlinecolor": "#2a3f5f" } } ], "mesh3d": [ { "type": "mesh3d", "colorbar": { "ticks": "", "outlinewidth": 0 } } ], "contour": [ { "type": "contour", "colorbar": { "ticks": "", "outlinewidth": 0 }, "autocolorscale": true } ], "heatmap": [ { "type": "heatmap", "colorbar": { "ticks": "", "outlinewidth": 0 }, "autocolorscale": true } ], "scatter": [ { "type": "scatter", "marker": { "colorbar": { "ticks": "", "outlinewidth": 0 } } } ], "surface": [ { "type": "surface", "colorbar": { "ticks": "", "outlinewidth": 0 } } ], "heatmapgl": [ { "type": "heatmapgl", "colorbar": { "ticks": "", "outlinewidth": 0 } } ], "histogram": [ { "type": "histogram", "marker": { "colorbar": { "ticks": "", "outlinewidth": 0 } } } ], "parcoords": [ { "line": { "colorbar": { "ticks": "", "outlinewidth": 0 } }, "type": "parcoords" } ], "scatter3d": [ { "type": "scatter3d", "marker": { "colorbar": { "ticks": "", "outlinewidth": 0 } } } ], "scattergl": [ { "type": "scattergl", "marker": { "colorbar": { "ticks": "", "outlinewidth": 0 } } } ], "choropleth": [ { "type": "choropleth", "colorbar": { "ticks": "", "outlinewidth": 0 } } ], "scattergeo": [ { "type": "scattergeo", "marker": { "colorbar": { "ticks": "", "outlinewidth": 0 } } } ], "histogram2d": [ { "type": "histogram2d", "colorbar": { "ticks": "", "outlinewidth": 0 }, "autocolorscale": true } ], "scatterpolar": [ { "type": "scatterpolar", "marker": { "colorbar": { "ticks": "", "outlinewidth": 0 } } } ], "contourcarpet": [ { "type": "contourcarpet", "colorbar": { "ticks": "", "outlinewidth": 0 } } ], "scattercarpet": [ { "type": "scattercarpet", "marker": { "colorbar": { "ticks": "", "outlinewidth": 0 } } } ], "scattermapbox": [ { "type": "scattermapbox", "marker": { "colorbar": { "ticks": "", "outlinewidth": 0 } } } ], "scatterpolargl": [ { "type": "scatterpolargl", "marker": { "colorbar": { "ticks": "", "outlinewidth": 0 } } } ], "scatterternary": [ { "type": "scatterternary", "marker": { "colorbar": { "ticks": "", "outlinewidth": 0 } } } ], "histogram2dcontour": [ { "type": "histogram2dcontour", "colorbar": { "ticks": "", "outlinewidth": 0 }, "autocolorscale": true } ] }, "layout": { "geo": { "bgcolor": "white", "showland": true, "lakecolor": "white", "landcolor": "white", "showlakes": true, "subunitcolor": "#C8D4E3" }, "font": { "color": "#2a3f5f" }, "polar": { "bgcolor": "white", "radialaxis": { "ticks": "", "gridcolor": "#EBF0F8", "linecolor": "#EBF0F8" }, "angularaxis": { "ticks": "", "gridcolor": "#EBF0F8", "linecolor": "#EBF0F8" } }, "scene": { "xaxis": { "ticks": "", "gridcolor": "#DFE8F3", "gridwidth": 2, "linecolor": "#EBF0F8", "zerolinecolor": "#EBF0F8", "showbackground": true, "backgroundcolor": "white" }, "yaxis": { "ticks": "", "gridcolor": "#DFE8F3", "gridwidth": 2, "linecolor": "#EBF0F8", "zerolinecolor": "#EBF0F8", "showbackground": true, "backgroundcolor": "white" }, "zaxis": { "ticks": "", "gridcolor": "#DFE8F3", "gridwidth": 2, "linecolor": "#EBF0F8", "zerolinecolor": "#EBF0F8", "showbackground": true, "backgroundcolor": "white" } }, "title": { "x": 0.05 }, "xaxis": { "ticks": "", "gridcolor": "#EBF0F8", "linecolor": "#EBF0F8", "automargin": true, "zerolinecolor": "#EBF0F8", "zerolinewidth": 2 }, "yaxis": { "ticks": "", "gridcolor": "#EBF0F8", "linecolor": "#EBF0F8", "automargin": true, "zerolinecolor": "#EBF0F8", "zerolinewidth": 2 }, "ternary": { "aaxis": { "ticks": "", "gridcolor": "#DFE8F3", "linecolor": "#A2B1C6" }, "baxis": { "ticks": "", "gridcolor": "#DFE8F3", "linecolor": "#A2B1C6" }, "caxis": { "ticks": "", "gridcolor": "#DFE8F3", "linecolor": "#A2B1C6" }, "bgcolor": "white" }, "colorway": [ "#636efa", "#EF553B", "#00cc96", "#ab63fa", "#19d3f3", "#e763fa", "#fecb52", "#ffa15a", "#ff6692", "#b6e880" ], "hovermode": "closest", "colorscale": { "diverging": [ [ 0, "#8e0152" ], [ 0.1, "#c51b7d" ], [ 0.2, "#de77ae" ], [ 0.3, "#f1b6da" ], [ 0.4, "#fde0ef" ], [ 0.5, "#f7f7f7" ], [ 0.6, "#e6f5d0" ], [ 0.7, "#b8e186" ], [ 0.8, "#7fbc41" ], [ 0.9, "#4d9221" ], [ 1, "#276419" ] ], "sequential": [ [ 0, "#0508b8" ], [ 0.0893854748603352, "#1910d8" ], [ 0.1787709497206704, "#3c19f0" ], [ 0.2681564245810056, "#6b1cfb" ], [ 0.3575418994413408, "#981cfd" ], [ 0.44692737430167595, "#bf1cfd" ], [ 0.5363128491620112, "#dd2bfd" ], [ 0.6256983240223464, "#f246fe" ], [ 0.7150837988826816, "#fc67fd" ], [ 0.8044692737430168, "#fe88fc" ], [ 0.8938547486033519, "#fea5fd" ], [ 0.9832402234636871, "#febefe" ], [ 1, "#fec3fe" ] ], "sequentialminus": [ [ 0, "#0508b8" ], [ 0.0893854748603352, "#1910d8" ], [ 0.1787709497206704, "#3c19f0" ], [ 0.2681564245810056, "#6b1cfb" ], [ 0.3575418994413408, "#981cfd" ], [ 0.44692737430167595, "#bf1cfd" ], [ 0.5363128491620112, "#dd2bfd" ], [ 0.6256983240223464, "#f246fe" ], [ 0.7150837988826816, "#fc67fd" ], [ 0.8044692737430168, "#fe88fc" ], [ 0.8938547486033519, "#fea5fd" ], [ 0.9832402234636871, "#febefe" ], [ 1, "#fec3fe" ] ] }, "plot_bgcolor": "white", "paper_bgcolor": "white", "shapedefaults": { "line": { "width": 0 }, "opacity": 0.4, "fillcolor": "#506784" }, "annotationdefaults": { "arrowhead": 0, "arrowcolor": "#506784", "arrowwidth": 1 } }, "themeRef": "PLOTLY_WHITE" } } }, "height": null, "width": null, "user": { "profile_url": "https://chart-studio.plotly.com/~bayreuthss", "avatar_url": "https://storage.googleapis.com/plotly-prod-profiles/25.jpg", "background_url": "https://storage.googleapis.com/plotly-prod-profiles/bg-10.jpg", "bio": "", "nickname": "unnamedss", "website": "", "stream_tokens": null, "feature_set_id": null, "csrf_token": null, "date_joined": "2022-02-18 10:12:23", "mapbox_access_tokens": null, "has_password": null, "username": "bayreuthss", "email": null, "is_active": null, "readonly": null, "is_dash_creator": null, "dash_created_count": null, "is_chart_creator": null, "charts_created_count": null } }, { "creation_time": "2024-03-22T07:16:14.207997Z", "comments": { "results": [], "count": 0 }, "parented": true, "embed_url": "https://chart-studio.plotly.com/~sven.sandberg/47.embed", "fid": "sven.sandberg:47", "filename": "Tryck i radiatorrör jan 2024", "filetype": "plot", "img_url": "https://storage.googleapis.com/plotly-prod-images/sven.sandberg/47/9_A47JD4CD0R1WPSKO2W8F44LGS4O80U.png", "image_urls": { "default": "https://storage.googleapis.com/plotly-prod-images/sven.sandberg/47/2_LCQH6AX71PGB5CJ174B5ENI3HC6258.png", "block-thumb": "https://storage.googleapis.com/plotly-prod-images/sven.sandberg/47/8_9RJEKQQQPIXEAGK3ZVSWV5IOTQ6YC1.png", "list-thumb": "https://storage.googleapis.com/plotly-prod-images/sven.sandberg/47/9_A47JD4CD0R1WPSKO2W8F44LGS4O80U.png" }, "api_urls": { "files": "https://api.plotly.com/v2/files/sven.sandberg:47", "plots": "https://api.plotly.com/v2/plots/sven.sandberg:47", "parent": "https://api.plotly.com/v2/folders/home?user=sven.sandberg" }, "owner": "sven.sandberg", "parent": -1, "preview": "", "referencers": [], "references": [], "title": "", "views": 3, "web_url": "https://chart-studio.plotly.com/~sven.sandberg/47/", "world_readable": true, "date_modified": "2024-03-22T07:16:14.219Z", "stars": { "results": [], "count": 0 }, "collaborators": { "results": [], "count": 0 }, "subfolder_count": null, "refresh_interval": null, "organize_view_url": "https://chart-studio.plotly.com/~sven.sandberg/47/", "current_user_permission": "read", "is_theme": null, "is_template": false, "autosize": true, "caption": "", "figure": { "data": [ { "meta": { "columnNames": { "x": "A", "y": "B" } }, "mode": "lines", "type": "scatter", "xsrc": "sven.sandberg:46:5c049c", "ysrc": "sven.sandberg:46:b319d7" }, { "meta": { "columnNames": { "x": "A", "y": "B" } }, "mode": "markers", "type": "scatter", "xsrc": "sven.sandberg:46:5c049c", "ysrc": "sven.sandberg:46:b319d7" } ], "frames": [], "layout": { "font": { "size": 24 }, "title": { "text": "Tryck i radiatorrör" }, "xaxis": { "side": "bottom", "type": "date", "range": [ "2024-01-08 14:37:06.5702", "2024-01-23 02:10:53.4298" ], "ticks": "outside", "title": { "font": { "size": 20 }, "text": "Tid" }, "domain": [ 0, 1 ], "tickfont": { "size": 18 }, "tickmode": "linear", "autorange": true, "tickangle": 45, "showspikes": true, "tickformat": "%a %d %b", "rangeselector": { "buttons": [ {} ], "visible": false }, "spikethickness": 3 }, "yaxis": { "type": "linear", "range": [ 0.31896043803501195, 1.0410395619649881 ], "title": { "font": { "size": 22 }, "text": "Tryck (bar)" }, "domain": [ 0.125, 1 ], "tickfont": { "size": 18 }, "autorange": true }, "autosize": true, "template": { "data": { "bar": [ { "type": "bar", "marker": { "colorbar": { "ticks": "", "outlinewidth": 0 } } } ], "table": [ { "type": "table", "cells": { "fill": { "color": "#EBF0F8" }, "line": { "color": "white" } }, "header": { "fill": { "color": "#C8D4E3" }, "line": { "color": "white" } } } ], "carpet": [ { "type": "carpet", "aaxis": { "gridcolor": "#C8D4E3", "linecolor": "#C8D4E3", "endlinecolor": "#2a3f5f", "minorgridcolor": "#C8D4E3", "startlinecolor": "#2a3f5f" }, "baxis": { "gridcolor": "#C8D4E3", "linecolor": "#C8D4E3", "endlinecolor": "#2a3f5f", "minorgridcolor": "#C8D4E3", "startlinecolor": "#2a3f5f" } } ], "mesh3d": [ { "type": "mesh3d", "colorbar": { "ticks": "", "outlinewidth": 0 } } ], "contour": [ { "type": "contour", "colorbar": { "ticks": "", "outlinewidth": 0 }, "autocolorscale": true } ], "heatmap": [ { "type": "heatmap", "colorbar": { "ticks": "", "outlinewidth": 0 }, "autocolorscale": true } ], "scatter": [ { "type": "scatter", "marker": { "colorbar": { "ticks": "", "outlinewidth": 0 } } } ], "surface": [ { "type": "surface", "colorbar": { "ticks": "", "outlinewidth": 0 } } ], "heatmapgl": [ { "type": "heatmapgl", "colorbar": { "ticks": "", "outlinewidth": 0 } } ], "histogram": [ { "type": "histogram", "marker": { "colorbar": { "ticks": "", "outlinewidth": 0 } } } ], "parcoords": [ { "line": { "colorbar": { "ticks": "", "outlinewidth": 0 } }, "type": "parcoords" } ], "scatter3d": [ { "type": "scatter3d", "marker": { "colorbar": { "ticks": "", "outlinewidth": 0 } } } ], "scattergl": [ { "type": "scattergl", "marker": { "colorbar": { "ticks": "", "outlinewidth": 0 } } } ], "choropleth": [ { "type": "choropleth", "colorbar": { "ticks": "", "outlinewidth": 0 } } ], "scattergeo": [ { "type": "scattergeo", "marker": { "colorbar": { "ticks": "", "outlinewidth": 0 } } } ], "histogram2d": [ { "type": "histogram2d", "colorbar": { "ticks": "", "outlinewidth": 0 }, "autocolorscale": true } ], "scatterpolar": [ { "type": "scatterpolar", "marker": { "colorbar": { "ticks": "", "outlinewidth": 0 } } } ], "contourcarpet": [ { "type": "contourcarpet", "colorbar": { "ticks": "", "outlinewidth": 0 } } ], "scattercarpet": [ { "type": "scattercarpet", "marker": { "colorbar": { "ticks": "", "outlinewidth": 0 } } } ], "scattermapbox": [ { "type": "scattermapbox", "marker": { "colorbar": { "ticks": "", "outlinewidth": 0 } } } ], "scatterpolargl": [ { "type": "scatterpolargl", "marker": { "colorbar": { "ticks": "", "outlinewidth": 0 } } } ], "scatterternary": [ { "type": "scatterternary", "marker": { "colorbar": { "ticks": "", "outlinewidth": 0 } } } ], "histogram2dcontour": [ { "type": "histogram2dcontour", "colorbar": { "ticks": "", "outlinewidth": 0 }, "autocolorscale": true } ] }, "layout": { "geo": { "bgcolor": "white", "showland": true, "lakecolor": "white", "landcolor": "white", "showlakes": true, "subunitcolor": "#C8D4E3" }, "font": { "color": "#2a3f5f" }, "polar": { "bgcolor": "white", "radialaxis": { "ticks": "", "gridcolor": "#EBF0F8", "linecolor": "#EBF0F8" }, "angularaxis": { "ticks": "", "gridcolor": "#EBF0F8", "linecolor": "#EBF0F8" } }, "scene": { "xaxis": { "ticks": "", "gridcolor": "#DFE8F3", "gridwidth": 2, "linecolor": "#EBF0F8", "zerolinecolor": "#EBF0F8", "showbackground": true, "backgroundcolor": "white" }, "yaxis": { "ticks": "", "gridcolor": "#DFE8F3", "gridwidth": 2, "linecolor": "#EBF0F8", "zerolinecolor": "#EBF0F8", "showbackground": true, "backgroundcolor": "white" }, "zaxis": { "ticks": "", "gridcolor": "#DFE8F3", "gridwidth": 2, "linecolor": "#EBF0F8", "zerolinecolor": "#EBF0F8", "showbackground": true, "backgroundcolor": "white" } }, "title": { "x": 0.05 }, "xaxis": { "ticks": "", "gridcolor": "#EBF0F8", "linecolor": "#EBF0F8", "automargin": true, "zerolinecolor": "#EBF0F8", "zerolinewidth": 2 }, "yaxis": { "ticks": "", "gridcolor": "#EBF0F8", "linecolor": "#EBF0F8", "automargin": true, "zerolinecolor": "#EBF0F8", "zerolinewidth": 2 }, "ternary": { "aaxis": { "ticks": "", "gridcolor": "#DFE8F3", "linecolor": "#A2B1C6" }, "baxis": { "ticks": "", "gridcolor": "#DFE8F3", "linecolor": "#A2B1C6" }, "caxis": { "ticks": "", "gridcolor": "#DFE8F3", "linecolor": "#A2B1C6" }, "bgcolor": "white" }, "colorway": [ "#636efa", "#EF553B", "#00cc96", "#ab63fa", "#19d3f3", "#e763fa", "#fecb52", "#ffa15a", "#ff6692", "#b6e880" ], "hovermode": "closest", "colorscale": { "diverging": [ [ 0, "#8e0152" ], [ 0.1, "#c51b7d" ], [ 0.2, "#de77ae" ], [ 0.3, "#f1b6da" ], [ 0.4, "#fde0ef" ], [ 0.5, "#f7f7f7" ], [ 0.6, "#e6f5d0" ], [ 0.7, "#b8e186" ], [ 0.8, "#7fbc41" ], [ 0.9, "#4d9221" ], [ 1, "#276419" ] ], "sequential": [ [ 0, "#0508b8" ], [ 0.0893854748603352, "#1910d8" ], [ 0.1787709497206704, "#3c19f0" ], [ 0.2681564245810056, "#6b1cfb" ], [ 0.3575418994413408, "#981cfd" ], [ 0.44692737430167595, "#bf1cfd" ], [ 0.5363128491620112, "#dd2bfd" ], [ 0.6256983240223464, "#f246fe" ], [ 0.7150837988826816, "#fc67fd" ], [ 0.8044692737430168, "#fe88fc" ], [ 0.8938547486033519, "#fea5fd" ], [ 0.9832402234636871, "#febefe" ], [ 1, "#fec3fe" ] ], "sequentialminus": [ [ 0, "#0508b8" ], [ 0.0893854748603352, "#1910d8" ], [ 0.1787709497206704, "#3c19f0" ], [ 0.2681564245810056, "#6b1cfb" ], [ 0.3575418994413408, "#981cfd" ], [ 0.44692737430167595, "#bf1cfd" ], [ 0.5363128491620112, "#dd2bfd" ], [ 0.6256983240223464, "#f246fe" ], [ 0.7150837988826816, "#fc67fd" ], [ 0.8044692737430168, "#fe88fc" ], [ 0.8938547486033519, "#fea5fd" ], [ 0.9832402234636871, "#febefe" ], [ 1, "#fec3fe" ] ] }, "plot_bgcolor": "white", "paper_bgcolor": "white", "shapedefaults": { "line": { "width": 0 }, "opacity": 0.4, "fillcolor": "#506784" }, "annotationdefaults": { "arrowhead": 0, "arrowcolor": "#506784", "arrowwidth": 1 } }, "themeRef": "PLOTLY_WHITE" }, "showlegend": false } }, "height": null, "width": null, "user": { "profile_url": "https://chart-studio.plotly.com/~sven.sandberg", "avatar_url": "https://storage.googleapis.com/plotly-prod-profiles/46.jpg", "background_url": "https://storage.googleapis.com/plotly-prod-profiles/bg-11.jpg", "bio": "", "nickname": "", "website": "", "stream_tokens": null, "feature_set_id": null, "csrf_token": null, "date_joined": "2017-12-21 19:57:34", "mapbox_access_tokens": null, "has_password": null, "username": "sven.sandberg", "email": null, "is_active": null, "readonly": null, "is_dash_creator": null, "dash_created_count": null, "is_chart_creator": null, "charts_created_count": null } }, { "creation_time": "2024-03-22T07:06:54.173151Z", "comments": { "results": [], "count": 0 }, "parented": true, "embed_url": "https://chart-studio.plotly.com/~vevadzawla/7.embed", "fid": "vevadzawla:7", "filename": "Bottom10_food_n_service", "filetype": "plot", "img_url": "https://storage.googleapis.com/plotly-prod-images/vevadzawla/7/9_0YHOVG2TFJ737UPNTF9Z1J4T4MERIW.png", "image_urls": { "default": "https://storage.googleapis.com/plotly-prod-images/vevadzawla/7/2_2DN243I5GOWJD3KULGIPD9FYBQXT02.png", "block-thumb": "https://storage.googleapis.com/plotly-prod-images/vevadzawla/7/8_733SMRS9F4ZRNKU1VKIJXJENGGYQHS.png", "list-thumb": "https://storage.googleapis.com/plotly-prod-images/vevadzawla/7/9_0YHOVG2TFJ737UPNTF9Z1J4T4MERIW.png" }, "api_urls": { "files": "https://api.plotly.com/v2/files/vevadzawla:7", "plots": "https://api.plotly.com/v2/plots/vevadzawla:7", "parent": "https://api.plotly.com/v2/folders/home?user=vevadzawla" }, "owner": "vevadzawla", "parent": -1, "preview": "", "referencers": [], "references": [], "title": "", "views": 167, "web_url": "https://chart-studio.plotly.com/~vevadzawla/7/", "world_readable": true, "date_modified": "2024-03-22T07:06:54.185Z", "stars": { "results": [], "count": 0 }, "collaborators": { "results": [], "count": 0 }, "subfolder_count": null, "refresh_interval": null, "organize_view_url": "https://chart-studio.plotly.com/~vevadzawla/7/", "current_user_permission": "read", "is_theme": null, "is_template": null, "autosize": true, "caption": "", "figure": { "data": [ { "name": "Victoria", "type": "bar", "xsrc": "vevadzawla:6:8afae6", "ysrc": "vevadzawla:6:2e69b5", "xaxis": "x", "yaxis": "y", "marker": { "color": "#636efa", "pattern": { "shape": "" } }, "showlegend": true, "legendgroup": "Victoria", "offsetgroup": "Victoria", "orientation": "v", "textposition": "auto", "customdatasrc": "vevadzawla:6:382dad", "hovertemplate": "city=%{customdata[2]}<br>resto_name=%{x}<br>cnt=%{y}<br>food_rating=%{customdata[0]}<br>service_rating=%{customdata[1]}<extra></extra>", "alignmentgroup": "True" }, { "name": "San Luis Potosi", "type": "bar", "xsrc": "vevadzawla:6:cc48dd", "ysrc": "vevadzawla:6:ee9180", "xaxis": "x", "yaxis": "y", "marker": { "color": "#EF553B", "pattern": { "shape": "" } }, "showlegend": true, "legendgroup": "San Luis Potosi", "offsetgroup": "San Luis Potosi", "orientation": "v", "textposition": "auto", "customdatasrc": "vevadzawla:6:8f0f38", "hovertemplate": "city=%{customdata[2]}<br>resto_name=%{x}<br>cnt=%{y}<br>food_rating=%{customdata[0]}<br>service_rating=%{customdata[1]}<extra></extra>", "alignmentgroup": "True" }, { "name": "?", "type": "bar", "xsrc": "vevadzawla:6:e34e8f", "ysrc": "vevadzawla:6:7312e3", "xaxis": "x", "yaxis": "y", "marker": { "color": "#00cc96", "pattern": { "shape": "" } }, "showlegend": true, "legendgroup": "?", "offsetgroup": "?", "orientation": "v", "textposition": "auto", "customdatasrc": "vevadzawla:6:f78db6", "hovertemplate": "city=%{customdata[2]}<br>resto_name=%{x}<br>cnt=%{y}<br>food_rating=%{customdata[0]}<br>service_rating=%{customdata[1]}<extra></extra>", "alignmentgroup": "True" } ], "layout": { "title": { "text": "Top 10 restaurants having the lowest average ratings in terms of food and service" }, "xaxis": { "title": { "text": "resto_name" }, "anchor": "y", "domain": [ 0.0, 1.0 ] }, "yaxis": { "title": { "text": "cnt" }, "anchor": "x", "domain": [ 0.0, 1.0 ] }, "height": 400, "legend": { "title": { "text": "city" }, "tracegroupgap": 0 }, "barmode": "relative", "template": { "data": { "bar": [ { "type": "bar", "marker": { "line": { "color": "#E5ECF6", "width": 0.5 }, "pattern": { "size": 10, "fillmode": "overlay", "solidity": 0.2 } }, "error_x": { "color": "#2a3f5f" }, "error_y": { "color": "#2a3f5f" } } ], "pie": [ { "type": "pie", "automargin": true } ], "table": [ { "type": "table", "cells": { "fill": { "color": "#EBF0F8" }, "line": { "color": "white" } }, "header": { "fill": { "color": "#C8D4E3" }, "line": { "color": "white" } } } ], "carpet": [ { "type": "carpet", "aaxis": { "gridcolor": "white", "linecolor": "white", "endlinecolor": "#2a3f5f", "minorgridcolor": "white", "startlinecolor": "#2a3f5f" }, "baxis": { "gridcolor": "white", "linecolor": "white", "endlinecolor": "#2a3f5f", "minorgridcolor": "white", "startlinecolor": "#2a3f5f" } } ], "mesh3d": [ { "type": "mesh3d", "colorbar": { "ticks": "", "outlinewidth": 0 } } ], "contour": [ { "type": "contour", "colorbar": { "ticks": "", "outlinewidth": 0 }, "colorscale": [ [ 0.0, "#0d0887" ], [ 0.1111111111111111, "#46039f" ], [ 0.2222222222222222, "#7201a8" ], [ 0.3333333333333333, "#9c179e" ], [ 0.4444444444444444, "#bd3786" ], [ 0.5555555555555556, "#d8576b" ], [ 0.6666666666666666, "#ed7953" ], [ 0.7777777777777778, "#fb9f3a" ], [ 0.8888888888888888, "#fdca26" ], [ 1.0, "#f0f921" ] ] } ], "heatmap": [ { "type": "heatmap", "colorbar": { "ticks": "", "outlinewidth": 0 }, "colorscale": [ [ 0.0, "#0d0887" ], [ 0.1111111111111111, "#46039f" ], [ 0.2222222222222222, "#7201a8" ], [ 0.3333333333333333, "#9c179e" ], [ 0.4444444444444444, "#bd3786" ], [ 0.5555555555555556, "#d8576b" ], [ 0.6666666666666666, "#ed7953" ], [ 0.7777777777777778, "#fb9f3a" ], [ 0.8888888888888888, "#fdca26" ], [ 1.0, "#f0f921" ] ] } ], "scatter": [ { "type": "scatter", "marker": { "colorbar": { "ticks": "", "outlinewidth": 0 } } } ], "surface": [ { "type": "surface", "colorbar": { "ticks": "", "outlinewidth": 0 }, "colorscale": [ [ 0.0, "#0d0887" ], [ 0.1111111111111111, "#46039f" ], [ 0.2222222222222222, "#7201a8" ], [ 0.3333333333333333, "#9c179e" ], [ 0.4444444444444444, "#bd3786" ], [ 0.5555555555555556, "#d8576b" ], [ 0.6666666666666666, "#ed7953" ], [ 0.7777777777777778, "#fb9f3a" ], [ 0.8888888888888888, "#fdca26" ], [ 1.0, "#f0f921" ] ] } ], "barpolar": [ { "type": "barpolar", "marker": { "line": { "color": "#E5ECF6", "width": 0.5 }, "pattern": { "size": 10, "fillmode": "overlay", "solidity": 0.2 } } } ], "heatmapgl": [ { "type": "heatmapgl", "colorbar": { "ticks": "", "outlinewidth": 0 }, "colorscale": [ [ 0.0, "#0d0887" ], [ 0.1111111111111111, "#46039f" ], [ 0.2222222222222222, "#7201a8" ], [ 0.3333333333333333, "#9c179e" ], [ 0.4444444444444444, "#bd3786" ], [ 0.5555555555555556, "#d8576b" ], [ 0.6666666666666666, "#ed7953" ], [ 0.7777777777777778, "#fb9f3a" ], [ 0.8888888888888888, "#fdca26" ], [ 1.0, "#f0f921" ] ] } ], "histogram": [ { "type": "histogram", "marker": { "pattern": { "size": 10, "fillmode": "overlay", "solidity": 0.2 } } } ], "parcoords": [ { "line": { "colorbar": { "ticks": "", "outlinewidth": 0 } }, "type": "parcoords" } ], "scatter3d": [ { "line": { "colorbar": { "ticks": "", "outlinewidth": 0 } }, "type": "scatter3d", "marker": { "colorbar": { "ticks": "", "outlinewidth": 0 } } } ], "scattergl": [ { "type": "scattergl", "marker": { "colorbar": { "ticks": "", "outlinewidth": 0 } } } ], "choropleth": [ { "type": "choropleth", "colorbar": { "ticks": "", "outlinewidth": 0 } } ], "scattergeo": [ { "type": "scattergeo", "marker": { "colorbar": { "ticks": "", "outlinewidth": 0 } } } ], "histogram2d": [ { "type": "histogram2d", "colorbar": { "ticks": "", "outlinewidth": 0 }, "colorscale": [ [ 0.0, "#0d0887" ], [ 0.1111111111111111, "#46039f" ], [ 0.2222222222222222, "#7201a8" ], [ 0.3333333333333333, "#9c179e" ], [ 0.4444444444444444, "#bd3786" ], [ 0.5555555555555556, "#d8576b" ], [ 0.6666666666666666, "#ed7953" ], [ 0.7777777777777778, "#fb9f3a" ], [ 0.8888888888888888, "#fdca26" ], [ 1.0, "#f0f921" ] ] } ], "scatterpolar": [ { "type": "scatterpolar", "marker": { "colorbar": { "ticks": "", "outlinewidth": 0 } } } ], "contourcarpet": [ { "type": "contourcarpet", "colorbar": { "ticks": "", "outlinewidth": 0 } } ], "scattercarpet": [ { "type": "scattercarpet", "marker": { "colorbar": { "ticks": "", "outlinewidth": 0 } } } ], "scattermapbox": [ { "type": "scattermapbox", "marker": { "colorbar": { "ticks": "", "outlinewidth": 0 } } } ], "scatterpolargl": [ { "type": "scatterpolargl", "marker": { "colorbar": { "ticks": "", "outlinewidth": 0 } } } ], "scatterternary": [ { "type": "scatterternary", "marker": { "colorbar": { "ticks": "", "outlinewidth": 0 } } } ], "histogram2dcontour": [ { "type": "histogram2dcontour", "colorbar": { "ticks": "", "outlinewidth": 0 }, "colorscale": [ [ 0.0, "#0d0887" ], [ 0.1111111111111111, "#46039f" ], [ 0.2222222222222222, "#7201a8" ], [ 0.3333333333333333, "#9c179e" ], [ 0.4444444444444444, "#bd3786" ], [ 0.5555555555555556, "#d8576b" ], [ 0.6666666666666666, "#ed7953" ], [ 0.7777777777777778, "#fb9f3a" ], [ 0.8888888888888888, "#fdca26" ], [ 1.0, "#f0f921" ] ] } ] }, "layout": { "geo": { "bgcolor": "white", "showland": true, "lakecolor": "white", "landcolor": "#E5ECF6", "showlakes": true, "subunitcolor": "white" }, "font": { "color": "#2a3f5f" }, "polar": { "bgcolor": "#E5ECF6", "radialaxis": { "ticks": "", "gridcolor": "white", "linecolor": "white" }, "angularaxis": { "ticks": "", "gridcolor": "white", "linecolor": "white" } }, "scene": { "xaxis": { "ticks": "", "gridcolor": "white", "gridwidth": 2, "linecolor": "white", "zerolinecolor": "white", "showbackground": true, "backgroundcolor": "#E5ECF6" }, "yaxis": { "ticks": "", "gridcolor": "white", "gridwidth": 2, "linecolor": "white", "zerolinecolor": "white", "showbackground": true, "backgroundcolor": "#E5ECF6" }, "zaxis": { "ticks": "", "gridcolor": "white", "gridwidth": 2, "linecolor": "white", "zerolinecolor": "white", "showbackground": true, "backgroundcolor": "#E5ECF6" } }, "title": { "x": 0.05 }, "xaxis": { "ticks": "", "title": { "standoff": 15 }, "gridcolor": "white", "linecolor": "white", "automargin": true, "zerolinecolor": "white", "zerolinewidth": 2 }, "yaxis": { "ticks": "", "title": { "standoff": 15 }, "gridcolor": "white", "linecolor": "white", "automargin": true, "zerolinecolor": "white", "zerolinewidth": 2 }, "mapbox": { "style": "light" }, "ternary": { "aaxis": { "ticks": "", "gridcolor": "white", "linecolor": "white" }, "baxis": { "ticks": "", "gridcolor": "white", "linecolor": "white" }, "caxis": { "ticks": "", "gridcolor": "white", "linecolor": "white" }, "bgcolor": "#E5ECF6" }, "colorway": [ "#636efa", "#EF553B", "#00cc96", "#ab63fa", "#FFA15A", "#19d3f3", "#FF6692", "#B6E880", "#FF97FF", "#FECB52" ], "coloraxis": { "colorbar": { "ticks": "", "outlinewidth": 0 } }, "hovermode": "closest", "colorscale": { "diverging": [ [ 0, "#8e0152" ], [ 0.1, "#c51b7d" ], [ 0.2, "#de77ae" ], [ 0.3, "#f1b6da" ], [ 0.4, "#fde0ef" ], [ 0.5, "#f7f7f7" ], [ 0.6, "#e6f5d0" ], [ 0.7, "#b8e186" ], [ 0.8, "#7fbc41" ], [ 0.9, "#4d9221" ], [ 1, "#276419" ] ], "sequential": [ [ 0.0, "#0d0887" ], [ 0.1111111111111111, "#46039f" ], [ 0.2222222222222222, "#7201a8" ], [ 0.3333333333333333, "#9c179e" ], [ 0.4444444444444444, "#bd3786" ], [ 0.5555555555555556, "#d8576b" ], [ 0.6666666666666666, "#ed7953" ], [ 0.7777777777777778, "#fb9f3a" ], [ 0.8888888888888888, "#fdca26" ], [ 1.0, "#f0f921" ] ], "sequentialminus": [ [ 0.0, "#0d0887" ], [ 0.1111111111111111, "#46039f" ], [ 0.2222222222222222, "#7201a8" ], [ 0.3333333333333333, "#9c179e" ], [ 0.4444444444444444, "#bd3786" ], [ 0.5555555555555556, "#d8576b" ], [ 0.6666666666666666, "#ed7953" ], [ 0.7777777777777778, "#fb9f3a" ], [ 0.8888888888888888, "#fdca26" ], [ 1.0, "#f0f921" ] ] }, "hoverlabel": { "align": "left" }, "plot_bgcolor": "#E5ECF6", "paper_bgcolor": "white", "shapedefaults": { "line": { "color": "#2a3f5f" } }, "autotypenumbers": "strict", "annotationdefaults": { "arrowhead": 0, "arrowcolor": "#2a3f5f", "arrowwidth": 1 } } } } }, "height": 400, "width": null, "user": { "profile_url": "https://chart-studio.plotly.com/~vevadzawla", "avatar_url": "https://storage.googleapis.com/plotly-prod-profiles/13.jpg", "background_url": "https://storage.googleapis.com/plotly-prod-profiles/bg-10.jpg", "bio": "", "nickname": "", "website": "", "stream_tokens": null, "feature_set_id": null, "csrf_token": null, "date_joined": "2024-03-22 06:23:30", "mapbox_access_tokens": null, "has_password": null, "username": "vevadzawla", "email": null, "is_active": null, "readonly": null, "is_dash_creator": null, "dash_created_count": null, "is_chart_creator": null, "charts_created_count": null } } ] }
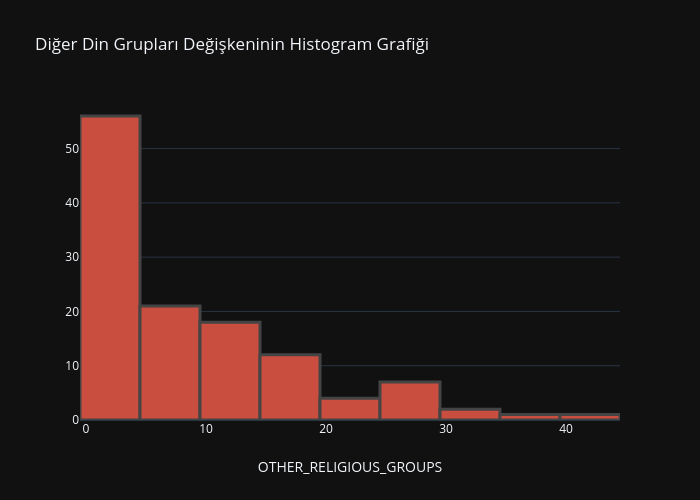
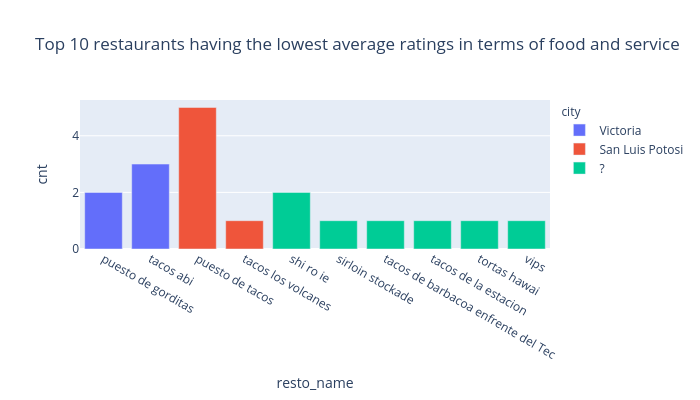