Plots List
Plots
This endpoint handles manipulation of Plotly plot files.
Reference
Authorization
Any user with or without a Plotly account may view public plots. For private plots, see authentication.
Actions
list
Listing all public plots can be done via a GET request to this endpoint.
By default, plots will be listed in order of date created. The order_by
query parameter is accepted at this endpoint. Currently, only ordering by
views is supported. It is possible to filter the plots by quality
with min_quality or max_quality as query parameter.
Example:
// GET https://api.plotly.com/v2/plots/ ---> 200

// GET https://api.plotly.com/v2/plots/?order_by=-views ---> 200

// GET https://api.plotly.com/v2/plots/?min_quality=5 ---> 200

// GET https://api.plotly.com/v2/plots/?max_quality=5 ---> 200
feed
Listing all handpicked feed plots can be done via a GET request to this endpoint. By default, plots will be listed in a random order.
Example:
// GET https://api.plotly.com/v2/plots/feed ---> 200
create
You can create new plot resources here. The only required field is 'figure'. Currently, the figure is restricted to only contain references to grid data. That is, this will fail if raw data arrays are passed in. To create and manipulate underlying grids for plots, see the grids endpoint.
Example:
// This fails because a figure field is required.
// POST https://api.plotly.com/v2/plots ---> 400 Bad Request
{}

// This fails because the figure has raw data
//POST https://api.plotly.com/v2/plots ---> 400 Bad Request
{
    "figure": {"data": [{"y": ['this', 'is', 'raw', 'data']}]}
}

// This succeeds because the figure has src keys, not raw data.
//POST https://api.plotly.com/v2/plots ---> 200 OK
{
    "figure": {"data": [{"ysrc": "sven:88:u8nd62"}]}
}
When creating a grid, you can optionally specify a source_fid to specify where a plot has come from:
- source_fid: the fid of a plot that was copied (and presumably edited) to produce this one
detail
There is a lot of meta information stored about plot files including filename, title, share_url, and content_url to name a few.
This information can only be reached with a GET to this endpoint.
Example:
// GET https://api.plotly.com/v2/plots/iheartgraphs:90
content
The contents of a plot can be downloaded via the content resource. The plot
content contains referenced grid/column data by default. If you wish to
return the raw grid/column data, the inline_data=true query must be included
in the request url. The Content-Type header will be appropriately set for the
response body.
Alternatively, you can set ?map_data=unreadable to append a mapping of
sources to data that belongs to grids which are unreadable for the
requestor. This is useful when you have read access to another users plot,
but that plot contains grid references which you don't have access to.
Examples:
// Returns referenced grid/column data
// GET https://api.plotly.com/v2/plots/iheartgraphs:90/content ---> 200 OK

// Returns full grid/column data
// GET https://api.plotly.com/v2/plots/iheartgraphs:90/content?inline_data=true ---> 200 OK

// Returns full grid/column data when requestor doesn't have permission
// to read the referenced grid.
// GET https://api.plotly.com/v2/plots/iheartgraphs:90/content?map_data=unreadable ---> 200 OK
GET /v2/plots?cursor=cj0xJnA9MjAyNC0wMy0yMSswMCUzQTA4JTNBMzQuMjI2NjQ1JTJCMDAlM0EwMA%3D%3D&format=api
{ "next": "https://api.plot.ly/v2/plots?cursor=cD0yMDI0LTAzLTIxKzAwJTNBMTAlM0ExOC43NzU1MzUlMkIwMCUzQTAw&format=api", "previous": "https://api.plot.ly/v2/plots?cursor=cj0xJnA9MjAyNC0wMy0yMSswMCUzQTMxJTNBMTAuNzE3NDUxJTJCMDAlM0EwMA%3D%3D&format=api", "results": [ { "creation_time": "2024-03-21T00:31:10.717451Z", "comments": { "results": [], "count": 0 }, "parented": true, "embed_url": "https://chart-studio.plotly.com/~kateeab4/29.embed", "fid": "kateeab4:29", "filename": "volcano 10.41357770070126254", "filetype": "plot", "img_url": "https://storage.googleapis.com/plotly-prod-images/kateeab4/29/9_L0MLDUHQFC9H9ARM37R80QFJOZ38FG.png", "image_urls": { "default": "https://storage.googleapis.com/plotly-prod-images/kateeab4/29/2_HA6XQ0690JL4OLBRYCRVUGVUP947KC.png", "block-thumb": "https://storage.googleapis.com/plotly-prod-images/kateeab4/29/8_GN7MKEHBECYIH0LWYOHRYQECHRZUKN.png", "list-thumb": "https://storage.googleapis.com/plotly-prod-images/kateeab4/29/9_L0MLDUHQFC9H9ARM37R80QFJOZ38FG.png" }, "api_urls": { "files": "https://api.plotly.com/v2/files/kateeab4:29", "plots": "https://api.plotly.com/v2/plots/kateeab4:29", "parent": "https://api.plotly.com/v2/folders/home?user=kateeab4" }, "owner": "kateeab4", "parent": -1, "preview": "", "referencers": [], "references": [], "title": "", "views": 4, "web_url": "https://chart-studio.plotly.com/~kateeab4/29/", "world_readable": true, "date_modified": "2024-03-21T00:31:10.731Z", "stars": { "results": [], "count": 0 }, "collaborators": { "results": [], "count": 0 }, "subfolder_count": null, "refresh_interval": null, "organize_view_url": "https://chart-studio.plotly.com/~kateeab4/29/", "current_user_permission": "read", "is_theme": null, "is_template": null, "autosize": true, "caption": "", "figure": { "data": [ { "mode": "markers", "name": "No change", "type": "scattergl", "xsrc": "kateeab4:28:19dc72", "ysrc": "kateeab4:28:8e31e1", "xaxis": "x", "yaxis": "y", "marker": { "color": "#636efa", "symbol": "circle" }, "showlegend": true, "legendgroup": "No change", "hovertextsrc": "kateeab4:28:3100de", "customdatasrc": "kateeab4:28:643669", "hovertemplate": "<b>%{hovertext}</b><br><br>Intrxn=No change<br>TRAF7FL/TRAF7Cterm Log2FC=%{x}<br>TRAF7FL/TRAF7Cterm Log2FC -log10(p value)=%{y}<br>TRAF7FL/TRAF7Cterm pvalue=%{customdata[0]}<br>WDFL/WDCterm Log2FC=%{customdata[1]}<br>WDFL/WDCterm pvalue=%{customdata[2]}<extra></extra>" }, { "mode": "markers", "name": "Disrupted", "type": "scattergl", "xsrc": "kateeab4:28:feddc2", "ysrc": "kateeab4:28:be1456", "xaxis": "x", "yaxis": "y", "marker": { "color": "#EF553B", "symbol": "circle" }, "showlegend": true, "legendgroup": "Disrupted", "hovertextsrc": "kateeab4:28:727f52", "customdatasrc": "kateeab4:28:96a14e", "hovertemplate": "<b>%{hovertext}</b><br><br>Intrxn=Disrupted<br>TRAF7FL/TRAF7Cterm Log2FC=%{x}<br>TRAF7FL/TRAF7Cterm Log2FC -log10(p value)=%{y}<br>TRAF7FL/TRAF7Cterm pvalue=%{customdata[0]}<br>WDFL/WDCterm Log2FC=%{customdata[1]}<br>WDFL/WDCterm pvalue=%{customdata[2]}<extra></extra>" }, { "mode": "markers", "name": "Enhanced in TRAF7 WD40, Disrupted in FL TRAF7", "type": "scattergl", "xsrc": "kateeab4:28:634896", "ysrc": "kateeab4:28:9a69d6", "xaxis": "x", "yaxis": "y", "marker": { "color": "#00cc96", "symbol": "circle" }, "showlegend": true, "legendgroup": "Enhanced in TRAF7 WD40, Disrupted in FL TRAF7", "hovertextsrc": "kateeab4:28:3f87a1", "customdatasrc": "kateeab4:28:448a88", "hovertemplate": "<b>%{hovertext}</b><br><br>Intrxn=Enhanced in TRAF7 WD40, Disrupted in FL TRAF7<br>TRAF7FL/TRAF7Cterm Log2FC=%{x}<br>TRAF7FL/TRAF7Cterm Log2FC -log10(p value)=%{y}<br>TRAF7FL/TRAF7Cterm pvalue=%{customdata[0]}<br>WDFL/WDCterm Log2FC=%{customdata[1]}<br>WDFL/WDCterm pvalue=%{customdata[2]}<extra></extra>" }, { "mode": "markers", "name": "Disrupted in FL TRAF7", "type": "scattergl", "xsrc": "kateeab4:28:ede077", "ysrc": "kateeab4:28:c4b410", "xaxis": "x", "yaxis": "y", "marker": { "color": "#ab63fa", "symbol": "circle" }, "showlegend": true, "legendgroup": "Disrupted in FL TRAF7", "hovertextsrc": "kateeab4:28:588fe9", "customdatasrc": "kateeab4:28:f6752c", "hovertemplate": "<b>%{hovertext}</b><br><br>Intrxn=Disrupted in FL TRAF7<br>TRAF7FL/TRAF7Cterm Log2FC=%{x}<br>TRAF7FL/TRAF7Cterm Log2FC -log10(p value)=%{y}<br>TRAF7FL/TRAF7Cterm pvalue=%{customdata[0]}<br>WDFL/WDCterm Log2FC=%{customdata[1]}<br>WDFL/WDCterm pvalue=%{customdata[2]}<extra></extra>" }, { "mode": "markers", "name": "Enhanced in TRAF7 WD40, no data in FL TRAF7", "type": "scattergl", "xsrc": "kateeab4:28:e4fc07", "ysrc": "kateeab4:28:ca1b5e", "xaxis": "x", "yaxis": "y", "marker": { "color": "#FFA15A", "symbol": "circle" }, "showlegend": true, "legendgroup": "Enhanced in TRAF7 WD40, no data in FL TRAF7", "hovertextsrc": "kateeab4:28:28e480", "customdatasrc": "kateeab4:28:ad7867", "hovertemplate": "<b>%{hovertext}</b><br><br>Intrxn=Enhanced in TRAF7 WD40, no data in FL TRAF7<br>TRAF7FL/TRAF7Cterm Log2FC=%{x}<br>TRAF7FL/TRAF7Cterm Log2FC -log10(p value)=%{y}<br>TRAF7FL/TRAF7Cterm pvalue=%{customdata[0]}<br>WDFL/WDCterm Log2FC=%{customdata[1]}<br>WDFL/WDCterm pvalue=%{customdata[2]}<extra></extra>" }, { "mode": "markers", "name": "Enhanced in FL TRAF7, Disrupted in TRAF7 WD40", "type": "scattergl", "xsrc": "kateeab4:28:a3db19", "ysrc": "kateeab4:28:9d91b1", "xaxis": "x", "yaxis": "y", "marker": { "color": "#19d3f3", "symbol": "circle" }, "showlegend": true, "legendgroup": "Enhanced in FL TRAF7, Disrupted in TRAF7 WD40", "hovertextsrc": "kateeab4:28:1c09b2", "customdatasrc": "kateeab4:28:63afa8", "hovertemplate": "<b>%{hovertext}</b><br><br>Intrxn=Enhanced in FL TRAF7, Disrupted in TRAF7 WD40<br>TRAF7FL/TRAF7Cterm Log2FC=%{x}<br>TRAF7FL/TRAF7Cterm Log2FC -log10(p value)=%{y}<br>TRAF7FL/TRAF7Cterm pvalue=%{customdata[0]}<br>WDFL/WDCterm Log2FC=%{customdata[1]}<br>WDFL/WDCterm pvalue=%{customdata[2]}<extra></extra>" }, { "mode": "markers", "name": "Enhanced", "type": "scattergl", "xsrc": "kateeab4:28:6a651a", "ysrc": "kateeab4:28:0f567a", "xaxis": "x", "yaxis": "y", "marker": { "color": "#FF6692", "symbol": "circle" }, "showlegend": true, "legendgroup": "Enhanced", "hovertextsrc": "kateeab4:28:ece9a0", "customdatasrc": "kateeab4:28:a19d70", "hovertemplate": "<b>%{hovertext}</b><br><br>Intrxn=Enhanced<br>TRAF7FL/TRAF7Cterm Log2FC=%{x}<br>TRAF7FL/TRAF7Cterm Log2FC -log10(p value)=%{y}<br>TRAF7FL/TRAF7Cterm pvalue=%{customdata[0]}<br>WDFL/WDCterm Log2FC=%{customdata[1]}<br>WDFL/WDCterm pvalue=%{customdata[2]}<extra></extra>" }, { "mode": "markers", "name": "Enhanced in FL TRAF7", "type": "scattergl", "xsrc": "kateeab4:28:738179", "ysrc": "kateeab4:28:7121eb", "xaxis": "x", "yaxis": "y", "marker": { "color": "#B6E880", "symbol": "circle" }, "showlegend": true, "legendgroup": "Enhanced in FL TRAF7", "hovertextsrc": "kateeab4:28:6e1880", "customdatasrc": "kateeab4:28:058c49", "hovertemplate": "<b>%{hovertext}</b><br><br>Intrxn=Enhanced in FL TRAF7<br>TRAF7FL/TRAF7Cterm Log2FC=%{x}<br>TRAF7FL/TRAF7Cterm Log2FC -log10(p value)=%{y}<br>TRAF7FL/TRAF7Cterm pvalue=%{customdata[0]}<br>WDFL/WDCterm Log2FC=%{customdata[1]}<br>WDFL/WDCterm pvalue=%{customdata[2]}<extra></extra>" }, { "mode": "markers", "name": "Disrupted in FL TRAF7, no data in TRAF7 WD40", "type": "scattergl", "xsrc": "kateeab4:28:8c8c9d", "ysrc": "kateeab4:28:5578a1", "xaxis": "x", "yaxis": "y", "marker": { "color": "#FF97FF", "symbol": "circle" }, "showlegend": true, "legendgroup": "Disrupted in FL TRAF7, no data in TRAF7 WD40", "hovertextsrc": "kateeab4:28:bb6002", "customdatasrc": "kateeab4:28:a874eb", "hovertemplate": "<b>%{hovertext}</b><br><br>Intrxn=Disrupted in FL TRAF7, no data in TRAF7 WD40<br>TRAF7FL/TRAF7Cterm Log2FC=%{x}<br>TRAF7FL/TRAF7Cterm Log2FC -log10(p value)=%{y}<br>TRAF7FL/TRAF7Cterm pvalue=%{customdata[0]}<br>WDFL/WDCterm Log2FC=%{customdata[1]}<br>WDFL/WDCterm pvalue=%{customdata[2]}<extra></extra>" }, { "mode": "markers", "name": "Enhanced in TRAF7 WD40", "type": "scattergl", "xsrc": "kateeab4:28:a41d8e", "ysrc": "kateeab4:28:409d9a", "xaxis": "x", "yaxis": "y", "marker": { "color": "#FECB52", "symbol": "circle" }, "showlegend": true, "legendgroup": "Enhanced in TRAF7 WD40", "hovertextsrc": "kateeab4:28:8315ca", "customdatasrc": "kateeab4:28:503217", "hovertemplate": "<b>%{hovertext}</b><br><br>Intrxn=Enhanced in TRAF7 WD40<br>TRAF7FL/TRAF7Cterm Log2FC=%{x}<br>TRAF7FL/TRAF7Cterm Log2FC -log10(p value)=%{y}<br>TRAF7FL/TRAF7Cterm pvalue=%{customdata[0]}<br>WDFL/WDCterm Log2FC=%{customdata[1]}<br>WDFL/WDCterm pvalue=%{customdata[2]}<extra></extra>" }, { "mode": "markers", "name": "Disrupted in TRAF7 WD40, no data in FL TRAF7", "type": "scattergl", "xsrc": "kateeab4:28:19ce66", "ysrc": "kateeab4:28:39de61", "xaxis": "x", "yaxis": "y", "marker": { "color": "#636efa", "symbol": "circle" }, "showlegend": true, "legendgroup": "Disrupted in TRAF7 WD40, no data in FL TRAF7", "hovertextsrc": "kateeab4:28:e5e699", "customdatasrc": "kateeab4:28:fe6a2e", "hovertemplate": "<b>%{hovertext}</b><br><br>Intrxn=Disrupted in TRAF7 WD40, no data in FL TRAF7<br>TRAF7FL/TRAF7Cterm Log2FC=%{x}<br>TRAF7FL/TRAF7Cterm Log2FC -log10(p value)=%{y}<br>TRAF7FL/TRAF7Cterm pvalue=%{customdata[0]}<br>WDFL/WDCterm Log2FC=%{customdata[1]}<br>WDFL/WDCterm pvalue=%{customdata[2]}<extra></extra>" }, { "mode": "markers", "name": "Disrupted in TRAF7 WD40", "type": "scattergl", "xsrc": "kateeab4:28:62bf77", "ysrc": "kateeab4:28:8b384b", "xaxis": "x", "yaxis": "y", "marker": { "color": "#EF553B", "symbol": "circle" }, "showlegend": true, "legendgroup": "Disrupted in TRAF7 WD40", "hovertextsrc": "kateeab4:28:4467be", "customdatasrc": "kateeab4:28:a3e9e3", "hovertemplate": "<b>%{hovertext}</b><br><br>Intrxn=Disrupted in TRAF7 WD40<br>TRAF7FL/TRAF7Cterm Log2FC=%{x}<br>TRAF7FL/TRAF7Cterm Log2FC -log10(p value)=%{y}<br>TRAF7FL/TRAF7Cterm pvalue=%{customdata[0]}<br>WDFL/WDCterm Log2FC=%{customdata[1]}<br>WDFL/WDCterm pvalue=%{customdata[2]}<extra></extra>" }, { "mode": "markers", "name": "Enhanced in FL TRAF7, no data in TRAF7 WD40", "type": "scattergl", "xsrc": "kateeab4:28:988e37", "ysrc": "kateeab4:28:92ffd0", "xaxis": "x", "yaxis": "y", "marker": { "color": "#00cc96", "symbol": "circle" }, "showlegend": true, "legendgroup": "Enhanced in FL TRAF7, no data in TRAF7 WD40", "hovertextsrc": "kateeab4:28:5918aa", "customdatasrc": "kateeab4:28:1f2a00", "hovertemplate": "<b>%{hovertext}</b><br><br>Intrxn=Enhanced in FL TRAF7, no data in TRAF7 WD40<br>TRAF7FL/TRAF7Cterm Log2FC=%{x}<br>TRAF7FL/TRAF7Cterm Log2FC -log10(p value)=%{y}<br>TRAF7FL/TRAF7Cterm pvalue=%{customdata[0]}<br>WDFL/WDCterm Log2FC=%{customdata[1]}<br>WDFL/WDCterm pvalue=%{customdata[2]}<extra></extra>" }, { "line": { "dash": "dot", "color": "black", "width": 1 }, "mode": "lines", "name": "p value = 0.05", "type": "scatter", "xsrc": "kateeab4:28:4c3b10", "ysrc": "kateeab4:28:a32540", "opacity": 0.5 } ], "layout": { "title": { "text": "AP-MS of Proteins with TRAF7" }, "xaxis": { "title": { "text": "TRAF7FL/TRAF7Cterm Log2FC" }, "anchor": "y", "domain": [ 0.0, 1.0 ] }, "yaxis": { "title": { "text": "-log10(p val)" }, "anchor": "x", "domain": [ 0.0, 1.0 ] }, "legend": { "title": { "text": "Intrxn" }, "tracegroupgap": 0 }, "margin": { "t": 60 }, "template": { "data": { "bar": [ { "type": "bar", "marker": { "line": { "color": "#E5ECF6", "width": 0.5 }, "pattern": { "size": 10, "fillmode": "overlay", "solidity": 0.2 } }, "error_x": { "color": "#2a3f5f" }, "error_y": { "color": "#2a3f5f" } } ], "pie": [ { "type": "pie", "automargin": true } ], "table": [ { "type": "table", "cells": { "fill": { "color": "#EBF0F8" }, "line": { "color": "white" } }, "header": { "fill": { "color": "#C8D4E3" }, "line": { "color": "white" } } } ], "carpet": [ { "type": "carpet", "aaxis": { "gridcolor": "white", "linecolor": "white", "endlinecolor": "#2a3f5f", "minorgridcolor": "white", "startlinecolor": "#2a3f5f" }, "baxis": { "gridcolor": "white", "linecolor": "white", "endlinecolor": "#2a3f5f", "minorgridcolor": "white", "startlinecolor": "#2a3f5f" } } ], "mesh3d": [ { "type": "mesh3d", "colorbar": { "ticks": "", "outlinewidth": 0 } } ], "contour": [ { "type": "contour", "colorbar": { "ticks": "", "outlinewidth": 0 }, "colorscale": [ [ 0.0, "#0d0887" ], [ 0.1111111111111111, "#46039f" ], [ 0.2222222222222222, "#7201a8" ], [ 0.3333333333333333, "#9c179e" ], [ 0.4444444444444444, "#bd3786" ], [ 0.5555555555555556, "#d8576b" ], [ 0.6666666666666666, "#ed7953" ], [ 0.7777777777777778, "#fb9f3a" ], [ 0.8888888888888888, "#fdca26" ], [ 1.0, "#f0f921" ] ] } ], "heatmap": [ { "type": "heatmap", "colorbar": { "ticks": "", "outlinewidth": 0 }, "colorscale": [ [ 0.0, "#0d0887" ], [ 0.1111111111111111, "#46039f" ], [ 0.2222222222222222, "#7201a8" ], [ 0.3333333333333333, "#9c179e" ], [ 0.4444444444444444, "#bd3786" ], [ 0.5555555555555556, "#d8576b" ], [ 0.6666666666666666, "#ed7953" ], [ 0.7777777777777778, "#fb9f3a" ], [ 0.8888888888888888, "#fdca26" ], [ 1.0, "#f0f921" ] ] } ], "scatter": [ { "type": "scatter", "fillpattern": { "size": 10, "fillmode": "overlay", "solidity": 0.2 } } ], "surface": [ { "type": "surface", "colorbar": { "ticks": "", "outlinewidth": 0 }, "colorscale": [ [ 0.0, "#0d0887" ], [ 0.1111111111111111, "#46039f" ], [ 0.2222222222222222, "#7201a8" ], [ 0.3333333333333333, "#9c179e" ], [ 0.4444444444444444, "#bd3786" ], [ 0.5555555555555556, "#d8576b" ], [ 0.6666666666666666, "#ed7953" ], [ 0.7777777777777778, "#fb9f3a" ], [ 0.8888888888888888, "#fdca26" ], [ 1.0, "#f0f921" ] ] } ], "barpolar": [ { "type": "barpolar", "marker": { "line": { "color": "#E5ECF6", "width": 0.5 }, "pattern": { "size": 10, "fillmode": "overlay", "solidity": 0.2 } } } ], "heatmapgl": [ { "type": "heatmapgl", "colorbar": { "ticks": "", "outlinewidth": 0 }, "colorscale": [ [ 0.0, "#0d0887" ], [ 0.1111111111111111, "#46039f" ], [ 0.2222222222222222, "#7201a8" ], [ 0.3333333333333333, "#9c179e" ], [ 0.4444444444444444, "#bd3786" ], [ 0.5555555555555556, "#d8576b" ], [ 0.6666666666666666, "#ed7953" ], [ 0.7777777777777778, "#fb9f3a" ], [ 0.8888888888888888, "#fdca26" ], [ 1.0, "#f0f921" ] ] } ], "histogram": [ { "type": "histogram", "marker": { "pattern": { "size": 10, "fillmode": "overlay", "solidity": 0.2 } } } ], "parcoords": [ { "line": { "colorbar": { "ticks": "", "outlinewidth": 0 } }, "type": "parcoords" } ], "scatter3d": [ { "line": { "colorbar": { "ticks": "", "outlinewidth": 0 } }, "type": "scatter3d", "marker": { "colorbar": { "ticks": "", "outlinewidth": 0 } } } ], "scattergl": [ { "type": "scattergl", "marker": { "colorbar": { "ticks": "", "outlinewidth": 0 } } } ], "choropleth": [ { "type": "choropleth", "colorbar": { "ticks": "", "outlinewidth": 0 } } ], "scattergeo": [ { "type": "scattergeo", "marker": { "colorbar": { "ticks": "", "outlinewidth": 0 } } } ], "histogram2d": [ { "type": "histogram2d", "colorbar": { "ticks": "", "outlinewidth": 0 }, "colorscale": [ [ 0.0, "#0d0887" ], [ 0.1111111111111111, "#46039f" ], [ 0.2222222222222222, "#7201a8" ], [ 0.3333333333333333, "#9c179e" ], [ 0.4444444444444444, "#bd3786" ], [ 0.5555555555555556, "#d8576b" ], [ 0.6666666666666666, "#ed7953" ], [ 0.7777777777777778, "#fb9f3a" ], [ 0.8888888888888888, "#fdca26" ], [ 1.0, "#f0f921" ] ] } ], "scatterpolar": [ { "type": "scatterpolar", "marker": { "colorbar": { "ticks": "", "outlinewidth": 0 } } } ], "contourcarpet": [ { "type": "contourcarpet", "colorbar": { "ticks": "", "outlinewidth": 0 } } ], "scattercarpet": [ { "type": "scattercarpet", "marker": { "colorbar": { "ticks": "", "outlinewidth": 0 } } } ], "scattermapbox": [ { "type": "scattermapbox", "marker": { "colorbar": { "ticks": "", "outlinewidth": 0 } } } ], "scatterpolargl": [ { "type": "scatterpolargl", "marker": { "colorbar": { "ticks": "", "outlinewidth": 0 } } } ], "scatterternary": [ { "type": "scatterternary", "marker": { "colorbar": { "ticks": "", "outlinewidth": 0 } } } ], "histogram2dcontour": [ { "type": "histogram2dcontour", "colorbar": { "ticks": "", "outlinewidth": 0 }, "colorscale": [ [ 0.0, "#0d0887" ], [ 0.1111111111111111, "#46039f" ], [ 0.2222222222222222, "#7201a8" ], [ 0.3333333333333333, "#9c179e" ], [ 0.4444444444444444, "#bd3786" ], [ 0.5555555555555556, "#d8576b" ], [ 0.6666666666666666, "#ed7953" ], [ 0.7777777777777778, "#fb9f3a" ], [ 0.8888888888888888, "#fdca26" ], [ 1.0, "#f0f921" ] ] } ] }, "layout": { "geo": { "bgcolor": "white", "showland": true, "lakecolor": "white", "landcolor": "#E5ECF6", "showlakes": true, "subunitcolor": "white" }, "font": { "color": "#2a3f5f" }, "polar": { "bgcolor": "#E5ECF6", "radialaxis": { "ticks": "", "gridcolor": "white", "linecolor": "white" }, "angularaxis": { "ticks": "", "gridcolor": "white", "linecolor": "white" } }, "scene": { "xaxis": { "ticks": "", "gridcolor": "white", "gridwidth": 2, "linecolor": "white", "zerolinecolor": "white", "showbackground": true, "backgroundcolor": "#E5ECF6" }, "yaxis": { "ticks": "", "gridcolor": "white", "gridwidth": 2, "linecolor": "white", "zerolinecolor": "white", "showbackground": true, "backgroundcolor": "#E5ECF6" }, "zaxis": { "ticks": "", "gridcolor": "white", "gridwidth": 2, "linecolor": "white", "zerolinecolor": "white", "showbackground": true, "backgroundcolor": "#E5ECF6" } }, "title": { "x": 0.05 }, "xaxis": { "ticks": "", "title": { "standoff": 15 }, "gridcolor": "white", "linecolor": "white", "automargin": true, "zerolinecolor": "white", "zerolinewidth": 2 }, "yaxis": { "ticks": "", "title": { "standoff": 15 }, "gridcolor": "white", "linecolor": "white", "automargin": true, "zerolinecolor": "white", "zerolinewidth": 2 }, "mapbox": { "style": "light" }, "ternary": { "aaxis": { "ticks": "", "gridcolor": "white", "linecolor": "white" }, "baxis": { "ticks": "", "gridcolor": "white", "linecolor": "white" }, "caxis": { "ticks": "", "gridcolor": "white", "linecolor": "white" }, "bgcolor": "#E5ECF6" }, "colorway": [ "#636efa", "#EF553B", "#00cc96", "#ab63fa", "#FFA15A", "#19d3f3", "#FF6692", "#B6E880", "#FF97FF", "#FECB52" ], "coloraxis": { "colorbar": { "ticks": "", "outlinewidth": 0 } }, "hovermode": "closest", "colorscale": { "diverging": [ [ 0, "#8e0152" ], [ 0.1, "#c51b7d" ], [ 0.2, "#de77ae" ], [ 0.3, "#f1b6da" ], [ 0.4, "#fde0ef" ], [ 0.5, "#f7f7f7" ], [ 0.6, "#e6f5d0" ], [ 0.7, "#b8e186" ], [ 0.8, "#7fbc41" ], [ 0.9, "#4d9221" ], [ 1, "#276419" ] ], "sequential": [ [ 0.0, "#0d0887" ], [ 0.1111111111111111, "#46039f" ], [ 0.2222222222222222, "#7201a8" ], [ 0.3333333333333333, "#9c179e" ], [ 0.4444444444444444, "#bd3786" ], [ 0.5555555555555556, "#d8576b" ], [ 0.6666666666666666, "#ed7953" ], [ 0.7777777777777778, "#fb9f3a" ], [ 0.8888888888888888, "#fdca26" ], [ 1.0, "#f0f921" ] ], "sequentialminus": [ [ 0.0, "#0d0887" ], [ 0.1111111111111111, "#46039f" ], [ 0.2222222222222222, "#7201a8" ], [ 0.3333333333333333, "#9c179e" ], [ 0.4444444444444444, "#bd3786" ], [ 0.5555555555555556, "#d8576b" ], [ 0.6666666666666666, "#ed7953" ], [ 0.7777777777777778, "#fb9f3a" ], [ 0.8888888888888888, "#fdca26" ], [ 1.0, "#f0f921" ] ] }, "hoverlabel": { "align": "left" }, "plot_bgcolor": "#E5ECF6", "paper_bgcolor": "white", "shapedefaults": { "line": { "color": "#2a3f5f" } }, "autotypenumbers": "strict", "annotationdefaults": { "arrowhead": 0, "arrowcolor": "#2a3f5f", "arrowwidth": 1 } } }, "showlegend": true } }, "height": null, "width": null, "user": { "profile_url": "https://chart-studio.plotly.com/~kateeab4", "avatar_url": "https://storage.googleapis.com/plotly-prod-profiles/87.jpg", "background_url": "https://storage.googleapis.com/plotly-prod-profiles/bg-0.jpg", "bio": "", "nickname": "", "website": "", "stream_tokens": null, "feature_set_id": null, "csrf_token": null, "date_joined": "2024-03-14 18:33:41", "mapbox_access_tokens": null, "has_password": null, "username": "kateeab4", "email": null, "is_active": null, "readonly": null, "is_dash_creator": null, "dash_created_count": null, "is_chart_creator": null, "charts_created_count": null } }, { "creation_time": "2024-03-21T00:31:01.240545Z", "comments": { "results": [], "count": 0 }, "parented": true, "embed_url": "https://chart-studio.plotly.com/~kateeab4/27.embed", "fid": "kateeab4:27", "filename": "scatter0.41357770070126254", "filetype": "plot", "img_url": "https://storage.googleapis.com/plotly-prod-images/kateeab4/27/9_QJGUQ766B9YI8AZK302PZU4Q6HUQBV.png", "image_urls": { "default": "https://storage.googleapis.com/plotly-prod-images/kateeab4/27/2_T6SEUJ8WEOXT04XCSYVLA7CY3VP9DT.png", "block-thumb": "https://storage.googleapis.com/plotly-prod-images/kateeab4/27/8_A39JBN60M59WBTDPWJ1IISLEOQI9OW.png", "list-thumb": "https://storage.googleapis.com/plotly-prod-images/kateeab4/27/9_QJGUQ766B9YI8AZK302PZU4Q6HUQBV.png" }, "api_urls": { "files": "https://api.plotly.com/v2/files/kateeab4:27", "plots": "https://api.plotly.com/v2/plots/kateeab4:27", "parent": "https://api.plotly.com/v2/folders/home?user=kateeab4" }, "owner": "kateeab4", "parent": -1, "preview": "", "referencers": [], "references": [], "title": "", "views": 2, "web_url": "https://chart-studio.plotly.com/~kateeab4/27/", "world_readable": true, "date_modified": "2024-03-21T00:31:01.255Z", "stars": { "results": [], "count": 0 }, "collaborators": { "results": [], "count": 0 }, "subfolder_count": null, "refresh_interval": null, "organize_view_url": "https://chart-studio.plotly.com/~kateeab4/27/", "current_user_permission": "read", "is_theme": null, "is_template": null, "autosize": true, "caption": "", "figure": { "data": [ { "mode": "markers", "name": "No change", "type": "scatter", "xsrc": "kateeab4:26:cd1371", "ysrc": "kateeab4:26:691884", "xaxis": "x", "yaxis": "y", "marker": { "color": "#636efa", "symbol": "circle" }, "showlegend": true, "legendgroup": "No change", "orientation": "v", "customdatasrc": "kateeab4:26:8ef3af", "hovertemplate": "Intrxn=No change<br>TRAF7FL/TRAF7Cterm Log2FC=%{x}<br>WDFL/WDCterm Log2FC=%{y}<br>PreyGene=%{customdata[0]}<br>TRAF7FL/TRAF7Cterm pvalue=%{customdata[1]}<br>WDFL/WDCterm pvalue=%{customdata[2]}<extra></extra>" }, { "mode": "markers", "name": "Disrupted", "type": "scatter", "xsrc": "kateeab4:26:4ff1a7", "ysrc": "kateeab4:26:e615d5", "xaxis": "x", "yaxis": "y", "marker": { "color": "#EF553B", "symbol": "circle" }, "showlegend": true, "legendgroup": "Disrupted", "orientation": "v", "customdatasrc": "kateeab4:26:d41df0", "hovertemplate": "Intrxn=Disrupted<br>TRAF7FL/TRAF7Cterm Log2FC=%{x}<br>WDFL/WDCterm Log2FC=%{y}<br>PreyGene=%{customdata[0]}<br>TRAF7FL/TRAF7Cterm pvalue=%{customdata[1]}<br>WDFL/WDCterm pvalue=%{customdata[2]}<extra></extra>" }, { "mode": "markers", "name": "Disrupted in FL TRAF7", "type": "scatter", "xsrc": "kateeab4:26:b42fad", "ysrc": "kateeab4:26:3dce03", "xaxis": "x", "yaxis": "y", "marker": { "color": "#00cc96", "symbol": "circle" }, "showlegend": true, "legendgroup": "Disrupted in FL TRAF7", "orientation": "v", "customdatasrc": "kateeab4:26:549d9e", "hovertemplate": "Intrxn=Disrupted in FL TRAF7<br>TRAF7FL/TRAF7Cterm Log2FC=%{x}<br>WDFL/WDCterm Log2FC=%{y}<br>PreyGene=%{customdata[0]}<br>TRAF7FL/TRAF7Cterm pvalue=%{customdata[1]}<br>WDFL/WDCterm pvalue=%{customdata[2]}<extra></extra>" }, { "mode": "markers", "name": "Enhanced in TRAF7 WD40, no data in FL TRAF7", "type": "scatter", "xsrc": "kateeab4:26:60278e", "ysrc": "kateeab4:26:82db5c", "xaxis": "x", "yaxis": "y", "marker": { "color": "#ab63fa", "symbol": "circle" }, "showlegend": true, "legendgroup": "Enhanced in TRAF7 WD40, no data in FL TRAF7", "orientation": "v", "customdatasrc": "kateeab4:26:929e65", "hovertemplate": "Intrxn=Enhanced in TRAF7 WD40, no data in FL TRAF7<br>TRAF7FL/TRAF7Cterm Log2FC=%{x}<br>WDFL/WDCterm Log2FC=%{y}<br>PreyGene=%{customdata[0]}<br>TRAF7FL/TRAF7Cterm pvalue=%{customdata[1]}<br>WDFL/WDCterm pvalue=%{customdata[2]}<extra></extra>" }, { "mode": "markers", "name": "Enhanced", "type": "scatter", "xsrc": "kateeab4:26:ade004", "ysrc": "kateeab4:26:97f6ba", "xaxis": "x", "yaxis": "y", "marker": { "color": "#FFA15A", "symbol": "circle" }, "showlegend": true, "legendgroup": "Enhanced", "orientation": "v", "customdatasrc": "kateeab4:26:0139c4", "hovertemplate": "Intrxn=Enhanced<br>TRAF7FL/TRAF7Cterm Log2FC=%{x}<br>WDFL/WDCterm Log2FC=%{y}<br>PreyGene=%{customdata[0]}<br>TRAF7FL/TRAF7Cterm pvalue=%{customdata[1]}<br>WDFL/WDCterm pvalue=%{customdata[2]}<extra></extra>" }, { "mode": "markers", "name": "Enhanced in FL TRAF7", "type": "scatter", "xsrc": "kateeab4:26:2a1936", "ysrc": "kateeab4:26:fb26d6", "xaxis": "x", "yaxis": "y", "marker": { "color": "#19d3f3", "symbol": "circle" }, "showlegend": true, "legendgroup": "Enhanced in FL TRAF7", "orientation": "v", "customdatasrc": "kateeab4:26:8ca35d", "hovertemplate": "Intrxn=Enhanced in FL TRAF7<br>TRAF7FL/TRAF7Cterm Log2FC=%{x}<br>WDFL/WDCterm Log2FC=%{y}<br>PreyGene=%{customdata[0]}<br>TRAF7FL/TRAF7Cterm pvalue=%{customdata[1]}<br>WDFL/WDCterm pvalue=%{customdata[2]}<extra></extra>" }, { "mode": "markers", "name": "Disrupted in FL TRAF7, no data in TRAF7 WD40", "type": "scatter", "xsrc": "kateeab4:26:2d2775", "ysrc": "kateeab4:26:abb251", "xaxis": "x", "yaxis": "y", "marker": { "color": "#FF6692", "symbol": "circle" }, "showlegend": true, "legendgroup": "Disrupted in FL TRAF7, no data in TRAF7 WD40", "orientation": "v", "customdatasrc": "kateeab4:26:082909", "hovertemplate": "Intrxn=Disrupted in FL TRAF7, no data in TRAF7 WD40<br>TRAF7FL/TRAF7Cterm Log2FC=%{x}<br>WDFL/WDCterm Log2FC=%{y}<br>PreyGene=%{customdata[0]}<br>TRAF7FL/TRAF7Cterm pvalue=%{customdata[1]}<br>WDFL/WDCterm pvalue=%{customdata[2]}<extra></extra>" }, { "mode": "markers", "name": "Disrupted in TRAF7 WD40, no data in FL TRAF7", "type": "scatter", "xsrc": "kateeab4:26:1fa313", "ysrc": "kateeab4:26:b31b70", "xaxis": "x", "yaxis": "y", "marker": { "color": "#B6E880", "symbol": "circle" }, "showlegend": true, "legendgroup": "Disrupted in TRAF7 WD40, no data in FL TRAF7", "orientation": "v", "customdatasrc": "kateeab4:26:d613a3", "hovertemplate": "Intrxn=Disrupted in TRAF7 WD40, no data in FL TRAF7<br>TRAF7FL/TRAF7Cterm Log2FC=%{x}<br>WDFL/WDCterm Log2FC=%{y}<br>PreyGene=%{customdata[0]}<br>TRAF7FL/TRAF7Cterm pvalue=%{customdata[1]}<br>WDFL/WDCterm pvalue=%{customdata[2]}<extra></extra>" }, { "mode": "markers", "name": "Enhanced in TRAF7 WD40", "type": "scatter", "xsrc": "kateeab4:26:3100ca", "ysrc": "kateeab4:26:c45a7d", "xaxis": "x", "yaxis": "y", "marker": { "color": "#FF97FF", "symbol": "circle" }, "showlegend": true, "legendgroup": "Enhanced in TRAF7 WD40", "orientation": "v", "customdatasrc": "kateeab4:26:045fa2", "hovertemplate": "Intrxn=Enhanced in TRAF7 WD40<br>TRAF7FL/TRAF7Cterm Log2FC=%{x}<br>WDFL/WDCterm Log2FC=%{y}<br>PreyGene=%{customdata[0]}<br>TRAF7FL/TRAF7Cterm pvalue=%{customdata[1]}<br>WDFL/WDCterm pvalue=%{customdata[2]}<extra></extra>" }, { "mode": "markers", "name": "Disrupted in TRAF7 WD40", "type": "scatter", "xsrc": "kateeab4:26:84001f", "ysrc": "kateeab4:26:ac0e11", "xaxis": "x", "yaxis": "y", "marker": { "color": "#FECB52", "symbol": "circle" }, "showlegend": true, "legendgroup": "Disrupted in TRAF7 WD40", "orientation": "v", "customdatasrc": "kateeab4:26:dcc87a", "hovertemplate": "Intrxn=Disrupted in TRAF7 WD40<br>TRAF7FL/TRAF7Cterm Log2FC=%{x}<br>WDFL/WDCterm Log2FC=%{y}<br>PreyGene=%{customdata[0]}<br>TRAF7FL/TRAF7Cterm pvalue=%{customdata[1]}<br>WDFL/WDCterm pvalue=%{customdata[2]}<extra></extra>" }, { "mode": "markers", "name": "Enhanced in FL TRAF7, no data in TRAF7 WD40", "type": "scatter", "xsrc": "kateeab4:26:be550b", "ysrc": "kateeab4:26:5e4658", "xaxis": "x", "yaxis": "y", "marker": { "color": "#636efa", "symbol": "circle" }, "showlegend": true, "legendgroup": "Enhanced in FL TRAF7, no data in TRAF7 WD40", "orientation": "v", "customdatasrc": "kateeab4:26:25688f", "hovertemplate": "Intrxn=Enhanced in FL TRAF7, no data in TRAF7 WD40<br>TRAF7FL/TRAF7Cterm Log2FC=%{x}<br>WDFL/WDCterm Log2FC=%{y}<br>PreyGene=%{customdata[0]}<br>TRAF7FL/TRAF7Cterm pvalue=%{customdata[1]}<br>WDFL/WDCterm pvalue=%{customdata[2]}<extra></extra>" }, { "mode": "markers", "name": "Enhanced in TRAF7 WD40, Disrupted in FL TRAF7", "type": "scatter", "xsrc": "kateeab4:26:5a6ebd", "ysrc": "kateeab4:26:b0ef4d", "xaxis": "x", "yaxis": "y", "marker": { "color": "#EF553B", "symbol": "circle" }, "showlegend": true, "legendgroup": "Enhanced in TRAF7 WD40, Disrupted in FL TRAF7", "orientation": "v", "customdatasrc": "kateeab4:26:66024e", "hovertemplate": "Intrxn=Enhanced in TRAF7 WD40, Disrupted in FL TRAF7<br>TRAF7FL/TRAF7Cterm Log2FC=%{x}<br>WDFL/WDCterm Log2FC=%{y}<br>PreyGene=%{customdata[0]}<br>TRAF7FL/TRAF7Cterm pvalue=%{customdata[1]}<br>WDFL/WDCterm pvalue=%{customdata[2]}<extra></extra>" } ], "layout": { "title": { "text": "AP-MS of Proteins with TRAF7" }, "xaxis": { "title": { "text": "TRAF7FL/TRAF7Cterm Log2FC" }, "anchor": "y", "domain": [ 0.0, 1.0 ] }, "yaxis": { "title": { "text": "WDFL/WDCterm Log2FC" }, "anchor": "x", "domain": [ 0.0, 1.0 ] }, "legend": { "title": { "text": "Intrxn" }, "tracegroupgap": 0 }, "margin": { "t": 60 }, "template": { "data": { "bar": [ { "type": "bar", "marker": { "line": { "color": "#E5ECF6", "width": 0.5 }, "pattern": { "size": 10, "fillmode": "overlay", "solidity": 0.2 } }, "error_x": { "color": "#2a3f5f" }, "error_y": { "color": "#2a3f5f" } } ], "pie": [ { "type": "pie", "automargin": true } ], "table": [ { "type": "table", "cells": { "fill": { "color": "#EBF0F8" }, "line": { "color": "white" } }, "header": { "fill": { "color": "#C8D4E3" }, "line": { "color": "white" } } } ], "carpet": [ { "type": "carpet", "aaxis": { "gridcolor": "white", "linecolor": "white", "endlinecolor": "#2a3f5f", "minorgridcolor": "white", "startlinecolor": "#2a3f5f" }, "baxis": { "gridcolor": "white", "linecolor": "white", "endlinecolor": "#2a3f5f", "minorgridcolor": "white", "startlinecolor": "#2a3f5f" } } ], "mesh3d": [ { "type": "mesh3d", "colorbar": { "ticks": "", "outlinewidth": 0 } } ], "contour": [ { "type": "contour", "colorbar": { "ticks": "", "outlinewidth": 0 }, "colorscale": [ [ 0.0, "#0d0887" ], [ 0.1111111111111111, "#46039f" ], [ 0.2222222222222222, "#7201a8" ], [ 0.3333333333333333, "#9c179e" ], [ 0.4444444444444444, "#bd3786" ], [ 0.5555555555555556, "#d8576b" ], [ 0.6666666666666666, "#ed7953" ], [ 0.7777777777777778, "#fb9f3a" ], [ 0.8888888888888888, "#fdca26" ], [ 1.0, "#f0f921" ] ] } ], "heatmap": [ { "type": "heatmap", "colorbar": { "ticks": "", "outlinewidth": 0 }, "colorscale": [ [ 0.0, "#0d0887" ], [ 0.1111111111111111, "#46039f" ], [ 0.2222222222222222, "#7201a8" ], [ 0.3333333333333333, "#9c179e" ], [ 0.4444444444444444, "#bd3786" ], [ 0.5555555555555556, "#d8576b" ], [ 0.6666666666666666, "#ed7953" ], [ 0.7777777777777778, "#fb9f3a" ], [ 0.8888888888888888, "#fdca26" ], [ 1.0, "#f0f921" ] ] } ], "scatter": [ { "type": "scatter", "fillpattern": { "size": 10, "fillmode": "overlay", "solidity": 0.2 } } ], "surface": [ { "type": "surface", "colorbar": { "ticks": "", "outlinewidth": 0 }, "colorscale": [ [ 0.0, "#0d0887" ], [ 0.1111111111111111, "#46039f" ], [ 0.2222222222222222, "#7201a8" ], [ 0.3333333333333333, "#9c179e" ], [ 0.4444444444444444, "#bd3786" ], [ 0.5555555555555556, "#d8576b" ], [ 0.6666666666666666, "#ed7953" ], [ 0.7777777777777778, "#fb9f3a" ], [ 0.8888888888888888, "#fdca26" ], [ 1.0, "#f0f921" ] ] } ], "barpolar": [ { "type": "barpolar", "marker": { "line": { "color": "#E5ECF6", "width": 0.5 }, "pattern": { "size": 10, "fillmode": "overlay", "solidity": 0.2 } } } ], "heatmapgl": [ { "type": "heatmapgl", "colorbar": { "ticks": "", "outlinewidth": 0 }, "colorscale": [ [ 0.0, "#0d0887" ], [ 0.1111111111111111, "#46039f" ], [ 0.2222222222222222, "#7201a8" ], [ 0.3333333333333333, "#9c179e" ], [ 0.4444444444444444, "#bd3786" ], [ 0.5555555555555556, "#d8576b" ], [ 0.6666666666666666, "#ed7953" ], [ 0.7777777777777778, "#fb9f3a" ], [ 0.8888888888888888, "#fdca26" ], [ 1.0, "#f0f921" ] ] } ], "histogram": [ { "type": "histogram", "marker": { "pattern": { "size": 10, "fillmode": "overlay", "solidity": 0.2 } } } ], "parcoords": [ { "line": { "colorbar": { "ticks": "", "outlinewidth": 0 } }, "type": "parcoords" } ], "scatter3d": [ { "line": { "colorbar": { "ticks": "", "outlinewidth": 0 } }, "type": "scatter3d", "marker": { "colorbar": { "ticks": "", "outlinewidth": 0 } } } ], "scattergl": [ { "type": "scattergl", "marker": { "colorbar": { "ticks": "", "outlinewidth": 0 } } } ], "choropleth": [ { "type": "choropleth", "colorbar": { "ticks": "", "outlinewidth": 0 } } ], "scattergeo": [ { "type": "scattergeo", "marker": { "colorbar": { "ticks": "", "outlinewidth": 0 } } } ], "histogram2d": [ { "type": "histogram2d", "colorbar": { "ticks": "", "outlinewidth": 0 }, "colorscale": [ [ 0.0, "#0d0887" ], [ 0.1111111111111111, "#46039f" ], [ 0.2222222222222222, "#7201a8" ], [ 0.3333333333333333, "#9c179e" ], [ 0.4444444444444444, "#bd3786" ], [ 0.5555555555555556, "#d8576b" ], [ 0.6666666666666666, "#ed7953" ], [ 0.7777777777777778, "#fb9f3a" ], [ 0.8888888888888888, "#fdca26" ], [ 1.0, "#f0f921" ] ] } ], "scatterpolar": [ { "type": "scatterpolar", "marker": { "colorbar": { "ticks": "", "outlinewidth": 0 } } } ], "contourcarpet": [ { "type": "contourcarpet", "colorbar": { "ticks": "", "outlinewidth": 0 } } ], "scattercarpet": [ { "type": "scattercarpet", "marker": { "colorbar": { "ticks": "", "outlinewidth": 0 } } } ], "scattermapbox": [ { "type": "scattermapbox", "marker": { "colorbar": { "ticks": "", "outlinewidth": 0 } } } ], "scatterpolargl": [ { "type": "scatterpolargl", "marker": { "colorbar": { "ticks": "", "outlinewidth": 0 } } } ], "scatterternary": [ { "type": "scatterternary", "marker": { "colorbar": { "ticks": "", "outlinewidth": 0 } } } ], "histogram2dcontour": [ { "type": "histogram2dcontour", "colorbar": { "ticks": "", "outlinewidth": 0 }, "colorscale": [ [ 0.0, "#0d0887" ], [ 0.1111111111111111, "#46039f" ], [ 0.2222222222222222, "#7201a8" ], [ 0.3333333333333333, "#9c179e" ], [ 0.4444444444444444, "#bd3786" ], [ 0.5555555555555556, "#d8576b" ], [ 0.6666666666666666, "#ed7953" ], [ 0.7777777777777778, "#fb9f3a" ], [ 0.8888888888888888, "#fdca26" ], [ 1.0, "#f0f921" ] ] } ] }, "layout": { "geo": { "bgcolor": "white", "showland": true, "lakecolor": "white", "landcolor": "#E5ECF6", "showlakes": true, "subunitcolor": "white" }, "font": { "color": "#2a3f5f" }, "polar": { "bgcolor": "#E5ECF6", "radialaxis": { "ticks": "", "gridcolor": "white", "linecolor": "white" }, "angularaxis": { "ticks": "", "gridcolor": "white", "linecolor": "white" } }, "scene": { "xaxis": { "ticks": "", "gridcolor": "white", "gridwidth": 2, "linecolor": "white", "zerolinecolor": "white", "showbackground": true, "backgroundcolor": "#E5ECF6" }, "yaxis": { "ticks": "", "gridcolor": "white", "gridwidth": 2, "linecolor": "white", "zerolinecolor": "white", "showbackground": true, "backgroundcolor": "#E5ECF6" }, "zaxis": { "ticks": "", "gridcolor": "white", "gridwidth": 2, "linecolor": "white", "zerolinecolor": "white", "showbackground": true, "backgroundcolor": "#E5ECF6" } }, "title": { "x": 0.05 }, "xaxis": { "ticks": "", "title": { "standoff": 15 }, "gridcolor": "white", "linecolor": "white", "automargin": true, "zerolinecolor": "white", "zerolinewidth": 2 }, "yaxis": { "ticks": "", "title": { "standoff": 15 }, "gridcolor": "white", "linecolor": "white", "automargin": true, "zerolinecolor": "white", "zerolinewidth": 2 }, "mapbox": { "style": "light" }, "ternary": { "aaxis": { "ticks": "", "gridcolor": "white", "linecolor": "white" }, "baxis": { "ticks": "", "gridcolor": "white", "linecolor": "white" }, "caxis": { "ticks": "", "gridcolor": "white", "linecolor": "white" }, "bgcolor": "#E5ECF6" }, "colorway": [ "#636efa", "#EF553B", "#00cc96", "#ab63fa", "#FFA15A", "#19d3f3", "#FF6692", "#B6E880", "#FF97FF", "#FECB52" ], "coloraxis": { "colorbar": { "ticks": "", "outlinewidth": 0 } }, "hovermode": "closest", "colorscale": { "diverging": [ [ 0, "#8e0152" ], [ 0.1, "#c51b7d" ], [ 0.2, "#de77ae" ], [ 0.3, "#f1b6da" ], [ 0.4, "#fde0ef" ], [ 0.5, "#f7f7f7" ], [ 0.6, "#e6f5d0" ], [ 0.7, "#b8e186" ], [ 0.8, "#7fbc41" ], [ 0.9, "#4d9221" ], [ 1, "#276419" ] ], "sequential": [ [ 0.0, "#0d0887" ], [ 0.1111111111111111, "#46039f" ], [ 0.2222222222222222, "#7201a8" ], [ 0.3333333333333333, "#9c179e" ], [ 0.4444444444444444, "#bd3786" ], [ 0.5555555555555556, "#d8576b" ], [ 0.6666666666666666, "#ed7953" ], [ 0.7777777777777778, "#fb9f3a" ], [ 0.8888888888888888, "#fdca26" ], [ 1.0, "#f0f921" ] ], "sequentialminus": [ [ 0.0, "#0d0887" ], [ 0.1111111111111111, "#46039f" ], [ 0.2222222222222222, "#7201a8" ], [ 0.3333333333333333, "#9c179e" ], [ 0.4444444444444444, "#bd3786" ], [ 0.5555555555555556, "#d8576b" ], [ 0.6666666666666666, "#ed7953" ], [ 0.7777777777777778, "#fb9f3a" ], [ 0.8888888888888888, "#fdca26" ], [ 1.0, "#f0f921" ] ] }, "hoverlabel": { "align": "left" }, "plot_bgcolor": "#E5ECF6", "paper_bgcolor": "white", "shapedefaults": { "line": { "color": "#2a3f5f" } }, "autotypenumbers": "strict", "annotationdefaults": { "arrowhead": 0, "arrowcolor": "#2a3f5f", "arrowwidth": 1 } } } } }, "height": null, "width": null, "user": { "profile_url": "https://chart-studio.plotly.com/~kateeab4", "avatar_url": "https://storage.googleapis.com/plotly-prod-profiles/87.jpg", "background_url": "https://storage.googleapis.com/plotly-prod-profiles/bg-0.jpg", "bio": "", "nickname": "", "website": "", "stream_tokens": null, "feature_set_id": null, "csrf_token": null, "date_joined": "2024-03-14 18:33:41", "mapbox_access_tokens": null, "has_password": null, "username": "kateeab4", "email": null, "is_active": null, "readonly": null, "is_dash_creator": null, "dash_created_count": null, "is_chart_creator": null, "charts_created_count": null } }, { "creation_time": "2024-03-21T00:30:55.769135Z", "comments": { "results": [], "count": 0 }, "parented": true, "embed_url": "https://chart-studio.plotly.com/~kateeab4/25.embed", "fid": "kateeab4:25", "filename": "sunburst0.41357770070126254", "filetype": "plot", "img_url": "https://storage.googleapis.com/plotly-prod-images/kateeab4/25/9_LAUQFL26P0A90UCSO0MOSM97L4IECO.png", "image_urls": { "default": "https://storage.googleapis.com/plotly-prod-images/kateeab4/25/2_N9LTLF7S164TGWDKAAGBZRKOB1W9B5.png", "block-thumb": "https://storage.googleapis.com/plotly-prod-images/kateeab4/25/8_3AZRT5M4JRNVT2UNZTAW6YD60N6FPL.png", "list-thumb": "https://storage.googleapis.com/plotly-prod-images/kateeab4/25/9_LAUQFL26P0A90UCSO0MOSM97L4IECO.png" }, "api_urls": { "files": "https://api.plotly.com/v2/files/kateeab4:25", "plots": "https://api.plotly.com/v2/plots/kateeab4:25", "parent": "https://api.plotly.com/v2/folders/home?user=kateeab4" }, "owner": "kateeab4", "parent": -1, "preview": "", "referencers": [], "references": [], "title": "", "views": 2, "web_url": "https://chart-studio.plotly.com/~kateeab4/25/", "world_readable": true, "date_modified": "2024-03-21T00:30:55.780Z", "stars": { "results": [], "count": 0 }, "collaborators": { "results": [], "count": 0 }, "subfolder_count": null, "refresh_interval": null, "organize_view_url": "https://chart-studio.plotly.com/~kateeab4/25/", "current_user_permission": "read", "is_theme": null, "is_template": null, "autosize": true, "caption": "", "figure": { "data": [ { "name": "", "type": "sunburst", "domain": { "x": [ 0.0, 1.0 ], "y": [ 0.0, 1.0 ] }, "idssrc": "kateeab4:24:d280e9", "marker": { "coloraxis": "coloraxis", "colorssrc": "kateeab4:24:3b1e60" }, "labelssrc": "kateeab4:24:581be5", "valuessrc": "kateeab4:24:6ebdbb", "parentssrc": "kateeab4:24:b6db31", "branchvalues": "total", "customdatasrc": "kateeab4:24:8805d3", "hovertemplate": "labels=%{label}<br>count=%{value}<br>parent=%{parent}<br>id=%{id}<br>TRAF7FL/TRAF7Cterm Log2FC=%{color}<extra></extra>" } ], "layout": { "title": { "text": "AP-MS of Proteins with TRAF7" }, "legend": { "tracegroupgap": 0 }, "margin": { "t": 60 }, "template": { "data": { "bar": [ { "type": "bar", "marker": { "line": { "color": "#E5ECF6", "width": 0.5 }, "pattern": { "size": 10, "fillmode": "overlay", "solidity": 0.2 } }, "error_x": { "color": "#2a3f5f" }, "error_y": { "color": "#2a3f5f" } } ], "pie": [ { "type": "pie", "automargin": true } ], "table": [ { "type": "table", "cells": { "fill": { "color": "#EBF0F8" }, "line": { "color": "white" } }, "header": { "fill": { "color": "#C8D4E3" }, "line": { "color": "white" } } } ], "carpet": [ { "type": "carpet", "aaxis": { "gridcolor": "white", "linecolor": "white", "endlinecolor": "#2a3f5f", "minorgridcolor": "white", "startlinecolor": "#2a3f5f" }, "baxis": { "gridcolor": "white", "linecolor": "white", "endlinecolor": "#2a3f5f", "minorgridcolor": "white", "startlinecolor": "#2a3f5f" } } ], "mesh3d": [ { "type": "mesh3d", "colorbar": { "ticks": "", "outlinewidth": 0 } } ], "contour": [ { "type": "contour", "colorbar": { "ticks": "", "outlinewidth": 0 }, "colorscale": [ [ 0.0, "#0d0887" ], [ 0.1111111111111111, "#46039f" ], [ 0.2222222222222222, "#7201a8" ], [ 0.3333333333333333, "#9c179e" ], [ 0.4444444444444444, "#bd3786" ], [ 0.5555555555555556, "#d8576b" ], [ 0.6666666666666666, "#ed7953" ], [ 0.7777777777777778, "#fb9f3a" ], [ 0.8888888888888888, "#fdca26" ], [ 1.0, "#f0f921" ] ] } ], "heatmap": [ { "type": "heatmap", "colorbar": { "ticks": "", "outlinewidth": 0 }, "colorscale": [ [ 0.0, "#0d0887" ], [ 0.1111111111111111, "#46039f" ], [ 0.2222222222222222, "#7201a8" ], [ 0.3333333333333333, "#9c179e" ], [ 0.4444444444444444, "#bd3786" ], [ 0.5555555555555556, "#d8576b" ], [ 0.6666666666666666, "#ed7953" ], [ 0.7777777777777778, "#fb9f3a" ], [ 0.8888888888888888, "#fdca26" ], [ 1.0, "#f0f921" ] ] } ], "scatter": [ { "type": "scatter", "fillpattern": { "size": 10, "fillmode": "overlay", "solidity": 0.2 } } ], "surface": [ { "type": "surface", "colorbar": { "ticks": "", "outlinewidth": 0 }, "colorscale": [ [ 0.0, "#0d0887" ], [ 0.1111111111111111, "#46039f" ], [ 0.2222222222222222, "#7201a8" ], [ 0.3333333333333333, "#9c179e" ], [ 0.4444444444444444, "#bd3786" ], [ 0.5555555555555556, "#d8576b" ], [ 0.6666666666666666, "#ed7953" ], [ 0.7777777777777778, "#fb9f3a" ], [ 0.8888888888888888, "#fdca26" ], [ 1.0, "#f0f921" ] ] } ], "barpolar": [ { "type": "barpolar", "marker": { "line": { "color": "#E5ECF6", "width": 0.5 }, "pattern": { "size": 10, "fillmode": "overlay", "solidity": 0.2 } } } ], "heatmapgl": [ { "type": "heatmapgl", "colorbar": { "ticks": "", "outlinewidth": 0 }, "colorscale": [ [ 0.0, "#0d0887" ], [ 0.1111111111111111, "#46039f" ], [ 0.2222222222222222, "#7201a8" ], [ 0.3333333333333333, "#9c179e" ], [ 0.4444444444444444, "#bd3786" ], [ 0.5555555555555556, "#d8576b" ], [ 0.6666666666666666, "#ed7953" ], [ 0.7777777777777778, "#fb9f3a" ], [ 0.8888888888888888, "#fdca26" ], [ 1.0, "#f0f921" ] ] } ], "histogram": [ { "type": "histogram", "marker": { "pattern": { "size": 10, "fillmode": "overlay", "solidity": 0.2 } } } ], "parcoords": [ { "line": { "colorbar": { "ticks": "", "outlinewidth": 0 } }, "type": "parcoords" } ], "scatter3d": [ { "line": { "colorbar": { "ticks": "", "outlinewidth": 0 } }, "type": "scatter3d", "marker": { "colorbar": { "ticks": "", "outlinewidth": 0 } } } ], "scattergl": [ { "type": "scattergl", "marker": { "colorbar": { "ticks": "", "outlinewidth": 0 } } } ], "choropleth": [ { "type": "choropleth", "colorbar": { "ticks": "", "outlinewidth": 0 } } ], "scattergeo": [ { "type": "scattergeo", "marker": { "colorbar": { "ticks": "", "outlinewidth": 0 } } } ], "histogram2d": [ { "type": "histogram2d", "colorbar": { "ticks": "", "outlinewidth": 0 }, "colorscale": [ [ 0.0, "#0d0887" ], [ 0.1111111111111111, "#46039f" ], [ 0.2222222222222222, "#7201a8" ], [ 0.3333333333333333, "#9c179e" ], [ 0.4444444444444444, "#bd3786" ], [ 0.5555555555555556, "#d8576b" ], [ 0.6666666666666666, "#ed7953" ], [ 0.7777777777777778, "#fb9f3a" ], [ 0.8888888888888888, "#fdca26" ], [ 1.0, "#f0f921" ] ] } ], "scatterpolar": [ { "type": "scatterpolar", "marker": { "colorbar": { "ticks": "", "outlinewidth": 0 } } } ], "contourcarpet": [ { "type": "contourcarpet", "colorbar": { "ticks": "", "outlinewidth": 0 } } ], "scattercarpet": [ { "type": "scattercarpet", "marker": { "colorbar": { "ticks": "", "outlinewidth": 0 } } } ], "scattermapbox": [ { "type": "scattermapbox", "marker": { "colorbar": { "ticks": "", "outlinewidth": 0 } } } ], "scatterpolargl": [ { "type": "scatterpolargl", "marker": { "colorbar": { "ticks": "", "outlinewidth": 0 } } } ], "scatterternary": [ { "type": "scatterternary", "marker": { "colorbar": { "ticks": "", "outlinewidth": 0 } } } ], "histogram2dcontour": [ { "type": "histogram2dcontour", "colorbar": { "ticks": "", "outlinewidth": 0 }, "colorscale": [ [ 0.0, "#0d0887" ], [ 0.1111111111111111, "#46039f" ], [ 0.2222222222222222, "#7201a8" ], [ 0.3333333333333333, "#9c179e" ], [ 0.4444444444444444, "#bd3786" ], [ 0.5555555555555556, "#d8576b" ], [ 0.6666666666666666, "#ed7953" ], [ 0.7777777777777778, "#fb9f3a" ], [ 0.8888888888888888, "#fdca26" ], [ 1.0, "#f0f921" ] ] } ] }, "layout": { "geo": { "bgcolor": "white", "showland": true, "lakecolor": "white", "landcolor": "#E5ECF6", "showlakes": true, "subunitcolor": "white" }, "font": { "color": "#2a3f5f" }, "polar": { "bgcolor": "#E5ECF6", "radialaxis": { "ticks": "", "gridcolor": "white", "linecolor": "white" }, "angularaxis": { "ticks": "", "gridcolor": "white", "linecolor": "white" } }, "scene": { "xaxis": { "ticks": "", "gridcolor": "white", "gridwidth": 2, "linecolor": "white", "zerolinecolor": "white", "showbackground": true, "backgroundcolor": "#E5ECF6" }, "yaxis": { "ticks": "", "gridcolor": "white", "gridwidth": 2, "linecolor": "white", "zerolinecolor": "white", "showbackground": true, "backgroundcolor": "#E5ECF6" }, "zaxis": { "ticks": "", "gridcolor": "white", "gridwidth": 2, "linecolor": "white", "zerolinecolor": "white", "showbackground": true, "backgroundcolor": "#E5ECF6" } }, "title": { "x": 0.05 }, "xaxis": { "ticks": "", "title": { "standoff": 15 }, "gridcolor": "white", "linecolor": "white", "automargin": true, "zerolinecolor": "white", "zerolinewidth": 2 }, "yaxis": { "ticks": "", "title": { "standoff": 15 }, "gridcolor": "white", "linecolor": "white", "automargin": true, "zerolinecolor": "white", "zerolinewidth": 2 }, "mapbox": { "style": "light" }, "ternary": { "aaxis": { "ticks": "", "gridcolor": "white", "linecolor": "white" }, "baxis": { "ticks": "", "gridcolor": "white", "linecolor": "white" }, "caxis": { "ticks": "", "gridcolor": "white", "linecolor": "white" }, "bgcolor": "#E5ECF6" }, "colorway": [ "#636efa", "#EF553B", "#00cc96", "#ab63fa", "#FFA15A", "#19d3f3", "#FF6692", "#B6E880", "#FF97FF", "#FECB52" ], "coloraxis": { "colorbar": { "ticks": "", "outlinewidth": 0 } }, "hovermode": "closest", "colorscale": { "diverging": [ [ 0, "#8e0152" ], [ 0.1, "#c51b7d" ], [ 0.2, "#de77ae" ], [ 0.3, "#f1b6da" ], [ 0.4, "#fde0ef" ], [ 0.5, "#f7f7f7" ], [ 0.6, "#e6f5d0" ], [ 0.7, "#b8e186" ], [ 0.8, "#7fbc41" ], [ 0.9, "#4d9221" ], [ 1, "#276419" ] ], "sequential": [ [ 0.0, "#0d0887" ], [ 0.1111111111111111, "#46039f" ], [ 0.2222222222222222, "#7201a8" ], [ 0.3333333333333333, "#9c179e" ], [ 0.4444444444444444, "#bd3786" ], [ 0.5555555555555556, "#d8576b" ], [ 0.6666666666666666, "#ed7953" ], [ 0.7777777777777778, "#fb9f3a" ], [ 0.8888888888888888, "#fdca26" ], [ 1.0, "#f0f921" ] ], "sequentialminus": [ [ 0.0, "#0d0887" ], [ 0.1111111111111111, "#46039f" ], [ 0.2222222222222222, "#7201a8" ], [ 0.3333333333333333, "#9c179e" ], [ 0.4444444444444444, "#bd3786" ], [ 0.5555555555555556, "#d8576b" ], [ 0.6666666666666666, "#ed7953" ], [ 0.7777777777777778, "#fb9f3a" ], [ 0.8888888888888888, "#fdca26" ], [ 1.0, "#f0f921" ] ] }, "hoverlabel": { "align": "left" }, "plot_bgcolor": "#E5ECF6", "paper_bgcolor": "white", "shapedefaults": { "line": { "color": "#2a3f5f" } }, "autotypenumbers": "strict", "annotationdefaults": { "arrowhead": 0, "arrowcolor": "#2a3f5f", "arrowwidth": 1 } } }, "coloraxis": { "colorbar": { "title": { "text": "TRAF7FL/TRAF7Cterm Log2FC" } }, "colorscale": [ [ 0.0, "#0d0887" ], [ 0.1111111111111111, "#46039f" ], [ 0.2222222222222222, "#7201a8" ], [ 0.3333333333333333, "#9c179e" ], [ 0.4444444444444444, "#bd3786" ], [ 0.5555555555555556, "#d8576b" ], [ 0.6666666666666666, "#ed7953" ], [ 0.7777777777777778, "#fb9f3a" ], [ 0.8888888888888888, "#fdca26" ], [ 1.0, "#f0f921" ] ] } } }, "height": null, "width": null, "user": { "profile_url": "https://chart-studio.plotly.com/~kateeab4", "avatar_url": "https://storage.googleapis.com/plotly-prod-profiles/87.jpg", "background_url": "https://storage.googleapis.com/plotly-prod-profiles/bg-0.jpg", "bio": "", "nickname": "", "website": "", "stream_tokens": null, "feature_set_id": null, "csrf_token": null, "date_joined": "2024-03-14 18:33:41", "mapbox_access_tokens": null, "has_password": null, "username": "kateeab4", "email": null, "is_active": null, "readonly": null, "is_dash_creator": null, "dash_created_count": null, "is_chart_creator": null, "charts_created_count": null } }, { "creation_time": "2024-03-21T00:28:29.634414Z", "comments": { "results": [], "count": 0 }, "parented": true, "embed_url": "https://chart-studio.plotly.com/~Amsale/110.embed", "fid": "Amsale:110", "filename": "Plot 110", "filetype": "plot", "img_url": "https://storage.googleapis.com/plotly-prod-images/Amsale/110/9_YKTDPZSQL3K3IO6UJY7I28APJ5CSIX.png", "image_urls": { "default": "https://storage.googleapis.com/plotly-prod-images/Amsale/110/2_W1B3Y64N7SI3K6NO0KDDL5H3U7PEMX.png", "block-thumb": "https://storage.googleapis.com/plotly-prod-images/Amsale/110/8_Y51HEN8LQKUZTZ6289CX7AFABBTSRL.png", "list-thumb": "https://storage.googleapis.com/plotly-prod-images/Amsale/110/9_YKTDPZSQL3K3IO6UJY7I28APJ5CSIX.png" }, "api_urls": { "files": "https://api.plotly.com/v2/files/Amsale:110", "plots": "https://api.plotly.com/v2/plots/Amsale:110", "parent": "https://api.plotly.com/v2/folders/home?user=Amsale" }, "owner": "Amsale", "parent": -1, "preview": "", "referencers": [], "references": [], "title": "", "views": 1, "web_url": "https://chart-studio.plotly.com/~Amsale/110/", "world_readable": true, "date_modified": "2024-03-21T00:28:29.649Z", "stars": { "results": [], "count": 0 }, "collaborators": { "results": [], "count": 0 }, "subfolder_count": null, "refresh_interval": null, "organize_view_url": "https://chart-studio.plotly.com/~Amsale/110/", "current_user_permission": "read", "is_theme": null, "is_template": false, "autosize": false, "caption": "", "figure": { "data": [ { "hole": 0, "meta": { "columnNames": { "text": "B", "labels": "A", "values": "B", "textposition": "" } }, "mode": "markers", "pull": 0, "type": "pie", "opacity": 1, "textsrc": "Amsale:109:bbd7cd", "rotation": -43, "textfont": { "size": 20, "color": "rgb(1, 7, 18)", "family": "Times New Roman" }, "textinfo": "percent", "direction": "counterclockwise", "hoverinfo": "none", "labelssrc": "Amsale:109:de8a45", "valuessrc": "Amsale:109:bbd7cd", "textposition": "middle center", "texttemplate": "" } ], "frames": [], "layout": { "font": { "size": 12 }, "title": { "font": { "size": 24 }, "text": "<br>" }, "width": 1016.8800000000001, "xaxis": { "range": [ -1, 6 ], "autorange": true }, "yaxis": { "range": [ -1, 4 ], "autorange": true }, "height": 592.99, "legend": { "x": 1.06, "y": 0.96, "font": { "size": 22, "color": "rgb(1, 7, 18)", "family": "Times New Roman" } }, "margin": { "b": 80, "l": 80, "r": 80, "t": 100, "pad": 0 }, "autosize": false, "colorway": [ "#b3e2cd", "#fdcdac", "#cbd5e8", "#f4cae4", "#e6f5c9", "#fff2ae", "#f1e2cc", "#cccccc" ], "template": { "data": { "bar": [ { "type": "bar", "marker": { "colorbar": { "ticks": "", "outlinewidth": 0 } } } ], "table": [ { "type": "table", "cells": { "fill": { "color": "#EBF0F8" }, "line": { "color": "white" } }, "header": { "fill": { "color": "#C8D4E3" }, "line": { "color": "white" } } } ], "carpet": [ { "type": "carpet", "aaxis": { "gridcolor": "#C8D4E3", "linecolor": "#C8D4E3", "endlinecolor": "#2a3f5f", "minorgridcolor": "#C8D4E3", "startlinecolor": "#2a3f5f" }, "baxis": { "gridcolor": "#C8D4E3", "linecolor": "#C8D4E3", "endlinecolor": "#2a3f5f", "minorgridcolor": "#C8D4E3", "startlinecolor": "#2a3f5f" } } ], "mesh3d": [ { "type": "mesh3d", "colorbar": { "ticks": "", "outlinewidth": 0 } } ], "contour": [ { "type": "contour", "colorbar": { "ticks": "", "outlinewidth": 0 }, "autocolorscale": true } ], "heatmap": [ { "type": "heatmap", "colorbar": { "ticks": "", "outlinewidth": 0 }, "autocolorscale": true } ], "scatter": [ { "type": "scatter", "marker": { "colorbar": { "ticks": "", "outlinewidth": 0 } } } ], "surface": [ { "type": "surface", "colorbar": { "ticks": "", "outlinewidth": 0 } } ], "heatmapgl": [ { "type": "heatmapgl", "colorbar": { "ticks": "", "outlinewidth": 0 } } ], "histogram": [ { "type": "histogram", "marker": { "colorbar": { "ticks": "", "outlinewidth": 0 } } } ], "parcoords": [ { "line": { "colorbar": { "ticks": "", "outlinewidth": 0 } }, "type": "parcoords" } ], "scatter3d": [ { "type": "scatter3d", "marker": { "colorbar": { "ticks": "", "outlinewidth": 0 } } } ], "scattergl": [ { "type": "scattergl", "marker": { "colorbar": { "ticks": "", "outlinewidth": 0 } } } ], "choropleth": [ { "type": "choropleth", "colorbar": { "ticks": "", "outlinewidth": 0 } } ], "scattergeo": [ { "type": "scattergeo", "marker": { "colorbar": { "ticks": "", "outlinewidth": 0 } } } ], "histogram2d": [ { "type": "histogram2d", "colorbar": { "ticks": "", "outlinewidth": 0 }, "autocolorscale": true } ], "scatterpolar": [ { "type": "scatterpolar", "marker": { "colorbar": { "ticks": "", "outlinewidth": 0 } } } ], "contourcarpet": [ { "type": "contourcarpet", "colorbar": { "ticks": "", "outlinewidth": 0 } } ], "scattercarpet": [ { "type": "scattercarpet", "marker": { "colorbar": { "ticks": "", "outlinewidth": 0 } } } ], "scattermapbox": [ { "type": "scattermapbox", "marker": { "colorbar": { "ticks": "", "outlinewidth": 0 } } } ], "scatterpolargl": [ { "type": "scatterpolargl", "marker": { "colorbar": { "ticks": "", "outlinewidth": 0 } } } ], "scatterternary": [ { "type": "scatterternary", "marker": { "colorbar": { "ticks": "", "outlinewidth": 0 } } } ], "histogram2dcontour": [ { "type": "histogram2dcontour", "colorbar": { "ticks": "", "outlinewidth": 0 }, "autocolorscale": true } ] }, "layout": { "geo": { "bgcolor": "white", "showland": true, "lakecolor": "white", "landcolor": "white", "showlakes": true, "subunitcolor": "#C8D4E3" }, "font": { "color": "#2a3f5f" }, "polar": { "bgcolor": "white", "radialaxis": { "ticks": "", "gridcolor": "#EBF0F8", "linecolor": "#EBF0F8" }, "angularaxis": { "ticks": "", "gridcolor": "#EBF0F8", "linecolor": "#EBF0F8" } }, "scene": { "xaxis": { "ticks": "", "gridcolor": "#DFE8F3", "gridwidth": 2, "linecolor": "#EBF0F8", "zerolinecolor": "#EBF0F8", "showbackground": true, "backgroundcolor": "white" }, "yaxis": { "ticks": "", "gridcolor": "#DFE8F3", "gridwidth": 2, "linecolor": "#EBF0F8", "zerolinecolor": "#EBF0F8", "showbackground": true, "backgroundcolor": "white" }, "zaxis": { "ticks": "", "gridcolor": "#DFE8F3", "gridwidth": 2, "linecolor": "#EBF0F8", "zerolinecolor": "#EBF0F8", "showbackground": true, "backgroundcolor": "white" } }, "title": { "x": 0.05 }, "xaxis": { "ticks": "", "gridcolor": "#EBF0F8", "linecolor": "#EBF0F8", "automargin": true, "zerolinecolor": "#EBF0F8", "zerolinewidth": 2 }, "yaxis": { "ticks": "", "gridcolor": "#EBF0F8", "linecolor": "#EBF0F8", "automargin": true, "zerolinecolor": "#EBF0F8", "zerolinewidth": 2 }, "ternary": { "aaxis": { "ticks": "", "gridcolor": "#DFE8F3", "linecolor": "#A2B1C6" }, "baxis": { "ticks": "", "gridcolor": "#DFE8F3", "linecolor": "#A2B1C6" }, "caxis": { "ticks": "", "gridcolor": "#DFE8F3", "linecolor": "#A2B1C6" }, "bgcolor": "white" }, "colorway": [ "#636efa", "#EF553B", "#00cc96", "#ab63fa", "#19d3f3", "#e763fa", "#fecb52", "#ffa15a", "#ff6692", "#b6e880" ], "hovermode": "closest", "colorscale": { "diverging": [ [ 0, "#8e0152" ], [ 0.1, "#c51b7d" ], [ 0.2, "#de77ae" ], [ 0.3, "#f1b6da" ], [ 0.4, "#fde0ef" ], [ 0.5, "#f7f7f7" ], [ 0.6, "#e6f5d0" ], [ 0.7, "#b8e186" ], [ 0.8, "#7fbc41" ], [ 0.9, "#4d9221" ], [ 1, "#276419" ] ], "sequential": [ [ 0, "#0508b8" ], [ 0.0893854748603352, "#1910d8" ], [ 0.1787709497206704, "#3c19f0" ], [ 0.2681564245810056, "#6b1cfb" ], [ 0.3575418994413408, "#981cfd" ], [ 0.44692737430167595, "#bf1cfd" ], [ 0.5363128491620112, "#dd2bfd" ], [ 0.6256983240223464, "#f246fe" ], [ 0.7150837988826816, "#fc67fd" ], [ 0.8044692737430168, "#fe88fc" ], [ 0.8938547486033519, "#fea5fd" ], [ 0.9832402234636871, "#febefe" ], [ 1, "#fec3fe" ] ], "sequentialminus": [ [ 0, "#0508b8" ], [ 0.0893854748603352, "#1910d8" ], [ 0.1787709497206704, "#3c19f0" ], [ 0.2681564245810056, "#6b1cfb" ], [ 0.3575418994413408, "#981cfd" ], [ 0.44692737430167595, "#bf1cfd" ], [ 0.5363128491620112, "#dd2bfd" ], [ 0.6256983240223464, "#f246fe" ], [ 0.7150837988826816, "#fc67fd" ], [ 0.8044692737430168, "#fe88fc" ], [ 0.8938547486033519, "#fea5fd" ], [ 0.9832402234636871, "#febefe" ], [ 1, "#fec3fe" ] ] }, "plot_bgcolor": "white", "paper_bgcolor": "white", "shapedefaults": { "line": { "width": 0 }, "opacity": 0.4, "fillcolor": "#506784" }, "annotationdefaults": { "arrowhead": 0, "arrowcolor": "#506784", "arrowwidth": 1 } }, "themeRef": "PLOTLY_WHITE" }, "colorscale": { "sequential": [ [ 0, "#440154" ], [ 0.1111111111111111, "#482878" ], [ 0.2222222222222222, "#3e4989" ], [ 0.3333333333333333, "#31688e" ], [ 0.4444444444444444, "#26828e" ], [ 0.5555555555555556, "#1f9e89" ], [ 0.6666666666666666, "#35b779" ], [ 0.7777777777777778, "#6ece58" ], [ 0.8888888888888888, "#b5de2b" ], [ 1, "#fde725" ] ] }, "piecolorway": [ "#4c78a8", "#f58518", "#e45756", "#72b7b2", "#54a24b", "#eeca3b", "#b279a2", "#ff9da6", "#9d755d", "#bab0ac" ], "hiddenlabels": [ "Aldolase-type TIM barrel" ], "extendpiecolors": true } }, "height": 592, "width": 1016, "user": { "profile_url": "https://chart-studio.plotly.com/~Amsale", "avatar_url": "https://storage.googleapis.com/plotly-prod-profiles/7.jpg", "background_url": "https://storage.googleapis.com/plotly-prod-profiles/bg-8.jpg", "bio": "", "nickname": "", "website": "", "stream_tokens": null, "feature_set_id": null, "csrf_token": null, "date_joined": "2023-03-10 17:24:16", "mapbox_access_tokens": null, "has_password": null, "username": "Amsale", "email": null, "is_active": null, "readonly": null, "is_dash_creator": null, "dash_created_count": null, "is_chart_creator": null, "charts_created_count": null } }, { "creation_time": "2024-03-21T00:25:20.563830Z", "comments": { "results": [], "count": 0 }, "parented": true, "embed_url": "https://chart-studio.plotly.com/~kateeab4/22.embed", "fid": "kateeab4:22", "filename": "volcano 10.7638587822182806", "filetype": "plot", "img_url": "https://storage.googleapis.com/plotly-prod-images/kateeab4/22/9_WZCBQHG08VPVHTKLFAQNG4PL3B10E8.png", "image_urls": { "default": "https://storage.googleapis.com/plotly-prod-images/kateeab4/22/2_H6MU304QKFJJ1T75MLZ8JCJQ6XW79W.png", "block-thumb": "https://storage.googleapis.com/plotly-prod-images/kateeab4/22/8_YHJN8LVFLY4TGI3Q4JB5R6ZLD8IGVU.png", "list-thumb": "https://storage.googleapis.com/plotly-prod-images/kateeab4/22/9_WZCBQHG08VPVHTKLFAQNG4PL3B10E8.png" }, "api_urls": { "files": "https://api.plotly.com/v2/files/kateeab4:22", "plots": "https://api.plotly.com/v2/plots/kateeab4:22", "parent": "https://api.plotly.com/v2/folders/home?user=kateeab4" }, "owner": "kateeab4", "parent": -1, "preview": "", "referencers": [], "references": [], "title": "", "views": 2, "web_url": "https://chart-studio.plotly.com/~kateeab4/22/", "world_readable": true, "date_modified": "2024-03-21T00:25:20.576Z", "stars": { "results": [], "count": 0 }, "collaborators": { "results": [], "count": 0 }, "subfolder_count": null, "refresh_interval": null, "organize_view_url": "https://chart-studio.plotly.com/~kateeab4/22/", "current_user_permission": "read", "is_theme": null, "is_template": null, "autosize": true, "caption": "", "figure": { "data": [ { "mode": "markers", "name": "No change", "type": "scattergl", "xsrc": "kateeab4:21:9b8d26", "ysrc": "kateeab4:21:c2d153", "xaxis": "x", "yaxis": "y", "marker": { "color": "#636efa", "symbol": "circle" }, "showlegend": true, "legendgroup": "No change", "hovertextsrc": "kateeab4:21:4b2999", "customdatasrc": "kateeab4:21:75adf0", "hovertemplate": "<b>%{hovertext}</b><br><br>Intrxn=No change<br>TRAF7FL/TRAF7Cterm Log2FC=%{x}<br>TRAF7FL/TRAF7Cterm Log2FC -log10(p value)=%{y}<br>TRAF7FL/TRAF7Cterm pvalue=%{customdata[0]}<br>WDFL/WDCterm Log2FC=%{customdata[1]}<br>WDFL/WDCterm pvalue=%{customdata[2]}<extra></extra>" }, { "mode": "markers", "name": "Disrupted", "type": "scattergl", "xsrc": "kateeab4:21:2ab609", "ysrc": "kateeab4:21:8b4983", "xaxis": "x", "yaxis": "y", "marker": { "color": "#EF553B", "symbol": "circle" }, "showlegend": true, "legendgroup": "Disrupted", "hovertextsrc": "kateeab4:21:8c0af3", "customdatasrc": "kateeab4:21:9f06ee", "hovertemplate": "<b>%{hovertext}</b><br><br>Intrxn=Disrupted<br>TRAF7FL/TRAF7Cterm Log2FC=%{x}<br>TRAF7FL/TRAF7Cterm Log2FC -log10(p value)=%{y}<br>TRAF7FL/TRAF7Cterm pvalue=%{customdata[0]}<br>WDFL/WDCterm Log2FC=%{customdata[1]}<br>WDFL/WDCterm pvalue=%{customdata[2]}<extra></extra>" }, { "mode": "markers", "name": "Enhanced in TRAF7 WD40, Disrupted in FL TRAF7", "type": "scattergl", "xsrc": "kateeab4:21:a37d0a", "ysrc": "kateeab4:21:723479", "xaxis": "x", "yaxis": "y", "marker": { "color": "#00cc96", "symbol": "circle" }, "showlegend": true, "legendgroup": "Enhanced in TRAF7 WD40, Disrupted in FL TRAF7", "hovertextsrc": "kateeab4:21:1aa742", "customdatasrc": "kateeab4:21:64dbfe", "hovertemplate": "<b>%{hovertext}</b><br><br>Intrxn=Enhanced in TRAF7 WD40, Disrupted in FL TRAF7<br>TRAF7FL/TRAF7Cterm Log2FC=%{x}<br>TRAF7FL/TRAF7Cterm Log2FC -log10(p value)=%{y}<br>TRAF7FL/TRAF7Cterm pvalue=%{customdata[0]}<br>WDFL/WDCterm Log2FC=%{customdata[1]}<br>WDFL/WDCterm pvalue=%{customdata[2]}<extra></extra>" }, { "mode": "markers", "name": "Disrupted in FL TRAF7", "type": "scattergl", "xsrc": "kateeab4:21:c8c45f", "ysrc": "kateeab4:21:c58f58", "xaxis": "x", "yaxis": "y", "marker": { "color": "#ab63fa", "symbol": "circle" }, "showlegend": true, "legendgroup": "Disrupted in FL TRAF7", "hovertextsrc": "kateeab4:21:30547e", "customdatasrc": "kateeab4:21:256c1e", "hovertemplate": "<b>%{hovertext}</b><br><br>Intrxn=Disrupted in FL TRAF7<br>TRAF7FL/TRAF7Cterm Log2FC=%{x}<br>TRAF7FL/TRAF7Cterm Log2FC -log10(p value)=%{y}<br>TRAF7FL/TRAF7Cterm pvalue=%{customdata[0]}<br>WDFL/WDCterm Log2FC=%{customdata[1]}<br>WDFL/WDCterm pvalue=%{customdata[2]}<extra></extra>" }, { "mode": "markers", "name": "Enhanced in TRAF7 WD40, no data in FL TRAF7", "type": "scattergl", "xsrc": "kateeab4:21:51f99b", "ysrc": "kateeab4:21:0b9443", "xaxis": "x", "yaxis": "y", "marker": { "color": "#FFA15A", "symbol": "circle" }, "showlegend": true, "legendgroup": "Enhanced in TRAF7 WD40, no data in FL TRAF7", "hovertextsrc": "kateeab4:21:d6480d", "customdatasrc": "kateeab4:21:298b0e", "hovertemplate": "<b>%{hovertext}</b><br><br>Intrxn=Enhanced in TRAF7 WD40, no data in FL TRAF7<br>TRAF7FL/TRAF7Cterm Log2FC=%{x}<br>TRAF7FL/TRAF7Cterm Log2FC -log10(p value)=%{y}<br>TRAF7FL/TRAF7Cterm pvalue=%{customdata[0]}<br>WDFL/WDCterm Log2FC=%{customdata[1]}<br>WDFL/WDCterm pvalue=%{customdata[2]}<extra></extra>" }, { "mode": "markers", "name": "Enhanced", "type": "scattergl", "xsrc": "kateeab4:21:cfbb52", "ysrc": "kateeab4:21:86b695", "xaxis": "x", "yaxis": "y", "marker": { "color": "#19d3f3", "symbol": "circle" }, "showlegend": true, "legendgroup": "Enhanced", "hovertextsrc": "kateeab4:21:252f0c", "customdatasrc": "kateeab4:21:387bc4", "hovertemplate": "<b>%{hovertext}</b><br><br>Intrxn=Enhanced<br>TRAF7FL/TRAF7Cterm Log2FC=%{x}<br>TRAF7FL/TRAF7Cterm Log2FC -log10(p value)=%{y}<br>TRAF7FL/TRAF7Cterm pvalue=%{customdata[0]}<br>WDFL/WDCterm Log2FC=%{customdata[1]}<br>WDFL/WDCterm pvalue=%{customdata[2]}<extra></extra>" }, { "mode": "markers", "name": "Enhanced in FL TRAF7, Disrupted in TRAF7 WD40", "type": "scattergl", "xsrc": "kateeab4:21:f5e3ff", "ysrc": "kateeab4:21:219136", "xaxis": "x", "yaxis": "y", "marker": { "color": "#FF6692", "symbol": "circle" }, "showlegend": true, "legendgroup": "Enhanced in FL TRAF7, Disrupted in TRAF7 WD40", "hovertextsrc": "kateeab4:21:9d1c17", "customdatasrc": "kateeab4:21:4f5ba4", "hovertemplate": "<b>%{hovertext}</b><br><br>Intrxn=Enhanced in FL TRAF7, Disrupted in TRAF7 WD40<br>TRAF7FL/TRAF7Cterm Log2FC=%{x}<br>TRAF7FL/TRAF7Cterm Log2FC -log10(p value)=%{y}<br>TRAF7FL/TRAF7Cterm pvalue=%{customdata[0]}<br>WDFL/WDCterm Log2FC=%{customdata[1]}<br>WDFL/WDCterm pvalue=%{customdata[2]}<extra></extra>" }, { "mode": "markers", "name": "Enhanced in FL TRAF7", "type": "scattergl", "xsrc": "kateeab4:21:a93fdc", "ysrc": "kateeab4:21:364bf8", "xaxis": "x", "yaxis": "y", "marker": { "color": "#B6E880", "symbol": "circle" }, "showlegend": true, "legendgroup": "Enhanced in FL TRAF7", "hovertextsrc": "kateeab4:21:ee7fd8", "customdatasrc": "kateeab4:21:fb202f", "hovertemplate": "<b>%{hovertext}</b><br><br>Intrxn=Enhanced in FL TRAF7<br>TRAF7FL/TRAF7Cterm Log2FC=%{x}<br>TRAF7FL/TRAF7Cterm Log2FC -log10(p value)=%{y}<br>TRAF7FL/TRAF7Cterm pvalue=%{customdata[0]}<br>WDFL/WDCterm Log2FC=%{customdata[1]}<br>WDFL/WDCterm pvalue=%{customdata[2]}<extra></extra>" }, { "mode": "markers", "name": "Disrupted in FL TRAF7, no data in TRAF7 WD40", "type": "scattergl", "xsrc": "kateeab4:21:6d83f7", "ysrc": "kateeab4:21:2730f9", "xaxis": "x", "yaxis": "y", "marker": { "color": "#FF97FF", "symbol": "circle" }, "showlegend": true, "legendgroup": "Disrupted in FL TRAF7, no data in TRAF7 WD40", "hovertextsrc": "kateeab4:21:94c3b0", "customdatasrc": "kateeab4:21:fcdeec", "hovertemplate": "<b>%{hovertext}</b><br><br>Intrxn=Disrupted in FL TRAF7, no data in TRAF7 WD40<br>TRAF7FL/TRAF7Cterm Log2FC=%{x}<br>TRAF7FL/TRAF7Cterm Log2FC -log10(p value)=%{y}<br>TRAF7FL/TRAF7Cterm pvalue=%{customdata[0]}<br>WDFL/WDCterm Log2FC=%{customdata[1]}<br>WDFL/WDCterm pvalue=%{customdata[2]}<extra></extra>" }, { "mode": "markers", "name": "Enhanced in TRAF7 WD40", "type": "scattergl", "xsrc": "kateeab4:21:226c2d", "ysrc": "kateeab4:21:3d8009", "xaxis": "x", "yaxis": "y", "marker": { "color": "#FECB52", "symbol": "circle" }, "showlegend": true, "legendgroup": "Enhanced in TRAF7 WD40", "hovertextsrc": "kateeab4:21:73a1b6", "customdatasrc": "kateeab4:21:020142", "hovertemplate": "<b>%{hovertext}</b><br><br>Intrxn=Enhanced in TRAF7 WD40<br>TRAF7FL/TRAF7Cterm Log2FC=%{x}<br>TRAF7FL/TRAF7Cterm Log2FC -log10(p value)=%{y}<br>TRAF7FL/TRAF7Cterm pvalue=%{customdata[0]}<br>WDFL/WDCterm Log2FC=%{customdata[1]}<br>WDFL/WDCterm pvalue=%{customdata[2]}<extra></extra>" }, { "mode": "markers", "name": "Disrupted in TRAF7 WD40, no data in FL TRAF7", "type": "scattergl", "xsrc": "kateeab4:21:5f7926", "ysrc": "kateeab4:21:115fec", "xaxis": "x", "yaxis": "y", "marker": { "color": "#636efa", "symbol": "circle" }, "showlegend": true, "legendgroup": "Disrupted in TRAF7 WD40, no data in FL TRAF7", "hovertextsrc": "kateeab4:21:50c1b1", "customdatasrc": "kateeab4:21:294c3a", "hovertemplate": "<b>%{hovertext}</b><br><br>Intrxn=Disrupted in TRAF7 WD40, no data in FL TRAF7<br>TRAF7FL/TRAF7Cterm Log2FC=%{x}<br>TRAF7FL/TRAF7Cterm Log2FC -log10(p value)=%{y}<br>TRAF7FL/TRAF7Cterm pvalue=%{customdata[0]}<br>WDFL/WDCterm Log2FC=%{customdata[1]}<br>WDFL/WDCterm pvalue=%{customdata[2]}<extra></extra>" }, { "mode": "markers", "name": "Disrupted in TRAF7 WD40", "type": "scattergl", "xsrc": "kateeab4:21:f4d13e", "ysrc": "kateeab4:21:084fd3", "xaxis": "x", "yaxis": "y", "marker": { "color": "#EF553B", "symbol": "circle" }, "showlegend": true, "legendgroup": "Disrupted in TRAF7 WD40", "hovertextsrc": "kateeab4:21:ce1527", "customdatasrc": "kateeab4:21:9db767", "hovertemplate": "<b>%{hovertext}</b><br><br>Intrxn=Disrupted in TRAF7 WD40<br>TRAF7FL/TRAF7Cterm Log2FC=%{x}<br>TRAF7FL/TRAF7Cterm Log2FC -log10(p value)=%{y}<br>TRAF7FL/TRAF7Cterm pvalue=%{customdata[0]}<br>WDFL/WDCterm Log2FC=%{customdata[1]}<br>WDFL/WDCterm pvalue=%{customdata[2]}<extra></extra>" }, { "mode": "markers", "name": "Enhanced in FL TRAF7, no data in TRAF7 WD40", "type": "scattergl", "xsrc": "kateeab4:21:316133", "ysrc": "kateeab4:21:73efcc", "xaxis": "x", "yaxis": "y", "marker": { "color": "#00cc96", "symbol": "circle" }, "showlegend": true, "legendgroup": "Enhanced in FL TRAF7, no data in TRAF7 WD40", "hovertextsrc": "kateeab4:21:2a4142", "customdatasrc": "kateeab4:21:f1314b", "hovertemplate": "<b>%{hovertext}</b><br><br>Intrxn=Enhanced in FL TRAF7, no data in TRAF7 WD40<br>TRAF7FL/TRAF7Cterm Log2FC=%{x}<br>TRAF7FL/TRAF7Cterm Log2FC -log10(p value)=%{y}<br>TRAF7FL/TRAF7Cterm pvalue=%{customdata[0]}<br>WDFL/WDCterm Log2FC=%{customdata[1]}<br>WDFL/WDCterm pvalue=%{customdata[2]}<extra></extra>" }, { "line": { "dash": "dot", "color": "black", "width": 1 }, "mode": "lines", "name": "p value = 0.05", "type": "scatter", "xsrc": "kateeab4:21:cc680d", "ysrc": "kateeab4:21:55f3d1", "opacity": 0.5 } ], "layout": { "title": { "text": "AP-MS of Proteins with TRAF7" }, "xaxis": { "title": { "text": "TRAF7FL/TRAF7Cterm Log2FC" }, "anchor": "y", "domain": [ 0.0, 1.0 ] }, "yaxis": { "title": { "text": "-log10(p val)" }, "anchor": "x", "domain": [ 0.0, 1.0 ] }, "legend": { "title": { "text": "Intrxn" }, "tracegroupgap": 0 }, "margin": { "t": 60 }, "template": { "data": { "bar": [ { "type": "bar", "marker": { "line": { "color": "#E5ECF6", "width": 0.5 }, "pattern": { "size": 10, "fillmode": "overlay", "solidity": 0.2 } }, "error_x": { "color": "#2a3f5f" }, "error_y": { "color": "#2a3f5f" } } ], "pie": [ { "type": "pie", "automargin": true } ], "table": [ { "type": "table", "cells": { "fill": { "color": "#EBF0F8" }, "line": { "color": "white" } }, "header": { "fill": { "color": "#C8D4E3" }, "line": { "color": "white" } } } ], "carpet": [ { "type": "carpet", "aaxis": { "gridcolor": "white", "linecolor": "white", "endlinecolor": "#2a3f5f", "minorgridcolor": "white", "startlinecolor": "#2a3f5f" }, "baxis": { "gridcolor": "white", "linecolor": "white", "endlinecolor": "#2a3f5f", "minorgridcolor": "white", "startlinecolor": "#2a3f5f" } } ], "mesh3d": [ { "type": "mesh3d", "colorbar": { "ticks": "", "outlinewidth": 0 } } ], "contour": [ { "type": "contour", "colorbar": { "ticks": "", "outlinewidth": 0 }, "colorscale": [ [ 0.0, "#0d0887" ], [ 0.1111111111111111, "#46039f" ], [ 0.2222222222222222, "#7201a8" ], [ 0.3333333333333333, "#9c179e" ], [ 0.4444444444444444, "#bd3786" ], [ 0.5555555555555556, "#d8576b" ], [ 0.6666666666666666, "#ed7953" ], [ 0.7777777777777778, "#fb9f3a" ], [ 0.8888888888888888, "#fdca26" ], [ 1.0, "#f0f921" ] ] } ], "heatmap": [ { "type": "heatmap", "colorbar": { "ticks": "", "outlinewidth": 0 }, "colorscale": [ [ 0.0, "#0d0887" ], [ 0.1111111111111111, "#46039f" ], [ 0.2222222222222222, "#7201a8" ], [ 0.3333333333333333, "#9c179e" ], [ 0.4444444444444444, "#bd3786" ], [ 0.5555555555555556, "#d8576b" ], [ 0.6666666666666666, "#ed7953" ], [ 0.7777777777777778, "#fb9f3a" ], [ 0.8888888888888888, "#fdca26" ], [ 1.0, "#f0f921" ] ] } ], "scatter": [ { "type": "scatter", "fillpattern": { "size": 10, "fillmode": "overlay", "solidity": 0.2 } } ], "surface": [ { "type": "surface", "colorbar": { "ticks": "", "outlinewidth": 0 }, "colorscale": [ [ 0.0, "#0d0887" ], [ 0.1111111111111111, "#46039f" ], [ 0.2222222222222222, "#7201a8" ], [ 0.3333333333333333, "#9c179e" ], [ 0.4444444444444444, "#bd3786" ], [ 0.5555555555555556, "#d8576b" ], [ 0.6666666666666666, "#ed7953" ], [ 0.7777777777777778, "#fb9f3a" ], [ 0.8888888888888888, "#fdca26" ], [ 1.0, "#f0f921" ] ] } ], "barpolar": [ { "type": "barpolar", "marker": { "line": { "color": "#E5ECF6", "width": 0.5 }, "pattern": { "size": 10, "fillmode": "overlay", "solidity": 0.2 } } } ], "heatmapgl": [ { "type": "heatmapgl", "colorbar": { "ticks": "", "outlinewidth": 0 }, "colorscale": [ [ 0.0, "#0d0887" ], [ 0.1111111111111111, "#46039f" ], [ 0.2222222222222222, "#7201a8" ], [ 0.3333333333333333, "#9c179e" ], [ 0.4444444444444444, "#bd3786" ], [ 0.5555555555555556, "#d8576b" ], [ 0.6666666666666666, "#ed7953" ], [ 0.7777777777777778, "#fb9f3a" ], [ 0.8888888888888888, "#fdca26" ], [ 1.0, "#f0f921" ] ] } ], "histogram": [ { "type": "histogram", "marker": { "pattern": { "size": 10, "fillmode": "overlay", "solidity": 0.2 } } } ], "parcoords": [ { "line": { "colorbar": { "ticks": "", "outlinewidth": 0 } }, "type": "parcoords" } ], "scatter3d": [ { "line": { "colorbar": { "ticks": "", "outlinewidth": 0 } }, "type": "scatter3d", "marker": { "colorbar": { "ticks": "", "outlinewidth": 0 } } } ], "scattergl": [ { "type": "scattergl", "marker": { "colorbar": { "ticks": "", "outlinewidth": 0 } } } ], "choropleth": [ { "type": "choropleth", "colorbar": { "ticks": "", "outlinewidth": 0 } } ], "scattergeo": [ { "type": "scattergeo", "marker": { "colorbar": { "ticks": "", "outlinewidth": 0 } } } ], "histogram2d": [ { "type": "histogram2d", "colorbar": { "ticks": "", "outlinewidth": 0 }, "colorscale": [ [ 0.0, "#0d0887" ], [ 0.1111111111111111, "#46039f" ], [ 0.2222222222222222, "#7201a8" ], [ 0.3333333333333333, "#9c179e" ], [ 0.4444444444444444, "#bd3786" ], [ 0.5555555555555556, "#d8576b" ], [ 0.6666666666666666, "#ed7953" ], [ 0.7777777777777778, "#fb9f3a" ], [ 0.8888888888888888, "#fdca26" ], [ 1.0, "#f0f921" ] ] } ], "scatterpolar": [ { "type": "scatterpolar", "marker": { "colorbar": { "ticks": "", "outlinewidth": 0 } } } ], "contourcarpet": [ { "type": "contourcarpet", "colorbar": { "ticks": "", "outlinewidth": 0 } } ], "scattercarpet": [ { "type": "scattercarpet", "marker": { "colorbar": { "ticks": "", "outlinewidth": 0 } } } ], "scattermapbox": [ { "type": "scattermapbox", "marker": { "colorbar": { "ticks": "", "outlinewidth": 0 } } } ], "scatterpolargl": [ { "type": "scatterpolargl", "marker": { "colorbar": { "ticks": "", "outlinewidth": 0 } } } ], "scatterternary": [ { "type": "scatterternary", "marker": { "colorbar": { "ticks": "", "outlinewidth": 0 } } } ], "histogram2dcontour": [ { "type": "histogram2dcontour", "colorbar": { "ticks": "", "outlinewidth": 0 }, "colorscale": [ [ 0.0, "#0d0887" ], [ 0.1111111111111111, "#46039f" ], [ 0.2222222222222222, "#7201a8" ], [ 0.3333333333333333, "#9c179e" ], [ 0.4444444444444444, "#bd3786" ], [ 0.5555555555555556, "#d8576b" ], [ 0.6666666666666666, "#ed7953" ], [ 0.7777777777777778, "#fb9f3a" ], [ 0.8888888888888888, "#fdca26" ], [ 1.0, "#f0f921" ] ] } ] }, "layout": { "geo": { "bgcolor": "white", "showland": true, "lakecolor": "white", "landcolor": "#E5ECF6", "showlakes": true, "subunitcolor": "white" }, "font": { "color": "#2a3f5f" }, "polar": { "bgcolor": "#E5ECF6", "radialaxis": { "ticks": "", "gridcolor": "white", "linecolor": "white" }, "angularaxis": { "ticks": "", "gridcolor": "white", "linecolor": "white" } }, "scene": { "xaxis": { "ticks": "", "gridcolor": "white", "gridwidth": 2, "linecolor": "white", "zerolinecolor": "white", "showbackground": true, "backgroundcolor": "#E5ECF6" }, "yaxis": { "ticks": "", "gridcolor": "white", "gridwidth": 2, "linecolor": "white", "zerolinecolor": "white", "showbackground": true, "backgroundcolor": "#E5ECF6" }, "zaxis": { "ticks": "", "gridcolor": "white", "gridwidth": 2, "linecolor": "white", "zerolinecolor": "white", "showbackground": true, "backgroundcolor": "#E5ECF6" } }, "title": { "x": 0.05 }, "xaxis": { "ticks": "", "title": { "standoff": 15 }, "gridcolor": "white", "linecolor": "white", "automargin": true, "zerolinecolor": "white", "zerolinewidth": 2 }, "yaxis": { "ticks": "", "title": { "standoff": 15 }, "gridcolor": "white", "linecolor": "white", "automargin": true, "zerolinecolor": "white", "zerolinewidth": 2 }, "mapbox": { "style": "light" }, "ternary": { "aaxis": { "ticks": "", "gridcolor": "white", "linecolor": "white" }, "baxis": { "ticks": "", "gridcolor": "white", "linecolor": "white" }, "caxis": { "ticks": "", "gridcolor": "white", "linecolor": "white" }, "bgcolor": "#E5ECF6" }, "colorway": [ "#636efa", "#EF553B", "#00cc96", "#ab63fa", "#FFA15A", "#19d3f3", "#FF6692", "#B6E880", "#FF97FF", "#FECB52" ], "coloraxis": { "colorbar": { "ticks": "", "outlinewidth": 0 } }, "hovermode": "closest", "colorscale": { "diverging": [ [ 0, "#8e0152" ], [ 0.1, "#c51b7d" ], [ 0.2, "#de77ae" ], [ 0.3, "#f1b6da" ], [ 0.4, "#fde0ef" ], [ 0.5, "#f7f7f7" ], [ 0.6, "#e6f5d0" ], [ 0.7, "#b8e186" ], [ 0.8, "#7fbc41" ], [ 0.9, "#4d9221" ], [ 1, "#276419" ] ], "sequential": [ [ 0.0, "#0d0887" ], [ 0.1111111111111111, "#46039f" ], [ 0.2222222222222222, "#7201a8" ], [ 0.3333333333333333, "#9c179e" ], [ 0.4444444444444444, "#bd3786" ], [ 0.5555555555555556, "#d8576b" ], [ 0.6666666666666666, "#ed7953" ], [ 0.7777777777777778, "#fb9f3a" ], [ 0.8888888888888888, "#fdca26" ], [ 1.0, "#f0f921" ] ], "sequentialminus": [ [ 0.0, "#0d0887" ], [ 0.1111111111111111, "#46039f" ], [ 0.2222222222222222, "#7201a8" ], [ 0.3333333333333333, "#9c179e" ], [ 0.4444444444444444, "#bd3786" ], [ 0.5555555555555556, "#d8576b" ], [ 0.6666666666666666, "#ed7953" ], [ 0.7777777777777778, "#fb9f3a" ], [ 0.8888888888888888, "#fdca26" ], [ 1.0, "#f0f921" ] ] }, "hoverlabel": { "align": "left" }, "plot_bgcolor": "#E5ECF6", "paper_bgcolor": "white", "shapedefaults": { "line": { "color": "#2a3f5f" } }, "autotypenumbers": "strict", "annotationdefaults": { "arrowhead": 0, "arrowcolor": "#2a3f5f", "arrowwidth": 1 } } }, "showlegend": true } }, "height": null, "width": null, "user": { "profile_url": "https://chart-studio.plotly.com/~kateeab4", "avatar_url": "https://storage.googleapis.com/plotly-prod-profiles/87.jpg", "background_url": "https://storage.googleapis.com/plotly-prod-profiles/bg-0.jpg", "bio": "", "nickname": "", "website": "", "stream_tokens": null, "feature_set_id": null, "csrf_token": null, "date_joined": "2024-03-14 18:33:41", "mapbox_access_tokens": null, "has_password": null, "username": "kateeab4", "email": null, "is_active": null, "readonly": null, "is_dash_creator": null, "dash_created_count": null, "is_chart_creator": null, "charts_created_count": null } }, { "creation_time": "2024-03-21T00:25:14.882537Z", "comments": { "results": [], "count": 0 }, "parented": true, "embed_url": "https://chart-studio.plotly.com/~kateeab4/20.embed", "fid": "kateeab4:20", "filename": "scatter0.7638587822182806", "filetype": "plot", "img_url": "https://storage.googleapis.com/plotly-prod-images/kateeab4/20/9_87XFXYDWTFVXU8DZHFEOYXUN0MGAA3.png", "image_urls": { "default": "https://storage.googleapis.com/plotly-prod-images/kateeab4/20/2_4FPXANG4HDYJBN6D6JOOYK6DK1YQAB.png", "block-thumb": "https://storage.googleapis.com/plotly-prod-images/kateeab4/20/8_4ER6VSW9X46RBLQLCZSUTZZ4T9HU98.png", "list-thumb": "https://storage.googleapis.com/plotly-prod-images/kateeab4/20/9_87XFXYDWTFVXU8DZHFEOYXUN0MGAA3.png" }, "api_urls": { "files": "https://api.plotly.com/v2/files/kateeab4:20", "plots": "https://api.plotly.com/v2/plots/kateeab4:20", "parent": "https://api.plotly.com/v2/folders/home?user=kateeab4" }, "owner": "kateeab4", "parent": -1, "preview": "", "referencers": [], "references": [], "title": "", "views": 2, "web_url": "https://chart-studio.plotly.com/~kateeab4/20/", "world_readable": true, "date_modified": "2024-03-21T00:25:14.894Z", "stars": { "results": [], "count": 0 }, "collaborators": { "results": [], "count": 0 }, "subfolder_count": null, "refresh_interval": null, "organize_view_url": "https://chart-studio.plotly.com/~kateeab4/20/", "current_user_permission": "read", "is_theme": null, "is_template": null, "autosize": true, "caption": "", "figure": { "data": [ { "mode": "markers", "name": "No change", "type": "scatter", "xsrc": "kateeab4:19:851508", "ysrc": "kateeab4:19:f99861", "xaxis": "x", "yaxis": "y", "marker": { "color": "#636efa", "symbol": "circle" }, "showlegend": true, "legendgroup": "No change", "orientation": "v", "customdatasrc": "kateeab4:19:bead19", "hovertemplate": "Intrxn=No change<br>TRAF7FL/TRAF7Cterm Log2FC=%{x}<br>WDFL/WDCterm Log2FC=%{y}<br>PreyGene=%{customdata[0]}<br>TRAF7FL/TRAF7Cterm pvalue=%{customdata[1]}<br>WDFL/WDCterm pvalue=%{customdata[2]}<extra></extra>" }, { "mode": "markers", "name": "Disrupted", "type": "scatter", "xsrc": "kateeab4:19:624711", "ysrc": "kateeab4:19:ce6fbf", "xaxis": "x", "yaxis": "y", "marker": { "color": "#EF553B", "symbol": "circle" }, "showlegend": true, "legendgroup": "Disrupted", "orientation": "v", "customdatasrc": "kateeab4:19:1b5d78", "hovertemplate": "Intrxn=Disrupted<br>TRAF7FL/TRAF7Cterm Log2FC=%{x}<br>WDFL/WDCterm Log2FC=%{y}<br>PreyGene=%{customdata[0]}<br>TRAF7FL/TRAF7Cterm pvalue=%{customdata[1]}<br>WDFL/WDCterm pvalue=%{customdata[2]}<extra></extra>" }, { "mode": "markers", "name": "Disrupted in FL TRAF7", "type": "scatter", "xsrc": "kateeab4:19:c67eb6", "ysrc": "kateeab4:19:3022dc", "xaxis": "x", "yaxis": "y", "marker": { "color": "#00cc96", "symbol": "circle" }, "showlegend": true, "legendgroup": "Disrupted in FL TRAF7", "orientation": "v", "customdatasrc": "kateeab4:19:b824d1", "hovertemplate": "Intrxn=Disrupted in FL TRAF7<br>TRAF7FL/TRAF7Cterm Log2FC=%{x}<br>WDFL/WDCterm Log2FC=%{y}<br>PreyGene=%{customdata[0]}<br>TRAF7FL/TRAF7Cterm pvalue=%{customdata[1]}<br>WDFL/WDCterm pvalue=%{customdata[2]}<extra></extra>" }, { "mode": "markers", "name": "Enhanced in TRAF7 WD40, no data in FL TRAF7", "type": "scatter", "xsrc": "kateeab4:19:ee6ada", "ysrc": "kateeab4:19:0a7757", "xaxis": "x", "yaxis": "y", "marker": { "color": "#ab63fa", "symbol": "circle" }, "showlegend": true, "legendgroup": "Enhanced in TRAF7 WD40, no data in FL TRAF7", "orientation": "v", "customdatasrc": "kateeab4:19:0c0183", "hovertemplate": "Intrxn=Enhanced in TRAF7 WD40, no data in FL TRAF7<br>TRAF7FL/TRAF7Cterm Log2FC=%{x}<br>WDFL/WDCterm Log2FC=%{y}<br>PreyGene=%{customdata[0]}<br>TRAF7FL/TRAF7Cterm pvalue=%{customdata[1]}<br>WDFL/WDCterm pvalue=%{customdata[2]}<extra></extra>" }, { "mode": "markers", "name": "Enhanced", "type": "scatter", "xsrc": "kateeab4:19:5b8b47", "ysrc": "kateeab4:19:9256b6", "xaxis": "x", "yaxis": "y", "marker": { "color": "#FFA15A", "symbol": "circle" }, "showlegend": true, "legendgroup": "Enhanced", "orientation": "v", "customdatasrc": "kateeab4:19:c04e80", "hovertemplate": "Intrxn=Enhanced<br>TRAF7FL/TRAF7Cterm Log2FC=%{x}<br>WDFL/WDCterm Log2FC=%{y}<br>PreyGene=%{customdata[0]}<br>TRAF7FL/TRAF7Cterm pvalue=%{customdata[1]}<br>WDFL/WDCterm pvalue=%{customdata[2]}<extra></extra>" }, { "mode": "markers", "name": "Enhanced in FL TRAF7", "type": "scatter", "xsrc": "kateeab4:19:e4efb0", "ysrc": "kateeab4:19:44fdab", "xaxis": "x", "yaxis": "y", "marker": { "color": "#19d3f3", "symbol": "circle" }, "showlegend": true, "legendgroup": "Enhanced in FL TRAF7", "orientation": "v", "customdatasrc": "kateeab4:19:b22498", "hovertemplate": "Intrxn=Enhanced in FL TRAF7<br>TRAF7FL/TRAF7Cterm Log2FC=%{x}<br>WDFL/WDCterm Log2FC=%{y}<br>PreyGene=%{customdata[0]}<br>TRAF7FL/TRAF7Cterm pvalue=%{customdata[1]}<br>WDFL/WDCterm pvalue=%{customdata[2]}<extra></extra>" }, { "mode": "markers", "name": "Disrupted in FL TRAF7, no data in TRAF7 WD40", "type": "scatter", "xsrc": "kateeab4:19:402d56", "ysrc": "kateeab4:19:f5caa9", "xaxis": "x", "yaxis": "y", "marker": { "color": "#FF6692", "symbol": "circle" }, "showlegend": true, "legendgroup": "Disrupted in FL TRAF7, no data in TRAF7 WD40", "orientation": "v", "customdatasrc": "kateeab4:19:19d65e", "hovertemplate": "Intrxn=Disrupted in FL TRAF7, no data in TRAF7 WD40<br>TRAF7FL/TRAF7Cterm Log2FC=%{x}<br>WDFL/WDCterm Log2FC=%{y}<br>PreyGene=%{customdata[0]}<br>TRAF7FL/TRAF7Cterm pvalue=%{customdata[1]}<br>WDFL/WDCterm pvalue=%{customdata[2]}<extra></extra>" }, { "mode": "markers", "name": "Disrupted in TRAF7 WD40, no data in FL TRAF7", "type": "scatter", "xsrc": "kateeab4:19:1cf69d", "ysrc": "kateeab4:19:9016d9", "xaxis": "x", "yaxis": "y", "marker": { "color": "#B6E880", "symbol": "circle" }, "showlegend": true, "legendgroup": "Disrupted in TRAF7 WD40, no data in FL TRAF7", "orientation": "v", "customdatasrc": "kateeab4:19:dc1817", "hovertemplate": "Intrxn=Disrupted in TRAF7 WD40, no data in FL TRAF7<br>TRAF7FL/TRAF7Cterm Log2FC=%{x}<br>WDFL/WDCterm Log2FC=%{y}<br>PreyGene=%{customdata[0]}<br>TRAF7FL/TRAF7Cterm pvalue=%{customdata[1]}<br>WDFL/WDCterm pvalue=%{customdata[2]}<extra></extra>" }, { "mode": "markers", "name": "Enhanced in TRAF7 WD40", "type": "scatter", "xsrc": "kateeab4:19:96f9a3", "ysrc": "kateeab4:19:bfd92c", "xaxis": "x", "yaxis": "y", "marker": { "color": "#FF97FF", "symbol": "circle" }, "showlegend": true, "legendgroup": "Enhanced in TRAF7 WD40", "orientation": "v", "customdatasrc": "kateeab4:19:b1846c", "hovertemplate": "Intrxn=Enhanced in TRAF7 WD40<br>TRAF7FL/TRAF7Cterm Log2FC=%{x}<br>WDFL/WDCterm Log2FC=%{y}<br>PreyGene=%{customdata[0]}<br>TRAF7FL/TRAF7Cterm pvalue=%{customdata[1]}<br>WDFL/WDCterm pvalue=%{customdata[2]}<extra></extra>" }, { "mode": "markers", "name": "Disrupted in TRAF7 WD40", "type": "scatter", "xsrc": "kateeab4:19:3b9608", "ysrc": "kateeab4:19:7029a3", "xaxis": "x", "yaxis": "y", "marker": { "color": "#FECB52", "symbol": "circle" }, "showlegend": true, "legendgroup": "Disrupted in TRAF7 WD40", "orientation": "v", "customdatasrc": "kateeab4:19:cf5d5c", "hovertemplate": "Intrxn=Disrupted in TRAF7 WD40<br>TRAF7FL/TRAF7Cterm Log2FC=%{x}<br>WDFL/WDCterm Log2FC=%{y}<br>PreyGene=%{customdata[0]}<br>TRAF7FL/TRAF7Cterm pvalue=%{customdata[1]}<br>WDFL/WDCterm pvalue=%{customdata[2]}<extra></extra>" }, { "mode": "markers", "name": "Enhanced in FL TRAF7, no data in TRAF7 WD40", "type": "scatter", "xsrc": "kateeab4:19:7f977e", "ysrc": "kateeab4:19:a7d5c5", "xaxis": "x", "yaxis": "y", "marker": { "color": "#636efa", "symbol": "circle" }, "showlegend": true, "legendgroup": "Enhanced in FL TRAF7, no data in TRAF7 WD40", "orientation": "v", "customdatasrc": "kateeab4:19:276ebd", "hovertemplate": "Intrxn=Enhanced in FL TRAF7, no data in TRAF7 WD40<br>TRAF7FL/TRAF7Cterm Log2FC=%{x}<br>WDFL/WDCterm Log2FC=%{y}<br>PreyGene=%{customdata[0]}<br>TRAF7FL/TRAF7Cterm pvalue=%{customdata[1]}<br>WDFL/WDCterm pvalue=%{customdata[2]}<extra></extra>" }, { "mode": "markers", "name": "Enhanced in TRAF7 WD40, Disrupted in FL TRAF7", "type": "scatter", "xsrc": "kateeab4:19:9404dd", "ysrc": "kateeab4:19:710391", "xaxis": "x", "yaxis": "y", "marker": { "color": "#EF553B", "symbol": "circle" }, "showlegend": true, "legendgroup": "Enhanced in TRAF7 WD40, Disrupted in FL TRAF7", "orientation": "v", "customdatasrc": "kateeab4:19:6da0ba", "hovertemplate": "Intrxn=Enhanced in TRAF7 WD40, Disrupted in FL TRAF7<br>TRAF7FL/TRAF7Cterm Log2FC=%{x}<br>WDFL/WDCterm Log2FC=%{y}<br>PreyGene=%{customdata[0]}<br>TRAF7FL/TRAF7Cterm pvalue=%{customdata[1]}<br>WDFL/WDCterm pvalue=%{customdata[2]}<extra></extra>" } ], "layout": { "title": { "text": "AP-MS of Proteins with TRAF7" }, "xaxis": { "title": { "text": "TRAF7FL/TRAF7Cterm Log2FC" }, "anchor": "y", "domain": [ 0.0, 1.0 ] }, "yaxis": { "title": { "text": "WDFL/WDCterm Log2FC" }, "anchor": "x", "domain": [ 0.0, 1.0 ] }, "legend": { "title": { "text": "Intrxn" }, "tracegroupgap": 0 }, "margin": { "t": 60 }, "template": { "data": { "bar": [ { "type": "bar", "marker": { "line": { "color": "#E5ECF6", "width": 0.5 }, "pattern": { "size": 10, "fillmode": "overlay", "solidity": 0.2 } }, "error_x": { "color": "#2a3f5f" }, "error_y": { "color": "#2a3f5f" } } ], "pie": [ { "type": "pie", "automargin": true } ], "table": [ { "type": "table", "cells": { "fill": { "color": "#EBF0F8" }, "line": { "color": "white" } }, "header": { "fill": { "color": "#C8D4E3" }, "line": { "color": "white" } } } ], "carpet": [ { "type": "carpet", "aaxis": { "gridcolor": "white", "linecolor": "white", "endlinecolor": "#2a3f5f", "minorgridcolor": "white", "startlinecolor": "#2a3f5f" }, "baxis": { "gridcolor": "white", "linecolor": "white", "endlinecolor": "#2a3f5f", "minorgridcolor": "white", "startlinecolor": "#2a3f5f" } } ], "mesh3d": [ { "type": "mesh3d", "colorbar": { "ticks": "", "outlinewidth": 0 } } ], "contour": [ { "type": "contour", "colorbar": { "ticks": "", "outlinewidth": 0 }, "colorscale": [ [ 0.0, "#0d0887" ], [ 0.1111111111111111, "#46039f" ], [ 0.2222222222222222, "#7201a8" ], [ 0.3333333333333333, "#9c179e" ], [ 0.4444444444444444, "#bd3786" ], [ 0.5555555555555556, "#d8576b" ], [ 0.6666666666666666, "#ed7953" ], [ 0.7777777777777778, "#fb9f3a" ], [ 0.8888888888888888, "#fdca26" ], [ 1.0, "#f0f921" ] ] } ], "heatmap": [ { "type": "heatmap", "colorbar": { "ticks": "", "outlinewidth": 0 }, "colorscale": [ [ 0.0, "#0d0887" ], [ 0.1111111111111111, "#46039f" ], [ 0.2222222222222222, "#7201a8" ], [ 0.3333333333333333, "#9c179e" ], [ 0.4444444444444444, "#bd3786" ], [ 0.5555555555555556, "#d8576b" ], [ 0.6666666666666666, "#ed7953" ], [ 0.7777777777777778, "#fb9f3a" ], [ 0.8888888888888888, "#fdca26" ], [ 1.0, "#f0f921" ] ] } ], "scatter": [ { "type": "scatter", "fillpattern": { "size": 10, "fillmode": "overlay", "solidity": 0.2 } } ], "surface": [ { "type": "surface", "colorbar": { "ticks": "", "outlinewidth": 0 }, "colorscale": [ [ 0.0, "#0d0887" ], [ 0.1111111111111111, "#46039f" ], [ 0.2222222222222222, "#7201a8" ], [ 0.3333333333333333, "#9c179e" ], [ 0.4444444444444444, "#bd3786" ], [ 0.5555555555555556, "#d8576b" ], [ 0.6666666666666666, "#ed7953" ], [ 0.7777777777777778, "#fb9f3a" ], [ 0.8888888888888888, "#fdca26" ], [ 1.0, "#f0f921" ] ] } ], "barpolar": [ { "type": "barpolar", "marker": { "line": { "color": "#E5ECF6", "width": 0.5 }, "pattern": { "size": 10, "fillmode": "overlay", "solidity": 0.2 } } } ], "heatmapgl": [ { "type": "heatmapgl", "colorbar": { "ticks": "", "outlinewidth": 0 }, "colorscale": [ [ 0.0, "#0d0887" ], [ 0.1111111111111111, "#46039f" ], [ 0.2222222222222222, "#7201a8" ], [ 0.3333333333333333, "#9c179e" ], [ 0.4444444444444444, "#bd3786" ], [ 0.5555555555555556, "#d8576b" ], [ 0.6666666666666666, "#ed7953" ], [ 0.7777777777777778, "#fb9f3a" ], [ 0.8888888888888888, "#fdca26" ], [ 1.0, "#f0f921" ] ] } ], "histogram": [ { "type": "histogram", "marker": { "pattern": { "size": 10, "fillmode": "overlay", "solidity": 0.2 } } } ], "parcoords": [ { "line": { "colorbar": { "ticks": "", "outlinewidth": 0 } }, "type": "parcoords" } ], "scatter3d": [ { "line": { "colorbar": { "ticks": "", "outlinewidth": 0 } }, "type": "scatter3d", "marker": { "colorbar": { "ticks": "", "outlinewidth": 0 } } } ], "scattergl": [ { "type": "scattergl", "marker": { "colorbar": { "ticks": "", "outlinewidth": 0 } } } ], "choropleth": [ { "type": "choropleth", "colorbar": { "ticks": "", "outlinewidth": 0 } } ], "scattergeo": [ { "type": "scattergeo", "marker": { "colorbar": { "ticks": "", "outlinewidth": 0 } } } ], "histogram2d": [ { "type": "histogram2d", "colorbar": { "ticks": "", "outlinewidth": 0 }, "colorscale": [ [ 0.0, "#0d0887" ], [ 0.1111111111111111, "#46039f" ], [ 0.2222222222222222, "#7201a8" ], [ 0.3333333333333333, "#9c179e" ], [ 0.4444444444444444, "#bd3786" ], [ 0.5555555555555556, "#d8576b" ], [ 0.6666666666666666, "#ed7953" ], [ 0.7777777777777778, "#fb9f3a" ], [ 0.8888888888888888, "#fdca26" ], [ 1.0, "#f0f921" ] ] } ], "scatterpolar": [ { "type": "scatterpolar", "marker": { "colorbar": { "ticks": "", "outlinewidth": 0 } } } ], "contourcarpet": [ { "type": "contourcarpet", "colorbar": { "ticks": "", "outlinewidth": 0 } } ], "scattercarpet": [ { "type": "scattercarpet", "marker": { "colorbar": { "ticks": "", "outlinewidth": 0 } } } ], "scattermapbox": [ { "type": "scattermapbox", "marker": { "colorbar": { "ticks": "", "outlinewidth": 0 } } } ], "scatterpolargl": [ { "type": "scatterpolargl", "marker": { "colorbar": { "ticks": "", "outlinewidth": 0 } } } ], "scatterternary": [ { "type": "scatterternary", "marker": { "colorbar": { "ticks": "", "outlinewidth": 0 } } } ], "histogram2dcontour": [ { "type": "histogram2dcontour", "colorbar": { "ticks": "", "outlinewidth": 0 }, "colorscale": [ [ 0.0, "#0d0887" ], [ 0.1111111111111111, "#46039f" ], [ 0.2222222222222222, "#7201a8" ], [ 0.3333333333333333, "#9c179e" ], [ 0.4444444444444444, "#bd3786" ], [ 0.5555555555555556, "#d8576b" ], [ 0.6666666666666666, "#ed7953" ], [ 0.7777777777777778, "#fb9f3a" ], [ 0.8888888888888888, "#fdca26" ], [ 1.0, "#f0f921" ] ] } ] }, "layout": { "geo": { "bgcolor": "white", "showland": true, "lakecolor": "white", "landcolor": "#E5ECF6", "showlakes": true, "subunitcolor": "white" }, "font": { "color": "#2a3f5f" }, "polar": { "bgcolor": "#E5ECF6", "radialaxis": { "ticks": "", "gridcolor": "white", "linecolor": "white" }, "angularaxis": { "ticks": "", "gridcolor": "white", "linecolor": "white" } }, "scene": { "xaxis": { "ticks": "", "gridcolor": "white", "gridwidth": 2, "linecolor": "white", "zerolinecolor": "white", "showbackground": true, "backgroundcolor": "#E5ECF6" }, "yaxis": { "ticks": "", "gridcolor": "white", "gridwidth": 2, "linecolor": "white", "zerolinecolor": "white", "showbackground": true, "backgroundcolor": "#E5ECF6" }, "zaxis": { "ticks": "", "gridcolor": "white", "gridwidth": 2, "linecolor": "white", "zerolinecolor": "white", "showbackground": true, "backgroundcolor": "#E5ECF6" } }, "title": { "x": 0.05 }, "xaxis": { "ticks": "", "title": { "standoff": 15 }, "gridcolor": "white", "linecolor": "white", "automargin": true, "zerolinecolor": "white", "zerolinewidth": 2 }, "yaxis": { "ticks": "", "title": { "standoff": 15 }, "gridcolor": "white", "linecolor": "white", "automargin": true, "zerolinecolor": "white", "zerolinewidth": 2 }, "mapbox": { "style": "light" }, "ternary": { "aaxis": { "ticks": "", "gridcolor": "white", "linecolor": "white" }, "baxis": { "ticks": "", "gridcolor": "white", "linecolor": "white" }, "caxis": { "ticks": "", "gridcolor": "white", "linecolor": "white" }, "bgcolor": "#E5ECF6" }, "colorway": [ "#636efa", "#EF553B", "#00cc96", "#ab63fa", "#FFA15A", "#19d3f3", "#FF6692", "#B6E880", "#FF97FF", "#FECB52" ], "coloraxis": { "colorbar": { "ticks": "", "outlinewidth": 0 } }, "hovermode": "closest", "colorscale": { "diverging": [ [ 0, "#8e0152" ], [ 0.1, "#c51b7d" ], [ 0.2, "#de77ae" ], [ 0.3, "#f1b6da" ], [ 0.4, "#fde0ef" ], [ 0.5, "#f7f7f7" ], [ 0.6, "#e6f5d0" ], [ 0.7, "#b8e186" ], [ 0.8, "#7fbc41" ], [ 0.9, "#4d9221" ], [ 1, "#276419" ] ], "sequential": [ [ 0.0, "#0d0887" ], [ 0.1111111111111111, "#46039f" ], [ 0.2222222222222222, "#7201a8" ], [ 0.3333333333333333, "#9c179e" ], [ 0.4444444444444444, "#bd3786" ], [ 0.5555555555555556, "#d8576b" ], [ 0.6666666666666666, "#ed7953" ], [ 0.7777777777777778, "#fb9f3a" ], [ 0.8888888888888888, "#fdca26" ], [ 1.0, "#f0f921" ] ], "sequentialminus": [ [ 0.0, "#0d0887" ], [ 0.1111111111111111, "#46039f" ], [ 0.2222222222222222, "#7201a8" ], [ 0.3333333333333333, "#9c179e" ], [ 0.4444444444444444, "#bd3786" ], [ 0.5555555555555556, "#d8576b" ], [ 0.6666666666666666, "#ed7953" ], [ 0.7777777777777778, "#fb9f3a" ], [ 0.8888888888888888, "#fdca26" ], [ 1.0, "#f0f921" ] ] }, "hoverlabel": { "align": "left" }, "plot_bgcolor": "#E5ECF6", "paper_bgcolor": "white", "shapedefaults": { "line": { "color": "#2a3f5f" } }, "autotypenumbers": "strict", "annotationdefaults": { "arrowhead": 0, "arrowcolor": "#2a3f5f", "arrowwidth": 1 } } } } }, "height": null, "width": null, "user": { "profile_url": "https://chart-studio.plotly.com/~kateeab4", "avatar_url": "https://storage.googleapis.com/plotly-prod-profiles/87.jpg", "background_url": "https://storage.googleapis.com/plotly-prod-profiles/bg-0.jpg", "bio": "", "nickname": "", "website": "", "stream_tokens": null, "feature_set_id": null, "csrf_token": null, "date_joined": "2024-03-14 18:33:41", "mapbox_access_tokens": null, "has_password": null, "username": "kateeab4", "email": null, "is_active": null, "readonly": null, "is_dash_creator": null, "dash_created_count": null, "is_chart_creator": null, "charts_created_count": null } }, { "creation_time": "2024-03-21T00:25:08.352928Z", "comments": { "results": [], "count": 0 }, "parented": true, "embed_url": "https://chart-studio.plotly.com/~kateeab4/18.embed", "fid": "kateeab4:18", "filename": "sunburst0.7638587822182806", "filetype": "plot", "img_url": "https://storage.googleapis.com/plotly-prod-images/kateeab4/18/9_L9ALY845R2O6CFER5RG2C1J5SN109B.png", "image_urls": { "default": "https://storage.googleapis.com/plotly-prod-images/kateeab4/18/2_GU6VFDNDL3PI6MSSWOYRLXZIX97ZN7.png", "block-thumb": "https://storage.googleapis.com/plotly-prod-images/kateeab4/18/8_22KK9XNDZH7A9X0KU3BNR5QJP66EXD.png", "list-thumb": "https://storage.googleapis.com/plotly-prod-images/kateeab4/18/9_L9ALY845R2O6CFER5RG2C1J5SN109B.png" }, "api_urls": { "files": "https://api.plotly.com/v2/files/kateeab4:18", "plots": "https://api.plotly.com/v2/plots/kateeab4:18", "parent": "https://api.plotly.com/v2/folders/home?user=kateeab4" }, "owner": "kateeab4", "parent": -1, "preview": "", "referencers": [], "references": [], "title": "", "views": 13, "web_url": "https://chart-studio.plotly.com/~kateeab4/18/", "world_readable": true, "date_modified": "2024-03-21T00:25:08.365Z", "stars": { "results": [], "count": 0 }, "collaborators": { "results": [], "count": 0 }, "subfolder_count": null, "refresh_interval": null, "organize_view_url": "https://chart-studio.plotly.com/~kateeab4/18/", "current_user_permission": "read", "is_theme": null, "is_template": null, "autosize": true, "caption": "", "figure": { "data": [ { "name": "", "type": "sunburst", "domain": { "x": [ 0.0, 1.0 ], "y": [ 0.0, 1.0 ] }, "idssrc": "kateeab4:17:b8b04f", "marker": { "coloraxis": "coloraxis", "colorssrc": "kateeab4:17:98962a" }, "labelssrc": "kateeab4:17:e2d4ae", "valuessrc": "kateeab4:17:7191f1", "parentssrc": "kateeab4:17:ddcfce", "branchvalues": "total", "customdatasrc": "kateeab4:17:efc1cf", "hovertemplate": "labels=%{label}<br>count=%{value}<br>parent=%{parent}<br>id=%{id}<br>TRAF7FL/TRAF7Cterm Log2FC=%{color}<extra></extra>" } ], "layout": { "title": { "text": "AP-MS of Proteins with TRAF7" }, "legend": { "tracegroupgap": 0 }, "margin": { "t": 60 }, "template": { "data": { "bar": [ { "type": "bar", "marker": { "line": { "color": "#E5ECF6", "width": 0.5 }, "pattern": { "size": 10, "fillmode": "overlay", "solidity": 0.2 } }, "error_x": { "color": "#2a3f5f" }, "error_y": { "color": "#2a3f5f" } } ], "pie": [ { "type": "pie", "automargin": true } ], "table": [ { "type": "table", "cells": { "fill": { "color": "#EBF0F8" }, "line": { "color": "white" } }, "header": { "fill": { "color": "#C8D4E3" }, "line": { "color": "white" } } } ], "carpet": [ { "type": "carpet", "aaxis": { "gridcolor": "white", "linecolor": "white", "endlinecolor": "#2a3f5f", "minorgridcolor": "white", "startlinecolor": "#2a3f5f" }, "baxis": { "gridcolor": "white", "linecolor": "white", "endlinecolor": "#2a3f5f", "minorgridcolor": "white", "startlinecolor": "#2a3f5f" } } ], "mesh3d": [ { "type": "mesh3d", "colorbar": { "ticks": "", "outlinewidth": 0 } } ], "contour": [ { "type": "contour", "colorbar": { "ticks": "", "outlinewidth": 0 }, "colorscale": [ [ 0.0, "#0d0887" ], [ 0.1111111111111111, "#46039f" ], [ 0.2222222222222222, "#7201a8" ], [ 0.3333333333333333, "#9c179e" ], [ 0.4444444444444444, "#bd3786" ], [ 0.5555555555555556, "#d8576b" ], [ 0.6666666666666666, "#ed7953" ], [ 0.7777777777777778, "#fb9f3a" ], [ 0.8888888888888888, "#fdca26" ], [ 1.0, "#f0f921" ] ] } ], "heatmap": [ { "type": "heatmap", "colorbar": { "ticks": "", "outlinewidth": 0 }, "colorscale": [ [ 0.0, "#0d0887" ], [ 0.1111111111111111, "#46039f" ], [ 0.2222222222222222, "#7201a8" ], [ 0.3333333333333333, "#9c179e" ], [ 0.4444444444444444, "#bd3786" ], [ 0.5555555555555556, "#d8576b" ], [ 0.6666666666666666, "#ed7953" ], [ 0.7777777777777778, "#fb9f3a" ], [ 0.8888888888888888, "#fdca26" ], [ 1.0, "#f0f921" ] ] } ], "scatter": [ { "type": "scatter", "fillpattern": { "size": 10, "fillmode": "overlay", "solidity": 0.2 } } ], "surface": [ { "type": "surface", "colorbar": { "ticks": "", "outlinewidth": 0 }, "colorscale": [ [ 0.0, "#0d0887" ], [ 0.1111111111111111, "#46039f" ], [ 0.2222222222222222, "#7201a8" ], [ 0.3333333333333333, "#9c179e" ], [ 0.4444444444444444, "#bd3786" ], [ 0.5555555555555556, "#d8576b" ], [ 0.6666666666666666, "#ed7953" ], [ 0.7777777777777778, "#fb9f3a" ], [ 0.8888888888888888, "#fdca26" ], [ 1.0, "#f0f921" ] ] } ], "barpolar": [ { "type": "barpolar", "marker": { "line": { "color": "#E5ECF6", "width": 0.5 }, "pattern": { "size": 10, "fillmode": "overlay", "solidity": 0.2 } } } ], "heatmapgl": [ { "type": "heatmapgl", "colorbar": { "ticks": "", "outlinewidth": 0 }, "colorscale": [ [ 0.0, "#0d0887" ], [ 0.1111111111111111, "#46039f" ], [ 0.2222222222222222, "#7201a8" ], [ 0.3333333333333333, "#9c179e" ], [ 0.4444444444444444, "#bd3786" ], [ 0.5555555555555556, "#d8576b" ], [ 0.6666666666666666, "#ed7953" ], [ 0.7777777777777778, "#fb9f3a" ], [ 0.8888888888888888, "#fdca26" ], [ 1.0, "#f0f921" ] ] } ], "histogram": [ { "type": "histogram", "marker": { "pattern": { "size": 10, "fillmode": "overlay", "solidity": 0.2 } } } ], "parcoords": [ { "line": { "colorbar": { "ticks": "", "outlinewidth": 0 } }, "type": "parcoords" } ], "scatter3d": [ { "line": { "colorbar": { "ticks": "", "outlinewidth": 0 } }, "type": "scatter3d", "marker": { "colorbar": { "ticks": "", "outlinewidth": 0 } } } ], "scattergl": [ { "type": "scattergl", "marker": { "colorbar": { "ticks": "", "outlinewidth": 0 } } } ], "choropleth": [ { "type": "choropleth", "colorbar": { "ticks": "", "outlinewidth": 0 } } ], "scattergeo": [ { "type": "scattergeo", "marker": { "colorbar": { "ticks": "", "outlinewidth": 0 } } } ], "histogram2d": [ { "type": "histogram2d", "colorbar": { "ticks": "", "outlinewidth": 0 }, "colorscale": [ [ 0.0, "#0d0887" ], [ 0.1111111111111111, "#46039f" ], [ 0.2222222222222222, "#7201a8" ], [ 0.3333333333333333, "#9c179e" ], [ 0.4444444444444444, "#bd3786" ], [ 0.5555555555555556, "#d8576b" ], [ 0.6666666666666666, "#ed7953" ], [ 0.7777777777777778, "#fb9f3a" ], [ 0.8888888888888888, "#fdca26" ], [ 1.0, "#f0f921" ] ] } ], "scatterpolar": [ { "type": "scatterpolar", "marker": { "colorbar": { "ticks": "", "outlinewidth": 0 } } } ], "contourcarpet": [ { "type": "contourcarpet", "colorbar": { "ticks": "", "outlinewidth": 0 } } ], "scattercarpet": [ { "type": "scattercarpet", "marker": { "colorbar": { "ticks": "", "outlinewidth": 0 } } } ], "scattermapbox": [ { "type": "scattermapbox", "marker": { "colorbar": { "ticks": "", "outlinewidth": 0 } } } ], "scatterpolargl": [ { "type": "scatterpolargl", "marker": { "colorbar": { "ticks": "", "outlinewidth": 0 } } } ], "scatterternary": [ { "type": "scatterternary", "marker": { "colorbar": { "ticks": "", "outlinewidth": 0 } } } ], "histogram2dcontour": [ { "type": "histogram2dcontour", "colorbar": { "ticks": "", "outlinewidth": 0 }, "colorscale": [ [ 0.0, "#0d0887" ], [ 0.1111111111111111, "#46039f" ], [ 0.2222222222222222, "#7201a8" ], [ 0.3333333333333333, "#9c179e" ], [ 0.4444444444444444, "#bd3786" ], [ 0.5555555555555556, "#d8576b" ], [ 0.6666666666666666, "#ed7953" ], [ 0.7777777777777778, "#fb9f3a" ], [ 0.8888888888888888, "#fdca26" ], [ 1.0, "#f0f921" ] ] } ] }, "layout": { "geo": { "bgcolor": "white", "showland": true, "lakecolor": "white", "landcolor": "#E5ECF6", "showlakes": true, "subunitcolor": "white" }, "font": { "color": "#2a3f5f" }, "polar": { "bgcolor": "#E5ECF6", "radialaxis": { "ticks": "", "gridcolor": "white", "linecolor": "white" }, "angularaxis": { "ticks": "", "gridcolor": "white", "linecolor": "white" } }, "scene": { "xaxis": { "ticks": "", "gridcolor": "white", "gridwidth": 2, "linecolor": "white", "zerolinecolor": "white", "showbackground": true, "backgroundcolor": "#E5ECF6" }, "yaxis": { "ticks": "", "gridcolor": "white", "gridwidth": 2, "linecolor": "white", "zerolinecolor": "white", "showbackground": true, "backgroundcolor": "#E5ECF6" }, "zaxis": { "ticks": "", "gridcolor": "white", "gridwidth": 2, "linecolor": "white", "zerolinecolor": "white", "showbackground": true, "backgroundcolor": "#E5ECF6" } }, "title": { "x": 0.05 }, "xaxis": { "ticks": "", "title": { "standoff": 15 }, "gridcolor": "white", "linecolor": "white", "automargin": true, "zerolinecolor": "white", "zerolinewidth": 2 }, "yaxis": { "ticks": "", "title": { "standoff": 15 }, "gridcolor": "white", "linecolor": "white", "automargin": true, "zerolinecolor": "white", "zerolinewidth": 2 }, "mapbox": { "style": "light" }, "ternary": { "aaxis": { "ticks": "", "gridcolor": "white", "linecolor": "white" }, "baxis": { "ticks": "", "gridcolor": "white", "linecolor": "white" }, "caxis": { "ticks": "", "gridcolor": "white", "linecolor": "white" }, "bgcolor": "#E5ECF6" }, "colorway": [ "#636efa", "#EF553B", "#00cc96", "#ab63fa", "#FFA15A", "#19d3f3", "#FF6692", "#B6E880", "#FF97FF", "#FECB52" ], "coloraxis": { "colorbar": { "ticks": "", "outlinewidth": 0 } }, "hovermode": "closest", "colorscale": { "diverging": [ [ 0, "#8e0152" ], [ 0.1, "#c51b7d" ], [ 0.2, "#de77ae" ], [ 0.3, "#f1b6da" ], [ 0.4, "#fde0ef" ], [ 0.5, "#f7f7f7" ], [ 0.6, "#e6f5d0" ], [ 0.7, "#b8e186" ], [ 0.8, "#7fbc41" ], [ 0.9, "#4d9221" ], [ 1, "#276419" ] ], "sequential": [ [ 0.0, "#0d0887" ], [ 0.1111111111111111, "#46039f" ], [ 0.2222222222222222, "#7201a8" ], [ 0.3333333333333333, "#9c179e" ], [ 0.4444444444444444, "#bd3786" ], [ 0.5555555555555556, "#d8576b" ], [ 0.6666666666666666, "#ed7953" ], [ 0.7777777777777778, "#fb9f3a" ], [ 0.8888888888888888, "#fdca26" ], [ 1.0, "#f0f921" ] ], "sequentialminus": [ [ 0.0, "#0d0887" ], [ 0.1111111111111111, "#46039f" ], [ 0.2222222222222222, "#7201a8" ], [ 0.3333333333333333, "#9c179e" ], [ 0.4444444444444444, "#bd3786" ], [ 0.5555555555555556, "#d8576b" ], [ 0.6666666666666666, "#ed7953" ], [ 0.7777777777777778, "#fb9f3a" ], [ 0.8888888888888888, "#fdca26" ], [ 1.0, "#f0f921" ] ] }, "hoverlabel": { "align": "left" }, "plot_bgcolor": "#E5ECF6", "paper_bgcolor": "white", "shapedefaults": { "line": { "color": "#2a3f5f" } }, "autotypenumbers": "strict", "annotationdefaults": { "arrowhead": 0, "arrowcolor": "#2a3f5f", "arrowwidth": 1 } } }, "coloraxis": { "colorbar": { "title": { "text": "TRAF7FL/TRAF7Cterm Log2FC" } }, "colorscale": [ [ 0.0, "#0d0887" ], [ 0.1111111111111111, "#46039f" ], [ 0.2222222222222222, "#7201a8" ], [ 0.3333333333333333, "#9c179e" ], [ 0.4444444444444444, "#bd3786" ], [ 0.5555555555555556, "#d8576b" ], [ 0.6666666666666666, "#ed7953" ], [ 0.7777777777777778, "#fb9f3a" ], [ 0.8888888888888888, "#fdca26" ], [ 1.0, "#f0f921" ] ] } } }, "height": null, "width": null, "user": { "profile_url": "https://chart-studio.plotly.com/~kateeab4", "avatar_url": "https://storage.googleapis.com/plotly-prod-profiles/87.jpg", "background_url": "https://storage.googleapis.com/plotly-prod-profiles/bg-0.jpg", "bio": "", "nickname": "", "website": "", "stream_tokens": null, "feature_set_id": null, "csrf_token": null, "date_joined": "2024-03-14 18:33:41", "mapbox_access_tokens": null, "has_password": null, "username": "kateeab4", "email": null, "is_active": null, "readonly": null, "is_dash_creator": null, "dash_created_count": null, "is_chart_creator": null, "charts_created_count": null } }, { "creation_time": "2024-03-21T00:15:58.091752Z", "comments": { "results": [], "count": 0 }, "parented": true, "embed_url": "https://chart-studio.plotly.com/~riat24/4.embed", "fid": "riat24:4", "filename": "Plotly Intro Vis 1", "filetype": "plot", "img_url": "https://storage.googleapis.com/plotly-prod-images/riat24/4/9_7LPWJPO5E92T44C7O0LSDLR66K62HA.png", "image_urls": { "default": "https://storage.googleapis.com/plotly-prod-images/riat24/4/2_XP05FJ2N4LES9U0ZKS2ZIIXFU14ZS6.png", "block-thumb": "https://storage.googleapis.com/plotly-prod-images/riat24/4/8_4NRVN3CAEAIVDJJI3BJBMEV5U80MZ5.png", "list-thumb": "https://storage.googleapis.com/plotly-prod-images/riat24/4/9_7LPWJPO5E92T44C7O0LSDLR66K62HA.png" }, "api_urls": { "files": "https://api.plotly.com/v2/files/riat24:4", "plots": "https://api.plotly.com/v2/plots/riat24:4", "parent": "https://api.plotly.com/v2/folders/home?user=riat24" }, "owner": "riat24", "parent": -1, "preview": "", "referencers": [], "references": [], "title": "", "views": 4, "web_url": "https://chart-studio.plotly.com/~riat24/4/", "world_readable": true, "date_modified": "2024-03-28T15:25:42.742Z", "stars": { "results": [], "count": 0 }, "collaborators": { "results": [], "count": 0 }, "subfolder_count": null, "refresh_interval": null, "organize_view_url": "https://chart-studio.plotly.com/~riat24/4/", "current_user_permission": "read", "is_theme": null, "is_template": false, "autosize": true, "caption": "", "figure": { "data": [ { "meta": { "columnNames": { "z": "2022", "locations": "country" } }, "mode": "markers", "type": "choropleth", "zsrc": "riat24:3:f5100b", "colorbar": { "title": { "text": "CO2 Emissions (Tonnes per capita)" } }, "locationmode": "country names", "locationssrc": "riat24:3:ac0c8f", "reversescale": true } ], "frames": [], "layout": { "geo": {}, "title": { "text": "CO2 emissions per capita by country in 2022" }, "xaxis": { "range": [ -1, 6 ], "autorange": true }, "yaxis": { "range": [ -1, 4 ], "autorange": true }, "mapbox": {}, "autosize": true, "template": { "data": { "bar": [ { "type": "bar", "marker": { "colorbar": { "ticks": "", "outlinewidth": 0 } } } ], "table": [ { "type": "table", "cells": { "fill": { "color": "#EBF0F8" }, "line": { "color": "white" } }, "header": { "fill": { "color": "#C8D4E3" }, "line": { "color": "white" } } } ], "carpet": [ { "type": "carpet", "aaxis": { "gridcolor": "#C8D4E3", "linecolor": "#C8D4E3", "endlinecolor": "#2a3f5f", "minorgridcolor": "#C8D4E3", "startlinecolor": "#2a3f5f" }, "baxis": { "gridcolor": "#C8D4E3", "linecolor": "#C8D4E3", "endlinecolor": "#2a3f5f", "minorgridcolor": "#C8D4E3", "startlinecolor": "#2a3f5f" } } ], "mesh3d": [ { "type": "mesh3d", "colorbar": { "ticks": "", "outlinewidth": 0 } } ], "contour": [ { "type": "contour", "colorbar": { "ticks": "", "outlinewidth": 0 }, "autocolorscale": true } ], "heatmap": [ { "type": "heatmap", "colorbar": { "ticks": "", "outlinewidth": 0 }, "autocolorscale": true } ], "scatter": [ { "type": "scatter", "marker": { "colorbar": { "ticks": "", "outlinewidth": 0 } } } ], "surface": [ { "type": "surface", "colorbar": { "ticks": "", "outlinewidth": 0 } } ], "heatmapgl": [ { "type": "heatmapgl", "colorbar": { "ticks": "", "outlinewidth": 0 } } ], "histogram": [ { "type": "histogram", "marker": { "colorbar": { "ticks": "", "outlinewidth": 0 } } } ], "parcoords": [ { "line": { "colorbar": { "ticks": "", "outlinewidth": 0 } }, "type": "parcoords" } ], "scatter3d": [ { "type": "scatter3d", "marker": { "colorbar": { "ticks": "", "outlinewidth": 0 } } } ], "scattergl": [ { "type": "scattergl", "marker": { "colorbar": { "ticks": "", "outlinewidth": 0 } } } ], "choropleth": [ { "type": "choropleth", "colorbar": { "ticks": "", "outlinewidth": 0 } } ], "scattergeo": [ { "type": "scattergeo", "marker": { "colorbar": { "ticks": "", "outlinewidth": 0 } } } ], "histogram2d": [ { "type": "histogram2d", "colorbar": { "ticks": "", "outlinewidth": 0 }, "autocolorscale": true } ], "scatterpolar": [ { "type": "scatterpolar", "marker": { "colorbar": { "ticks": "", "outlinewidth": 0 } } } ], "contourcarpet": [ { "type": "contourcarpet", "colorbar": { "ticks": "", "outlinewidth": 0 } } ], "scattercarpet": [ { "type": "scattercarpet", "marker": { "colorbar": { "ticks": "", "outlinewidth": 0 } } } ], "scattermapbox": [ { "type": "scattermapbox", "marker": { "colorbar": { "ticks": "", "outlinewidth": 0 } } } ], "scatterpolargl": [ { "type": "scatterpolargl", "marker": { "colorbar": { "ticks": "", "outlinewidth": 0 } } } ], "scatterternary": [ { "type": "scatterternary", "marker": { "colorbar": { "ticks": "", "outlinewidth": 0 } } } ], "histogram2dcontour": [ { "type": "histogram2dcontour", "colorbar": { "ticks": "", "outlinewidth": 0 }, "autocolorscale": true } ] }, "layout": { "geo": { "bgcolor": "white", "showland": true, "lakecolor": "white", "landcolor": "white", "showlakes": true, "subunitcolor": "#C8D4E3" }, "font": { "color": "#2a3f5f" }, "polar": { "bgcolor": "white", "radialaxis": { "ticks": "", "gridcolor": "#EBF0F8", "linecolor": "#EBF0F8" }, "angularaxis": { "ticks": "", "gridcolor": "#EBF0F8", "linecolor": "#EBF0F8" } }, "scene": { "xaxis": { "ticks": "", "gridcolor": "#DFE8F3", "gridwidth": 2, "linecolor": "#EBF0F8", "zerolinecolor": "#EBF0F8", "showbackground": true, "backgroundcolor": "white" }, "yaxis": { "ticks": "", "gridcolor": "#DFE8F3", "gridwidth": 2, "linecolor": "#EBF0F8", "zerolinecolor": "#EBF0F8", "showbackground": true, "backgroundcolor": "white" }, "zaxis": { "ticks": "", "gridcolor": "#DFE8F3", "gridwidth": 2, "linecolor": "#EBF0F8", "zerolinecolor": "#EBF0F8", "showbackground": true, "backgroundcolor": "white" } }, "title": { "x": 0.05 }, "xaxis": { "ticks": "", "gridcolor": "#EBF0F8", "linecolor": "#EBF0F8", "automargin": true, "zerolinecolor": "#EBF0F8", "zerolinewidth": 2 }, "yaxis": { "ticks": "", "gridcolor": "#EBF0F8", "linecolor": "#EBF0F8", "automargin": true, "zerolinecolor": "#EBF0F8", "zerolinewidth": 2 }, "ternary": { "aaxis": { "ticks": "", "gridcolor": "#DFE8F3", "linecolor": "#A2B1C6" }, "baxis": { "ticks": "", "gridcolor": "#DFE8F3", "linecolor": "#A2B1C6" }, "caxis": { "ticks": "", "gridcolor": "#DFE8F3", "linecolor": "#A2B1C6" }, "bgcolor": "white" }, "colorway": [ "#636efa", "#EF553B", "#00cc96", "#ab63fa", "#19d3f3", "#e763fa", "#fecb52", "#ffa15a", "#ff6692", "#b6e880" ], "hovermode": "closest", "colorscale": { "diverging": [ [ 0, "#8e0152" ], [ 0.1, "#c51b7d" ], [ 0.2, "#de77ae" ], [ 0.3, "#f1b6da" ], [ 0.4, "#fde0ef" ], [ 0.5, "#f7f7f7" ], [ 0.6, "#e6f5d0" ], [ 0.7, "#b8e186" ], [ 0.8, "#7fbc41" ], [ 0.9, "#4d9221" ], [ 1, "#276419" ] ], "sequential": [ [ 0, "#0508b8" ], [ 0.0893854748603352, "#1910d8" ], [ 0.1787709497206704, "#3c19f0" ], [ 0.2681564245810056, "#6b1cfb" ], [ 0.3575418994413408, "#981cfd" ], [ 0.44692737430167595, "#bf1cfd" ], [ 0.5363128491620112, "#dd2bfd" ], [ 0.6256983240223464, "#f246fe" ], [ 0.7150837988826816, "#fc67fd" ], [ 0.8044692737430168, "#fe88fc" ], [ 0.8938547486033519, "#fea5fd" ], [ 0.9832402234636871, "#febefe" ], [ 1, "#fec3fe" ] ], "sequentialminus": [ [ 0, "#0508b8" ], [ 0.0893854748603352, "#1910d8" ], [ 0.1787709497206704, "#3c19f0" ], [ 0.2681564245810056, "#6b1cfb" ], [ 0.3575418994413408, "#981cfd" ], [ 0.44692737430167595, "#bf1cfd" ], [ 0.5363128491620112, "#dd2bfd" ], [ 0.6256983240223464, "#f246fe" ], [ 0.7150837988826816, "#fc67fd" ], [ 0.8044692737430168, "#fe88fc" ], [ 0.8938547486033519, "#fea5fd" ], [ 0.9832402234636871, "#febefe" ], [ 1, "#fec3fe" ] ] }, "plot_bgcolor": "white", "paper_bgcolor": "white", "shapedefaults": { "line": { "width": 0 }, "opacity": 0.4, "fillcolor": "#506784" }, "annotationdefaults": { "arrowhead": 0, "arrowcolor": "#506784", "arrowwidth": 1 } }, "themeRef": "PLOTLY_WHITE" } } }, "height": null, "width": null, "user": { "profile_url": "https://chart-studio.plotly.com/~riat24", "avatar_url": "https://storage.googleapis.com/plotly-prod-profiles/14.jpg", "background_url": "https://storage.googleapis.com/plotly-prod-profiles/bg-6.jpg", "bio": "", "nickname": "", "website": "", "stream_tokens": null, "feature_set_id": null, "csrf_token": null, "date_joined": "2024-03-18 23:20:13", "mapbox_access_tokens": null, "has_password": null, "username": "riat24", "email": null, "is_active": null, "readonly": null, "is_dash_creator": null, "dash_created_count": null, "is_chart_creator": null, "charts_created_count": null } }, { "creation_time": "2024-03-21T00:14:39.337625Z", "comments": { "results": [], "count": 0 }, "parented": true, "embed_url": "https://chart-studio.plotly.com/~4conner/3.embed", "fid": "4conner:3", "filename": "Plot 3", "filetype": "plot", "img_url": "https://storage.googleapis.com/plotly-prod-images/4conner/3/9_52JDPHZ1BFXAA0QJDFW8XLQV2YHGVE.png", "image_urls": { "default": "https://storage.googleapis.com/plotly-prod-images/4conner/3/2_S5KG1RQP4ZHB2E8AAMLJUWMAOFIQ8Q.png", "block-thumb": "https://storage.googleapis.com/plotly-prod-images/4conner/3/8_IRJ6KUNCV5GLY5WA62F0E9HXK3OUJ8.png", "list-thumb": "https://storage.googleapis.com/plotly-prod-images/4conner/3/9_52JDPHZ1BFXAA0QJDFW8XLQV2YHGVE.png" }, "api_urls": { "files": "https://api.plotly.com/v2/files/4conner:3", "plots": "https://api.plotly.com/v2/plots/4conner:3", "parent": "https://api.plotly.com/v2/folders/home?user=4conner" }, "owner": "4conner", "parent": -1, "preview": "", "referencers": [], "references": [], "title": "", "views": 4, "web_url": "https://chart-studio.plotly.com/~4conner/3/", "world_readable": true, "date_modified": "2024-03-21T00:14:39.356Z", "stars": { "results": [], "count": 0 }, "collaborators": { "results": [], "count": 0 }, "subfolder_count": null, "refresh_interval": null, "organize_view_url": "https://chart-studio.plotly.com/~4conner/3/", "current_user_permission": "read", "is_theme": null, "is_template": false, "autosize": true, "caption": "", "figure": { "data": [ { "meta": { "columnNames": { "x": "A", "y": "B" } }, "mode": "markers", "type": "scatter", "xsrc": "4conner:2:1bb1c3", "ysrc": "4conner:2:68ca48" } ], "frames": [], "layout": { "title": { "text": "Aluminium" }, "xaxis": { "type": "linear", "range": [ 0.09071090047393365, 0.21428909952606634 ], "title": { "text": "Mass of Al (g)" }, "autorange": true }, "yaxis": { "type": "linear", "range": [ 124.29447852760737, 315.70552147239266 ], "title": { "text": "Volume of H2 Released (mL)" }, "autorange": true }, "autosize": true, "template": { "data": { "bar": [ { "type": "bar", "marker": { "colorbar": { "ticks": "", "outlinewidth": 0 } } } ], "table": [ { "type": "table", "cells": { "fill": { "color": "#EBF0F8" }, "line": { "color": "white" } }, "header": { "fill": { "color": "#C8D4E3" }, "line": { "color": "white" } } } ], "carpet": [ { "type": "carpet", "aaxis": { "gridcolor": "#C8D4E3", "linecolor": "#C8D4E3", "endlinecolor": "#2a3f5f", "minorgridcolor": "#C8D4E3", "startlinecolor": "#2a3f5f" }, "baxis": { "gridcolor": "#C8D4E3", "linecolor": "#C8D4E3", "endlinecolor": "#2a3f5f", "minorgridcolor": "#C8D4E3", "startlinecolor": "#2a3f5f" } } ], "mesh3d": [ { "type": "mesh3d", "colorbar": { "ticks": "", "outlinewidth": 0 } } ], "contour": [ { "type": "contour", "colorbar": { "ticks": "", "outlinewidth": 0 }, "autocolorscale": true } ], "heatmap": [ { "type": "heatmap", "colorbar": { "ticks": "", "outlinewidth": 0 }, "autocolorscale": true } ], "scatter": [ { "type": "scatter", "marker": { "colorbar": { "ticks": "", "outlinewidth": 0 } } } ], "surface": [ { "type": "surface", "colorbar": { "ticks": "", "outlinewidth": 0 } } ], "heatmapgl": [ { "type": "heatmapgl", "colorbar": { "ticks": "", "outlinewidth": 0 } } ], "histogram": [ { "type": "histogram", "marker": { "colorbar": { "ticks": "", "outlinewidth": 0 } } } ], "parcoords": [ { "line": { "colorbar": { "ticks": "", "outlinewidth": 0 } }, "type": "parcoords" } ], "scatter3d": [ { "type": "scatter3d", "marker": { "colorbar": { "ticks": "", "outlinewidth": 0 } } } ], "scattergl": [ { "type": "scattergl", "marker": { "colorbar": { "ticks": "", "outlinewidth": 0 } } } ], "choropleth": [ { "type": "choropleth", "colorbar": { "ticks": "", "outlinewidth": 0 } } ], "scattergeo": [ { "type": "scattergeo", "marker": { "colorbar": { "ticks": "", "outlinewidth": 0 } } } ], "histogram2d": [ { "type": "histogram2d", "colorbar": { "ticks": "", "outlinewidth": 0 }, "autocolorscale": true } ], "scatterpolar": [ { "type": "scatterpolar", "marker": { "colorbar": { "ticks": "", "outlinewidth": 0 } } } ], "contourcarpet": [ { "type": "contourcarpet", "colorbar": { "ticks": "", "outlinewidth": 0 } } ], "scattercarpet": [ { "type": "scattercarpet", "marker": { "colorbar": { "ticks": "", "outlinewidth": 0 } } } ], "scattermapbox": [ { "type": "scattermapbox", "marker": { "colorbar": { "ticks": "", "outlinewidth": 0 } } } ], "scatterpolargl": [ { "type": "scatterpolargl", "marker": { "colorbar": { "ticks": "", "outlinewidth": 0 } } } ], "scatterternary": [ { "type": "scatterternary", "marker": { "colorbar": { "ticks": "", "outlinewidth": 0 } } } ], "histogram2dcontour": [ { "type": "histogram2dcontour", "colorbar": { "ticks": "", "outlinewidth": 0 }, "autocolorscale": true } ] }, "layout": { "geo": { "bgcolor": "white", "showland": true, "lakecolor": "white", "landcolor": "white", "showlakes": true, "subunitcolor": "#C8D4E3" }, "font": { "color": "#2a3f5f" }, "polar": { "bgcolor": "white", "radialaxis": { "ticks": "", "gridcolor": "#EBF0F8", "linecolor": "#EBF0F8" }, "angularaxis": { "ticks": "", "gridcolor": "#EBF0F8", "linecolor": "#EBF0F8" } }, "scene": { "xaxis": { "ticks": "", "gridcolor": "#DFE8F3", "gridwidth": 2, "linecolor": "#EBF0F8", "zerolinecolor": "#EBF0F8", "showbackground": true, "backgroundcolor": "white" }, "yaxis": { "ticks": "", "gridcolor": "#DFE8F3", "gridwidth": 2, "linecolor": "#EBF0F8", "zerolinecolor": "#EBF0F8", "showbackground": true, "backgroundcolor": "white" }, "zaxis": { "ticks": "", "gridcolor": "#DFE8F3", "gridwidth": 2, "linecolor": "#EBF0F8", "zerolinecolor": "#EBF0F8", "showbackground": true, "backgroundcolor": "white" } }, "title": { "x": 0.05 }, "xaxis": { "ticks": "", "gridcolor": "#EBF0F8", "linecolor": "#EBF0F8", "automargin": true, "zerolinecolor": "#EBF0F8", "zerolinewidth": 2 }, "yaxis": { "ticks": "", "gridcolor": "#EBF0F8", "linecolor": "#EBF0F8", "automargin": true, "zerolinecolor": "#EBF0F8", "zerolinewidth": 2 }, "ternary": { "aaxis": { "ticks": "", "gridcolor": "#DFE8F3", "linecolor": "#A2B1C6" }, "baxis": { "ticks": "", "gridcolor": "#DFE8F3", "linecolor": "#A2B1C6" }, "caxis": { "ticks": "", "gridcolor": "#DFE8F3", "linecolor": "#A2B1C6" }, "bgcolor": "white" }, "colorway": [ "#636efa", "#EF553B", "#00cc96", "#ab63fa", "#19d3f3", "#e763fa", "#fecb52", "#ffa15a", "#ff6692", "#b6e880" ], "hovermode": "closest", "colorscale": { "diverging": [ [ 0, "#8e0152" ], [ 0.1, "#c51b7d" ], [ 0.2, "#de77ae" ], [ 0.3, "#f1b6da" ], [ 0.4, "#fde0ef" ], [ 0.5, "#f7f7f7" ], [ 0.6, "#e6f5d0" ], [ 0.7, "#b8e186" ], [ 0.8, "#7fbc41" ], [ 0.9, "#4d9221" ], [ 1, "#276419" ] ], "sequential": [ [ 0, "#0508b8" ], [ 0.0893854748603352, "#1910d8" ], [ 0.1787709497206704, "#3c19f0" ], [ 0.2681564245810056, "#6b1cfb" ], [ 0.3575418994413408, "#981cfd" ], [ 0.44692737430167595, "#bf1cfd" ], [ 0.5363128491620112, "#dd2bfd" ], [ 0.6256983240223464, "#f246fe" ], [ 0.7150837988826816, "#fc67fd" ], [ 0.8044692737430168, "#fe88fc" ], [ 0.8938547486033519, "#fea5fd" ], [ 0.9832402234636871, "#febefe" ], [ 1, "#fec3fe" ] ], "sequentialminus": [ [ 0, "#0508b8" ], [ 0.0893854748603352, "#1910d8" ], [ 0.1787709497206704, "#3c19f0" ], [ 0.2681564245810056, "#6b1cfb" ], [ 0.3575418994413408, "#981cfd" ], [ 0.44692737430167595, "#bf1cfd" ], [ 0.5363128491620112, "#dd2bfd" ], [ 0.6256983240223464, "#f246fe" ], [ 0.7150837988826816, "#fc67fd" ], [ 0.8044692737430168, "#fe88fc" ], [ 0.8938547486033519, "#fea5fd" ], [ 0.9832402234636871, "#febefe" ], [ 1, "#fec3fe" ] ] }, "plot_bgcolor": "white", "paper_bgcolor": "white", "shapedefaults": { "line": { "width": 0 }, "opacity": 0.4, "fillcolor": "#506784" }, "annotationdefaults": { "arrowhead": 0, "arrowcolor": "#506784", "arrowwidth": 1 } }, "themeRef": "PLOTLY_WHITE" } } }, "height": null, "width": null, "user": { "profile_url": "https://chart-studio.plotly.com/~4conner", "avatar_url": "https://storage.googleapis.com/plotly-prod-profiles/73.jpg", "background_url": "https://storage.googleapis.com/plotly-prod-profiles/bg-3.jpg", "bio": "", "nickname": "", "website": "", "stream_tokens": null, "feature_set_id": null, "csrf_token": null, "date_joined": "2024-03-20 19:27:53", "mapbox_access_tokens": null, "has_password": null, "username": "4conner", "email": null, "is_active": null, "readonly": null, "is_dash_creator": null, "dash_created_count": null, "is_chart_creator": null, "charts_created_count": null } }, { "creation_time": "2024-03-21T00:10:18.775535Z", "comments": { "results": [], "count": 0 }, "parented": true, "embed_url": "https://chart-studio.plotly.com/~mnr2299/1.embed", "fid": "mnr2299:1", "filename": "Manu Ramineni - GEO 302N Project", "filetype": "plot", "img_url": "https://storage.googleapis.com/plotly-prod-images/mnr2299/1/9_ZCIQB0DW18MMEP6BTSA455D6CILGNS.png", "image_urls": { "default": "https://storage.googleapis.com/plotly-prod-images/mnr2299/1/2_84VTRY8Y4I4DAP55JLRJLIOGXU7H0Y.png", "block-thumb": "https://storage.googleapis.com/plotly-prod-images/mnr2299/1/8_D80A0B9619N5IO2L6EP8ZYT8Z4K7XV.png", "list-thumb": "https://storage.googleapis.com/plotly-prod-images/mnr2299/1/9_ZCIQB0DW18MMEP6BTSA455D6CILGNS.png" }, "api_urls": { "files": "https://api.plotly.com/v2/files/mnr2299:1", "plots": "https://api.plotly.com/v2/plots/mnr2299:1", "parent": "https://api.plotly.com/v2/folders/home?user=mnr2299" }, "owner": "mnr2299", "parent": -1, "preview": "", "referencers": [], "references": [], "title": "", "views": 13, "web_url": "https://chart-studio.plotly.com/~mnr2299/1/", "world_readable": true, "date_modified": "2024-03-21T00:10:18.788Z", "stars": { "results": [], "count": 0 }, "collaborators": { "results": [], "count": 0 }, "subfolder_count": null, "refresh_interval": null, "organize_view_url": "https://chart-studio.plotly.com/~mnr2299/1/", "current_user_permission": "read", "is_theme": null, "is_template": false, "autosize": true, "caption": "", "figure": { "data": [ { "line": { "dash": "solid" }, "meta": { "columnNames": { "x": "A", "y": "B" } }, "mode": "lines", "name": "PM2.5 Levels at 12:30", "type": "scatter", "xsrc": "mnr2299:0:1b9432", "ysrc": "mnr2299:0:919e1d" }, { "meta": { "columnNames": { "x": "A", "y": "C" } }, "mode": "lines", "name": "PM2.5 Levels at 14:00", "type": "scatter", "xsrc": "mnr2299:0:1b9432", "ysrc": "mnr2299:0:7b1930" }, { "meta": { "columnNames": { "x": "A", "y": "D" } }, "mode": "lines", "name": "PM2.5 Levels at 17:00", "type": "scatter", "xsrc": "mnr2299:0:1b9432", "ysrc": "mnr2299:0:62d1be" }, { "line": { "dash": "dash", "width": 1 }, "meta": { "columnNames": { "x": "A", "y": "E" } }, "mode": "lines", "name": "Danger Level of PM2.5 (<a href=\"https://www.epa.gov/sites/default/files/2016-04/documents/2012_aqi_factsheet.pdf\">EPA</a>)", "type": "scatter", "xsrc": "mnr2299:0:1b9432", "ysrc": "mnr2299:0:8d5dfe", "stackgroup": null } ], "frames": [], "layout": { "title": { "text": "PM2.5 AQI Levels in February, at various times of day." }, "xaxis": { "type": "category", "range": [ 0, 29 ], "title": { "text": "Date" }, "autorange": true }, "yaxis": { "type": "linear", "range": [ -3.7222222222222223, 70.72222222222223 ], "title": { "text": "PM2.5 AQI (μg/m^3)" }, "autorange": true }, "autosize": true, "template": { "data": { "bar": [ { "type": "bar", "marker": { "colorbar": { "ticks": "", "outlinewidth": 0 } } } ], "table": [ { "type": "table", "cells": { "fill": { "color": "#EBF0F8" }, "line": { "color": "white" } }, "header": { "fill": { "color": "#C8D4E3" }, "line": { "color": "white" } } } ], "carpet": [ { "type": "carpet", "aaxis": { "gridcolor": "#C8D4E3", "linecolor": "#C8D4E3", "endlinecolor": "#2a3f5f", "minorgridcolor": "#C8D4E3", "startlinecolor": "#2a3f5f" }, "baxis": { "gridcolor": "#C8D4E3", "linecolor": "#C8D4E3", "endlinecolor": "#2a3f5f", "minorgridcolor": "#C8D4E3", "startlinecolor": "#2a3f5f" } } ], "mesh3d": [ { "type": "mesh3d", "colorbar": { "ticks": "", "outlinewidth": 0 } } ], "contour": [ { "type": "contour", "colorbar": { "ticks": "", "outlinewidth": 0 }, "autocolorscale": true } ], "heatmap": [ { "type": "heatmap", "colorbar": { "ticks": "", "outlinewidth": 0 }, "autocolorscale": true } ], "scatter": [ { "type": "scatter", "marker": { "colorbar": { "ticks": "", "outlinewidth": 0 } } } ], "surface": [ { "type": "surface", "colorbar": { "ticks": "", "outlinewidth": 0 } } ], "heatmapgl": [ { "type": "heatmapgl", "colorbar": { "ticks": "", "outlinewidth": 0 } } ], "histogram": [ { "type": "histogram", "marker": { "colorbar": { "ticks": "", "outlinewidth": 0 } } } ], "parcoords": [ { "line": { "colorbar": { "ticks": "", "outlinewidth": 0 } }, "type": "parcoords" } ], "scatter3d": [ { "type": "scatter3d", "marker": { "colorbar": { "ticks": "", "outlinewidth": 0 } } } ], "scattergl": [ { "type": "scattergl", "marker": { "colorbar": { "ticks": "", "outlinewidth": 0 } } } ], "choropleth": [ { "type": "choropleth", "colorbar": { "ticks": "", "outlinewidth": 0 } } ], "scattergeo": [ { "type": "scattergeo", "marker": { "colorbar": { "ticks": "", "outlinewidth": 0 } } } ], "histogram2d": [ { "type": "histogram2d", "colorbar": { "ticks": "", "outlinewidth": 0 }, "autocolorscale": true } ], "scatterpolar": [ { "type": "scatterpolar", "marker": { "colorbar": { "ticks": "", "outlinewidth": 0 } } } ], "contourcarpet": [ { "type": "contourcarpet", "colorbar": { "ticks": "", "outlinewidth": 0 } } ], "scattercarpet": [ { "type": "scattercarpet", "marker": { "colorbar": { "ticks": "", "outlinewidth": 0 } } } ], "scattermapbox": [ { "type": "scattermapbox", "marker": { "colorbar": { "ticks": "", "outlinewidth": 0 } } } ], "scatterpolargl": [ { "type": "scatterpolargl", "marker": { "colorbar": { "ticks": "", "outlinewidth": 0 } } } ], "scatterternary": [ { "type": "scatterternary", "marker": { "colorbar": { "ticks": "", "outlinewidth": 0 } } } ], "histogram2dcontour": [ { "type": "histogram2dcontour", "colorbar": { "ticks": "", "outlinewidth": 0 }, "autocolorscale": true } ] }, "layout": { "geo": { "bgcolor": "white", "showland": true, "lakecolor": "white", "landcolor": "white", "showlakes": true, "subunitcolor": "#C8D4E3" }, "font": { "color": "#2a3f5f" }, "polar": { "bgcolor": "white", "radialaxis": { "ticks": "", "gridcolor": "#EBF0F8", "linecolor": "#EBF0F8" }, "angularaxis": { "ticks": "", "gridcolor": "#EBF0F8", "linecolor": "#EBF0F8" } }, "scene": { "xaxis": { "ticks": "", "gridcolor": "#DFE8F3", "gridwidth": 2, "linecolor": "#EBF0F8", "zerolinecolor": "#EBF0F8", "showbackground": true, "backgroundcolor": "white" }, "yaxis": { "ticks": "", "gridcolor": "#DFE8F3", "gridwidth": 2, "linecolor": "#EBF0F8", "zerolinecolor": "#EBF0F8", "showbackground": true, "backgroundcolor": "white" }, "zaxis": { "ticks": "", "gridcolor": "#DFE8F3", "gridwidth": 2, "linecolor": "#EBF0F8", "zerolinecolor": "#EBF0F8", "showbackground": true, "backgroundcolor": "white" } }, "title": { "x": 0.05 }, "xaxis": { "ticks": "", "gridcolor": "#EBF0F8", "linecolor": "#EBF0F8", "automargin": true, "zerolinecolor": "#EBF0F8", "zerolinewidth": 2 }, "yaxis": { "ticks": "", "gridcolor": "#EBF0F8", "linecolor": "#EBF0F8", "automargin": true, "zerolinecolor": "#EBF0F8", "zerolinewidth": 2 }, "ternary": { "aaxis": { "ticks": "", "gridcolor": "#DFE8F3", "linecolor": "#A2B1C6" }, "baxis": { "ticks": "", "gridcolor": "#DFE8F3", "linecolor": "#A2B1C6" }, "caxis": { "ticks": "", "gridcolor": "#DFE8F3", "linecolor": "#A2B1C6" }, "bgcolor": "white" }, "colorway": [ "#636efa", "#EF553B", "#00cc96", "#ab63fa", "#19d3f3", "#e763fa", "#fecb52", "#ffa15a", "#ff6692", "#b6e880" ], "hovermode": "closest", "colorscale": { "diverging": [ [ 0, "#8e0152" ], [ 0.1, "#c51b7d" ], [ 0.2, "#de77ae" ], [ 0.3, "#f1b6da" ], [ 0.4, "#fde0ef" ], [ 0.5, "#f7f7f7" ], [ 0.6, "#e6f5d0" ], [ 0.7, "#b8e186" ], [ 0.8, "#7fbc41" ], [ 0.9, "#4d9221" ], [ 1, "#276419" ] ], "sequential": [ [ 0, "#0508b8" ], [ 0.0893854748603352, "#1910d8" ], [ 0.1787709497206704, "#3c19f0" ], [ 0.2681564245810056, "#6b1cfb" ], [ 0.3575418994413408, "#981cfd" ], [ 0.44692737430167595, "#bf1cfd" ], [ 0.5363128491620112, "#dd2bfd" ], [ 0.6256983240223464, "#f246fe" ], [ 0.7150837988826816, "#fc67fd" ], [ 0.8044692737430168, "#fe88fc" ], [ 0.8938547486033519, "#fea5fd" ], [ 0.9832402234636871, "#febefe" ], [ 1, "#fec3fe" ] ], "sequentialminus": [ [ 0, "#0508b8" ], [ 0.0893854748603352, "#1910d8" ], [ 0.1787709497206704, "#3c19f0" ], [ 0.2681564245810056, "#6b1cfb" ], [ 0.3575418994413408, "#981cfd" ], [ 0.44692737430167595, "#bf1cfd" ], [ 0.5363128491620112, "#dd2bfd" ], [ 0.6256983240223464, "#f246fe" ], [ 0.7150837988826816, "#fc67fd" ], [ 0.8044692737430168, "#fe88fc" ], [ 0.8938547486033519, "#fea5fd" ], [ 0.9832402234636871, "#febefe" ], [ 1, "#fec3fe" ] ] }, "plot_bgcolor": "white", "paper_bgcolor": "white", "shapedefaults": { "line": { "width": 0 }, "opacity": 0.4, "fillcolor": "#506784" }, "annotationdefaults": { "arrowhead": 0, "arrowcolor": "#506784", "arrowwidth": 1 } }, "themeRef": "PLOTLY_WHITE" } } }, "height": null, "width": null, "user": { "profile_url": "https://chart-studio.plotly.com/~mnr2299", "avatar_url": "https://storage.googleapis.com/plotly-prod-profiles/20.jpg", "background_url": "https://storage.googleapis.com/plotly-prod-profiles/bg-6.jpg", "bio": "", "nickname": "", "website": "", "stream_tokens": null, "feature_set_id": null, "csrf_token": null, "date_joined": "2024-03-21 00:09:35", "mapbox_access_tokens": null, "has_password": null, "username": "mnr2299", "email": null, "is_active": null, "readonly": null, "is_dash_creator": null, "dash_created_count": null, "is_chart_creator": null, "charts_created_count": null } } ] }
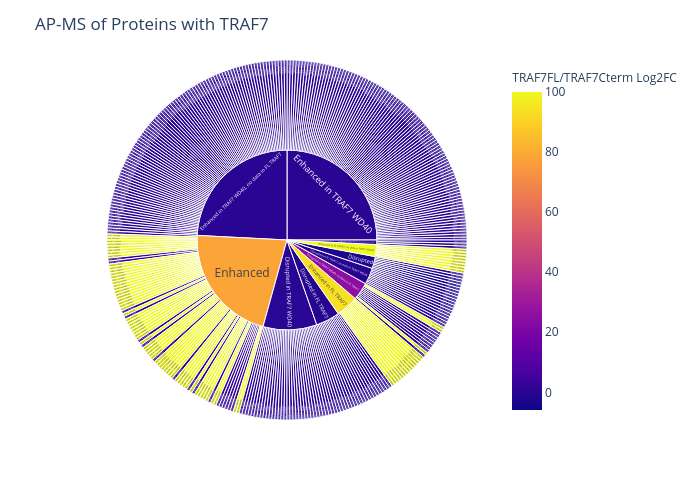
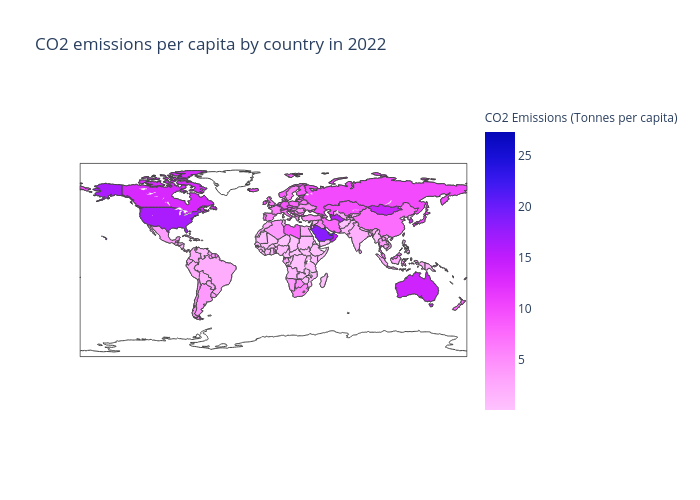