Plots List
Plots
This endpoint handles manipulation of Plotly plot files.
Reference
Authorization
Any user with or without a Plotly account may view public plots. For private plots, see authentication.
Actions
list
Listing all public plots can be done via a GET request to this endpoint.
By default, plots will be listed in order of date created. The order_by
query parameter is accepted at this endpoint. Currently, only ordering by
views is supported. It is possible to filter the plots by quality
with min_quality or max_quality as query parameter.
Example:
// GET https://api.plotly.com/v2/plots/ ---> 200

// GET https://api.plotly.com/v2/plots/?order_by=-views ---> 200

// GET https://api.plotly.com/v2/plots/?min_quality=5 ---> 200

// GET https://api.plotly.com/v2/plots/?max_quality=5 ---> 200
feed
Listing all handpicked feed plots can be done via a GET request to this endpoint. By default, plots will be listed in a random order.
Example:
// GET https://api.plotly.com/v2/plots/feed ---> 200
create
You can create new plot resources here. The only required field is 'figure'. Currently, the figure is restricted to only contain references to grid data. That is, this will fail if raw data arrays are passed in. To create and manipulate underlying grids for plots, see the grids endpoint.
Example:
// This fails because a figure field is required.
// POST https://api.plotly.com/v2/plots ---> 400 Bad Request
{}

// This fails because the figure has raw data
//POST https://api.plotly.com/v2/plots ---> 400 Bad Request
{
    "figure": {"data": [{"y": ['this', 'is', 'raw', 'data']}]}
}

// This succeeds because the figure has src keys, not raw data.
//POST https://api.plotly.com/v2/plots ---> 200 OK
{
    "figure": {"data": [{"ysrc": "sven:88:u8nd62"}]}
}
When creating a grid, you can optionally specify a source_fid to specify where a plot has come from:
- source_fid: the fid of a plot that was copied (and presumably edited) to produce this one
detail
There is a lot of meta information stored about plot files including filename, title, share_url, and content_url to name a few.
This information can only be reached with a GET to this endpoint.
Example:
// GET https://api.plotly.com/v2/plots/iheartgraphs:90
content
The contents of a plot can be downloaded via the content resource. The plot
content contains referenced grid/column data by default. If you wish to
return the raw grid/column data, the inline_data=true query must be included
in the request url. The Content-Type header will be appropriately set for the
response body.
Alternatively, you can set ?map_data=unreadable to append a mapping of
sources to data that belongs to grids which are unreadable for the
requestor. This is useful when you have read access to another users plot,
but that plot contains grid references which you don't have access to.
Examples:
// Returns referenced grid/column data
// GET https://api.plotly.com/v2/plots/iheartgraphs:90/content ---> 200 OK

// Returns full grid/column data
// GET https://api.plotly.com/v2/plots/iheartgraphs:90/content?inline_data=true ---> 200 OK

// Returns full grid/column data when requestor doesn't have permission
// to read the referenced grid.
// GET https://api.plotly.com/v2/plots/iheartgraphs:90/content?map_data=unreadable ---> 200 OK
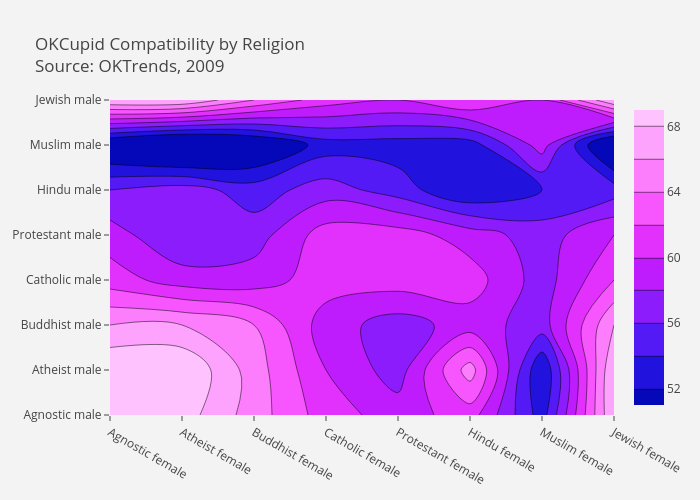
GET /v2/plots?cursor=cj0xJnA9MjAxOS0wNi0xOCswNSUzQTU4JTNBMTMuODE5OTc5JTJCMDAlM0EwMA%3D%3D&format=api
{ "next": "https://api.plot.ly/v2/plots?cursor=cD0yMDE5LTA2LTE4KzA1JTNBNTglM0EyMy42ODYwMzglMkIwMCUzQTAw&format=api", "previous": "https://api.plot.ly/v2/plots?cursor=cj0xJnA9MjAxOS0wNi0xOCswNiUzQTA0JTNBNTQuOTc4MzQwJTJCMDAlM0EwMA%3D%3D&format=api", "results": [ { "creation_time": "2019-06-18T06:04:54.978340Z", "comments": { "results": [], "count": 0 }, "parented": true, "embed_url": "https://chart-studio.plotly.com/~HannahLD/5.embed", "fid": "HannahLD:5", "filename": "Plot 5", "filetype": "plot", "img_url": "https://storage.googleapis.com/plotly-prod-images/HannahLD/5/9_4I1EI52NX5M4OCJXJ54C2A088STHVI.png", "image_urls": { "default": "https://storage.googleapis.com/plotly-prod-images/HannahLD/5/2_OC387ZBF5B0TYPHU8IVB4RM4VZG0GY.png", "block-thumb": "https://storage.googleapis.com/plotly-prod-images/HannahLD/5/8_5GKMTO278AM7Z9MUY6NYIQ0GO7XAIV.png", "list-thumb": "https://storage.googleapis.com/plotly-prod-images/HannahLD/5/9_4I1EI52NX5M4OCJXJ54C2A088STHVI.png" }, "api_urls": { "files": "https://api.plotly.com/v2/files/HannahLD:5", "plots": "https://api.plotly.com/v2/plots/HannahLD:5", "parent": "https://api.plotly.com/v2/folders/home?user=HannahLD" }, "owner": "HannahLD", "parent": -1, "preview": "", "referencers": [], "references": [], "title": "", "views": 0, "web_url": "https://chart-studio.plotly.com/~HannahLD/5/", "world_readable": true, "date_modified": "2019-06-20T03:22:35.161Z", "stars": { "results": [], "count": 0 }, "collaborators": { "results": [], "count": 0 }, "subfolder_count": null, "refresh_interval": null, "organize_view_url": "https://chart-studio.plotly.com/~HannahLD/5/", "current_user_permission": "read", "is_theme": null, "is_template": false, "autosize": true, "caption": "", "figure": { "data": [ { "line": { "width": 2 }, "meta": { "columnNames": { "y": "Bushfire Prone", "text": "Bushfire Prone" } }, "name": "Bushfire-Prone", "type": "box", "ysrc": "HannahLD:4:9c2d72", "width": 0, "jitter": 0.52, "marker": { "size": 4, "color": "rgb(158, 160, 168)" }, "boxmean": false, "notched": false, "textsrc": "HannahLD:4:9c2d72", "visible": true, "pointpos": -2, "boxpoints": "all", "hoverinfo": "x+y+name", "hovertemplate": "" }, { "meta": { "columnNames": { "y": "Not bushfire prone" } }, "mode": "markers", "name": "Not Bushfire-Prone", "type": "box", "ysrc": "HannahLD:4:409132", "jitter": 1, "marker": { "size": 4, "color": "rgb(0, 0, 0)" }, "boxmean": false, "visible": true, "pointpos": -2, "boxpoints": "all", "fillcolor": "rgba(0, 0, 0, 0.5)", "orientation": "v", "whiskerwidth": 0.37 } ], "frames": [], "layout": { "font": { "size": 15, "color": "rgb(0, 0, 0)" }, "title": { "x": 0.18, "font": { "family": "Arial" }, "text": "" }, "xaxis": { "type": "category", "range": [ -0.5045454545454545, 1.5 ], "title": { "font": { "size": 15 }, "text": "Property category" }, "domain": [ 0, 1 ], "showgrid": false, "showline": false, "autorange": true, "rangeslider": { "range": [ -0.5045924225028703, 1.5 ], "yaxis": {}, "visible": false, "autorange": true } }, "yaxis": { "side": "left", "range": [ -0.10572222222222227, 1 ], "ticks": "outside", "title": { "font": { "size": 15 }, "text": "Rate of AAV increase/decrease per month (%)" }, "anchor": "x", "domain": [ 0, 1 ], "mirror": false, "nticks": 21, "showgrid": false, "showline": true, "autorange": false, "gridwidth": 1, "linecolor": "rgb(166, 166, 168)", "showspikes": false, "zerolinecolor": "rgb(158, 160, 163)", "zerolinewidth": 1, "separatethousands": false }, "boxgap": 0.86, "margin": { "b": 67, "l": 65, "r": 500, "pad": 11 }, "boxmode": "overlay", "modebar": { "color": "rgba(255, 255, 255, 0.3)", "activecolor": "rgba(255, 255, 255, 0.7)", "orientation": "v" }, "autosize": true, "dragmode": "zoom", "template": { "data": { "bar": [ { "type": "bar", "marker": { "colorbar": { "ticks": "", "outlinewidth": 0 } } } ], "table": [ { "type": "table", "cells": { "fill": { "color": "#EBF0F8" }, "line": { "color": "white" } }, "header": { "fill": { "color": "#C8D4E3" }, "line": { "color": "white" } } } ], "carpet": [ { "type": "carpet", "aaxis": { "gridcolor": "#C8D4E3", "linecolor": "#C8D4E3", "endlinecolor": "#2a3f5f", "minorgridcolor": "#C8D4E3", "startlinecolor": "#2a3f5f" }, "baxis": { "gridcolor": "#C8D4E3", "linecolor": "#C8D4E3", "endlinecolor": "#2a3f5f", "minorgridcolor": "#C8D4E3", "startlinecolor": "#2a3f5f" } } ], "mesh3d": [ { "type": "mesh3d", "colorbar": { "ticks": "", "outlinewidth": 0 } } ], "contour": [ { "type": "contour", "colorbar": { "ticks": "", "outlinewidth": 0 }, "autocolorscale": true } ], "heatmap": [ { "type": "heatmap", "colorbar": { "ticks": "", "outlinewidth": 0 }, "autocolorscale": true } ], "scatter": [ { "type": "scatter", "marker": { "colorbar": { "ticks": "", "outlinewidth": 0 } } } ], "surface": [ { "type": "surface", "colorbar": { "ticks": "", "outlinewidth": 0 } } ], "heatmapgl": [ { "type": "heatmapgl", "colorbar": { "ticks": "", "outlinewidth": 0 } } ], "histogram": [ { "type": "histogram", "marker": { "colorbar": { "ticks": "", "outlinewidth": 0 } } } ], "parcoords": [ { "line": { "colorbar": { "ticks": "", "outlinewidth": 0 } }, "type": "parcoords" } ], "scatter3d": [ { "type": "scatter3d", "marker": { "colorbar": { "ticks": "", "outlinewidth": 0 } } } ], "scattergl": [ { "type": "scattergl", "marker": { "colorbar": { "ticks": "", "outlinewidth": 0 } } } ], "choropleth": [ { "type": "choropleth", "colorbar": { "ticks": "", "outlinewidth": 0 } } ], "scattergeo": [ { "type": "scattergeo", "marker": { "colorbar": { "ticks": "", "outlinewidth": 0 } } } ], "histogram2d": [ { "type": "histogram2d", "colorbar": { "ticks": "", "outlinewidth": 0 }, "autocolorscale": true } ], "scatterpolar": [ { "type": "scatterpolar", "marker": { "colorbar": { "ticks": "", "outlinewidth": 0 } } } ], "contourcarpet": [ { "type": "contourcarpet", "colorbar": { "ticks": "", "outlinewidth": 0 } } ], "scattercarpet": [ { "type": "scattercarpet", "marker": { "colorbar": { "ticks": "", "outlinewidth": 0 } } } ], "scattermapbox": [ { "type": "scattermapbox", "marker": { "colorbar": { "ticks": "", "outlinewidth": 0 } } } ], "scatterpolargl": [ { "type": "scatterpolargl", "marker": { "colorbar": { "ticks": "", "outlinewidth": 0 } } } ], "scatterternary": [ { "type": "scatterternary", "marker": { "colorbar": { "ticks": "", "outlinewidth": 0 } } } ], "histogram2dcontour": [ { "type": "histogram2dcontour", "colorbar": { "ticks": "", "outlinewidth": 0 }, "autocolorscale": true } ] }, "layout": { "geo": { "bgcolor": "white", "showland": true, "lakecolor": "white", "landcolor": "white", "showlakes": true, "subunitcolor": "#C8D4E3" }, "font": { "color": "#2a3f5f" }, "polar": { "bgcolor": "white", "radialaxis": { "ticks": "", "gridcolor": "#EBF0F8", "linecolor": "#EBF0F8" }, "angularaxis": { "ticks": "", "gridcolor": "#EBF0F8", "linecolor": "#EBF0F8" } }, "scene": { "xaxis": { "ticks": "", "gridcolor": "#DFE8F3", "gridwidth": 2, "linecolor": "#EBF0F8", "zerolinecolor": "#EBF0F8", "showbackground": true, "backgroundcolor": "white" }, "yaxis": { "ticks": "", "gridcolor": "#DFE8F3", "gridwidth": 2, "linecolor": "#EBF0F8", "zerolinecolor": "#EBF0F8", "showbackground": true, "backgroundcolor": "white" }, "zaxis": { "ticks": "", "gridcolor": "#DFE8F3", "gridwidth": 2, "linecolor": "#EBF0F8", "zerolinecolor": "#EBF0F8", "showbackground": true, "backgroundcolor": "white" } }, "title": { "x": 0.05 }, "xaxis": { "ticks": "", "gridcolor": "#EBF0F8", "linecolor": "#EBF0F8", "automargin": true, "zerolinecolor": "#EBF0F8", "zerolinewidth": 2 }, "yaxis": { "ticks": "", "gridcolor": "#EBF0F8", "linecolor": "#EBF0F8", "automargin": true, "zerolinecolor": "#EBF0F8", "zerolinewidth": 2 }, "ternary": { "aaxis": { "ticks": "", "gridcolor": "#DFE8F3", "linecolor": "#A2B1C6" }, "baxis": { "ticks": "", "gridcolor": "#DFE8F3", "linecolor": "#A2B1C6" }, "caxis": { "ticks": "", "gridcolor": "#DFE8F3", "linecolor": "#A2B1C6" }, "bgcolor": "white" }, "colorway": [ "#636efa", "#EF553B", "#00cc96", "#ab63fa", "#19d3f3", "#e763fa", "#fecb52", "#ffa15a", "#ff6692", "#b6e880" ], "hovermode": "closest", "colorscale": { "diverging": [ [ 0, "#8e0152" ], [ 0.1, "#c51b7d" ], [ 0.2, "#de77ae" ], [ 0.3, "#f1b6da" ], [ 0.4, "#fde0ef" ], [ 0.5, "#f7f7f7" ], [ 0.6, "#e6f5d0" ], [ 0.7, "#b8e186" ], [ 0.8, "#7fbc41" ], [ 0.9, "#4d9221" ], [ 1, "#276419" ] ], "sequential": [ [ 0, "#0508b8" ], [ 0.0893854748603352, "#1910d8" ], [ 0.1787709497206704, "#3c19f0" ], [ 0.2681564245810056, "#6b1cfb" ], [ 0.3575418994413408, "#981cfd" ], [ 0.44692737430167595, "#bf1cfd" ], [ 0.5363128491620112, "#dd2bfd" ], [ 0.6256983240223464, "#f246fe" ], [ 0.7150837988826816, "#fc67fd" ], [ 0.8044692737430168, "#fe88fc" ], [ 0.8938547486033519, "#fea5fd" ], [ 0.9832402234636871, "#febefe" ], [ 1, "#fec3fe" ] ], "sequentialminus": [ [ 0, "#0508b8" ], [ 0.0893854748603352, "#1910d8" ], [ 0.1787709497206704, "#3c19f0" ], [ 0.2681564245810056, "#6b1cfb" ], [ 0.3575418994413408, "#981cfd" ], [ 0.44692737430167595, "#bf1cfd" ], [ 0.5363128491620112, "#dd2bfd" ], [ 0.6256983240223464, "#f246fe" ], [ 0.7150837988826816, "#fc67fd" ], [ 0.8044692737430168, "#fe88fc" ], [ 0.8938547486033519, "#fea5fd" ], [ 0.9832402234636871, "#febefe" ], [ 1, "#fec3fe" ] ] }, "plot_bgcolor": "white", "paper_bgcolor": "white", "shapedefaults": { "line": { "width": 0 }, "opacity": 0.4, "fillcolor": "#506784" }, "annotationdefaults": { "arrowhead": 0, "arrowcolor": "#506784", "arrowwidth": 1 } }, "themeRef": "PLOTLY_WHITE" }, "hovermode": "closest", "showlegend": false, "boxgroupgap": 0.44 } }, "height": null, "width": null, "user": { "profile_url": "https://chart-studio.plotly.com/~HannahLD", "avatar_url": "https://storage.googleapis.com/plotly-prod-profiles/85.jpg", "background_url": "https://storage.googleapis.com/plotly-prod-profiles/bg-12.jpg", "bio": "", "nickname": "", "website": "", "stream_tokens": null, "feature_set_id": null, "csrf_token": null, "date_joined": "2019-06-17 07:37:14", "mapbox_access_tokens": null, "has_password": null, "username": "HannahLD", "email": null, "is_active": null, "readonly": null, "is_dash_creator": null, "dash_created_count": null, "is_chart_creator": null, "charts_created_count": null } }, { "creation_time": "2019-06-18T06:02:59.065606Z", "comments": { "results": [], "count": 0 }, "parented": true, "embed_url": "https://chart-studio.plotly.com/~nildenist/14.embed", "fid": "nildenist:14", "filename": "Plotly Playground 2019-06-18 09:02:55", "filetype": "plot", "img_url": "https://storage.googleapis.com/plotly-prod-images/nildenist/14/9_O83PZQ9TSM85CMHKTIH4F8VA2ISV9U.png", "image_urls": { "default": "https://storage.googleapis.com/plotly-prod-images/nildenist/14/2_DOT12303Q2L90GKJ0Z379KOPOE1DDH.png", "block-thumb": "https://storage.googleapis.com/plotly-prod-images/nildenist/14/8_BUVR9244OORDG59VU8BWPQ1Q9WQ7OD.png", "list-thumb": "https://storage.googleapis.com/plotly-prod-images/nildenist/14/9_O83PZQ9TSM85CMHKTIH4F8VA2ISV9U.png" }, "api_urls": { "files": "https://api.plotly.com/v2/files/nildenist:14", "plots": "https://api.plotly.com/v2/plots/nildenist:14", "parent": "https://api.plotly.com/v2/folders/home?user=nildenist" }, "owner": "nildenist", "parent": -1, "preview": "", "referencers": [], "references": [], "title": "{'font': {'color': '#151516'}}", "views": 0, "web_url": "https://chart-studio.plotly.com/~nildenist/14/font-color-151516/", "world_readable": true, "date_modified": "2019-06-18T06:02:59.570Z", "stars": { "results": [], "count": 0 }, "collaborators": { "results": [], "count": 0 }, "subfolder_count": null, "refresh_interval": null, "organize_view_url": "https://chart-studio.plotly.com/~nildenist/14/", "current_user_permission": "read", "is_theme": null, "is_template": null, "autosize": true, "caption": "", "figure": { "data": [ { "uid": "d75d93af-695c-43a3-a12d-a47f87f8be4f", "name": "number_of_user_id", "text": "", "type": "bar", "xsrc": "nildenist:15:813681", "ysrc": "nildenist:15:5030fa", "marker": { "line": { "color": "rgba(226, 74, 51, 1.0)", "width": 1 }, "color": "rgba(226, 74, 51, 0.6)" }, "orientation": "v" }, { "uid": "740890d4-2549-44e6-99b9-de41c12c4e38", "name": "order_month", "text": "", "type": "bar", "xsrc": "nildenist:15:813681", "ysrc": "nildenist:15:5d6929", "marker": { "line": { "color": "rgba(62, 111, 176, 1.0)", "width": 1 }, "color": "rgba(62, 111, 176, 0.6)" }, "orientation": "v" }, { "uid": "6ca51f85-be76-44c6-b5b6-0585b900e497", "name": "order_year", "text": "", "type": "bar", "xsrc": "nildenist:15:813681", "ysrc": "nildenist:15:ccae6b", "marker": { "line": { "color": "rgba(132, 118, 202, 1.0)", "width": 1 }, "color": "rgba(132, 118, 202, 0.6)" }, "orientation": "v" } ], "layout": { "title": { "font": { "color": "#151516" } }, "xaxis": { "title": { "font": { "color": "#666666" }, "text": "" }, "showgrid": true, "tickfont": { "color": "#666666" }, "gridcolor": "#F6F6F6", "zerolinecolor": "#F6F6F6" }, "yaxis": { "title": { "font": { "color": "#666666" }, "text": "" }, "showgrid": true, "tickfont": { "color": "#666666" }, "gridcolor": "#F6F6F6", "zerolinecolor": "#F6F6F6" }, "legend": { "font": { "color": "#666666" }, "bgcolor": "#FFFFFF" }, "plot_bgcolor": "#E5E5E5", "paper_bgcolor": "#FFFFFF" } }, "height": null, "width": null, "user": { "profile_url": "https://chart-studio.plotly.com/~nildenist", "avatar_url": "https://storage.googleapis.com/plotly-prod-profiles/91.jpg", "background_url": "https://storage.googleapis.com/plotly-prod-profiles/bg-13.jpg", "bio": "", "nickname": "", "website": "", "stream_tokens": null, "feature_set_id": null, "csrf_token": null, "date_joined": "2019-06-18 05:52:36", "mapbox_access_tokens": null, "has_password": null, "username": "nildenist", "email": null, "is_active": null, "readonly": null, "is_dash_creator": null, "dash_created_count": null, "is_chart_creator": null, "charts_created_count": null } }, { "creation_time": "2019-06-18T06:01:52.352938Z", "comments": { "results": [], "count": 0 }, "parented": true, "embed_url": "https://chart-studio.plotly.com/~nildenist/12.embed", "fid": "nildenist:12", "filename": "Plotly Playground 2019-06-18 09:01:49", "filetype": "plot", "img_url": "https://storage.googleapis.com/plotly-prod-images/nildenist/12/9_GITSG27K7T27Q0H9N8OBYGYX3EH39D.png", "image_urls": { "default": "https://storage.googleapis.com/plotly-prod-images/nildenist/12/2_11I3HYBT5MC0SHE5ITFMB8L6QGVY96.png", "block-thumb": "https://storage.googleapis.com/plotly-prod-images/nildenist/12/8_B5YBT0FSV7OYN1QPQG5F0GVD778MQ0.png", "list-thumb": "https://storage.googleapis.com/plotly-prod-images/nildenist/12/9_GITSG27K7T27Q0H9N8OBYGYX3EH39D.png" }, "api_urls": { "files": "https://api.plotly.com/v2/files/nildenist:12", "plots": "https://api.plotly.com/v2/plots/nildenist:12", "parent": "https://api.plotly.com/v2/folders/home?user=nildenist" }, "owner": "nildenist", "parent": -1, "preview": "", "referencers": [], "references": [], "title": "{'font': {'color': '#151516'}}", "views": 1, "web_url": "https://chart-studio.plotly.com/~nildenist/12/font-color-151516/", "world_readable": true, "date_modified": "2019-06-18T06:01:52.780Z", "stars": { "results": [], "count": 0 }, "collaborators": { "results": [], "count": 0 }, "subfolder_count": null, "refresh_interval": null, "organize_view_url": "https://chart-studio.plotly.com/~nildenist/12/", "current_user_permission": "read", "is_theme": null, "is_template": null, "autosize": true, "caption": "", "figure": { "data": [ { "uid": "dfa48913-bade-44a4-ae81-2273db6c81ea", "name": "number_of_user_id", "text": "", "type": "bar", "xsrc": "nildenist:13:87384f", "ysrc": "nildenist:13:5c5715", "marker": { "line": { "color": "rgba(226, 74, 51, 1.0)", "width": 1 }, "color": "rgba(226, 74, 51, 0.6)" }, "orientation": "v" }, { "uid": "b4d55214-2a32-42f6-8ab6-53b9ccb4638c", "name": "order_month", "text": "", "type": "bar", "xsrc": "nildenist:13:87384f", "ysrc": "nildenist:13:044e71", "marker": { "line": { "color": "rgba(62, 111, 176, 1.0)", "width": 1 }, "color": "rgba(62, 111, 176, 0.6)" }, "orientation": "v" }, { "uid": "d149a034-f8a7-41db-bfde-9310874efb0d", "name": "order_year", "text": "", "type": "bar", "xsrc": "nildenist:13:87384f", "ysrc": "nildenist:13:ae5653", "marker": { "line": { "color": "rgba(132, 118, 202, 1.0)", "width": 1 }, "color": "rgba(132, 118, 202, 0.6)" }, "orientation": "v" } ], "layout": { "title": { "font": { "color": "#151516" } }, "xaxis": { "title": { "font": { "color": "#666666" }, "text": "" }, "showgrid": true, "tickfont": { "color": "#666666" }, "gridcolor": "#F6F6F6", "zerolinecolor": "#F6F6F6" }, "yaxis": { "title": { "font": { "color": "#666666" }, "text": "" }, "showgrid": true, "tickfont": { "color": "#666666" }, "gridcolor": "#F6F6F6", "zerolinecolor": "#F6F6F6" }, "legend": { "font": { "color": "#666666" }, "bgcolor": "#FFFFFF" }, "plot_bgcolor": "#E5E5E5", "paper_bgcolor": "#FFFFFF" } }, "height": null, "width": null, "user": { "profile_url": "https://chart-studio.plotly.com/~nildenist", "avatar_url": "https://storage.googleapis.com/plotly-prod-profiles/91.jpg", "background_url": "https://storage.googleapis.com/plotly-prod-profiles/bg-13.jpg", "bio": "", "nickname": "", "website": "", "stream_tokens": null, "feature_set_id": null, "csrf_token": null, "date_joined": "2019-06-18 05:52:36", "mapbox_access_tokens": null, "has_password": null, "username": "nildenist", "email": null, "is_active": null, "readonly": null, "is_dash_creator": null, "dash_created_count": null, "is_chart_creator": null, "charts_created_count": null } }, { "creation_time": "2019-06-18T06:00:59.921823Z", "comments": { "results": [], "count": 0 }, "parented": true, "embed_url": "https://chart-studio.plotly.com/~mkbakht/2.embed", "fid": "mkbakht:2", "filename": "Plot 2", "filetype": "plot", "img_url": "https://storage.googleapis.com/plotly-prod-images/mkbakht/2/9_G777H5KM7GYKGQI54F1R0U0PUEFU6U.png", "image_urls": { "default": "https://storage.googleapis.com/plotly-prod-images/mkbakht/2/2_AH27DZWVT4GO336P5OSA1RC3SOCKL6.png", "block-thumb": "https://storage.googleapis.com/plotly-prod-images/mkbakht/2/8_TCWY1W9RG5OE7MU66QZ39ILN8A249I.png", "list-thumb": "https://storage.googleapis.com/plotly-prod-images/mkbakht/2/9_G777H5KM7GYKGQI54F1R0U0PUEFU6U.png" }, "api_urls": { "files": "https://api.plotly.com/v2/files/mkbakht:2", "plots": "https://api.plotly.com/v2/plots/mkbakht:2", "parent": "https://api.plotly.com/v2/folders/home?user=mkbakht" }, "owner": "mkbakht", "parent": -1, "preview": "", "referencers": [], "references": [], "title": "", "views": 0, "web_url": "https://chart-studio.plotly.com/~mkbakht/2/", "world_readable": true, "date_modified": "2019-06-18T06:14:04.813Z", "stars": { "results": [], "count": 0 }, "collaborators": { "results": [], "count": 0 }, "subfolder_count": null, "refresh_interval": null, "organize_view_url": "https://chart-studio.plotly.com/~mkbakht/2/", "current_user_permission": "read", "is_theme": null, "is_template": false, "autosize": true, "caption": "", "figure": { "data": [ { "uid": "19b265", "name": "cimar:199:c76973", "type": "contour", "xsrc": "mkbakht:0:c40edd", "ysrc": "mkbakht:0:54227d", "zmax": 70, "zmin": 50.2, "zsrc": "mkbakht:0:-54227d,c40edd", "zauto": false, "error_x": {}, "error_y": {}, "colorbar": {}, "contours": { "end": 68.02, "size": 2, "start": 52 }, "textfont": {}, "colorscale": [ [ 0, "rgb(12,51,131)" ], [ 0.25, "rgb(10,136,186)" ], [ 0.5, "rgb(242,211,56)" ], [ 0.75, "rgb(242,143,56)" ], [ 1, "rgb(217,30,30)" ] ], "autocolorscale": true } ], "frames": [], "layout": { "font": { "size": 12, "color": "#444", "family": "\"Open sans\", verdana, arial, sans-serif" }, "smith": false, "title": { "font": { "size": 0, "color": "", "family": "" }, "text": "OKCupid Compatibility by Religion<br>Source: <a href=\"http://blog.okcupid.com/index.php/how-races-and-religions-match-in-online-dating/\">OKTrends, 2009</a>" }, "width": 1619, "xaxis": { "type": "category", "dtick": 1, "range": [ -0.5, 7.5 ], "tick0": 0, "ticks": "outside", "title": { "font": { "size": 0, "color": "", "family": "" }, "text": "Click to enter X axis title" }, "anchor": "y", "domain": [ 0, 1 ], "mirror": false, "nticks": 0, "ticklen": 5, "position": 0, "showgrid": true, "showline": false, "tickfont": { "size": 0, "color": "", "family": "" }, "tickmode": "auto", "zeroline": true, "autorange": true, "gridcolor": "#eee", "gridwidth": 1, "linecolor": "#444", "linewidth": 1, "rangemode": "normal", "tickangle": "auto", "tickcolor": "#444", "tickwidth": 1, "overlaying": false, "showexponent": "all", "zerolinecolor": "#444", "zerolinewidth": 1, "exponentformat": "B", "showticklabels": true }, "yaxis": { "type": "category", "dtick": 1, "range": [ -0.5, 7.5 ], "tick0": 0, "ticks": "outside", "title": { "font": { "size": 0, "color": "", "family": "" }, "text": "Click to enter Y axis title" }, "anchor": "x", "domain": [ 0, 1 ], "mirror": false, "nticks": 0, "ticklen": 5, "position": 0, "showgrid": true, "showline": false, "tickfont": { "size": 0, "color": "", "family": "" }, "tickmode": "auto", "zeroline": true, "autorange": true, "gridcolor": "#eee", "gridwidth": 1, "linecolor": "#444", "linewidth": 1, "rangemode": "normal", "tickangle": "auto", "tickcolor": "#444", "tickwidth": 1, "overlaying": false, "showexponent": "all", "zerolinecolor": "#444", "zerolinewidth": 1, "exponentformat": "B", "showticklabels": true }, "bargap": 0.2, "boxgap": 0.3, "height": 629, "legend": { "font": { "size": 0, "color": "", "family": "" }, "bgcolor": "#fff", "traceorder": "normal", "bordercolor": "#444", "borderwidth": 0 }, "margin": { "b": 80, "l": 100, "r": 80, "t": 100, "pad": 0, "autoexpand": true }, "barmode": "group", "boxmode": "overlay", "autosize": true, "dragmode": "zoom", "template": { "data": { "bar": [ { "type": "bar", "marker": { "colorbar": { "ticks": "", "outlinewidth": 0 } } } ], "table": [ { "type": "table", "cells": { "fill": { "color": "#EBF0F8" }, "line": { "color": "white" } }, "header": { "fill": { "color": "#C8D4E3" }, "line": { "color": "white" } } } ], "carpet": [ { "type": "carpet", "aaxis": { "gridcolor": "#C8D4E3", "linecolor": "#C8D4E3", "endlinecolor": "#2a3f5f", "minorgridcolor": "#C8D4E3", "startlinecolor": "#2a3f5f" }, "baxis": { "gridcolor": "#C8D4E3", "linecolor": "#C8D4E3", "endlinecolor": "#2a3f5f", "minorgridcolor": "#C8D4E3", "startlinecolor": "#2a3f5f" } } ], "mesh3d": [ { "type": "mesh3d", "colorbar": { "ticks": "", "outlinewidth": 0 } } ], "contour": [ { "type": "contour", "colorbar": { "ticks": "", "outlinewidth": 0 }, "autocolorscale": true } ], "heatmap": [ { "type": "heatmap", "colorbar": { "ticks": "", "outlinewidth": 0 }, "autocolorscale": true } ], "scatter": [ { "type": "scatter", "marker": { "colorbar": { "ticks": "", "outlinewidth": 0 } } } ], "surface": [ { "type": "surface", "colorbar": { "ticks": "", "outlinewidth": 0 } } ], "heatmapgl": [ { "type": "heatmapgl", "colorbar": { "ticks": "", "outlinewidth": 0 } } ], "histogram": [ { "type": "histogram", "marker": { "colorbar": { "ticks": "", "outlinewidth": 0 } } } ], "parcoords": [ { "line": { "colorbar": { "ticks": "", "outlinewidth": 0 } }, "type": "parcoords" } ], "scatter3d": [ { "type": "scatter3d", "marker": { "colorbar": { "ticks": "", "outlinewidth": 0 } } } ], "scattergl": [ { "type": "scattergl", "marker": { "colorbar": { "ticks": "", "outlinewidth": 0 } } } ], "choropleth": [ { "type": "choropleth", "colorbar": { "ticks": "", "outlinewidth": 0 } } ], "scattergeo": [ { "type": "scattergeo", "marker": { "colorbar": { "ticks": "", "outlinewidth": 0 } } } ], "histogram2d": [ { "type": "histogram2d", "colorbar": { "ticks": "", "outlinewidth": 0 }, "autocolorscale": true } ], "scatterpolar": [ { "type": "scatterpolar", "marker": { "colorbar": { "ticks": "", "outlinewidth": 0 } } } ], "contourcarpet": [ { "type": "contourcarpet", "colorbar": { "ticks": "", "outlinewidth": 0 } } ], "scattercarpet": [ { "type": "scattercarpet", "marker": { "colorbar": { "ticks": "", "outlinewidth": 0 } } } ], "scattermapbox": [ { "type": "scattermapbox", "marker": { "colorbar": { "ticks": "", "outlinewidth": 0 } } } ], "scatterpolargl": [ { "type": "scatterpolargl", "marker": { "colorbar": { "ticks": "", "outlinewidth": 0 } } } ], "scatterternary": [ { "type": "scatterternary", "marker": { "colorbar": { "ticks": "", "outlinewidth": 0 } } } ], "histogram2dcontour": [ { "type": "histogram2dcontour", "colorbar": { "ticks": "", "outlinewidth": 0 }, "autocolorscale": true } ] }, "layout": { "geo": { "bgcolor": "white", "showland": true, "lakecolor": "white", "landcolor": "white", "showlakes": true, "subunitcolor": "#C8D4E3" }, "font": { "color": "#2a3f5f" }, "polar": { "bgcolor": "white", "radialaxis": { "ticks": "", "gridcolor": "#EBF0F8", "linecolor": "#EBF0F8" }, "angularaxis": { "ticks": "", "gridcolor": "#EBF0F8", "linecolor": "#EBF0F8" } }, "scene": { "xaxis": { "ticks": "", "gridcolor": "#DFE8F3", "gridwidth": 2, "linecolor": "#EBF0F8", "zerolinecolor": "#EBF0F8", "showbackground": true, "backgroundcolor": "white" }, "yaxis": { "ticks": "", "gridcolor": "#DFE8F3", "gridwidth": 2, "linecolor": "#EBF0F8", "zerolinecolor": "#EBF0F8", "showbackground": true, "backgroundcolor": "white" }, "zaxis": { "ticks": "", "gridcolor": "#DFE8F3", "gridwidth": 2, "linecolor": "#EBF0F8", "zerolinecolor": "#EBF0F8", "showbackground": true, "backgroundcolor": "white" } }, "title": { "x": 0.05 }, "xaxis": { "ticks": "", "gridcolor": "#EBF0F8", "linecolor": "#EBF0F8", "automargin": true, "zerolinecolor": "#EBF0F8", "zerolinewidth": 2 }, "yaxis": { "ticks": "", "gridcolor": "#EBF0F8", "linecolor": "#EBF0F8", "automargin": true, "zerolinecolor": "#EBF0F8", "zerolinewidth": 2 }, "ternary": { "aaxis": { "ticks": "", "gridcolor": "#DFE8F3", "linecolor": "#A2B1C6" }, "baxis": { "ticks": "", "gridcolor": "#DFE8F3", "linecolor": "#A2B1C6" }, "caxis": { "ticks": "", "gridcolor": "#DFE8F3", "linecolor": "#A2B1C6" }, "bgcolor": "white" }, "colorway": [ "#636efa", "#EF553B", "#00cc96", "#ab63fa", "#19d3f3", "#e763fa", "#fecb52", "#ffa15a", "#ff6692", "#b6e880" ], "hovermode": "closest", "colorscale": { "diverging": [ [ 0, "#8e0152" ], [ 0.1, "#c51b7d" ], [ 0.2, "#de77ae" ], [ 0.3, "#f1b6da" ], [ 0.4, "#fde0ef" ], [ 0.5, "#f7f7f7" ], [ 0.6, "#e6f5d0" ], [ 0.7, "#b8e186" ], [ 0.8, "#7fbc41" ], [ 0.9, "#4d9221" ], [ 1, "#276419" ] ], "sequential": [ [ 0, "#0508b8" ], [ 0.0893854748603352, "#1910d8" ], [ 0.1787709497206704, "#3c19f0" ], [ 0.2681564245810056, "#6b1cfb" ], [ 0.3575418994413408, "#981cfd" ], [ 0.44692737430167595, "#bf1cfd" ], [ 0.5363128491620112, "#dd2bfd" ], [ 0.6256983240223464, "#f246fe" ], [ 0.7150837988826816, "#fc67fd" ], [ 0.8044692737430168, "#fe88fc" ], [ 0.8938547486033519, "#fea5fd" ], [ 0.9832402234636871, "#febefe" ], [ 1, "#fec3fe" ] ], "sequentialminus": [ [ 0, "#0508b8" ], [ 0.0893854748603352, "#1910d8" ], [ 0.1787709497206704, "#3c19f0" ], [ 0.2681564245810056, "#6b1cfb" ], [ 0.3575418994413408, "#981cfd" ], [ 0.44692737430167595, "#bf1cfd" ], [ 0.5363128491620112, "#dd2bfd" ], [ 0.6256983240223464, "#f246fe" ], [ 0.7150837988826816, "#fc67fd" ], [ 0.8044692737430168, "#fe88fc" ], [ 0.8938547486033519, "#fea5fd" ], [ 0.9832402234636871, "#febefe" ], [ 1, "#fec3fe" ] ] }, "plot_bgcolor": "white", "paper_bgcolor": "white", "shapedefaults": { "line": { "width": 0 }, "opacity": 0.4, "fillcolor": "#506784" }, "annotationdefaults": { "arrowhead": 0, "arrowcolor": "#506784", "arrowwidth": 1 } }, "themeRef": "PLOTLY_WHITE" }, "hovermode": "x", "separators": ".,", "showlegend": false, "bargroupgap": 0, "boxgroupgap": 0.3, "hidesources": false, "plot_bgcolor": "rgb(243, 243, 243)", "paper_bgcolor": "rgb(243, 243, 243)" } }, "height": 629, "width": 1619, "user": { "profile_url": "https://chart-studio.plotly.com/~mkbakht", "avatar_url": "https://storage.googleapis.com/plotly-prod-profiles/82.jpg", "background_url": "https://storage.googleapis.com/plotly-prod-profiles/bg-10.jpg", "bio": "", "nickname": "", "website": "", "stream_tokens": null, "feature_set_id": null, "csrf_token": null, "date_joined": "2019-06-18 06:00:46", "mapbox_access_tokens": null, "has_password": null, "username": "mkbakht", "email": null, "is_active": null, "readonly": null, "is_dash_creator": null, "dash_created_count": null, "is_chart_creator": null, "charts_created_count": null } }, { "creation_time": "2019-06-18T06:00:12.871715Z", "comments": { "results": [], "count": 0 }, "parented": true, "embed_url": "https://chart-studio.plotly.com/~nildenist/10.embed", "fid": "nildenist:10", "filename": "Plotly Playground 2019-06-18 09:00:09", "filetype": "plot", "img_url": "https://storage.googleapis.com/plotly-prod-images/nildenist/10/9_1276DJU7AXO648S3YZE2FLSEL1POAK.png", "image_urls": { "default": "https://storage.googleapis.com/plotly-prod-images/nildenist/10/2_OHN67L6LYZ5S39T2BQ2FX9QJZFCSUO.png", "block-thumb": "https://storage.googleapis.com/plotly-prod-images/nildenist/10/8_DM4AZW462OHUZV8FQIC0DJ9XS4DV36.png", "list-thumb": "https://storage.googleapis.com/plotly-prod-images/nildenist/10/9_1276DJU7AXO648S3YZE2FLSEL1POAK.png" }, "api_urls": { "files": "https://api.plotly.com/v2/files/nildenist:10", "plots": "https://api.plotly.com/v2/plots/nildenist:10", "parent": "https://api.plotly.com/v2/folders/home?user=nildenist" }, "owner": "nildenist", "parent": -1, "preview": "", "referencers": [], "references": [], "title": "{'font': {'color': '#151516'}}", "views": 0, "web_url": "https://chart-studio.plotly.com/~nildenist/10/font-color-151516/", "world_readable": true, "date_modified": "2019-06-18T06:00:13.479Z", "stars": { "results": [], "count": 0 }, "collaborators": { "results": [], "count": 0 }, "subfolder_count": null, "refresh_interval": null, "organize_view_url": "https://chart-studio.plotly.com/~nildenist/10/", "current_user_permission": "read", "is_theme": null, "is_template": null, "autosize": true, "caption": "", "figure": { "data": [ { "uid": "23ba7c9b-411b-4a29-a11a-20b40ebef926", "name": "number_of_user_id", "text": "", "type": "bar", "xsrc": "nildenist:11:be33af", "ysrc": "nildenist:11:21abda", "marker": { "line": { "color": "rgba(226, 74, 51, 1.0)", "width": 1 }, "color": "rgba(226, 74, 51, 0.6)" }, "orientation": "v" }, { "uid": "0522e426-dfe9-469f-8b72-6d83025cb6fd", "name": "order_month", "text": "", "type": "bar", "xsrc": "nildenist:11:be33af", "ysrc": "nildenist:11:9b0ebf", "marker": { "line": { "color": "rgba(62, 111, 176, 1.0)", "width": 1 }, "color": "rgba(62, 111, 176, 0.6)" }, "orientation": "v" }, { "uid": "1dcf5304-30c5-4d6c-a132-c3cada5625de", "name": "order_year", "text": "", "type": "bar", "xsrc": "nildenist:11:be33af", "ysrc": "nildenist:11:c92fdc", "marker": { "line": { "color": "rgba(132, 118, 202, 1.0)", "width": 1 }, "color": "rgba(132, 118, 202, 0.6)" }, "orientation": "v" } ], "layout": { "title": { "font": { "color": "#151516" } }, "xaxis": { "title": { "font": { "color": "#666666" }, "text": "" }, "showgrid": true, "tickfont": { "color": "#666666" }, "gridcolor": "#F6F6F6", "zerolinecolor": "#F6F6F6" }, "yaxis": { "title": { "font": { "color": "#666666" }, "text": "" }, "showgrid": true, "tickfont": { "color": "#666666" }, "gridcolor": "#F6F6F6", "zerolinecolor": "#F6F6F6" }, "legend": { "font": { "color": "#666666" }, "bgcolor": "#FFFFFF" }, "plot_bgcolor": "#E5E5E5", "paper_bgcolor": "#FFFFFF" } }, "height": null, "width": null, "user": { "profile_url": "https://chart-studio.plotly.com/~nildenist", "avatar_url": "https://storage.googleapis.com/plotly-prod-profiles/91.jpg", "background_url": "https://storage.googleapis.com/plotly-prod-profiles/bg-13.jpg", "bio": "", "nickname": "", "website": "", "stream_tokens": null, "feature_set_id": null, "csrf_token": null, "date_joined": "2019-06-18 05:52:36", "mapbox_access_tokens": null, "has_password": null, "username": "nildenist", "email": null, "is_active": null, "readonly": null, "is_dash_creator": null, "dash_created_count": null, "is_chart_creator": null, "charts_created_count": null } }, { "creation_time": "2019-06-18T05:59:55.583008Z", "comments": { "results": [], "count": 0 }, "parented": true, "embed_url": "https://chart-studio.plotly.com/~nildenist/8.embed", "fid": "nildenist:8", "filename": "Plotly Playground 2019-06-18 08:59:51", "filetype": "plot", "img_url": "https://storage.googleapis.com/plotly-prod-images/nildenist/8/9_JIL0T4IO4H9IK09M0G67WXHDFBA9PZ.png", "image_urls": { "default": "https://storage.googleapis.com/plotly-prod-images/nildenist/8/2_CWHB1LVEWWRBIG59YSEUR25MX1P79X.png", "block-thumb": "https://storage.googleapis.com/plotly-prod-images/nildenist/8/8_0I91ROIPJAZBE3RLDKW3Y7COX8P02J.png", "list-thumb": "https://storage.googleapis.com/plotly-prod-images/nildenist/8/9_JIL0T4IO4H9IK09M0G67WXHDFBA9PZ.png" }, "api_urls": { "files": "https://api.plotly.com/v2/files/nildenist:8", "plots": "https://api.plotly.com/v2/plots/nildenist:8", "parent": "https://api.plotly.com/v2/folders/home?user=nildenist" }, "owner": "nildenist", "parent": -1, "preview": "", "referencers": [], "references": [], "title": "{'font': {'color': '#151516'}}", "views": 3, "web_url": "https://chart-studio.plotly.com/~nildenist/8/font-color-151516/", "world_readable": true, "date_modified": "2019-06-18T05:59:56.039Z", "stars": { "results": [], "count": 0 }, "collaborators": { "results": [], "count": 0 }, "subfolder_count": null, "refresh_interval": null, "organize_view_url": "https://chart-studio.plotly.com/~nildenist/8/", "current_user_permission": "read", "is_theme": null, "is_template": null, "autosize": true, "caption": "", "figure": { "data": [ { "uid": "0dcfbcb2-b83a-40db-bc42-a72f8840fa24", "name": "order_month", "text": "", "type": "bar", "xsrc": "nildenist:9:6722a5", "ysrc": "nildenist:9:b9ef8f", "marker": { "line": { "color": "rgba(226, 74, 51, 1.0)", "width": 1 }, "color": "rgba(226, 74, 51, 0.6)" }, "orientation": "v" } ], "layout": { "title": { "font": { "color": "#151516" } }, "xaxis": { "title": { "font": { "color": "#666666" }, "text": "" }, "showgrid": true, "tickfont": { "color": "#666666" }, "gridcolor": "#F6F6F6", "zerolinecolor": "#F6F6F6" }, "yaxis": { "title": { "font": { "color": "#666666" }, "text": "" }, "showgrid": true, "tickfont": { "color": "#666666" }, "gridcolor": "#F6F6F6", "zerolinecolor": "#F6F6F6" }, "legend": { "font": { "color": "#666666" }, "bgcolor": "#FFFFFF" }, "plot_bgcolor": "#E5E5E5", "paper_bgcolor": "#FFFFFF" } }, "height": null, "width": null, "user": { "profile_url": "https://chart-studio.plotly.com/~nildenist", "avatar_url": "https://storage.googleapis.com/plotly-prod-profiles/91.jpg", "background_url": "https://storage.googleapis.com/plotly-prod-profiles/bg-13.jpg", "bio": "", "nickname": "", "website": "", "stream_tokens": null, "feature_set_id": null, "csrf_token": null, "date_joined": "2019-06-18 05:52:36", "mapbox_access_tokens": null, "has_password": null, "username": "nildenist", "email": null, "is_active": null, "readonly": null, "is_dash_creator": null, "dash_created_count": null, "is_chart_creator": null, "charts_created_count": null } }, { "creation_time": "2019-06-18T05:59:44.131905Z", "comments": { "results": [], "count": 0 }, "parented": true, "embed_url": "https://chart-studio.plotly.com/~nildenist/7.embed", "fid": "nildenist:7", "filename": "Plotly Playground 2019-06-18 08:59:40", "filetype": "plot", "img_url": "https://storage.googleapis.com/plotly-prod-images/nildenist/7/9_UATB3B0WO7D2SEXOQK2Z7X4VEAQSPI.png", "image_urls": { "default": "https://storage.googleapis.com/plotly-prod-images/nildenist/7/2_LV2RY43I9X6RT5E168TGOGWXWJ48FA.png", "block-thumb": "https://storage.googleapis.com/plotly-prod-images/nildenist/7/8_YVBC69D32EL0N01ZU0RVNSRIJRB3UI.png", "list-thumb": "https://storage.googleapis.com/plotly-prod-images/nildenist/7/9_UATB3B0WO7D2SEXOQK2Z7X4VEAQSPI.png" }, "api_urls": { "files": "https://api.plotly.com/v2/files/nildenist:7", "plots": "https://api.plotly.com/v2/plots/nildenist:7", "parent": "https://api.plotly.com/v2/folders/home?user=nildenist" }, "owner": "nildenist", "parent": -1, "preview": "", "referencers": [], "references": [], "title": "{'font': {'color': '#151516'}}", "views": 0, "web_url": "https://chart-studio.plotly.com/~nildenist/7/font-color-151516/", "world_readable": true, "date_modified": "2019-06-18T05:59:44.145Z", "stars": { "results": [], "count": 0 }, "collaborators": { "results": [], "count": 0 }, "subfolder_count": null, "refresh_interval": null, "organize_view_url": "https://chart-studio.plotly.com/~nildenist/7/", "current_user_permission": "read", "is_theme": null, "is_template": null, "autosize": true, "caption": "", "figure": { "data": [ { "x": [], "y": [], "uid": "862b1ab2-32ba-4c66-8e93-240f32662a69", "name": "order_month", "text": "", "type": "bar", "marker": { "line": { "color": "rgba(226, 74, 51, 1.0)", "width": 1 }, "color": "rgba(226, 74, 51, 0.6)" }, "orientation": "v" } ], "layout": { "title": { "font": { "color": "#151516" } }, "xaxis": { "title": { "font": { "color": "#666666" }, "text": "" }, "showgrid": true, "tickfont": { "color": "#666666" }, "gridcolor": "#F6F6F6", "zerolinecolor": "#F6F6F6" }, "yaxis": { "title": { "font": { "color": "#666666" }, "text": "" }, "showgrid": true, "tickfont": { "color": "#666666" }, "gridcolor": "#F6F6F6", "zerolinecolor": "#F6F6F6" }, "legend": { "font": { "color": "#666666" }, "bgcolor": "#FFFFFF" }, "plot_bgcolor": "#E5E5E5", "paper_bgcolor": "#FFFFFF" } }, "height": null, "width": null, "user": { "profile_url": "https://chart-studio.plotly.com/~nildenist", "avatar_url": "https://storage.googleapis.com/plotly-prod-profiles/91.jpg", "background_url": "https://storage.googleapis.com/plotly-prod-profiles/bg-13.jpg", "bio": "", "nickname": "", "website": "", "stream_tokens": null, "feature_set_id": null, "csrf_token": null, "date_joined": "2019-06-18 05:52:36", "mapbox_access_tokens": null, "has_password": null, "username": "nildenist", "email": null, "is_active": null, "readonly": null, "is_dash_creator": null, "dash_created_count": null, "is_chart_creator": null, "charts_created_count": null } }, { "creation_time": "2019-06-18T05:59:14.312508Z", "comments": { "results": [], "count": 0 }, "parented": true, "embed_url": "https://chart-studio.plotly.com/~nildenist/6.embed", "fid": "nildenist:6", "filename": "Plotly Playground 2019-06-18 08:59:11", "filetype": "plot", "img_url": "https://storage.googleapis.com/plotly-prod-images/nildenist/6/9_ZE2H4H0XWMSJZ72L295XARHFRFN1QT.png", "image_urls": { "default": "https://storage.googleapis.com/plotly-prod-images/nildenist/6/2_HJTSXBH9JDJ1F8Q1XX5FXYXO1N9VKE.png", "block-thumb": "https://storage.googleapis.com/plotly-prod-images/nildenist/6/8_H31GE102A2HJQWY5IXSWZHR3USX6KW.png", "list-thumb": "https://storage.googleapis.com/plotly-prod-images/nildenist/6/9_ZE2H4H0XWMSJZ72L295XARHFRFN1QT.png" }, "api_urls": { "files": "https://api.plotly.com/v2/files/nildenist:6", "plots": "https://api.plotly.com/v2/plots/nildenist:6", "parent": "https://api.plotly.com/v2/folders/home?user=nildenist" }, "owner": "nildenist", "parent": -1, "preview": "", "referencers": [], "references": [], "title": "{'font': {'color': '#151516'}}", "views": 4, "web_url": "https://chart-studio.plotly.com/~nildenist/6/font-color-151516/", "world_readable": true, "date_modified": "2019-06-18T05:59:14.326Z", "stars": { "results": [], "count": 0 }, "collaborators": { "results": [], "count": 0 }, "subfolder_count": null, "refresh_interval": null, "organize_view_url": "https://chart-studio.plotly.com/~nildenist/6/", "current_user_permission": "read", "is_theme": null, "is_template": null, "autosize": true, "caption": "", "figure": { "data": [ { "x": [], "y": [], "uid": "a2880241-9baa-483e-b0f6-de8e49cabae5", "name": "order_year", "text": "", "type": "bar", "marker": { "line": { "color": "rgba(226, 74, 51, 1.0)", "width": 1 }, "color": "rgba(226, 74, 51, 0.6)" }, "orientation": "v" } ], "layout": { "title": { "font": { "color": "#151516" } }, "xaxis": { "title": { "font": { "color": "#666666" }, "text": "" }, "showgrid": true, "tickfont": { "color": "#666666" }, "gridcolor": "#F6F6F6", "zerolinecolor": "#F6F6F6" }, "yaxis": { "title": { "font": { "color": "#666666" }, "text": "" }, "showgrid": true, "tickfont": { "color": "#666666" }, "gridcolor": "#F6F6F6", "zerolinecolor": "#F6F6F6" }, "legend": { "font": { "color": "#666666" }, "bgcolor": "#FFFFFF" }, "plot_bgcolor": "#E5E5E5", "paper_bgcolor": "#FFFFFF" } }, "height": null, "width": null, "user": { "profile_url": "https://chart-studio.plotly.com/~nildenist", "avatar_url": "https://storage.googleapis.com/plotly-prod-profiles/91.jpg", "background_url": "https://storage.googleapis.com/plotly-prod-profiles/bg-13.jpg", "bio": "", "nickname": "", "website": "", "stream_tokens": null, "feature_set_id": null, "csrf_token": null, "date_joined": "2019-06-18 05:52:36", "mapbox_access_tokens": null, "has_password": null, "username": "nildenist", "email": null, "is_active": null, "readonly": null, "is_dash_creator": null, "dash_created_count": null, "is_chart_creator": null, "charts_created_count": null } }, { "creation_time": "2019-06-18T05:58:47.007118Z", "comments": { "results": [], "count": 0 }, "parented": true, "embed_url": "https://chart-studio.plotly.com/~nildenist/4.embed", "fid": "nildenist:4", "filename": "Plotly Playground 2019-06-18 08:58:43", "filetype": "plot", "img_url": "https://storage.googleapis.com/plotly-prod-images/nildenist/4/9_S47709AR1PKPH3CIEQD6J0K3RSIJJM.png", "image_urls": { "default": "https://storage.googleapis.com/plotly-prod-images/nildenist/4/2_YKR4DO9FB93JVRLQJ84QFQDXWF0QAV.png", "block-thumb": "https://storage.googleapis.com/plotly-prod-images/nildenist/4/8_2537SABOI8ZKIG4Z52EHX813QDK6AS.png", "list-thumb": "https://storage.googleapis.com/plotly-prod-images/nildenist/4/9_S47709AR1PKPH3CIEQD6J0K3RSIJJM.png" }, "api_urls": { "files": "https://api.plotly.com/v2/files/nildenist:4", "plots": "https://api.plotly.com/v2/plots/nildenist:4", "parent": "https://api.plotly.com/v2/folders/home?user=nildenist" }, "owner": "nildenist", "parent": -1, "preview": "", "referencers": [], "references": [], "title": "{'font': {'color': '#151516'}}", "views": 0, "web_url": "https://chart-studio.plotly.com/~nildenist/4/font-color-151516/", "world_readable": true, "date_modified": "2019-06-18T05:58:47.478Z", "stars": { "results": [], "count": 0 }, "collaborators": { "results": [], "count": 0 }, "subfolder_count": null, "refresh_interval": null, "organize_view_url": "https://chart-studio.plotly.com/~nildenist/4/", "current_user_permission": "read", "is_theme": null, "is_template": null, "autosize": true, "caption": "", "figure": { "data": [ { "uid": "d96a01de-3669-47d3-b8c8-9da6fc3c2abe", "name": "number_of_user_id", "text": "", "type": "bar", "xsrc": "nildenist:5:b28711", "ysrc": "nildenist:5:37093b", "marker": { "line": { "color": "rgba(226, 74, 51, 1.0)", "width": 1 }, "color": "rgba(226, 74, 51, 0.6)" }, "orientation": "v" }, { "uid": "ad8c3fcd-86e7-4732-b462-e60f89f6f2b8", "name": "order_month", "text": "", "type": "bar", "xsrc": "nildenist:5:b28711", "ysrc": "nildenist:5:f20993", "marker": { "line": { "color": "rgba(62, 111, 176, 1.0)", "width": 1 }, "color": "rgba(62, 111, 176, 0.6)" }, "orientation": "v" }, { "uid": "da4e824c-7b1b-4fd4-9fdf-29383c8d6b5a", "name": "order_year", "text": "", "type": "bar", "xsrc": "nildenist:5:b28711", "ysrc": "nildenist:5:474ab9", "marker": { "line": { "color": "rgba(132, 118, 202, 1.0)", "width": 1 }, "color": "rgba(132, 118, 202, 0.6)" }, "orientation": "v" } ], "layout": { "title": { "font": { "color": "#151516" } }, "xaxis": { "title": { "font": { "color": "#666666" }, "text": "" }, "showgrid": true, "tickfont": { "color": "#666666" }, "gridcolor": "#F6F6F6", "zerolinecolor": "#F6F6F6" }, "yaxis": { "title": { "font": { "color": "#666666" }, "text": "" }, "showgrid": true, "tickfont": { "color": "#666666" }, "gridcolor": "#F6F6F6", "zerolinecolor": "#F6F6F6" }, "legend": { "font": { "color": "#666666" }, "bgcolor": "#FFFFFF" }, "plot_bgcolor": "#E5E5E5", "paper_bgcolor": "#FFFFFF" } }, "height": null, "width": null, "user": { "profile_url": "https://chart-studio.plotly.com/~nildenist", "avatar_url": "https://storage.googleapis.com/plotly-prod-profiles/91.jpg", "background_url": "https://storage.googleapis.com/plotly-prod-profiles/bg-13.jpg", "bio": "", "nickname": "", "website": "", "stream_tokens": null, "feature_set_id": null, "csrf_token": null, "date_joined": "2019-06-18 05:52:36", "mapbox_access_tokens": null, "has_password": null, "username": "nildenist", "email": null, "is_active": null, "readonly": null, "is_dash_creator": null, "dash_created_count": null, "is_chart_creator": null, "charts_created_count": null } }, { "creation_time": "2019-06-18T05:58:23.686038Z", "comments": { "results": [], "count": 0 }, "parented": true, "embed_url": "https://chart-studio.plotly.com/~nildenist/2.embed", "fid": "nildenist:2", "filename": "Plotly Playground 2019-06-18 08:58:20", "filetype": "plot", "img_url": "https://storage.googleapis.com/plotly-prod-images/nildenist/2/9_IM9YKR828UIB7L2LL7XJABATPYXGBB.png", "image_urls": { "default": "https://storage.googleapis.com/plotly-prod-images/nildenist/2/2_LQXID0YIYBQEIX77QXOSMVJJBO66IP.png", "block-thumb": "https://storage.googleapis.com/plotly-prod-images/nildenist/2/8_KOPSZRFD4JNMI1QTKQCVQOHOHH8Z4S.png", "list-thumb": "https://storage.googleapis.com/plotly-prod-images/nildenist/2/9_IM9YKR828UIB7L2LL7XJABATPYXGBB.png" }, "api_urls": { "files": "https://api.plotly.com/v2/files/nildenist:2", "plots": "https://api.plotly.com/v2/plots/nildenist:2", "parent": "https://api.plotly.com/v2/folders/home?user=nildenist" }, "owner": "nildenist", "parent": -1, "preview": "", "referencers": [], "references": [], "title": "{'font': {'color': '#151516'}}", "views": 0, "web_url": "https://chart-studio.plotly.com/~nildenist/2/font-color-151516/", "world_readable": true, "date_modified": "2019-06-18T05:58:24.193Z", "stars": { "results": [], "count": 0 }, "collaborators": { "results": [], "count": 0 }, "subfolder_count": null, "refresh_interval": null, "organize_view_url": "https://chart-studio.plotly.com/~nildenist/2/", "current_user_permission": "read", "is_theme": null, "is_template": null, "autosize": true, "caption": "", "figure": { "data": [ { "uid": "24893705-379b-41fe-93c5-338fe54ce6ea", "name": "order_year", "text": "", "type": "bar", "xsrc": "nildenist:3:a8b905", "ysrc": "nildenist:3:617a2a", "marker": { "line": { "color": "rgba(226, 74, 51, 1.0)", "width": 1 }, "color": "rgba(226, 74, 51, 0.6)" }, "orientation": "v" } ], "layout": { "title": { "font": { "color": "#151516" } }, "xaxis": { "title": { "font": { "color": "#666666" }, "text": "" }, "showgrid": true, "tickfont": { "color": "#666666" }, "gridcolor": "#F6F6F6", "zerolinecolor": "#F6F6F6" }, "yaxis": { "title": { "font": { "color": "#666666" }, "text": "" }, "showgrid": true, "tickfont": { "color": "#666666" }, "gridcolor": "#F6F6F6", "zerolinecolor": "#F6F6F6" }, "legend": { "font": { "color": "#666666" }, "bgcolor": "#FFFFFF" }, "plot_bgcolor": "#E5E5E5", "paper_bgcolor": "#FFFFFF" } }, "height": null, "width": null, "user": { "profile_url": "https://chart-studio.plotly.com/~nildenist", "avatar_url": "https://storage.googleapis.com/plotly-prod-profiles/91.jpg", "background_url": "https://storage.googleapis.com/plotly-prod-profiles/bg-13.jpg", "bio": "", "nickname": "", "website": "", "stream_tokens": null, "feature_set_id": null, "csrf_token": null, "date_joined": "2019-06-18 05:52:36", "mapbox_access_tokens": null, "has_password": null, "username": "nildenist", "email": null, "is_active": null, "readonly": null, "is_dash_creator": null, "dash_created_count": null, "is_chart_creator": null, "charts_created_count": null } } ] }