Plots List
Plots
This endpoint handles manipulation of Plotly plot files.
Reference
Authorization
Any user with or without a Plotly account may view public plots. For private plots, see authentication.
Actions
list
Listing all public plots can be done via a GET request to this endpoint.
By default, plots will be listed in order of date created. The order_by
query parameter is accepted at this endpoint. Currently, only ordering by
views is supported. It is possible to filter the plots by quality
with min_quality or max_quality as query parameter.
Example:
// GET https://api.plotly.com/v2/plots/ ---> 200

// GET https://api.plotly.com/v2/plots/?order_by=-views ---> 200

// GET https://api.plotly.com/v2/plots/?min_quality=5 ---> 200

// GET https://api.plotly.com/v2/plots/?max_quality=5 ---> 200
feed
Listing all handpicked feed plots can be done via a GET request to this endpoint. By default, plots will be listed in a random order.
Example:
// GET https://api.plotly.com/v2/plots/feed ---> 200
create
You can create new plot resources here. The only required field is 'figure'. Currently, the figure is restricted to only contain references to grid data. That is, this will fail if raw data arrays are passed in. To create and manipulate underlying grids for plots, see the grids endpoint.
Example:
// This fails because a figure field is required.
// POST https://api.plotly.com/v2/plots ---> 400 Bad Request
{}

// This fails because the figure has raw data
//POST https://api.plotly.com/v2/plots ---> 400 Bad Request
{
    "figure": {"data": [{"y": ['this', 'is', 'raw', 'data']}]}
}

// This succeeds because the figure has src keys, not raw data.
//POST https://api.plotly.com/v2/plots ---> 200 OK
{
    "figure": {"data": [{"ysrc": "sven:88:u8nd62"}]}
}
When creating a grid, you can optionally specify a source_fid to specify where a plot has come from:
- source_fid: the fid of a plot that was copied (and presumably edited) to produce this one
detail
There is a lot of meta information stored about plot files including filename, title, share_url, and content_url to name a few.
This information can only be reached with a GET to this endpoint.
Example:
// GET https://api.plotly.com/v2/plots/iheartgraphs:90
content
The contents of a plot can be downloaded via the content resource. The plot
content contains referenced grid/column data by default. If you wish to
return the raw grid/column data, the inline_data=true query must be included
in the request url. The Content-Type header will be appropriately set for the
response body.
Alternatively, you can set ?map_data=unreadable to append a mapping of
sources to data that belongs to grids which are unreadable for the
requestor. This is useful when you have read access to another users plot,
but that plot contains grid references which you don't have access to.
Examples:
// Returns referenced grid/column data
// GET https://api.plotly.com/v2/plots/iheartgraphs:90/content ---> 200 OK

// Returns full grid/column data
// GET https://api.plotly.com/v2/plots/iheartgraphs:90/content?inline_data=true ---> 200 OK

// Returns full grid/column data when requestor doesn't have permission
// to read the referenced grid.
// GET https://api.plotly.com/v2/plots/iheartgraphs:90/content?map_data=unreadable ---> 200 OK
GET /v2/plots?cursor=cj0xJnA9MjAxOS0wNi0xNysxOSUzQTMzJTNBMTIuNzU1NDAyJTJCMDAlM0EwMA%3D%3D&format=api
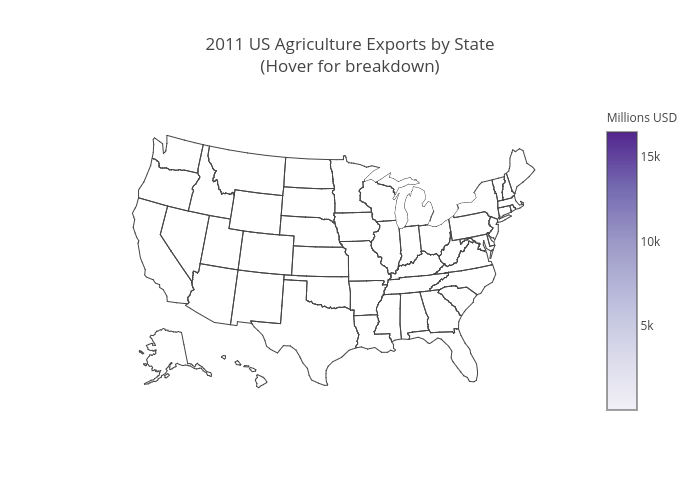
{ "next": "https://api.plot.ly/v2/plots?cursor=cD0yMDE5LTA2LTE3KzE5JTNBMzMlM0E0My44Nzk5MTAlMkIwMCUzQTAw&format=api", "previous": "https://api.plot.ly/v2/plots?cursor=cj0xJnA9MjAxOS0wNi0xNysxOSUzQTM2JTNBNDEuMzg1Mzg1JTJCMDAlM0EwMA%3D%3D&format=api", "results": [ { "creation_time": "2019-06-17T19:36:41.385385Z", "comments": { "results": [], "count": 0 }, "parented": true, "embed_url": "https://chart-studio.plotly.com/~roger_nogueira/10.embed", "fid": "roger_nogueira:10", "filename": "Matriz de Confusão", "filetype": "plot", "img_url": "https://storage.googleapis.com/plotly-prod-images/roger_nogueira/10/9_YSDD8P0GYR1UWS52M8FW5SRR2CNGQB.png", "image_urls": { "default": "https://storage.googleapis.com/plotly-prod-images/roger_nogueira/10/2_7G0O3M7GMKIBO7V4PKJVQXZ63AWWD6.png", "block-thumb": "https://storage.googleapis.com/plotly-prod-images/roger_nogueira/10/8_BJ5LD6ZAQDL0LR6R4JFEDYUHCGEYT5.png", "list-thumb": "https://storage.googleapis.com/plotly-prod-images/roger_nogueira/10/9_YSDD8P0GYR1UWS52M8FW5SRR2CNGQB.png" }, "api_urls": { "files": "https://api.plotly.com/v2/files/roger_nogueira:10", "plots": "https://api.plotly.com/v2/plots/roger_nogueira:10", "parent": "https://api.plotly.com/v2/folders/home?user=roger_nogueira" }, "owner": "roger_nogueira", "parent": -1, "preview": "", "referencers": [], "references": [], "title": "", "views": 0, "web_url": "https://chart-studio.plotly.com/~roger_nogueira/10/", "world_readable": true, "date_modified": "2019-06-24T12:54:59.581Z", "stars": { "results": [], "count": 0 }, "collaborators": { "results": [], "count": 0 }, "subfolder_count": null, "refresh_interval": null, "organize_view_url": "https://chart-studio.plotly.com/~roger_nogueira/10/", "current_user_permission": "read", "is_theme": null, "is_template": null, "autosize": true, "caption": "", "figure": { "data": [ { "uid": "421fe098-8004-4279-b6ad-9a41120ed634", "type": "table", "cells": { "fill": { "color": "#EDFAFF" }, "line": { "color": "#7D7F80" }, "alignsrc": "roger_nogueira:11:a9f544", "valuessrc": "roger_nogueira:11:-a9f544,8d44cf" }, "header": { "fill": { "color": "#a1c3d1" }, "line": { "color": "#7D7F80" }, "alignsrc": "roger_nogueira:11:a9f544", "valuessrc": "roger_nogueira:11:8d44cf" } } ], "layout": { "width": 500, "height": 900 } }, "height": 900, "width": 500, "user": { "profile_url": "https://chart-studio.plotly.com/~roger_nogueira", "avatar_url": "https://storage.googleapis.com/plotly-prod-profiles/88.jpg", "background_url": "https://storage.googleapis.com/plotly-prod-profiles/bg-12.jpg", "bio": "", "nickname": "", "website": "", "stream_tokens": null, "feature_set_id": null, "csrf_token": null, "date_joined": "2019-02-28 16:46:58", "mapbox_access_tokens": null, "has_password": null, "username": "roger_nogueira", "email": null, "is_active": null, "readonly": null, "is_dash_creator": null, "dash_created_count": null, "is_chart_creator": null, "charts_created_count": null } }, { "creation_time": "2019-06-17T19:35:50.243259Z", "comments": { "results": [], "count": 0 }, "parented": true, "embed_url": "https://chart-studio.plotly.com/~octobers/0.embed", "fid": "octobers:0", "filename": "simple-3d-scatter", "filetype": "plot", "img_url": "https://storage.googleapis.com/plotly-prod-images/octobers/0/9_P5URWIFMZSJOUQ7SHPOKQW0EEG0J52.png", "image_urls": { "default": "https://storage.googleapis.com/plotly-prod-images/octobers/0/2_0UEV1CAZY0F8RSNZFHV62TC3XWROOO.png", "block-thumb": "https://storage.googleapis.com/plotly-prod-images/octobers/0/8_MFSRO95805KLWT74ACDSDLMKYCSFAR.png", "list-thumb": "https://storage.googleapis.com/plotly-prod-images/octobers/0/9_P5URWIFMZSJOUQ7SHPOKQW0EEG0J52.png" }, "api_urls": { "files": "https://api.plotly.com/v2/files/octobers:0", "plots": "https://api.plotly.com/v2/plots/octobers:0", "parent": "https://api.plotly.com/v2/folders/home?user=octobers" }, "owner": "octobers", "parent": -1, "preview": "", "referencers": [], "references": [], "title": "", "views": 0, "web_url": "https://chart-studio.plotly.com/~octobers/0/", "world_readable": true, "date_modified": "2019-06-17T19:55:02.911Z", "stars": { "results": [], "count": 0 }, "collaborators": { "results": [], "count": 0 }, "subfolder_count": null, "refresh_interval": null, "organize_view_url": "https://chart-studio.plotly.com/~octobers/0/", "current_user_permission": "read", "is_theme": null, "is_template": null, "autosize": true, "caption": "", "figure": { "data": [ { "uid": "468c7bb0-815a-495f-b102-301f1b0cdfb7", "mode": "markers", "type": "scatter3d", "xsrc": "octobers:1:9202b0", "ysrc": "octobers:1:70edb9", "zsrc": "octobers:1:a6e210", "marker": { "line": { "width": 0.3, "colorsrc": "octobers:1:5678f5", "colorscale": "BlueRed" }, "size": 2, "opacity": 0.8 } } ], "layout": { "margin": { "b": 0, "l": 0, "r": 0, "t": 0 } } }, "height": null, "width": null, "user": { "profile_url": "https://chart-studio.plotly.com/~octobers", "avatar_url": "https://storage.googleapis.com/plotly-prod-profiles/72.jpg", "background_url": "https://storage.googleapis.com/plotly-prod-profiles/bg-11.jpg", "bio": "", "nickname": "", "website": "", "stream_tokens": null, "feature_set_id": null, "csrf_token": null, "date_joined": "2019-06-17 19:33:32", "mapbox_access_tokens": null, "has_password": null, "username": "octobers", "email": null, "is_active": null, "readonly": null, "is_dash_creator": null, "dash_created_count": null, "is_chart_creator": null, "charts_created_count": null } }, { "creation_time": "2019-06-17T19:35:46.983800Z", "comments": { "results": [], "count": 0 }, "parented": true, "embed_url": "https://chart-studio.plotly.com/~jmunozu/2.embed", "fid": "jmunozu:2", "filename": "d3-cloropleth-map", "filetype": "plot", "img_url": "https://storage.googleapis.com/plotly-prod-images/jmunozu/2/9_TT6A2SN7ELOL5XPI6N7RF9L78K0WY4.png", "image_urls": { "default": "https://storage.googleapis.com/plotly-prod-images/jmunozu/2/2_PLSA5OFHX68XMG3K7PGLVRK34FSR2P.png", "block-thumb": "https://storage.googleapis.com/plotly-prod-images/jmunozu/2/8_UACZEPA0AZFES9N1CMNAB42QDOOUQ0.png", "list-thumb": "https://storage.googleapis.com/plotly-prod-images/jmunozu/2/9_TT6A2SN7ELOL5XPI6N7RF9L78K0WY4.png" }, "api_urls": { "files": "https://api.plotly.com/v2/files/jmunozu:2", "plots": "https://api.plotly.com/v2/plots/jmunozu:2", "parent": "https://api.plotly.com/v2/folders/home?user=jmunozu" }, "owner": "jmunozu", "parent": -1, "preview": "", "referencers": [], "references": [], "title": "2011 US Agriculture Exports by State<br>(Hover for breakdown)", "views": 11, "web_url": "https://chart-studio.plotly.com/~jmunozu/2/_2011-us-agriculture-exports-by-state-hover-for-breakdown/", "world_readable": true, "date_modified": "2019-06-17T19:47:03.957Z", "stars": { "results": [], "count": 0 }, "collaborators": { "results": [], "count": 0 }, "subfolder_count": null, "refresh_interval": null, "organize_view_url": "https://chart-studio.plotly.com/~jmunozu/2/", "current_user_permission": "read", "is_theme": null, "is_template": null, "autosize": true, "caption": "", "figure": { "data": [ { "uid": "bc73b06e-6e60-4a70-bef9-ab0cf6d8b6c0", "type": "choropleth", "zsrc": "jmunozu:3:998617", "marker": { "line": { "color": "rgb(255,255,255)", "width": 2 } }, "textsrc": "jmunozu:3:5d1866", "colorbar": { "title": { "text": "Millions USD" } }, "colorscale": [ [ 0.0, "rgb(242,240,247)" ], [ 0.2, "rgb(218,218,235)" ], [ 0.4, "rgb(188,189,220)" ], [ 0.6, "rgb(158,154,200)" ], [ 0.8, "rgb(117,107,177)" ], [ 1.0, "rgb(84,39,143)" ] ], "locationssrc": "jmunozu:3:2a1fcf", "autocolorscale": false } ], "layout": { "geo": { "lakecolor": "rgb(255, 255, 255)", "showlakes": true, "projection": { "type": "albers usa" } }, "title": { "text": "2011 US Agriculture Exports by State<br>(Hover for breakdown)" } } }, "height": null, "width": null, "user": { "profile_url": "https://chart-studio.plotly.com/~jmunozu", "avatar_url": "https://storage.googleapis.com/plotly-prod-profiles/91.jpg", "background_url": "https://storage.googleapis.com/plotly-prod-profiles/bg-2.jpg", "bio": "", "nickname": "", "website": "", "stream_tokens": null, "feature_set_id": null, "csrf_token": null, "date_joined": "2019-06-17 13:36:30", "mapbox_access_tokens": null, "has_password": null, "username": "jmunozu", "email": null, "is_active": null, "readonly": null, "is_dash_creator": null, "dash_created_count": null, "is_chart_creator": null, "charts_created_count": null } }, { "creation_time": "2019-06-17T19:35:42.840666Z", "comments": { "results": [], "count": 0 }, "parented": true, "embed_url": "https://chart-studio.plotly.com/~andres.cely/24.embed", "fid": "andres.cely:24", "filename": "pie4", "filetype": "plot", "img_url": "https://storage.googleapis.com/plotly-prod-images/andres.cely/24/9_K4O150S6RKPNFCIW660GP17Q7V9SMW.png", "image_urls": { "default": "https://storage.googleapis.com/plotly-prod-images/andres.cely/24/2_ZP4BBOP1U9277O1CTK3HMSJ9QY7AZ9.png", "block-thumb": "https://storage.googleapis.com/plotly-prod-images/andres.cely/24/8_N0ZSE19HB385HQPNG64VG2S61XL0E5.png", "list-thumb": "https://storage.googleapis.com/plotly-prod-images/andres.cely/24/9_K4O150S6RKPNFCIW660GP17Q7V9SMW.png" }, "api_urls": { "files": "https://api.plotly.com/v2/files/andres.cely:24", "plots": "https://api.plotly.com/v2/plots/andres.cely:24", "parent": "https://api.plotly.com/v2/folders/home?user=andres.cely" }, "owner": "andres.cely", "parent": -1, "preview": "", "referencers": [], "references": [], "title": "", "views": 31, "web_url": "https://chart-studio.plotly.com/~andres.cely/24/", "world_readable": true, "date_modified": "2019-06-17T20:25:12.253Z", "stars": { "results": [], "count": 0 }, "collaborators": { "results": [], "count": 0 }, "subfolder_count": null, "refresh_interval": null, "organize_view_url": "https://chart-studio.plotly.com/~andres.cely/24/", "current_user_permission": "read", "is_theme": null, "is_template": null, "autosize": true, "caption": "", "figure": { "data": [ { "uid": "3848b46f-d58f-4a7d-bd25-d481849366ff", "type": "pie", "labelssrc": "andres.cely:25:f3d090", "valuessrc": "andres.cely:25:9503f1" } ], "layout": {} }, "height": null, "width": null, "user": { "profile_url": "https://chart-studio.plotly.com/~andres.cely", "avatar_url": "https://storage.googleapis.com/plotly-prod-profiles/66.jpg", "background_url": "https://storage.googleapis.com/plotly-prod-profiles/bg-2.jpg", "bio": "", "nickname": "", "website": "", "stream_tokens": null, "feature_set_id": null, "csrf_token": null, "date_joined": "2018-06-20 14:38:17", "mapbox_access_tokens": null, "has_password": null, "username": "andres.cely", "email": null, "is_active": null, "readonly": null, "is_dash_creator": null, "dash_created_count": null, "is_chart_creator": null, "charts_created_count": null } }, { "creation_time": "2019-06-17T19:35:23.459969Z", "comments": { "results": [], "count": 0 }, "parented": true, "embed_url": "https://chart-studio.plotly.com/~clkickEDHEC/22.embed", "fid": "clkickEDHEC:22", "filename": "plot from API (11)", "filetype": "plot", "img_url": "https://storage.googleapis.com/plotly-prod-images/clkickEDHEC/22/9_P0U4OMXJGDT322XZ3K0G686VWZXUZZ.png", "image_urls": { "default": "https://storage.googleapis.com/plotly-prod-images/clkickEDHEC/22/2_PP62OMJVSUV5HAHGBTR1A65QFC6Q0U.png", "block-thumb": "https://storage.googleapis.com/plotly-prod-images/clkickEDHEC/22/8_F6OGTPGWXEHOKNXO02T1RI8MO4VC1E.png", "list-thumb": "https://storage.googleapis.com/plotly-prod-images/clkickEDHEC/22/9_P0U4OMXJGDT322XZ3K0G686VWZXUZZ.png" }, "api_urls": { "files": "https://api.plotly.com/v2/files/clkickEDHEC:22", "plots": "https://api.plotly.com/v2/plots/clkickEDHEC:22", "parent": "https://api.plotly.com/v2/folders/home?user=clkickEDHEC" }, "owner": "clkickEDHEC", "parent": -1, "preview": "", "referencers": [], "references": [], "title": "Refugee movement through Manus and Nauru, via <a href='http://www.bryanbrussee.com/sankey.html'>Bryan Brussee</a>", "views": 1, "web_url": "https://chart-studio.plotly.com/~clkickEDHEC/22/refugee-movement-through-manus-and-nauru-via-bryan-brussee/", "world_readable": true, "date_modified": "2019-06-17T19:35:23.988Z", "stars": { "results": [], "count": 0 }, "collaborators": { "results": [], "count": 0 }, "subfolder_count": null, "refresh_interval": null, "organize_view_url": "https://chart-studio.plotly.com/~clkickEDHEC/22/", "current_user_permission": "read", "is_theme": null, "is_template": null, "autosize": true, "caption": "", "figure": { "data": [ { "link": { "valuesrc": "clkickEDHEC:23:264886", "sourcesrc": "clkickEDHEC:23:224a2f", "targetsrc": "clkickEDHEC:23:68073d" }, "node": { "pad": 10, "line": { "color": "black", "width": 0.5 }, "colorsrc": "clkickEDHEC:23:5a7ad6", "labelsrc": "clkickEDHEC:23:5205ed", "thickness": 30 }, "type": "sankey", "domain": { "x": [ 0, 1 ], "y": [ 0, 1 ] }, "orientation": "h", "valueformat": ".0f" } ], "layout": { "font": { "size": 10 }, "title": "Refugee movement through Manus and Nauru, via <a href='http://www.bryanbrussee.com/sankey.html'>Bryan Brussee</a>", "width": 950, "height": 772 } }, "height": 772, "width": 950, "user": { "profile_url": "https://chart-studio.plotly.com/~clkickEDHEC", "avatar_url": "https://storage.googleapis.com/plotly-prod-profiles/37.jpg", "background_url": "https://storage.googleapis.com/plotly-prod-profiles/bg-10.jpg", "bio": "", "nickname": "", "website": "", "stream_tokens": null, "feature_set_id": null, "csrf_token": null, "date_joined": "2019-06-17 16:58:19", "mapbox_access_tokens": null, "has_password": null, "username": "clkickEDHEC", "email": null, "is_active": null, "readonly": null, "is_dash_creator": null, "dash_created_count": null, "is_chart_creator": null, "charts_created_count": null } }, { "creation_time": "2019-06-17T19:34:50.163312Z", "comments": { "results": [], "count": 0 }, "parented": true, "embed_url": "https://chart-studio.plotly.com/~andres.cely/22.embed", "fid": "andres.cely:22", "filename": "pie2", "filetype": "plot", "img_url": "https://storage.googleapis.com/plotly-prod-images/andres.cely/22/9_Q4VAW47066HPKHJLY82VYOQ7EWGRD8.png", "image_urls": { "default": "https://storage.googleapis.com/plotly-prod-images/andres.cely/22/2_3H0AA5N3MUMIWLWNEFGKL029RR66Y5.png", "block-thumb": "https://api.plotly.com/v2/files/andres.cely:22/image?image_name=block-thumb", "list-thumb": "https://storage.googleapis.com/plotly-prod-images/andres.cely/22/9_Q4VAW47066HPKHJLY82VYOQ7EWGRD8.png" }, "api_urls": { "files": "https://api.plotly.com/v2/files/andres.cely:22", "plots": "https://api.plotly.com/v2/plots/andres.cely:22", "parent": "https://api.plotly.com/v2/folders/home?user=andres.cely" }, "owner": "andres.cely", "parent": -1, "preview": "", "referencers": [], "references": [], "title": "", "views": 10, "web_url": "https://chart-studio.plotly.com/~andres.cely/22/", "world_readable": true, "date_modified": "2019-06-17T19:34:50.595Z", "stars": { "results": [], "count": 0 }, "collaborators": { "results": [], "count": 0 }, "subfolder_count": null, "refresh_interval": null, "organize_view_url": "https://chart-studio.plotly.com/~andres.cely/22/", "current_user_permission": "read", "is_theme": null, "is_template": null, "autosize": true, "caption": "", "figure": { "data": [ { "uid": "884eb0c3-9e37-4e81-98b5-a9378368c37e", "type": "pie", "labelssrc": "andres.cely:23:bd4605", "valuessrc": "andres.cely:23:ee23f9" } ], "layout": {} }, "height": null, "width": null, "user": { "profile_url": "https://chart-studio.plotly.com/~andres.cely", "avatar_url": "https://storage.googleapis.com/plotly-prod-profiles/66.jpg", "background_url": "https://storage.googleapis.com/plotly-prod-profiles/bg-2.jpg", "bio": "", "nickname": "", "website": "", "stream_tokens": null, "feature_set_id": null, "csrf_token": null, "date_joined": "2018-06-20 14:38:17", "mapbox_access_tokens": null, "has_password": null, "username": "andres.cely", "email": null, "is_active": null, "readonly": null, "is_dash_creator": null, "dash_created_count": null, "is_chart_creator": null, "charts_created_count": null } }, { "creation_time": "2019-06-17T19:34:13.749748Z", "comments": { "results": [], "count": 0 }, "parented": true, "embed_url": "https://chart-studio.plotly.com/~clkickEDHEC/20.embed", "fid": "clkickEDHEC:20", "filename": "plot from API (10)", "filetype": "plot", "img_url": "https://api.plotly.com/v2/files/clkickEDHEC:20/image?image_name=list-thumb", "image_urls": { "default": "https://storage.googleapis.com/plotly-prod-images/clkickEDHEC/20/2_TWUEXB9ZDSY1X0ZVJ7P4CAEM3HDJP4.png", "block-thumb": "https://storage.googleapis.com/plotly-prod-images/clkickEDHEC/20/8_GX49OTGDB0JRDYZILAEN2XE31MPYML.png", "list-thumb": "https://api.plotly.com/v2/files/clkickEDHEC:20/image?image_name=list-thumb" }, "api_urls": { "files": "https://api.plotly.com/v2/files/clkickEDHEC:20", "plots": "https://api.plotly.com/v2/plots/clkickEDHEC:20", "parent": "https://api.plotly.com/v2/folders/home?user=clkickEDHEC" }, "owner": "clkickEDHEC", "parent": -1, "preview": "", "referencers": [], "references": [], "title": "Refugee movement through Manus and Nauru, via <a href='http://www.bryanbrussee.com/sankey.html'>Bryan Brussee</a>", "views": 1, "web_url": "https://chart-studio.plotly.com/~clkickEDHEC/20/refugee-movement-through-manus-and-nauru-via-bryan-brussee/", "world_readable": true, "date_modified": "2019-06-17T19:34:14.188Z", "stars": { "results": [], "count": 0 }, "collaborators": { "results": [], "count": 0 }, "subfolder_count": null, "refresh_interval": null, "organize_view_url": "https://chart-studio.plotly.com/~clkickEDHEC/20/", "current_user_permission": "read", "is_theme": null, "is_template": null, "autosize": true, "caption": "", "figure": { "data": [ { "link": { "valuesrc": "clkickEDHEC:21:c4ff5b", "sourcesrc": "clkickEDHEC:21:65fc50", "targetsrc": "clkickEDHEC:21:b12513" }, "node": { "pad": 10, "line": { "color": "black", "width": 0.5 }, "colorsrc": "clkickEDHEC:21:9014e9", "labelsrc": "clkickEDHEC:21:b4d4a8", "thickness": 30 }, "type": "sankey", "domain": { "x": [ 0, 1 ], "y": [ 0, 1 ] }, "orientation": "h", "valueformat": ".0f" } ], "layout": { "font": { "size": 10 }, "title": "Refugee movement through Manus and Nauru, via <a href='http://www.bryanbrussee.com/sankey.html'>Bryan Brussee</a>", "width": 950, "height": 772 } }, "height": 772, "width": 950, "user": { "profile_url": "https://chart-studio.plotly.com/~clkickEDHEC", "avatar_url": "https://storage.googleapis.com/plotly-prod-profiles/37.jpg", "background_url": "https://storage.googleapis.com/plotly-prod-profiles/bg-10.jpg", "bio": "", "nickname": "", "website": "", "stream_tokens": null, "feature_set_id": null, "csrf_token": null, "date_joined": "2019-06-17 16:58:19", "mapbox_access_tokens": null, "has_password": null, "username": "clkickEDHEC", "email": null, "is_active": null, "readonly": null, "is_dash_creator": null, "dash_created_count": null, "is_chart_creator": null, "charts_created_count": null } }, { "creation_time": "2019-06-17T19:34:02.207176Z", "comments": { "results": [], "count": 0 }, "parented": true, "embed_url": "https://chart-studio.plotly.com/~jwrchen/5580.embed", "fid": "jwrchen:5580", "filename": "test_volume_Heart", "filetype": "plot", "img_url": "https://storage.googleapis.com/plotly-prod-images/jwrchen/5580/9_RZYPQGR9ISD1JX1H2974RDQCTRTJI5.png", "image_urls": { "default": "https://storage.googleapis.com/plotly-prod-images/jwrchen/5580/2_L9TYVMT6J7FRBHF1IZ3W2CZMNT12EY.png", "block-thumb": "https://storage.googleapis.com/plotly-prod-images/jwrchen/5580/8_VNAQCVEO7OO904357JFBUZJH41KJOG.png", "list-thumb": "https://storage.googleapis.com/plotly-prod-images/jwrchen/5580/9_RZYPQGR9ISD1JX1H2974RDQCTRTJI5.png" }, "api_urls": { "files": "https://api.plotly.com/v2/files/jwrchen:5580", "plots": "https://api.plotly.com/v2/plots/jwrchen:5580", "parent": "https://api.plotly.com/v2/folders/jwrchen:4142" }, "owner": "jwrchen", "parent": 4142, "preview": "", "referencers": [], "references": [], "title": "", "views": 1, "web_url": "https://chart-studio.plotly.com/~jwrchen/5580/", "world_readable": true, "date_modified": "2019-07-28T20:53:08.972Z", "stars": { "results": [], "count": 0 }, "collaborators": { "results": [], "count": 0 }, "subfolder_count": null, "refresh_interval": null, "organize_view_url": "https://chart-studio.plotly.com/~jwrchen/5580/", "current_user_permission": "read", "is_theme": null, "is_template": null, "autosize": true, "caption": "", "figure": { "data": [ { "base": 0, "text": "Date Reviewed: Mar 2019<br />No.Orders: 1", "type": "bar", "xsrc": "jwrchen:5579:7bd912", "ysrc": "jwrchen:5579:0d0759", "frame": null, "width": 0.9, "xaxis": "x", "yaxis": "y", "marker": { "line": { "color": "rgba(19,83,0,1)", "width": 1.88976377952756 }, "color": "rgba(19,83,0,1)", "autocolorscale": false }, "hoverinfo": "text", "showlegend": false, "orientation": "v" }, { "base": 0, "text": "Date Reviewed: Apr 2019<br />No.Orders: 0", "type": "bar", "xsrc": "jwrchen:5579:0eab92", "ysrc": "jwrchen:5579:c1cd00", "frame": null, "width": 0.9, "xaxis": "x", "yaxis": "y", "marker": { "line": { "color": "rgba(255,138,244,1)", "width": 1.88976377952756 }, "color": "rgba(255,138,244,1)", "autocolorscale": false }, "hoverinfo": "text", "showlegend": false, "orientation": "v" }, { "mode": "markers", "name": "red", "type": "scatter", "xsrc": "jwrchen:5579:9e2580", "ysrc": "jwrchen:5579:593f41", "frame": null, "xaxis": "x", "yaxis": "y", "marker": { "line": { "color": "rgba(248,118,109,1)", "width": 1.88976377952756 }, "size": 5.66929133858268, "color": "rgba(248,118,109,1)", "symbol": "circle", "opacity": 1, "autocolorscale": false }, "hoveron": "points", "textsrc": "jwrchen:5579:36e449", "hoverinfo": "text", "showlegend": true, "legendgroup": "red" }, { "line": { "dash": "solid", "color": "rgba(255,0,0,1)", "width": 1.88976377952756 }, "mode": "lines", "type": "scatter", "xsrc": "jwrchen:5579:01e4e2", "ysrc": "jwrchen:5579:f2dcd7", "frame": null, "xaxis": "x", "yaxis": "y", "hoveron": "points", "textsrc": "jwrchen:5579:b15a00", "hoverinfo": "text", "showlegend": false } ], "layout": { "font": { "size": 14.6118721461187, "color": "rgba(0,0,0,1)", "family": "" }, "title": { "x": 0.5, "font": { "size": 26.5670402656704, "color": "rgba(0,0,0,1)", "family": "" }, "text": "<b> Order Volume Distribution </b>", "xref": "paper" }, "xaxis": { "type": "linear", "range": [ 0.4, 2.6 ], "ticks": "outside", "title": { "font": { "size": 18.5969281859693, "color": "rgba(0,0,0,1)", "family": "" }, "text": "<b> </b>" }, "anchor": "y", "domain": [ 0, 1 ], "nticks": null, "ticklen": 3.65296803652968, "showgrid": true, "showline": false, "tickfont": { "size": 18.5969281859693, "color": "rgba(77,77,77,1)", "family": "" }, "tickmode": "array", "ticktext": [ "Mar 2019", "Apr 2019" ], "tickvals": [ 1, 2 ], "zeroline": false, "autorange": true, "gridcolor": "rgba(235,235,235,1)", "gridwidth": 0.66417600664176, "linecolor": null, "linewidth": 0, "tickangle": -45, "tickcolor": "rgba(51,51,51,1)", "tickwidth": 0.66417600664176, "automargin": true, "hoverformat": ".2f", "categoryarray": [ "Mar 2019", "Apr 2019" ], "categoryorder": "array", "showticklabels": true }, "yaxis": { "type": "linear", "range": [ -0.5, 10.5 ], "ticks": "outside", "title": { "font": { "size": 18.5969281859693, "color": "rgba(0,0,0,1)", "family": "" }, "text": "<b> Number of Test Orders </b>" }, "anchor": "x", "domain": [ 0, 1 ], "nticks": null, "ticklen": 3.65296803652968, "showgrid": true, "showline": false, "tickfont": { "size": 18.5969281859693, "color": "rgba(77,77,77,1)", "family": "" }, "tickmode": "array", "ticktext": [ "0", "1", "2", "3", "4", "5", "6", "7", "8", "9", "10" ], "tickvals": [ 0, 1, 2, 3, 4, 5, 6, 7, 8, 9, 10 ], "zeroline": false, "autorange": false, "gridcolor": "rgba(235,235,235,1)", "gridwidth": 0.66417600664176, "linecolor": null, "linewidth": 0, "tickangle": 0, "tickcolor": "rgba(51,51,51,1)", "tickwidth": 0.66417600664176, "automargin": true, "hoverformat": ".2f", "categoryarray": [ "0", "1", "2", "3", "4", "5", "6", "7", "8", "9", "10" ], "categoryorder": "array", "showticklabels": true }, "legend": { "font": { "size": 11.689497716895, "color": "rgba(0,0,0,1)", "family": "" }, "bgcolor": "rgba(255,255,255,1)", "bordercolor": "transparent", "borderwidth": 1.88976377952756 }, "margin": { "b": 54.0867515231504, "l": 48.1527604815276, "r": 7.30593607305936, "t": 52.7206574918072 }, "shapes": [ { "x0": 0, "x1": 1, "y0": 0, "y1": 1, "line": { "color": "rgba(51,51,51,1)", "width": 0.66417600664176, "linetype": "solid" }, "type": "rect", "xref": "paper", "yref": "paper", "fillcolor": "transparent" } ], "barmode": "relative", "hovermode": "closest", "showlegend": false, "plot_bgcolor": "rgba(255,255,255,1)", "paper_bgcolor": "rgba(255,255,255,1)" } }, "height": null, "width": null, "user": { "profile_url": "https://chart-studio.plotly.com/~jwrchen", "avatar_url": "https://storage.googleapis.com/plotly-prod-profiles/8.jpg", "background_url": "https://storage.googleapis.com/plotly-prod-profiles/bg-5.jpg", "bio": "", "nickname": "Jessica Chen", "website": "", "stream_tokens": null, "feature_set_id": null, "csrf_token": null, "date_joined": "2018-12-03 04:39:33", "mapbox_access_tokens": null, "has_password": null, "username": "jwrchen", "email": null, "is_active": null, "readonly": null, "is_dash_creator": null, "dash_created_count": null, "is_chart_creator": null, "charts_created_count": null } }, { "creation_time": "2019-06-17T19:33:55.421728Z", "comments": { "results": [], "count": 0 }, "parented": true, "embed_url": "https://chart-studio.plotly.com/~jwrchen/5578.embed", "fid": "jwrchen:5578", "filename": "histdx_distribution_Heart", "filetype": "plot", "img_url": "https://storage.googleapis.com/plotly-prod-images/jwrchen/5578/9_A23DZBEIWV0S3PNLVQT39W03MYU5V9.png", "image_urls": { "default": "https://storage.googleapis.com/plotly-prod-images/jwrchen/5578/2_H7YKMTFMKY2R051U2PGMIQV5HGZIEI.png", "block-thumb": "https://storage.googleapis.com/plotly-prod-images/jwrchen/5578/8_UG68KHKVYG3RNXRY2F7MBJ5GM2U8O6.png", "list-thumb": "https://storage.googleapis.com/plotly-prod-images/jwrchen/5578/9_A23DZBEIWV0S3PNLVQT39W03MYU5V9.png" }, "api_urls": { "files": "https://api.plotly.com/v2/files/jwrchen:5578", "plots": "https://api.plotly.com/v2/plots/jwrchen:5578", "parent": "https://api.plotly.com/v2/folders/jwrchen:4605" }, "owner": "jwrchen", "parent": 4605, "preview": "", "referencers": [], "references": [], "title": "", "views": 1, "web_url": "https://chart-studio.plotly.com/~jwrchen/5578/", "world_readable": true, "date_modified": "2019-07-28T20:53:01.856Z", "stars": { "results": [], "count": 0 }, "collaborators": { "results": [], "count": 0 }, "subfolder_count": null, "refresh_interval": null, "organize_view_url": "https://chart-studio.plotly.com/~jwrchen/5578/", "current_user_permission": "read", "is_theme": null, "is_template": null, "autosize": true, "caption": "", "figure": { "data": [ { "base": 0, "name": "angiosarcoma", "text": "Histological Dx: angiosarcoma<br />No.Orders: 1", "type": "bar", "xsrc": "jwrchen:5577:2702e3", "ysrc": "jwrchen:5577:e3453f", "frame": null, "width": 0.9, "xaxis": "x", "yaxis": "y", "marker": { "line": { "color": "transparent", "width": 1.88976377952756 }, "color": "rgba(248,118,109,1)", "autocolorscale": false }, "hoverinfo": "text", "showlegend": true, "legendgroup": "angiosarcoma", "orientation": "v" } ], "layout": { "font": { "size": 14.6118721461187, "color": "rgba(0,0,0,1)", "family": "" }, "title": { "x": 0.5, "font": { "size": 26.5670402656704, "color": "rgba(0,0,0,1)", "family": "" }, "text": "<b> Histological Diagnosis Distribution </b>", "xref": "paper" }, "xaxis": { "type": "linear", "range": [ 0.4, 1.6 ], "ticks": "outside", "title": { "font": { "size": 18.5969281859693, "color": "rgba(0,0,0,1)", "family": "" }, "text": "<b> Histological Diagnoses </b>" }, "anchor": "y", "domain": [ 0, 1 ], "nticks": null, "ticklen": 3.65296803652968, "showgrid": true, "showline": false, "tickfont": { "size": 18.5969281859693, "color": "rgba(77,77,77,1)", "family": "" }, "tickmode": "array", "ticktext": [ "angiosarcoma" ], "tickvals": [ 1 ], "zeroline": false, "autorange": true, "gridcolor": "rgba(235,235,235,1)", "gridwidth": 0.66417600664176, "linecolor": null, "linewidth": 0, "tickangle": -45, "tickcolor": "rgba(51,51,51,1)", "tickwidth": 0.66417600664176, "automargin": true, "hoverformat": ".2f", "categoryarray": [ "angiosarcoma" ], "categoryorder": "array", "showticklabels": true }, "yaxis": { "type": "linear", "range": [ -0.5, 10.5 ], "ticks": "outside", "title": { "font": { "size": 18.5969281859693, "color": "rgba(0,0,0,1)", "family": "" }, "text": "<b> Number of Test Orders </b>" }, "anchor": "x", "domain": [ 0, 1 ], "nticks": null, "ticklen": 3.65296803652968, "showgrid": true, "showline": false, "tickfont": { "size": 18.5969281859693, "color": "rgba(77,77,77,1)", "family": "" }, "tickmode": "array", "ticktext": [ "0", "1", "2", "3", "4", "5", "6", "7", "8", "9", "10" ], "tickvals": [ 0, 1, 2, 3, 4, 5, 6, 7, 8, 9, 10 ], "zeroline": false, "autorange": false, "gridcolor": "rgba(235,235,235,1)", "gridwidth": 0.66417600664176, "linecolor": null, "linewidth": 0, "tickangle": 0, "tickcolor": "rgba(51,51,51,1)", "tickwidth": 0.66417600664176, "automargin": true, "hoverformat": ".2f", "categoryarray": [ "0", "1", "2", "3", "4", "5", "6", "7", "8", "9", "10" ], "categoryorder": "array", "showticklabels": true }, "legend": { "font": { "size": 11.689497716895, "color": "rgba(0,0,0,1)", "family": "" }, "bgcolor": "rgba(255,255,255,1)", "bordercolor": "transparent", "borderwidth": 1.88976377952756 }, "margin": { "b": 91.8283034712658, "l": 48.1527604815276, "r": 7.30593607305936, "t": 52.7206574918072 }, "shapes": [ { "x0": 0, "x1": 1, "y0": 0, "y1": 1, "line": { "color": "rgba(51,51,51,1)", "width": 0.66417600664176, "linetype": "solid" }, "type": "rect", "xref": "paper", "yref": "paper", "fillcolor": "transparent" } ], "barmode": "relative", "hovermode": "closest", "showlegend": false, "plot_bgcolor": "rgba(255,255,255,1)", "paper_bgcolor": "rgba(255,255,255,1)" } }, "height": null, "width": null, "user": { "profile_url": "https://chart-studio.plotly.com/~jwrchen", "avatar_url": "https://storage.googleapis.com/plotly-prod-profiles/8.jpg", "background_url": "https://storage.googleapis.com/plotly-prod-profiles/bg-5.jpg", "bio": "", "nickname": "Jessica Chen", "website": "", "stream_tokens": null, "feature_set_id": null, "csrf_token": null, "date_joined": "2018-12-03 04:39:33", "mapbox_access_tokens": null, "has_password": null, "username": "jwrchen", "email": null, "is_active": null, "readonly": null, "is_dash_creator": null, "dash_created_count": null, "is_chart_creator": null, "charts_created_count": null } }, { "creation_time": "2019-06-17T19:33:43.879910Z", "comments": { "results": [], "count": 0 }, "parented": true, "embed_url": "https://chart-studio.plotly.com/~SRGARRITY/26.embed", "fid": "SRGARRITY:26", "filename": "plot from API (12)", "filetype": "plot", "img_url": "https://storage.googleapis.com/plotly-prod-images/SRGARRITY/26/9_LAT06N1270M7BHQGK2VSLQPQL5ZWVM.png", "image_urls": { "default": "https://storage.googleapis.com/plotly-prod-images/SRGARRITY/26/2_4CVNX5FJS9GBOKEC39H718AGZ3F9SR.png", "block-thumb": "https://storage.googleapis.com/plotly-prod-images/SRGARRITY/26/8_ZHP2D79AJV3NRQ7YA1JDBJ493RK8RW.png", "list-thumb": "https://storage.googleapis.com/plotly-prod-images/SRGARRITY/26/9_LAT06N1270M7BHQGK2VSLQPQL5ZWVM.png" }, "api_urls": { "files": "https://api.plotly.com/v2/files/SRGARRITY:26", "plots": "https://api.plotly.com/v2/plots/SRGARRITY:26", "parent": "https://api.plotly.com/v2/folders/home?user=SRGARRITY" }, "owner": "SRGARRITY", "parent": -1, "preview": "", "referencers": [], "references": [], "title": "", "views": 1, "web_url": "https://chart-studio.plotly.com/~SRGARRITY/26/", "world_readable": true, "date_modified": "2019-06-17T19:33:44.875Z", "stars": { "results": [], "count": 0 }, "collaborators": { "results": [], "count": 0 }, "subfolder_count": null, "refresh_interval": null, "organize_view_url": "https://chart-studio.plotly.com/~SRGARRITY/26/", "current_user_permission": "read", "is_theme": null, "is_template": null, "autosize": true, "caption": "", "figure": { "data": [ { "uid": "06bfa188-6328-443e-b8ae-2f1569b1535e", "type": "scatter", "ysrc": "SRGARRITY:27:cbd985" } ], "layout": {} }, "height": null, "width": null, "user": { "profile_url": "https://chart-studio.plotly.com/~SRGARRITY", "avatar_url": "https://storage.googleapis.com/plotly-prod-profiles/91.jpg", "background_url": "https://storage.googleapis.com/plotly-prod-profiles/bg-7.jpg", "bio": "", "nickname": "", "website": "", "stream_tokens": null, "feature_set_id": null, "csrf_token": null, "date_joined": "2019-06-10 21:15:04", "mapbox_access_tokens": null, "has_password": null, "username": "SRGARRITY", "email": null, "is_active": null, "readonly": null, "is_dash_creator": null, "dash_created_count": null, "is_chart_creator": null, "charts_created_count": null } } ] }