Plots List
Plots
This endpoint handles manipulation of Plotly plot files.
Reference
Authorization
Any user with or without a Plotly account may view public plots. For private plots, see authentication.
Actions
list
Listing all public plots can be done via a GET request to this endpoint.
By default, plots will be listed in order of date created. The order_by
query parameter is accepted at this endpoint. Currently, only ordering by
views is supported. It is possible to filter the plots by quality
with min_quality or max_quality as query parameter.
Example:
// GET https://api.plotly.com/v2/plots/ ---> 200

// GET https://api.plotly.com/v2/plots/?order_by=-views ---> 200

// GET https://api.plotly.com/v2/plots/?min_quality=5 ---> 200

// GET https://api.plotly.com/v2/plots/?max_quality=5 ---> 200
feed
Listing all handpicked feed plots can be done via a GET request to this endpoint. By default, plots will be listed in a random order.
Example:
// GET https://api.plotly.com/v2/plots/feed ---> 200
create
You can create new plot resources here. The only required field is 'figure'. Currently, the figure is restricted to only contain references to grid data. That is, this will fail if raw data arrays are passed in. To create and manipulate underlying grids for plots, see the grids endpoint.
Example:
// This fails because a figure field is required.
// POST https://api.plotly.com/v2/plots ---> 400 Bad Request
{}

// This fails because the figure has raw data
//POST https://api.plotly.com/v2/plots ---> 400 Bad Request
{
    "figure": {"data": [{"y": ['this', 'is', 'raw', 'data']}]}
}

// This succeeds because the figure has src keys, not raw data.
//POST https://api.plotly.com/v2/plots ---> 200 OK
{
    "figure": {"data": [{"ysrc": "sven:88:u8nd62"}]}
}
When creating a grid, you can optionally specify a source_fid to specify where a plot has come from:
- source_fid: the fid of a plot that was copied (and presumably edited) to produce this one
detail
There is a lot of meta information stored about plot files including filename, title, share_url, and content_url to name a few.
This information can only be reached with a GET to this endpoint.
Example:
// GET https://api.plotly.com/v2/plots/iheartgraphs:90
content
The contents of a plot can be downloaded via the content resource. The plot
content contains referenced grid/column data by default. If you wish to
return the raw grid/column data, the inline_data=true query must be included
in the request url. The Content-Type header will be appropriately set for the
response body.
Alternatively, you can set ?map_data=unreadable to append a mapping of
sources to data that belongs to grids which are unreadable for the
requestor. This is useful when you have read access to another users plot,
but that plot contains grid references which you don't have access to.
Examples:
// Returns referenced grid/column data
// GET https://api.plotly.com/v2/plots/iheartgraphs:90/content ---> 200 OK

// Returns full grid/column data
// GET https://api.plotly.com/v2/plots/iheartgraphs:90/content?inline_data=true ---> 200 OK

// Returns full grid/column data when requestor doesn't have permission
// to read the referenced grid.
// GET https://api.plotly.com/v2/plots/iheartgraphs:90/content?map_data=unreadable ---> 200 OK
GET /v2/plots?cursor=cj0xJnA9MjAxOS0wNC0yMiswMSUzQTE3JTNBMTEuOTY4MDI3JTJCMDAlM0EwMA%3D%3D&format=api
{ "next": "https://api.plot.ly/v2/plots?cursor=cD0yMDE5LTA0LTIyKzAxJTNBMTglM0EyMC41MDQwNDMlMkIwMCUzQTAw&format=api", "previous": "https://api.plot.ly/v2/plots?cursor=cj0xJnA9MjAxOS0wNC0yMiswMSUzQTI4JTNBMDQuOTIzNTg1JTJCMDAlM0EwMA%3D%3D&format=api", "results": [ { "creation_time": "2019-04-22T01:28:04.923585Z", "comments": { "results": [], "count": 0 }, "parented": true, "embed_url": "https://chart-studio.plotly.com/~ecotwo/20.embed", "fid": "ecotwo:20", "filename": "basic-line2", "filetype": "plot", "img_url": "https://storage.googleapis.com/plotly-prod-images/ecotwo/20/9_D5HFW6JWFWMCPI9LR15ZZ5CPGP511X.png", "image_urls": { "default": "https://storage.googleapis.com/plotly-prod-images/ecotwo/20/2_FT02NGAU79QRW213DFFIHFONPR5Q44.png", "block-thumb": "https://storage.googleapis.com/plotly-prod-images/ecotwo/20/8_SNBOVU2HDTXSJJ0A8VK8C790915ZJV.png", "list-thumb": "https://storage.googleapis.com/plotly-prod-images/ecotwo/20/9_D5HFW6JWFWMCPI9LR15ZZ5CPGP511X.png" }, "api_urls": { "files": "https://api.plotly.com/v2/files/ecotwo:20", "plots": "https://api.plotly.com/v2/plots/ecotwo:20", "parent": "https://api.plotly.com/v2/folders/home?user=ecotwo" }, "owner": "ecotwo", "parent": -1, "preview": "", "referencers": [], "references": [], "title": "", "views": 0, "web_url": "https://chart-studio.plotly.com/~ecotwo/20/", "world_readable": true, "date_modified": "2019-04-22T01:29:58.757Z", "stars": { "results": [], "count": 0 }, "collaborators": { "results": [], "count": 0 }, "subfolder_count": null, "refresh_interval": null, "organize_view_url": "https://chart-studio.plotly.com/~ecotwo/20/", "current_user_permission": "read", "is_theme": null, "is_template": null, "autosize": true, "caption": "", "figure": { "data": [ { "type": "scatter", "xsrc": "ecotwo:21:a892cd", "ysrc": "ecotwo:21:ba130f" }, { "type": "scatter", "xsrc": "ecotwo:21:a892cd", "ysrc": "ecotwo:21:e8765d" } ], "layout": {} }, "height": null, "width": null, "user": { "profile_url": "https://chart-studio.plotly.com/~ecotwo", "avatar_url": "https://storage.googleapis.com/plotly-prod-profiles/76.jpg", "background_url": "https://storage.googleapis.com/plotly-prod-profiles/bg-7.jpg", "bio": "", "nickname": "", "website": "", "stream_tokens": null, "feature_set_id": null, "csrf_token": null, "date_joined": "2019-04-03 21:14:09", "mapbox_access_tokens": null, "has_password": null, "username": "ecotwo", "email": null, "is_active": null, "readonly": null, "is_dash_creator": null, "dash_created_count": null, "is_chart_creator": null, "charts_created_count": null } }, { "creation_time": "2019-04-22T01:27:08.005665Z", "comments": { "results": [], "count": 0 }, "parented": true, "embed_url": "https://chart-studio.plotly.com/~TianYL713/120.embed", "fid": "TianYL713:120", "filename": "2019-04-19-Volatility_3D_Surface", "filetype": "plot", "img_url": "https://storage.googleapis.com/plotly-prod-images/TianYL713/120/9_TYW7FEGQMJLBO89UL6UN6HTKBVWYZL.png", "image_urls": { "default": "https://storage.googleapis.com/plotly-prod-images/TianYL713/120/2_I6FPWEKHA0R6BCZZPEROEAAH6RO5YB.png", "block-thumb": "https://storage.googleapis.com/plotly-prod-images/TianYL713/120/8_ONJQ370M2YNVG7DFP4SUY4ABNYCVP0.png", "list-thumb": "https://storage.googleapis.com/plotly-prod-images/TianYL713/120/9_TYW7FEGQMJLBO89UL6UN6HTKBVWYZL.png" }, "api_urls": { "files": "https://api.plotly.com/v2/files/TianYL713:120", "plots": "https://api.plotly.com/v2/plots/TianYL713:120", "parent": "https://api.plotly.com/v2/folders/home?user=TianYL713" }, "owner": "TianYL713", "parent": -1, "preview": "", "referencers": [], "references": [], "title": "", "views": 0, "web_url": "https://chart-studio.plotly.com/~TianYL713/120/", "world_readable": true, "date_modified": "2019-04-22T05:23:18.479Z", "stars": { "results": [], "count": 0 }, "collaborators": { "results": [], "count": 0 }, "subfolder_count": null, "refresh_interval": null, "organize_view_url": "https://chart-studio.plotly.com/~TianYL713/120/", "current_user_permission": "read", "is_theme": null, "is_template": null, "autosize": true, "caption": "", "figure": { "data": [ { "type": "surface", "xsrc": "TianYL713:119:35cac7", "ysrc": "TianYL713:119:0c0ccc", "zsrc": "TianYL713:119:d81353", "frame": null, "colorbar": { "y": 1, "len": 0.5, "title": "option_impliedvol", "lenmode": "fraction", "ticklen": 2, "yanchor": "top" }, "showscale": true, "colorscale": [ [ "0", "rgba(68,1,84,1)" ], [ "0.0200482819382257", "rgba(69,10,90,1)" ], [ "0.0276306990221906", "rgba(70,13,93,1)" ], [ "0.0406852380199648", "rgba(70,18,97,1)" ], [ "0.0511699927908337", "rgba(71,22,100,1)" ], [ "0.0615724390444355", "rgba(71,25,104,1)" ], [ "0.072428426821901", "rgba(71,29,107,1)" ], [ "0.0834505058779284", "rgba(72,32,111,1)" ], [ "0.0951189532256682", "rgba(72,35,115,1)" ], [ "0.106592777136769", "rgba(72,39,118,1)" ], [ "0.118533800231225", "rgba(72,43,121,1)" ], [ "0.130944912273539", "rgba(71,47,123,1)" ], [ "0.144412548106904", "rgba(70,51,125,1)" ], [ "0.159640452925224", "rgba(69,56,127,1)" ], [ "0.176559678718125", "rgba(67,61,130,1)" ], [ "0.195974940622364", "rgba(65,66,133,1)" ], [ "0.218503547266289", "rgba(63,73,136,1)" ], [ "0.245648107740369", "rgba(60,80,138,1)" ], [ "0.280727462159767", "rgba(57,90,140,1)" ], [ "0.330626647980061", "rgba(50,103,142,1)" ], [ "0.393113255545217", "rgba(45,118,142,1)" ], [ "0.471466893243328", "rgba(38,137,141,1)" ], [ "0.58870243438424", "rgba(40,165,132,1)" ], [ "0.899613347271725", "rgba(187,223,43,1)" ], [ "1", "rgba(253,231,37,1)" ] ] } ], "layout": { "scene": { "xaxis": { "title": "option_term_remain" }, "yaxis": { "title": "option_moneyness" }, "zaxis": { "title": "option_impliedvol" } }, "legend": { "y": 0.5, "yanchor": "top" }, "margin": { "b": 40, "l": 60, "r": 10, "t": 25 }, "hovermode": "closest", "showlegend": false } }, "height": null, "width": null, "user": { "profile_url": "https://chart-studio.plotly.com/~TianYL713", "avatar_url": "https://storage.googleapis.com/plotly-prod-profiles/61.jpg", "background_url": "https://storage.googleapis.com/plotly-prod-profiles/bg-7.jpg", "bio": "", "nickname": "", "website": "", "stream_tokens": null, "feature_set_id": null, "csrf_token": null, "date_joined": "2019-01-25 08:28:31", "mapbox_access_tokens": null, "has_password": null, "username": "TianYL713", "email": null, "is_active": null, "readonly": null, "is_dash_creator": null, "dash_created_count": null, "is_chart_creator": null, "charts_created_count": null } }, { "creation_time": "2019-04-22T01:23:55.457503Z", "comments": { "results": [], "count": 0 }, "parented": true, "embed_url": "https://chart-studio.plotly.com/~matiasdev/0.embed", "fid": "matiasdev:0", "filename": "basic-bar", "filetype": "plot", "img_url": "https://storage.googleapis.com/plotly-prod-images/matiasdev/0/9_L301JHYZLZZQUKODU9U2DZX5KY5TM0.png", "image_urls": { "default": "https://storage.googleapis.com/plotly-prod-images/matiasdev/0/2_0UE68F8UDGDDNSK88KKEYRAG56VYVX.png", "block-thumb": "https://api.plotly.com/v2/files/matiasdev:0/image?image_name=block-thumb", "list-thumb": "https://storage.googleapis.com/plotly-prod-images/matiasdev/0/9_L301JHYZLZZQUKODU9U2DZX5KY5TM0.png" }, "api_urls": { "files": "https://api.plotly.com/v2/files/matiasdev:0", "plots": "https://api.plotly.com/v2/plots/matiasdev:0", "parent": "https://api.plotly.com/v2/folders/home?user=matiasdev" }, "owner": "matiasdev", "parent": -1, "preview": "", "referencers": [], "references": [], "title": "", "views": 0, "web_url": "https://chart-studio.plotly.com/~matiasdev/0/", "world_readable": true, "date_modified": "2019-04-22T04:24:31.190Z", "stars": { "results": [], "count": 0 }, "collaborators": { "results": [], "count": 0 }, "subfolder_count": null, "refresh_interval": null, "organize_view_url": "https://chart-studio.plotly.com/~matiasdev/0/", "current_user_permission": "read", "is_theme": null, "is_template": null, "autosize": true, "caption": "", "figure": { "data": [ { "uid": "9e0d4aa0-340e-48d3-a344-0c2ce027aa6e", "type": "bar", "xsrc": "matiasdev:1:108069", "ysrc": "matiasdev:1:b58a94" } ], "layout": {} }, "height": null, "width": null, "user": { "profile_url": "https://chart-studio.plotly.com/~matiasdev", "avatar_url": "https://storage.googleapis.com/plotly-prod-profiles/60.jpg", "background_url": "https://storage.googleapis.com/plotly-prod-profiles/bg-14.jpg", "bio": "", "nickname": "", "website": "", "stream_tokens": null, "feature_set_id": null, "csrf_token": null, "date_joined": "2019-04-22 01:21:55", "mapbox_access_tokens": null, "has_password": null, "username": "matiasdev", "email": null, "is_active": null, "readonly": null, "is_dash_creator": null, "dash_created_count": null, "is_chart_creator": null, "charts_created_count": null } }, { "creation_time": "2019-04-22T01:22:47.709550Z", "comments": { "results": [], "count": 0 }, "parented": true, "embed_url": "https://chart-studio.plotly.com/~josephkc/4.embed", "fid": "josephkc:4", "filename": "yelp_bar_graph", "filetype": "plot", "img_url": "https://api.plotly.com/v2/files/josephkc:4/image?image_name=list-thumb", "image_urls": { "default": "https://storage.googleapis.com/plotly-prod-images/josephkc/4/2_HNADWWDGAGP8DZ6UUMPZBP8NUVPSJP.png", "block-thumb": "https://storage.googleapis.com/plotly-prod-images/josephkc/4/8_SA3G7UHQZYVHO00OMPMOE2TOCFFNS2.png", "list-thumb": "https://api.plotly.com/v2/files/josephkc:4/image?image_name=list-thumb" }, "api_urls": { "files": "https://api.plotly.com/v2/files/josephkc:4", "plots": "https://api.plotly.com/v2/plots/josephkc:4", "parent": "https://api.plotly.com/v2/folders/home?user=josephkc" }, "owner": "josephkc", "parent": -1, "preview": "", "referencers": [], "references": [], "title": "Average Ratings of Korean Restaurants in Michigan", "views": 0, "web_url": "https://chart-studio.plotly.com/~josephkc/4/average-ratings-of-korean-restaurants-in-michigan/", "world_readable": true, "date_modified": "2019-04-22T17:24:12.624Z", "stars": { "results": [], "count": 0 }, "collaborators": { "results": [], "count": 0 }, "subfolder_count": null, "refresh_interval": null, "organize_view_url": "https://chart-studio.plotly.com/~josephkc/4/", "current_user_permission": "read", "is_theme": null, "is_template": null, "autosize": true, "caption": "", "figure": { "data": [ { "uid": "e9ca56b4-6a9c-4137-b78b-1fbff529ef75", "type": "bar", "xsrc": "josephkc:5:3ea776", "ysrc": "josephkc:5:0be888", "marker": { "colorsrc": "josephkc:5:703afe" } } ], "layout": { "title": { "x": 0, "text": "Average Ratings of Korean Restaurants in Michigan", "xref": "paper" }, "xaxis": { "title": { "font": { "family": "Roboto" }, "text": "City in Michigan" } }, "yaxis": { "title": { "text": "Average rating" } } } }, "height": null, "width": null, "user": { "profile_url": "https://chart-studio.plotly.com/~josephkc", "avatar_url": "https://storage.googleapis.com/plotly-prod-profiles/5.jpg", "background_url": "https://storage.googleapis.com/plotly-prod-profiles/bg-7.jpg", "bio": "", "nickname": "", "website": "", "stream_tokens": null, "feature_set_id": null, "csrf_token": null, "date_joined": "2019-04-15 17:15:51", "mapbox_access_tokens": null, "has_password": null, "username": "josephkc", "email": null, "is_active": null, "readonly": null, "is_dash_creator": null, "dash_created_count": null, "is_chart_creator": null, "charts_created_count": null } }, { "creation_time": "2019-04-22T01:22:44.684307Z", "comments": { "results": [], "count": 0 }, "parented": true, "embed_url": "https://chart-studio.plotly.com/~alexplandevel/36.embed", "fid": "alexplandevel:36", "filename": "Small-Cities-PopDen-graph", "filetype": "plot", "img_url": "https://storage.googleapis.com/plotly-prod-images/alexplandevel/36/9_6ZPQ5RTBKILRGRGDFE8A07TVY9KMAJ.png", "image_urls": { "default": "https://storage.googleapis.com/plotly-prod-images/alexplandevel/36/2_6AHJDJR3VE08NC6V2MW5W4VIYQF446.png", "block-thumb": "https://storage.googleapis.com/plotly-prod-images/alexplandevel/36/8_4Z2NG76ABPJQOJG3SDS7HQ9SSS9ASJ.png", "list-thumb": "https://storage.googleapis.com/plotly-prod-images/alexplandevel/36/9_6ZPQ5RTBKILRGRGDFE8A07TVY9KMAJ.png" }, "api_urls": { "files": "https://api.plotly.com/v2/files/alexplandevel:36", "plots": "https://api.plotly.com/v2/plots/alexplandevel:36", "parent": "https://api.plotly.com/v2/folders/home?user=alexplandevel" }, "owner": "alexplandevel", "parent": -1, "preview": "", "referencers": [], "references": [], "title": "", "views": 0, "web_url": "https://chart-studio.plotly.com/~alexplandevel/36/", "world_readable": true, "date_modified": "2019-04-22T01:22:44.709Z", "stars": { "results": [], "count": 0 }, "collaborators": { "results": [], "count": 0 }, "subfolder_count": null, "refresh_interval": null, "organize_view_url": "https://chart-studio.plotly.com/~alexplandevel/36/", "current_user_permission": "read", "is_theme": null, "is_template": null, "autosize": true, "caption": "", "figure": { "data": [ { "mode": "markers", "name": "AL", "text": "City: Durres AL", "type": "scatter", "xsrc": "alexplandevel:35:b9f9fe", "ysrc": "alexplandevel:35:b6ffc6", "frame": null, "xaxis": "x", "yaxis": "y", "marker": { "line": { "color": "rgba(248,118,109,1)", "width": 1.88976377952756 }, "size": 9.28914624538822, "color": "transparent", "symbol": "circle", "opacity": 1, "autocolorscale": false }, "hoveron": "points", "hoverinfo": "text", "showlegend": true, "legendgroup": "AL" }, { "mode": "markers", "name": "AT", "type": "scatter", "xsrc": "alexplandevel:35:7e8fa8", "ysrc": "alexplandevel:35:9ffd5e", "frame": null, "xaxis": "x", "yaxis": "y", "marker": { "line": { "color": "rgba(240,126,76,1)", "width": 1.88976377952756 }, "color": "transparent", "symbol": "circle", "opacity": 1, "sizesrc": "alexplandevel:35:d64824", "autocolorscale": false }, "hoveron": "points", "textsrc": "alexplandevel:35:e44733", "hoverinfo": "text", "showlegend": true, "legendgroup": "AT" }, { "mode": "markers", "name": "BA", "text": "City: Banja Luka BA", "type": "scatter", "xsrc": "alexplandevel:35:a7d535", "ysrc": "alexplandevel:35:26b3f2", "frame": null, "xaxis": "x", "yaxis": "y", "marker": { "line": { "color": "rgba(230,134,19,1)", "width": 1.88976377952756 }, "size": 16.1090392618401, "color": "transparent", "symbol": "circle", "opacity": 1, "autocolorscale": false }, "hoveron": "points", "hoverinfo": "text", "showlegend": true, "legendgroup": "BA" }, { "mode": "markers", "name": "BE", "type": "scatter", "xsrc": "alexplandevel:35:2f089b", "ysrc": "alexplandevel:35:be5e69", "frame": null, "xaxis": "x", "yaxis": "y", "marker": { "line": { "color": "rgba(218,142,0,1)", "width": 1.88976377952756 }, "color": "transparent", "symbol": "circle", "opacity": 1, "sizesrc": "alexplandevel:35:35444f", "autocolorscale": false }, "hoveron": "points", "textsrc": "alexplandevel:35:c1c4e1", "hoverinfo": "text", "showlegend": true, "legendgroup": "BE" }, { "mode": "markers", "name": "BG", "type": "scatter", "xsrc": "alexplandevel:35:b3312d", "ysrc": "alexplandevel:35:fddc0a", "frame": null, "xaxis": "x", "yaxis": "y", "marker": { "line": { "color": "rgba(205,150,0,1)", "width": 1.88976377952756 }, "color": "transparent", "symbol": "circle", "opacity": 1, "sizesrc": "alexplandevel:35:4bc252", "autocolorscale": false }, "hoveron": "points", "textsrc": "alexplandevel:35:a374ff", "hoverinfo": "text", "showlegend": true, "legendgroup": "BG" }, { "mode": "markers", "name": "CH", "type": "scatter", "xsrc": "alexplandevel:35:e0ecd2", "ysrc": "alexplandevel:35:07ab89", "frame": null, "xaxis": "x", "yaxis": "y", "marker": { "line": { "color": "rgba(189,157,0,1)", "width": 1.88976377952756 }, "color": "transparent", "symbol": "circle", "opacity": 1, "sizesrc": "alexplandevel:35:07c745", "autocolorscale": false }, "hoveron": "points", "textsrc": "alexplandevel:35:1cca11", "hoverinfo": "text", "showlegend": true, "legendgroup": "CH" }, { "mode": "markers", "name": "CY", "type": "scatter", "xsrc": "alexplandevel:35:49c93c", "ysrc": "alexplandevel:35:495e70", "frame": null, "xaxis": "x", "yaxis": "y", "marker": { "line": { "color": "rgba(171,163,0,1)", "width": 1.88976377952756 }, "color": "transparent", "symbol": "circle", "opacity": 1, "sizesrc": "alexplandevel:35:81c877", "autocolorscale": false }, "hoveron": "points", "textsrc": "alexplandevel:35:69b09c", "hoverinfo": "text", "showlegend": true, "legendgroup": "CY" }, { "mode": "markers", "name": "CZ", "text": "City: Ostrava CZ", "type": "scatter", "xsrc": "alexplandevel:35:84f3c0", "ysrc": "alexplandevel:35:7b5e71", "frame": null, "xaxis": "x", "yaxis": "y", "marker": { "line": { "color": "rgba(150,169,0,1)", "width": 1.88976377952756 }, "size": 10.7802956754387, "color": "transparent", "symbol": "circle", "opacity": 1, "autocolorscale": false }, "hoveron": "points", "hoverinfo": "text", "showlegend": true, "legendgroup": "CZ" }, { "mode": "markers", "name": "DE", "type": "scatter", "xsrc": "alexplandevel:35:f299d6", "ysrc": "alexplandevel:35:25c061", "frame": null, "xaxis": "x", "yaxis": "y", "marker": { "line": { "color": "rgba(124,174,0,1)", "width": 1.88976377952756 }, "color": "transparent", "symbol": "circle", "opacity": 1, "sizesrc": "alexplandevel:35:2608ae", "autocolorscale": false }, "hoveron": "points", "textsrc": "alexplandevel:35:deb153", "hoverinfo": "text", "showlegend": true, "legendgroup": "DE" }, { "mode": "markers", "name": "DK", "type": "scatter", "xsrc": "alexplandevel:35:9abd81", "ysrc": "alexplandevel:35:259a36", "frame": null, "xaxis": "x", "yaxis": "y", "marker": { "line": { "color": "rgba(89,179,0,1)", "width": 1.88976377952756 }, "color": "transparent", "symbol": "circle", "opacity": 1, "sizesrc": "alexplandevel:35:db092e", "autocolorscale": false }, "hoveron": "points", "textsrc": "alexplandevel:35:429997", "hoverinfo": "text", "showlegend": true, "legendgroup": "DK" }, { "mode": "markers", "name": "ES", "type": "scatter", "xsrc": "alexplandevel:35:59c1f1", "ysrc": "alexplandevel:35:735f78", "frame": null, "xaxis": "x", "yaxis": "y", "marker": { "line": { "color": "rgba(12,183,2,1)", "width": 1.88976377952756 }, "color": "transparent", "symbol": "circle", "opacity": 1, "sizesrc": "alexplandevel:35:63496d", "autocolorscale": false }, "hoveron": "points", "textsrc": "alexplandevel:35:826dea", "hoverinfo": "text", "showlegend": true, "legendgroup": "ES" }, { "mode": "markers", "name": "FI", "text": "City: Turku / Abo FI", "type": "scatter", "xsrc": "alexplandevel:35:16cc36", "ysrc": "alexplandevel:35:035e15", "frame": null, "xaxis": "x", "yaxis": "y", "marker": { "line": { "color": "rgba(0,187,70,1)", "width": 1.88976377952756 }, "size": 15.9121704550156, "color": "transparent", "symbol": "circle", "opacity": 1, "autocolorscale": false }, "hoveron": "points", "hoverinfo": "text", "showlegend": true, "legendgroup": "FI" }, { "mode": "markers", "name": "FR", "type": "scatter", "xsrc": "alexplandevel:35:854696", "ysrc": "alexplandevel:35:551cec", "frame": null, "xaxis": "x", "yaxis": "y", "marker": { "line": { "color": "rgba(0,190,103,1)", "width": 1.88976377952756 }, "color": "transparent", "symbol": "circle", "opacity": 1, "sizesrc": "alexplandevel:35:c8a2ca", "autocolorscale": false }, "hoveron": "points", "textsrc": "alexplandevel:35:86f456", "hoverinfo": "text", "showlegend": true, "legendgroup": "FR" }, { "mode": "markers", "name": "GB", "type": "scatter", "xsrc": "alexplandevel:35:6fba61", "ysrc": "alexplandevel:35:238ea2", "frame": null, "xaxis": "x", "yaxis": "y", "marker": { "line": { "color": "rgba(0,192,130,1)", "width": 1.88976377952756 }, "color": "transparent", "symbol": "circle", "opacity": 1, "sizesrc": "alexplandevel:35:c936bd", "autocolorscale": false }, "hoveron": "points", "textsrc": "alexplandevel:35:e062a5", "hoverinfo": "text", "showlegend": true, "legendgroup": "GB" }, { "mode": "markers", "name": "GR", "type": "scatter", "xsrc": "alexplandevel:35:a26310", "ysrc": "alexplandevel:35:7bf624", "frame": null, "xaxis": "x", "yaxis": "y", "marker": { "line": { "color": "rgba(0,193,154,1)", "width": 1.88976377952756 }, "color": "transparent", "symbol": "circle", "opacity": 1, "sizesrc": "alexplandevel:35:778442", "autocolorscale": false }, "hoveron": "points", "textsrc": "alexplandevel:35:5180b3", "hoverinfo": "text", "showlegend": true, "legendgroup": "GR" }, { "mode": "markers", "name": "HR", "type": "scatter", "xsrc": "alexplandevel:35:45eb5b", "ysrc": "alexplandevel:35:9cc611", "frame": null, "xaxis": "x", "yaxis": "y", "marker": { "line": { "color": "rgba(0,192,176,1)", "width": 1.88976377952756 }, "color": "transparent", "symbol": "circle", "opacity": 1, "sizesrc": "alexplandevel:35:6b94df", "autocolorscale": false }, "hoveron": "points", "textsrc": "alexplandevel:35:ebfabf", "hoverinfo": "text", "showlegend": true, "legendgroup": "HR" }, { "mode": "markers", "name": "HU", "type": "scatter", "xsrc": "alexplandevel:35:f8e9d0", "ysrc": "alexplandevel:35:46665c", "frame": null, "xaxis": "x", "yaxis": "y", "marker": { "line": { "color": "rgba(0,191,196,1)", "width": 1.88976377952756 }, "color": "transparent", "symbol": "circle", "opacity": 1, "sizesrc": "alexplandevel:35:bf4cbf", "autocolorscale": false }, "hoveron": "points", "textsrc": "alexplandevel:35:2ce742", "hoverinfo": "text", "showlegend": true, "legendgroup": "HU" }, { "mode": "markers", "name": "IE", "text": "City: Cork IE", "type": "scatter", "xsrc": "alexplandevel:35:0477a6", "ysrc": "alexplandevel:35:73b5a1", "frame": null, "xaxis": "x", "yaxis": "y", "marker": { "line": { "color": "rgba(0,188,215,1)", "width": 1.88976377952756 }, "size": 16.0261118296151, "color": "transparent", "symbol": "circle", "opacity": 1, "autocolorscale": false }, "hoveron": "points", "hoverinfo": "text", "showlegend": true, "legendgroup": "IE" }, { "mode": "markers", "name": "IS", "text": "City: Reykjavik IS", "type": "scatter", "xsrc": "alexplandevel:35:797743", "ysrc": "alexplandevel:35:eb47b1", "frame": null, "xaxis": "x", "yaxis": "y", "marker": { "line": { "color": "rgba(0,184,231,1)", "width": 1.88976377952756 }, "size": 16.4478945077261, "color": "transparent", "symbol": "circle", "opacity": 1, "autocolorscale": false }, "hoveron": "points", "hoverinfo": "text", "showlegend": true, "legendgroup": "IS" }, { "mode": "markers", "name": "IT", "type": "scatter", "xsrc": "alexplandevel:35:774e49", "ysrc": "alexplandevel:35:969e8f", "frame": null, "xaxis": "x", "yaxis": "y", "marker": { "line": { "color": "rgba(0,177,244,1)", "width": 1.88976377952756 }, "color": "transparent", "symbol": "circle", "opacity": 1, "sizesrc": "alexplandevel:35:32115b", "autocolorscale": false }, "hoveron": "points", "textsrc": "alexplandevel:35:77ca86", "hoverinfo": "text", "showlegend": true, "legendgroup": "IT" }, { "mode": "markers", "name": "LT", "text": "City: Klaipeda LT", "type": "scatter", "xsrc": "alexplandevel:35:16ba16", "ysrc": "alexplandevel:35:329d0b", "frame": null, "xaxis": "x", "yaxis": "y", "marker": { "line": { "color": "rgba(0,169,255,1)", "width": 1.88976377952756 }, "size": 16.2643122826595, "color": "transparent", "symbol": "circle", "opacity": 1, "autocolorscale": false }, "hoveron": "points", "hoverinfo": "text", "showlegend": true, "legendgroup": "LT" }, { "mode": "markers", "name": "ME", "text": "City: Podgorica ME", "type": "scatter", "xsrc": "alexplandevel:35:bb05f0", "ysrc": "alexplandevel:35:c8ced3", "frame": null, "xaxis": "x", "yaxis": "y", "marker": { "line": { "color": "rgba(73,160,255,1)", "width": 1.88976377952756 }, "size": 12.977640451111, "color": "transparent", "symbol": "circle", "opacity": 1, "autocolorscale": false }, "hoveron": "points", "hoverinfo": "text", "showlegend": true, "legendgroup": "ME" }, { "mode": "markers", "name": "NL", "type": "scatter", "xsrc": "alexplandevel:35:ace6b5", "ysrc": "alexplandevel:35:27f480", "frame": null, "xaxis": "x", "yaxis": "y", "marker": { "line": { "color": "rgba(132,148,255,1)", "width": 1.88976377952756 }, "color": "transparent", "symbol": "circle", "opacity": 1, "sizesrc": "alexplandevel:35:5c3cd7", "autocolorscale": false }, "hoveron": "points", "textsrc": "alexplandevel:35:3aa975", "hoverinfo": "text", "showlegend": true, "legendgroup": "NL" }, { "mode": "markers", "name": "NO", "type": "scatter", "xsrc": "alexplandevel:35:162a47", "ysrc": "alexplandevel:35:91351f", "frame": null, "xaxis": "x", "yaxis": "y", "marker": { "line": { "color": "rgba(170,136,255,1)", "width": 1.88976377952756 }, "color": "transparent", "symbol": "circle", "opacity": 1, "sizesrc": "alexplandevel:35:096ff6", "autocolorscale": false }, "hoveron": "points", "textsrc": "alexplandevel:35:0eea38", "hoverinfo": "text", "showlegend": true, "legendgroup": "NO" }, { "mode": "markers", "name": "PL", "type": "scatter", "xsrc": "alexplandevel:35:ddc2e5", "ysrc": "alexplandevel:35:50bb31", "frame": null, "xaxis": "x", "yaxis": "y", "marker": { "line": { "color": "rgba(199,124,255,1)", "width": 1.88976377952756 }, "color": "transparent", "symbol": "circle", "opacity": 1, "sizesrc": "alexplandevel:35:67f99d", "autocolorscale": false }, "hoveron": "points", "textsrc": "alexplandevel:35:11b815", "hoverinfo": "text", "showlegend": true, "legendgroup": "PL" }, { "mode": "markers", "name": "PT", "type": "scatter", "xsrc": "alexplandevel:35:214de0", "ysrc": "alexplandevel:35:2cf6f8", "frame": null, "xaxis": "x", "yaxis": "y", "marker": { "line": { "color": "rgba(221,113,250,1)", "width": 1.88976377952756 }, "color": "transparent", "symbol": "circle", "opacity": 1, "sizesrc": "alexplandevel:35:25d865", "autocolorscale": false }, "hoveron": "points", "textsrc": "alexplandevel:35:9fa095", "hoverinfo": "text", "showlegend": true, "legendgroup": "PT" }, { "mode": "markers", "name": "RO", "type": "scatter", "xsrc": "alexplandevel:35:bcc7ff", "ysrc": "alexplandevel:35:87dece", "frame": null, "xaxis": "x", "yaxis": "y", "marker": { "line": { "color": "rgba(237,104,237,1)", "width": 1.88976377952756 }, "color": "transparent", "symbol": "circle", "opacity": 1, "sizesrc": "alexplandevel:35:8e1eb9", "autocolorscale": false }, "hoveron": "points", "textsrc": "alexplandevel:35:2b0223", "hoverinfo": "text", "showlegend": true, "legendgroup": "RO" }, { "mode": "markers", "name": "RS", "type": "scatter", "xsrc": "alexplandevel:35:b86ba9", "ysrc": "alexplandevel:35:833f82", "frame": null, "xaxis": "x", "yaxis": "y", "marker": { "line": { "color": "rgba(248,98,222,1)", "width": 1.88976377952756 }, "color": "transparent", "symbol": "circle", "opacity": 1, "sizesrc": "alexplandevel:35:6e9b93", "autocolorscale": false }, "hoveron": "points", "textsrc": "alexplandevel:35:4447af", "hoverinfo": "text", "showlegend": true, "legendgroup": "RS" }, { "mode": "markers", "name": "SE", "text": "City: Uppsala SE", "type": "scatter", "xsrc": "alexplandevel:35:aa5377", "ysrc": "alexplandevel:35:8059e7", "frame": null, "xaxis": "x", "yaxis": "y", "marker": { "line": { "color": "rgba(255,97,204,1)", "width": 1.88976377952756 }, "size": 9.56588880669701, "color": "transparent", "symbol": "circle", "opacity": 1, "autocolorscale": false }, "hoveron": "points", "hoverinfo": "text", "showlegend": true, "legendgroup": "SE" }, { "mode": "markers", "name": "SI", "text": "City: Ljubljana SI", "type": "scatter", "xsrc": "alexplandevel:35:a48a01", "ysrc": "alexplandevel:35:773d45", "frame": null, "xaxis": "x", "yaxis": "y", "marker": { "line": { "color": "rgba(255,99,184,1)", "width": 1.88976377952756 }, "size": 20.9002316421045, "color": "transparent", "symbol": "circle", "opacity": 1, "autocolorscale": false }, "hoveron": "points", "hoverinfo": "text", "showlegend": true, "legendgroup": "SI" }, { "mode": "markers", "name": "SK", "type": "scatter", "xsrc": "alexplandevel:35:bc16e3", "ysrc": "alexplandevel:35:2e69a2", "frame": null, "xaxis": "x", "yaxis": "y", "marker": { "line": { "color": "rgba(255,104,161,1)", "width": 1.88976377952756 }, "color": "transparent", "symbol": "circle", "opacity": 1, "sizesrc": "alexplandevel:35:71a8b8", "autocolorscale": false }, "hoveron": "points", "textsrc": "alexplandevel:35:1482c6", "hoverinfo": "text", "showlegend": true, "legendgroup": "SK" }, { "mode": "markers", "name": "XK", "text": "City: Prishtina XK", "type": "scatter", "xsrc": "alexplandevel:35:90b6ec", "ysrc": "alexplandevel:35:7f4a7f", "frame": null, "xaxis": "x", "yaxis": "y", "marker": { "line": { "color": "rgba(254,110,136,1)", "width": 1.88976377952756 }, "size": 16.0785567968364, "color": "transparent", "symbol": "circle", "opacity": 1, "autocolorscale": false }, "hoveron": "points", "hoverinfo": "text", "showlegend": true, "legendgroup": "XK" }, { "line": { "dash": "solid", "color": "rgba(51,102,255,1)", "width": 3.77952755905512 }, "mode": "lines", "name": "fitted values", "text": "", "type": "scatter", "xsrc": "alexplandevel:35:03070a", "ysrc": "alexplandevel:35:021280", "frame": null, "xaxis": "x", "yaxis": "y", "hoveron": "points", "hoverinfo": "text", "showlegend": false } ], "layout": { "font": { "size": 14.6118721461187, "color": "rgba(0,0,0,1)", "family": "" }, "xaxis": { "type": "linear", "range": [ -0.00702500023154469, 0.170130111400622 ], "ticks": "outside", "title": { "font": { "size": 14.6118721461187, "color": "rgba(0,0,0,1)", "family": "" }, "text": "Pedestrian Streets Length to Total Streets Length Ratio" }, "anchor": "y", "domain": [ 0, 1 ], "nticks": null, "ticklen": 3.65296803652968, "showgrid": false, "showline": true, "tickfont": { "size": 11.689497716895, "color": "rgba(77,77,77,1)", "family": "" }, "tickmode": "array", "ticktext": [ "0.00", "0.05", "0.10", "0.15" ], "tickvals": [ 0, 0.05, 0.1, 0.15 ], "zeroline": false, "autorange": false, "gridcolor": null, "gridwidth": 0, "linecolor": "rgba(0,0,0,1)", "linewidth": 0.66417600664176, "tickangle": 0, "tickcolor": "rgba(51,51,51,1)", "tickwidth": 0.66417600664176, "automargin": true, "hoverformat": ".2f", "categoryarray": [ "0.00", "0.05", "0.10", "0.15" ], "categoryorder": "array", "showticklabels": true }, "yaxis": { "type": "linear", "range": [ 1342.55676813091, 14641.4971742107 ], "ticks": "outside", "title": { "font": { "size": 14.6118721461187, "color": "rgba(0,0,0,1)", "family": "" }, "text": "Population Density" }, "anchor": "x", "domain": [ 0, 1 ], "nticks": null, "ticklen": 3.65296803652968, "showgrid": false, "showline": true, "tickfont": { "size": 11.689497716895, "color": "rgba(77,77,77,1)", "family": "" }, "tickmode": "array", "ticktext": [ "5000", "10000" ], "tickvals": [ 5000, 10000 ], "zeroline": false, "autorange": false, "gridcolor": null, "gridwidth": 0, "linecolor": "rgba(0,0,0,1)", "linewidth": 0.66417600664176, "tickangle": 0, "tickcolor": "rgba(51,51,51,1)", "tickwidth": 0.66417600664176, "automargin": true, "hoverformat": ".2f", "categoryarray": [ "5000", "10000" ], "categoryorder": "array", "showticklabels": true }, "legend": { "font": { "size": 11.689497716895, "color": "rgba(0,0,0,1)", "family": "" }, "bgcolor": "rgba(255,255,255,1)", "bordercolor": "transparent", "borderwidth": 1.88976377952756 }, "margin": { "b": 42.0643594414086, "l": 54.7945205479452, "r": 7.30593607305936, "t": 28.1100215418652 }, "shapes": [ { "x0": 0, "x1": 1, "y0": 0, "y1": 1, "line": { "color": null, "width": 0, "linetype": [] }, "type": "rect", "xref": "paper", "yref": "paper", "fillcolor": null } ], "barmode": "relative", "hovermode": "closest", "showlegend": false, "plot_bgcolor": "rgba(255,255,255,1)", "paper_bgcolor": "rgba(255,255,255,1)" } }, "height": null, "width": null, "user": { "profile_url": "https://chart-studio.plotly.com/~alexplandevel", "avatar_url": "https://storage.googleapis.com/plotly-prod-profiles/98.jpg", "background_url": "https://storage.googleapis.com/plotly-prod-profiles/bg-13.jpg", "bio": "", "nickname": "", "website": "", "stream_tokens": null, "feature_set_id": null, "csrf_token": null, "date_joined": "2019-04-21 00:11:11", "mapbox_access_tokens": null, "has_password": null, "username": "alexplandevel", "email": null, "is_active": null, "readonly": null, "is_dash_creator": null, "dash_created_count": null, "is_chart_creator": null, "charts_created_count": null } }, { "creation_time": "2019-04-22T01:21:41.814646Z", "comments": { "results": [], "count": 0 }, "parented": true, "embed_url": "https://chart-studio.plotly.com/~zl2003cn/6.embed", "fid": "zl2003cn:6", "filename": "plot from API (3)", "filetype": "plot", "img_url": "https://api.plotly.com/v2/files/zl2003cn:6/image?image_name=list-thumb", "image_urls": { "default": "https://storage.googleapis.com/plotly-prod-images/zl2003cn/6/2_LVHB9W9K6KA4OLE0TDOC96GLYJG6LY.png", "block-thumb": "https://storage.googleapis.com/plotly-prod-images/zl2003cn/6/8_NS4P3Z0VQHQ2CIRC5G0RRP3EG521UF.png", "list-thumb": "https://api.plotly.com/v2/files/zl2003cn:6/image?image_name=list-thumb" }, "api_urls": { "files": "https://api.plotly.com/v2/files/zl2003cn:6", "plots": "https://api.plotly.com/v2/plots/zl2003cn:6", "parent": "https://api.plotly.com/v2/folders/home?user=zl2003cn" }, "owner": "zl2003cn", "parent": -1, "preview": "", "referencers": [], "references": [], "title": "", "views": 1, "web_url": "https://chart-studio.plotly.com/~zl2003cn/6/", "world_readable": true, "date_modified": "2019-04-22T01:21:42.249Z", "stars": { "results": [], "count": 0 }, "collaborators": { "results": [], "count": 0 }, "subfolder_count": null, "refresh_interval": null, "organize_view_url": "https://chart-studio.plotly.com/~zl2003cn/6/", "current_user_permission": "read", "is_theme": null, "is_template": null, "autosize": true, "caption": "", "figure": { "data": [ { "uid": "bebce36b-5cdf-4b01-936e-dd9ef03babb0", "type": "scatter", "xsrc": "zl2003cn:7:05192e", "ysrc": "zl2003cn:7:73a05e" } ], "layout": {} }, "height": null, "width": null, "user": { "profile_url": "https://chart-studio.plotly.com/~zl2003cn", "avatar_url": "https://storage.googleapis.com/plotly-prod-profiles/67.jpg", "background_url": "https://storage.googleapis.com/plotly-prod-profiles/bg-8.jpg", "bio": "", "nickname": "", "website": "", "stream_tokens": null, "feature_set_id": null, "csrf_token": null, "date_joined": "2019-04-21 14:22:49", "mapbox_access_tokens": null, "has_password": null, "username": "zl2003cn", "email": null, "is_active": null, "readonly": null, "is_dash_creator": null, "dash_created_count": null, "is_chart_creator": null, "charts_created_count": null } }, { "creation_time": "2019-04-22T01:20:59.203448Z", "comments": { "results": [], "count": 0 }, "parented": true, "embed_url": "https://chart-studio.plotly.com/~alexplandevel/34.embed", "fid": "alexplandevel:34", "filename": "Medium-Cities-PopDen-graph", "filetype": "plot", "img_url": "https://storage.googleapis.com/plotly-prod-images/alexplandevel/34/9_09UWCRII36E2S6UVQH5718GY9HNS31.png", "image_urls": { "default": "https://storage.googleapis.com/plotly-prod-images/alexplandevel/34/2_TKXS546HIU2C9WTG2WOTTYDYQKPVL9.png", "block-thumb": "https://storage.googleapis.com/plotly-prod-images/alexplandevel/34/8_IRUSPVPICZM114B1NGD0ZT4LLE99PA.png", "list-thumb": "https://storage.googleapis.com/plotly-prod-images/alexplandevel/34/9_09UWCRII36E2S6UVQH5718GY9HNS31.png" }, "api_urls": { "files": "https://api.plotly.com/v2/files/alexplandevel:34", "plots": "https://api.plotly.com/v2/plots/alexplandevel:34", "parent": "https://api.plotly.com/v2/folders/home?user=alexplandevel" }, "owner": "alexplandevel", "parent": -1, "preview": "", "referencers": [], "references": [], "title": "", "views": 1, "web_url": "https://chart-studio.plotly.com/~alexplandevel/34/", "world_readable": true, "date_modified": "2019-04-22T01:22:03.570Z", "stars": { "results": [], "count": 0 }, "collaborators": { "results": [], "count": 0 }, "subfolder_count": null, "refresh_interval": null, "organize_view_url": "https://chart-studio.plotly.com/~alexplandevel/34/", "current_user_permission": "read", "is_theme": null, "is_template": null, "autosize": true, "caption": "", "figure": { "data": [ { "mode": "markers", "name": "AL", "text": "City: Tirana AL", "type": "scatter", "xsrc": "alexplandevel:33:106a4d", "ysrc": "alexplandevel:33:4fbaea", "frame": null, "xaxis": "x", "yaxis": "y", "marker": { "line": { "color": "rgba(248,118,109,1)", "width": 1.88976377952756 }, "size": 18.5279441333751, "color": "transparent", "symbol": "circle", "opacity": 1, "autocolorscale": false }, "hoveron": "points", "hoverinfo": "text", "showlegend": true, "legendgroup": "AL" }, { "mode": "markers", "name": "BA", "text": "City: Sarajevo BA", "type": "scatter", "xsrc": "alexplandevel:33:4907e3", "ysrc": "alexplandevel:33:70b097", "frame": null, "xaxis": "x", "yaxis": "y", "marker": { "line": { "color": "rgba(238,128,69,1)", "width": 1.88976377952756 }, "size": 12.7740280832244, "color": "transparent", "symbol": "circle", "opacity": 1, "autocolorscale": false }, "hoveron": "points", "hoverinfo": "text", "showlegend": true, "legendgroup": "BA" }, { "mode": "markers", "name": "BE", "type": "scatter", "xsrc": "alexplandevel:33:8a6855", "ysrc": "alexplandevel:33:03c1f1", "frame": null, "xaxis": "x", "yaxis": "y", "marker": { "line": { "color": "rgba(226,137,0,1)", "width": 1.88976377952756 }, "color": "transparent", "symbol": "circle", "opacity": 1, "sizesrc": "alexplandevel:33:fe8604", "autocolorscale": false }, "hoveron": "points", "textsrc": "alexplandevel:33:3d354f", "hoverinfo": "text", "showlegend": true, "legendgroup": "BE" }, { "mode": "markers", "name": "BG", "type": "scatter", "xsrc": "alexplandevel:33:554c48", "ysrc": "alexplandevel:33:a9c696", "frame": null, "xaxis": "x", "yaxis": "y", "marker": { "line": { "color": "rgba(211,146,0,1)", "width": 1.88976377952756 }, "color": "transparent", "symbol": "circle", "opacity": 1, "sizesrc": "alexplandevel:33:7d3be3", "autocolorscale": false }, "hoveron": "points", "textsrc": "alexplandevel:33:d97ad4", "hoverinfo": "text", "showlegend": true, "legendgroup": "BG" }, { "mode": "markers", "name": "CH", "type": "scatter", "xsrc": "alexplandevel:33:eaafd2", "ysrc": "alexplandevel:33:b09ac5", "frame": null, "xaxis": "x", "yaxis": "y", "marker": { "line": { "color": "rgba(193,155,0,1)", "width": 1.88976377952756 }, "color": "transparent", "symbol": "circle", "opacity": 1, "sizesrc": "alexplandevel:33:528f2b", "autocolorscale": false }, "hoveron": "points", "textsrc": "alexplandevel:33:8c9d0f", "hoverinfo": "text", "showlegend": true, "legendgroup": "CH" }, { "mode": "markers", "name": "CZ", "text": "City: Brno CZ", "type": "scatter", "xsrc": "alexplandevel:33:ea3b54", "ysrc": "alexplandevel:33:12d572", "frame": null, "xaxis": "x", "yaxis": "y", "marker": { "line": { "color": "rgba(172,163,0,1)", "width": 1.88976377952756 }, "size": 10.4424277490486, "color": "transparent", "symbol": "circle", "opacity": 1, "autocolorscale": false }, "hoveron": "points", "hoverinfo": "text", "showlegend": true, "legendgroup": "CZ" }, { "mode": "markers", "name": "DE", "type": "scatter", "xsrc": "alexplandevel:33:542a69", "ysrc": "alexplandevel:33:c60d2b", "frame": null, "xaxis": "x", "yaxis": "y", "marker": { "line": { "color": "rgba(147,170,0,1)", "width": 1.88976377952756 }, "color": "transparent", "symbol": "circle", "opacity": 1, "sizesrc": "alexplandevel:33:1c6fcc", "autocolorscale": false }, "hoveron": "points", "textsrc": "alexplandevel:33:7ba2cc", "hoverinfo": "text", "showlegend": true, "legendgroup": "DE" }, { "mode": "markers", "name": "EE", "text": "City: Tallinn EE", "type": "scatter", "xsrc": "alexplandevel:33:15ee07", "ysrc": "alexplandevel:33:7b28f0", "frame": null, "xaxis": "x", "yaxis": "y", "marker": { "line": { "color": "rgba(115,176,0,1)", "width": 1.88976377952756 }, "size": 13.198935298177, "color": "transparent", "symbol": "circle", "opacity": 1, "autocolorscale": false }, "hoveron": "points", "hoverinfo": "text", "showlegend": true, "legendgroup": "EE" }, { "mode": "markers", "name": "ES", "type": "scatter", "xsrc": "alexplandevel:33:c63c00", "ysrc": "alexplandevel:33:d07d0c", "frame": null, "xaxis": "x", "yaxis": "y", "marker": { "line": { "color": "rgba(65,181,0,1)", "width": 1.88976377952756 }, "color": "transparent", "symbol": "circle", "opacity": 1, "sizesrc": "alexplandevel:33:0bbf96", "autocolorscale": false }, "hoveron": "points", "textsrc": "alexplandevel:33:1b98ff", "hoverinfo": "text", "showlegend": true, "legendgroup": "ES" }, { "mode": "markers", "name": "FI", "text": "City: Helsinki / Helsingfors FI", "type": "scatter", "xsrc": "alexplandevel:33:4d2ca6", "ysrc": "alexplandevel:33:9405d1", "frame": null, "xaxis": "x", "yaxis": "y", "marker": { "line": { "color": "rgba(0,186,56,1)", "width": 1.88976377952756 }, "size": 21.2808200857403, "color": "transparent", "symbol": "circle", "opacity": 1, "autocolorscale": false }, "hoveron": "points", "hoverinfo": "text", "showlegend": true, "legendgroup": "FI" }, { "mode": "markers", "name": "FR", "type": "scatter", "xsrc": "alexplandevel:33:429404", "ysrc": "alexplandevel:33:b21db5", "frame": null, "xaxis": "x", "yaxis": "y", "marker": { "line": { "color": "rgba(0,189,99,1)", "width": 1.88976377952756 }, "color": "transparent", "symbol": "circle", "opacity": 1, "sizesrc": "alexplandevel:33:b07cb9", "autocolorscale": false }, "hoveron": "points", "textsrc": "alexplandevel:33:d91ce1", "hoverinfo": "text", "showlegend": true, "legendgroup": "FR" }, { "mode": "markers", "name": "GB", "type": "scatter", "xsrc": "alexplandevel:33:a02ece", "ysrc": "alexplandevel:33:cf975c", "frame": null, "xaxis": "x", "yaxis": "y", "marker": { "line": { "color": "rgba(0,192,131,1)", "width": 1.88976377952756 }, "color": "transparent", "symbol": "circle", "opacity": 1, "sizesrc": "alexplandevel:33:c2eb58", "autocolorscale": false }, "hoveron": "points", "textsrc": "alexplandevel:33:f9c4cb", "hoverinfo": "text", "showlegend": true, "legendgroup": "GB" }, { "mode": "markers", "name": "GR", "text": "City: Thessaloniki GR", "type": "scatter", "xsrc": "alexplandevel:33:189e7f", "ysrc": "alexplandevel:33:8f440e", "frame": null, "xaxis": "x", "yaxis": "y", "marker": { "line": { "color": "rgba(0,193,159,1)", "width": 1.88976377952756 }, "size": 20.85293143619, "color": "transparent", "symbol": "circle", "opacity": 1, "autocolorscale": false }, "hoveron": "points", "hoverinfo": "text", "showlegend": true, "legendgroup": "GR" }, { "mode": "markers", "name": "HR", "text": "City: Zagreb HR", "type": "scatter", "xsrc": "alexplandevel:33:df6eba", "ysrc": "alexplandevel:33:de5de7", "frame": null, "xaxis": "x", "yaxis": "y", "marker": { "line": { "color": "rgba(0,192,185,1)", "width": 1.88976377952756 }, "size": 19.5025912531147, "color": "transparent", "symbol": "circle", "opacity": 1, "autocolorscale": false }, "hoveron": "points", "hoverinfo": "text", "showlegend": true, "legendgroup": "HR" }, { "mode": "markers", "name": "IE", "text": "City: Dublin IE", "type": "scatter", "xsrc": "alexplandevel:33:84b5fe", "ysrc": "alexplandevel:33:53371b", "frame": null, "xaxis": "x", "yaxis": "y", "marker": { "line": { "color": "rgba(0,190,207,1)", "width": 1.88976377952756 }, "size": 22.6771653543307, "color": "transparent", "symbol": "circle", "opacity": 1, "autocolorscale": false }, "hoveron": "points", "hoverinfo": "text", "showlegend": true, "legendgroup": "IE" }, { "mode": "markers", "name": "IT", "type": "scatter", "xsrc": "alexplandevel:33:aedf4b", "ysrc": "alexplandevel:33:f7596a", "frame": null, "xaxis": "x", "yaxis": "y", "marker": { "line": { "color": "rgba(0,185,227,1)", "width": 1.88976377952756 }, "color": "transparent", "symbol": "circle", "opacity": 1, "sizesrc": "alexplandevel:33:107200", "autocolorscale": false }, "hoveron": "points", "textsrc": "alexplandevel:33:ba9601", "hoverinfo": "text", "showlegend": true, "legendgroup": "IT" }, { "mode": "markers", "name": "LT", "type": "scatter", "xsrc": "alexplandevel:33:af1eff", "ysrc": "alexplandevel:33:76e3a8", "frame": null, "xaxis": "x", "yaxis": "y", "marker": { "line": { "color": "rgba(0,178,244,1)", "width": 1.88976377952756 }, "color": "transparent", "symbol": "circle", "opacity": 1, "sizesrc": "alexplandevel:33:78372d", "autocolorscale": false }, "hoveron": "points", "textsrc": "alexplandevel:33:24de2d", "hoverinfo": "text", "showlegend": true, "legendgroup": "LT" }, { "mode": "markers", "name": "LV", "text": "City: Riga LV", "type": "scatter", "xsrc": "alexplandevel:33:1b2c5d", "ysrc": "alexplandevel:33:da4c0d", "frame": null, "xaxis": "x", "yaxis": "y", "marker": { "line": { "color": "rgba(0,168,255,1)", "width": 1.88976377952756 }, "size": 18.1411696432619, "color": "transparent", "symbol": "circle", "opacity": 1, "autocolorscale": false }, "hoveron": "points", "hoverinfo": "text", "showlegend": true, "legendgroup": "LV" }, { "mode": "markers", "name": "MK", "text": "City: Skopje MK", "type": "scatter", "xsrc": "alexplandevel:33:5d5439", "ysrc": "alexplandevel:33:f41de7", "frame": null, "xaxis": "x", "yaxis": "y", "marker": { "line": { "color": "rgba(97,156,255,1)", "width": 1.88976377952756 }, "size": 16.3717920103556, "color": "transparent", "symbol": "circle", "opacity": 1, "autocolorscale": false }, "hoveron": "points", "hoverinfo": "text", "showlegend": true, "legendgroup": "MK" }, { "mode": "markers", "name": "MT", "text": "City: Valletta MT", "type": "scatter", "xsrc": "alexplandevel:33:e8cceb", "ysrc": "alexplandevel:33:2f1274", "frame": null, "xaxis": "x", "yaxis": "y", "marker": { "line": { "color": "rgba(153,142,255,1)", "width": 1.88976377952756 }, "size": 6.43026949793814, "color": "transparent", "symbol": "circle", "opacity": 1, "autocolorscale": false }, "hoveron": "points", "hoverinfo": "text", "showlegend": true, "legendgroup": "MT" }, { "mode": "markers", "name": "NL", "type": "scatter", "xsrc": "alexplandevel:33:4c27cf", "ysrc": "alexplandevel:33:0f9a73", "frame": null, "xaxis": "x", "yaxis": "y", "marker": { "line": { "color": "rgba(191,128,255,1)", "width": 1.88976377952756 }, "color": "transparent", "symbol": "circle", "opacity": 1, "sizesrc": "alexplandevel:33:6b125d", "autocolorscale": false }, "hoveron": "points", "textsrc": "alexplandevel:33:d7d711", "hoverinfo": "text", "showlegend": true, "legendgroup": "NL" }, { "mode": "markers", "name": "NO", "text": "City: Oslo NO", "type": "scatter", "xsrc": "alexplandevel:33:a2d1e0", "ysrc": "alexplandevel:33:ac17c9", "frame": null, "xaxis": "x", "yaxis": "y", "marker": { "line": { "color": "rgba(219,114,251,1)", "width": 1.88976377952756 }, "size": 19.7216249482927, "color": "transparent", "symbol": "circle", "opacity": 1, "autocolorscale": false }, "hoveron": "points", "hoverinfo": "text", "showlegend": true, "legendgroup": "NO" }, { "mode": "markers", "name": "PL", "type": "scatter", "xsrc": "alexplandevel:33:868f5e", "ysrc": "alexplandevel:33:3c4be5", "frame": null, "xaxis": "x", "yaxis": "y", "marker": { "line": { "color": "rgba(238,103,236,1)", "width": 1.88976377952756 }, "color": "transparent", "symbol": "circle", "opacity": 1, "sizesrc": "alexplandevel:33:7b6d09", "autocolorscale": false }, "hoveron": "points", "textsrc": "alexplandevel:33:8c11c3", "hoverinfo": "text", "showlegend": true, "legendgroup": "PL" }, { "mode": "markers", "name": "PT", "text": "City: Porto PT", "type": "scatter", "xsrc": "alexplandevel:33:4358bd", "ysrc": "alexplandevel:33:86e881", "frame": null, "xaxis": "x", "yaxis": "y", "marker": { "line": { "color": "rgba(250,98,218,1)", "width": 1.88976377952756 }, "size": 21.84079863537, "color": "transparent", "symbol": "circle", "opacity": 1, "autocolorscale": false }, "hoveron": "points", "hoverinfo": "text", "showlegend": true, "legendgroup": "PT" }, { "mode": "markers", "name": "RO", "type": "scatter", "xsrc": "alexplandevel:33:0489a8", "ysrc": "alexplandevel:33:418714", "frame": null, "xaxis": "x", "yaxis": "y", "marker": { "line": { "color": "rgba(255,97,195,1)", "width": 1.88976377952756 }, "color": "transparent", "symbol": "circle", "opacity": 1, "sizesrc": "alexplandevel:33:4cb3fd", "autocolorscale": false }, "hoveron": "points", "textsrc": "alexplandevel:33:02039b", "hoverinfo": "text", "showlegend": true, "legendgroup": "RO" }, { "mode": "markers", "name": "RS", "text": "City: Novi Sad RS", "type": "scatter", "xsrc": "alexplandevel:33:b73237", "ysrc": "alexplandevel:33:dc7317", "frame": null, "xaxis": "x", "yaxis": "y", "marker": { "line": { "color": "rgba(255,102,170,1)", "width": 1.88976377952756 }, "size": 4.56632229455152, "color": "transparent", "symbol": "circle", "opacity": 1, "autocolorscale": false }, "hoveron": "points", "hoverinfo": "text", "showlegend": true, "legendgroup": "RS" }, { "mode": "markers", "name": "SE", "type": "scatter", "xsrc": "alexplandevel:33:ae5cc1", "ysrc": "alexplandevel:33:2a745a", "frame": null, "xaxis": "x", "yaxis": "y", "marker": { "line": { "color": "rgba(254,109,141,1)", "width": 1.88976377952756 }, "color": "transparent", "symbol": "circle", "opacity": 1, "sizesrc": "alexplandevel:33:6e3c17", "autocolorscale": false }, "hoveron": "points", "textsrc": "alexplandevel:33:66bcd0", "hoverinfo": "text", "showlegend": true, "legendgroup": "SE" }, { "line": { "dash": "solid", "color": "rgba(51,102,255,1)", "width": 3.77952755905512 }, "mode": "lines", "name": "fitted values", "text": "", "type": "scatter", "xsrc": "alexplandevel:33:ab6544", "ysrc": "alexplandevel:33:eacc13", "frame": null, "xaxis": "x", "yaxis": "y", "hoveron": "points", "hoverinfo": "text", "showlegend": false } ], "layout": { "font": { "size": 14.6118721461187, "color": "rgba(0,0,0,1)", "family": "" }, "xaxis": { "type": "linear", "range": [ -0.00302273956320195, 0.150617819597819 ], "ticks": "outside", "title": { "font": { "size": 14.6118721461187, "color": "rgba(0,0,0,1)", "family": "" }, "text": "Pedestrian Streets Length to Total Streets Length Ratio" }, "anchor": "y", "domain": [ 0, 1 ], "nticks": null, "ticklen": 3.65296803652968, "showgrid": false, "showline": true, "tickfont": { "size": 11.689497716895, "color": "rgba(77,77,77,1)", "family": "" }, "tickmode": "array", "ticktext": [ "0.00", "0.05", "0.10", "0.15" ], "tickvals": [ 0, 0.05, 0.1, 0.15 ], "zeroline": false, "autorange": false, "gridcolor": null, "gridwidth": 0, "linecolor": "rgba(0,0,0,1)", "linewidth": 0.66417600664176, "tickangle": 0, "tickcolor": "rgba(51,51,51,1)", "tickwidth": 0.66417600664176, "automargin": true, "hoverformat": ".2f", "categoryarray": [ "0.00", "0.05", "0.10", "0.15" ], "categoryorder": "array", "showticklabels": true }, "yaxis": { "type": "linear", "range": [ 2000.84784241931, 14174.2267228071 ], "ticks": "outside", "title": { "font": { "size": 14.6118721461187, "color": "rgba(0,0,0,1)", "family": "" }, "text": "Population Density" }, "anchor": "x", "domain": [ 0, 1 ], "nticks": null, "ticklen": 3.65296803652968, "showgrid": false, "showline": true, "tickfont": { "size": 11.689497716895, "color": "rgba(77,77,77,1)", "family": "" }, "tickmode": "array", "ticktext": [ "5000", "10000" ], "tickvals": [ 5000, 10000 ], "zeroline": false, "autorange": false, "gridcolor": null, "gridwidth": 0, "linecolor": "rgba(0,0,0,1)", "linewidth": 0.66417600664176, "tickangle": 0, "tickcolor": "rgba(51,51,51,1)", "tickwidth": 0.66417600664176, "automargin": true, "hoverformat": ".2f", "categoryarray": [ "5000", "10000" ], "categoryorder": "array", "showticklabels": true }, "legend": { "font": { "size": 11.689497716895, "color": "rgba(0,0,0,1)", "family": "" }, "bgcolor": "rgba(255,255,255,1)", "bordercolor": "transparent", "borderwidth": 1.88976377952756 }, "margin": { "b": 42.0643594414086, "l": 54.7945205479452, "r": 7.30593607305936, "t": 28.1100215418652 }, "shapes": [ { "x0": 0, "x1": 1, "y0": 0, "y1": 1, "line": { "color": null, "width": 0, "linetype": [] }, "type": "rect", "xref": "paper", "yref": "paper", "fillcolor": null } ], "barmode": "relative", "hovermode": "closest", "showlegend": false, "plot_bgcolor": "rgba(255,255,255,1)", "paper_bgcolor": "rgba(255,255,255,1)" } }, "height": null, "width": null, "user": { "profile_url": "https://chart-studio.plotly.com/~alexplandevel", "avatar_url": "https://storage.googleapis.com/plotly-prod-profiles/98.jpg", "background_url": "https://storage.googleapis.com/plotly-prod-profiles/bg-13.jpg", "bio": "", "nickname": "", "website": "", "stream_tokens": null, "feature_set_id": null, "csrf_token": null, "date_joined": "2019-04-21 00:11:11", "mapbox_access_tokens": null, "has_password": null, "username": "alexplandevel", "email": null, "is_active": null, "readonly": null, "is_dash_creator": null, "dash_created_count": null, "is_chart_creator": null, "charts_created_count": null } }, { "creation_time": "2019-04-22T01:20:33.569704Z", "comments": { "results": [], "count": 0 }, "parented": true, "embed_url": "https://chart-studio.plotly.com/~alexplandevel/32.embed", "fid": "alexplandevel:32", "filename": "Large-Cities-PopDen-graph", "filetype": "plot", "img_url": "https://storage.googleapis.com/plotly-prod-images/alexplandevel/32/9_BFQIC00SL00LF00V7VXIL110F5N4V5.png", "image_urls": { "default": "https://api.plotly.com/v2/files/alexplandevel:32/image?image_name=default", "block-thumb": "https://storage.googleapis.com/plotly-prod-images/alexplandevel/32/8_6D3IGA5JKXNLBFWO26ED25QJEWDQL7.png", "list-thumb": "https://storage.googleapis.com/plotly-prod-images/alexplandevel/32/9_BFQIC00SL00LF00V7VXIL110F5N4V5.png" }, "api_urls": { "files": "https://api.plotly.com/v2/files/alexplandevel:32", "plots": "https://api.plotly.com/v2/plots/alexplandevel:32", "parent": "https://api.plotly.com/v2/folders/home?user=alexplandevel" }, "owner": "alexplandevel", "parent": -1, "preview": "", "referencers": [], "references": [], "title": "", "views": 2, "web_url": "https://chart-studio.plotly.com/~alexplandevel/32/", "world_readable": true, "date_modified": "2019-04-22T01:20:33.585Z", "stars": { "results": [], "count": 0 }, "collaborators": { "results": [], "count": 0 }, "subfolder_count": null, "refresh_interval": null, "organize_view_url": "https://chart-studio.plotly.com/~alexplandevel/32/", "current_user_permission": "read", "is_theme": null, "is_template": null, "autosize": true, "caption": "", "figure": { "data": [ { "mode": "markers", "name": "AT", "text": "City: Wien AT", "type": "scatter", "xsrc": "alexplandevel:31:c45b6a", "ysrc": "alexplandevel:31:99d677", "frame": null, "xaxis": "x", "yaxis": "y", "marker": { "line": { "color": "rgba(248,118,109,1)", "width": 1.88976377952756 }, "size": 12.7932775296119, "color": "transparent", "symbol": "circle", "opacity": 1, "autocolorscale": false }, "hoveron": "points", "hoverinfo": "text", "showlegend": true, "legendgroup": "AT" }, { "mode": "markers", "name": "BE", "text": "City: Bruxelles / Brussel BE", "type": "scatter", "xsrc": "alexplandevel:31:c47737", "ysrc": "alexplandevel:31:5517ae", "frame": null, "xaxis": "x", "yaxis": "y", "marker": { "line": { "color": "rgba(233,132,44,1)", "width": 1.88976377952756 }, "size": 9.20141422211866, "color": "transparent", "symbol": "circle", "opacity": 1, "autocolorscale": false }, "hoveron": "points", "hoverinfo": "text", "showlegend": true, "legendgroup": "BE" }, { "mode": "markers", "name": "BG", "text": "City: Sofia BG", "type": "scatter", "xsrc": "alexplandevel:31:e9ceaf", "ysrc": "alexplandevel:31:24d9b6", "frame": null, "xaxis": "x", "yaxis": "y", "marker": { "line": { "color": "rgba(214,145,0,1)", "width": 1.88976377952756 }, "size": 7.9291824939731, "color": "transparent", "symbol": "circle", "opacity": 1, "autocolorscale": false }, "hoveron": "points", "hoverinfo": "text", "showlegend": true, "legendgroup": "BG" }, { "mode": "markers", "name": "CH", "text": "City: Basel CH", "type": "scatter", "xsrc": "alexplandevel:31:a25f6f", "ysrc": "alexplandevel:31:698cca", "frame": null, "xaxis": "x", "yaxis": "y", "marker": { "line": { "color": "rgba(188,157,0,1)", "width": 1.88976377952756 }, "size": 8.37505626945868, "color": "transparent", "symbol": "circle", "opacity": 1, "autocolorscale": false }, "hoveron": "points", "hoverinfo": "text", "showlegend": true, "legendgroup": "CH" }, { "mode": "markers", "name": "CZ", "text": "City: Praha CZ", "type": "scatter", "xsrc": "alexplandevel:31:dae78b", "ysrc": "alexplandevel:31:8b70bb", "frame": null, "xaxis": "x", "yaxis": "y", "marker": { "line": { "color": "rgba(156,167,0,1)", "width": 1.88976377952756 }, "size": 7.58539499365526, "color": "transparent", "symbol": "circle", "opacity": 1, "autocolorscale": false }, "hoveron": "points", "hoverinfo": "text", "showlegend": true, "legendgroup": "CZ" }, { "mode": "markers", "name": "DE", "type": "scatter", "xsrc": "alexplandevel:31:8466b9", "ysrc": "alexplandevel:31:60c7f8", "frame": null, "xaxis": "x", "yaxis": "y", "marker": { "line": { "color": "rgba(111,176,0,1)", "width": 1.88976377952756 }, "color": "transparent", "symbol": "circle", "opacity": 1, "sizesrc": "alexplandevel:31:581b82", "autocolorscale": false }, "hoveron": "points", "textsrc": "alexplandevel:31:d39121", "hoverinfo": "text", "showlegend": true, "legendgroup": "DE" }, { "mode": "markers", "name": "DK", "text": "City: Kobenhavn DK", "type": "scatter", "xsrc": "alexplandevel:31:8ca451", "ysrc": "alexplandevel:31:e41290", "frame": null, "xaxis": "x", "yaxis": "y", "marker": { "line": { "color": "rgba(0,184,19,1)", "width": 1.88976377952756 }, "size": 4.52329090844915, "color": "transparent", "symbol": "circle", "opacity": 1, "autocolorscale": false }, "hoveron": "points", "hoverinfo": "text", "showlegend": true, "legendgroup": "DK" }, { "mode": "markers", "name": "ES", "type": "scatter", "xsrc": "alexplandevel:31:b18c91", "ysrc": "alexplandevel:31:0209a6", "frame": null, "xaxis": "x", "yaxis": "y", "marker": { "line": { "color": "rgba(0,189,97,1)", "width": 1.88976377952756 }, "color": "transparent", "symbol": "circle", "opacity": 1, "sizesrc": "alexplandevel:31:e925e9", "autocolorscale": false }, "hoveron": "points", "textsrc": "alexplandevel:31:2e2579", "hoverinfo": "text", "showlegend": true, "legendgroup": "ES" }, { "mode": "markers", "name": "FR", "type": "scatter", "xsrc": "alexplandevel:31:30f578", "ysrc": "alexplandevel:31:7dacfe", "frame": null, "xaxis": "x", "yaxis": "y", "marker": { "line": { "color": "rgba(0,192,142,1)", "width": 1.88976377952756 }, "color": "transparent", "symbol": "circle", "opacity": 1, "sizesrc": "alexplandevel:31:9fbccb", "autocolorscale": false }, "hoveron": "points", "textsrc": "alexplandevel:31:9fdc14", "hoverinfo": "text", "showlegend": true, "legendgroup": "FR" }, { "mode": "markers", "name": "GB", "type": "scatter", "xsrc": "alexplandevel:31:2d079d", "ysrc": "alexplandevel:31:e7ce95", "frame": null, "xaxis": "x", "yaxis": "y", "marker": { "line": { "color": "rgba(0,192,180,1)", "width": 1.88976377952756 }, "color": "transparent", "symbol": "circle", "opacity": 1, "sizesrc": "alexplandevel:31:05e855", "autocolorscale": false }, "hoveron": "points", "textsrc": "alexplandevel:31:b5ba2e", "hoverinfo": "text", "showlegend": true, "legendgroup": "GB" }, { "mode": "markers", "name": "GR", "text": "City: Athina\r<br />Athina\r<br />Athina GR", "type": "scatter", "xsrc": "alexplandevel:31:4e5165", "ysrc": "alexplandevel:31:31b2f1", "frame": null, "xaxis": "x", "yaxis": "y", "marker": { "line": { "color": "rgba(0,189,212,1)", "width": 1.88976377952756 }, "size": 17.5325058103755, "color": "transparent", "symbol": "circle", "opacity": 1, "autocolorscale": false }, "hoveron": "points", "hoverinfo": "text", "showlegend": true, "legendgroup": "GR" }, { "mode": "markers", "name": "HU", "text": "City: Budapest HU", "type": "scatter", "xsrc": "alexplandevel:31:21fbbd", "ysrc": "alexplandevel:31:f92c5a", "frame": null, "xaxis": "x", "yaxis": "y", "marker": { "line": { "color": "rgba(0,181,238,1)", "width": 1.88976377952756 }, "size": 12.0957825669731, "color": "transparent", "symbol": "circle", "opacity": 1, "autocolorscale": false }, "hoveron": "points", "hoverinfo": "text", "showlegend": true, "legendgroup": "HU" }, { "mode": "markers", "name": "IT", "type": "scatter", "xsrc": "alexplandevel:31:83d6a3", "ysrc": "alexplandevel:31:ba7070", "frame": null, "xaxis": "x", "yaxis": "y", "marker": { "line": { "color": "rgba(0,167,255,1)", "width": 1.88976377952756 }, "color": "transparent", "symbol": "circle", "opacity": 1, "sizesrc": "alexplandevel:31:99dd32", "autocolorscale": false }, "hoveron": "points", "textsrc": "alexplandevel:31:599607", "hoverinfo": "text", "showlegend": true, "legendgroup": "IT" }, { "mode": "markers", "name": "NL", "text": "City: Amsterdam NL", "type": "scatter", "xsrc": "alexplandevel:31:fe4201", "ysrc": "alexplandevel:31:536d79", "frame": null, "xaxis": "x", "yaxis": "y", "marker": { "line": { "color": "rgba(127,150,255,1)", "width": 1.88976377952756 }, "size": 5.83880227405981, "color": "transparent", "symbol": "circle", "opacity": 1, "autocolorscale": false }, "hoveron": "points", "hoverinfo": "text", "showlegend": true, "legendgroup": "NL" }, { "mode": "markers", "name": "PL", "type": "scatter", "xsrc": "alexplandevel:31:ec9b38", "ysrc": "alexplandevel:31:a8a39c", "frame": null, "xaxis": "x", "yaxis": "y", "marker": { "line": { "color": "rgba(188,129,255,1)", "width": 1.88976377952756 }, "color": "transparent", "symbol": "circle", "opacity": 1, "sizesrc": "alexplandevel:31:e8933b", "autocolorscale": false }, "hoveron": "points", "textsrc": "alexplandevel:31:0171db", "hoverinfo": "text", "showlegend": true, "legendgroup": "PL" }, { "mode": "markers", "name": "PT", "text": "City: Lisboa PT", "type": "scatter", "xsrc": "alexplandevel:31:6a2cd8", "ysrc": "alexplandevel:31:1e1085", "frame": null, "xaxis": "x", "yaxis": "y", "marker": { "line": { "color": "rgba(226,110,247,1)", "width": 1.88976377952756 }, "size": 13.0981440247653, "color": "transparent", "symbol": "circle", "opacity": 1, "autocolorscale": false }, "hoveron": "points", "hoverinfo": "text", "showlegend": true, "legendgroup": "PT" }, { "mode": "markers", "name": "RO", "text": "City: Bucuresti RO", "type": "scatter", "xsrc": "alexplandevel:31:87a718", "ysrc": "alexplandevel:31:eabfae", "frame": null, "xaxis": "x", "yaxis": "y", "marker": { "line": { "color": "rgba(248,99,223,1)", "width": 1.88976377952756 }, "size": 14.0491371520818, "color": "transparent", "symbol": "circle", "opacity": 1, "autocolorscale": false }, "hoveron": "points", "hoverinfo": "text", "showlegend": true, "legendgroup": "RO" }, { "mode": "markers", "name": "RS", "text": "City: Belgrade RS", "type": "scatter", "xsrc": "alexplandevel:31:fd4215", "ysrc": "alexplandevel:31:531e5b", "frame": null, "xaxis": "x", "yaxis": "y", "marker": { "line": { "color": "rgba(255,98,191,1)", "width": 1.88976377952756 }, "size": 3.77952755905512, "color": "transparent", "symbol": "circle", "opacity": 1, "autocolorscale": false }, "hoveron": "points", "hoverinfo": "text", "showlegend": true, "legendgroup": "RS" }, { "mode": "markers", "name": "SE", "text": "City: Stockholm SE", "type": "scatter", "xsrc": "alexplandevel:31:ebc9dd", "ysrc": "alexplandevel:31:4baad6", "frame": null, "xaxis": "x", "yaxis": "y", "marker": { "line": { "color": "rgba(255,106,154,1)", "width": 1.88976377952756 }, "size": 8.50503276100169, "color": "transparent", "symbol": "circle", "opacity": 1, "autocolorscale": false }, "hoveron": "points", "hoverinfo": "text", "showlegend": true, "legendgroup": "SE" }, { "line": { "dash": "solid", "color": "rgba(51,102,255,1)", "width": 3.77952755905512 }, "mode": "lines", "name": "fitted values", "text": "", "type": "scatter", "xsrc": "alexplandevel:31:6380cb", "ysrc": "alexplandevel:31:f6049f", "frame": null, "xaxis": "x", "yaxis": "y", "hoveron": "points", "hoverinfo": "text", "showlegend": false } ], "layout": { "font": { "size": 14.6118721461187, "color": "rgba(0,0,0,1)", "family": "" }, "xaxis": { "type": "linear", "range": [ 3.73173133428233e-05, 0.127729635035538 ], "ticks": "outside", "title": { "font": { "size": 14.6118721461187, "color": "rgba(0,0,0,1)", "family": "" }, "text": "Pedestrian Streets Length to Total Streets Length Ratio" }, "anchor": "y", "domain": [ 0, 1 ], "nticks": null, "ticklen": 3.65296803652968, "showgrid": false, "showline": true, "tickfont": { "size": 11.689497716895, "color": "rgba(77,77,77,1)", "family": "" }, "tickmode": "array", "ticktext": [ "0.025", "0.050", "0.075", "0.100", "0.125" ], "tickvals": [ 0.025, 0.05, 0.075, 0.1, 0.125 ], "zeroline": false, "autorange": false, "gridcolor": null, "gridwidth": 0, "linecolor": "rgba(0,0,0,1)", "linewidth": 0.66417600664176, "tickangle": 0, "tickcolor": "rgba(51,51,51,1)", "tickwidth": 0.66417600664176, "automargin": true, "hoverformat": ".2f", "categoryarray": [ "0.025", "0.050", "0.075", "0.100", "0.125" ], "categoryorder": "array", "showticklabels": true }, "yaxis": { "type": "linear", "range": [ 2052.34155450923, 20524.5331100774 ], "ticks": "outside", "title": { "font": { "size": 14.6118721461187, "color": "rgba(0,0,0,1)", "family": "" }, "text": "Population Density" }, "anchor": "x", "domain": [ 0, 1 ], "nticks": null, "ticklen": 3.65296803652968, "showgrid": false, "showline": true, "tickfont": { "size": 11.689497716895, "color": "rgba(77,77,77,1)", "family": "" }, "tickmode": "array", "ticktext": [ "5000", "10000", "15000", "20000" ], "tickvals": [ 5000, 10000, 15000, 20000 ], "zeroline": false, "autorange": false, "gridcolor": null, "gridwidth": 0, "linecolor": "rgba(0,0,0,1)", "linewidth": 0.66417600664176, "tickangle": 0, "tickcolor": "rgba(51,51,51,1)", "tickwidth": 0.66417600664176, "automargin": true, "hoverformat": ".2f", "categoryarray": [ "5000", "10000", "15000", "20000" ], "categoryorder": "array", "showticklabels": true }, "legend": { "font": { "size": 11.689497716895, "color": "rgba(0,0,0,1)", "family": "" }, "bgcolor": "rgba(255,255,255,1)", "bordercolor": "transparent", "borderwidth": 1.88976377952756 }, "margin": { "b": 42.0643594414086, "l": 54.7945205479452, "r": 7.30593607305936, "t": 28.1100215418652 }, "shapes": [ { "x0": 0, "x1": 1, "y0": 0, "y1": 1, "line": { "color": null, "width": 0, "linetype": [] }, "type": "rect", "xref": "paper", "yref": "paper", "fillcolor": null } ], "barmode": "relative", "hovermode": "closest", "showlegend": false, "plot_bgcolor": "rgba(255,255,255,1)", "paper_bgcolor": "rgba(255,255,255,1)" } }, "height": null, "width": null, "user": { "profile_url": "https://chart-studio.plotly.com/~alexplandevel", "avatar_url": "https://storage.googleapis.com/plotly-prod-profiles/98.jpg", "background_url": "https://storage.googleapis.com/plotly-prod-profiles/bg-13.jpg", "bio": "", "nickname": "", "website": "", "stream_tokens": null, "feature_set_id": null, "csrf_token": null, "date_joined": "2019-04-21 00:11:11", "mapbox_access_tokens": null, "has_password": null, "username": "alexplandevel", "email": null, "is_active": null, "readonly": null, "is_dash_creator": null, "dash_created_count": null, "is_chart_creator": null, "charts_created_count": null } }, { "creation_time": "2019-04-22T01:19:26.434583Z", "comments": { "results": [], "count": 0 }, "parented": true, "embed_url": "https://chart-studio.plotly.com/~agrayb/1.embed", "fid": "agrayb:1", "filename": "Plot 1", "filetype": "plot", "img_url": "https://api.plotly.com/v2/files/agrayb:1/image?image_name=list-thumb", "image_urls": { "default": "https://storage.googleapis.com/plotly-prod-images/agrayb/1/2_JW29UZDQJUZLRMKL87ATK9D1W47125.png", "block-thumb": "https://storage.googleapis.com/plotly-prod-images/agrayb/1/8_YEIFS6U2IY972PTRZO7CR6T02C12JQ.png", "list-thumb": "https://api.plotly.com/v2/files/agrayb:1/image?image_name=list-thumb" }, "api_urls": { "files": "https://api.plotly.com/v2/files/agrayb:1", "plots": "https://api.plotly.com/v2/plots/agrayb:1", "parent": "https://api.plotly.com/v2/folders/home?user=agrayb" }, "owner": "agrayb", "parent": -1, "preview": "", "referencers": [], "references": [], "title": "", "views": 0, "web_url": "https://chart-studio.plotly.com/~agrayb/1/", "world_readable": true, "date_modified": "2019-04-22T01:19:26.451Z", "stars": { "results": [], "count": 0 }, "collaborators": { "results": [], "count": 0 }, "subfolder_count": null, "refresh_interval": null, "organize_view_url": "https://chart-studio.plotly.com/~agrayb/1/", "current_user_permission": "read", "is_theme": null, "is_template": false, "autosize": true, "caption": "", "figure": { "data": [ { "uid": "fe6d9d", "mode": "lines+markers", "name": "EQ", "type": "scatter", "xsrc": "agrayb:0:d3325a", "ysrc": "agrayb:0:aa6411" }, { "uid": "d49f04", "mode": "lines+markers", "name": "1:1", "type": "scatter", "xsrc": "agrayb:0:e0463a", "ysrc": "agrayb:0:818292" } ], "frames": [], "layout": { "title": { "text": "Vapor-Liquid Equilibrium Data, CS2 in CCl4" }, "width": 1066, "xaxis": { "type": "linear", "dtick": 0.05, "range": [ 0, 1.05 ], "title": { "text": "Mole Fraction CS2 in Liquid" }, "domain": [ 0, 0.5 ], "showline": false, "tickmode": "linear", "autorange": false }, "yaxis": { "type": "linear", "dtick": 0.05, "range": [ 0, 1.05 ], "title": { "text": "Mole Fraction CS2 in Vapor" }, "showline": false, "tickmode": "linear", "autorange": false }, "height": 545, "autosize": true } }, "height": 545, "width": 1066, "user": { "profile_url": "https://chart-studio.plotly.com/~agrayb", "avatar_url": "https://storage.googleapis.com/plotly-prod-profiles/38.jpg", "background_url": "https://storage.googleapis.com/plotly-prod-profiles/bg-12.jpg", "bio": "", "nickname": "", "website": "", "stream_tokens": null, "feature_set_id": null, "csrf_token": null, "date_joined": "2019-04-22 01:19:01", "mapbox_access_tokens": null, "has_password": null, "username": "agrayb", "email": null, "is_active": null, "readonly": null, "is_dash_creator": null, "dash_created_count": null, "is_chart_creator": null, "charts_created_count": null } }, { "creation_time": "2019-04-22T01:18:20.504043Z", "comments": { "results": [], "count": 0 }, "parented": true, "embed_url": "https://chart-studio.plotly.com/~alexplandevel/30.embed", "fid": "alexplandevel:30", "filename": "Cities-PopDen-graph", "filetype": "plot", "img_url": "https://storage.googleapis.com/plotly-prod-images/alexplandevel/30/9_HA2CC5ZP7X7H01D6Z2W9XML1WINZVS.png", "image_urls": { "default": "https://storage.googleapis.com/plotly-prod-images/alexplandevel/30/2_M4S18NJIKSWO0LTL1H7BTC2IX37ZY9.png", "block-thumb": "https://storage.googleapis.com/plotly-prod-images/alexplandevel/30/8_SWN2F5NGLSSCNDXQH6UQF7F38CKS70.png", "list-thumb": "https://storage.googleapis.com/plotly-prod-images/alexplandevel/30/9_HA2CC5ZP7X7H01D6Z2W9XML1WINZVS.png" }, "api_urls": { "files": "https://api.plotly.com/v2/files/alexplandevel:30", "plots": "https://api.plotly.com/v2/plots/alexplandevel:30", "parent": "https://api.plotly.com/v2/folders/home?user=alexplandevel" }, "owner": "alexplandevel", "parent": -1, "preview": "", "referencers": [], "references": [], "title": "", "views": 1, "web_url": "https://chart-studio.plotly.com/~alexplandevel/30/", "world_readable": true, "date_modified": "2019-04-22T01:18:20.517Z", "stars": { "results": [], "count": 0 }, "collaborators": { "results": [], "count": 0 }, "subfolder_count": null, "refresh_interval": null, "organize_view_url": "https://chart-studio.plotly.com/~alexplandevel/30/", "current_user_permission": "read", "is_theme": null, "is_template": null, "autosize": true, "caption": "", "figure": { "data": [ { "mode": "markers", "name": "AL", "type": "scatter", "xsrc": "alexplandevel:29:ab5c3c", "ysrc": "alexplandevel:29:142ce6", "frame": null, "xaxis": "x", "yaxis": "y", "marker": { "line": { "color": "rgba(248,118,109,1)", "width": 1.88976377952756 }, "color": "transparent", "symbol": "circle", "opacity": 1, "sizesrc": "alexplandevel:29:34f962", "autocolorscale": false }, "hoveron": "points", "textsrc": "alexplandevel:29:aff6c5", "hoverinfo": "text", "showlegend": true, "legendgroup": "AL" }, { "mode": "markers", "name": "AT", "type": "scatter", "xsrc": "alexplandevel:29:915c35", "ysrc": "alexplandevel:29:7e305d", "frame": null, "xaxis": "x", "yaxis": "y", "marker": { "line": { "color": "rgba(241,125,80,1)", "width": 1.88976377952756 }, "color": "transparent", "symbol": "circle", "opacity": 1, "sizesrc": "alexplandevel:29:ec8a47", "autocolorscale": false }, "hoveron": "points", "textsrc": "alexplandevel:29:013a8e", "hoverinfo": "text", "showlegend": true, "legendgroup": "AT" }, { "mode": "markers", "name": "BA", "type": "scatter", "xsrc": "alexplandevel:29:6bb81f", "ysrc": "alexplandevel:29:d08def", "frame": null, "xaxis": "x", "yaxis": "y", "marker": { "line": { "color": "rgba(232,133,38,1)", "width": 1.88976377952756 }, "color": "transparent", "symbol": "circle", "opacity": 1, "sizesrc": "alexplandevel:29:3339b3", "autocolorscale": false }, "hoveron": "points", "textsrc": "alexplandevel:29:83f855", "hoverinfo": "text", "showlegend": true, "legendgroup": "BA" }, { "mode": "markers", "name": "BE", "type": "scatter", "xsrc": "alexplandevel:29:30d4b2", "ysrc": "alexplandevel:29:e6a27b", "frame": null, "xaxis": "x", "yaxis": "y", "marker": { "line": { "color": "rgba(222,140,0,1)", "width": 1.88976377952756 }, "color": "transparent", "symbol": "circle", "opacity": 1, "sizesrc": "alexplandevel:29:45b112", "autocolorscale": false }, "hoveron": "points", "textsrc": "alexplandevel:29:e82ddd", "hoverinfo": "text", "showlegend": true, "legendgroup": "BE" }, { "mode": "markers", "name": "BG", "type": "scatter", "xsrc": "alexplandevel:29:a9198f", "ysrc": "alexplandevel:29:2696d0", "frame": null, "xaxis": "x", "yaxis": "y", "marker": { "line": { "color": "rgba(211,146,0,1)", "width": 1.88976377952756 }, "color": "transparent", "symbol": "circle", "opacity": 1, "sizesrc": "alexplandevel:29:df6066", "autocolorscale": false }, "hoveron": "points", "textsrc": "alexplandevel:29:0dff91", "hoverinfo": "text", "showlegend": true, "legendgroup": "BG" }, { "mode": "markers", "name": "CH", "type": "scatter", "xsrc": "alexplandevel:29:ae5206", "ysrc": "alexplandevel:29:6109ec", "frame": null, "xaxis": "x", "yaxis": "y", "marker": { "line": { "color": "rgba(198,153,0,1)", "width": 1.88976377952756 }, "color": "transparent", "symbol": "circle", "opacity": 1, "sizesrc": "alexplandevel:29:13413d", "autocolorscale": false }, "hoveron": "points", "textsrc": "alexplandevel:29:9fa3ee", "hoverinfo": "text", "showlegend": true, "legendgroup": "CH" }, { "mode": "markers", "name": "CY", "type": "scatter", "xsrc": "alexplandevel:29:5db686", "ysrc": "alexplandevel:29:b0ad9a", "frame": null, "xaxis": "x", "yaxis": "y", "marker": { "line": { "color": "rgba(183,159,0,1)", "width": 1.88976377952756 }, "color": "transparent", "symbol": "circle", "opacity": 1, "sizesrc": "alexplandevel:29:8cbd63", "autocolorscale": false }, "hoveron": "points", "textsrc": "alexplandevel:29:9562bf", "hoverinfo": "text", "showlegend": true, "legendgroup": "CY" }, { "mode": "markers", "name": "CZ", "type": "scatter", "xsrc": "alexplandevel:29:87af50", "ysrc": "alexplandevel:29:987010", "frame": null, "xaxis": "x", "yaxis": "y", "marker": { "line": { "color": "rgba(166,164,0,1)", "width": 1.88976377952756 }, "color": "transparent", "symbol": "circle", "opacity": 1, "sizesrc": "alexplandevel:29:5b2316", "autocolorscale": false }, "hoveron": "points", "textsrc": "alexplandevel:29:b93b74", "hoverinfo": "text", "showlegend": true, "legendgroup": "CZ" }, { "mode": "markers", "name": "DE", "type": "scatter", "xsrc": "alexplandevel:29:e3dc60", "ysrc": "alexplandevel:29:13464e", "frame": null, "xaxis": "x", "yaxis": "y", "marker": { "line": { "color": "rgba(147,170,0,1)", "width": 1.88976377952756 }, "color": "transparent", "symbol": "circle", "opacity": 1, "sizesrc": "alexplandevel:29:d51875", "autocolorscale": false }, "hoveron": "points", "textsrc": "alexplandevel:29:4c95db", "hoverinfo": "text", "showlegend": true, "legendgroup": "DE" }, { "mode": "markers", "name": "DK", "type": "scatter", "xsrc": "alexplandevel:29:19e364", "ysrc": "alexplandevel:29:6a790e", "frame": null, "xaxis": "x", "yaxis": "y", "marker": { "line": { "color": "rgba(124,174,0,1)", "width": 1.88976377952756 }, "color": "transparent", "symbol": "circle", "opacity": 1, "sizesrc": "alexplandevel:29:03d632", "autocolorscale": false }, "hoveron": "points", "textsrc": "alexplandevel:29:a27c1c", "hoverinfo": "text", "showlegend": true, "legendgroup": "DK" }, { "mode": "markers", "name": "EE", "text": "City: Tallinn EE", "type": "scatter", "xsrc": "alexplandevel:29:464d11", "ysrc": "alexplandevel:29:cbaea4", "frame": null, "xaxis": "x", "yaxis": "y", "marker": { "line": { "color": "rgba(94,179,0,1)", "width": 1.88976377952756 }, "size": 13.7959033726578, "color": "transparent", "symbol": "circle", "opacity": 1, "autocolorscale": false }, "hoveron": "points", "hoverinfo": "text", "showlegend": true, "legendgroup": "EE" }, { "mode": "markers", "name": "ES", "type": "scatter", "xsrc": "alexplandevel:29:65dd4f", "ysrc": "alexplandevel:29:24c1d1", "frame": null, "xaxis": "x", "yaxis": "y", "marker": { "line": { "color": "rgba(43,182,0,1)", "width": 1.88976377952756 }, "color": "transparent", "symbol": "circle", "opacity": 1, "sizesrc": "alexplandevel:29:0876e5", "autocolorscale": false }, "hoveron": "points", "textsrc": "alexplandevel:29:92b057", "hoverinfo": "text", "showlegend": true, "legendgroup": "ES" }, { "mode": "markers", "name": "FI", "type": "scatter", "xsrc": "alexplandevel:29:7d21b3", "ysrc": "alexplandevel:29:7c7c07", "frame": null, "xaxis": "x", "yaxis": "y", "marker": { "line": { "color": "rgba(0,186,56,1)", "width": 1.88976377952756 }, "color": "transparent", "symbol": "circle", "opacity": 1, "sizesrc": "alexplandevel:29:3823e2", "autocolorscale": false }, "hoveron": "points", "textsrc": "alexplandevel:29:169652", "hoverinfo": "text", "showlegend": true, "legendgroup": "FI" }, { "mode": "markers", "name": "FR", "type": "scatter", "xsrc": "alexplandevel:29:b23c20", "ysrc": "alexplandevel:29:5f0e2e", "frame": null, "xaxis": "x", "yaxis": "y", "marker": { "line": { "color": "rgba(0,188,90,1)", "width": 1.88976377952756 }, "color": "transparent", "symbol": "circle", "opacity": 1, "sizesrc": "alexplandevel:29:b3c12c", "autocolorscale": false }, "hoveron": "points", "textsrc": "alexplandevel:29:e4fea9", "hoverinfo": "text", "showlegend": true, "legendgroup": "FR" }, { "mode": "markers", "name": "GB", "type": "scatter", "xsrc": "alexplandevel:29:b6feb1", "ysrc": "alexplandevel:29:8d5350", "frame": null, "xaxis": "x", "yaxis": "y", "marker": { "line": { "color": "rgba(0,191,116,1)", "width": 1.88976377952756 }, "color": "transparent", "symbol": "circle", "opacity": 1, "sizesrc": "alexplandevel:29:5e4693", "autocolorscale": false }, "hoveron": "points", "textsrc": "alexplandevel:29:d34bc3", "hoverinfo": "text", "showlegend": true, "legendgroup": "GB" }, { "mode": "markers", "name": "GR", "type": "scatter", "xsrc": "alexplandevel:29:9a7a17", "ysrc": "alexplandevel:29:f94e10", "frame": null, "xaxis": "x", "yaxis": "y", "marker": { "line": { "color": "rgba(0,192,139,1)", "width": 1.88976377952756 }, "color": "transparent", "symbol": "circle", "opacity": 1, "sizesrc": "alexplandevel:29:b15314", "autocolorscale": false }, "hoveron": "points", "textsrc": "alexplandevel:29:ee601c", "hoverinfo": "text", "showlegend": true, "legendgroup": "GR" }, { "mode": "markers", "name": "HR", "type": "scatter", "xsrc": "alexplandevel:29:e7a4d1", "ysrc": "alexplandevel:29:881811", "frame": null, "xaxis": "x", "yaxis": "y", "marker": { "line": { "color": "rgba(0,193,159,1)", "width": 1.88976377952756 }, "color": "transparent", "symbol": "circle", "opacity": 1, "sizesrc": "alexplandevel:29:1f9817", "autocolorscale": false }, "hoveron": "points", "textsrc": "alexplandevel:29:361886", "hoverinfo": "text", "showlegend": true, "legendgroup": "HR" }, { "mode": "markers", "name": "HU", "type": "scatter", "xsrc": "alexplandevel:29:c002c0", "ysrc": "alexplandevel:29:6b348d", "frame": null, "xaxis": "x", "yaxis": "y", "marker": { "line": { "color": "rgba(0,192,179,1)", "width": 1.88976377952756 }, "color": "transparent", "symbol": "circle", "opacity": 1, "sizesrc": "alexplandevel:29:4d3e37", "autocolorscale": false }, "hoveron": "points", "textsrc": "alexplandevel:29:34917e", "hoverinfo": "text", "showlegend": true, "legendgroup": "HU" }, { "mode": "markers", "name": "IE", "type": "scatter", "xsrc": "alexplandevel:29:061f03", "ysrc": "alexplandevel:29:56b87b", "frame": null, "xaxis": "x", "yaxis": "y", "marker": { "line": { "color": "rgba(0,191,196,1)", "width": 1.88976377952756 }, "color": "transparent", "symbol": "circle", "opacity": 1, "sizesrc": "alexplandevel:29:610766", "autocolorscale": false }, "hoveron": "points", "textsrc": "alexplandevel:29:1cee97", "hoverinfo": "text", "showlegend": true, "legendgroup": "IE" }, { "mode": "markers", "name": "IS", "text": "City: Reykjavik IS", "type": "scatter", "xsrc": "alexplandevel:29:12b124", "ysrc": "alexplandevel:29:36486b", "frame": null, "xaxis": "x", "yaxis": "y", "marker": { "line": { "color": "rgba(0,189,213,1)", "width": 1.88976377952756 }, "size": 9.49116003386195, "color": "transparent", "symbol": "circle", "opacity": 1, "autocolorscale": false }, "hoveron": "points", "hoverinfo": "text", "showlegend": true, "legendgroup": "IS" }, { "mode": "markers", "name": "IT", "type": "scatter", "xsrc": "alexplandevel:29:737f20", "ysrc": "alexplandevel:29:dcc52f", "frame": null, "xaxis": "x", "yaxis": "y", "marker": { "line": { "color": "rgba(0,185,227,1)", "width": 1.88976377952756 }, "color": "transparent", "symbol": "circle", "opacity": 1, "sizesrc": "alexplandevel:29:7a9d81", "autocolorscale": false }, "hoveron": "points", "textsrc": "alexplandevel:29:9546a6", "hoverinfo": "text", "showlegend": true, "legendgroup": "IT" }, { "mode": "markers", "name": "LT", "type": "scatter", "xsrc": "alexplandevel:29:28fadb", "ysrc": "alexplandevel:29:480032", "frame": null, "xaxis": "x", "yaxis": "y", "marker": { "line": { "color": "rgba(0,180,240,1)", "width": 1.88976377952756 }, "color": "transparent", "symbol": "circle", "opacity": 1, "sizesrc": "alexplandevel:29:57ef79", "autocolorscale": false }, "hoveron": "points", "textsrc": "alexplandevel:29:41897d", "hoverinfo": "text", "showlegend": true, "legendgroup": "LT" }, { "mode": "markers", "name": "LV", "text": "City: Riga LV", "type": "scatter", "xsrc": "alexplandevel:29:8726a9", "ysrc": "alexplandevel:29:f8d3a3", "frame": null, "xaxis": "x", "yaxis": "y", "marker": { "line": { "color": "rgba(0,173,250,1)", "width": 1.88976377952756 }, "size": 15.447082814676, "color": "transparent", "symbol": "circle", "opacity": 1, "autocolorscale": false }, "hoveron": "points", "hoverinfo": "text", "showlegend": true, "legendgroup": "LV" }, { "mode": "markers", "name": "ME", "text": "City: Podgorica ME", "type": "scatter", "xsrc": "alexplandevel:29:dce02f", "ysrc": "alexplandevel:29:b78e3d", "frame": null, "xaxis": "x", "yaxis": "y", "marker": { "line": { "color": "rgba(0,165,255,1)", "width": 1.88976377952756 }, "size": 7.92656880865494, "color": "transparent", "symbol": "circle", "opacity": 1, "autocolorscale": false }, "hoveron": "points", "hoverinfo": "text", "showlegend": true, "legendgroup": "ME" }, { "mode": "markers", "name": "MK", "text": "City: Skopje MK", "type": "scatter", "xsrc": "alexplandevel:29:272666", "ysrc": "alexplandevel:29:cc099f", "frame": null, "xaxis": "x", "yaxis": "y", "marker": { "line": { "color": "rgba(97,156,255,1)", "width": 1.88976377952756 }, "size": 14.8069191582797, "color": "transparent", "symbol": "circle", "opacity": 1, "autocolorscale": false }, "hoveron": "points", "hoverinfo": "text", "showlegend": true, "legendgroup": "MK" }, { "mode": "markers", "name": "MT", "text": "City: Valletta MT", "type": "scatter", "xsrc": "alexplandevel:29:edaa7d", "ysrc": "alexplandevel:29:1b983b", "frame": null, "xaxis": "x", "yaxis": "y", "marker": { "line": { "color": "rgba(142,146,255,1)", "width": 1.88976377952756 }, "size": 12.4651233670084, "color": "transparent", "symbol": "circle", "opacity": 1, "autocolorscale": false }, "hoveron": "points", "hoverinfo": "text", "showlegend": true, "legendgroup": "MT" }, { "mode": "markers", "name": "NL", "type": "scatter", "xsrc": "alexplandevel:29:6a87f3", "ysrc": "alexplandevel:29:23d6c0", "frame": null, "xaxis": "x", "yaxis": "y", "marker": { "line": { "color": "rgba(174,135,255,1)", "width": 1.88976377952756 }, "color": "transparent", "symbol": "circle", "opacity": 1, "sizesrc": "alexplandevel:29:49c789", "autocolorscale": false }, "hoveron": "points", "textsrc": "alexplandevel:29:682bf4", "hoverinfo": "text", "showlegend": true, "legendgroup": "NL" }, { "mode": "markers", "name": "NO", "type": "scatter", "xsrc": "alexplandevel:29:6c796f", "ysrc": "alexplandevel:29:fea8d9", "frame": null, "xaxis": "x", "yaxis": "y", "marker": { "line": { "color": "rgba(199,124,255,1)", "width": 1.88976377952756 }, "color": "transparent", "symbol": "circle", "opacity": 1, "sizesrc": "alexplandevel:29:7a9919", "autocolorscale": false }, "hoveron": "points", "textsrc": "alexplandevel:29:650499", "hoverinfo": "text", "showlegend": true, "legendgroup": "NO" }, { "mode": "markers", "name": "PL", "type": "scatter", "xsrc": "alexplandevel:29:1f8e21", "ysrc": "alexplandevel:29:9849bf", "frame": null, "xaxis": "x", "yaxis": "y", "marker": { "line": { "color": "rgba(219,114,251,1)", "width": 1.88976377952756 }, "color": "transparent", "symbol": "circle", "opacity": 1, "sizesrc": "alexplandevel:29:42a07d", "autocolorscale": false }, "hoveron": "points", "textsrc": "alexplandevel:29:9e0905", "hoverinfo": "text", "showlegend": true, "legendgroup": "PL" }, { "mode": "markers", "name": "PT", "type": "scatter", "xsrc": "alexplandevel:29:7bfb36", "ysrc": "alexplandevel:29:1228ed", "frame": null, "xaxis": "x", "yaxis": "y", "marker": { "line": { "color": "rgba(234,106,241,1)", "width": 1.88976377952756 }, "color": "transparent", "symbol": "circle", "opacity": 1, "sizesrc": "alexplandevel:29:cfe130", "autocolorscale": false }, "hoveron": "points", "textsrc": "alexplandevel:29:55d375", "hoverinfo": "text", "showlegend": true, "legendgroup": "PT" }, { "mode": "markers", "name": "RO", "type": "scatter", "xsrc": "alexplandevel:29:6d8661", "ysrc": "alexplandevel:29:2ef41f", "frame": null, "xaxis": "x", "yaxis": "y", "marker": { "line": { "color": "rgba(245,100,227,1)", "width": 1.88976377952756 }, "color": "transparent", "symbol": "circle", "opacity": 1, "sizesrc": "alexplandevel:29:a64a0e", "autocolorscale": false }, "hoveron": "points", "textsrc": "alexplandevel:29:7e0c7a", "hoverinfo": "text", "showlegend": true, "legendgroup": "RO" }, { "mode": "markers", "name": "RS", "type": "scatter", "xsrc": "alexplandevel:29:b0bf17", "ysrc": "alexplandevel:29:2abfb5", "frame": null, "xaxis": "x", "yaxis": "y", "marker": { "line": { "color": "rgba(252,97,212,1)", "width": 1.88976377952756 }, "color": "transparent", "symbol": "circle", "opacity": 1, "sizesrc": "alexplandevel:29:8fec5e", "autocolorscale": false }, "hoveron": "points", "textsrc": "alexplandevel:29:cbc462", "hoverinfo": "text", "showlegend": true, "legendgroup": "RS" }, { "mode": "markers", "name": "SE", "type": "scatter", "xsrc": "alexplandevel:29:63fc84", "ysrc": "alexplandevel:29:a45d29", "frame": null, "xaxis": "x", "yaxis": "y", "marker": { "line": { "color": "rgba(255,97,195,1)", "width": 1.88976377952756 }, "color": "transparent", "symbol": "circle", "opacity": 1, "sizesrc": "alexplandevel:29:f83a98", "autocolorscale": false }, "hoveron": "points", "textsrc": "alexplandevel:29:8e4dc1", "hoverinfo": "text", "showlegend": true, "legendgroup": "SE" }, { "mode": "markers", "name": "SI", "text": "City: Ljubljana SI", "type": "scatter", "xsrc": "alexplandevel:29:0263a6", "ysrc": "alexplandevel:29:c8f0a4", "frame": null, "xaxis": "x", "yaxis": "y", "marker": { "line": { "color": "rgba(255,100,176,1)", "width": 1.88976377952756 }, "size": 11.4985311076981, "color": "transparent", "symbol": "circle", "opacity": 1, "autocolorscale": false }, "hoveron": "points", "hoverinfo": "text", "showlegend": true, "legendgroup": "SI" }, { "mode": "markers", "name": "SK", "type": "scatter", "xsrc": "alexplandevel:29:959998", "ysrc": "alexplandevel:29:53d4c2", "frame": null, "xaxis": "x", "yaxis": "y", "marker": { "line": { "color": "rgba(255,105,156,1)", "width": 1.88976377952756 }, "color": "transparent", "symbol": "circle", "opacity": 1, "sizesrc": "alexplandevel:29:5bab63", "autocolorscale": false }, "hoveron": "points", "textsrc": "alexplandevel:29:8b588b", "hoverinfo": "text", "showlegend": true, "legendgroup": "SK" }, { "mode": "markers", "name": "XK", "text": "City: Prishtina XK", "type": "scatter", "xsrc": "alexplandevel:29:5b4502", "ysrc": "alexplandevel:29:599f28", "frame": null, "xaxis": "x", "yaxis": "y", "marker": { "line": { "color": "rgba(253,111,134,1)", "width": 1.88976377952756 }, "size": 9.32464123374859, "color": "transparent", "symbol": "circle", "opacity": 1, "autocolorscale": false }, "hoveron": "points", "hoverinfo": "text", "showlegend": true, "legendgroup": "XK" }, { "line": { "dash": "solid", "color": "rgba(51,102,255,1)", "width": 3.77952755905512 }, "mode": "lines", "name": "fitted values", "text": "", "type": "scatter", "xsrc": "alexplandevel:29:de5068", "ysrc": "alexplandevel:29:5c183b", "frame": null, "xaxis": "x", "yaxis": "y", "hoveron": "points", "hoverinfo": "text", "showlegend": false } ], "layout": { "font": { "size": 14.6118721461187, "color": "rgba(0,0,0,1)", "family": "" }, "xaxis": { "type": "linear", "range": [ -0.00702500023154469, 0.170130111400622 ], "ticks": "outside", "title": { "font": { "size": 14.6118721461187, "color": "rgba(0,0,0,1)", "family": "" }, "text": "Pedestrian Streets Length to Total Streets Length Ratio" }, "anchor": "y", "domain": [ 0, 1 ], "nticks": null, "ticklen": 3.65296803652968, "showgrid": false, "showline": true, "tickfont": { "size": 11.689497716895, "color": "rgba(77,77,77,1)", "family": "" }, "tickmode": "array", "ticktext": [ "0.00", "0.05", "0.10", "0.15" ], "tickvals": [ 0, 0.05, 0.1, 0.15 ], "zeroline": false, "autorange": false, "gridcolor": null, "gridwidth": 0, "linecolor": "rgba(0,0,0,1)", "linewidth": 0.66417600664176, "tickangle": 0, "tickcolor": "rgba(51,51,51,1)", "tickwidth": 0.66417600664176, "automargin": true, "hoverformat": ".2f", "categoryarray": [ "0.00", "0.05", "0.10", "0.15" ], "categoryorder": "array", "showticklabels": true }, "yaxis": { "type": "linear", "range": [ 1060.16236031368, 20571.7797383724 ], "ticks": "outside", "title": { "font": { "size": 14.6118721461187, "color": "rgba(0,0,0,1)", "family": "" }, "text": "Population Density" }, "anchor": "x", "domain": [ 0, 1 ], "nticks": null, "ticklen": 3.65296803652968, "showgrid": false, "showline": true, "tickfont": { "size": 11.689497716895, "color": "rgba(77,77,77,1)", "family": "" }, "tickmode": "array", "ticktext": [ "5000", "10000", "15000", "20000" ], "tickvals": [ 5000, 10000, 15000, 20000 ], "zeroline": false, "autorange": false, "gridcolor": null, "gridwidth": 0, "linecolor": "rgba(0,0,0,1)", "linewidth": 0.66417600664176, "tickangle": 0, "tickcolor": "rgba(51,51,51,1)", "tickwidth": 0.66417600664176, "automargin": true, "hoverformat": ".2f", "categoryarray": [ "5000", "10000", "15000", "20000" ], "categoryorder": "array", "showticklabels": true }, "legend": { "font": { "size": 11.689497716895, "color": "rgba(0,0,0,1)", "family": "" }, "bgcolor": "rgba(255,255,255,1)", "bordercolor": "transparent", "borderwidth": 1.88976377952756 }, "margin": { "b": 42.0643594414086, "l": 54.7945205479452, "r": 7.30593607305936, "t": 28.1100215418652 }, "shapes": [ { "x0": 0, "x1": 1, "y0": 0, "y1": 1, "line": { "color": null, "width": 0, "linetype": [] }, "type": "rect", "xref": "paper", "yref": "paper", "fillcolor": null } ], "barmode": "relative", "hovermode": "closest", "showlegend": false, "plot_bgcolor": "rgba(255,255,255,1)", "paper_bgcolor": "rgba(255,255,255,1)" } }, "height": null, "width": null, "user": { "profile_url": "https://chart-studio.plotly.com/~alexplandevel", "avatar_url": "https://storage.googleapis.com/plotly-prod-profiles/98.jpg", "background_url": "https://storage.googleapis.com/plotly-prod-profiles/bg-13.jpg", "bio": "", "nickname": "", "website": "", "stream_tokens": null, "feature_set_id": null, "csrf_token": null, "date_joined": "2019-04-21 00:11:11", "mapbox_access_tokens": null, "has_password": null, "username": "alexplandevel", "email": null, "is_active": null, "readonly": null, "is_dash_creator": null, "dash_created_count": null, "is_chart_creator": null, "charts_created_count": null } } ] }
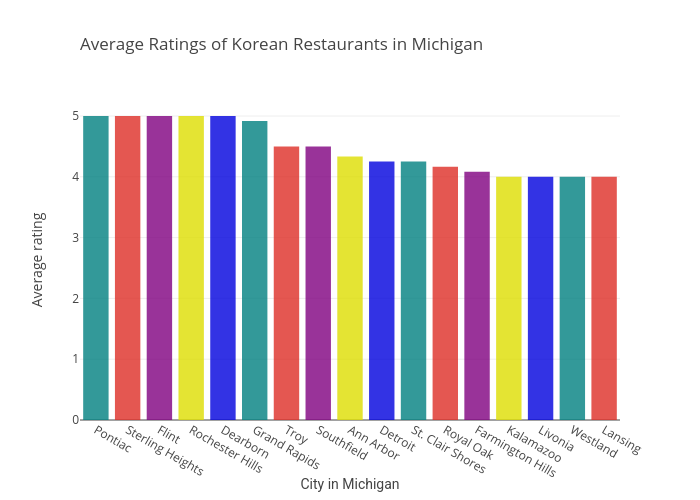
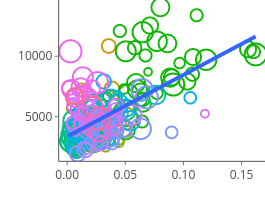