Plots List
Plots
This endpoint handles manipulation of Plotly plot files.
Reference
Authorization
Any user with or without a Plotly account may view public plots. For private plots, see authentication.
Actions
list
Listing all public plots can be done via a GET request to this endpoint.
By default, plots will be listed in order of date created. The order_by
query parameter is accepted at this endpoint. Currently, only ordering by
views is supported. It is possible to filter the plots by quality
with min_quality or max_quality as query parameter.
Example:
// GET https://api.plotly.com/v2/plots/ ---> 200

// GET https://api.plotly.com/v2/plots/?order_by=-views ---> 200

// GET https://api.plotly.com/v2/plots/?min_quality=5 ---> 200

// GET https://api.plotly.com/v2/plots/?max_quality=5 ---> 200
feed
Listing all handpicked feed plots can be done via a GET request to this endpoint. By default, plots will be listed in a random order.
Example:
// GET https://api.plotly.com/v2/plots/feed ---> 200
create
You can create new plot resources here. The only required field is 'figure'. Currently, the figure is restricted to only contain references to grid data. That is, this will fail if raw data arrays are passed in. To create and manipulate underlying grids for plots, see the grids endpoint.
Example:
// This fails because a figure field is required.
// POST https://api.plotly.com/v2/plots ---> 400 Bad Request
{}

// This fails because the figure has raw data
//POST https://api.plotly.com/v2/plots ---> 400 Bad Request
{
    "figure": {"data": [{"y": ['this', 'is', 'raw', 'data']}]}
}

// This succeeds because the figure has src keys, not raw data.
//POST https://api.plotly.com/v2/plots ---> 200 OK
{
    "figure": {"data": [{"ysrc": "sven:88:u8nd62"}]}
}
When creating a grid, you can optionally specify a source_fid to specify where a plot has come from:
- source_fid: the fid of a plot that was copied (and presumably edited) to produce this one
detail
There is a lot of meta information stored about plot files including filename, title, share_url, and content_url to name a few.
This information can only be reached with a GET to this endpoint.
Example:
// GET https://api.plotly.com/v2/plots/iheartgraphs:90
content
The contents of a plot can be downloaded via the content resource. The plot
content contains referenced grid/column data by default. If you wish to
return the raw grid/column data, the inline_data=true query must be included
in the request url. The Content-Type header will be appropriately set for the
response body.
Alternatively, you can set ?map_data=unreadable to append a mapping of
sources to data that belongs to grids which are unreadable for the
requestor. This is useful when you have read access to another users plot,
but that plot contains grid references which you don't have access to.
Examples:
// Returns referenced grid/column data
// GET https://api.plotly.com/v2/plots/iheartgraphs:90/content ---> 200 OK

// Returns full grid/column data
// GET https://api.plotly.com/v2/plots/iheartgraphs:90/content?inline_data=true ---> 200 OK

// Returns full grid/column data when requestor doesn't have permission
// to read the referenced grid.
// GET https://api.plotly.com/v2/plots/iheartgraphs:90/content?map_data=unreadable ---> 200 OK
GET /v2/plots?cursor=cD0yMDI0LTAzLTMxKzIzJTNBMDIlM0ExNi40NTk1MTYlMkIwMCUzQTAw&format=api
{ "next": "https://api.plot.ly/v2/plots?cursor=cD0yMDI0LTAzLTMxKzIxJTNBMTMlM0EzNC4xNDAwMjYlMkIwMCUzQTAw&format=api", "previous": "https://api.plot.ly/v2/plots?cursor=cj0xJnA9MjAyNC0wMy0zMSsyMiUzQTU0JTNBNTguNDMzOTQ1JTJCMDAlM0EwMA%3D%3D&format=api", "results": [ { "creation_time": "2024-03-31T22:54:58.433945Z", "comments": { "results": [], "count": 0 }, "parented": true, "embed_url": "https://chart-studio.plotly.com/~akshaynayakkolgar97/43.embed", "fid": "akshaynayakkolgar97:43", "filename": "line error 1", "filetype": "plot", "img_url": "https://storage.googleapis.com/plotly-prod-images/akshaynayakkolgar97/43/9_X4ZGACTQOSLNUF05D3DU29LYOFK8YC.png", "image_urls": { "default": "https://storage.googleapis.com/plotly-prod-images/akshaynayakkolgar97/43/2_DUN3LPV7KERMSOLZS842RTKWCK4OZX.png", "block-thumb": "https://storage.googleapis.com/plotly-prod-images/akshaynayakkolgar97/43/8_FN76NBMBG3S27NVLRK507HE5RVXKM9.png", "list-thumb": "https://storage.googleapis.com/plotly-prod-images/akshaynayakkolgar97/43/9_X4ZGACTQOSLNUF05D3DU29LYOFK8YC.png" }, "api_urls": { "files": "https://api.plotly.com/v2/files/akshaynayakkolgar97:43", "plots": "https://api.plotly.com/v2/plots/akshaynayakkolgar97:43", "parent": "https://api.plotly.com/v2/folders/home?user=akshaynayakkolgar97" }, "owner": "akshaynayakkolgar97", "parent": -1, "preview": "", "referencers": [], "references": [], "title": "", "views": 2, "web_url": "https://chart-studio.plotly.com/~akshaynayakkolgar97/43/", "world_readable": true, "date_modified": "2024-04-16T04:09:06.835Z", "stars": { "results": [], "count": 0 }, "collaborators": { "results": [], "count": 0 }, "subfolder_count": null, "refresh_interval": null, "organize_view_url": "https://chart-studio.plotly.com/~akshaynayakkolgar97/43/", "current_user_permission": "read", "is_theme": null, "is_template": false, "autosize": true, "caption": "", "figure": { "data": [ { "uid": "e557cc", "line": { "dash": "dash", "color": "rgb(155, 57, 34)", "shape": "spline", "width": 2, "smoothing": 1 }, "meta": { "columnNames": { "x": "B", "y": "A", "error_y": { "array": "D", "arrayminus": "C" } } }, "mode": "markers+lines", "type": "scatter", "xsrc": "akshaynayakkolgar97:42:de332b", "ysrc": "akshaynayakkolgar97:42:12a255", "marker": { "line": { "color": "rgb(51, 58, 115)", "width": 1 }, "size": 11, "color": "rgb(100, 32, 170)", "symbol": "circle" }, "error_y": { "meta": { "columnNames": { "array": "D", "arrayminus": "C" } }, "type": "data", "color": "rgb(42, 43, 48)", "value": 10, "width": 8, "visible": true, "arraysrc": "akshaynayakkolgar97:42:66e5c1", "symmetric": false, "thickness": 2, "arrayminussrc": "akshaynayakkolgar97:42:bbea37" }, "connectgaps": false } ], "frames": [], "layout": { "font": { "size": 28 }, "title": { "text": "Line Prediction" }, "xaxis": { "type": "category", "dtick": 1, "range": [ -0.2941747858593589, 4.294174785859359 ], "tick0": 0, "title": { "text": "Condition" }, "domain": [ 0.25, 0.625 ], "tickson": "labels", "showgrid": true, "showline": false, "tickmode": "auto", "autorange": true, "gridcolor": "rgb(210, 210, 223)", "gridwidth": 1, "tickangle": "auto", "automargin": true, "showticklabels": true }, "yaxis": { "type": "linear", "range": [ 0, 25 ], "title": { "text": "Error Percentage (%)" }, "domain": [ 0, 1 ], "autorange": false, "gridcolor": "rgb(210, 210, 223)", "gridwidth": 3, "zerolinecolor": "rgb(210, 210, 223)" }, "margin": { "pad": 10 }, "shapes": [ { "x0": 0.25, "x1": 0.6245188606620478, "y0": -0.0007886435331230235, "y1": 1, "line": { "color": "#444444", "width": 3 }, "xref": "paper", "yref": "paper", "opacity": 0.1, "fillcolor": "rgb(255, 255, 255)" } ], "barmode": "group", "barnorm": "", "modebar": { "orientation": "h" }, "autosize": true, "colorway": [ "#4c78a8", "#f58518", "#e45756", "#72b7b2", "#54a24b", "#eeca3b", "#b279a2", "#ff9da6", "#9d755d", "#bab0ac" ], "template": { "data": { "bar": [ { "type": "bar", "marker": { "colorbar": { "ticks": "", "outlinewidth": 0 } } } ], "table": [ { "type": "table", "cells": { "fill": { "color": "#EBF0F8" }, "line": { "color": "white" } }, "header": { "fill": { "color": "#C8D4E3" }, "line": { "color": "white" } } } ], "carpet": [ { "type": "carpet", "aaxis": { "gridcolor": "#C8D4E3", "linecolor": "#C8D4E3", "endlinecolor": "#2a3f5f", "minorgridcolor": "#C8D4E3", "startlinecolor": "#2a3f5f" }, "baxis": { "gridcolor": "#C8D4E3", "linecolor": "#C8D4E3", "endlinecolor": "#2a3f5f", "minorgridcolor": "#C8D4E3", "startlinecolor": "#2a3f5f" } } ], "mesh3d": [ { "type": "mesh3d", "colorbar": { "ticks": "", "outlinewidth": 0 } } ], "contour": [ { "type": "contour", "colorbar": { "ticks": "", "outlinewidth": 0 }, "autocolorscale": true } ], "heatmap": [ { "type": "heatmap", "colorbar": { "ticks": "", "outlinewidth": 0 }, "autocolorscale": true } ], "scatter": [ { "type": "scatter", "marker": { "colorbar": { "ticks": "", "outlinewidth": 0 } } } ], "surface": [ { "type": "surface", "colorbar": { "ticks": "", "outlinewidth": 0 } } ], "heatmapgl": [ { "type": "heatmapgl", "colorbar": { "ticks": "", "outlinewidth": 0 } } ], "histogram": [ { "type": "histogram", "marker": { "colorbar": { "ticks": "", "outlinewidth": 0 } } } ], "parcoords": [ { "line": { "colorbar": { "ticks": "", "outlinewidth": 0 } }, "type": "parcoords" } ], "scatter3d": [ { "type": "scatter3d", "marker": { "colorbar": { "ticks": "", "outlinewidth": 0 } } } ], "scattergl": [ { "type": "scattergl", "marker": { "colorbar": { "ticks": "", "outlinewidth": 0 } } } ], "choropleth": [ { "type": "choropleth", "colorbar": { "ticks": "", "outlinewidth": 0 } } ], "scattergeo": [ { "type": "scattergeo", "marker": { "colorbar": { "ticks": "", "outlinewidth": 0 } } } ], "histogram2d": [ { "type": "histogram2d", "colorbar": { "ticks": "", "outlinewidth": 0 }, "autocolorscale": true } ], "scatterpolar": [ { "type": "scatterpolar", "marker": { "colorbar": { "ticks": "", "outlinewidth": 0 } } } ], "contourcarpet": [ { "type": "contourcarpet", "colorbar": { "ticks": "", "outlinewidth": 0 } } ], "scattercarpet": [ { "type": "scattercarpet", "marker": { "colorbar": { "ticks": "", "outlinewidth": 0 } } } ], "scattermapbox": [ { "type": "scattermapbox", "marker": { "colorbar": { "ticks": "", "outlinewidth": 0 } } } ], "scatterpolargl": [ { "type": "scatterpolargl", "marker": { "colorbar": { "ticks": "", "outlinewidth": 0 } } } ], "scatterternary": [ { "type": "scatterternary", "marker": { "colorbar": { "ticks": "", "outlinewidth": 0 } } } ], "histogram2dcontour": [ { "type": "histogram2dcontour", "colorbar": { "ticks": "", "outlinewidth": 0 }, "autocolorscale": true } ] }, "layout": { "geo": { "bgcolor": "white", "showland": true, "lakecolor": "white", "landcolor": "white", "showlakes": true, "subunitcolor": "#C8D4E3" }, "font": { "color": "#2a3f5f" }, "polar": { "bgcolor": "white", "radialaxis": { "ticks": "", "gridcolor": "#EBF0F8", "linecolor": "#EBF0F8" }, "angularaxis": { "ticks": "", "gridcolor": "#EBF0F8", "linecolor": "#EBF0F8" } }, "scene": { "xaxis": { "ticks": "", "gridcolor": "#DFE8F3", "gridwidth": 2, "linecolor": "#EBF0F8", "zerolinecolor": "#EBF0F8", "showbackground": true, "backgroundcolor": "white" }, "yaxis": { "ticks": "", "gridcolor": "#DFE8F3", "gridwidth": 2, "linecolor": "#EBF0F8", "zerolinecolor": "#EBF0F8", "showbackground": true, "backgroundcolor": "white" }, "zaxis": { "ticks": "", "gridcolor": "#DFE8F3", "gridwidth": 2, "linecolor": "#EBF0F8", "zerolinecolor": "#EBF0F8", "showbackground": true, "backgroundcolor": "white" } }, "title": { "x": 0.05 }, "xaxis": { "ticks": "", "gridcolor": "#EBF0F8", "linecolor": "#EBF0F8", "automargin": true, "zerolinecolor": "#EBF0F8", "zerolinewidth": 2 }, "yaxis": { "ticks": "", "gridcolor": "#EBF0F8", "linecolor": "#EBF0F8", "automargin": true, "zerolinecolor": "#EBF0F8", "zerolinewidth": 2 }, "ternary": { "aaxis": { "ticks": "", "gridcolor": "#DFE8F3", "linecolor": "#A2B1C6" }, "baxis": { "ticks": "", "gridcolor": "#DFE8F3", "linecolor": "#A2B1C6" }, "caxis": { "ticks": "", "gridcolor": "#DFE8F3", "linecolor": "#A2B1C6" }, "bgcolor": "white" }, "colorway": [ "#636efa", "#EF553B", "#00cc96", "#ab63fa", "#19d3f3", "#e763fa", "#fecb52", "#ffa15a", "#ff6692", "#b6e880" ], "hovermode": "closest", "colorscale": { "diverging": [ [ 0, "#8e0152" ], [ 0.1, "#c51b7d" ], [ 0.2, "#de77ae" ], [ 0.3, "#f1b6da" ], [ 0.4, "#fde0ef" ], [ 0.5, "#f7f7f7" ], [ 0.6, "#e6f5d0" ], [ 0.7, "#b8e186" ], [ 0.8, "#7fbc41" ], [ 0.9, "#4d9221" ], [ 1, "#276419" ] ], "sequential": [ [ 0, "#0508b8" ], [ 0.0893854748603352, "#1910d8" ], [ 0.1787709497206704, "#3c19f0" ], [ 0.2681564245810056, "#6b1cfb" ], [ 0.3575418994413408, "#981cfd" ], [ 0.44692737430167595, "#bf1cfd" ], [ 0.5363128491620112, "#dd2bfd" ], [ 0.6256983240223464, "#f246fe" ], [ 0.7150837988826816, "#fc67fd" ], [ 0.8044692737430168, "#fe88fc" ], [ 0.8938547486033519, "#fea5fd" ], [ 0.9832402234636871, "#febefe" ], [ 1, "#fec3fe" ] ], "sequentialminus": [ [ 0, "#0508b8" ], [ 0.0893854748603352, "#1910d8" ], [ 0.1787709497206704, "#3c19f0" ], [ 0.2681564245810056, "#6b1cfb" ], [ 0.3575418994413408, "#981cfd" ], [ 0.44692737430167595, "#bf1cfd" ], [ 0.5363128491620112, "#dd2bfd" ], [ 0.6256983240223464, "#f246fe" ], [ 0.7150837988826816, "#fc67fd" ], [ 0.8044692737430168, "#fe88fc" ], [ 0.8938547486033519, "#fea5fd" ], [ 0.9832402234636871, "#febefe" ], [ 1, "#fec3fe" ] ] }, "plot_bgcolor": "white", "paper_bgcolor": "white", "shapedefaults": { "line": { "width": 0 }, "opacity": 0.4, "fillcolor": "#506784" }, "annotationdefaults": { "arrowhead": 0, "arrowcolor": "#506784", "arrowwidth": 1 } }, "themeRef": "PLOTLY_WHITE" } } }, "height": null, "width": null, "user": { "profile_url": "https://chart-studio.plotly.com/~akshaynayakkolgar97", "avatar_url": "https://storage.googleapis.com/plotly-prod-profiles/2.jpg", "background_url": "https://storage.googleapis.com/plotly-prod-profiles/bg-4.jpg", "bio": "", "nickname": "", "website": "", "stream_tokens": null, "feature_set_id": null, "csrf_token": null, "date_joined": "2023-12-08 07:44:36", "mapbox_access_tokens": null, "has_password": null, "username": "akshaynayakkolgar97", "email": null, "is_active": null, "readonly": null, "is_dash_creator": null, "dash_created_count": null, "is_chart_creator": null, "charts_created_count": null } }, { "creation_time": "2024-03-31T22:35:56.514321Z", "comments": { "results": [], "count": 0 }, "parented": true, "embed_url": "https://chart-studio.plotly.com/~cynthiawang630/7.embed", "fid": "cynthiawang630:7", "filename": "sleep deprivation flies trial 1", "filetype": "plot", "img_url": "https://storage.googleapis.com/plotly-prod-images/cynthiawang630/7/9_D68OOCN8BYS77TRFUY9N59WT3K30LB.png", "image_urls": { "default": "https://storage.googleapis.com/plotly-prod-images/cynthiawang630/7/2_A3KM795U9DYIV9B5R19OFPBFEPXAWJ.png", "block-thumb": "https://storage.googleapis.com/plotly-prod-images/cynthiawang630/7/8_ZJD6VDQ37FLP2MSM98SIPZ9T7SYC00.png", "list-thumb": "https://storage.googleapis.com/plotly-prod-images/cynthiawang630/7/9_D68OOCN8BYS77TRFUY9N59WT3K30LB.png" }, "api_urls": { "files": "https://api.plotly.com/v2/files/cynthiawang630:7", "plots": "https://api.plotly.com/v2/plots/cynthiawang630:7", "parent": "https://api.plotly.com/v2/folders/home?user=cynthiawang630" }, "owner": "cynthiawang630", "parent": -1, "preview": "", "referencers": [], "references": [], "title": "", "views": 2, "web_url": "https://chart-studio.plotly.com/~cynthiawang630/7/", "world_readable": true, "date_modified": "2024-04-24T01:29:35.388Z", "stars": { "results": [], "count": 0 }, "collaborators": { "results": [], "count": 0 }, "subfolder_count": null, "refresh_interval": null, "organize_view_url": "https://chart-studio.plotly.com/~cynthiawang630/7/", "current_user_permission": "read", "is_theme": null, "is_template": false, "autosize": true, "caption": "", "figure": { "data": [ { "meta": { "columnNames": { "x": "C", "y": "E" } }, "mode": "lines", "type": "scatter", "xsrc": "cynthiawang630:6:3798ac", "ysrc": "cynthiawang630:6:571c38", "stackgroup": null } ], "frames": [], "layout": { "xaxis": { "type": "linear", "range": [ 0.02083333, 4 ], "title": { "text": "Time (Days)" }, "autorange": true }, "yaxis": { "type": "linear", "range": [ -0.8421052631578948, 28 ], "title": { "text": "Sleep / 30 minute bin" }, "autorange": true }, "shapes": [ { "x0": 2, "x1": 2.5, "y0": 25, "y1": 28, "line": { "color": "#444444" }, "opacity": 0.3, "fillcolor": "rgb(22, 39, 199)" } ], "autosize": true, "template": { "data": { "bar": [ { "type": "bar", "marker": { "colorbar": { "ticks": "", "outlinewidth": 0 } } } ], "table": [ { "type": "table", "cells": { "fill": { "color": "#EBF0F8" }, "line": { "color": "white" } }, "header": { "fill": { "color": "#C8D4E3" }, "line": { "color": "white" } } } ], "carpet": [ { "type": "carpet", "aaxis": { "gridcolor": "#C8D4E3", "linecolor": "#C8D4E3", "endlinecolor": "#2a3f5f", "minorgridcolor": "#C8D4E3", "startlinecolor": "#2a3f5f" }, "baxis": { "gridcolor": "#C8D4E3", "linecolor": "#C8D4E3", "endlinecolor": "#2a3f5f", "minorgridcolor": "#C8D4E3", "startlinecolor": "#2a3f5f" } } ], "mesh3d": [ { "type": "mesh3d", "colorbar": { "ticks": "", "outlinewidth": 0 } } ], "contour": [ { "type": "contour", "colorbar": { "ticks": "", "outlinewidth": 0 }, "autocolorscale": true } ], "heatmap": [ { "type": "heatmap", "colorbar": { "ticks": "", "outlinewidth": 0 }, "autocolorscale": true } ], "scatter": [ { "type": "scatter", "marker": { "colorbar": { "ticks": "", "outlinewidth": 0 } } } ], "surface": [ { "type": "surface", "colorbar": { "ticks": "", "outlinewidth": 0 } } ], "heatmapgl": [ { "type": "heatmapgl", "colorbar": { "ticks": "", "outlinewidth": 0 } } ], "histogram": [ { "type": "histogram", "marker": { "colorbar": { "ticks": "", "outlinewidth": 0 } } } ], "parcoords": [ { "line": { "colorbar": { "ticks": "", "outlinewidth": 0 } }, "type": "parcoords" } ], "scatter3d": [ { "type": "scatter3d", "marker": { "colorbar": { "ticks": "", "outlinewidth": 0 } } } ], "scattergl": [ { "type": "scattergl", "marker": { "colorbar": { "ticks": "", "outlinewidth": 0 } } } ], "choropleth": [ { "type": "choropleth", "colorbar": { "ticks": "", "outlinewidth": 0 } } ], "scattergeo": [ { "type": "scattergeo", "marker": { "colorbar": { "ticks": "", "outlinewidth": 0 } } } ], "histogram2d": [ { "type": "histogram2d", "colorbar": { "ticks": "", "outlinewidth": 0 }, "autocolorscale": true } ], "scatterpolar": [ { "type": "scatterpolar", "marker": { "colorbar": { "ticks": "", "outlinewidth": 0 } } } ], "contourcarpet": [ { "type": "contourcarpet", "colorbar": { "ticks": "", "outlinewidth": 0 } } ], "scattercarpet": [ { "type": "scattercarpet", "marker": { "colorbar": { "ticks": "", "outlinewidth": 0 } } } ], "scattermapbox": [ { "type": "scattermapbox", "marker": { "colorbar": { "ticks": "", "outlinewidth": 0 } } } ], "scatterpolargl": [ { "type": "scatterpolargl", "marker": { "colorbar": { "ticks": "", "outlinewidth": 0 } } } ], "scatterternary": [ { "type": "scatterternary", "marker": { "colorbar": { "ticks": "", "outlinewidth": 0 } } } ], "histogram2dcontour": [ { "type": "histogram2dcontour", "colorbar": { "ticks": "", "outlinewidth": 0 }, "autocolorscale": true } ] }, "layout": { "geo": { "bgcolor": "white", "showland": true, "lakecolor": "white", "landcolor": "white", "showlakes": true, "subunitcolor": "#C8D4E3" }, "font": { "color": "#2a3f5f" }, "polar": { "bgcolor": "white", "radialaxis": { "ticks": "", "gridcolor": "#EBF0F8", "linecolor": "#EBF0F8" }, "angularaxis": { "ticks": "", "gridcolor": "#EBF0F8", "linecolor": "#EBF0F8" } }, "scene": { "xaxis": { "ticks": "", "gridcolor": "#DFE8F3", "gridwidth": 2, "linecolor": "#EBF0F8", "zerolinecolor": "#EBF0F8", "showbackground": true, "backgroundcolor": "white" }, "yaxis": { "ticks": "", "gridcolor": "#DFE8F3", "gridwidth": 2, "linecolor": "#EBF0F8", "zerolinecolor": "#EBF0F8", "showbackground": true, "backgroundcolor": "white" }, "zaxis": { "ticks": "", "gridcolor": "#DFE8F3", "gridwidth": 2, "linecolor": "#EBF0F8", "zerolinecolor": "#EBF0F8", "showbackground": true, "backgroundcolor": "white" } }, "title": { "x": 0.05 }, "xaxis": { "ticks": "", "gridcolor": "#EBF0F8", "linecolor": "#EBF0F8", "automargin": true, "zerolinecolor": "#EBF0F8", "zerolinewidth": 2 }, "yaxis": { "ticks": "", "gridcolor": "#EBF0F8", "linecolor": "#EBF0F8", "automargin": true, "zerolinecolor": "#EBF0F8", "zerolinewidth": 2 }, "ternary": { "aaxis": { "ticks": "", "gridcolor": "#DFE8F3", "linecolor": "#A2B1C6" }, "baxis": { "ticks": "", "gridcolor": "#DFE8F3", "linecolor": "#A2B1C6" }, "caxis": { "ticks": "", "gridcolor": "#DFE8F3", "linecolor": "#A2B1C6" }, "bgcolor": "white" }, "colorway": [ "#636efa", "#EF553B", "#00cc96", "#ab63fa", "#19d3f3", "#e763fa", "#fecb52", "#ffa15a", "#ff6692", "#b6e880" ], "hovermode": "closest", "colorscale": { "diverging": [ [ 0, "#8e0152" ], [ 0.1, "#c51b7d" ], [ 0.2, "#de77ae" ], [ 0.3, "#f1b6da" ], [ 0.4, "#fde0ef" ], [ 0.5, "#f7f7f7" ], [ 0.6, "#e6f5d0" ], [ 0.7, "#b8e186" ], [ 0.8, "#7fbc41" ], [ 0.9, "#4d9221" ], [ 1, "#276419" ] ], "sequential": [ [ 0, "#0508b8" ], [ 0.0893854748603352, "#1910d8" ], [ 0.1787709497206704, "#3c19f0" ], [ 0.2681564245810056, "#6b1cfb" ], [ 0.3575418994413408, "#981cfd" ], [ 0.44692737430167595, "#bf1cfd" ], [ 0.5363128491620112, "#dd2bfd" ], [ 0.6256983240223464, "#f246fe" ], [ 0.7150837988826816, "#fc67fd" ], [ 0.8044692737430168, "#fe88fc" ], [ 0.8938547486033519, "#fea5fd" ], [ 0.9832402234636871, "#febefe" ], [ 1, "#fec3fe" ] ], "sequentialminus": [ [ 0, "#0508b8" ], [ 0.0893854748603352, "#1910d8" ], [ 0.1787709497206704, "#3c19f0" ], [ 0.2681564245810056, "#6b1cfb" ], [ 0.3575418994413408, "#981cfd" ], [ 0.44692737430167595, "#bf1cfd" ], [ 0.5363128491620112, "#dd2bfd" ], [ 0.6256983240223464, "#f246fe" ], [ 0.7150837988826816, "#fc67fd" ], [ 0.8044692737430168, "#fe88fc" ], [ 0.8938547486033519, "#fea5fd" ], [ 0.9832402234636871, "#febefe" ], [ 1, "#fec3fe" ] ] }, "plot_bgcolor": "white", "paper_bgcolor": "white", "shapedefaults": { "line": { "width": 0 }, "opacity": 0.4, "fillcolor": "#506784" }, "annotationdefaults": { "arrowhead": 0, "arrowcolor": "#506784", "arrowwidth": 1 } }, "themeRef": "PLOTLY_WHITE" } } }, "height": null, "width": null, "user": { "profile_url": "https://chart-studio.plotly.com/~cynthiawang630", "avatar_url": "https://storage.googleapis.com/plotly-prod-profiles/29.jpg", "background_url": "https://storage.googleapis.com/plotly-prod-profiles/bg-13.jpg", "bio": "", "nickname": "", "website": "", "stream_tokens": null, "feature_set_id": null, "csrf_token": null, "date_joined": "2024-02-23 20:11:56", "mapbox_access_tokens": null, "has_password": null, "username": "cynthiawang630", "email": null, "is_active": null, "readonly": null, "is_dash_creator": null, "dash_created_count": null, "is_chart_creator": null, "charts_created_count": null } }, { "creation_time": "2024-03-31T22:35:26.772430Z", "comments": { "results": [], "count": 0 }, "parented": true, "embed_url": "https://chart-studio.plotly.com/~simon.verstraete/7.embed", "fid": "simon.verstraete:7", "filename": "Plot 7", "filetype": "plot", "img_url": "https://storage.googleapis.com/plotly-prod-images/simon.verstraete/7/9_YW4EBMBPIHVAEPD5G447HHRUT5FE5V.png", "image_urls": { "default": "https://storage.googleapis.com/plotly-prod-images/simon.verstraete/7/2_AJWB8N7G1AGQN71CBHDGWFO0XW2J20.png", "block-thumb": "https://storage.googleapis.com/plotly-prod-images/simon.verstraete/7/8_UFF88G9Z5DJC27GW4EF691P324JY2H.png", "list-thumb": "https://storage.googleapis.com/plotly-prod-images/simon.verstraete/7/9_YW4EBMBPIHVAEPD5G447HHRUT5FE5V.png" }, "api_urls": { "files": "https://api.plotly.com/v2/files/simon.verstraete:7", "plots": "https://api.plotly.com/v2/plots/simon.verstraete:7", "parent": "https://api.plotly.com/v2/folders/home?user=simon.verstraete" }, "owner": "simon.verstraete", "parent": -1, "preview": "", "referencers": [], "references": [], "title": "", "views": 2, "web_url": "https://chart-studio.plotly.com/~simon.verstraete/7/", "world_readable": true, "date_modified": "2024-04-19T09:59:25.293Z", "stars": { "results": [], "count": 0 }, "collaborators": { "results": [], "count": 0 }, "subfolder_count": null, "refresh_interval": null, "organize_view_url": "https://chart-studio.plotly.com/~simon.verstraete/7/", "current_user_permission": "read", "is_theme": null, "is_template": false, "autosize": true, "caption": "", "figure": { "data": [ { "meta": { "columnNames": { "x": "SS1_H", "y": "UTS [MPa]" } }, "mode": "markers", "name": "SS1 H", "type": "scatter", "xsrc": "simon.verstraete:0:c21d58", "ysrc": "simon.verstraete:0:d13d23", "visible": true, "hoverinfo": "x+y+name", "hoverlabel": { "namelength": 15 } }, { "meta": { "columnNames": { "x": "SS1_V", "y": "UTS [MPa]" } }, "mode": "markers", "name": "SS1 V", "type": "scatter", "xsrc": "simon.verstraete:1:9ec2c6", "ysrc": "simon.verstraete:1:bb235e", "visible": true, "stackgroup": null }, { "meta": { "columnNames": { "x": "SS2_H", "y": "UTS [MPa]" } }, "mode": "markers", "name": "SS2 H", "type": "scatter", "xsrc": "simon.verstraete:4:a4db5d", "ysrc": "simon.verstraete:4:17bbd0", "visible": true, "stackgroup": null }, { "meta": { "columnNames": { "x": "SS2_V", "y": "UTS [MPa]" } }, "mode": "markers", "name": "SS2 V", "type": "scatter", "xsrc": "simon.verstraete:5:3ec18c", "ysrc": "simon.verstraete:1:bb235e", "marker": { "opacity": 1 }, "visible": true, "stackgroup": null }, { "meta": { "columnNames": { "x": "SS3_H", "y": "UTS [MPa]" } }, "mode": "markers", "name": "SS3 H", "type": "scatter", "xsrc": "simon.verstraete:2:c5335c", "ysrc": "simon.verstraete:2:d1bdf0", "visible": true, "stackgroup": null }, { "meta": { "columnNames": { "x": "SS3_V", "y": "UTS [MPa]" } }, "mode": "markers", "name": "SS3 V", "type": "scatter", "xsrc": "simon.verstraete:3:a26994", "ysrc": "simon.verstraete:3:23ad1c", "visible": true, "stackgroup": null } ], "frames": [], "layout": { "font": { "size": 11 }, "title": { "x": 0.48, "text": "Ultima Tensile Strenght" }, "xaxis": { "side": "bottom", "type": "category", "dtick": 1, "range": [ -1, 54 ], "tick0": -1, "ticks": "", "title": { "text": "Percentage Core [%]" }, "nticks": 0, "tickson": "boundaries", "showgrid": true, "showline": true, "tickfont": { "size": 11 }, "tickmode": "linear", "zeroline": true, "autorange": false, "gridcolor": "rgb(212, 212, 212)", "gridwidth": 2, "linecolor": "rgb(0, 0, 0)", "tickangle": 45, "automargin": true, "fixedrange": false, "showspikes": false, "ticksuffix": "%", "rangeslider": { "range": [ -3.1401666223522104, 56.14016662235221 ], "yaxis": {}, "visible": false, "autorange": true }, "zerolinecolor": "rgb(0, 0, 0)", "zerolinewidth": 1, "showticklabels": false, "spikethickness": 18, "separatethousands": false }, "yaxis": { "type": "linear", "dtick": 29, "range": [ 0, 57.29814517969662 ], "tick0": 0, "title": { "text": "Stress [MPa]" }, "mirror": false, "nticks": 0, "showgrid": true, "showline": true, "tickmode": "auto", "zeroline": true, "autorange": false, "gridcolor": "rgb(181, 181, 181)", "gridwidth": 1, "linecolor": "rgb(0, 0, 0)", "fixedrange": false, "showspikes": false, "zerolinecolor": "rgb(0, 0, 0)", "zerolinewidth": 1, "separatethousands": false }, "images": [ { "x": -0.39000000000000057, "y": 1.0399999999999991, "xref": "x", "yref": "y", "sizex": 9.7, "sizey": 5.3100000000000005, "source": "data:image/png;base64,iVBORw0KGgoAAAANSUhEUgAAAnIAAAB+CAYAAACgc/zHAAAAAXNSR0IArs4c6QAAAARnQU1BAACxjwv8YQUAAAAJcEhZcwAAEnQAABJ0Ad5mH3gAACvMSURBVHhe7Z0JnE3lG8efUigVkSUkIqSQXfZdZMkuZMu+G8bYDcY29jX7mj1K1oTKvi9D2bXIn6iIsjP/83vmnJk716ylmXvO/X37+My5516a555z3vf3Pu+zPBFsIIQQQgghxHY8af4khBBCCCE2g0KOEEIIIcSmUMgRQgghhNgUCjlCCCGEEJtCIUcIIYQQYlMo5AghhBBCbAqFHCGEEEKITaGQI4QQQgixKRRyhBBCCCE2hUKOEEIIIcSmUMgRQgghhNgUCjlCCCGEEJtCIUcIIYQQYlMo5AghhBBCbAqFHCGEEEKITaGQI4QQQgixKRRyhBBCCCE2hUKOEEIIIcSmUMgRQgghhNgUCjlCCCGEEJtCIUcIIYQQYlMo5AghhBBCbAqFHCGEEEKITaGQI4QQQgixKRRyhBBCCCE2hUKOEEIIIcSmUMgRQgghhNgUCjlCCCGEEJtCIUcIIYQQYlMo5AghhBBCbAqFHCGEEEKITaGQI4QQQgixKRRyhBBCCCE2hUKOEEIIIcSmUMgRQgghhNgUCjlCCCGEEJtCIUcIIYR4CKfO/SKTZn9mviIkeijkCPEwfvrlVwkODjZfEW/l5wuXzSPiLZz54YI07zpCPp6/SkZMXmyeJSRqEvgbmMeEeAQfdhwiB4+elj9v/C3pXk4piRI+bb7jfG7euiOlanWWecu/lB9+vigpkieVNKmSm+8Sb2H9lj3S0neU/Hn9bylWMKd5ljidh8YCbv3Xe+Ta9b/kyPdn5a+/b/H6k2h5wlj5e9TS/++bt+XrnYd0Iv/j6nVJ9VIyyZcrq5Qrnl8SJKAD0en89sefUrJmZ/OVyNNPJZA6VUtJ+6Y1JFnS58yzzuXk2fNS86N+5qsQyhXPJz07NpSXKei8AnhjXLfWGtepKH7tPzBfEaeDMbBJ52Hy4/lL+tpbrv/Dh8GybPXXsnTVFjn300VJlOhpyZUjs9SpUlIqlCwgTzzxhPlJ4o7HCLmbt27LzEVrZd6yL+X2nbvm2TBeSZtKAvu21gvrZHbt/05eTPa8pH85pTyX5BnzrPdw9c8bMnPhWjlx5mfZf+Sk3H/wQM+nePEFmRDQSd5+M4u+dioYzI6f/kl27Dsqn675Vi5c+k3PQ8RONOzPmzOrvibO4+7de9Jv5GxZ89Uu80wY3jKZX/vzL9l35ISGF9y9d19SGGNhzjdekxxZM5qf8A68Tczdu/9AOvWdIFt3HzHPhKdgnuwysl9beSl5UvMMccUjhNy+wyekR8BUufzbNfOMyJNPPiEvp0oh1/+6KTeMP+Dpp5+SUf3bqofCieBS5KnQUu4ZAxhI+nwS3VpM//JLkjbNSyruqlcsKs8+k1jfdzrYVlr0+SaZZQj8W7fv6vWfOtxHCufLYX7C2UDUfbr2Wxk9daluscD+j4d1lXfyv2l+gjgFLGAwkWEnAryW4WUZ6Ntc+gXO8orJHIu2WYvXyfa9QXrfu5MhXWpp07iaVKtQxGs8M94k5gInL9ZwEoD5rUq5wsbiPakEHT9rLGqP6fl0xhw4Z1xP/UnCE+9CbsbCNTJh1orQhzd1yhelVaOq+sDiguL8NzsPycAx8/TGTpwooSya0k+yZX5FP+8kfr1yVcrU6Wq+ihh4ZKYF+niNmAMIAG7ba6z879Jv6qVcMXOQilpv4dzPF6VNj9HqnUvybGJZPn2gvJo+tfkusTtnf/qftOs5Vn65eEVfF8n/lozxbyfPP/es4ydzLN4Dxs+XzdsOmmdCQBgNxnrszjx48NA8K1I4bw4J7NdGPfTegDeIOdwDmPcgRV5OnULmj++ljguLvYdOSFf/SeqtzWQscJZ83N8rd6uiIt6EHARawPgFuh9uUadKKfFtV18nK3cwidVpNUC9NHiYZ43pYb7jLLC9csV4eCHqrvx+zXiQr8nW3UHGSvWovo+YsekjfdXV7E0ggw/XH56pEoVzy8fDoxa8TuP8/y5L3Vb+6qFGzOj8Cb3Nd7wDxM6e+fGCnDp3Xie3Fg2q6LNgdxBK0dV/cuiuQ/3qZaRXp4byVIIw25w6mWMbrefQ6TqmA1zPd8sU0nngzWwZVchhd+JA0ClZsGKjsaA/rJ/DIm7maF8Nt/EGnC7mFq78SoZOWKjHs8f6SaE8b+ixKyjJ0rB9gIZg4f7w797UfIeAeMlaxQrLb8g0+XzDdn2NLaNBvs2kbZPqktA4jogXjNXp80melW93HdGVa9Xy70jSF5wX/J7AGMBhK1YmWTKm09XKnKXrDeH7UAe6MQM7eGUWU9IXkujP3Qe/1/gZp17/yMA2+zOJE8q2PUfl4q+/S5H8b2rogdNArMy5n/6n13nd5t06gY+b8amMmbZMVqzdqpM5Vugnz5yX8iULSIIn7ZsAhfGv28Ap6nVCKIlf+wbS8aOaxnF4m+B9r1iqgNrulGzGuUs3SJ8Rs0LjobE4mRbYXWpXKSlpjbHvKVOkwzOXPm1Kea9sYXnj9VeN8f+w/H71un4XlQzR5w07E068/q6s3bRbgo6fk+TJnpd+XRubZ8MDDyzGPzg0Tpz5SWq8W1w91iSEeBkFB46Zq+n1ABcHcU81KhXX11FRplhe80iMi3nePHIuGOi7Dpikq1JLxJUpmsd81/uAJ84CMTXexrulC5lH8GYEmUf2BBsB8LIjQx3hFb6DP5bqzfpI/oqt5P1mfaXH4Kl6HpMXttSx2EPQuwX+3votu81X9uTYiR9Ctw27tqojH9auoMcRgSDveeN7ScZX0ujr+cu/1LgiOzJ66jIZ+fGS0FqJ7YwFvKttkYGxD55obKthMY97JJ42lOKciK6/U+rMJXw6pLwUYuKiomblEhofid28LTvCb8V7O3Eu5CbOXqkra4CVxszRPWIcvP70U2Heutt37phHzmTJqi3SZ/hMvWkp4kJwHbSxMnUCSOJo2X2UbPx2v3kmcrDosbh0+Q/zyB4gCxlbKANGzZEP2g2WgpXbSoX63aVD7/HqcVu3eY/GQiJLGfd71tfSqxemS8vaMssYI76YO0RuG9+VRYsG70m1CkXNV/akaoUi6mkFE2at1Gc+Ktwn89eN78huYPyfvWSd+UqkSrl35JV0qdTTghio6IBXbvSAdnqcNfMrXlWSwrr+iBMDdhZzrnGPuP4A4SNWlYKIQMiVNQZiV4aEEacxctv2BEkbvzF6nDDh0zJtRLdYxXphW6mN32g9RowcYuWcCAb0wWPn6zFFXBhT5q2SyXNC6msh4BkTvd1BEs+yL77WLaTAvm3k3dIFzXce5ctv9oqP/xQ9blKnovSwSZzMlh2HxAee5fuPDtLIQMv62isqSl7PlF4FXMYMacLFiGHQ/qhboG4pA4g4eLCcwKUrfxjfzWTdLgPN6leSbq3rRilQEDN1IOikVCwV+b3iiWAB33/kbPPVo2BOQPwTxPuzzyQyz0YMPLKli3jPmIgF/d5Dx2XVlztk07b9WjgcQNwh+Qs/PRkItOWrv5HP1m/TsAi8xnbpW9kzyavp06goBZHFyAEsBmu16K/HThoDHgdxJuQQ11C9aR9NswdjDXFSoWR+PY4pHfuM10kBQbDbV00K56FwChRxEYPaauj4AA8WBvwty8fIi0mfN9+1L39cuyHNug5XbxQmb0xizetX1pgpV36+8Kth/1CdxIFdFjKIgXq3QQ9N3AHINm9Qo5wKtiyZ0kUb43T2xwvS3Ccw1G4nDuAInYD3fe3mkK3ilg2r6H3gJBCoj0LXd+7e09fYJqtUpqCkTJFMLlz8zRAnB2TNVztV7OPemDLchwWwDZCx/oUh3r7YuEMT4FxBsseU4V21VI0ng0Sedr3GhpbWiQqEWAX4fWS+CgPeWnQ6+f7Uj/p65ihflmFyIc6EHMSJtXWA8iKdW9TS45iyx1iNoAcdQJAr6sk5DYq4iEFpgt7DZ2iAL2jbuLp0aF5Dj50AxFyjDgGh2wXZs2SQhjXLSa43MsuDhw9122nmwjWasQqKF8olU0f46LEdQMYZxCoGYwjUYb1b6ZZadODv4Zm3Fn9OXoXD4+LjP1m+2hqyxT7Gv70GuDuFxp2GavYpiMybDo9LB2OxDs9r5ozpZNHkvl5bFB2hBhBwx07+YJ4NAU6MciXyqeCB58rTt5ZxX7fqMUqzswEKmzc0FnI5jbEN/PTLJdl14DvZYYxxlsceGctli+ULzVxGLTk0CrAWc06uWvFPiRMhhwcTq3K4UzFJLZ02INzWSXRgAkPpBeyh48b9fHaAruadBEVceHCtkdCAhA/XxIayxfPKWP8OtmjXhpUoSmbkeet180zkaHmdlgO0v2xUoMI9BjFkNtuJ2Io5p4g4eCQxGcUEfBZbR/BeYdtpw6JAR2RlwhMDbzrA1nH3NvX0OCJQZqhe65AyOw1rlpfenRqa7zgbeGW/2XVYxRsSmdxjxXLnyCw1KheXSqUL2UrcwpPYa+gMPUZ84/SR3TU71R30la7apHe0yStIeELpKSfsxjxO4kTIoWI3ygeABRN7x6rNEBQ93LKIrwOR1ZCBC3rjN/t0QnwlbUpdscBtbwecKOIwMA0Z/4kKMmDdZsHGfxY4hfMIfL1//74xkd2Tv27ekqvXbuik5gom/w7NakqrRlU8fhUKIOKwFYAEHdzzMQHemC79J+lKtMDb2TWexKqxhUBfq+dsdPFDnkpMxZxTRBxKqKDMRmy8p4j9QgIIGNCtqdQ1rrndQVwc4uOw+Ni4ZFS0ZSPmLtsgI6cs0cX+9lUTHV1mIuj7sxr3hioO7os4xL0hoQcCztO3TyOjaZfh2rkpUcKnZd3CEZImZeTb5Yh/Rxw8PgOvIxYACClB6a1smTOoh/qDGmVj5QTyFuJEyFkXE944BGbGhoGj58qy1d/oMarZfzpjYLhVKrbbhk9apJ4bV1Mw8SEOr2iBt8wznsnjEnEomLr38HG5fOWqJE6cSN7MmjHevJYQZp37TdRJ6d+CwQxtyWobAj6Dmd0UEZ5kP9jw9V6tEQbmjuupwiwmNOowRA4dOy0j+rSWymULyy8XL+uWQ4a0qbQER2R4mv2REZ2Y+6ciztPsxza5FRO2et7Q0EzD6MDC9Z2q7XRcQ7kl9NeNCZ58/d/7sKd6GauUf0fv6+jA4g87OGDikM4xGg+RNHL42BmNxU71UjLJnSOL/vREsEP1xcadhoDb/kj2JeaAUkXyqCMCdeJiuvPgqfYXqdZeF6MQYQgXiAr0GEZ9WYwLWz+bECuvm52u/39BnAg5PJR4OGPrKketIaxoARIbPpnUV8WgBdyxyIK1Wttg77yIIdxQMBAxBhB8n88J8NjebI9DxGEgQEr/5u0HtSuEK8gIRpFR1+8srkB2KbJMLRDzlTb1SxrzhRUWbjtMWtYxvGwohPrMM4l05Z7qpRe1zEJ0185T7YdHsly9bhrXgS2FJVP7x2glaVU5R1LAylmDzbOR46n2R0VkYu6fiDhPtR9JOSVqdNTswvIl8su4QR3Md6KnauNeusOALF6MX1Fhh+tfoFJr/R6wpYqt1ehwbVWI3RfswkTG7gPfy+S5n8vBoyHxdxYQQFXLF5Ee7T4ILSYen0Bob/x2n3rf4NRwB9cI4g3PAeLIYoqn21+yZmcdA+tVLyP9Iyn2a4FY4eLvd9Tj8YM7xqinul2u/39NnHR2WLhyk7qN334zS4yqUWNix7bcJyu+0teYACcN7SJ5c4bFGiEwFp4+dD7AxI/kB2R64TMVShYwzl/VlH5sbaEKvqfxb0UcYijGz1whfgHTjAnwfLi6PBbYZl69cYe89mpa/ROXFEQKuXEd95nxbVgpdW9TV0q+k1uruOfLlU3y586mnip8Fj/xGvcIhA+8b1HFgXm6/RhIsKLcYkywGMieNISqfifRcOnyVS0zgu+rkbHwiSy+ytPtjwrEfyFhA3ZC8OA7SvBkAn0eYiriPN1+PNN3797X+E50qsDWGIRZdMCDN3b6crUHHQ6wnR4Rdrr+MxaulXv37+szjuc+OhAjZiV91KpcIkJvJiZ930FTZfysFXLxckhZGlcwh2CO+PKbfVLUmHPiI6YKC9Wd+7/TRW2/wNlaKxLFrS0gMGq/V1L8uzWV9k3fl1w5MkviGFZisIP9AF1YsNjAgg1dO6LimcSJZPFnmzWsBskuUe1i2MX+uCJOhBxc/vCe3TJWZfXfL2OejRgM7H5Dpoe278KEiPpariIHA1QzQ8ThYmI/fd6EXo/E3WEFtGnrAUn2wnO6ReVJ/FsRB9c8PJGIq3ho3LAAAggTXzdj1dugRlmNE0Tl+L+M7wGrdaRq47uKS1zFHGLG8HuUK5b3X8e82MV+eNUwmPxw/pLsDzqltdIyRzOhrv5qZ+jqEn03I/qu7GJ/VLiLOWSlW3GR0Yk4u9iPiXnztgMqTrfvPSYlCueKtt4XFr3oQQoQJ+TazcTCbtd/254jxmT7hy7IUQQ5KhBG4Ddkqo7t+HzvTo0eETfwaH3kExhaigIioULJguLbtp4u5qtVLCqJjAXQsRPn1IGwddcRjTWLadLJ4+LuvfsybOJC/f4hvAF+12IFc+nvOah7MylV5O1Y14Czi/0AXRvwjMOx8k6+HNp6MipmLVmn4wA8lJE5fexkf1wRJ0IODyK2Ov+4dl0zVnJmD2u14wpqRmGAwqAOECA5blBHHdAs8KC39h0tP/5ySZMZEEiO2Dl3EFyL/m3w/pSO5Xblf8m/FXHYfkIDZQhjgJXGoB7NpWeHBlrpHKs8uOZzGwN7xdIFNVYL8Ta4+VG/K64TBR63mLOT/fh/QaygPzA8bLAdnpHMGSMWcwg/QOcDbJHh++n0US0dpFyx2/WPCog59Iu1vC8AE9vgHo/WkbKwk/3oF4rtzTWbdhsLy1sq6grlfSPSJCwI+N7DZqp3Db8nPDXuk7wdrz+2VVFC58KlK1K0QM5IBSW8KP0CZ4WWqqj+brFHFuGYRxB/i6QogMXSlGFd5cPa5XUewHOD7xci4M2smWT913vk+o2bKgxdWzzGBRCiFUoVUEGNe6FZvUoyrFdLqVettPbRhpMittjJfgBvKq4nYthwD75X7h31vEUE5v85ZigVFj0Fcj/qkbOb/XFFnAi5jOnTGIPUaY1lwwOdKGFCTSO2Gl5j62nagtXGIDZDLpuFQzHIo9ghVpKuLFzxlWbzQV3PGesX4ZYB3NfIlLpviL42javF67aCK/9WxB3+7oy06BZorPBDWtkgu3H22J7htpxdeeH5JLqdgyBSrEzeyPKq8V3EffbT4xJzdrQfixGUTEHiBwYTxMncvH1HPSiuyQvfnfzRWMSMVsEH4FVxX5Ha9fpHBkRJ90Efh8tQRpZahnSptduDO3a0P3myF/T3g/cM9/7qjTv1nsj+eobQxvDYglu+5lvtHWrFuTWuU1HeN4SMK3a9/tmyZJDVxu+ACRXjP+5rfC+uQGz2HDJNJ2qAQHUs4l0n/cWfb1ahZ3khkQSFZIjIvDyIsb1z557OPRAJdaqWjvOMb4g5iNFGtcob1ymrJuH9U+xoPxYOBd7OpvcgioKjXhw6criXUEFIga9x/1tbz6hQgNACV+xof1wRJ0IOF7Nk4dw6maG0BAoALl31tezYf0wWrdykpUn2B53UAQ2g0CF6sGKf3BWs2Lr5T1E13r1tPSkbgcLGQNi21zitFo5trF4dG8XLKjQisGWCVck/EXHYokObohvGgAcQazYtsLtuHUcFJsVP13wj2GrGDR9f8YL/VszZ2X4M3hjMce1//e2qZlehLddpY3DB5Ixil2OmLw+1DZXth/dpFU7o2f36uwMR55rYUOu9EhrrYsXMuYs5O9uv/98Cb6ld+P13GuMeJiXcDyiZFDhlsQo9K84NrbfgjXP1xtrZfoiZgm9n13i9a9f/Nhbi2+X6X3/rQh7XfO2mXdLLWMQfPX5OP4/+szNG+Qo6F1hg8e4/eq75SqRj85ri16GB/ttRgQQrbFdjboE3NKLdm/8ad6/6P8HO9ic17tE8hojd8PUeTWSBLVjEpE6ZXGOH9x85YSxipskRYywE2EVDzKArdrY/Loizqqpw9y+e0k+3TgAGcGScoHK1FT+QOuWLMqRnCxVxEcUNIIUdLlpsH9R/v6x5Ngxsu3YzVviozQO3NVp9PI6H6HHRzrg5cQPGVsRhy611j9G6agXobDEhoJOu7GOCtfq1KmPHF+2b1ZB2TarrMVZeTboMDxf8GxlOsB9bYPMn9NasPSws4CGBd2bOkvXqpcAiBWAQQ79B1xI7Trn+Fu4iDjFxg3yby5yxPXWcwKCLwrAWTrA/Z/ZM8umMQeqdBVjM4Lqj5aD1e0G4o2PJ6AFtw227OcF+xDzNHuOnOy3wwKIaAYQpEtaQtGG1cMNEu3By+OoE+I5ce7Si8gF2WmIC/n8WnnL/xxYn2A+v8bzxvXVeR7Fn1AksV9dHClZuIy27h7XewsJjVP92emzh7dc/JsSZkAPwvkwe2sW4oL10BY5gYFxgBCIi3XjDwkDdTohMfCFwF0Blw6vlys1bt6VT3wm66gX9ujbWf9/TwA0YGxEHDyNiAqybEPv88NZEtxKxwCof21UgRfKwmzq+iK2Yc5L96BGLEgxr5g/TdPy0ZmkV3O/o2IBSCxBxEH0WTrv+YNaiteFEnJXYAE8kxFy3NnVD7xEn2Y+F6oTBnWT5dH8txYSOH9g1wJYbxoV1C4Zr+znXHQQn2Y/xeNXcIRo24L7FiO8Gi9zPZgeEy1JFxqNfwNTQ3Ro8P/juYooVSwhcJ3W74CT7EQrwxbyhUrda6QgXIWjbtuTj/uHqv3n79Y8pcVJH7nGB7YESNTrJ3Xv3ZMHEPhpnBFBmpN+IWXL2p//pa9929aVp3Xf1OCrg3XvhuSQevW8eMG6BbsMAeGvQLBiCIKYg5b3rgEl6PMa/nW7beAKudeYgaOaN6xkqbFxxqv0W8CJj3o5sYnai/YiH6dhnvJaZiSo7FTj9+keHU+2/d+++tq+DdyZVimTyavo0jyzg8ZkP2g2W46d/0tcffVBZfFrX1eOYMmT8Aln02WYVx9+sGBfrDNH4xMn2Y0fi0NHT8qsxBydJ8oxxb2eTl1OFT4Lx9usfG+LUI/dvwSquRcP3VJ3DJY/thrqt/aWBcbEh4pAAgcrhkYk4TJqIS0FM3vvN+krZOj76b8Cb54kgAN4axJHpheDf2AzisHfK3M/1GN9N8UKPljKIL1w9c9f+vKGxY+442X4LeJYjE3FOtR+r8cnDukYr4rzh+keFk+3HNjKEPOKh4YGLaBdm4WebQidxZH93aRn1/eIOkutWrtumxxDBdpvEnWw/4iARZoWdCRRBdhdxwNuvf2ywlZADbT6sJi0bVpEHDx5ojAkGO4BWXMtnDNQ2MK6gYDBKkaCHZdFq7VUAovfr6R9+CY1DORB0Wn96GmOmh/SnBYH92khEzYajYsbCNWonQP0+T/M8Qsyh7s+0wG4RNpZ3uv3R4WT73UMjIoLX33vtRzzg9AWr9Rh2Y4Eem3hnLPYHjJwTmhHdvH5l/WkXaL932x9bbCfk4CLF5L9h0UhNZsCfdZ+MkOkju2v1dCROHAg6pdXR0euwdO0uGiiJWlXYmoUqRyuUMf7tZceqSVqHrnih6LtNxDVYTSAZBOD3xYoiNkDkWqtxdEho1aiqHkcE4pWsmKW4BqLcvZgziCv78cAj0Bq1rjwJ2k/7vdl+jNfYfgMIlUGCW2xA27LdB0O+P3SMQZZvRNB+2u+J9scWW8XIRQYuBAaubXuCZMe+Y6HZXQAqHrF0cM3iD9z5dmDe8i8lcPJiPUZwfEybboOTZ89r0VBkxgGIVjQtdgWCd+XarTL/042hAaHIFOvv00Rye0CSyH9tP2JzZi5co2ntqO8GEEiOfoCRFWyNS2g/7fdm+zv0Hq/lqtKkTC5fLhkZ4+QOgK5AfYbP1GOE46yYOShcKRNA+2m/J9sfW2znkQPIxEIV9HEzPpVaLfpLqVpdpO+IWdpXDSIOXjdkv44e0E52fDFZEyOwIrWLiAPI1gG4AWMziOPvtew+MnQQR4aQ+yCOFj+NOw6VgWPmqYiD2EXsDWpVYQJwb0AcH/yX9qP/ZbUmvXWLHQ8xtvmwzY6M5wbtA0If7PiE9tN+4L32X9KfqL8Xm0l807YDWjTWYmD3ZvodukL7ab+n2x9bbCPkkH4Ppe3jP0WKVu8gHxpCBDEgEB+W1w3p60jtR3YK6tG9W7qgbivYEfSlBcli4VI+88MFadxpqFjdAbBl3KdzIz22QA2v+m0HaaYvAo5ReBFid9/6qVoCAZlC/UfOCa1rFl/8V/av3bxb+/TBiwvBj9iLfRumy/ZVk/TzKIUyYeYK89PxB+2n/cBr7b9t2R91wWNXUFQZBeOxXQbQ4g4191yh/bTfDvbHFo8VcvC6HTp2WibMWiG1Ww6QkjU7q7sUDXix2kRNmGoVisrIfm31IqCIJIQI6nEhtgTJDeXqdZPKjfxk9NRl4qmZqZGB9iIADdddWxhFBtqQYBC36k1B2I4d2DHcaubczxelaZdh+hncxJ9M6qNFiiF28TkIYZyHl861IGt88F/Yj76TfgHTdFsZyRWoWYXkGKzI8B34tW+gn/tm12H9GZ/QftoPvNX+V037j58JyVqMDpSYQIsn2AbQEqv1h+HjAmk/7beL/bHFY4XcghUbpVGHIdqDFSnISHJAQUlUPl86bYB8u3K8DOvdUiqXLaSpzODP639Lp34TpEX3kRosiS1EbDXMXrJOGrQLCN1usANW+zFsFaOFU1Sgh2uzLsNDg0ML580hM0Z1l2cSJ9TXAO+18h2l3xFSvSHi3sqWyXw3DMsTh1pf8cnjth/dPtDLEfahf+/M0b6PZAFaPkgUYY1vaD/tB95qf7ni+fQnGq4jeS0yME4hmQ31wqyxC/XGenVsqMcWtJ/228n+2OKxQg614OAahWIe0be1ZpiixRcqn0OAQNi5gjY29doMlM3bQjo7INMLn4enDhWlkYY/aupSfc8OZMmUTreGwaQ5K7U3pzvwsKG9CRrxWysRFPycOsJHXFs8gYBx81XYIvtn1hi/R+IGAHrBYlsGZQriuyfd47QfDztWa6irhcXAxIDOWlfLnZXrturPN7LGfywl7af93mw/xm+rQDg6W2B3xh0kuKEeKMpLAcwJyHB0LxpL+2m/3eyPLY7IWoWIg/cO2wpwkY4a0E7ryllAwGCbFSvUfeunPSICPRWsxj9oO0gHbIB+jcUK5tKYwIPGjY3VigW2UHza1JUmdSqaZ8KARxPb0wAr9SL5w74bC/y/8Bl8l3WqlNJ2UfHN47J//vIvZcTkxdrHc9WcIbp97A56/aGwNB521OxCu5j4hvbTfm+2H/HPjToEyK3bd9XmUkXy6CL+xt83ZYcxiSPe1wKhNoF920jhfDnMM2HQftpvR/tjg+2FHNKI67X215guXMxZY3rI65nSm++GgIuTt0ILDYLcv2F6uC0HTwf13RDvh0ybyEAdNjQSjiwrFw2K5y7boIGfo/q3Nc+Gge+nQ+9xusJBP1zc7Oh96Ak8DvvrtPLXB3WATxPN4nPn1ytXpWH7wXLx8h86WS6a0l8HDk+A9tN+b7Yfv3fHPhO0nWJEYFFevWJR7RIS0QQNaD/tt6v9McX2Qg5ZrEiAgCdu/sTej4g4gO1WxM6hPgwyWu0Gtk3WfLVLFn22SU6dPa/CC/YWLZhTb2LUx4uKNn5jtMbeuEEdpHyJ/ObZEJCl2m3QlNAt6bEDO0iFkuE/E9/8W/vzVWylAeM7v5j8SGFJDBDIYvrx/CX9N5dO85cM6R7ddo5PaD/t92b7sVj/ZMVXsnrjjtAkLMT5limWT2pXKSlZX3t0zHeF9tN+O9sfIyDk7IqxSg3OUbKJ/tm+96h5Njx/37wV/G4DX/3MiEmLzLP25d79+8G3bt8xX8UM30Efq/3GRGCeCeHK79eCP+w4JPQ7nLdsg/mO5/JP7C9Zs7Pad+aHX8wzIQR9fza4dO0u+l7eCi2DDx49Zb7judB+2u/N9sN2fAexgfbTfqfYHxkJ/A1MTWc7xs/4VPfJa71XIsLYEJQw6T7oYzn83Rl5Lskzuq3ongRgN5588kl56qmwkgIxAfXi1m3erSUK0qRMbqzo78uqL3doKjbKG8A93a9rY2lYs7z5NyIG3zVq+SEoFLEI+Hfjmn9iP2oG4R7Ye/ikZEyfRl/PWLRWBo+dp3FIyHpGizekpEcGvCAHg07Jks+36M+Ced4w34lbaD/t92b7YTu+g9hA+2m/U+yPDFtvrVZq6Cc/X/hVlk3z18xUVyDiUOEZggVAxLkXB/Qmhk74RBau3GS+CgPbzcN7t4owSBS9aXcd+E63ZfEHsQQWiMuZNdpXO0J4OgiWbe4zQlPQ3UE7MgS3pn85pXkmDNiLuEFk8+J7wPdh0ax+Jenepp75yrOh/bSf9tN+2u9c+20t5Ko27qUZXe5CDsV//YZM15YbAIVuUSzY2/li4w5B4URUr06bOoVUKFVA6lcvKyg3YoHq8Fv3HFHhdjDotMbnWOBzqFFVvHBujctBnIJdQAo6euut/zqkoHTW117RFPdKZQqqRxLA1sPHzoQKV/SsdAWit1jBnGp7kfxvamKIXaD9tJ/2037a70z7bS3krGxMVDFHIH/yZC/oBUCqMTx1AAWEUXuORAxELzphbN0dcvMi+NOVzK+m1Ru3eOFcki9n1njZTv0vgZvdWnXt3P+dutot0H8PKzbYX8IQr9mzZDDfcQ60n/bTftpP++1tv62FHJT1B+0Ga0spqGrsnyMLEyR5NrEM6NbUdvVg4oKzP14wRNtRFW4Hgk7q/r8FvG6F8uQwbt6QlYdVlNEpYMv9yPdnjAc3RLiiVpErSGEPXXUVeEszmZwE7af9tJ/2035n2W/78iNoOYX2HOu/3qN14pDUULlMIWnTuLrH1EKLb27euiN7DoV53VAg2ZVMGV7WG7eE8Sd/7myO87qhUDTshnjduf+YLgAsUC8o1xuZdcUF8YpaXJar3SnQftpP+2k/7Xeu/bYXchaoEwNRlyL5C1rl3NtB7CBuXriMDxwJ73VDQWRk3ah4M27gdKbXDYJv98Hv5ferf0qWjOmizOLxZLDqCjp+NlS4orOFKygcXbRATsP2kFUXspYA3Ox7D5/QXnuw3WpcbjdoP+2n/bSf9nuP/Y4RckTk2p9/ycTZK/XmvXDpN/NsCOidGrLqyCUFcmcLl22K7egZC9fInKXrVcxZFHg7u4zxb/9Ic2FP5ftTP8rsJetl575joQ3EAVZdObO/pnF+sP/NrBnDrbqwYkMfXhRddX0cGtYsJ37tG2ishB2g/bSf9tN+2u999lPIOYzJcz6TKfNWaVNgCDHLZRxRk3yAtiSd+k7QhwAgDfut7Jnk4NFTcvm3a5Lzjddk4aS+triZkZnUsc942WE8yBCfqHyPB7eYsfpyr+htsffQCek2cLL8ce2GvkaLltQpkxv/xlFNW29a713xbVtf3/N0aD/tp/20n/Z7of0QcsRZBB0/F3z7zl3zVeT88PPF4DK1u2pl6zzlWwQv/nxz8IMHD/W96zf+Dq7UsIe+t/HbfXrODsDuoyfOBT98GGJHVGzaeiA4d7mP1MaydboG7z74vflOcPDx0z/pe7nKNNcOGHaB9tN+2k/7ab932W8PnymJFVhVJIqmUC/KjLToFqg/X0z6vPaprV+9jLqhAWrkVCn3jh4fPX5Of9oB2P1WtkzhXOcRsWv/d7oSw7Yyvq9l0wdKIZdq3Ug1R1kb1BY6fjp8ZpMnQ/tpP+2n/bTfu+ynkPNCkPjQpd9E3VaFiJs3oZfe/O5YcXaJE4cVDHYCKIjc1d94iI3vIVeOzDJ7rJ+64l0xFjn6OYDkECdB+2k/7af9tN859lPIeSFzl66Xoyd+0NXL1EAfLfrrDm7i9Vv26DGSI5yE/+i5moKeIV1qmTrCJ8L+uxu/3adCFrGGiBl0ErSf9tN+2k/7nWM/hZyXgdTqWYvX6XGP9h9E6InDSgUtzhA8Chczass5BfTbQzAsStSMHdg+NPXcFXgqA8Yt0OM6VUvpw+wUaD/tp/20n/Y7y34KOS9j35GT5mokldStWto8G8bDh8HSd/hMzVpFpmp/nybRxhvYiS07DunPqhWKqEh1B7UIW/cYrVlMaVIml7ZNnNXejfbTfkD7aT/td479FHJexuXfrupPxAZYiQ0W8MT1Gjpd1mzapa97tPtAe805iV+vhNiPgo/uoJ5Q0y7DBC3MsO08JpIVm52h/bQf0H7a7w7tt6/9FHJehlWt+uDR09ow3wJtuz7yGREq4to0riaNapXXYyeRKUOI/dv3BulPC3gg67b2l1PnftFiyeMGdXCciAW0n/YD2k/7XaH99rafBYG9kIbtA+Twd2ckS6Z0WmLkwsXfDAG3UwsgwksHT9yHtSuYn3YWWHVVa9JbK3+jWCSKJh8+djrU5Y7CkRMGd3JUXKArtJ/2037aT/udZT+FnBdy5fdr0sZvjJw4E74+TuaM6cS/W1PJm/NRt7OTgDeyQ59xGg/hCrpgwP7UKV80zzgT2k/7aT/tp/3OsZ9Czku5d+++rN2821iNnJHEiRNK4bw59EZ2j5tzKlf/vCGfr98u536+KClTJJUyxfJGmMHrVGg/7af9tJ/2O8N+CjlCCCGEEJvCZAdCCCGEEJtCIUcIIYQQYlMo5AghhBBCbAqFHCGEEEKITaGQI4QQQgixKRRyhBBCCCE2hUKOEEIIIcSmUMgRQgghhNgUCjlCCCGEEJtCIUcIIYQQYlMo5AghhBBCbAqFHCGEEEKITaGQI4QQQgixKRRyhBBCCCE2hUKOEEIIIcSmUMgRQgghhNgUCjlCCCGEEJtCIUcIIYQQYlMo5AghhBBCbAqFHCGEEEKITaGQI4QQQgixKRRyhBBCCCE2hUKOEEIIIcSmUMgRQgghhNgUCjlCCCGEEJtCIUcIIYQQYlMo5AghhBBCbAqFHCGEEEKITaGQI4QQQgixJSL/B1B4RRSivWOSAAAAAElFTkSuQmCC", "visible": false } ], "legend": { "x": 0.5, "y": 1.105, "font": { "size": 15, "color": "rgb(0, 0, 0)", "family": "Arial" }, "title": { "font": { "size": 11 }, "text": "<br>" }, "valign": "middle", "xanchor": "center", "itemsizing": "trace", "traceorder": "normal", "borderwidth": 1, "orientation": "h" }, "margin": { "b": 51 }, "shapes": [ { "x0": 8.5, "x1": 8.5, "y0": 0, "y1": 1, "line": { "color": "#444444", "width": 5 }, "type": "line", "yref": "paper", "opacity": 0.3, "fillcolor": "#7f7f7f" }, { "x0": 17.5, "x1": 17.5, "y0": 0, "y1": 1, "line": { "color": "#444444", "width": 5 }, "type": "line", "yref": "paper", "opacity": 0.3, "fillcolor": "#7f7f7f" }, { "x0": 26.5, "x1": 26.5, "y0": 0, "y1": 1, "line": { "color": "#444444", "width": 5 }, "type": "line", "yref": "paper", "opacity": 0.3, "fillcolor": "#7f7f7f" }, { "x0": 35.5, "x1": 35.5, "y0": 0, "y1": 1, "line": { "color": "#444444", "width": 5 }, "type": "line", "yref": "paper", "opacity": 0.3, "fillcolor": "#7f7f7f" }, { "x0": 44.5, "x1": 44.5, "y0": 0, "y1": 1, "line": { "color": "#444444", "width": 5 }, "type": "line", "yref": "paper", "opacity": 0.3, "fillcolor": "#7f7f7f" }, { "x0": 53.5, "x1": 53.5, "y0": 0, "y1": 1, "line": { "color": "#444444", "width": 5 }, "type": "line", "yref": "paper", "opacity": 0.3, "fillcolor": "#7f7f7f" }, { "x0": -0.5, "x1": -0.5, "y0": 0, "y1": 1, "line": { "color": "#444444", "width": 5 }, "type": "line", "yref": "paper", "opacity": 0.3, "fillcolor": "#7f7f7f" } ], "modebar": { "orientation": "h" }, "autosize": true, "dragmode": "zoom", "template": { "data": { "bar": [ { "type": "bar", "marker": { "colorbar": { "ticks": "", "outlinewidth": 0 } } } ], "table": [ { "type": "table", "cells": { "fill": { "color": "#EBF0F8" }, "line": { "color": "white" } }, "header": { "fill": { "color": "#C8D4E3" }, "line": { "color": "white" } } } ], "carpet": [ { "type": "carpet", "aaxis": { "gridcolor": "#C8D4E3", "linecolor": "#C8D4E3", "endlinecolor": "#2a3f5f", "minorgridcolor": "#C8D4E3", "startlinecolor": "#2a3f5f" }, "baxis": { "gridcolor": "#C8D4E3", "linecolor": "#C8D4E3", "endlinecolor": "#2a3f5f", "minorgridcolor": "#C8D4E3", "startlinecolor": "#2a3f5f" } } ], "mesh3d": [ { "type": "mesh3d", "colorbar": { "ticks": "", "outlinewidth": 0 } } ], "contour": [ { "type": "contour", "colorbar": { "ticks": "", "outlinewidth": 0 }, "autocolorscale": true } ], "heatmap": [ { "type": "heatmap", "colorbar": { "ticks": "", "outlinewidth": 0 }, "autocolorscale": true } ], "scatter": [ { "type": "scatter", "marker": { "colorbar": { "ticks": "", "outlinewidth": 0 } } } ], "surface": [ { "type": "surface", "colorbar": { "ticks": "", "outlinewidth": 0 } } ], "heatmapgl": [ { "type": "heatmapgl", "colorbar": { "ticks": "", "outlinewidth": 0 } } ], "histogram": [ { "type": "histogram", "marker": { "colorbar": { "ticks": "", "outlinewidth": 0 } } } ], "parcoords": [ { "line": { "colorbar": { "ticks": "", "outlinewidth": 0 } }, "type": "parcoords" } ], "scatter3d": [ { "type": "scatter3d", "marker": { "colorbar": { "ticks": "", "outlinewidth": 0 } } } ], "scattergl": [ { "type": "scattergl", "marker": { "colorbar": { "ticks": "", "outlinewidth": 0 } } } ], "choropleth": [ { "type": "choropleth", "colorbar": { "ticks": "", "outlinewidth": 0 } } ], "scattergeo": [ { "type": "scattergeo", "marker": { "colorbar": { "ticks": "", "outlinewidth": 0 } } } ], "histogram2d": [ { "type": "histogram2d", "colorbar": { "ticks": "", "outlinewidth": 0 }, "autocolorscale": true } ], "scatterpolar": [ { "type": "scatterpolar", "marker": { "colorbar": { "ticks": "", "outlinewidth": 0 } } } ], "contourcarpet": [ { "type": "contourcarpet", "colorbar": { "ticks": "", "outlinewidth": 0 } } ], "scattercarpet": [ { "type": "scattercarpet", "marker": { "colorbar": { "ticks": "", "outlinewidth": 0 } } } ], "scattermapbox": [ { "type": "scattermapbox", "marker": { "colorbar": { "ticks": "", "outlinewidth": 0 } } } ], "scatterpolargl": [ { "type": "scatterpolargl", "marker": { "colorbar": { "ticks": "", "outlinewidth": 0 } } } ], "scatterternary": [ { "type": "scatterternary", "marker": { "colorbar": { "ticks": "", "outlinewidth": 0 } } } ], "histogram2dcontour": [ { "type": "histogram2dcontour", "colorbar": { "ticks": "", "outlinewidth": 0 }, "autocolorscale": true } ] }, "layout": { "geo": { "bgcolor": "white", "showland": true, "lakecolor": "white", "landcolor": "white", "showlakes": true, "subunitcolor": "#C8D4E3" }, "font": { "color": "#2a3f5f" }, "polar": { "bgcolor": "white", "radialaxis": { "ticks": "", "gridcolor": "#EBF0F8", "linecolor": "#EBF0F8" }, "angularaxis": { "ticks": "", "gridcolor": "#EBF0F8", "linecolor": "#EBF0F8" } }, "scene": { "xaxis": { "ticks": "", "gridcolor": "#DFE8F3", "gridwidth": 2, "linecolor": "#EBF0F8", "zerolinecolor": "#EBF0F8", "showbackground": true, "backgroundcolor": "white" }, "yaxis": { "ticks": "", "gridcolor": "#DFE8F3", "gridwidth": 2, "linecolor": "#EBF0F8", "zerolinecolor": "#EBF0F8", "showbackground": true, "backgroundcolor": "white" }, "zaxis": { "ticks": "", "gridcolor": "#DFE8F3", "gridwidth": 2, "linecolor": "#EBF0F8", "zerolinecolor": "#EBF0F8", "showbackground": true, "backgroundcolor": "white" } }, "title": { "x": 0.05 }, "xaxis": { "ticks": "", "gridcolor": "#EBF0F8", "linecolor": "#EBF0F8", "automargin": true, "zerolinecolor": "#EBF0F8", "zerolinewidth": 2 }, "yaxis": { "ticks": "", "gridcolor": "#EBF0F8", "linecolor": "#EBF0F8", "automargin": true, "zerolinecolor": "#EBF0F8", "zerolinewidth": 2 }, "ternary": { "aaxis": { "ticks": "", "gridcolor": "#DFE8F3", "linecolor": "#A2B1C6" }, "baxis": { "ticks": "", "gridcolor": "#DFE8F3", "linecolor": "#A2B1C6" }, "caxis": { "ticks": "", "gridcolor": "#DFE8F3", "linecolor": "#A2B1C6" }, "bgcolor": "white" }, "colorway": [ "#636efa", "#EF553B", "#00cc96", "#ab63fa", "#19d3f3", "#e763fa", "#fecb52", "#ffa15a", "#ff6692", "#b6e880" ], "hovermode": "closest", "colorscale": { "diverging": [ [ 0, "#8e0152" ], [ 0.1, "#c51b7d" ], [ 0.2, "#de77ae" ], [ 0.3, "#f1b6da" ], [ 0.4, "#fde0ef" ], [ 0.5, "#f7f7f7" ], [ 0.6, "#e6f5d0" ], [ 0.7, "#b8e186" ], [ 0.8, "#7fbc41" ], [ 0.9, "#4d9221" ], [ 1, "#276419" ] ], "sequential": [ [ 0, "#0508b8" ], [ 0.0893854748603352, "#1910d8" ], [ 0.1787709497206704, "#3c19f0" ], [ 0.2681564245810056, "#6b1cfb" ], [ 0.3575418994413408, "#981cfd" ], [ 0.44692737430167595, "#bf1cfd" ], [ 0.5363128491620112, "#dd2bfd" ], [ 0.6256983240223464, "#f246fe" ], [ 0.7150837988826816, "#fc67fd" ], [ 0.8044692737430168, "#fe88fc" ], [ 0.8938547486033519, "#fea5fd" ], [ 0.9832402234636871, "#febefe" ], [ 1, "#fec3fe" ] ], "sequentialminus": [ [ 0, "#0508b8" ], [ 0.0893854748603352, "#1910d8" ], [ 0.1787709497206704, "#3c19f0" ], [ 0.2681564245810056, "#6b1cfb" ], [ 0.3575418994413408, "#981cfd" ], [ 0.44692737430167595, "#bf1cfd" ], [ 0.5363128491620112, "#dd2bfd" ], [ 0.6256983240223464, "#f246fe" ], [ 0.7150837988826816, "#fc67fd" ], [ 0.8044692737430168, "#fe88fc" ], [ 0.8938547486033519, "#fea5fd" ], [ 0.9832402234636871, "#febefe" ], [ 1, "#fec3fe" ] ] }, "plot_bgcolor": "white", "paper_bgcolor": "white", "shapedefaults": { "line": { "width": 0 }, "opacity": 0.4, "fillcolor": "#506784" }, "annotationdefaults": { "arrowhead": 0, "arrowcolor": "#506784", "arrowwidth": 1 } }, "themeRef": "PLOTLY_WHITE" }, "showlegend": true, "annotations": [ { "x": 4.083807498005849, "y": 0.13, "ax": -508, "ay": 122, "font": { "size": 11 }, "text": "", "yref": "paper", "showarrow": false, "textangle": 0 } ] } }, "height": null, "width": null, "user": { "profile_url": "https://chart-studio.plotly.com/~simon.verstraete", "avatar_url": "https://storage.googleapis.com/plotly-prod-profiles/98.jpg", "background_url": "https://storage.googleapis.com/plotly-prod-profiles/bg-14.jpg", "bio": "", "nickname": "", "website": "", "stream_tokens": null, "feature_set_id": null, "csrf_token": null, "date_joined": "2024-03-31 22:00:20", "mapbox_access_tokens": null, "has_password": null, "username": "simon.verstraete", "email": null, "is_active": null, "readonly": null, "is_dash_creator": null, "dash_created_count": null, "is_chart_creator": null, "charts_created_count": null } }, { "creation_time": "2024-03-31T21:54:02.976700Z", "comments": { "results": [], "count": 0 }, "parented": true, "embed_url": "https://chart-studio.plotly.com/~akshaynayakkolgar97/41.embed", "fid": "akshaynayakkolgar97:41", "filename": "errorb2", "filetype": "plot", "img_url": "https://storage.googleapis.com/plotly-prod-images/akshaynayakkolgar97/41/9_OZRBP9ZXX0U2DULUE1EFKDDDYNLAK2.png", "image_urls": { "default": "https://storage.googleapis.com/plotly-prod-images/akshaynayakkolgar97/41/2_0T4KW1S4QQFQ8BNGQRRFXT5T27CCVI.png", "block-thumb": "https://storage.googleapis.com/plotly-prod-images/akshaynayakkolgar97/41/8_PLEOPY3JQ1WXYK57NXEXJ2NB6LDOPR.png", "list-thumb": "https://storage.googleapis.com/plotly-prod-images/akshaynayakkolgar97/41/9_OZRBP9ZXX0U2DULUE1EFKDDDYNLAK2.png" }, "api_urls": { "files": "https://api.plotly.com/v2/files/akshaynayakkolgar97:41", "plots": "https://api.plotly.com/v2/plots/akshaynayakkolgar97:41", "parent": "https://api.plotly.com/v2/folders/home?user=akshaynayakkolgar97" }, "owner": "akshaynayakkolgar97", "parent": -1, "preview": "", "referencers": [], "references": [], "title": "", "views": 1, "web_url": "https://chart-studio.plotly.com/~akshaynayakkolgar97/41/", "world_readable": true, "date_modified": "2024-03-31T22:54:25.134Z", "stars": { "results": [], "count": 0 }, "collaborators": { "results": [], "count": 0 }, "subfolder_count": null, "refresh_interval": null, "organize_view_url": "https://chart-studio.plotly.com/~akshaynayakkolgar97/41/", "current_user_permission": "read", "is_theme": null, "is_template": false, "autosize": true, "caption": "", "figure": { "data": [ { "uid": "e557cc", "line": { "dash": "dash", "color": "rgb(155, 57, 34)", "shape": "spline", "width": 2, "smoothing": 1 }, "meta": { "columnNames": { "x": "B", "y": "A", "error_y": { "array": "D", "arrayminus": "C" } } }, "mode": "markers+lines", "type": "scatter", "xsrc": "akshaynayakkolgar97:40:de332b", "ysrc": "akshaynayakkolgar97:40:12a255", "marker": { "line": { "color": "rgb(51, 58, 115)", "width": 1 }, "size": 11, "color": "rgb(100, 32, 170)", "symbol": "circle" }, "error_y": { "meta": { "columnNames": { "array": "D", "arrayminus": "C" } }, "type": "data", "color": "rgb(42, 43, 48)", "value": 10, "width": 8, "visible": true, "arraysrc": "akshaynayakkolgar97:40:66e5c1", "symmetric": false, "thickness": 2, "arrayminussrc": "akshaynayakkolgar97:40:bbea37" }, "connectgaps": false } ], "frames": [], "layout": { "font": { "size": 28 }, "title": { "text": "Filtration" }, "xaxis": { "type": "category", "dtick": 1, "range": [ -0.2941747858593589, 4.294174785859359 ], "tick0": 0, "title": { "text": "Condition" }, "domain": [ 0.25, 0.625 ], "tickson": "labels", "showgrid": true, "showline": false, "tickmode": "auto", "autorange": true, "gridcolor": "rgb(210, 210, 223)", "gridwidth": 1, "tickangle": "auto", "automargin": true, "showticklabels": true }, "yaxis": { "type": "linear", "range": [ 0, 25 ], "title": { "text": "Error Percentage (%)" }, "domain": [ 0, 1 ], "autorange": false, "gridcolor": "rgb(210, 210, 223)", "gridwidth": 3, "zerolinecolor": "rgb(210, 210, 223)" }, "margin": { "pad": 10 }, "shapes": [ { "x0": 0.25, "x1": 0.6245188606620478, "y0": -0.0007886435331230235, "y1": 1, "line": { "color": "#444444", "width": 3 }, "xref": "paper", "yref": "paper", "opacity": 0.1, "fillcolor": "rgb(255, 255, 255)" } ], "barmode": "group", "barnorm": "", "modebar": { "orientation": "h" }, "autosize": true, "colorway": [ "#4c78a8", "#f58518", "#e45756", "#72b7b2", "#54a24b", "#eeca3b", "#b279a2", "#ff9da6", "#9d755d", "#bab0ac" ], "template": { "data": { "bar": [ { "type": "bar", "marker": { "colorbar": { "ticks": "", "outlinewidth": 0 } } } ], "table": [ { "type": "table", "cells": { "fill": { "color": "#EBF0F8" }, "line": { "color": "white" } }, "header": { "fill": { "color": "#C8D4E3" }, "line": { "color": "white" } } } ], "carpet": [ { "type": "carpet", "aaxis": { "gridcolor": "#C8D4E3", "linecolor": "#C8D4E3", "endlinecolor": "#2a3f5f", "minorgridcolor": "#C8D4E3", "startlinecolor": "#2a3f5f" }, "baxis": { "gridcolor": "#C8D4E3", "linecolor": "#C8D4E3", "endlinecolor": "#2a3f5f", "minorgridcolor": "#C8D4E3", "startlinecolor": "#2a3f5f" } } ], "mesh3d": [ { "type": "mesh3d", "colorbar": { "ticks": "", "outlinewidth": 0 } } ], "contour": [ { "type": "contour", "colorbar": { "ticks": "", "outlinewidth": 0 }, "autocolorscale": true } ], "heatmap": [ { "type": "heatmap", "colorbar": { "ticks": "", "outlinewidth": 0 }, "autocolorscale": true } ], "scatter": [ { "type": "scatter", "marker": { "colorbar": { "ticks": "", "outlinewidth": 0 } } } ], "surface": [ { "type": "surface", "colorbar": { "ticks": "", "outlinewidth": 0 } } ], "heatmapgl": [ { "type": "heatmapgl", "colorbar": { "ticks": "", "outlinewidth": 0 } } ], "histogram": [ { "type": "histogram", "marker": { "colorbar": { "ticks": "", "outlinewidth": 0 } } } ], "parcoords": [ { "line": { "colorbar": { "ticks": "", "outlinewidth": 0 } }, "type": "parcoords" } ], "scatter3d": [ { "type": "scatter3d", "marker": { "colorbar": { "ticks": "", "outlinewidth": 0 } } } ], "scattergl": [ { "type": "scattergl", "marker": { "colorbar": { "ticks": "", "outlinewidth": 0 } } } ], "choropleth": [ { "type": "choropleth", "colorbar": { "ticks": "", "outlinewidth": 0 } } ], "scattergeo": [ { "type": "scattergeo", "marker": { "colorbar": { "ticks": "", "outlinewidth": 0 } } } ], "histogram2d": [ { "type": "histogram2d", "colorbar": { "ticks": "", "outlinewidth": 0 }, "autocolorscale": true } ], "scatterpolar": [ { "type": "scatterpolar", "marker": { "colorbar": { "ticks": "", "outlinewidth": 0 } } } ], "contourcarpet": [ { "type": "contourcarpet", "colorbar": { "ticks": "", "outlinewidth": 0 } } ], "scattercarpet": [ { "type": "scattercarpet", "marker": { "colorbar": { "ticks": "", "outlinewidth": 0 } } } ], "scattermapbox": [ { "type": "scattermapbox", "marker": { "colorbar": { "ticks": "", "outlinewidth": 0 } } } ], "scatterpolargl": [ { "type": "scatterpolargl", "marker": { "colorbar": { "ticks": "", "outlinewidth": 0 } } } ], "scatterternary": [ { "type": "scatterternary", "marker": { "colorbar": { "ticks": "", "outlinewidth": 0 } } } ], "histogram2dcontour": [ { "type": "histogram2dcontour", "colorbar": { "ticks": "", "outlinewidth": 0 }, "autocolorscale": true } ] }, "layout": { "geo": { "bgcolor": "white", "showland": true, "lakecolor": "white", "landcolor": "white", "showlakes": true, "subunitcolor": "#C8D4E3" }, "font": { "color": "#2a3f5f" }, "polar": { "bgcolor": "white", "radialaxis": { "ticks": "", "gridcolor": "#EBF0F8", "linecolor": "#EBF0F8" }, "angularaxis": { "ticks": "", "gridcolor": "#EBF0F8", "linecolor": "#EBF0F8" } }, "scene": { "xaxis": { "ticks": "", "gridcolor": "#DFE8F3", "gridwidth": 2, "linecolor": "#EBF0F8", "zerolinecolor": "#EBF0F8", "showbackground": true, "backgroundcolor": "white" }, "yaxis": { "ticks": "", "gridcolor": "#DFE8F3", "gridwidth": 2, "linecolor": "#EBF0F8", "zerolinecolor": "#EBF0F8", "showbackground": true, "backgroundcolor": "white" }, "zaxis": { "ticks": "", "gridcolor": "#DFE8F3", "gridwidth": 2, "linecolor": "#EBF0F8", "zerolinecolor": "#EBF0F8", "showbackground": true, "backgroundcolor": "white" } }, "title": { "x": 0.05 }, "xaxis": { "ticks": "", "gridcolor": "#EBF0F8", "linecolor": "#EBF0F8", "automargin": true, "zerolinecolor": "#EBF0F8", "zerolinewidth": 2 }, "yaxis": { "ticks": "", "gridcolor": "#EBF0F8", "linecolor": "#EBF0F8", "automargin": true, "zerolinecolor": "#EBF0F8", "zerolinewidth": 2 }, "ternary": { "aaxis": { "ticks": "", "gridcolor": "#DFE8F3", "linecolor": "#A2B1C6" }, "baxis": { "ticks": "", "gridcolor": "#DFE8F3", "linecolor": "#A2B1C6" }, "caxis": { "ticks": "", "gridcolor": "#DFE8F3", "linecolor": "#A2B1C6" }, "bgcolor": "white" }, "colorway": [ "#636efa", "#EF553B", "#00cc96", "#ab63fa", "#19d3f3", "#e763fa", "#fecb52", "#ffa15a", "#ff6692", "#b6e880" ], "hovermode": "closest", "colorscale": { "diverging": [ [ 0, "#8e0152" ], [ 0.1, "#c51b7d" ], [ 0.2, "#de77ae" ], [ 0.3, "#f1b6da" ], [ 0.4, "#fde0ef" ], [ 0.5, "#f7f7f7" ], [ 0.6, "#e6f5d0" ], [ 0.7, "#b8e186" ], [ 0.8, "#7fbc41" ], [ 0.9, "#4d9221" ], [ 1, "#276419" ] ], "sequential": [ [ 0, "#0508b8" ], [ 0.0893854748603352, "#1910d8" ], [ 0.1787709497206704, "#3c19f0" ], [ 0.2681564245810056, "#6b1cfb" ], [ 0.3575418994413408, "#981cfd" ], [ 0.44692737430167595, "#bf1cfd" ], [ 0.5363128491620112, "#dd2bfd" ], [ 0.6256983240223464, "#f246fe" ], [ 0.7150837988826816, "#fc67fd" ], [ 0.8044692737430168, "#fe88fc" ], [ 0.8938547486033519, "#fea5fd" ], [ 0.9832402234636871, "#febefe" ], [ 1, "#fec3fe" ] ], "sequentialminus": [ [ 0, "#0508b8" ], [ 0.0893854748603352, "#1910d8" ], [ 0.1787709497206704, "#3c19f0" ], [ 0.2681564245810056, "#6b1cfb" ], [ 0.3575418994413408, "#981cfd" ], [ 0.44692737430167595, "#bf1cfd" ], [ 0.5363128491620112, "#dd2bfd" ], [ 0.6256983240223464, "#f246fe" ], [ 0.7150837988826816, "#fc67fd" ], [ 0.8044692737430168, "#fe88fc" ], [ 0.8938547486033519, "#fea5fd" ], [ 0.9832402234636871, "#febefe" ], [ 1, "#fec3fe" ] ] }, "plot_bgcolor": "white", "paper_bgcolor": "white", "shapedefaults": { "line": { "width": 0 }, "opacity": 0.4, "fillcolor": "#506784" }, "annotationdefaults": { "arrowhead": 0, "arrowcolor": "#506784", "arrowwidth": 1 } }, "themeRef": "PLOTLY_WHITE" } } }, "height": null, "width": null, "user": { "profile_url": "https://chart-studio.plotly.com/~akshaynayakkolgar97", "avatar_url": "https://storage.googleapis.com/plotly-prod-profiles/2.jpg", "background_url": "https://storage.googleapis.com/plotly-prod-profiles/bg-4.jpg", "bio": "", "nickname": "", "website": "", "stream_tokens": null, "feature_set_id": null, "csrf_token": null, "date_joined": "2023-12-08 07:44:36", "mapbox_access_tokens": null, "has_password": null, "username": "akshaynayakkolgar97", "email": null, "is_active": null, "readonly": null, "is_dash_creator": null, "dash_created_count": null, "is_chart_creator": null, "charts_created_count": null } }, { "creation_time": "2024-03-31T21:53:27.345548Z", "comments": { "results": [], "count": 0 }, "parented": true, "embed_url": "https://chart-studio.plotly.com/~akshaynayakkolgar97/39.embed", "fid": "akshaynayakkolgar97:39", "filename": "errorb1", "filetype": "plot", "img_url": "https://storage.googleapis.com/plotly-prod-images/akshaynayakkolgar97/39/9_J5K6Y56UB8TA43WBXPLI3IKZTPEG7V.png", "image_urls": { "default": "https://storage.googleapis.com/plotly-prod-images/akshaynayakkolgar97/39/2_UPT0Z65MW3MKZDQ9KG9HL8MSZ8KCG5.png", "block-thumb": "https://storage.googleapis.com/plotly-prod-images/akshaynayakkolgar97/39/8_E9AMQ8VF4BI0OJII8MWJB058Z6LQ4V.png", "list-thumb": "https://storage.googleapis.com/plotly-prod-images/akshaynayakkolgar97/39/9_J5K6Y56UB8TA43WBXPLI3IKZTPEG7V.png" }, "api_urls": { "files": "https://api.plotly.com/v2/files/akshaynayakkolgar97:39", "plots": "https://api.plotly.com/v2/plots/akshaynayakkolgar97:39", "parent": "https://api.plotly.com/v2/folders/home?user=akshaynayakkolgar97" }, "owner": "akshaynayakkolgar97", "parent": -1, "preview": "", "referencers": [], "references": [], "title": "", "views": 2, "web_url": "https://chart-studio.plotly.com/~akshaynayakkolgar97/39/", "world_readable": true, "date_modified": "2024-03-31T23:30:09.010Z", "stars": { "results": [], "count": 0 }, "collaborators": { "results": [], "count": 0 }, "subfolder_count": null, "refresh_interval": null, "organize_view_url": "https://chart-studio.plotly.com/~akshaynayakkolgar97/39/", "current_user_permission": "read", "is_theme": null, "is_template": false, "autosize": true, "caption": "", "figure": { "data": [ { "uid": "e557cc", "line": { "dash": "dash", "color": "rgb(155, 57, 34)", "shape": "spline", "width": 2, "smoothing": 1 }, "meta": { "columnNames": { "x": "B", "y": "A", "error_y": { "array": "D", "arrayminus": "C" } } }, "mode": "markers+lines", "type": "scatter", "xsrc": "akshaynayakkolgar97:38:de332b", "ysrc": "akshaynayakkolgar97:38:12a255", "marker": { "line": { "color": "rgb(51, 58, 115)", "width": 1 }, "size": 11, "color": "rgb(100, 32, 170)", "symbol": "circle" }, "error_y": { "meta": { "columnNames": { "array": "D", "arrayminus": "C" } }, "type": "data", "color": "rgb(42, 43, 48)", "value": 10, "width": 8, "visible": true, "arraysrc": "akshaynayakkolgar97:38:66e5c1", "symmetric": false, "thickness": 2, "arrayminussrc": "akshaynayakkolgar97:38:bbea37" }, "connectgaps": false } ], "frames": [], "layout": { "font": { "size": 28 }, "title": { "text": "Bar Comparison" }, "xaxis": { "type": "category", "dtick": 1, "range": [ -0.2941747858593589, 4.294174785859359 ], "tick0": 0, "title": { "font": { "size": 38 }, "text": "Condition" }, "domain": [ 0.25, 0.625 ], "tickson": "labels", "showgrid": true, "showline": false, "tickmode": "auto", "autorange": true, "gridcolor": "rgb(210, 210, 223)", "gridwidth": 1, "tickangle": "auto", "automargin": true, "showticklabels": true }, "yaxis": { "type": "linear", "range": [ 0, 25 ], "title": { "text": "Error Percentage (%)" }, "domain": [ 0, 1 ], "autorange": false, "gridcolor": "rgb(210, 210, 223)", "gridwidth": 3, "zerolinecolor": "rgb(210, 210, 223)" }, "margin": { "pad": 10 }, "shapes": [ { "x0": 0.25, "x1": 0.6245188606620478, "y0": -0.0007886435331230235, "y1": 1.003344824221926, "line": { "color": "#444444", "width": 3 }, "xref": "paper", "yref": "paper", "opacity": 0.1, "fillcolor": "rgb(255, 255, 255)" } ], "barmode": "group", "barnorm": "", "modebar": { "orientation": "h" }, "autosize": true, "colorway": [ "#4c78a8", "#f58518", "#e45756", "#72b7b2", "#54a24b", "#eeca3b", "#b279a2", "#ff9da6", "#9d755d", "#bab0ac" ], "template": { "data": { "bar": [ { "type": "bar", "marker": { "colorbar": { "ticks": "", "outlinewidth": 0 } } } ], "table": [ { "type": "table", "cells": { "fill": { "color": "#EBF0F8" }, "line": { "color": "white" } }, "header": { "fill": { "color": "#C8D4E3" }, "line": { "color": "white" } } } ], "carpet": [ { "type": "carpet", "aaxis": { "gridcolor": "#C8D4E3", "linecolor": "#C8D4E3", "endlinecolor": "#2a3f5f", "minorgridcolor": "#C8D4E3", "startlinecolor": "#2a3f5f" }, "baxis": { "gridcolor": "#C8D4E3", "linecolor": "#C8D4E3", "endlinecolor": "#2a3f5f", "minorgridcolor": "#C8D4E3", "startlinecolor": "#2a3f5f" } } ], "mesh3d": [ { "type": "mesh3d", "colorbar": { "ticks": "", "outlinewidth": 0 } } ], "contour": [ { "type": "contour", "colorbar": { "ticks": "", "outlinewidth": 0 }, "autocolorscale": true } ], "heatmap": [ { "type": "heatmap", "colorbar": { "ticks": "", "outlinewidth": 0 }, "autocolorscale": true } ], "scatter": [ { "type": "scatter", "marker": { "colorbar": { "ticks": "", "outlinewidth": 0 } } } ], "surface": [ { "type": "surface", "colorbar": { "ticks": "", "outlinewidth": 0 } } ], "heatmapgl": [ { "type": "heatmapgl", "colorbar": { "ticks": "", "outlinewidth": 0 } } ], "histogram": [ { "type": "histogram", "marker": { "colorbar": { "ticks": "", "outlinewidth": 0 } } } ], "parcoords": [ { "line": { "colorbar": { "ticks": "", "outlinewidth": 0 } }, "type": "parcoords" } ], "scatter3d": [ { "type": "scatter3d", "marker": { "colorbar": { "ticks": "", "outlinewidth": 0 } } } ], "scattergl": [ { "type": "scattergl", "marker": { "colorbar": { "ticks": "", "outlinewidth": 0 } } } ], "choropleth": [ { "type": "choropleth", "colorbar": { "ticks": "", "outlinewidth": 0 } } ], "scattergeo": [ { "type": "scattergeo", "marker": { "colorbar": { "ticks": "", "outlinewidth": 0 } } } ], "histogram2d": [ { "type": "histogram2d", "colorbar": { "ticks": "", "outlinewidth": 0 }, "autocolorscale": true } ], "scatterpolar": [ { "type": "scatterpolar", "marker": { "colorbar": { "ticks": "", "outlinewidth": 0 } } } ], "contourcarpet": [ { "type": "contourcarpet", "colorbar": { "ticks": "", "outlinewidth": 0 } } ], "scattercarpet": [ { "type": "scattercarpet", "marker": { "colorbar": { "ticks": "", "outlinewidth": 0 } } } ], "scattermapbox": [ { "type": "scattermapbox", "marker": { "colorbar": { "ticks": "", "outlinewidth": 0 } } } ], "scatterpolargl": [ { "type": "scatterpolargl", "marker": { "colorbar": { "ticks": "", "outlinewidth": 0 } } } ], "scatterternary": [ { "type": "scatterternary", "marker": { "colorbar": { "ticks": "", "outlinewidth": 0 } } } ], "histogram2dcontour": [ { "type": "histogram2dcontour", "colorbar": { "ticks": "", "outlinewidth": 0 }, "autocolorscale": true } ] }, "layout": { "geo": { "bgcolor": "white", "showland": true, "lakecolor": "white", "landcolor": "white", "showlakes": true, "subunitcolor": "#C8D4E3" }, "font": { "color": "#2a3f5f" }, "polar": { "bgcolor": "white", "radialaxis": { "ticks": "", "gridcolor": "#EBF0F8", "linecolor": "#EBF0F8" }, "angularaxis": { "ticks": "", "gridcolor": "#EBF0F8", "linecolor": "#EBF0F8" } }, "scene": { "xaxis": { "ticks": "", "gridcolor": "#DFE8F3", "gridwidth": 2, "linecolor": "#EBF0F8", "zerolinecolor": "#EBF0F8", "showbackground": true, "backgroundcolor": "white" }, "yaxis": { "ticks": "", "gridcolor": "#DFE8F3", "gridwidth": 2, "linecolor": "#EBF0F8", "zerolinecolor": "#EBF0F8", "showbackground": true, "backgroundcolor": "white" }, "zaxis": { "ticks": "", "gridcolor": "#DFE8F3", "gridwidth": 2, "linecolor": "#EBF0F8", "zerolinecolor": "#EBF0F8", "showbackground": true, "backgroundcolor": "white" } }, "title": { "x": 0.05 }, "xaxis": { "ticks": "", "gridcolor": "#EBF0F8", "linecolor": "#EBF0F8", "automargin": true, "zerolinecolor": "#EBF0F8", "zerolinewidth": 2 }, "yaxis": { "ticks": "", "gridcolor": "#EBF0F8", "linecolor": "#EBF0F8", "automargin": true, "zerolinecolor": "#EBF0F8", "zerolinewidth": 2 }, "ternary": { "aaxis": { "ticks": "", "gridcolor": "#DFE8F3", "linecolor": "#A2B1C6" }, "baxis": { "ticks": "", "gridcolor": "#DFE8F3", "linecolor": "#A2B1C6" }, "caxis": { "ticks": "", "gridcolor": "#DFE8F3", "linecolor": "#A2B1C6" }, "bgcolor": "white" }, "colorway": [ "#636efa", "#EF553B", "#00cc96", "#ab63fa", "#19d3f3", "#e763fa", "#fecb52", "#ffa15a", "#ff6692", "#b6e880" ], "hovermode": "closest", "colorscale": { "diverging": [ [ 0, "#8e0152" ], [ 0.1, "#c51b7d" ], [ 0.2, "#de77ae" ], [ 0.3, "#f1b6da" ], [ 0.4, "#fde0ef" ], [ 0.5, "#f7f7f7" ], [ 0.6, "#e6f5d0" ], [ 0.7, "#b8e186" ], [ 0.8, "#7fbc41" ], [ 0.9, "#4d9221" ], [ 1, "#276419" ] ], "sequential": [ [ 0, "#0508b8" ], [ 0.0893854748603352, "#1910d8" ], [ 0.1787709497206704, "#3c19f0" ], [ 0.2681564245810056, "#6b1cfb" ], [ 0.3575418994413408, "#981cfd" ], [ 0.44692737430167595, "#bf1cfd" ], [ 0.5363128491620112, "#dd2bfd" ], [ 0.6256983240223464, "#f246fe" ], [ 0.7150837988826816, "#fc67fd" ], [ 0.8044692737430168, "#fe88fc" ], [ 0.8938547486033519, "#fea5fd" ], [ 0.9832402234636871, "#febefe" ], [ 1, "#fec3fe" ] ], "sequentialminus": [ [ 0, "#0508b8" ], [ 0.0893854748603352, "#1910d8" ], [ 0.1787709497206704, "#3c19f0" ], [ 0.2681564245810056, "#6b1cfb" ], [ 0.3575418994413408, "#981cfd" ], [ 0.44692737430167595, "#bf1cfd" ], [ 0.5363128491620112, "#dd2bfd" ], [ 0.6256983240223464, "#f246fe" ], [ 0.7150837988826816, "#fc67fd" ], [ 0.8044692737430168, "#fe88fc" ], [ 0.8938547486033519, "#fea5fd" ], [ 0.9832402234636871, "#febefe" ], [ 1, "#fec3fe" ] ] }, "plot_bgcolor": "white", "paper_bgcolor": "white", "shapedefaults": { "line": { "width": 0 }, "opacity": 0.4, "fillcolor": "#506784" }, "annotationdefaults": { "arrowhead": 0, "arrowcolor": "#506784", "arrowwidth": 1 } }, "themeRef": "PLOTLY_WHITE" } } }, "height": null, "width": null, "user": { "profile_url": "https://chart-studio.plotly.com/~akshaynayakkolgar97", "avatar_url": "https://storage.googleapis.com/plotly-prod-profiles/2.jpg", "background_url": "https://storage.googleapis.com/plotly-prod-profiles/bg-4.jpg", "bio": "", "nickname": "", "website": "", "stream_tokens": null, "feature_set_id": null, "csrf_token": null, "date_joined": "2023-12-08 07:44:36", "mapbox_access_tokens": null, "has_password": null, "username": "akshaynayakkolgar97", "email": null, "is_active": null, "readonly": null, "is_dash_creator": null, "dash_created_count": null, "is_chart_creator": null, "charts_created_count": null } }, { "creation_time": "2024-03-31T21:46:50.261762Z", "comments": { "results": [], "count": 0 }, "parented": true, "embed_url": "https://chart-studio.plotly.com/~jordan.81/4.embed", "fid": "jordan.81:4", "filename": "3D Scatter", "filetype": "plot", "img_url": "https://storage.googleapis.com/plotly-prod-images/jordan.81/4/9_SLHYM2VI2QN3V7RU3EOKAPBT5OWG00.png", "image_urls": { "default": "https://storage.googleapis.com/plotly-prod-images/jordan.81/4/2_1GGY4UZJKBYV38N6RIR2E61BPZMGF0.png", "block-thumb": "https://storage.googleapis.com/plotly-prod-images/jordan.81/4/8_MQVAB7FG55EPMK4ENBGRJC7RNM934S.png", "list-thumb": "https://storage.googleapis.com/plotly-prod-images/jordan.81/4/9_SLHYM2VI2QN3V7RU3EOKAPBT5OWG00.png" }, "api_urls": { "files": "https://api.plotly.com/v2/files/jordan.81:4", "plots": "https://api.plotly.com/v2/plots/jordan.81:4", "parent": "https://api.plotly.com/v2/folders/home?user=jordan.81" }, "owner": "jordan.81", "parent": -1, "preview": "", "referencers": [], "references": [], "title": "", "views": 1, "web_url": "https://chart-studio.plotly.com/~jordan.81/4/", "world_readable": true, "date_modified": "2024-04-01T01:55:44.962Z", "stars": { "results": [], "count": 0 }, "collaborators": { "results": [], "count": 0 }, "subfolder_count": null, "refresh_interval": null, "organize_view_url": "https://chart-studio.plotly.com/~jordan.81/4/", "current_user_permission": "read", "is_theme": null, "is_template": false, "autosize": true, "caption": "", "figure": { "data": [ { "meta": { "columnNames": { "x": "C", "y": "D", "z": "E", "marker": { "color": "E" } } }, "mode": "markers", "type": "scatter3d", "xsrc": "jordan.81:3:8d0530", "ysrc": "jordan.81:3:f7d42e", "zsrc": "jordan.81:3:4bbdf6", "marker": { "meta": { "columnNames": { "color": "E" } }, "colorbar": { "title": { "text": "Temperature (C)" } }, "colorsrc": "jordan.81:3:4bbdf6", "showscale": true, "colorscale": [ [ 0, "#fdedb0" ], [ 0.09090909090909091, "#facd91" ], [ 0.18181818181818182, "#f6ad77" ], [ 0.2727272727272727, "#f08e62" ], [ 0.36363636363636365, "#e76d54" ], [ 0.45454545454545453, "#d85053" ], [ 0.5454545454545454, "#c3385a" ], [ 0.6363636363636364, "#a82860" ], [ 0.7272727272727273, "#8a1d63" ], [ 0.8181818181818182, "#6b185d" ], [ 0.9090909090909091, "#4c1550" ], [ 1, "#2f0f3d" ] ] }, "autocolorscale": false } ], "frames": [], "layout": { "scene": { "camera": { "up": { "x": -0.05182031068650085, "y": -0.9969479400178639, "z": 0.05839058395402797 }, "eye": { "x": 0.7904965553561095, "y": -0.1865183125420714, "z": -1.933499220681244 }, "center": { "x": -0.16994988600400207, "y": -0.023351536194305297, "z": 0 }, "projection": { "type": "perspective" } }, "dragmode": "orbit", "aspectmode": "auto", "aspectratio": { "x": 0.6554794608224299, "y": 0.7408078241676342, "z": 2.059374598605941 } }, "xaxis": { "range": [ -1, 6 ], "autorange": true }, "yaxis": { "range": [ -1, 4 ], "autorange": true }, "autosize": true, "dragmode": "zoom", "template": { "data": { "bar": [ { "type": "bar", "marker": { "colorbar": { "ticks": "", "outlinewidth": 0 } } } ], "table": [ { "type": "table", "cells": { "fill": { "color": "#EBF0F8" }, "line": { "color": "white" } }, "header": { "fill": { "color": "#C8D4E3" }, "line": { "color": "white" } } } ], "carpet": [ { "type": "carpet", "aaxis": { "gridcolor": "#C8D4E3", "linecolor": "#C8D4E3", "endlinecolor": "#2a3f5f", "minorgridcolor": "#C8D4E3", "startlinecolor": "#2a3f5f" }, "baxis": { "gridcolor": "#C8D4E3", "linecolor": "#C8D4E3", "endlinecolor": "#2a3f5f", "minorgridcolor": "#C8D4E3", "startlinecolor": "#2a3f5f" } } ], "mesh3d": [ { "type": "mesh3d", "colorbar": { "ticks": "", "outlinewidth": 0 } } ], "contour": [ { "type": "contour", "colorbar": { "ticks": "", "outlinewidth": 0 }, "autocolorscale": true } ], "heatmap": [ { "type": "heatmap", "colorbar": { "ticks": "", "outlinewidth": 0 }, "autocolorscale": true } ], "scatter": [ { "type": "scatter", "marker": { "colorbar": { "ticks": "", "outlinewidth": 0 } } } ], "surface": [ { "type": "surface", "colorbar": { "ticks": "", "outlinewidth": 0 } } ], "heatmapgl": [ { "type": "heatmapgl", "colorbar": { "ticks": "", "outlinewidth": 0 } } ], "histogram": [ { "type": "histogram", "marker": { "colorbar": { "ticks": "", "outlinewidth": 0 } } } ], "parcoords": [ { "line": { "colorbar": { "ticks": "", "outlinewidth": 0 } }, "type": "parcoords" } ], "scatter3d": [ { "type": "scatter3d", "marker": { "colorbar": { "ticks": "", "outlinewidth": 0 } } } ], "scattergl": [ { "type": "scattergl", "marker": { "colorbar": { "ticks": "", "outlinewidth": 0 } } } ], "choropleth": [ { "type": "choropleth", "colorbar": { "ticks": "", "outlinewidth": 0 } } ], "scattergeo": [ { "type": "scattergeo", "marker": { "colorbar": { "ticks": "", "outlinewidth": 0 } } } ], "histogram2d": [ { "type": "histogram2d", "colorbar": { "ticks": "", "outlinewidth": 0 }, "autocolorscale": true } ], "scatterpolar": [ { "type": "scatterpolar", "marker": { "colorbar": { "ticks": "", "outlinewidth": 0 } } } ], "contourcarpet": [ { "type": "contourcarpet", "colorbar": { "ticks": "", "outlinewidth": 0 } } ], "scattercarpet": [ { "type": "scattercarpet", "marker": { "colorbar": { "ticks": "", "outlinewidth": 0 } } } ], "scattermapbox": [ { "type": "scattermapbox", "marker": { "colorbar": { "ticks": "", "outlinewidth": 0 } } } ], "scatterpolargl": [ { "type": "scatterpolargl", "marker": { "colorbar": { "ticks": "", "outlinewidth": 0 } } } ], "scatterternary": [ { "type": "scatterternary", "marker": { "colorbar": { "ticks": "", "outlinewidth": 0 } } } ], "histogram2dcontour": [ { "type": "histogram2dcontour", "colorbar": { "ticks": "", "outlinewidth": 0 }, "autocolorscale": true } ] }, "layout": { "geo": { "bgcolor": "white", "showland": true, "lakecolor": "white", "landcolor": "white", "showlakes": true, "subunitcolor": "#C8D4E3" }, "font": { "color": "#2a3f5f" }, "polar": { "bgcolor": "white", "radialaxis": { "ticks": "", "gridcolor": "#EBF0F8", "linecolor": "#EBF0F8" }, "angularaxis": { "ticks": "", "gridcolor": "#EBF0F8", "linecolor": "#EBF0F8" } }, "scene": { "xaxis": { "ticks": "", "gridcolor": "#DFE8F3", "gridwidth": 2, "linecolor": "#EBF0F8", "zerolinecolor": "#EBF0F8", "showbackground": true, "backgroundcolor": "white" }, "yaxis": { "ticks": "", "gridcolor": "#DFE8F3", "gridwidth": 2, "linecolor": "#EBF0F8", "zerolinecolor": "#EBF0F8", "showbackground": true, "backgroundcolor": "white" }, "zaxis": { "ticks": "", "gridcolor": "#DFE8F3", "gridwidth": 2, "linecolor": "#EBF0F8", "zerolinecolor": "#EBF0F8", "showbackground": true, "backgroundcolor": "white" } }, "title": { "x": 0.05 }, "xaxis": { "ticks": "", "gridcolor": "#EBF0F8", "linecolor": "#EBF0F8", "automargin": true, "zerolinecolor": "#EBF0F8", "zerolinewidth": 2 }, "yaxis": { "ticks": "", "gridcolor": "#EBF0F8", "linecolor": "#EBF0F8", "automargin": true, "zerolinecolor": "#EBF0F8", "zerolinewidth": 2 }, "ternary": { "aaxis": { "ticks": "", "gridcolor": "#DFE8F3", "linecolor": "#A2B1C6" }, "baxis": { "ticks": "", "gridcolor": "#DFE8F3", "linecolor": "#A2B1C6" }, "caxis": { "ticks": "", "gridcolor": "#DFE8F3", "linecolor": "#A2B1C6" }, "bgcolor": "white" }, "colorway": [ "#636efa", "#EF553B", "#00cc96", "#ab63fa", "#19d3f3", "#e763fa", "#fecb52", "#ffa15a", "#ff6692", "#b6e880" ], "hovermode": "closest", "colorscale": { "diverging": [ [ 0, "#8e0152" ], [ 0.1, "#c51b7d" ], [ 0.2, "#de77ae" ], [ 0.3, "#f1b6da" ], [ 0.4, "#fde0ef" ], [ 0.5, "#f7f7f7" ], [ 0.6, "#e6f5d0" ], [ 0.7, "#b8e186" ], [ 0.8, "#7fbc41" ], [ 0.9, "#4d9221" ], [ 1, "#276419" ] ], "sequential": [ [ 0, "#0508b8" ], [ 0.0893854748603352, "#1910d8" ], [ 0.1787709497206704, "#3c19f0" ], [ 0.2681564245810056, "#6b1cfb" ], [ 0.3575418994413408, "#981cfd" ], [ 0.44692737430167595, "#bf1cfd" ], [ 0.5363128491620112, "#dd2bfd" ], [ 0.6256983240223464, "#f246fe" ], [ 0.7150837988826816, "#fc67fd" ], [ 0.8044692737430168, "#fe88fc" ], [ 0.8938547486033519, "#fea5fd" ], [ 0.9832402234636871, "#febefe" ], [ 1, "#fec3fe" ] ], "sequentialminus": [ [ 0, "#0508b8" ], [ 0.0893854748603352, "#1910d8" ], [ 0.1787709497206704, "#3c19f0" ], [ 0.2681564245810056, "#6b1cfb" ], [ 0.3575418994413408, "#981cfd" ], [ 0.44692737430167595, "#bf1cfd" ], [ 0.5363128491620112, "#dd2bfd" ], [ 0.6256983240223464, "#f246fe" ], [ 0.7150837988826816, "#fc67fd" ], [ 0.8044692737430168, "#fe88fc" ], [ 0.8938547486033519, "#fea5fd" ], [ 0.9832402234636871, "#febefe" ], [ 1, "#fec3fe" ] ] }, "plot_bgcolor": "white", "paper_bgcolor": "white", "shapedefaults": { "line": { "width": 0 }, "opacity": 0.4, "fillcolor": "#506784" }, "annotationdefaults": { "arrowhead": 0, "arrowcolor": "#506784", "arrowwidth": 1 } }, "themeRef": "PLOTLY_WHITE" }, "showlegend": false } }, "height": null, "width": null, "user": { "profile_url": "https://chart-studio.plotly.com/~jordan.81", "avatar_url": "https://storage.googleapis.com/plotly-prod-profiles/73.jpg", "background_url": "https://storage.googleapis.com/plotly-prod-profiles/bg-6.jpg", "bio": "", "nickname": "", "website": "", "stream_tokens": null, "feature_set_id": null, "csrf_token": null, "date_joined": "2024-03-31 21:05:54", "mapbox_access_tokens": null, "has_password": null, "username": "jordan.81", "email": null, "is_active": null, "readonly": null, "is_dash_creator": null, "dash_created_count": null, "is_chart_creator": null, "charts_created_count": null } }, { "creation_time": "2024-03-31T21:45:42.579851Z", "comments": { "results": [], "count": 0 }, "parented": true, "embed_url": "https://chart-studio.plotly.com/~Paul_543NA/1.embed", "fid": "Paul_543NA:1", "filename": "interppol-papers-chart", "filetype": "plot", "img_url": "https://storage.googleapis.com/plotly-prod-images/Paul_543NA/1/9_WWWCKX5LJNE7N5843JREL1CB0GUFF8.png", "image_urls": { "default": "https://storage.googleapis.com/plotly-prod-images/Paul_543NA/1/2_DZ7BNY3180DU2UH9I30I3FN0170LXM.png", "block-thumb": "https://storage.googleapis.com/plotly-prod-images/Paul_543NA/1/8_52WL3G3F4D1FOLSVJH22GUZG9YV9G4.png", "list-thumb": "https://storage.googleapis.com/plotly-prod-images/Paul_543NA/1/9_WWWCKX5LJNE7N5843JREL1CB0GUFF8.png" }, "api_urls": { "files": "https://api.plotly.com/v2/files/Paul_543NA:1", "plots": "https://api.plotly.com/v2/plots/Paul_543NA:1", "parent": "https://api.plotly.com/v2/folders/home?user=Paul_543NA" }, "owner": "Paul_543NA", "parent": -1, "preview": "", "referencers": [], "references": [], "title": "", "views": 36, "web_url": "https://chart-studio.plotly.com/~Paul_543NA/1/", "world_readable": true, "date_modified": "2024-04-01T10:26:10.243Z", "stars": { "results": [], "count": 0 }, "collaborators": { "results": [], "count": 0 }, "subfolder_count": null, "refresh_interval": null, "organize_view_url": "https://chart-studio.plotly.com/~Paul_543NA/1/", "current_user_permission": "read", "is_theme": null, "is_template": null, "autosize": true, "caption": "", "figure": { "data": [ { "name": "Explainable Papers", "type": "bar", "xsrc": "Paul_543NA:18:dcb59d", "ysrc": "Paul_543NA:18:91b7a1", "marker": { "color": "indianred" } }, { "name": "Interpretable Papers", "type": "bar", "xsrc": "Paul_543NA:18:2369e5", "ysrc": "Paul_543NA:18:248f19", "marker": { "color": "lightsalmon" } }, { "name": "Venues", "type": "bar", "xsrc": "Paul_543NA:18:679f82", "ysrc": "Paul_543NA:18:481fe1", "marker": { "color": "lightblue" } } ], "layout": { "font": { "size": 12, "family": "Roboto Mono, monospace" }, "xaxis": { "dtick": 1, "title": { "text": "Year" }, "tickmode": "linear" }, "yaxis": { "title": { "text": "Number of Papers" } }, "height": 600, "legend": { "y": -0.2, "yanchor": "top", "orientation": "h" }, "margin": { "b": 40, "l": 40, "r": 40, "t": 100 }, "barmode": "stack", "dragmode": false, "template": { "data": { "bar": [ { "type": "bar", "marker": { "line": { "color": "#E5ECF6", "width": 0.5 }, "pattern": { "size": 10, "fillmode": "overlay", "solidity": 0.2 } }, "error_x": { "color": "#2a3f5f" }, "error_y": { "color": "#2a3f5f" } } ], "pie": [ { "type": "pie", "automargin": true } ], "table": [ { "type": "table", "cells": { "fill": { "color": "#EBF0F8" }, "line": { "color": "white" } }, "header": { "fill": { "color": "#C8D4E3" }, "line": { "color": "white" } } } ], "carpet": [ { "type": "carpet", "aaxis": { "gridcolor": "white", "linecolor": "white", "endlinecolor": "#2a3f5f", "minorgridcolor": "white", "startlinecolor": "#2a3f5f" }, "baxis": { "gridcolor": "white", "linecolor": "white", "endlinecolor": "#2a3f5f", "minorgridcolor": "white", "startlinecolor": "#2a3f5f" } } ], "mesh3d": [ { "type": "mesh3d", "colorbar": { "ticks": "", "outlinewidth": 0 } } ], "contour": [ { "type": "contour", "colorbar": { "ticks": "", "outlinewidth": 0 }, "colorscale": [ [ 0.0, "#0d0887" ], [ 0.1111111111111111, "#46039f" ], [ 0.2222222222222222, "#7201a8" ], [ 0.3333333333333333, "#9c179e" ], [ 0.4444444444444444, "#bd3786" ], [ 0.5555555555555556, "#d8576b" ], [ 0.6666666666666666, "#ed7953" ], [ 0.7777777777777778, "#fb9f3a" ], [ 0.8888888888888888, "#fdca26" ], [ 1.0, "#f0f921" ] ] } ], "heatmap": [ { "type": "heatmap", "colorbar": { "ticks": "", "outlinewidth": 0 }, "colorscale": [ [ 0.0, "#0d0887" ], [ 0.1111111111111111, "#46039f" ], [ 0.2222222222222222, "#7201a8" ], [ 0.3333333333333333, "#9c179e" ], [ 0.4444444444444444, "#bd3786" ], [ 0.5555555555555556, "#d8576b" ], [ 0.6666666666666666, "#ed7953" ], [ 0.7777777777777778, "#fb9f3a" ], [ 0.8888888888888888, "#fdca26" ], [ 1.0, "#f0f921" ] ] } ], "scatter": [ { "type": "scatter", "fillpattern": { "size": 10, "fillmode": "overlay", "solidity": 0.2 } } ], "surface": [ { "type": "surface", "colorbar": { "ticks": "", "outlinewidth": 0 }, "colorscale": [ [ 0.0, "#0d0887" ], [ 0.1111111111111111, "#46039f" ], [ 0.2222222222222222, "#7201a8" ], [ 0.3333333333333333, "#9c179e" ], [ 0.4444444444444444, "#bd3786" ], [ 0.5555555555555556, "#d8576b" ], [ 0.6666666666666666, "#ed7953" ], [ 0.7777777777777778, "#fb9f3a" ], [ 0.8888888888888888, "#fdca26" ], [ 1.0, "#f0f921" ] ] } ], "barpolar": [ { "type": "barpolar", "marker": { "line": { "color": "#E5ECF6", "width": 0.5 }, "pattern": { "size": 10, "fillmode": "overlay", "solidity": 0.2 } } } ], "heatmapgl": [ { "type": "heatmapgl", "colorbar": { "ticks": "", "outlinewidth": 0 }, "colorscale": [ [ 0.0, "#0d0887" ], [ 0.1111111111111111, "#46039f" ], [ 0.2222222222222222, "#7201a8" ], [ 0.3333333333333333, "#9c179e" ], [ 0.4444444444444444, "#bd3786" ], [ 0.5555555555555556, "#d8576b" ], [ 0.6666666666666666, "#ed7953" ], [ 0.7777777777777778, "#fb9f3a" ], [ 0.8888888888888888, "#fdca26" ], [ 1.0, "#f0f921" ] ] } ], "histogram": [ { "type": "histogram", "marker": { "pattern": { "size": 10, "fillmode": "overlay", "solidity": 0.2 } } } ], "parcoords": [ { "line": { "colorbar": { "ticks": "", "outlinewidth": 0 } }, "type": "parcoords" } ], "scatter3d": [ { "line": { "colorbar": { "ticks": "", "outlinewidth": 0 } }, "type": "scatter3d", "marker": { "colorbar": { "ticks": "", "outlinewidth": 0 } } } ], "scattergl": [ { "type": "scattergl", "marker": { "colorbar": { "ticks": "", "outlinewidth": 0 } } } ], "choropleth": [ { "type": "choropleth", "colorbar": { "ticks": "", "outlinewidth": 0 } } ], "scattergeo": [ { "type": "scattergeo", "marker": { "colorbar": { "ticks": "", "outlinewidth": 0 } } } ], "histogram2d": [ { "type": "histogram2d", "colorbar": { "ticks": "", "outlinewidth": 0 }, "colorscale": [ [ 0.0, "#0d0887" ], [ 0.1111111111111111, "#46039f" ], [ 0.2222222222222222, "#7201a8" ], [ 0.3333333333333333, "#9c179e" ], [ 0.4444444444444444, "#bd3786" ], [ 0.5555555555555556, "#d8576b" ], [ 0.6666666666666666, "#ed7953" ], [ 0.7777777777777778, "#fb9f3a" ], [ 0.8888888888888888, "#fdca26" ], [ 1.0, "#f0f921" ] ] } ], "scatterpolar": [ { "type": "scatterpolar", "marker": { "colorbar": { "ticks": "", "outlinewidth": 0 } } } ], "contourcarpet": [ { "type": "contourcarpet", "colorbar": { "ticks": "", "outlinewidth": 0 } } ], "scattercarpet": [ { "type": "scattercarpet", "marker": { "colorbar": { "ticks": "", "outlinewidth": 0 } } } ], "scattermapbox": [ { "type": "scattermapbox", "marker": { "colorbar": { "ticks": "", "outlinewidth": 0 } } } ], "scatterpolargl": [ { "type": "scatterpolargl", "marker": { "colorbar": { "ticks": "", "outlinewidth": 0 } } } ], "scatterternary": [ { "type": "scatterternary", "marker": { "colorbar": { "ticks": "", "outlinewidth": 0 } } } ], "histogram2dcontour": [ { "type": "histogram2dcontour", "colorbar": { "ticks": "", "outlinewidth": 0 }, "colorscale": [ [ 0.0, "#0d0887" ], [ 0.1111111111111111, "#46039f" ], [ 0.2222222222222222, "#7201a8" ], [ 0.3333333333333333, "#9c179e" ], [ 0.4444444444444444, "#bd3786" ], [ 0.5555555555555556, "#d8576b" ], [ 0.6666666666666666, "#ed7953" ], [ 0.7777777777777778, "#fb9f3a" ], [ 0.8888888888888888, "#fdca26" ], [ 1.0, "#f0f921" ] ] } ] }, "layout": { "geo": { "bgcolor": "white", "showland": true, "lakecolor": "white", "landcolor": "#E5ECF6", "showlakes": true, "subunitcolor": "white" }, "font": { "color": "#2a3f5f" }, "polar": { "bgcolor": "#E5ECF6", "radialaxis": { "ticks": "", "gridcolor": "white", "linecolor": "white" }, "angularaxis": { "ticks": "", "gridcolor": "white", "linecolor": "white" } }, "scene": { "xaxis": { "ticks": "", "gridcolor": "white", "gridwidth": 2, "linecolor": "white", "zerolinecolor": "white", "showbackground": true, "backgroundcolor": "#E5ECF6" }, "yaxis": { "ticks": "", "gridcolor": "white", "gridwidth": 2, "linecolor": "white", "zerolinecolor": "white", "showbackground": true, "backgroundcolor": "#E5ECF6" }, "zaxis": { "ticks": "", "gridcolor": "white", "gridwidth": 2, "linecolor": "white", "zerolinecolor": "white", "showbackground": true, "backgroundcolor": "#E5ECF6" } }, "title": { "x": 0.05 }, "xaxis": { "ticks": "", "title": { "standoff": 15 }, "gridcolor": "white", "linecolor": "white", "automargin": true, "zerolinecolor": "white", "zerolinewidth": 2 }, "yaxis": { "ticks": "", "title": { "standoff": 15 }, "gridcolor": "white", "linecolor": "white", "automargin": true, "zerolinecolor": "white", "zerolinewidth": 2 }, "mapbox": { "style": "light" }, "ternary": { "aaxis": { "ticks": "", "gridcolor": "white", "linecolor": "white" }, "baxis": { "ticks": "", "gridcolor": "white", "linecolor": "white" }, "caxis": { "ticks": "", "gridcolor": "white", "linecolor": "white" }, "bgcolor": "#E5ECF6" }, "colorway": [ "#636efa", "#EF553B", "#00cc96", "#ab63fa", "#FFA15A", "#19d3f3", "#FF6692", "#B6E880", "#FF97FF", "#FECB52" ], "coloraxis": { "colorbar": { "ticks": "", "outlinewidth": 0 } }, "hovermode": "closest", "colorscale": { "diverging": [ [ 0, "#8e0152" ], [ 0.1, "#c51b7d" ], [ 0.2, "#de77ae" ], [ 0.3, "#f1b6da" ], [ 0.4, "#fde0ef" ], [ 0.5, "#f7f7f7" ], [ 0.6, "#e6f5d0" ], [ 0.7, "#b8e186" ], [ 0.8, "#7fbc41" ], [ 0.9, "#4d9221" ], [ 1, "#276419" ] ], "sequential": [ [ 0.0, "#0d0887" ], [ 0.1111111111111111, "#46039f" ], [ 0.2222222222222222, "#7201a8" ], [ 0.3333333333333333, "#9c179e" ], [ 0.4444444444444444, "#bd3786" ], [ 0.5555555555555556, "#d8576b" ], [ 0.6666666666666666, "#ed7953" ], [ 0.7777777777777778, "#fb9f3a" ], [ 0.8888888888888888, "#fdca26" ], [ 1.0, "#f0f921" ] ], "sequentialminus": [ [ 0.0, "#0d0887" ], [ 0.1111111111111111, "#46039f" ], [ 0.2222222222222222, "#7201a8" ], [ 0.3333333333333333, "#9c179e" ], [ 0.4444444444444444, "#bd3786" ], [ 0.5555555555555556, "#d8576b" ], [ 0.6666666666666666, "#ed7953" ], [ 0.7777777777777778, "#fb9f3a" ], [ 0.8888888888888888, "#fdca26" ], [ 1.0, "#f0f921" ] ] }, "hoverlabel": { "align": "left" }, "plot_bgcolor": "#E5ECF6", "paper_bgcolor": "white", "shapedefaults": { "line": { "color": "#2a3f5f" } }, "autotypenumbers": "strict", "annotationdefaults": { "arrowhead": 0, "arrowcolor": "#2a3f5f", "arrowwidth": 1 } } }, "minreducedheight": 300 } }, "height": 600, "width": null, "user": { "profile_url": "https://chart-studio.plotly.com/~Paul_543NA", "avatar_url": "https://storage.googleapis.com/plotly-prod-profiles/33.jpg", "background_url": "https://storage.googleapis.com/plotly-prod-profiles/bg-11.jpg", "bio": "", "nickname": "", "website": "", "stream_tokens": null, "feature_set_id": null, "csrf_token": null, "date_joined": "2024-03-31 21:37:45", "mapbox_access_tokens": null, "has_password": null, "username": "Paul_543NA", "email": null, "is_active": null, "readonly": null, "is_dash_creator": null, "dash_created_count": null, "is_chart_creator": null, "charts_created_count": null } }, { "creation_time": "2024-03-31T21:42:14.947859Z", "comments": { "results": [], "count": 0 }, "parented": true, "embed_url": "https://chart-studio.plotly.com/~jordan.81/2.embed", "fid": "jordan.81:2", "filename": "3D Line", "filetype": "plot", "img_url": "https://storage.googleapis.com/plotly-prod-images/jordan.81/2/9_9QF4LC5BXJK53DVU6LV8SAHQZC0CJB.png", "image_urls": { "default": "https://storage.googleapis.com/plotly-prod-images/jordan.81/2/2_WJ2EAR8R4J7XYN7K3E1JOTINZGC30Q.png", "block-thumb": "https://storage.googleapis.com/plotly-prod-images/jordan.81/2/8_GSEH9KQWYFSQADSUDXD87BOFLD46N0.png", "list-thumb": "https://storage.googleapis.com/plotly-prod-images/jordan.81/2/9_9QF4LC5BXJK53DVU6LV8SAHQZC0CJB.png" }, "api_urls": { "files": "https://api.plotly.com/v2/files/jordan.81:2", "plots": "https://api.plotly.com/v2/plots/jordan.81:2", "parent": "https://api.plotly.com/v2/folders/home?user=jordan.81" }, "owner": "jordan.81", "parent": -1, "preview": "", "referencers": [], "references": [], "title": "", "views": 1, "web_url": "https://chart-studio.plotly.com/~jordan.81/2/", "world_readable": true, "date_modified": "2024-04-01T01:13:22.145Z", "stars": { "results": [], "count": 0 }, "collaborators": { "results": [], "count": 0 }, "subfolder_count": null, "refresh_interval": null, "organize_view_url": "https://chart-studio.plotly.com/~jordan.81/2/", "current_user_permission": "read", "is_theme": null, "is_template": false, "autosize": true, "caption": "", "figure": { "data": [ { "line": { "width": 2 }, "meta": { "columnNames": { "x": "C", "y": "D", "z": "E" } }, "mode": "lines", "type": "scatter3d", "xsrc": "jordan.81:1:712979", "ysrc": "jordan.81:1:88fadb", "zsrc": "jordan.81:1:71dd12" }, { "line": { "color": "rgb(99, 110, 250)", "width": 2 }, "meta": { "columnNames": { "x": "I", "y": "J", "z": "K" } }, "mode": "lines", "name": "trace 1", "type": "scatter3d", "xsrc": "jordan.81:1:5a3c4e", "ysrc": "jordan.81:1:f3e57d", "zsrc": "jordan.81:1:dc7d3a" }, { "line": { "color": "rgb(99, 110, 250)", "width": 2 }, "meta": { "columnNames": { "x": "O", "y": "P", "z": "Q" } }, "mode": "lines", "type": "scatter3d", "xsrc": "jordan.81:1:d3b125", "ysrc": "jordan.81:1:97bd5b", "zsrc": "jordan.81:1:af6a89" }, { "line": { "color": "rgb(99, 110, 250)", "width": 2 }, "meta": { "columnNames": { "x": "U", "y": "V", "z": "W" } }, "mode": "lines", "name": "trace 3", "type": "scatter3d", "xsrc": "jordan.81:1:3b6c2c", "ysrc": "jordan.81:1:ec2b08", "zsrc": "jordan.81:1:ee7127", "visible": true }, { "line": { "color": "rgb(99, 110, 250)", "width": 2 }, "meta": { "columnNames": { "x": "AJ", "y": "AK", "z": "AL" } }, "mode": "lines", "type": "scatter3d", "xsrc": "jordan.81:1:87c8e8", "ysrc": "jordan.81:1:5c3b3b", "zsrc": "jordan.81:1:8af07e" }, { "line": { "color": "rgb(99, 110, 250)", "width": 2 }, "meta": { "columnNames": { "x": "AT", "y": "AU", "z": "AV" } }, "mode": "lines", "type": "scatter3d", "xsrc": "jordan.81:1:89c17c", "ysrc": "jordan.81:1:379ddf", "zsrc": "jordan.81:1:fed8c2" }, { "line": { "color": "rgb(99, 110, 250)", "width": 2 }, "meta": { "columnNames": { "x": "BC", "y": "BD", "z": "BE" } }, "mode": "lines", "type": "scatter3d", "xsrc": "jordan.81:1:0bfb89", "ysrc": "jordan.81:1:9a8b67", "zsrc": "jordan.81:1:eb9e2f" }, { "line": { "color": "rgb(99, 110, 250)", "width": 2 }, "meta": { "columnNames": { "x": "BS", "y": "BT", "z": "BU" } }, "mode": "lines", "type": "scatter3d", "xsrc": "jordan.81:1:d9bbdc", "ysrc": "jordan.81:1:c081f1", "zsrc": "jordan.81:1:44772d" }, { "line": { "color": "rgb(99, 110, 250)", "width": 2 }, "meta": { "columnNames": { "x": "BW", "y": "BX", "z": "BY" } }, "mode": "lines", "type": "scatter3d", "xsrc": "jordan.81:1:6c76e2", "ysrc": "jordan.81:1:3330ef", "zsrc": "jordan.81:1:87b15c" }, { "line": { "color": "rgb(99, 110, 250)", "width": 2 }, "meta": { "columnNames": { "x": "CA", "y": "CB", "z": "CC" } }, "mode": "lines", "type": "scatter3d", "xsrc": "jordan.81:1:0a4495", "ysrc": "jordan.81:1:aab4ee", "zsrc": "jordan.81:1:048667" }, { "line": { "width": 2 }, "meta": { "columnNames": { "x": "CE", "y": "CF", "z": "CG" } }, "mode": "lines", "type": "scatter3d", "xsrc": "jordan.81:1:30cf65", "ysrc": "jordan.81:1:571eae", "zsrc": "jordan.81:1:796c05" }, { "line": { "color": "rgb(99, 110, 250)", "width": 2 }, "meta": { "columnNames": { "x": "CI", "y": "CJ", "z": "CK" } }, "mode": "lines", "type": "scatter3d", "xsrc": "jordan.81:1:be054d", "ysrc": "jordan.81:1:a0cde8", "zsrc": "jordan.81:1:8b6724" }, { "line": { "color": "rgb(99, 110, 250)", "width": 2 }, "meta": { "columnNames": { "x": "CM", "y": "CN", "z": "CO" } }, "mode": "lines", "type": "scatter3d", "xsrc": "jordan.81:1:8c35b0", "ysrc": "jordan.81:1:35854f", "zsrc": "jordan.81:1:3bf23f" }, { "line": { "color": "rgb(99, 110, 250)", "width": 2 }, "meta": { "columnNames": { "x": "CQ", "y": "CR", "z": "CS" } }, "mode": "lines", "type": "scatter3d", "xsrc": "jordan.81:1:df4785", "ysrc": "jordan.81:1:cc682e", "zsrc": "jordan.81:1:533022" }, { "line": { "color": "rgb(99, 110, 250)", "width": 2 }, "meta": { "columnNames": { "x": "CU", "y": "CV", "z": "CW" } }, "mode": "lines", "type": "scatter3d", "xsrc": "jordan.81:1:fc0e72", "ysrc": "jordan.81:1:f47ade", "zsrc": "jordan.81:1:29411a" }, { "line": { "color": "rgb(99, 110, 250)", "width": 2 }, "meta": { "columnNames": { "x": "CY", "y": "CZ", "z": "DA" } }, "mode": "lines", "type": "scatter3d", "xsrc": "jordan.81:1:9a7a6a", "ysrc": "jordan.81:1:87b66c", "zsrc": "jordan.81:1:f0c4ed" }, { "line": { "color": "rgb(99, 110, 250)", "width": 2 }, "meta": { "columnNames": { "x": "DC", "y": "DD", "z": "DE" } }, "mode": "lines", "type": "scatter3d", "xsrc": "jordan.81:1:405213", "ysrc": "jordan.81:1:9d9db6", "zsrc": "jordan.81:1:b2081c" }, { "line": { "color": "rgb(99, 110, 250)", "width": 2 }, "meta": { "columnNames": { "x": "DG", "y": "DH", "z": "DI" } }, "mode": "lines", "type": "scatter3d", "xsrc": "jordan.81:1:a0f0e6", "ysrc": "jordan.81:1:bb3563", "zsrc": "jordan.81:1:14f52c" }, { "line": { "color": "rgb(99, 110, 250)", "width": 2 }, "meta": { "columnNames": { "x": "BK", "y": "BL", "z": "BM" } }, "mode": "lines", "type": "scatter3d", "xsrc": "jordan.81:1:9b77a4", "ysrc": "jordan.81:1:1ab6d9", "zsrc": "jordan.81:1:780a4f" }, { "line": { "color": "rgb(99, 110, 250)", "width": 2 }, "meta": { "columnNames": { "x": "DK", "y": "DL", "z": "DM" } }, "mode": "lines", "type": "scatter3d", "xsrc": "jordan.81:1:876def", "ysrc": "jordan.81:1:d6bbdf", "zsrc": "jordan.81:1:6c94f3" }, { "line": { "width": 2 }, "meta": { "columnNames": { "x": "DO", "y": "DP", "z": "DQ" } }, "mode": "lines", "type": "scatter3d", "xsrc": "jordan.81:1:213b8d", "ysrc": "jordan.81:1:bb42b1", "zsrc": "jordan.81:1:5245ad" }, { "line": { "color": "rgb(99, 110, 250)", "width": 2 }, "meta": { "columnNames": { "x": "DS", "y": "DT", "z": "DU" } }, "mode": "lines", "type": "scatter3d", "xsrc": "jordan.81:1:d9d65b", "ysrc": "jordan.81:1:031cf8", "zsrc": "jordan.81:1:60da6c" }, { "line": { "color": "rgb(99, 110, 250)", "width": 2 }, "meta": { "columnNames": { "x": "DW", "y": "DX", "z": "DY" } }, "mode": "lines", "type": "scatter3d", "xsrc": "jordan.81:1:3a7b74", "ysrc": "jordan.81:1:7c1dfc", "zsrc": "jordan.81:1:20b693" }, { "line": { "color": "rgb(99, 110, 250)", "width": 2 }, "meta": { "columnNames": { "x": "EA", "y": "EB", "z": "EC" } }, "mode": "lines", "type": "scatter3d", "xsrc": "jordan.81:1:ced507", "ysrc": "jordan.81:1:b69515", "zsrc": "jordan.81:1:9851b3" }, { "line": { "color": "rgb(99, 110, 250)", "width": 2 }, "meta": { "columnNames": { "x": "EE", "y": "EF", "z": "EG" } }, "mode": "lines", "type": "scatter3d", "xsrc": "jordan.81:1:a10de1", "ysrc": "jordan.81:1:5209c6", "zsrc": "jordan.81:1:9dcfe4" }, { "line": { "color": "rgb(99, 110, 250)", "width": 2 }, "meta": { "columnNames": { "x": "EI", "y": "EJ", "z": "EK" } }, "mode": "lines", "type": "scatter3d", "xsrc": "jordan.81:1:e2c1e5", "ysrc": "jordan.81:1:31d1ba", "zsrc": "jordan.81:1:48771d" }, { "line": { "color": "rgb(99, 110, 250)", "width": 2 }, "meta": { "columnNames": { "x": "EM", "y": "EN", "z": "EO" } }, "mode": "lines", "type": "scatter3d", "xsrc": "jordan.81:1:afabbf", "ysrc": "jordan.81:1:74c5de", "zsrc": "jordan.81:1:f49a48" }, { "line": { "color": "rgb(99, 110, 250)", "width": 2 }, "meta": { "columnNames": { "x": "EQ", "y": "ER", "z": "ES" } }, "mode": "lines", "type": "scatter3d", "xsrc": "jordan.81:1:2cb030", "ysrc": "jordan.81:1:bbe0dc", "zsrc": "jordan.81:1:49b946" }, { "line": { "color": "rgb(99, 110, 250)", "width": 2 }, "meta": { "columnNames": { "x": "EU", "y": "EV", "z": "EW" } }, "mode": "lines", "type": "scatter3d", "xsrc": "jordan.81:1:76d7e6", "ysrc": "jordan.81:1:9927bf", "zsrc": "jordan.81:1:cc3012" }, { "line": { "color": "rgb(99, 110, 250)", "width": 2 }, "meta": { "columnNames": { "x": "EY", "y": "EZ", "z": "FA" } }, "mode": "lines", "type": "scatter3d", "xsrc": "jordan.81:1:46e716", "ysrc": "jordan.81:1:55b77b", "zsrc": "jordan.81:1:4b0ed4" }, { "line": { "width": 2 }, "meta": { "columnNames": { "x": "FC", "y": "FD", "z": "FE" } }, "mode": "lines", "type": "scatter3d", "xsrc": "jordan.81:1:885d9e", "ysrc": "jordan.81:1:181e30", "zsrc": "jordan.81:1:62bc17" }, { "line": { "color": "rgb(99, 110, 250)", "width": 2 }, "meta": { "columnNames": { "x": "FG", "y": "FH", "z": "FI" } }, "mode": "lines", "type": "scatter3d", "xsrc": "jordan.81:1:200e4a", "ysrc": "jordan.81:1:f4722c", "zsrc": "jordan.81:1:494530" }, { "line": { "color": "rgb(99, 110, 250)", "width": 2 }, "meta": { "columnNames": { "x": "FK", "y": "FL", "z": "FM" } }, "mode": "lines", "type": "scatter3d", "xsrc": "jordan.81:1:befed2", "ysrc": "jordan.81:1:ac0534", "zsrc": "jordan.81:1:5aa86e" }, { "line": { "color": "rgb(99, 110, 250)", "width": 2 }, "meta": { "columnNames": { "x": "FO", "y": "FP", "z": "FQ" } }, "mode": "lines", "type": "scatter3d", "xsrc": "jordan.81:1:117031", "ysrc": "jordan.81:1:53059e", "zsrc": "jordan.81:1:dc66cb" }, { "line": { "color": "rgb(99, 110, 250)", "width": 2 }, "meta": { "columnNames": { "x": "FS", "y": "FT", "z": "FU" } }, "mode": "lines", "type": "scatter3d", "xsrc": "jordan.81:1:6772c7", "ysrc": "jordan.81:1:d07272", "zsrc": "jordan.81:1:fda0dd" }, { "line": { "color": "rgb(99, 110, 250)", "width": 2 }, "meta": { "columnNames": { "x": "FW", "y": "FX", "z": "FY" } }, "mode": "lines", "type": "scatter3d", "xsrc": "jordan.81:1:50bcae", "ysrc": "jordan.81:1:8a0196", "zsrc": "jordan.81:1:5d4e3e" }, { "line": { "color": "rgb(99, 110, 250)", "width": 2 }, "meta": { "columnNames": { "x": "GA", "y": "GB", "z": "GC" } }, "mode": "lines", "type": "scatter3d", "xsrc": "jordan.81:1:2df3cc", "ysrc": "jordan.81:1:f75a25", "zsrc": "jordan.81:1:5c68d9" }, { "line": { "color": "rgb(99, 110, 250)", "width": 2 }, "meta": { "columnNames": { "x": "GE", "y": "GF", "z": "GG" } }, "mode": "lines", "type": "scatter3d", "xsrc": "jordan.81:1:fe1f07", "ysrc": "jordan.81:1:144182", "zsrc": "jordan.81:1:053c76" }, { "line": { "color": "rgb(99, 110, 250)", "width": 2 }, "meta": { "columnNames": { "x": "GI", "y": "GJ", "z": "GK" } }, "mode": "lines", "type": "scatter3d", "xsrc": "jordan.81:1:2f7eee", "ysrc": "jordan.81:1:005a87", "zsrc": "jordan.81:1:36655b" }, { "line": { "color": "rgb(99, 110, 250)", "width": 2 }, "meta": { "columnNames": { "x": "GM", "y": "GN", "z": "GO" } }, "mode": "lines", "type": "scatter3d", "xsrc": "jordan.81:1:ce1589", "ysrc": "jordan.81:1:06f3ae", "zsrc": "jordan.81:1:777203" }, { "line": { "width": 2 }, "meta": { "columnNames": { "x": "GQ", "y": "GR", "z": "GS" } }, "mode": "lines", "type": "scatter3d", "xsrc": "jordan.81:1:a46ee7", "ysrc": "jordan.81:1:dc6896", "zsrc": "jordan.81:1:b97f6f" }, { "line": { "color": "rgb(99, 110, 250)", "width": 2 }, "meta": { "columnNames": { "x": "GU", "y": "GV", "z": "GW" } }, "mode": "lines", "type": "scatter3d", "xsrc": "jordan.81:1:947568", "ysrc": "jordan.81:1:6307cf", "zsrc": "jordan.81:1:e8d492" }, { "line": { "color": "rgb(99, 110, 250)", "width": 2 }, "meta": { "columnNames": { "x": "GY", "y": "GZ", "z": "HA" } }, "mode": "lines", "type": "scatter3d", "xsrc": "jordan.81:1:cd018b", "ysrc": "jordan.81:1:4c5a60", "zsrc": "jordan.81:1:420001" }, { "line": { "color": "rgb(99, 110, 250)", "width": 2 }, "meta": { "columnNames": { "x": "HC", "y": "HD", "z": "HE" } }, "mode": "lines", "type": "scatter3d", "xsrc": "jordan.81:1:9551ea", "ysrc": "jordan.81:1:6c7a95", "zsrc": "jordan.81:1:7d15e7" }, { "line": { "color": "rgb(99, 110, 250)", "width": 2 }, "meta": { "columnNames": { "x": "HG", "y": "HH", "z": "HI" } }, "mode": "lines", "type": "scatter3d", "xsrc": "jordan.81:1:3d3cd7", "ysrc": "jordan.81:1:ed138a", "zsrc": "jordan.81:1:baa0eb" }, { "line": { "color": "rgb(99, 110, 250)", "width": 2 }, "meta": { "columnNames": { "x": "HK", "y": "HL", "z": "HM" } }, "mode": "lines", "type": "scatter3d", "xsrc": "jordan.81:1:ace977", "ysrc": "jordan.81:1:01c5b9", "zsrc": "jordan.81:1:3acb7e" }, { "line": { "color": "rgb(99, 110, 250)", "width": 2 }, "meta": { "columnNames": { "x": "HO", "y": "HP", "z": "HQ" } }, "mode": "lines", "type": "scatter3d", "xsrc": "jordan.81:1:addb9c", "ysrc": "jordan.81:1:dde15b", "zsrc": "jordan.81:1:9dfcaf" }, { "line": { "color": "rgb(99, 110, 250)", "width": 2 }, "meta": { "columnNames": { "x": "HT", "y": "HU", "z": "HV" } }, "mode": "lines", "type": "scatter3d", "xsrc": "jordan.81:1:12c5ae", "ysrc": "jordan.81:1:c91bd3", "zsrc": "jordan.81:1:747090" }, { "line": { "color": "rgb(99, 110, 250)", "width": 2 }, "meta": { "columnNames": { "x": "HX", "y": "HY", "z": "HZ" } }, "mode": "lines", "type": "scatter3d", "xsrc": "jordan.81:1:c7b040", "ysrc": "jordan.81:1:81521d", "zsrc": "jordan.81:1:1a81e5" }, { "line": { "color": "rgb(99, 110, 250)", "width": 2 }, "meta": { "columnNames": { "x": "IB", "y": "IC", "z": "ID" } }, "mode": "lines", "type": "scatter3d", "xsrc": "jordan.81:1:2b9b17", "ysrc": "jordan.81:1:54150b", "zsrc": "jordan.81:1:8f4ad1" } ], "frames": [], "layout": { "scene": { "camera": { "up": { "x": 0.4146913533867729, "y": -0.874401400373689, "z": -0.2518993299927146 }, "eye": { "x": -1.2950666356166507, "y": -0.6534767448049256, "z": -0.08935246058091008 }, "center": { "x": 0.08527742268069219, "y": 0.031485591031702315, "z": -0.19461387586467319 }, "projection": { "type": "perspective" } }, "dragmode": "pan", "aspectmode": "auto", "aspectratio": { "x": 0.6554794608224299, "y": 0.7408078241676342, "z": 2.059374598605941 } }, "xaxis": { "range": [ -1, 6 ], "autorange": true }, "yaxis": { "range": [ -1, 4 ], "autorange": true }, "autosize": true, "dragmode": "pan", "template": { "data": { "bar": [ { "type": "bar", "marker": { "colorbar": { "ticks": "", "outlinewidth": 0 } } } ], "table": [ { "type": "table", "cells": { "fill": { "color": "#EBF0F8" }, "line": { "color": "white" } }, "header": { "fill": { "color": "#C8D4E3" }, "line": { "color": "white" } } } ], "carpet": [ { "type": "carpet", "aaxis": { "gridcolor": "#C8D4E3", "linecolor": "#C8D4E3", "endlinecolor": "#2a3f5f", "minorgridcolor": "#C8D4E3", "startlinecolor": "#2a3f5f" }, "baxis": { "gridcolor": "#C8D4E3", "linecolor": "#C8D4E3", "endlinecolor": "#2a3f5f", "minorgridcolor": "#C8D4E3", "startlinecolor": "#2a3f5f" } } ], "mesh3d": [ { "type": "mesh3d", "colorbar": { "ticks": "", "outlinewidth": 0 } } ], "contour": [ { "type": "contour", "colorbar": { "ticks": "", "outlinewidth": 0 }, "autocolorscale": true } ], "heatmap": [ { "type": "heatmap", "colorbar": { "ticks": "", "outlinewidth": 0 }, "autocolorscale": true } ], "scatter": [ { "type": "scatter", "marker": { "colorbar": { "ticks": "", "outlinewidth": 0 } } } ], "surface": [ { "type": "surface", "colorbar": { "ticks": "", "outlinewidth": 0 } } ], "heatmapgl": [ { "type": "heatmapgl", "colorbar": { "ticks": "", "outlinewidth": 0 } } ], "histogram": [ { "type": "histogram", "marker": { "colorbar": { "ticks": "", "outlinewidth": 0 } } } ], "parcoords": [ { "line": { "colorbar": { "ticks": "", "outlinewidth": 0 } }, "type": "parcoords" } ], "scatter3d": [ { "type": "scatter3d", "marker": { "colorbar": { "ticks": "", "outlinewidth": 0 } } } ], "scattergl": [ { "type": "scattergl", "marker": { "colorbar": { "ticks": "", "outlinewidth": 0 } } } ], "choropleth": [ { "type": "choropleth", "colorbar": { "ticks": "", "outlinewidth": 0 } } ], "scattergeo": [ { "type": "scattergeo", "marker": { "colorbar": { "ticks": "", "outlinewidth": 0 } } } ], "histogram2d": [ { "type": "histogram2d", "colorbar": { "ticks": "", "outlinewidth": 0 }, "autocolorscale": true } ], "scatterpolar": [ { "type": "scatterpolar", "marker": { "colorbar": { "ticks": "", "outlinewidth": 0 } } } ], "contourcarpet": [ { "type": "contourcarpet", "colorbar": { "ticks": "", "outlinewidth": 0 } } ], "scattercarpet": [ { "type": "scattercarpet", "marker": { "colorbar": { "ticks": "", "outlinewidth": 0 } } } ], "scattermapbox": [ { "type": "scattermapbox", "marker": { "colorbar": { "ticks": "", "outlinewidth": 0 } } } ], "scatterpolargl": [ { "type": "scatterpolargl", "marker": { "colorbar": { "ticks": "", "outlinewidth": 0 } } } ], "scatterternary": [ { "type": "scatterternary", "marker": { "colorbar": { "ticks": "", "outlinewidth": 0 } } } ], "histogram2dcontour": [ { "type": "histogram2dcontour", "colorbar": { "ticks": "", "outlinewidth": 0 }, "autocolorscale": true } ] }, "layout": { "geo": { "bgcolor": "white", "showland": true, "lakecolor": "white", "landcolor": "white", "showlakes": true, "subunitcolor": "#C8D4E3" }, "font": { "color": "#2a3f5f" }, "polar": { "bgcolor": "white", "radialaxis": { "ticks": "", "gridcolor": "#EBF0F8", "linecolor": "#EBF0F8" }, "angularaxis": { "ticks": "", "gridcolor": "#EBF0F8", "linecolor": "#EBF0F8" } }, "scene": { "xaxis": { "ticks": "", "gridcolor": "#DFE8F3", "gridwidth": 2, "linecolor": "#EBF0F8", "zerolinecolor": "#EBF0F8", "showbackground": true, "backgroundcolor": "white" }, "yaxis": { "ticks": "", "gridcolor": "#DFE8F3", "gridwidth": 2, "linecolor": "#EBF0F8", "zerolinecolor": "#EBF0F8", "showbackground": true, "backgroundcolor": "white" }, "zaxis": { "ticks": "", "gridcolor": "#DFE8F3", "gridwidth": 2, "linecolor": "#EBF0F8", "zerolinecolor": "#EBF0F8", "showbackground": true, "backgroundcolor": "white" } }, "title": { "x": 0.05 }, "xaxis": { "ticks": "", "gridcolor": "#EBF0F8", "linecolor": "#EBF0F8", "automargin": true, "zerolinecolor": "#EBF0F8", "zerolinewidth": 2 }, "yaxis": { "ticks": "", "gridcolor": "#EBF0F8", "linecolor": "#EBF0F8", "automargin": true, "zerolinecolor": "#EBF0F8", "zerolinewidth": 2 }, "ternary": { "aaxis": { "ticks": "", "gridcolor": "#DFE8F3", "linecolor": "#A2B1C6" }, "baxis": { "ticks": "", "gridcolor": "#DFE8F3", "linecolor": "#A2B1C6" }, "caxis": { "ticks": "", "gridcolor": "#DFE8F3", "linecolor": "#A2B1C6" }, "bgcolor": "white" }, "colorway": [ "#636efa", "#EF553B", "#00cc96", "#ab63fa", "#19d3f3", "#e763fa", "#fecb52", "#ffa15a", "#ff6692", "#b6e880" ], "hovermode": "closest", "colorscale": { "diverging": [ [ 0, "#8e0152" ], [ 0.1, "#c51b7d" ], [ 0.2, "#de77ae" ], [ 0.3, "#f1b6da" ], [ 0.4, "#fde0ef" ], [ 0.5, "#f7f7f7" ], [ 0.6, "#e6f5d0" ], [ 0.7, "#b8e186" ], [ 0.8, "#7fbc41" ], [ 0.9, "#4d9221" ], [ 1, "#276419" ] ], "sequential": [ [ 0, "#0508b8" ], [ 0.0893854748603352, "#1910d8" ], [ 0.1787709497206704, "#3c19f0" ], [ 0.2681564245810056, "#6b1cfb" ], [ 0.3575418994413408, "#981cfd" ], [ 0.44692737430167595, "#bf1cfd" ], [ 0.5363128491620112, "#dd2bfd" ], [ 0.6256983240223464, "#f246fe" ], [ 0.7150837988826816, "#fc67fd" ], [ 0.8044692737430168, "#fe88fc" ], [ 0.8938547486033519, "#fea5fd" ], [ 0.9832402234636871, "#febefe" ], [ 1, "#fec3fe" ] ], "sequentialminus": [ [ 0, "#0508b8" ], [ 0.0893854748603352, "#1910d8" ], [ 0.1787709497206704, "#3c19f0" ], [ 0.2681564245810056, "#6b1cfb" ], [ 0.3575418994413408, "#981cfd" ], [ 0.44692737430167595, "#bf1cfd" ], [ 0.5363128491620112, "#dd2bfd" ], [ 0.6256983240223464, "#f246fe" ], [ 0.7150837988826816, "#fc67fd" ], [ 0.8044692737430168, "#fe88fc" ], [ 0.8938547486033519, "#fea5fd" ], [ 0.9832402234636871, "#febefe" ], [ 1, "#fec3fe" ] ] }, "plot_bgcolor": "white", "paper_bgcolor": "white", "shapedefaults": { "line": { "width": 0 }, "opacity": 0.4, "fillcolor": "#506784" }, "annotationdefaults": { "arrowhead": 0, "arrowcolor": "#506784", "arrowwidth": 1 } }, "themeRef": "PLOTLY_WHITE" }, "showlegend": false } }, "height": null, "width": null, "user": { "profile_url": "https://chart-studio.plotly.com/~jordan.81", "avatar_url": "https://storage.googleapis.com/plotly-prod-profiles/73.jpg", "background_url": "https://storage.googleapis.com/plotly-prod-profiles/bg-6.jpg", "bio": "", "nickname": "", "website": "", "stream_tokens": null, "feature_set_id": null, "csrf_token": null, "date_joined": "2024-03-31 21:05:54", "mapbox_access_tokens": null, "has_password": null, "username": "jordan.81", "email": null, "is_active": null, "readonly": null, "is_dash_creator": null, "dash_created_count": null, "is_chart_creator": null, "charts_created_count": null } }, { "creation_time": "2024-03-31T21:18:34.313367Z", "comments": { "results": [], "count": 0 }, "parented": true, "embed_url": "https://chart-studio.plotly.com/~cnmalcom/7.embed", "fid": "cnmalcom:7", "filename": "S11 Whole Sample PCA Plot", "filetype": "plot", "img_url": "https://storage.googleapis.com/plotly-prod-images/cnmalcom/7/9_810OLG062KU9LJD9BO8D0G4A92NXI2.png", "image_urls": { "default": "https://storage.googleapis.com/plotly-prod-images/cnmalcom/7/2_479D9ED7VO1QBXOY2UGLVAKZ8KS60Q.png", "block-thumb": "https://storage.googleapis.com/plotly-prod-images/cnmalcom/7/8_J14MI1RC4TDCLSEY4RFWGNFO38HWW8.png", "list-thumb": "https://storage.googleapis.com/plotly-prod-images/cnmalcom/7/9_810OLG062KU9LJD9BO8D0G4A92NXI2.png" }, "api_urls": { "files": "https://api.plotly.com/v2/files/cnmalcom:7", "plots": "https://api.plotly.com/v2/plots/cnmalcom:7", "parent": "https://api.plotly.com/v2/folders/home?user=cnmalcom" }, "owner": "cnmalcom", "parent": -1, "preview": "", "referencers": [], "references": [], "title": "", "views": 1, "web_url": "https://chart-studio.plotly.com/~cnmalcom/7/", "world_readable": true, "date_modified": "2024-04-04T00:24:28.545Z", "stars": { "results": [], "count": 0 }, "collaborators": { "results": [], "count": 0 }, "subfolder_count": null, "refresh_interval": null, "organize_view_url": "https://chart-studio.plotly.com/~cnmalcom/7/", "current_user_permission": "read", "is_theme": null, "is_template": false, "autosize": true, "caption": "", "figure": { "data": [ { "line": { "width": 55 }, "meta": { "columnNames": { "x": "data.1.x-18bba1f203", "y": "data.1.y-18bb817a348", "z": "data.1.z-18bb47e0d01e", "text": "data.1.text-18bb787f866f" } }, "mode": "markers", "type": "scatter3d", "xsrc": "cnmalcom:6:0919e3", "ysrc": "cnmalcom:6:587f1b", "zsrc": "cnmalcom:6:54214a", "frame": null, "marker": { "cmax": 3, "cmin": 1, "line": { "cmax": 3, "cmin": 1, "meta": { "columnNames": { "color": "data.1.marker.line.color-18bb66d115f4" } }, "colorbar": { "title": "", "ticklen": 2 }, "colorsrc": "cnmalcom:6:9cacf0", "showscale": false, "colorscale": [ [ "0", "rgba(72,118,255,1)" ], [ "0.0416666666666666", "rgba(118,113,234,1)" ], [ "0.0833333333333334", "rgba(146,107,214,1)" ], [ "0.125", "rgba(167,101,193,1)" ], [ "0.166666666666667", "rgba(184,95,173,1)" ], [ "0.208333333333333", "rgba(198,89,154,1)" ], [ "0.25", "rgba(209,82,134,1)" ], [ "0.291666666666667", "rgba(219,75,115,1)" ], [ "0.333333333333333", "rgba(228,67,96,1)" ], [ "0.375", "rgba(236,58,76,1)" ], [ "0.416666666666667", "rgba(243,47,56,1)" ], [ "0.458333333333333", "rgba(249,31,34,1)" ], [ "0.5", "rgba(255,0,0,1)" ], [ "0.541666666666667", "rgba(249,66,10,1)" ], [ "0.583333333333333", "rgba(242,95,22,1)" ], [ "0.625", "rgba(235,117,33,1)" ], [ "0.666666666666667", "rgba(226,136,43,1)" ], [ "0.708333333333333", "rgba(216,154,54,1)" ], [ "0.75", "rgba(205,170,64,1)" ], [ "0.791666666666667", "rgba(192,185,74,1)" ], [ "0.833333333333333", "rgba(176,200,85,1)" ], [ "0.875", "rgba(157,214,95,1)" ], [ "0.916666666666667", "rgba(132,228,106,1)" ], [ "0.958333333333333", "rgba(97,242,116,1)" ], [ "1", "rgba(0,255,127,1)" ] ] }, "meta": { "columnNames": { "size": "data.1.marker.size-18bb352651fe", "color": "data.1.marker.color-18bb7c531f36" } }, "sizesrc": "cnmalcom:6:0011b7", "colorbar": { "title": { "text": "components3$Dimension" }, "ticklen": 2 }, "colorsrc": "cnmalcom:6:108878", "sizemode": "area", "showscale": false, "colorscale": [ [ "0", "rgba(72,118,255,1)" ], [ "0.0416666666666666", "rgba(118,113,234,1)" ], [ "0.0833333333333334", "rgba(146,107,214,1)" ], [ "0.125", "rgba(167,101,193,1)" ], [ "0.166666666666667", "rgba(184,95,173,1)" ], [ "0.208333333333333", "rgba(198,89,154,1)" ], [ "0.25", "rgba(209,82,134,1)" ], [ "0.291666666666667", "rgba(219,75,115,1)" ], [ "0.333333333333333", "rgba(228,67,96,1)" ], [ "0.375", "rgba(236,58,76,1)" ], [ "0.416666666666667", "rgba(243,47,56,1)" ], [ "0.458333333333333", "rgba(249,31,34,1)" ], [ "0.5", "rgba(255,0,0,1)" ], [ "0.541666666666667", "rgba(249,66,10,1)" ], [ "0.583333333333333", "rgba(242,95,22,1)" ], [ "0.625", "rgba(235,117,33,1)" ], [ "0.666666666666667", "rgba(226,136,43,1)" ], [ "0.708333333333333", "rgba(216,154,54,1)" ], [ "0.75", "rgba(205,170,64,1)" ], [ "0.791666666666667", "rgba(192,185,74,1)" ], [ "0.833333333333333", "rgba(176,200,85,1)" ], [ "0.875", "rgba(157,214,95,1)" ], [ "0.916666666666667", "rgba(132,228,106,1)" ], [ "0.958333333333333", "rgba(97,242,116,1)" ], [ "1", "rgba(0,255,127,1)" ] ] }, "error_x": { "width": 55 }, "error_y": { "width": 55 }, "textsrc": "cnmalcom:6:28e3ff", "textfont": { "size": 55 } }, { "meta": { "columnNames": { "x": "data.2.x-18bb28f87ae8", "y": "data.2.y-18bb514d2a5b", "z": "data.2.z-18bb28013569" } }, "mode": "markers", "type": "scatter3d", "xsrc": "cnmalcom:6:9f90b9", "ysrc": "cnmalcom:6:440095", "zsrc": "cnmalcom:6:82a9cc", "frame": null, "marker": { "cmax": 3, "cmin": 1, "line": { "color": "rgba(255,127,14,1)" }, "meta": { "columnNames": { "color": "data.2.marker.color-18bb2117e610" } }, "colorbar": { "x": 1.02, "y": 1, "len": 0.5, "title": { "text": "components3$Dimension" }, "lenmode": "fraction", "ticklen": 2, "yanchor": "top" }, "colorsrc": "cnmalcom:6:319c65", "showscale": false, "colorscale": [ [ "0", "rgba(72,118,255,1)" ], [ "0.0416666666666666", "rgba(118,113,234,1)" ], [ "0.0833333333333334", "rgba(146,107,214,1)" ], [ "0.125", "rgba(167,101,193,1)" ], [ "0.166666666666667", "rgba(184,95,173,1)" ], [ "0.208333333333333", "rgba(198,89,154,1)" ], [ "0.25", "rgba(209,82,134,1)" ], [ "0.291666666666667", "rgba(219,75,115,1)" ], [ "0.333333333333333", "rgba(228,67,96,1)" ], [ "0.375", "rgba(236,58,76,1)" ], [ "0.416666666666667", "rgba(243,47,56,1)" ], [ "0.458333333333333", "rgba(249,31,34,1)" ], [ "0.5", "rgba(255,0,0,1)" ], [ "0.541666666666667", "rgba(249,66,10,1)" ], [ "0.583333333333333", "rgba(242,95,22,1)" ], [ "0.625", "rgba(235,117,33,1)" ], [ "0.666666666666667", "rgba(226,136,43,1)" ], [ "0.708333333333333", "rgba(216,154,54,1)" ], [ "0.75", "rgba(205,170,64,1)" ], [ "0.791666666666667", "rgba(192,185,74,1)" ], [ "0.833333333333333", "rgba(176,200,85,1)" ], [ "0.875", "rgba(157,214,95,1)" ], [ "0.916666666666667", "rgba(132,228,106,1)" ], [ "0.958333333333333", "rgba(97,242,116,1)" ], [ "1", "rgba(0,255,127,1)" ] ] }, "opacity": 0, "hoverinfo": "none", "showlegend": false } ], "frames": [], "layout": { "scene": { "xaxis": { "type": "linear", "title": { "text": "PC1 86.7%" } }, "yaxis": { "type": "linear", "title": { "text": "PC2 3.2%" } }, "zaxis": { "type": "linear", "title": { "text": "PC3 1.6%" } }, "bgcolor": "#FBFBF9", "aspectmode": "auto", "showlegend": false, "aspectratio": { "x": 0.9447530570233723, "y": 1.287210267294387, "z": 0.8223036138859117 } }, "title": { "text": "Total Explained Variance = 91.5%" }, "legend": { "y": 0.5, "yanchor": "top" }, "margin": { "b": 40, "l": 60, "r": 10, "t": 25 }, "autosize": true, "hovermode": "closest", "showlegend": false } }, "height": null, "width": null, "user": { "profile_url": "https://chart-studio.plotly.com/~cnmalcom", "avatar_url": "https://storage.googleapis.com/plotly-prod-profiles/98.jpg", "background_url": "https://storage.googleapis.com/plotly-prod-profiles/bg-7.jpg", "bio": "", "nickname": "", "website": "", "stream_tokens": null, "feature_set_id": null, "csrf_token": null, "date_joined": "2024-03-31 20:40:03", "mapbox_access_tokens": null, "has_password": null, "username": "cnmalcom", "email": null, "is_active": null, "readonly": null, "is_dash_creator": null, "dash_created_count": null, "is_chart_creator": null, "charts_created_count": null } }, { "creation_time": "2024-03-31T21:13:34.140026Z", "comments": { "results": [], "count": 0 }, "parented": true, "embed_url": "https://chart-studio.plotly.com/~cnmalcom/5.embed", "fid": "cnmalcom:5", "filename": "S10 Half Sample PCA Plot", "filetype": "plot", "img_url": "https://storage.googleapis.com/plotly-prod-images/cnmalcom/5/9_Z9FREM5WOCMBKFGRXUAGVLATY4JDJ1.png", "image_urls": { "default": "https://storage.googleapis.com/plotly-prod-images/cnmalcom/5/2_49ORD9NGYN3IXK8O739NPYW8UN46KH.png", "block-thumb": "https://storage.googleapis.com/plotly-prod-images/cnmalcom/5/8_K25IUDW84G4BKFFM4ZRKMZ5T6UOEC8.png", "list-thumb": "https://storage.googleapis.com/plotly-prod-images/cnmalcom/5/9_Z9FREM5WOCMBKFGRXUAGVLATY4JDJ1.png" }, "api_urls": { "files": "https://api.plotly.com/v2/files/cnmalcom:5", "plots": "https://api.plotly.com/v2/plots/cnmalcom:5", "parent": "https://api.plotly.com/v2/folders/home?user=cnmalcom" }, "owner": "cnmalcom", "parent": -1, "preview": "", "referencers": [], "references": [], "title": "", "views": 1, "web_url": "https://chart-studio.plotly.com/~cnmalcom/5/", "world_readable": true, "date_modified": "2024-04-04T00:13:40.174Z", "stars": { "results": [], "count": 0 }, "collaborators": { "results": [], "count": 0 }, "subfolder_count": null, "refresh_interval": null, "organize_view_url": "https://chart-studio.plotly.com/~cnmalcom/5/", "current_user_permission": "read", "is_theme": null, "is_template": false, "autosize": true, "caption": "", "figure": { "data": [ { "line": { "width": 55 }, "meta": { "columnNames": { "x": "data.1.x-18bb6e697ed9", "y": "data.1.y-18bb50071130", "z": "data.1.z-18bb7ff98f5b", "text": "data.1.text-18bb5932e100" } }, "mode": "markers", "type": "scatter3d", "xsrc": "cnmalcom:4:952ad4", "ysrc": "cnmalcom:4:6f798e", "zsrc": "cnmalcom:4:8b78a9", "frame": null, "marker": { "cmax": 3, "cmin": 1, "line": { "cmax": 3, "cmin": 1, "meta": { "columnNames": { "color": "data.1.marker.line.color-18bb65b2e0f1" } }, "colorbar": { "title": "", "ticklen": 2 }, "colorsrc": "cnmalcom:4:0557e5", "showscale": false, "colorscale": [ [ "0", "rgba(72,118,255,1)" ], [ "0.0416666666666666", "rgba(118,113,234,1)" ], [ "0.0833333333333334", "rgba(146,107,214,1)" ], [ "0.125", "rgba(167,101,193,1)" ], [ "0.166666666666667", "rgba(184,95,173,1)" ], [ "0.208333333333333", "rgba(198,89,154,1)" ], [ "0.25", "rgba(209,82,134,1)" ], [ "0.291666666666667", "rgba(219,75,115,1)" ], [ "0.333333333333333", "rgba(228,67,96,1)" ], [ "0.375", "rgba(236,58,76,1)" ], [ "0.416666666666667", "rgba(243,47,56,1)" ], [ "0.458333333333333", "rgba(249,31,34,1)" ], [ "0.5", "rgba(255,0,0,1)" ], [ "0.541666666666667", "rgba(249,66,10,1)" ], [ "0.583333333333333", "rgba(242,95,22,1)" ], [ "0.625", "rgba(235,117,33,1)" ], [ "0.666666666666667", "rgba(226,136,43,1)" ], [ "0.708333333333333", "rgba(216,154,54,1)" ], [ "0.75", "rgba(205,170,64,1)" ], [ "0.791666666666667", "rgba(192,185,74,1)" ], [ "0.833333333333333", "rgba(176,200,85,1)" ], [ "0.875", "rgba(157,214,95,1)" ], [ "0.916666666666667", "rgba(132,228,106,1)" ], [ "0.958333333333333", "rgba(97,242,116,1)" ], [ "1", "rgba(0,255,127,1)" ] ] }, "meta": { "columnNames": { "size": "data.1.marker.size-18bb219b7743", "color": "data.1.marker.color-18bb1b51f4c0" } }, "sizesrc": "cnmalcom:4:a53ca2", "colorbar": { "title": { "text": "components2$Dimension" }, "ticklen": 2 }, "colorsrc": "cnmalcom:4:03eaaf", "sizemode": "area", "showscale": false, "colorscale": [ [ "0", "rgba(72,118,255,1)" ], [ "0.0416666666666666", "rgba(118,113,234,1)" ], [ "0.0833333333333334", "rgba(146,107,214,1)" ], [ "0.125", "rgba(167,101,193,1)" ], [ "0.166666666666667", "rgba(184,95,173,1)" ], [ "0.208333333333333", "rgba(198,89,154,1)" ], [ "0.25", "rgba(209,82,134,1)" ], [ "0.291666666666667", "rgba(219,75,115,1)" ], [ "0.333333333333333", "rgba(228,67,96,1)" ], [ "0.375", "rgba(236,58,76,1)" ], [ "0.416666666666667", "rgba(243,47,56,1)" ], [ "0.458333333333333", "rgba(249,31,34,1)" ], [ "0.5", "rgba(255,0,0,1)" ], [ "0.541666666666667", "rgba(249,66,10,1)" ], [ "0.583333333333333", "rgba(242,95,22,1)" ], [ "0.625", "rgba(235,117,33,1)" ], [ "0.666666666666667", "rgba(226,136,43,1)" ], [ "0.708333333333333", "rgba(216,154,54,1)" ], [ "0.75", "rgba(205,170,64,1)" ], [ "0.791666666666667", "rgba(192,185,74,1)" ], [ "0.833333333333333", "rgba(176,200,85,1)" ], [ "0.875", "rgba(157,214,95,1)" ], [ "0.916666666666667", "rgba(132,228,106,1)" ], [ "0.958333333333333", "rgba(97,242,116,1)" ], [ "1", "rgba(0,255,127,1)" ] ] }, "error_x": { "width": 55 }, "error_y": { "width": 55 }, "textsrc": "cnmalcom:4:c31556", "textfont": { "size": 55 } }, { "meta": { "columnNames": { "x": "data.2.x-18bb42ce2260", "y": "data.2.y-18bb6b32eee3", "z": "data.2.z-18bb64ee1a13" } }, "mode": "markers", "type": "scatter3d", "xsrc": "cnmalcom:4:666e33", "ysrc": "cnmalcom:4:d5117c", "zsrc": "cnmalcom:4:c7a8da", "frame": null, "marker": { "cmax": 3, "cmin": 1, "line": { "color": "rgba(255,127,14,1)" }, "meta": { "columnNames": { "color": "data.2.marker.color-18bb5ce1b010" } }, "colorbar": { "x": 1.02, "y": 1, "len": 0.5, "title": { "text": "components2$Dimension" }, "lenmode": "fraction", "ticklen": 2, "yanchor": "top" }, "colorsrc": "cnmalcom:4:d724ec", "showscale": false, "colorscale": [ [ "0", "rgba(72,118,255,1)" ], [ "0.0416666666666666", "rgba(118,113,234,1)" ], [ "0.0833333333333334", "rgba(146,107,214,1)" ], [ "0.125", "rgba(167,101,193,1)" ], [ "0.166666666666667", "rgba(184,95,173,1)" ], [ "0.208333333333333", "rgba(198,89,154,1)" ], [ "0.25", "rgba(209,82,134,1)" ], [ "0.291666666666667", "rgba(219,75,115,1)" ], [ "0.333333333333333", "rgba(228,67,96,1)" ], [ "0.375", "rgba(236,58,76,1)" ], [ "0.416666666666667", "rgba(243,47,56,1)" ], [ "0.458333333333333", "rgba(249,31,34,1)" ], [ "0.5", "rgba(255,0,0,1)" ], [ "0.541666666666667", "rgba(249,66,10,1)" ], [ "0.583333333333333", "rgba(242,95,22,1)" ], [ "0.625", "rgba(235,117,33,1)" ], [ "0.666666666666667", "rgba(226,136,43,1)" ], [ "0.708333333333333", "rgba(216,154,54,1)" ], [ "0.75", "rgba(205,170,64,1)" ], [ "0.791666666666667", "rgba(192,185,74,1)" ], [ "0.833333333333333", "rgba(176,200,85,1)" ], [ "0.875", "rgba(157,214,95,1)" ], [ "0.916666666666667", "rgba(132,228,106,1)" ], [ "0.958333333333333", "rgba(97,242,116,1)" ], [ "1", "rgba(0,255,127,1)" ] ] }, "opacity": 0, "hoverinfo": "none", "showlegend": false } ], "frames": [], "layout": { "scene": { "xaxis": { "type": "linear", "title": { "text": "PC1 80.1%" } }, "yaxis": { "type": "linear", "title": { "text": "PC2 3.8%" } }, "zaxis": { "type": "linear", "title": { "text": "PC3 3.5%" } }, "bgcolor": "#FBFBF9", "aspectmode": "auto", "showlegend": false, "aspectratio": { "x": 1.0365488587209608, "y": 1.004197783708225, "z": 0.9607070189118321 } }, "title": { "text": "Total Explained Variance = 87.4%" }, "legend": { "y": 0.5, "yanchor": "top" }, "margin": { "b": 40, "l": 60, "r": 10, "t": 25 }, "autosize": true, "hovermode": "closest", "showlegend": false } }, "height": null, "width": null, "user": { "profile_url": "https://chart-studio.plotly.com/~cnmalcom", "avatar_url": "https://storage.googleapis.com/plotly-prod-profiles/98.jpg", "background_url": "https://storage.googleapis.com/plotly-prod-profiles/bg-7.jpg", "bio": "", "nickname": "", "website": "", "stream_tokens": null, "feature_set_id": null, "csrf_token": null, "date_joined": "2024-03-31 20:40:03", "mapbox_access_tokens": null, "has_password": null, "username": "cnmalcom", "email": null, "is_active": null, "readonly": null, "is_dash_creator": null, "dash_created_count": null, "is_chart_creator": null, "charts_created_count": null } } ] }
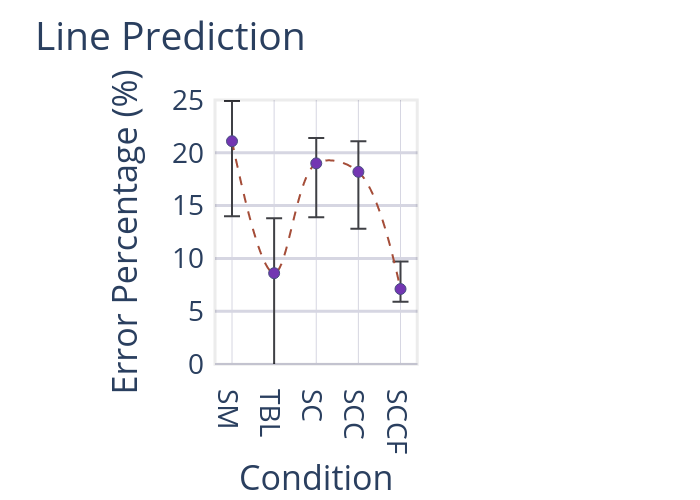