Plots List
Plots
This endpoint handles manipulation of Plotly plot files.
Reference
Authorization
Any user with or without a Plotly account may view public plots. For private plots, see authentication.
Actions
list
Listing all public plots can be done via a GET request to this endpoint.
By default, plots will be listed in order of date created. The order_by
query parameter is accepted at this endpoint. Currently, only ordering by
views is supported. It is possible to filter the plots by quality
with min_quality or max_quality as query parameter.
Example:
// GET https://api.plotly.com/v2/plots/ ---> 200

// GET https://api.plotly.com/v2/plots/?order_by=-views ---> 200

// GET https://api.plotly.com/v2/plots/?min_quality=5 ---> 200

// GET https://api.plotly.com/v2/plots/?max_quality=5 ---> 200
feed
Listing all handpicked feed plots can be done via a GET request to this endpoint. By default, plots will be listed in a random order.
Example:
// GET https://api.plotly.com/v2/plots/feed ---> 200
create
You can create new plot resources here. The only required field is 'figure'. Currently, the figure is restricted to only contain references to grid data. That is, this will fail if raw data arrays are passed in. To create and manipulate underlying grids for plots, see the grids endpoint.
Example:
// This fails because a figure field is required.
// POST https://api.plotly.com/v2/plots ---> 400 Bad Request
{}

// This fails because the figure has raw data
//POST https://api.plotly.com/v2/plots ---> 400 Bad Request
{
    "figure": {"data": [{"y": ['this', 'is', 'raw', 'data']}]}
}

// This succeeds because the figure has src keys, not raw data.
//POST https://api.plotly.com/v2/plots ---> 200 OK
{
    "figure": {"data": [{"ysrc": "sven:88:u8nd62"}]}
}
When creating a grid, you can optionally specify a source_fid to specify where a plot has come from:
- source_fid: the fid of a plot that was copied (and presumably edited) to produce this one
detail
There is a lot of meta information stored about plot files including filename, title, share_url, and content_url to name a few.
This information can only be reached with a GET to this endpoint.
Example:
// GET https://api.plotly.com/v2/plots/iheartgraphs:90
content
The contents of a plot can be downloaded via the content resource. The plot
content contains referenced grid/column data by default. If you wish to
return the raw grid/column data, the inline_data=true query must be included
in the request url. The Content-Type header will be appropriately set for the
response body.
Alternatively, you can set ?map_data=unreadable to append a mapping of
sources to data that belongs to grids which are unreadable for the
requestor. This is useful when you have read access to another users plot,
but that plot contains grid references which you don't have access to.
Examples:
// Returns referenced grid/column data
// GET https://api.plotly.com/v2/plots/iheartgraphs:90/content ---> 200 OK

// Returns full grid/column data
// GET https://api.plotly.com/v2/plots/iheartgraphs:90/content?inline_data=true ---> 200 OK

// Returns full grid/column data when requestor doesn't have permission
// to read the referenced grid.
// GET https://api.plotly.com/v2/plots/iheartgraphs:90/content?map_data=unreadable ---> 200 OK
GET /v2/plots?cursor=cD0yMDI0LTAzLTMxKzEzJTNBNDUlM0EwNS45MTQ4NzIlMkIwMCUzQTAw&format=api
{ "next": "https://api.plot.ly/v2/plots?cursor=cD0yMDI0LTAzLTMxKzEyJTNBMTglM0EwMi41MjQ4NjMlMkIwMCUzQTAw&format=api", "previous": "https://api.plot.ly/v2/plots?cursor=cj0xJnA9MjAyNC0wMy0zMSsxMyUzQTEyJTNBMTQuNzUxMDA4JTJCMDAlM0EwMA%3D%3D&format=api", "results": [ { "creation_time": "2024-03-31T13:12:14.751008Z", "comments": { "results": [], "count": 0 }, "parented": true, "embed_url": "https://chart-studio.plotly.com/~supersoulbylt/5.embed", "fid": "supersoulbylt:5", "filename": "Plot 5", "filetype": "plot", "img_url": "https://storage.googleapis.com/plotly-prod-images/supersoulbylt/5/9_3EO0XHWBZN8CTQFMRV3IC5870QKHP4.png", "image_urls": { "default": "https://storage.googleapis.com/plotly-prod-images/supersoulbylt/5/2_PU4ME6I90AOB64Y8RSCJ7BOB1PVBPX.png", "block-thumb": "https://storage.googleapis.com/plotly-prod-images/supersoulbylt/5/8_UB6BU2MJC7MI6754OWTD4NEIKN31HN.png", "list-thumb": "https://storage.googleapis.com/plotly-prod-images/supersoulbylt/5/9_3EO0XHWBZN8CTQFMRV3IC5870QKHP4.png" }, "api_urls": { "files": "https://api.plotly.com/v2/files/supersoulbylt:5", "plots": "https://api.plotly.com/v2/plots/supersoulbylt:5", "parent": "https://api.plotly.com/v2/folders/home?user=supersoulbylt" }, "owner": "supersoulbylt", "parent": -1, "preview": "", "referencers": [], "references": [], "title": "", "views": 1, "web_url": "https://chart-studio.plotly.com/~supersoulbylt/5/", "world_readable": true, "date_modified": "2024-03-31T13:12:14.761Z", "stars": { "results": [], "count": 0 }, "collaborators": { "results": [], "count": 0 }, "subfolder_count": null, "refresh_interval": null, "organize_view_url": "https://chart-studio.plotly.com/~supersoulbylt/5/", "current_user_permission": "read", "is_theme": null, "is_template": false, "autosize": true, "caption": "", "figure": { "data": [ { "meta": { "columnNames": { "labels": "A", "values": "B" } }, "mode": "markers", "type": "pie", "labelssrc": "supersoulbylt:4:ff9165", "valuessrc": "supersoulbylt:4:7ea700" } ], "frames": [], "layout": { "font": { "size": 18 }, "xaxis": { "range": [ -1, 6 ], "autorange": true }, "yaxis": { "range": [ -1, 4 ], "autorange": true }, "legend": { "x": 0.6235980290410547, "y": 1.0124610591900312, "font": { "size": 16 }, "title": { "font": { "size": 25 }, "text": "<br>" } }, "autosize": true, "template": { "data": { "bar": [ { "type": "bar", "marker": { "colorbar": { "ticks": "", "outlinewidth": 0 } } } ], "table": [ { "type": "table", "cells": { "fill": { "color": "#EBF0F8" }, "line": { "color": "white" } }, "header": { "fill": { "color": "#C8D4E3" }, "line": { "color": "white" } } } ], "carpet": [ { "type": "carpet", "aaxis": { "gridcolor": "#C8D4E3", "linecolor": "#C8D4E3", "endlinecolor": "#2a3f5f", "minorgridcolor": "#C8D4E3", "startlinecolor": "#2a3f5f" }, "baxis": { "gridcolor": "#C8D4E3", "linecolor": "#C8D4E3", "endlinecolor": "#2a3f5f", "minorgridcolor": "#C8D4E3", "startlinecolor": "#2a3f5f" } } ], "mesh3d": [ { "type": "mesh3d", "colorbar": { "ticks": "", "outlinewidth": 0 } } ], "contour": [ { "type": "contour", "colorbar": { "ticks": "", "outlinewidth": 0 }, "autocolorscale": true } ], "heatmap": [ { "type": "heatmap", "colorbar": { "ticks": "", "outlinewidth": 0 }, "autocolorscale": true } ], "scatter": [ { "type": "scatter", "marker": { "colorbar": { "ticks": "", "outlinewidth": 0 } } } ], "surface": [ { "type": "surface", "colorbar": { "ticks": "", "outlinewidth": 0 } } ], "heatmapgl": [ { "type": "heatmapgl", "colorbar": { "ticks": "", "outlinewidth": 0 } } ], "histogram": [ { "type": "histogram", "marker": { "colorbar": { "ticks": "", "outlinewidth": 0 } } } ], "parcoords": [ { "line": { "colorbar": { "ticks": "", "outlinewidth": 0 } }, "type": "parcoords" } ], "scatter3d": [ { "type": "scatter3d", "marker": { "colorbar": { "ticks": "", "outlinewidth": 0 } } } ], "scattergl": [ { "type": "scattergl", "marker": { "colorbar": { "ticks": "", "outlinewidth": 0 } } } ], "choropleth": [ { "type": "choropleth", "colorbar": { "ticks": "", "outlinewidth": 0 } } ], "scattergeo": [ { "type": "scattergeo", "marker": { "colorbar": { "ticks": "", "outlinewidth": 0 } } } ], "histogram2d": [ { "type": "histogram2d", "colorbar": { "ticks": "", "outlinewidth": 0 }, "autocolorscale": true } ], "scatterpolar": [ { "type": "scatterpolar", "marker": { "colorbar": { "ticks": "", "outlinewidth": 0 } } } ], "contourcarpet": [ { "type": "contourcarpet", "colorbar": { "ticks": "", "outlinewidth": 0 } } ], "scattercarpet": [ { "type": "scattercarpet", "marker": { "colorbar": { "ticks": "", "outlinewidth": 0 } } } ], "scattermapbox": [ { "type": "scattermapbox", "marker": { "colorbar": { "ticks": "", "outlinewidth": 0 } } } ], "scatterpolargl": [ { "type": "scatterpolargl", "marker": { "colorbar": { "ticks": "", "outlinewidth": 0 } } } ], "scatterternary": [ { "type": "scatterternary", "marker": { "colorbar": { "ticks": "", "outlinewidth": 0 } } } ], "histogram2dcontour": [ { "type": "histogram2dcontour", "colorbar": { "ticks": "", "outlinewidth": 0 }, "autocolorscale": true } ] }, "layout": { "geo": { "bgcolor": "white", "showland": true, "lakecolor": "white", "landcolor": "white", "showlakes": true, "subunitcolor": "#C8D4E3" }, "font": { "color": "#2a3f5f" }, "polar": { "bgcolor": "white", "radialaxis": { "ticks": "", "gridcolor": "#EBF0F8", "linecolor": "#EBF0F8" }, "angularaxis": { "ticks": "", "gridcolor": "#EBF0F8", "linecolor": "#EBF0F8" } }, "scene": { "xaxis": { "ticks": "", "gridcolor": "#DFE8F3", "gridwidth": 2, "linecolor": "#EBF0F8", "zerolinecolor": "#EBF0F8", "showbackground": true, "backgroundcolor": "white" }, "yaxis": { "ticks": "", "gridcolor": "#DFE8F3", "gridwidth": 2, "linecolor": "#EBF0F8", "zerolinecolor": "#EBF0F8", "showbackground": true, "backgroundcolor": "white" }, "zaxis": { "ticks": "", "gridcolor": "#DFE8F3", "gridwidth": 2, "linecolor": "#EBF0F8", "zerolinecolor": "#EBF0F8", "showbackground": true, "backgroundcolor": "white" } }, "title": { "x": 0.05 }, "xaxis": { "ticks": "", "gridcolor": "#EBF0F8", "linecolor": "#EBF0F8", "automargin": true, "zerolinecolor": "#EBF0F8", "zerolinewidth": 2 }, "yaxis": { "ticks": "", "gridcolor": "#EBF0F8", "linecolor": "#EBF0F8", "automargin": true, "zerolinecolor": "#EBF0F8", "zerolinewidth": 2 }, "ternary": { "aaxis": { "ticks": "", "gridcolor": "#DFE8F3", "linecolor": "#A2B1C6" }, "baxis": { "ticks": "", "gridcolor": "#DFE8F3", "linecolor": "#A2B1C6" }, "caxis": { "ticks": "", "gridcolor": "#DFE8F3", "linecolor": "#A2B1C6" }, "bgcolor": "white" }, "colorway": [ "#636efa", "#EF553B", "#00cc96", "#ab63fa", "#19d3f3", "#e763fa", "#fecb52", "#ffa15a", "#ff6692", "#b6e880" ], "hovermode": "closest", "colorscale": { "diverging": [ [ 0, "#8e0152" ], [ 0.1, "#c51b7d" ], [ 0.2, "#de77ae" ], [ 0.3, "#f1b6da" ], [ 0.4, "#fde0ef" ], [ 0.5, "#f7f7f7" ], [ 0.6, "#e6f5d0" ], [ 0.7, "#b8e186" ], [ 0.8, "#7fbc41" ], [ 0.9, "#4d9221" ], [ 1, "#276419" ] ], "sequential": [ [ 0, "#0508b8" ], [ 0.0893854748603352, "#1910d8" ], [ 0.1787709497206704, "#3c19f0" ], [ 0.2681564245810056, "#6b1cfb" ], [ 0.3575418994413408, "#981cfd" ], [ 0.44692737430167595, "#bf1cfd" ], [ 0.5363128491620112, "#dd2bfd" ], [ 0.6256983240223464, "#f246fe" ], [ 0.7150837988826816, "#fc67fd" ], [ 0.8044692737430168, "#fe88fc" ], [ 0.8938547486033519, "#fea5fd" ], [ 0.9832402234636871, "#febefe" ], [ 1, "#fec3fe" ] ], "sequentialminus": [ [ 0, "#0508b8" ], [ 0.0893854748603352, "#1910d8" ], [ 0.1787709497206704, "#3c19f0" ], [ 0.2681564245810056, "#6b1cfb" ], [ 0.3575418994413408, "#981cfd" ], [ 0.44692737430167595, "#bf1cfd" ], [ 0.5363128491620112, "#dd2bfd" ], [ 0.6256983240223464, "#f246fe" ], [ 0.7150837988826816, "#fc67fd" ], [ 0.8044692737430168, "#fe88fc" ], [ 0.8938547486033519, "#fea5fd" ], [ 0.9832402234636871, "#febefe" ], [ 1, "#fec3fe" ] ] }, "plot_bgcolor": "white", "paper_bgcolor": "white", "shapedefaults": { "line": { "width": 0 }, "opacity": 0.4, "fillcolor": "#506784" }, "annotationdefaults": { "arrowhead": 0, "arrowcolor": "#506784", "arrowwidth": 1 } }, "themeRef": "PLOTLY_WHITE" }, "showlegend": true } }, "height": null, "width": null, "user": { "profile_url": "https://chart-studio.plotly.com/~supersoulbylt", "avatar_url": "https://storage.googleapis.com/plotly-prod-profiles/41.jpg", "background_url": "https://storage.googleapis.com/plotly-prod-profiles/bg-5.jpg", "bio": "", "nickname": "", "website": "", "stream_tokens": null, "feature_set_id": null, "csrf_token": null, "date_joined": "2022-12-31 10:04:26", "mapbox_access_tokens": null, "has_password": null, "username": "supersoulbylt", "email": null, "is_active": null, "readonly": null, "is_dash_creator": null, "dash_created_count": null, "is_chart_creator": null, "charts_created_count": null } }, { "creation_time": "2024-03-31T12:54:23.010204Z", "comments": { "results": [], "count": 0 }, "parented": true, "embed_url": "https://chart-studio.plotly.com/~chandana021113/1.embed", "fid": "chandana021113:1", "filename": "Plot 1", "filetype": "plot", "img_url": "https://storage.googleapis.com/plotly-prod-images/chandana021113/1/9_RYCG62INMK2Y2B69PIJ8OJ3MYE9BIU.png", "image_urls": { "default": "https://storage.googleapis.com/plotly-prod-images/chandana021113/1/2_CA4P73EW46ZYRV7D5JVXO7NM04TZ8H.png", "block-thumb": "https://storage.googleapis.com/plotly-prod-images/chandana021113/1/8_ODRQ05EL89EC04IK6RJBU2MSSFJD2E.png", "list-thumb": "https://storage.googleapis.com/plotly-prod-images/chandana021113/1/9_RYCG62INMK2Y2B69PIJ8OJ3MYE9BIU.png" }, "api_urls": { "files": "https://api.plotly.com/v2/files/chandana021113:1", "plots": "https://api.plotly.com/v2/plots/chandana021113:1", "parent": "https://api.plotly.com/v2/folders/home?user=chandana021113" }, "owner": "chandana021113", "parent": -1, "preview": "", "referencers": [], "references": [], "title": "", "views": 3, "web_url": "https://chart-studio.plotly.com/~chandana021113/1/", "world_readable": true, "date_modified": "2024-03-31T12:54:23.021Z", "stars": { "results": [], "count": 0 }, "collaborators": { "results": [], "count": 0 }, "subfolder_count": null, "refresh_interval": null, "organize_view_url": "https://chart-studio.plotly.com/~chandana021113/1/", "current_user_permission": "read", "is_theme": null, "is_template": false, "autosize": true, "caption": "", "figure": { "data": [ { "meta": { "columnNames": { "x": "A", "y": "B" } }, "mode": "lines", "type": "scatter", "xsrc": "chandana021113:0:959e70", "ysrc": "chandana021113:0:cf1ad3" } ], "frames": [], "layout": { "xaxis": { "type": "category", "range": [ 0, 7 ], "title": { "text": "Time s" }, "autorange": true }, "yaxis": { "type": "linear", "range": [ -33824, 30716 ], "title": { "text": "Average mm/s^2" }, "autorange": true }, "autosize": true, "template": { "data": { "bar": [ { "type": "bar", "marker": { "colorbar": { "ticks": "", "outlinewidth": 0 } } } ], "table": [ { "type": "table", "cells": { "fill": { "color": "#EBF0F8" }, "line": { "color": "white" } }, "header": { "fill": { "color": "#C8D4E3" }, "line": { "color": "white" } } } ], "carpet": [ { "type": "carpet", "aaxis": { "gridcolor": "#C8D4E3", "linecolor": "#C8D4E3", "endlinecolor": "#2a3f5f", "minorgridcolor": "#C8D4E3", "startlinecolor": "#2a3f5f" }, "baxis": { "gridcolor": "#C8D4E3", "linecolor": "#C8D4E3", "endlinecolor": "#2a3f5f", "minorgridcolor": "#C8D4E3", "startlinecolor": "#2a3f5f" } } ], "mesh3d": [ { "type": "mesh3d", "colorbar": { "ticks": "", "outlinewidth": 0 } } ], "contour": [ { "type": "contour", "colorbar": { "ticks": "", "outlinewidth": 0 }, "autocolorscale": true } ], "heatmap": [ { "type": "heatmap", "colorbar": { "ticks": "", "outlinewidth": 0 }, "autocolorscale": true } ], "scatter": [ { "type": "scatter", "marker": { "colorbar": { "ticks": "", "outlinewidth": 0 } } } ], "surface": [ { "type": "surface", "colorbar": { "ticks": "", "outlinewidth": 0 } } ], "heatmapgl": [ { "type": "heatmapgl", "colorbar": { "ticks": "", "outlinewidth": 0 } } ], "histogram": [ { "type": "histogram", "marker": { "colorbar": { "ticks": "", "outlinewidth": 0 } } } ], "parcoords": [ { "line": { "colorbar": { "ticks": "", "outlinewidth": 0 } }, "type": "parcoords" } ], "scatter3d": [ { "type": "scatter3d", "marker": { "colorbar": { "ticks": "", "outlinewidth": 0 } } } ], "scattergl": [ { "type": "scattergl", "marker": { "colorbar": { "ticks": "", "outlinewidth": 0 } } } ], "choropleth": [ { "type": "choropleth", "colorbar": { "ticks": "", "outlinewidth": 0 } } ], "scattergeo": [ { "type": "scattergeo", "marker": { "colorbar": { "ticks": "", "outlinewidth": 0 } } } ], "histogram2d": [ { "type": "histogram2d", "colorbar": { "ticks": "", "outlinewidth": 0 }, "autocolorscale": true } ], "scatterpolar": [ { "type": "scatterpolar", "marker": { "colorbar": { "ticks": "", "outlinewidth": 0 } } } ], "contourcarpet": [ { "type": "contourcarpet", "colorbar": { "ticks": "", "outlinewidth": 0 } } ], "scattercarpet": [ { "type": "scattercarpet", "marker": { "colorbar": { "ticks": "", "outlinewidth": 0 } } } ], "scattermapbox": [ { "type": "scattermapbox", "marker": { "colorbar": { "ticks": "", "outlinewidth": 0 } } } ], "scatterpolargl": [ { "type": "scatterpolargl", "marker": { "colorbar": { "ticks": "", "outlinewidth": 0 } } } ], "scatterternary": [ { "type": "scatterternary", "marker": { "colorbar": { "ticks": "", "outlinewidth": 0 } } } ], "histogram2dcontour": [ { "type": "histogram2dcontour", "colorbar": { "ticks": "", "outlinewidth": 0 }, "autocolorscale": true } ] }, "layout": { "geo": { "bgcolor": "white", "showland": true, "lakecolor": "white", "landcolor": "white", "showlakes": true, "subunitcolor": "#C8D4E3" }, "font": { "color": "#2a3f5f" }, "polar": { "bgcolor": "white", "radialaxis": { "ticks": "", "gridcolor": "#EBF0F8", "linecolor": "#EBF0F8" }, "angularaxis": { "ticks": "", "gridcolor": "#EBF0F8", "linecolor": "#EBF0F8" } }, "scene": { "xaxis": { "ticks": "", "gridcolor": "#DFE8F3", "gridwidth": 2, "linecolor": "#EBF0F8", "zerolinecolor": "#EBF0F8", "showbackground": true, "backgroundcolor": "white" }, "yaxis": { "ticks": "", "gridcolor": "#DFE8F3", "gridwidth": 2, "linecolor": "#EBF0F8", "zerolinecolor": "#EBF0F8", "showbackground": true, "backgroundcolor": "white" }, "zaxis": { "ticks": "", "gridcolor": "#DFE8F3", "gridwidth": 2, "linecolor": "#EBF0F8", "zerolinecolor": "#EBF0F8", "showbackground": true, "backgroundcolor": "white" } }, "title": { "x": 0.05 }, "xaxis": { "ticks": "", "gridcolor": "#EBF0F8", "linecolor": "#EBF0F8", "automargin": true, "zerolinecolor": "#EBF0F8", "zerolinewidth": 2 }, "yaxis": { "ticks": "", "gridcolor": "#EBF0F8", "linecolor": "#EBF0F8", "automargin": true, "zerolinecolor": "#EBF0F8", "zerolinewidth": 2 }, "ternary": { "aaxis": { "ticks": "", "gridcolor": "#DFE8F3", "linecolor": "#A2B1C6" }, "baxis": { "ticks": "", "gridcolor": "#DFE8F3", "linecolor": "#A2B1C6" }, "caxis": { "ticks": "", "gridcolor": "#DFE8F3", "linecolor": "#A2B1C6" }, "bgcolor": "white" }, "colorway": [ "#636efa", "#EF553B", "#00cc96", "#ab63fa", "#19d3f3", "#e763fa", "#fecb52", "#ffa15a", "#ff6692", "#b6e880" ], "hovermode": "closest", "colorscale": { "diverging": [ [ 0, "#8e0152" ], [ 0.1, "#c51b7d" ], [ 0.2, "#de77ae" ], [ 0.3, "#f1b6da" ], [ 0.4, "#fde0ef" ], [ 0.5, "#f7f7f7" ], [ 0.6, "#e6f5d0" ], [ 0.7, "#b8e186" ], [ 0.8, "#7fbc41" ], [ 0.9, "#4d9221" ], [ 1, "#276419" ] ], "sequential": [ [ 0, "#0508b8" ], [ 0.0893854748603352, "#1910d8" ], [ 0.1787709497206704, "#3c19f0" ], [ 0.2681564245810056, "#6b1cfb" ], [ 0.3575418994413408, "#981cfd" ], [ 0.44692737430167595, "#bf1cfd" ], [ 0.5363128491620112, "#dd2bfd" ], [ 0.6256983240223464, "#f246fe" ], [ 0.7150837988826816, "#fc67fd" ], [ 0.8044692737430168, "#fe88fc" ], [ 0.8938547486033519, "#fea5fd" ], [ 0.9832402234636871, "#febefe" ], [ 1, "#fec3fe" ] ], "sequentialminus": [ [ 0, "#0508b8" ], [ 0.0893854748603352, "#1910d8" ], [ 0.1787709497206704, "#3c19f0" ], [ 0.2681564245810056, "#6b1cfb" ], [ 0.3575418994413408, "#981cfd" ], [ 0.44692737430167595, "#bf1cfd" ], [ 0.5363128491620112, "#dd2bfd" ], [ 0.6256983240223464, "#f246fe" ], [ 0.7150837988826816, "#fc67fd" ], [ 0.8044692737430168, "#fe88fc" ], [ 0.8938547486033519, "#fea5fd" ], [ 0.9832402234636871, "#febefe" ], [ 1, "#fec3fe" ] ] }, "plot_bgcolor": "white", "paper_bgcolor": "white", "shapedefaults": { "line": { "width": 0 }, "opacity": 0.4, "fillcolor": "#506784" }, "annotationdefaults": { "arrowhead": 0, "arrowcolor": "#506784", "arrowwidth": 1 } }, "themeRef": "PLOTLY_WHITE" } } }, "height": null, "width": null, "user": { "profile_url": "https://chart-studio.plotly.com/~chandana021113", "avatar_url": "https://storage.googleapis.com/plotly-prod-profiles/86.jpg", "background_url": "https://storage.googleapis.com/plotly-prod-profiles/bg-10.jpg", "bio": "", "nickname": "", "website": "", "stream_tokens": null, "feature_set_id": null, "csrf_token": null, "date_joined": "2024-03-31 12:53:14", "mapbox_access_tokens": null, "has_password": null, "username": "chandana021113", "email": null, "is_active": null, "readonly": null, "is_dash_creator": null, "dash_created_count": null, "is_chart_creator": null, "charts_created_count": null } }, { "creation_time": "2024-03-31T12:52:53.942341Z", "comments": { "results": [], "count": 0 }, "parented": true, "embed_url": "https://chart-studio.plotly.com/~massimo.maglio/1.embed", "fid": "massimo.maglio:1", "filename": "Plot 1", "filetype": "plot", "img_url": "https://storage.googleapis.com/plotly-prod-images/massimo.maglio/1/9_W2NTTERS8B9F7524T4FD4SCCEMEFN8.png", "image_urls": { "default": "https://storage.googleapis.com/plotly-prod-images/massimo.maglio/1/2_Q26Z0HLW6UV337GRCIOLPNC3P773ST.png", "block-thumb": "https://storage.googleapis.com/plotly-prod-images/massimo.maglio/1/8_VNJNVDBXI9C2B3YWO4NXS6U3KLU8L4.png", "list-thumb": "https://storage.googleapis.com/plotly-prod-images/massimo.maglio/1/9_W2NTTERS8B9F7524T4FD4SCCEMEFN8.png" }, "api_urls": { "files": "https://api.plotly.com/v2/files/massimo.maglio:1", "plots": "https://api.plotly.com/v2/plots/massimo.maglio:1", "parent": "https://api.plotly.com/v2/folders/home?user=massimo.maglio" }, "owner": "massimo.maglio", "parent": -1, "preview": "", "referencers": [], "references": [], "title": "", "views": 1, "web_url": "https://chart-studio.plotly.com/~massimo.maglio/1/", "world_readable": true, "date_modified": "2024-04-01T18:47:32.575Z", "stars": { "results": [], "count": 0 }, "collaborators": { "results": [], "count": 0 }, "subfolder_count": null, "refresh_interval": null, "organize_view_url": "https://chart-studio.plotly.com/~massimo.maglio/1/", "current_user_permission": "read", "is_theme": null, "is_template": false, "autosize": true, "caption": "", "figure": { "data": [ { "meta": { "columnNames": { "x": "A", "y": "B" } }, "mode": "lines", "type": "scatter", "xsrc": "massimo.maglio:0:f6a5d5", "ysrc": "massimo.maglio:0:5f770c" } ], "frames": [], "layout": { "xaxis": { "type": "linear", "range": [ 0, 2739 ], "autorange": true }, "yaxis": { "type": "linear", "range": [ -6.722222222222223, 127.72222222222223 ], "autorange": true }, "autosize": true, "template": { "data": { "bar": [ { "type": "bar", "marker": { "colorbar": { "ticks": "", "outlinewidth": 0 } } } ], "table": [ { "type": "table", "cells": { "fill": { "color": "#EBF0F8" }, "line": { "color": "white" } }, "header": { "fill": { "color": "#C8D4E3" }, "line": { "color": "white" } } } ], "carpet": [ { "type": "carpet", "aaxis": { "gridcolor": "#C8D4E3", "linecolor": "#C8D4E3", "endlinecolor": "#2a3f5f", "minorgridcolor": "#C8D4E3", "startlinecolor": "#2a3f5f" }, "baxis": { "gridcolor": "#C8D4E3", "linecolor": "#C8D4E3", "endlinecolor": "#2a3f5f", "minorgridcolor": "#C8D4E3", "startlinecolor": "#2a3f5f" } } ], "mesh3d": [ { "type": "mesh3d", "colorbar": { "ticks": "", "outlinewidth": 0 } } ], "contour": [ { "type": "contour", "colorbar": { "ticks": "", "outlinewidth": 0 }, "autocolorscale": true } ], "heatmap": [ { "type": "heatmap", "colorbar": { "ticks": "", "outlinewidth": 0 }, "autocolorscale": true } ], "scatter": [ { "type": "scatter", "marker": { "colorbar": { "ticks": "", "outlinewidth": 0 } } } ], "surface": [ { "type": "surface", "colorbar": { "ticks": "", "outlinewidth": 0 } } ], "heatmapgl": [ { "type": "heatmapgl", "colorbar": { "ticks": "", "outlinewidth": 0 } } ], "histogram": [ { "type": "histogram", "marker": { "colorbar": { "ticks": "", "outlinewidth": 0 } } } ], "parcoords": [ { "line": { "colorbar": { "ticks": "", "outlinewidth": 0 } }, "type": "parcoords" } ], "scatter3d": [ { "type": "scatter3d", "marker": { "colorbar": { "ticks": "", "outlinewidth": 0 } } } ], "scattergl": [ { "type": "scattergl", "marker": { "colorbar": { "ticks": "", "outlinewidth": 0 } } } ], "choropleth": [ { "type": "choropleth", "colorbar": { "ticks": "", "outlinewidth": 0 } } ], "scattergeo": [ { "type": "scattergeo", "marker": { "colorbar": { "ticks": "", "outlinewidth": 0 } } } ], "histogram2d": [ { "type": "histogram2d", "colorbar": { "ticks": "", "outlinewidth": 0 }, "autocolorscale": true } ], "scatterpolar": [ { "type": "scatterpolar", "marker": { "colorbar": { "ticks": "", "outlinewidth": 0 } } } ], "contourcarpet": [ { "type": "contourcarpet", "colorbar": { "ticks": "", "outlinewidth": 0 } } ], "scattercarpet": [ { "type": "scattercarpet", "marker": { "colorbar": { "ticks": "", "outlinewidth": 0 } } } ], "scattermapbox": [ { "type": "scattermapbox", "marker": { "colorbar": { "ticks": "", "outlinewidth": 0 } } } ], "scatterpolargl": [ { "type": "scatterpolargl", "marker": { "colorbar": { "ticks": "", "outlinewidth": 0 } } } ], "scatterternary": [ { "type": "scatterternary", "marker": { "colorbar": { "ticks": "", "outlinewidth": 0 } } } ], "histogram2dcontour": [ { "type": "histogram2dcontour", "colorbar": { "ticks": "", "outlinewidth": 0 }, "autocolorscale": true } ] }, "layout": { "geo": { "bgcolor": "white", "showland": true, "lakecolor": "white", "landcolor": "white", "showlakes": true, "subunitcolor": "#C8D4E3" }, "font": { "color": "#2a3f5f" }, "polar": { "bgcolor": "white", "radialaxis": { "ticks": "", "gridcolor": "#EBF0F8", "linecolor": "#EBF0F8" }, "angularaxis": { "ticks": "", "gridcolor": "#EBF0F8", "linecolor": "#EBF0F8" } }, "scene": { "xaxis": { "ticks": "", "gridcolor": "#DFE8F3", "gridwidth": 2, "linecolor": "#EBF0F8", "zerolinecolor": "#EBF0F8", "showbackground": true, "backgroundcolor": "white" }, "yaxis": { "ticks": "", "gridcolor": "#DFE8F3", "gridwidth": 2, "linecolor": "#EBF0F8", "zerolinecolor": "#EBF0F8", "showbackground": true, "backgroundcolor": "white" }, "zaxis": { "ticks": "", "gridcolor": "#DFE8F3", "gridwidth": 2, "linecolor": "#EBF0F8", "zerolinecolor": "#EBF0F8", "showbackground": true, "backgroundcolor": "white" } }, "title": { "x": 0.05 }, "xaxis": { "ticks": "", "gridcolor": "#EBF0F8", "linecolor": "#EBF0F8", "automargin": true, "zerolinecolor": "#EBF0F8", "zerolinewidth": 2 }, "yaxis": { "ticks": "", "gridcolor": "#EBF0F8", "linecolor": "#EBF0F8", "automargin": true, "zerolinecolor": "#EBF0F8", "zerolinewidth": 2 }, "ternary": { "aaxis": { "ticks": "", "gridcolor": "#DFE8F3", "linecolor": "#A2B1C6" }, "baxis": { "ticks": "", "gridcolor": "#DFE8F3", "linecolor": "#A2B1C6" }, "caxis": { "ticks": "", "gridcolor": "#DFE8F3", "linecolor": "#A2B1C6" }, "bgcolor": "white" }, "colorway": [ "#636efa", "#EF553B", "#00cc96", "#ab63fa", "#19d3f3", "#e763fa", "#fecb52", "#ffa15a", "#ff6692", "#b6e880" ], "hovermode": "closest", "colorscale": { "diverging": [ [ 0, "#8e0152" ], [ 0.1, "#c51b7d" ], [ 0.2, "#de77ae" ], [ 0.3, "#f1b6da" ], [ 0.4, "#fde0ef" ], [ 0.5, "#f7f7f7" ], [ 0.6, "#e6f5d0" ], [ 0.7, "#b8e186" ], [ 0.8, "#7fbc41" ], [ 0.9, "#4d9221" ], [ 1, "#276419" ] ], "sequential": [ [ 0, "#0508b8" ], [ 0.0893854748603352, "#1910d8" ], [ 0.1787709497206704, "#3c19f0" ], [ 0.2681564245810056, "#6b1cfb" ], [ 0.3575418994413408, "#981cfd" ], [ 0.44692737430167595, "#bf1cfd" ], [ 0.5363128491620112, "#dd2bfd" ], [ 0.6256983240223464, "#f246fe" ], [ 0.7150837988826816, "#fc67fd" ], [ 0.8044692737430168, "#fe88fc" ], [ 0.8938547486033519, "#fea5fd" ], [ 0.9832402234636871, "#febefe" ], [ 1, "#fec3fe" ] ], "sequentialminus": [ [ 0, "#0508b8" ], [ 0.0893854748603352, "#1910d8" ], [ 0.1787709497206704, "#3c19f0" ], [ 0.2681564245810056, "#6b1cfb" ], [ 0.3575418994413408, "#981cfd" ], [ 0.44692737430167595, "#bf1cfd" ], [ 0.5363128491620112, "#dd2bfd" ], [ 0.6256983240223464, "#f246fe" ], [ 0.7150837988826816, "#fc67fd" ], [ 0.8044692737430168, "#fe88fc" ], [ 0.8938547486033519, "#fea5fd" ], [ 0.9832402234636871, "#febefe" ], [ 1, "#fec3fe" ] ] }, "plot_bgcolor": "white", "paper_bgcolor": "white", "shapedefaults": { "line": { "width": 0 }, "opacity": 0.4, "fillcolor": "#506784" }, "annotationdefaults": { "arrowhead": 0, "arrowcolor": "#506784", "arrowwidth": 1 } }, "themeRef": "PLOTLY_WHITE" } } }, "height": null, "width": null, "user": { "profile_url": "https://chart-studio.plotly.com/~massimo.maglio", "avatar_url": "https://storage.googleapis.com/plotly-prod-profiles/96.jpg", "background_url": "https://storage.googleapis.com/plotly-prod-profiles/bg-8.jpg", "bio": "", "nickname": "", "website": "", "stream_tokens": null, "feature_set_id": null, "csrf_token": null, "date_joined": "2024-03-31 12:52:36", "mapbox_access_tokens": null, "has_password": null, "username": "massimo.maglio", "email": null, "is_active": null, "readonly": null, "is_dash_creator": null, "dash_created_count": null, "is_chart_creator": null, "charts_created_count": null } }, { "creation_time": "2024-03-31T12:45:10.280173Z", "comments": { "results": [], "count": 0 }, "parented": true, "embed_url": "https://chart-studio.plotly.com/~polcitech/4.embed", "fid": "polcitech:4", "filename": "scattergl_plot", "filetype": "plot", "img_url": "https://storage.googleapis.com/plotly-prod-images/polcitech/4/9_2KHNH69KBOE6DIWQT10VW1RZXAYM78.png", "image_urls": { "default": "https://storage.googleapis.com/plotly-prod-images/polcitech/4/2_A6BD53QWP3TJDOVZAXRWYHH0N3G00V.png", "block-thumb": "https://storage.googleapis.com/plotly-prod-images/polcitech/4/8_S55Y15PRWFB0K0P3X4UVRT1KFOUXCI.png", "list-thumb": "https://storage.googleapis.com/plotly-prod-images/polcitech/4/9_2KHNH69KBOE6DIWQT10VW1RZXAYM78.png" }, "api_urls": { "files": "https://api.plotly.com/v2/files/polcitech:4", "plots": "https://api.plotly.com/v2/plots/polcitech:4", "parent": "https://api.plotly.com/v2/folders/home?user=polcitech" }, "owner": "polcitech", "parent": -1, "preview": "", "referencers": [], "references": [], "title": "", "views": 1, "web_url": "https://chart-studio.plotly.com/~polcitech/4/", "world_readable": true, "date_modified": "2024-03-31T12:47:17.389Z", "stars": { "results": [], "count": 0 }, "collaborators": { "results": [], "count": 0 }, "subfolder_count": null, "refresh_interval": null, "organize_view_url": "https://chart-studio.plotly.com/~polcitech/4/", "current_user_permission": "read", "is_theme": null, "is_template": null, "autosize": true, "caption": "", "figure": { "data": [ { "mode": "markers", "type": "scattergl", "xsrc": "polcitech:6:6d822d", "ysrc": "polcitech:6:281dab", "marker": { "color": "blue" } } ], "layout": { "template": { "data": { "bar": [ { "type": "bar", "marker": { "line": { "color": "#E5ECF6", "width": 0.5 }, "pattern": { "size": 10, "fillmode": "overlay", "solidity": 0.2 } }, "error_x": { "color": "#2a3f5f" }, "error_y": { "color": "#2a3f5f" } } ], "pie": [ { "type": "pie", "automargin": true } ], "table": [ { "type": "table", "cells": { "fill": { "color": "#EBF0F8" }, "line": { "color": "white" } }, "header": { "fill": { "color": "#C8D4E3" }, "line": { "color": "white" } } } ], "carpet": [ { "type": "carpet", "aaxis": { "gridcolor": "white", "linecolor": "white", "endlinecolor": "#2a3f5f", "minorgridcolor": "white", "startlinecolor": "#2a3f5f" }, "baxis": { "gridcolor": "white", "linecolor": "white", "endlinecolor": "#2a3f5f", "minorgridcolor": "white", "startlinecolor": "#2a3f5f" } } ], "mesh3d": [ { "type": "mesh3d", "colorbar": { "ticks": "", "outlinewidth": 0 } } ], "contour": [ { "type": "contour", "colorbar": { "ticks": "", "outlinewidth": 0 }, "colorscale": [ [ 0.0, "#0d0887" ], [ 0.1111111111111111, "#46039f" ], [ 0.2222222222222222, "#7201a8" ], [ 0.3333333333333333, "#9c179e" ], [ 0.4444444444444444, "#bd3786" ], [ 0.5555555555555556, "#d8576b" ], [ 0.6666666666666666, "#ed7953" ], [ 0.7777777777777778, "#fb9f3a" ], [ 0.8888888888888888, "#fdca26" ], [ 1.0, "#f0f921" ] ] } ], "heatmap": [ { "type": "heatmap", "colorbar": { "ticks": "", "outlinewidth": 0 }, "colorscale": [ [ 0.0, "#0d0887" ], [ 0.1111111111111111, "#46039f" ], [ 0.2222222222222222, "#7201a8" ], [ 0.3333333333333333, "#9c179e" ], [ 0.4444444444444444, "#bd3786" ], [ 0.5555555555555556, "#d8576b" ], [ 0.6666666666666666, "#ed7953" ], [ 0.7777777777777778, "#fb9f3a" ], [ 0.8888888888888888, "#fdca26" ], [ 1.0, "#f0f921" ] ] } ], "scatter": [ { "type": "scatter", "fillpattern": { "size": 10, "fillmode": "overlay", "solidity": 0.2 } } ], "surface": [ { "type": "surface", "colorbar": { "ticks": "", "outlinewidth": 0 }, "colorscale": [ [ 0.0, "#0d0887" ], [ 0.1111111111111111, "#46039f" ], [ 0.2222222222222222, "#7201a8" ], [ 0.3333333333333333, "#9c179e" ], [ 0.4444444444444444, "#bd3786" ], [ 0.5555555555555556, "#d8576b" ], [ 0.6666666666666666, "#ed7953" ], [ 0.7777777777777778, "#fb9f3a" ], [ 0.8888888888888888, "#fdca26" ], [ 1.0, "#f0f921" ] ] } ], "barpolar": [ { "type": "barpolar", "marker": { "line": { "color": "#E5ECF6", "width": 0.5 }, "pattern": { "size": 10, "fillmode": "overlay", "solidity": 0.2 } } } ], "heatmapgl": [ { "type": "heatmapgl", "colorbar": { "ticks": "", "outlinewidth": 0 }, "colorscale": [ [ 0.0, "#0d0887" ], [ 0.1111111111111111, "#46039f" ], [ 0.2222222222222222, "#7201a8" ], [ 0.3333333333333333, "#9c179e" ], [ 0.4444444444444444, "#bd3786" ], [ 0.5555555555555556, "#d8576b" ], [ 0.6666666666666666, "#ed7953" ], [ 0.7777777777777778, "#fb9f3a" ], [ 0.8888888888888888, "#fdca26" ], [ 1.0, "#f0f921" ] ] } ], "histogram": [ { "type": "histogram", "marker": { "pattern": { "size": 10, "fillmode": "overlay", "solidity": 0.2 } } } ], "parcoords": [ { "line": { "colorbar": { "ticks": "", "outlinewidth": 0 } }, "type": "parcoords" } ], "scatter3d": [ { "line": { "colorbar": { "ticks": "", "outlinewidth": 0 } }, "type": "scatter3d", "marker": { "colorbar": { "ticks": "", "outlinewidth": 0 } } } ], "scattergl": [ { "type": "scattergl", "marker": { "colorbar": { "ticks": "", "outlinewidth": 0 } } } ], "choropleth": [ { "type": "choropleth", "colorbar": { "ticks": "", "outlinewidth": 0 } } ], "scattergeo": [ { "type": "scattergeo", "marker": { "colorbar": { "ticks": "", "outlinewidth": 0 } } } ], "histogram2d": [ { "type": "histogram2d", "colorbar": { "ticks": "", "outlinewidth": 0 }, "colorscale": [ [ 0.0, "#0d0887" ], [ 0.1111111111111111, "#46039f" ], [ 0.2222222222222222, "#7201a8" ], [ 0.3333333333333333, "#9c179e" ], [ 0.4444444444444444, "#bd3786" ], [ 0.5555555555555556, "#d8576b" ], [ 0.6666666666666666, "#ed7953" ], [ 0.7777777777777778, "#fb9f3a" ], [ 0.8888888888888888, "#fdca26" ], [ 1.0, "#f0f921" ] ] } ], "scatterpolar": [ { "type": "scatterpolar", "marker": { "colorbar": { "ticks": "", "outlinewidth": 0 } } } ], "contourcarpet": [ { "type": "contourcarpet", "colorbar": { "ticks": "", "outlinewidth": 0 } } ], "scattercarpet": [ { "type": "scattercarpet", "marker": { "colorbar": { "ticks": "", "outlinewidth": 0 } } } ], "scattermapbox": [ { "type": "scattermapbox", "marker": { "colorbar": { "ticks": "", "outlinewidth": 0 } } } ], "scatterpolargl": [ { "type": "scatterpolargl", "marker": { "colorbar": { "ticks": "", "outlinewidth": 0 } } } ], "scatterternary": [ { "type": "scatterternary", "marker": { "colorbar": { "ticks": "", "outlinewidth": 0 } } } ], "histogram2dcontour": [ { "type": "histogram2dcontour", "colorbar": { "ticks": "", "outlinewidth": 0 }, "colorscale": [ [ 0.0, "#0d0887" ], [ 0.1111111111111111, "#46039f" ], [ 0.2222222222222222, "#7201a8" ], [ 0.3333333333333333, "#9c179e" ], [ 0.4444444444444444, "#bd3786" ], [ 0.5555555555555556, "#d8576b" ], [ 0.6666666666666666, "#ed7953" ], [ 0.7777777777777778, "#fb9f3a" ], [ 0.8888888888888888, "#fdca26" ], [ 1.0, "#f0f921" ] ] } ] }, "layout": { "geo": { "bgcolor": "white", "showland": true, "lakecolor": "white", "landcolor": "#E5ECF6", "showlakes": true, "subunitcolor": "white" }, "font": { "color": "#2a3f5f" }, "polar": { "bgcolor": "#E5ECF6", "radialaxis": { "ticks": "", "gridcolor": "white", "linecolor": "white" }, "angularaxis": { "ticks": "", "gridcolor": "white", "linecolor": "white" } }, "scene": { "xaxis": { "ticks": "", "gridcolor": "white", "gridwidth": 2, "linecolor": "white", "zerolinecolor": "white", "showbackground": true, "backgroundcolor": "#E5ECF6" }, "yaxis": { "ticks": "", "gridcolor": "white", "gridwidth": 2, "linecolor": "white", "zerolinecolor": "white", "showbackground": true, "backgroundcolor": "#E5ECF6" }, "zaxis": { "ticks": "", "gridcolor": "white", "gridwidth": 2, "linecolor": "white", "zerolinecolor": "white", "showbackground": true, "backgroundcolor": "#E5ECF6" } }, "title": { "x": 0.05 }, "xaxis": { "ticks": "", "title": { "standoff": 15 }, "gridcolor": "white", "linecolor": "white", "automargin": true, "zerolinecolor": "white", "zerolinewidth": 2 }, "yaxis": { "ticks": "", "title": { "standoff": 15 }, "gridcolor": "white", "linecolor": "white", "automargin": true, "zerolinecolor": "white", "zerolinewidth": 2 }, "mapbox": { "style": "light" }, "ternary": { "aaxis": { "ticks": "", "gridcolor": "white", "linecolor": "white" }, "baxis": { "ticks": "", "gridcolor": "white", "linecolor": "white" }, "caxis": { "ticks": "", "gridcolor": "white", "linecolor": "white" }, "bgcolor": "#E5ECF6" }, "colorway": [ "#636efa", "#EF553B", "#00cc96", "#ab63fa", "#FFA15A", "#19d3f3", "#FF6692", "#B6E880", "#FF97FF", "#FECB52" ], "coloraxis": { "colorbar": { "ticks": "", "outlinewidth": 0 } }, "hovermode": "closest", "colorscale": { "diverging": [ [ 0, "#8e0152" ], [ 0.1, "#c51b7d" ], [ 0.2, "#de77ae" ], [ 0.3, "#f1b6da" ], [ 0.4, "#fde0ef" ], [ 0.5, "#f7f7f7" ], [ 0.6, "#e6f5d0" ], [ 0.7, "#b8e186" ], [ 0.8, "#7fbc41" ], [ 0.9, "#4d9221" ], [ 1, "#276419" ] ], "sequential": [ [ 0.0, "#0d0887" ], [ 0.1111111111111111, "#46039f" ], [ 0.2222222222222222, "#7201a8" ], [ 0.3333333333333333, "#9c179e" ], [ 0.4444444444444444, "#bd3786" ], [ 0.5555555555555556, "#d8576b" ], [ 0.6666666666666666, "#ed7953" ], [ 0.7777777777777778, "#fb9f3a" ], [ 0.8888888888888888, "#fdca26" ], [ 1.0, "#f0f921" ] ], "sequentialminus": [ [ 0.0, "#0d0887" ], [ 0.1111111111111111, "#46039f" ], [ 0.2222222222222222, "#7201a8" ], [ 0.3333333333333333, "#9c179e" ], [ 0.4444444444444444, "#bd3786" ], [ 0.5555555555555556, "#d8576b" ], [ 0.6666666666666666, "#ed7953" ], [ 0.7777777777777778, "#fb9f3a" ], [ 0.8888888888888888, "#fdca26" ], [ 1.0, "#f0f921" ] ] }, "hoverlabel": { "align": "left" }, "plot_bgcolor": "#E5ECF6", "paper_bgcolor": "white", "shapedefaults": { "line": { "color": "#2a3f5f" } }, "autotypenumbers": "strict", "annotationdefaults": { "arrowhead": 0, "arrowcolor": "#2a3f5f", "arrowwidth": 1 } } } } }, "height": null, "width": null, "user": { "profile_url": "https://chart-studio.plotly.com/~polcitech", "avatar_url": "https://storage.googleapis.com/plotly-prod-profiles/57.jpg", "background_url": "https://storage.googleapis.com/plotly-prod-profiles/bg-13.jpg", "bio": "", "nickname": "", "website": "", "stream_tokens": null, "feature_set_id": null, "csrf_token": null, "date_joined": "2024-03-31 12:00:57", "mapbox_access_tokens": null, "has_password": null, "username": "polcitech", "email": null, "is_active": null, "readonly": null, "is_dash_creator": null, "dash_created_count": null, "is_chart_creator": null, "charts_created_count": null } }, { "creation_time": "2024-03-31T12:39:38.708326Z", "comments": { "results": [], "count": 0 }, "parented": true, "embed_url": "https://chart-studio.plotly.com/~skpurnell/1.embed", "fid": "skpurnell:1", "filename": "B.J. Hill Chart", "filetype": "plot", "img_url": "https://storage.googleapis.com/plotly-prod-images/skpurnell/1/9_BKG99SJMMTQV1RR9CC8C8PYJ8EHEO7.png", "image_urls": { "default": "https://storage.googleapis.com/plotly-prod-images/skpurnell/1/2_NN6D8Z53OS3WYO3DFOQPRXRW96EP4H.png", "block-thumb": "https://storage.googleapis.com/plotly-prod-images/skpurnell/1/8_RGP3P7W6NMN2WDQ5B8C5I26OF6ZEME.png", "list-thumb": "https://storage.googleapis.com/plotly-prod-images/skpurnell/1/9_BKG99SJMMTQV1RR9CC8C8PYJ8EHEO7.png" }, "api_urls": { "files": "https://api.plotly.com/v2/files/skpurnell:1", "plots": "https://api.plotly.com/v2/plots/skpurnell:1", "parent": "https://api.plotly.com/v2/folders/home?user=skpurnell" }, "owner": "skpurnell", "parent": -1, "preview": "", "referencers": [], "references": [], "title": "", "views": 59, "web_url": "https://chart-studio.plotly.com/~skpurnell/1/", "world_readable": true, "date_modified": "2024-03-31T14:29:49.453Z", "stars": { "results": [], "count": 0 }, "collaborators": { "results": [], "count": 0 }, "subfolder_count": null, "refresh_interval": null, "organize_view_url": "https://chart-studio.plotly.com/~skpurnell/1/", "current_user_permission": "read", "is_theme": null, "is_template": null, "autosize": true, "caption": "", "figure": { "data": [ { "mode": "markers", "type": "scatter", "xsrc": "skpurnell:0:ebbf8d", "ysrc": "skpurnell:0:ec2b05", "frame": null, "xaxis": "x", "yaxis": "y", "marker": { "line": { "width": 1.8897637795275593, "colorsrc": "skpurnell:0:7f5dfe" }, "symbol": "circle", "opacity": 0.7, "sizesrc": "skpurnell:0:e123e6", "colorsrc": "skpurnell:0:32fbae", "autocolorscale": false }, "hoveron": "points", "textsrc": "skpurnell:0:86e709", "hoverinfo": "text", "showlegend": false }, { "line": { "dash": "solid", "color": "rgba(0,0,0,1)", "width": 3.7795275590551185 }, "mode": "lines", "text": "yintercept: 0", "type": "scatter", "xsrc": "skpurnell:0:9d6b8b", "ysrc": "skpurnell:0:f7d9b5", "frame": null, "xaxis": "x", "yaxis": "y", "hoveron": "points", "hoverinfo": "text", "showlegend": false }, { "mode": "markers", "name": "99_e905d6cc8c5386568b27236c2de49788", "type": "scatter", "xsrc": "skpurnell:0:a84188", "ysrc": "skpurnell:0:150f43", "frame": null, "xaxis": "x", "yaxis": "y", "marker": { "colorbar": { "len": 0.5, "title": "Weighted Score", "bgcolor": "rgba(255,255,255,1)", "ticklen": 2, "tickfont": { "size": 11.68949771689498, "color": "rgba(0,0,0,1)", "family": "" }, "tickmode": "array", "thickness": 23.039999999999996, "titlefont": { "size": 14.611872146118724, "color": "rgba(0,0,0,1)", "family": "" }, "bordercolor": "transparent", "borderwidth": 1.8897637795275593, "ticktextsrc": "skpurnell:0:94ee96", "tickvalssrc": "skpurnell:0:e418a8" }, "colorsrc": "skpurnell:0:65ffb0", "colorscale": [ [ 0, "#FF0000" ], [ 0.003344481605351178, "#FF0700" ], [ 0.006688963210702356, "#FE0E00" ], [ 0.010033444816053533, "#FE1300" ], [ 0.01337792642140466, "#FE1700" ], [ 0.016722408026755838, "#FE1B00" ], [ 0.020066889632107014, "#FD1E00" ], [ 0.023411371237458192, "#FD2100" ], [ 0.02675585284280937, "#FD2400" ], [ 0.030100334448160546, "#FD2700" ], [ 0.033444816053511725, "#FC2900" ], [ 0.03678929765886285, "#FC2B00" ], [ 0.04013377926421403, "#FC2D00" ], [ 0.04347826086956521, "#FC3000" ], [ 0.046822742474916385, "#FB3100" ], [ 0.05016722408026756, "#FB3300" ], [ 0.05351170568561874, "#FB3500" ], [ 0.05685618729096992, "#FA3700" ], [ 0.060200668896321044, "#FA3900" ], [ 0.06354515050167223, "#FA3A00" ], [ 0.0668896321070234, "#FA3C00" ], [ 0.07023411371237458, "#F93D00" ], [ 0.07357859531772576, "#F93F00" ], [ 0.07692307692307693, "#F94100" ], [ 0.08026755852842808, "#F84200" ], [ 0.08361204013377926, "#F84300" ], [ 0.08695652173913042, "#F84500" ], [ 0.09030100334448159, "#F84600" ], [ 0.09364548494983277, "#F74700" ], [ 0.09698996655518395, "#F74900" ], [ 0.10033444816053512, "#F74A00" ], [ 0.1036789297658863, "#F64B00" ], [ 0.10702341137123746, "#F64D00" ], [ 0.11036789297658861, "#F64E00" ], [ 0.11371237458193978, "#F54F00" ], [ 0.11705685618729096, "#F55000" ], [ 0.12040133779264214, "#F55100" ], [ 0.12374581939799331, "#F55300" ], [ 0.12709030100334448, "#F45400" ], [ 0.13043478260869565, "#F45500" ], [ 0.13377926421404682, "#F45600" ], [ 0.13712374581939799, "#F35700" ], [ 0.14046822742474915, "#F35800" ], [ 0.14381270903010032, "#F35900" ], [ 0.14715719063545152, "#F25A00" ], [ 0.15050167224080266, "#F25B00" ], [ 0.15384615384615383, "#F25C00" ], [ 0.15719063545150502, "#F15D00" ], [ 0.16053511705685616, "#F15E00" ], [ 0.16387959866220733, "#F15F00" ], [ 0.16722408026755853, "#F16000" ], [ 0.1705685618729097, "#F06100" ], [ 0.17391304347826084, "#F06200" ], [ 0.17725752508361203, "#F06300" ], [ 0.1806020066889632, "#EF6400" ], [ 0.18394648829431437, "#EF6500" ], [ 0.18729096989966554, "#EF6600" ], [ 0.1906354515050167, "#EE6700" ], [ 0.1939799331103679, "#EE6800" ], [ 0.19732441471571904, "#EE6900" ], [ 0.2006688963210702, "#ED6A00" ], [ 0.2040133779264214, "#ED6B00" ], [ 0.20735785953177258, "#ED6C00" ], [ 0.21070234113712372, "#EC6C00" ], [ 0.2140468227424749, "#EC6D00" ], [ 0.21739130434782608, "#EC6E00" ], [ 0.22073578595317722, "#EB6F00" ], [ 0.22408026755852842, "#EB7000" ], [ 0.22742474916387959, "#EB7100" ], [ 0.23076923076923075, "#EA7200" ], [ 0.23411371237458192, "#EA7300" ], [ 0.2374581939799331, "#EA7300" ], [ 0.2408026755852843, "#E97400" ], [ 0.24414715719063546, "#E97500" ], [ 0.24749163879598662, "#E87600" ], [ 0.25083612040133774, "#E87700" ], [ 0.25418060200668896, "#E87800" ], [ 0.25752508361204013, "#E77800" ], [ 0.2608695652173913, "#E77900" ], [ 0.26421404682274247, "#E77A00" ], [ 0.26755852842809363, "#E67B00" ], [ 0.2709030100334448, "#E67C00" ], [ 0.27424749163879597, "#E67C00" ], [ 0.27759197324414714, "#E57D00" ], [ 0.2809364548494983, "#E57E00" ], [ 0.2842809364548495, "#E47F00" ], [ 0.28762541806020064, "#E47F00" ], [ 0.2909698996655518, "#E48000" ], [ 0.29431438127090304, "#E38100" ], [ 0.29765886287625415, "#E38200" ], [ 0.3010033444816053, "#E38200" ], [ 0.3043478260869565, "#E28300" ], [ 0.30769230769230765, "#E28400" ], [ 0.3110367892976589, "#E18500" ], [ 0.31438127090301005, "#E18500" ], [ 0.3177257525083612, "#E18600" ], [ 0.3210702341137123, "#E08700" ], [ 0.3244147157190635, "#E08800" ], [ 0.32775919732441466, "#E08800" ], [ 0.3311036789297659, "#DF8900" ], [ 0.33444816053511706, "#DF8A00" ], [ 0.3377926421404682, "#DE8B00" ], [ 0.3411371237458194, "#DE8B00" ], [ 0.34448160535117056, "#DE8C00" ], [ 0.3478260869565217, "#DD8D00" ], [ 0.3511705685618729, "#DD8D00" ], [ 0.35451505016722407, "#DC8E00" ], [ 0.35785953177257523, "#DC8F00" ], [ 0.3612040133779264, "#DC9000" ], [ 0.36454849498327757, "#DB9000" ], [ 0.36789297658862874, "#DB9100" ], [ 0.3712374581939799, "#DA9200" ], [ 0.3745819397993311, "#DA9200" ], [ 0.37792642140468224, "#D99300" ], [ 0.3812709030100334, "#D99400" ], [ 0.3846153846153846, "#D99400" ], [ 0.3879598662207358, "#D89500" ], [ 0.391304347826087, "#D89600" ], [ 0.3946488294314381, "#D79700" ], [ 0.39799331103678925, "#D79700" ], [ 0.4013377926421404, "#D69800" ], [ 0.4046822742474916, "#D69900" ], [ 0.4080267558528428, "#D69900" ], [ 0.411371237458194, "#D59A00" ], [ 0.41471571906354515, "#D59B00" ], [ 0.41806020066889626, "#D49B00" ], [ 0.42140468227424743, "#D49C00" ], [ 0.42474916387959866, "#D39D00" ], [ 0.4280936454849498, "#D39D00" ], [ 0.431438127090301, "#D29E00" ], [ 0.43478260869565216, "#D29F00" ], [ 0.43812709030100333, "#D19F00" ], [ 0.44147157190635444, "#D1A000" ], [ 0.44481605351170567, "#D1A000" ], [ 0.44816053511705684, "#D0A100" ], [ 0.451505016722408, "#D0A200" ], [ 0.45484949832775917, "#CFA200" ], [ 0.45819397993311034, "#CFA300" ], [ 0.4615384615384615, "#CEA400" ], [ 0.4648829431438127, "#CEA400" ], [ 0.46822742474916385, "#CDA500" ], [ 0.47157190635451507, "#CDA600" ], [ 0.4749163879598662, "#CCA600" ], [ 0.4782608695652173, "#CCA700" ], [ 0.4816053511705686, "#CBA800" ], [ 0.4849498327759197, "#CBA800" ], [ 0.4882943143812709, "#CAA900" ], [ 0.491638795986622, "#CAA900" ], [ 0.49498327759197325, "#C9AA00" ], [ 0.49832775919732436, "#C9AB00" ], [ 0.5016722408026755, "#C8AB00" ], [ 0.5050167224080268, "#C8AC00" ], [ 0.5083612040133779, "#C7AD00" ], [ 0.5117056856187291, "#C7AD00" ], [ 0.5150501672240803, "#C6AE00" ], [ 0.5183946488294314, "#C6AE00" ], [ 0.5217391304347826, "#C5AF00" ], [ 0.5250836120401337, "#C5B000" ], [ 0.5284280936454849, "#C4B000" ], [ 0.5317725752508361, "#C4B100" ], [ 0.5351170568561873, "#C3B100" ], [ 0.5384615384615384, "#C2B200" ], [ 0.5418060200668896, "#C2B300" ], [ 0.5451505016722408, "#C1B300" ], [ 0.5484949832775919, "#C1B400" ], [ 0.5518394648829431, "#C0B500" ], [ 0.5551839464882943, "#C0B500" ], [ 0.5585284280936454, "#BFB600" ], [ 0.5618729096989966, "#BFB600" ], [ 0.5652173913043478, "#BEB700" ], [ 0.568561872909699, "#BDB800" ], [ 0.5719063545150501, "#BDB800" ], [ 0.5752508361204013, "#BCB900" ], [ 0.5785953177257525, "#BCB900" ], [ 0.5819397993311036, "#BBBA00" ], [ 0.5852842809364548, "#BBBB00" ], [ 0.5886287625418061, "#BABB00" ], [ 0.5919732441471571, "#B9BC00" ], [ 0.5953177257525083, "#B9BC00" ], [ 0.5986622073578595, "#B8BD00" ], [ 0.6020066889632106, "#B8BE00" ], [ 0.6053511705685619, "#B7BE00" ], [ 0.608695652173913, "#B6BF00" ], [ 0.6120401337792643, "#B6BF00" ], [ 0.6153846153846153, "#B5C000" ], [ 0.6187290969899665, "#B4C000" ], [ 0.6220735785953178, "#B4C100" ], [ 0.6254180602006688, "#B3C200" ], [ 0.6287625418060201, "#B3C200" ], [ 0.6321070234113711, "#B2C300" ], [ 0.6354515050167224, "#B1C300" ], [ 0.6387959866220735, "#B1C400" ], [ 0.6421404682274247, "#B0C500" ], [ 0.6454849498327759, "#AFC500" ], [ 0.648829431438127, "#AFC600" ], [ 0.6521739130434783, "#AEC600" ], [ 0.6555183946488293, "#ADC700" ], [ 0.6588628762541806, "#ADC700" ], [ 0.6622073578595318, "#ACC800" ], [ 0.6655518394648829, "#ABC900" ], [ 0.6688963210702341, "#AAC900" ], [ 0.6722408026755852, "#AACA00" ], [ 0.6755852842809364, "#A9CA00" ], [ 0.6789297658862876, "#A8CB00" ], [ 0.6822742474916388, "#A8CB00" ], [ 0.68561872909699, "#A7CC00" ], [ 0.6889632107023411, "#A6CD00" ], [ 0.6923076923076923, "#A5CD00" ], [ 0.6956521739130433, "#A5CE00" ], [ 0.6989966555183946, "#A4CE00" ], [ 0.7023411371237458, "#A3CF00" ], [ 0.705685618729097, "#A2CF00" ], [ 0.7090301003344481, "#A2D000" ], [ 0.7123745819397993, "#A1D100" ], [ 0.7157190635451505, "#A0D100" ], [ 0.7190635451505016, "#9FD200" ], [ 0.7224080267558528, "#9FD200" ], [ 0.725752508361204, "#9ED300" ], [ 0.7290969899665551, "#9DD300" ], [ 0.7324414715719063, "#9CD400" ], [ 0.7357859531772575, "#9BD400" ], [ 0.7391304347826086, "#9BD500" ], [ 0.7424749163879598, "#9AD600" ], [ 0.745819397993311, "#99D600" ], [ 0.7491638795986622, "#98D700" ], [ 0.7525083612040133, "#97D700" ], [ 0.7558528428093645, "#96D800" ], [ 0.7591973244147158, "#95D800" ], [ 0.7625418060200668, "#94D900" ], [ 0.765886287625418, "#94D900" ], [ 0.7692307692307693, "#93DA00" ], [ 0.7725752508361203, "#92DB00" ], [ 0.7759197324414716, "#91DB00" ], [ 0.7792642140468228, "#90DC00" ], [ 0.7826086956521741, "#8FDC00" ], [ 0.785953177257525, "#8EDD00" ], [ 0.7892976588628763, "#8DDD00" ], [ 0.7926421404682275, "#8CDE00" ], [ 0.7959866220735785, "#8BDE00" ], [ 0.7993311036789298, "#8ADF00" ], [ 0.802675585284281, "#89DF00" ], [ 0.8060200668896322, "#88E000" ], [ 0.8093645484949832, "#87E100" ], [ 0.8127090301003345, "#86E100" ], [ 0.8160535117056857, "#85E200" ], [ 0.8193979933110367, "#84E200" ], [ 0.822742474916388, "#83E300" ], [ 0.8260869565217391, "#82E300" ], [ 0.8294314381270904, "#81E400" ], [ 0.8327759197324415, "#80E400" ], [ 0.8361204013377926, "#7EE500" ], [ 0.8394648829431439, "#7DE500" ], [ 0.8428093645484949, "#7CE600" ], [ 0.8461538461538461, "#7BE700" ], [ 0.8494983277591973, "#7AE700" ], [ 0.8528428093645486, "#79E800" ], [ 0.8561872909698997, "#77E800" ], [ 0.8595317725752508, "#76E900" ], [ 0.8628762541806021, "#75E900" ], [ 0.8662207357859532, "#74EA00" ], [ 0.8695652173913043, "#72EA00" ], [ 0.8729096989966556, "#71EB00" ], [ 0.8762541806020068, "#70EB00" ], [ 0.8795986622073578, "#6EEC00" ], [ 0.882943143812709, "#6DEC00" ], [ 0.8862876254180603, "#6BED00" ], [ 0.8896321070234113, "#6AEE00" ], [ 0.8929765886287625, "#68EE00" ], [ 0.8963210702341138, "#67EF00" ], [ 0.899665551839465, "#65EF00" ], [ 0.903010033444816, "#64F000" ], [ 0.9063545150501673, "#62F000" ], [ 0.9096989966555185, "#61F100" ], [ 0.9130434782608695, "#5FF100" ], [ 0.9163879598662207, "#5DF200" ], [ 0.919732441471572, "#5BF200" ], [ 0.9230769230769231, "#5AF300" ], [ 0.9264214046822742, "#58F300" ], [ 0.9297658862876255, "#56F400" ], [ 0.9331103678929764, "#54F400" ], [ 0.9364548494983277, "#52F500" ], [ 0.9397993311036789, "#50F600" ], [ 0.9431438127090301, "#4EF600" ], [ 0.9464882943143812, "#4BF700" ], [ 0.9498327759197324, "#49F700" ], [ 0.9531772575250836, "#47F800" ], [ 0.9565217391304346, "#44F800" ], [ 0.9598662207357859, "#41F900" ], [ 0.9632107023411371, "#3FF900" ], [ 0.9665551839464883, "#3CFA00" ], [ 0.9698996655518394, "#38FA00" ], [ 0.9732441471571905, "#35FB00" ], [ 0.9765886287625418, "#32FB00" ], [ 0.9799331103678929, "#2EFC00" ], [ 0.983277591973244, "#29FC00" ], [ 0.9866220735785953, "#24FD00" ], [ 0.9899665551839465, "#1FFD00" ], [ 0.9933110367892976, "#18FE00" ], [ 0.9966555183946487, "#0EFE00" ], [ 1, "#00FF00" ] ] }, "opacity": 0, "hoverinfo": "skip", "showlegend": false } ], "layout": { "font": { "size": 14.611872146118724, "color": "rgba(0,0,0,1)", "family": "" }, "title": { "x": 0, "font": { "size": 17.53424657534247, "color": "rgba(0,0,0,1)", "family": "" }, "text": "Weighted Score Contribution for B.J. Hill", "xref": "paper" }, "xaxis": { "type": "linear", "range": [ 0.4, 14.6 ], "ticks": "outside", "title": { "font": { "size": 14.611872146118724, "color": "rgba(0,0,0,1)", "family": "" }, "text": "Weighted Metrics" }, "anchor": "y", "domain": [ 0, 1 ], "nticks": null, "ticklen": 3.652968036529681, "showgrid": true, "showline": false, "tickfont": { "size": 11.68949771689498, "color": "rgba(77,77,77,1)", "family": "" }, "tickmode": "array", "ticktext": [ "Weighted Interceptions", "Weighted Interception Touchdowns", "Weighted Pass Deflections", "Weighted Forced Fumbles", "Weighted Fumble Recoveries", "Weighted Fumble Touchdowns", "Weighted Sacks", "Weighted Solo Tackles", "Weighted Assists", "Weighted TFL", "Weighted QBHits", "Weighted Hurries", "Weighted QB Knockdowns", "Weighted QB Pressures" ], "tickvals": [ 1, 2, 3, 3.9999999999999996, 5, 6, 7, 7.999999999999999, 9, 10, 11, 12, 13, 14 ], "zeroline": false, "autorange": false, "gridcolor": "rgba(255,255,255,1)", "gridwidth": 0.66417600664176, "linecolor": null, "linewidth": 0, "tickangle": -45, "tickcolor": "rgba(51,51,51,1)", "tickwidth": 0.66417600664176, "automargin": true, "hoverformat": ".2f", "categoryarray": [ "Weighted Interceptions", "Weighted Interception Touchdowns", "Weighted Pass Deflections", "Weighted Forced Fumbles", "Weighted Fumble Recoveries", "Weighted Fumble Touchdowns", "Weighted Sacks", "Weighted Solo Tackles", "Weighted Assists", "Weighted TFL", "Weighted QBHits", "Weighted Hurries", "Weighted QB Knockdowns", "Weighted QB Pressures" ], "categoryorder": "array", "showticklabels": true }, "yaxis": { "type": "linear", "range": [ -0.09440000000000001, 0.2004 ], "ticks": "outside", "title": { "font": { "size": 14.611872146118724, "color": "rgba(0,0,0,1)", "family": "" }, "text": "Weighted Score" }, "anchor": "x", "domain": [ 0, 1 ], "nticks": null, "ticklen": 3.652968036529681, "showgrid": true, "showline": false, "tickfont": { "size": 11.68949771689498, "color": "rgba(77,77,77,1)", "family": "" }, "tickmode": "array", "ticktext": [ "0.0", "0.1", "0.2" ], "tickvals": [ 0, 0.09999999999999998, 0.20000000000000004 ], "zeroline": false, "autorange": false, "gridcolor": "rgba(255,255,255,1)", "gridwidth": 0.66417600664176, "linecolor": null, "linewidth": 0, "tickangle": 0, "tickcolor": "rgba(51,51,51,1)", "tickwidth": 0.66417600664176, "automargin": true, "hoverformat": ".2f", "categoryarray": [ "0.0", "0.1", "0.2" ], "categoryorder": "array", "showticklabels": true }, "legend": { "font": { "size": 11.68949771689498, "color": "rgba(0,0,0,1)", "family": "" }, "title": { "font": { "size": 14.611872146118724, "color": "rgba(0,0,0,1)", "family": "" }, "text": "Weighted Score" }, "bgcolor": "rgba(255,255,255,1)", "bordercolor": "transparent", "borderwidth": 1.8897637795275593 }, "margin": { "b": 122.52493090424137, "l": 43.105022831050235, "r": 7.305936073059362, "t": 39.35062286651594 }, "shapes": [ { "x0": 0, "x1": 1, "y0": 0, "y1": 1, "line": { "color": null, "width": 0, "linetype": [] }, "type": "rect", "xref": "paper", "yref": "paper", "fillcolor": null } ], "barmode": "relative", "hovermode": "closest", "showlegend": false, "plot_bgcolor": "rgba(235,235,235,1)", "paper_bgcolor": "rgba(255,255,255,1)" } }, "height": null, "width": null, "user": { "profile_url": "https://chart-studio.plotly.com/~skpurnell", "avatar_url": "https://storage.googleapis.com/plotly-prod-profiles/95.jpg", "background_url": "https://storage.googleapis.com/plotly-prod-profiles/bg-14.jpg", "bio": "", "nickname": "", "website": "", "stream_tokens": null, "feature_set_id": null, "csrf_token": null, "date_joined": "2024-03-31 12:34:35", "mapbox_access_tokens": null, "has_password": null, "username": "skpurnell", "email": null, "is_active": null, "readonly": null, "is_dash_creator": null, "dash_created_count": null, "is_chart_creator": null, "charts_created_count": null } }, { "creation_time": "2024-03-31T12:31:12.094863Z", "comments": { "results": [], "count": 0 }, "parented": true, "embed_url": "https://chart-studio.plotly.com/~polcitech/1.embed", "fid": "polcitech:1", "filename": "test", "filetype": "plot", "img_url": "https://storage.googleapis.com/plotly-prod-images/polcitech/1/9_EFZ9GFWTK3AP0JXRCRBMINSVQP3WKU.png", "image_urls": { "default": "https://storage.googleapis.com/plotly-prod-images/polcitech/1/2_ANIG7CBH1C4HLZKN6YRFJAXYSJT9UP.png", "block-thumb": "https://storage.googleapis.com/plotly-prod-images/polcitech/1/8_3TDM1P97T1XX10C8A4SU46CM1RES1Y.png", "list-thumb": "https://storage.googleapis.com/plotly-prod-images/polcitech/1/9_EFZ9GFWTK3AP0JXRCRBMINSVQP3WKU.png" }, "api_urls": { "files": "https://api.plotly.com/v2/files/polcitech:1", "plots": "https://api.plotly.com/v2/plots/polcitech:1", "parent": "https://api.plotly.com/v2/folders/home?user=polcitech" }, "owner": "polcitech", "parent": -1, "preview": "", "referencers": [], "references": [], "title": "", "views": 7, "web_url": "https://chart-studio.plotly.com/~polcitech/1/", "world_readable": true, "date_modified": "2024-03-31T12:37:44.308Z", "stars": { "results": [], "count": 0 }, "collaborators": { "results": [], "count": 0 }, "subfolder_count": null, "refresh_interval": null, "organize_view_url": "https://chart-studio.plotly.com/~polcitech/1/", "current_user_permission": "read", "is_theme": null, "is_template": null, "autosize": true, "caption": "", "figure": { "data": [ { "mode": "markers", "type": "scatter", "xsrc": "polcitech:2:e43354", "ysrc": "polcitech:2:444961", "marker": { "color": "blue" } } ], "layout": { "width": 400, "height": 300, "template": { "data": { "bar": [ { "type": "bar", "marker": { "line": { "color": "#E5ECF6", "width": 0.5 }, "pattern": { "size": 10, "fillmode": "overlay", "solidity": 0.2 } }, "error_x": { "color": "#2a3f5f" }, "error_y": { "color": "#2a3f5f" } } ], "pie": [ { "type": "pie", "automargin": true } ], "table": [ { "type": "table", "cells": { "fill": { "color": "#EBF0F8" }, "line": { "color": "white" } }, "header": { "fill": { "color": "#C8D4E3" }, "line": { "color": "white" } } } ], "carpet": [ { "type": "carpet", "aaxis": { "gridcolor": "white", "linecolor": "white", "endlinecolor": "#2a3f5f", "minorgridcolor": "white", "startlinecolor": "#2a3f5f" }, "baxis": { "gridcolor": "white", "linecolor": "white", "endlinecolor": "#2a3f5f", "minorgridcolor": "white", "startlinecolor": "#2a3f5f" } } ], "mesh3d": [ { "type": "mesh3d", "colorbar": { "ticks": "", "outlinewidth": 0 } } ], "contour": [ { "type": "contour", "colorbar": { "ticks": "", "outlinewidth": 0 }, "colorscale": [ [ 0.0, "#0d0887" ], [ 0.1111111111111111, "#46039f" ], [ 0.2222222222222222, "#7201a8" ], [ 0.3333333333333333, "#9c179e" ], [ 0.4444444444444444, "#bd3786" ], [ 0.5555555555555556, "#d8576b" ], [ 0.6666666666666666, "#ed7953" ], [ 0.7777777777777778, "#fb9f3a" ], [ 0.8888888888888888, "#fdca26" ], [ 1.0, "#f0f921" ] ] } ], "heatmap": [ { "type": "heatmap", "colorbar": { "ticks": "", "outlinewidth": 0 }, "colorscale": [ [ 0.0, "#0d0887" ], [ 0.1111111111111111, "#46039f" ], [ 0.2222222222222222, "#7201a8" ], [ 0.3333333333333333, "#9c179e" ], [ 0.4444444444444444, "#bd3786" ], [ 0.5555555555555556, "#d8576b" ], [ 0.6666666666666666, "#ed7953" ], [ 0.7777777777777778, "#fb9f3a" ], [ 0.8888888888888888, "#fdca26" ], [ 1.0, "#f0f921" ] ] } ], "scatter": [ { "type": "scatter", "fillpattern": { "size": 10, "fillmode": "overlay", "solidity": 0.2 } } ], "surface": [ { "type": "surface", "colorbar": { "ticks": "", "outlinewidth": 0 }, "colorscale": [ [ 0.0, "#0d0887" ], [ 0.1111111111111111, "#46039f" ], [ 0.2222222222222222, "#7201a8" ], [ 0.3333333333333333, "#9c179e" ], [ 0.4444444444444444, "#bd3786" ], [ 0.5555555555555556, "#d8576b" ], [ 0.6666666666666666, "#ed7953" ], [ 0.7777777777777778, "#fb9f3a" ], [ 0.8888888888888888, "#fdca26" ], [ 1.0, "#f0f921" ] ] } ], "barpolar": [ { "type": "barpolar", "marker": { "line": { "color": "#E5ECF6", "width": 0.5 }, "pattern": { "size": 10, "fillmode": "overlay", "solidity": 0.2 } } } ], "heatmapgl": [ { "type": "heatmapgl", "colorbar": { "ticks": "", "outlinewidth": 0 }, "colorscale": [ [ 0.0, "#0d0887" ], [ 0.1111111111111111, "#46039f" ], [ 0.2222222222222222, "#7201a8" ], [ 0.3333333333333333, "#9c179e" ], [ 0.4444444444444444, "#bd3786" ], [ 0.5555555555555556, "#d8576b" ], [ 0.6666666666666666, "#ed7953" ], [ 0.7777777777777778, "#fb9f3a" ], [ 0.8888888888888888, "#fdca26" ], [ 1.0, "#f0f921" ] ] } ], "histogram": [ { "type": "histogram", "marker": { "pattern": { "size": 10, "fillmode": "overlay", "solidity": 0.2 } } } ], "parcoords": [ { "line": { "colorbar": { "ticks": "", "outlinewidth": 0 } }, "type": "parcoords" } ], "scatter3d": [ { "line": { "colorbar": { "ticks": "", "outlinewidth": 0 } }, "type": "scatter3d", "marker": { "colorbar": { "ticks": "", "outlinewidth": 0 } } } ], "scattergl": [ { "type": "scattergl", "marker": { "colorbar": { "ticks": "", "outlinewidth": 0 } } } ], "choropleth": [ { "type": "choropleth", "colorbar": { "ticks": "", "outlinewidth": 0 } } ], "scattergeo": [ { "type": "scattergeo", "marker": { "colorbar": { "ticks": "", "outlinewidth": 0 } } } ], "histogram2d": [ { "type": "histogram2d", "colorbar": { "ticks": "", "outlinewidth": 0 }, "colorscale": [ [ 0.0, "#0d0887" ], [ 0.1111111111111111, "#46039f" ], [ 0.2222222222222222, "#7201a8" ], [ 0.3333333333333333, "#9c179e" ], [ 0.4444444444444444, "#bd3786" ], [ 0.5555555555555556, "#d8576b" ], [ 0.6666666666666666, "#ed7953" ], [ 0.7777777777777778, "#fb9f3a" ], [ 0.8888888888888888, "#fdca26" ], [ 1.0, "#f0f921" ] ] } ], "scatterpolar": [ { "type": "scatterpolar", "marker": { "colorbar": { "ticks": "", "outlinewidth": 0 } } } ], "contourcarpet": [ { "type": "contourcarpet", "colorbar": { "ticks": "", "outlinewidth": 0 } } ], "scattercarpet": [ { "type": "scattercarpet", "marker": { "colorbar": { "ticks": "", "outlinewidth": 0 } } } ], "scattermapbox": [ { "type": "scattermapbox", "marker": { "colorbar": { "ticks": "", "outlinewidth": 0 } } } ], "scatterpolargl": [ { "type": "scatterpolargl", "marker": { "colorbar": { "ticks": "", "outlinewidth": 0 } } } ], "scatterternary": [ { "type": "scatterternary", "marker": { "colorbar": { "ticks": "", "outlinewidth": 0 } } } ], "histogram2dcontour": [ { "type": "histogram2dcontour", "colorbar": { "ticks": "", "outlinewidth": 0 }, "colorscale": [ [ 0.0, "#0d0887" ], [ 0.1111111111111111, "#46039f" ], [ 0.2222222222222222, "#7201a8" ], [ 0.3333333333333333, "#9c179e" ], [ 0.4444444444444444, "#bd3786" ], [ 0.5555555555555556, "#d8576b" ], [ 0.6666666666666666, "#ed7953" ], [ 0.7777777777777778, "#fb9f3a" ], [ 0.8888888888888888, "#fdca26" ], [ 1.0, "#f0f921" ] ] } ] }, "layout": { "geo": { "bgcolor": "white", "showland": true, "lakecolor": "white", "landcolor": "#E5ECF6", "showlakes": true, "subunitcolor": "white" }, "font": { "color": "#2a3f5f" }, "polar": { "bgcolor": "#E5ECF6", "radialaxis": { "ticks": "", "gridcolor": "white", "linecolor": "white" }, "angularaxis": { "ticks": "", "gridcolor": "white", "linecolor": "white" } }, "scene": { "xaxis": { "ticks": "", "gridcolor": "white", "gridwidth": 2, "linecolor": "white", "zerolinecolor": "white", "showbackground": true, "backgroundcolor": "#E5ECF6" }, "yaxis": { "ticks": "", "gridcolor": "white", "gridwidth": 2, "linecolor": "white", "zerolinecolor": "white", "showbackground": true, "backgroundcolor": "#E5ECF6" }, "zaxis": { "ticks": "", "gridcolor": "white", "gridwidth": 2, "linecolor": "white", "zerolinecolor": "white", "showbackground": true, "backgroundcolor": "#E5ECF6" } }, "title": { "x": 0.05 }, "xaxis": { "ticks": "", "title": { "standoff": 15 }, "gridcolor": "white", "linecolor": "white", "automargin": true, "zerolinecolor": "white", "zerolinewidth": 2 }, "yaxis": { "ticks": "", "title": { "standoff": 15 }, "gridcolor": "white", "linecolor": "white", "automargin": true, "zerolinecolor": "white", "zerolinewidth": 2 }, "mapbox": { "style": "light" }, "ternary": { "aaxis": { "ticks": "", "gridcolor": "white", "linecolor": "white" }, "baxis": { "ticks": "", "gridcolor": "white", "linecolor": "white" }, "caxis": { "ticks": "", "gridcolor": "white", "linecolor": "white" }, "bgcolor": "#E5ECF6" }, "colorway": [ "#636efa", "#EF553B", "#00cc96", "#ab63fa", "#FFA15A", "#19d3f3", "#FF6692", "#B6E880", "#FF97FF", "#FECB52" ], "coloraxis": { "colorbar": { "ticks": "", "outlinewidth": 0 } }, "hovermode": "closest", "colorscale": { "diverging": [ [ 0, "#8e0152" ], [ 0.1, "#c51b7d" ], [ 0.2, "#de77ae" ], [ 0.3, "#f1b6da" ], [ 0.4, "#fde0ef" ], [ 0.5, "#f7f7f7" ], [ 0.6, "#e6f5d0" ], [ 0.7, "#b8e186" ], [ 0.8, "#7fbc41" ], [ 0.9, "#4d9221" ], [ 1, "#276419" ] ], "sequential": [ [ 0.0, "#0d0887" ], [ 0.1111111111111111, "#46039f" ], [ 0.2222222222222222, "#7201a8" ], [ 0.3333333333333333, "#9c179e" ], [ 0.4444444444444444, "#bd3786" ], [ 0.5555555555555556, "#d8576b" ], [ 0.6666666666666666, "#ed7953" ], [ 0.7777777777777778, "#fb9f3a" ], [ 0.8888888888888888, "#fdca26" ], [ 1.0, "#f0f921" ] ], "sequentialminus": [ [ 0.0, "#0d0887" ], [ 0.1111111111111111, "#46039f" ], [ 0.2222222222222222, "#7201a8" ], [ 0.3333333333333333, "#9c179e" ], [ 0.4444444444444444, "#bd3786" ], [ 0.5555555555555556, "#d8576b" ], [ 0.6666666666666666, "#ed7953" ], [ 0.7777777777777778, "#fb9f3a" ], [ 0.8888888888888888, "#fdca26" ], [ 1.0, "#f0f921" ] ] }, "hoverlabel": { "align": "left" }, "plot_bgcolor": "#E5ECF6", "paper_bgcolor": "white", "shapedefaults": { "line": { "color": "#2a3f5f" } }, "autotypenumbers": "strict", "annotationdefaults": { "arrowhead": 0, "arrowcolor": "#2a3f5f", "arrowwidth": 1 } } } } }, "height": 300, "width": 400, "user": { "profile_url": "https://chart-studio.plotly.com/~polcitech", "avatar_url": "https://storage.googleapis.com/plotly-prod-profiles/57.jpg", "background_url": "https://storage.googleapis.com/plotly-prod-profiles/bg-13.jpg", "bio": "", "nickname": "", "website": "", "stream_tokens": null, "feature_set_id": null, "csrf_token": null, "date_joined": "2024-03-31 12:00:57", "mapbox_access_tokens": null, "has_password": null, "username": "polcitech", "email": null, "is_active": null, "readonly": null, "is_dash_creator": null, "dash_created_count": null, "is_chart_creator": null, "charts_created_count": null } }, { "creation_time": "2024-03-31T12:23:49.599606Z", "comments": { "results": [], "count": 0 }, "parented": true, "embed_url": "https://chart-studio.plotly.com/~kbsnom/13.embed", "fid": "kbsnom:13", "filename": "Plotly Playground 2024-03-31 21:23:45", "filetype": "plot", "img_url": "https://storage.googleapis.com/plotly-prod-images/kbsnom/13/9_TZYIMMXS85GCNLD6KAX2SEOVW6X4GV.png", "image_urls": { "default": "https://storage.googleapis.com/plotly-prod-images/kbsnom/13/2_AVHYPS0SNFM7WBNWSXL102MUNXC6UT.png", "block-thumb": "https://storage.googleapis.com/plotly-prod-images/kbsnom/13/8_3D28JJMY06AONW47KLYKYH5FGR0SYH.png", "list-thumb": "https://storage.googleapis.com/plotly-prod-images/kbsnom/13/9_TZYIMMXS85GCNLD6KAX2SEOVW6X4GV.png" }, "api_urls": { "files": "https://api.plotly.com/v2/files/kbsnom:13", "plots": "https://api.plotly.com/v2/plots/kbsnom:13", "parent": "https://api.plotly.com/v2/folders/home?user=kbsnom" }, "owner": "kbsnom", "parent": -1, "preview": "", "referencers": [], "references": [], "title": "", "views": 2, "web_url": "https://chart-studio.plotly.com/~kbsnom/13/", "world_readable": true, "date_modified": "2024-03-31T12:23:49.611Z", "stars": { "results": [], "count": 0 }, "collaborators": { "results": [], "count": 0 }, "subfolder_count": null, "refresh_interval": null, "organize_view_url": "https://chart-studio.plotly.com/~kbsnom/13/", "current_user_permission": "read", "is_theme": null, "is_template": null, "autosize": true, "caption": "", "figure": { "data": [ { "line": { "dash": "solid", "color": "rgba(55, 128, 191, 1.0)", "shape": "linear", "width": 1.3 }, "mode": "lines", "name": "BOLL(close,20)", "text": "", "type": "scatter", "xsrc": "kbsnom:12:b1e85a", "ysrc": "kbsnom:12:afe3b7", "yaxis": "y2", "showlegend": true, "legendgroup": "BOLL(close,20)" }, { "line": { "dash": "solid", "color": "rgba(55, 128, 191, 0.8999999999999999)", "shape": "linear", "width": 1.3 }, "mode": "lines", "name": "UPPER(close,20)", "text": "", "type": "scatter", "xsrc": "kbsnom:12:1cf9cd", "ysrc": "kbsnom:12:d058e2", "yaxis": "y2", "showlegend": false, "legendgroup": "BOLL(close,20)" }, { "fill": "tonexty", "line": { "dash": "solid", "color": "rgba(55, 128, 191, 0.7999999999999998)", "shape": "linear", "width": 1.3 }, "mode": "lines", "name": "LOWER(close,20)", "text": "", "type": "scatter", "xsrc": "kbsnom:12:4e42a8", "ysrc": "kbsnom:12:681bc0", "yaxis": "y2", "fillcolor": "rgba(55, 128, 191, 0.1)", "showlegend": false, "legendgroup": "BOLL(close,20)" }, { "name": "GS", "type": "candlestick", "xsrc": "kbsnom:12:c3428e", "yaxis": "y2", "lowsrc": "kbsnom:12:336176", "highsrc": "kbsnom:12:5913a7", "opensrc": "kbsnom:12:bfa603", "closesrc": "kbsnom:12:44a8e1", "decreasing": { "line": { "color": "#808080" } }, "increasing": { "line": { "color": "#17BECF" } }, "showlegend": true } ], "layout": { "title": { "font": { "color": "#4D5663" }, "text": "First Quant Figure" }, "xaxis": { "title": { "font": { "color": "#4D5663" }, "text": "" }, "anchor": "y2", "showgrid": true, "tickfont": { "color": "#4D5663" }, "gridcolor": "#E1E5ED", "rangeslider": { "visible": false }, "rangeselector": { "x": 0, "y": 0.9, "font": { "size": 13 }, "bgcolor": "rgba(150, 200, 250, 1)", "buttons": [ { "step": "month", "count": 1, "label": "1m", "stepmode": "backward" }, { "step": "year", "count": 1, "label": "1y", "stepmode": "backward" } ], "visible": false }, "zerolinecolor": "#E1E5ED" }, "yaxis": { "title": { "font": { "color": "#4D5663" }, "text": "" }, "showgrid": true, "tickfont": { "color": "#4D5663" }, "gridcolor": "#E1E5ED", "zerolinecolor": "#E1E5ED", "showticklabels": false }, "legend": { "x": 0.3, "y": 0.95, "font": { "color": "#4D5663" }, "bgcolor": "#F5F6F9", "yanchor": "bottom", "orientation": "h" }, "margin": { "b": 30, "l": 30, "r": 30, "t": 30 }, "yaxis2": { "title": { "font": { "color": "#4D5663" }, "text": "" }, "domain": [ 0.0, 0.9 ], "showgrid": true, "tickfont": { "color": "#4D5663" }, "gridcolor": "#E1E5ED", "zerolinecolor": "#E1E5ED" }, "template": { "data": { "bar": [ { "type": "bar", "marker": { "line": { "color": "#E5ECF6", "width": 0.5 }, "pattern": { "size": 10, "fillmode": "overlay", "solidity": 0.2 } }, "error_x": { "color": "#2a3f5f" }, "error_y": { "color": "#2a3f5f" } } ], "pie": [ { "type": "pie", "automargin": true } ], "table": [ { "type": "table", "cells": { "fill": { "color": "#EBF0F8" }, "line": { "color": "white" } }, "header": { "fill": { "color": "#C8D4E3" }, "line": { "color": "white" } } } ], "carpet": [ { "type": "carpet", "aaxis": { "gridcolor": "white", "linecolor": "white", "endlinecolor": "#2a3f5f", "minorgridcolor": "white", "startlinecolor": "#2a3f5f" }, "baxis": { "gridcolor": "white", "linecolor": "white", "endlinecolor": "#2a3f5f", "minorgridcolor": "white", "startlinecolor": "#2a3f5f" } } ], "mesh3d": [ { "type": "mesh3d", "colorbar": { "ticks": "", "outlinewidth": 0 } } ], "contour": [ { "type": "contour", "colorbar": { "ticks": "", "outlinewidth": 0 }, "colorscale": [ [ 0.0, "#0d0887" ], [ 0.1111111111111111, "#46039f" ], [ 0.2222222222222222, "#7201a8" ], [ 0.3333333333333333, "#9c179e" ], [ 0.4444444444444444, "#bd3786" ], [ 0.5555555555555556, "#d8576b" ], [ 0.6666666666666666, "#ed7953" ], [ 0.7777777777777778, "#fb9f3a" ], [ 0.8888888888888888, "#fdca26" ], [ 1.0, "#f0f921" ] ] } ], "heatmap": [ { "type": "heatmap", "colorbar": { "ticks": "", "outlinewidth": 0 }, "colorscale": [ [ 0.0, "#0d0887" ], [ 0.1111111111111111, "#46039f" ], [ 0.2222222222222222, "#7201a8" ], [ 0.3333333333333333, "#9c179e" ], [ 0.4444444444444444, "#bd3786" ], [ 0.5555555555555556, "#d8576b" ], [ 0.6666666666666666, "#ed7953" ], [ 0.7777777777777778, "#fb9f3a" ], [ 0.8888888888888888, "#fdca26" ], [ 1.0, "#f0f921" ] ] } ], "scatter": [ { "type": "scatter", "fillpattern": { "size": 10, "fillmode": "overlay", "solidity": 0.2 } } ], "surface": [ { "type": "surface", "colorbar": { "ticks": "", "outlinewidth": 0 }, "colorscale": [ [ 0.0, "#0d0887" ], [ 0.1111111111111111, "#46039f" ], [ 0.2222222222222222, "#7201a8" ], [ 0.3333333333333333, "#9c179e" ], [ 0.4444444444444444, "#bd3786" ], [ 0.5555555555555556, "#d8576b" ], [ 0.6666666666666666, "#ed7953" ], [ 0.7777777777777778, "#fb9f3a" ], [ 0.8888888888888888, "#fdca26" ], [ 1.0, "#f0f921" ] ] } ], "barpolar": [ { "type": "barpolar", "marker": { "line": { "color": "#E5ECF6", "width": 0.5 }, "pattern": { "size": 10, "fillmode": "overlay", "solidity": 0.2 } } } ], "heatmapgl": [ { "type": "heatmapgl", "colorbar": { "ticks": "", "outlinewidth": 0 }, "colorscale": [ [ 0.0, "#0d0887" ], [ 0.1111111111111111, "#46039f" ], [ 0.2222222222222222, "#7201a8" ], [ 0.3333333333333333, "#9c179e" ], [ 0.4444444444444444, "#bd3786" ], [ 0.5555555555555556, "#d8576b" ], [ 0.6666666666666666, "#ed7953" ], [ 0.7777777777777778, "#fb9f3a" ], [ 0.8888888888888888, "#fdca26" ], [ 1.0, "#f0f921" ] ] } ], "histogram": [ { "type": "histogram", "marker": { "pattern": { "size": 10, "fillmode": "overlay", "solidity": 0.2 } } } ], "parcoords": [ { "line": { "colorbar": { "ticks": "", "outlinewidth": 0 } }, "type": "parcoords" } ], "scatter3d": [ { "line": { "colorbar": { "ticks": "", "outlinewidth": 0 } }, "type": "scatter3d", "marker": { "colorbar": { "ticks": "", "outlinewidth": 0 } } } ], "scattergl": [ { "type": "scattergl", "marker": { "colorbar": { "ticks": "", "outlinewidth": 0 } } } ], "choropleth": [ { "type": "choropleth", "colorbar": { "ticks": "", "outlinewidth": 0 } } ], "scattergeo": [ { "type": "scattergeo", "marker": { "colorbar": { "ticks": "", "outlinewidth": 0 } } } ], "histogram2d": [ { "type": "histogram2d", "colorbar": { "ticks": "", "outlinewidth": 0 }, "colorscale": [ [ 0.0, "#0d0887" ], [ 0.1111111111111111, "#46039f" ], [ 0.2222222222222222, "#7201a8" ], [ 0.3333333333333333, "#9c179e" ], [ 0.4444444444444444, "#bd3786" ], [ 0.5555555555555556, "#d8576b" ], [ 0.6666666666666666, "#ed7953" ], [ 0.7777777777777778, "#fb9f3a" ], [ 0.8888888888888888, "#fdca26" ], [ 1.0, "#f0f921" ] ] } ], "scatterpolar": [ { "type": "scatterpolar", "marker": { "colorbar": { "ticks": "", "outlinewidth": 0 } } } ], "contourcarpet": [ { "type": "contourcarpet", "colorbar": { "ticks": "", "outlinewidth": 0 } } ], "scattercarpet": [ { "type": "scattercarpet", "marker": { "colorbar": { "ticks": "", "outlinewidth": 0 } } } ], "scattermapbox": [ { "type": "scattermapbox", "marker": { "colorbar": { "ticks": "", "outlinewidth": 0 } } } ], "scatterpolargl": [ { "type": "scatterpolargl", "marker": { "colorbar": { "ticks": "", "outlinewidth": 0 } } } ], "scatterternary": [ { "type": "scatterternary", "marker": { "colorbar": { "ticks": "", "outlinewidth": 0 } } } ], "histogram2dcontour": [ { "type": "histogram2dcontour", "colorbar": { "ticks": "", "outlinewidth": 0 }, "colorscale": [ [ 0.0, "#0d0887" ], [ 0.1111111111111111, "#46039f" ], [ 0.2222222222222222, "#7201a8" ], [ 0.3333333333333333, "#9c179e" ], [ 0.4444444444444444, "#bd3786" ], [ 0.5555555555555556, "#d8576b" ], [ 0.6666666666666666, "#ed7953" ], [ 0.7777777777777778, "#fb9f3a" ], [ 0.8888888888888888, "#fdca26" ], [ 1.0, "#f0f921" ] ] } ] }, "layout": { "geo": { "bgcolor": "white", "showland": true, "lakecolor": "white", "landcolor": "#E5ECF6", "showlakes": true, "subunitcolor": "white" }, "font": { "color": "#2a3f5f" }, "polar": { "bgcolor": "#E5ECF6", "radialaxis": { "ticks": "", "gridcolor": "white", "linecolor": "white" }, "angularaxis": { "ticks": "", "gridcolor": "white", "linecolor": "white" } }, "scene": { "xaxis": { "ticks": "", "gridcolor": "white", "gridwidth": 2, "linecolor": "white", "zerolinecolor": "white", "showbackground": true, "backgroundcolor": "#E5ECF6" }, "yaxis": { "ticks": "", "gridcolor": "white", "gridwidth": 2, "linecolor": "white", "zerolinecolor": "white", "showbackground": true, "backgroundcolor": "#E5ECF6" }, "zaxis": { "ticks": "", "gridcolor": "white", "gridwidth": 2, "linecolor": "white", "zerolinecolor": "white", "showbackground": true, "backgroundcolor": "#E5ECF6" } }, "title": { "x": 0.05 }, "xaxis": { "ticks": "", "title": { "standoff": 15 }, "gridcolor": "white", "linecolor": "white", "automargin": true, "zerolinecolor": "white", "zerolinewidth": 2 }, "yaxis": { "ticks": "", "title": { "standoff": 15 }, "gridcolor": "white", "linecolor": "white", "automargin": true, "zerolinecolor": "white", "zerolinewidth": 2 }, "mapbox": { "style": "light" }, "ternary": { "aaxis": { "ticks": "", "gridcolor": "white", "linecolor": "white" }, "baxis": { "ticks": "", "gridcolor": "white", "linecolor": "white" }, "caxis": { "ticks": "", "gridcolor": "white", "linecolor": "white" }, "bgcolor": "#E5ECF6" }, "colorway": [ "#636efa", "#EF553B", "#00cc96", "#ab63fa", "#FFA15A", "#19d3f3", "#FF6692", "#B6E880", "#FF97FF", "#FECB52" ], "coloraxis": { "colorbar": { "ticks": "", "outlinewidth": 0 } }, "hovermode": "closest", "colorscale": { "diverging": [ [ 0, "#8e0152" ], [ 0.1, "#c51b7d" ], [ 0.2, "#de77ae" ], [ 0.3, "#f1b6da" ], [ 0.4, "#fde0ef" ], [ 0.5, "#f7f7f7" ], [ 0.6, "#e6f5d0" ], [ 0.7, "#b8e186" ], [ 0.8, "#7fbc41" ], [ 0.9, "#4d9221" ], [ 1, "#276419" ] ], "sequential": [ [ 0.0, "#0d0887" ], [ 0.1111111111111111, "#46039f" ], [ 0.2222222222222222, "#7201a8" ], [ 0.3333333333333333, "#9c179e" ], [ 0.4444444444444444, "#bd3786" ], [ 0.5555555555555556, "#d8576b" ], [ 0.6666666666666666, "#ed7953" ], [ 0.7777777777777778, "#fb9f3a" ], [ 0.8888888888888888, "#fdca26" ], [ 1.0, "#f0f921" ] ], "sequentialminus": [ [ 0.0, "#0d0887" ], [ 0.1111111111111111, "#46039f" ], [ 0.2222222222222222, "#7201a8" ], [ 0.3333333333333333, "#9c179e" ], [ 0.4444444444444444, "#bd3786" ], [ 0.5555555555555556, "#d8576b" ], [ 0.6666666666666666, "#ed7953" ], [ 0.7777777777777778, "#fb9f3a" ], [ 0.8888888888888888, "#fdca26" ], [ 1.0, "#f0f921" ] ] }, "hoverlabel": { "align": "left" }, "plot_bgcolor": "#E5ECF6", "paper_bgcolor": "white", "shapedefaults": { "line": { "color": "#2a3f5f" } }, "autotypenumbers": "strict", "annotationdefaults": { "arrowhead": 0, "arrowcolor": "#2a3f5f", "arrowwidth": 1 } } }, "showlegend": true, "plot_bgcolor": "#F5F6F9", "paper_bgcolor": "#F5F6F9" } }, "height": null, "width": null, "user": { "profile_url": "https://chart-studio.plotly.com/~kbsnom", "avatar_url": "https://storage.googleapis.com/plotly-prod-profiles/91.jpg", "background_url": "https://storage.googleapis.com/plotly-prod-profiles/bg-10.jpg", "bio": "", "nickname": "", "website": "", "stream_tokens": null, "feature_set_id": null, "csrf_token": null, "date_joined": "2024-03-31 12:11:20", "mapbox_access_tokens": null, "has_password": null, "username": "kbsnom", "email": null, "is_active": null, "readonly": null, "is_dash_creator": null, "dash_created_count": null, "is_chart_creator": null, "charts_created_count": null } }, { "creation_time": "2024-03-31T12:19:02.894989Z", "comments": { "results": [], "count": 0 }, "parented": true, "embed_url": "https://chart-studio.plotly.com/~kbsnom/11.embed", "fid": "kbsnom:11", "filename": "Plotly Playground 2024-03-31 21:18:59", "filetype": "plot", "img_url": "https://storage.googleapis.com/plotly-prod-images/kbsnom/11/9_PJGCBEONPN961ZHA42GLZUVVLTROM6.png", "image_urls": { "default": "https://storage.googleapis.com/plotly-prod-images/kbsnom/11/2_DM4DNA246Y1TP9MPME87JC49G6NUUL.png", "block-thumb": "https://storage.googleapis.com/plotly-prod-images/kbsnom/11/8_8EQW5Z57QZ4KIS8CJDO8ECNST8SICS.png", "list-thumb": "https://storage.googleapis.com/plotly-prod-images/kbsnom/11/9_PJGCBEONPN961ZHA42GLZUVVLTROM6.png" }, "api_urls": { "files": "https://api.plotly.com/v2/files/kbsnom:11", "plots": "https://api.plotly.com/v2/plots/kbsnom:11", "parent": "https://api.plotly.com/v2/folders/home?user=kbsnom" }, "owner": "kbsnom", "parent": -1, "preview": "", "referencers": [], "references": [], "title": "", "views": 1, "web_url": "https://chart-studio.plotly.com/~kbsnom/11/", "world_readable": true, "date_modified": "2024-03-31T12:19:02.904Z", "stars": { "results": [], "count": 0 }, "collaborators": { "results": [], "count": 0 }, "subfolder_count": null, "refresh_interval": null, "organize_view_url": "https://chart-studio.plotly.com/~kbsnom/11/", "current_user_permission": "read", "is_theme": null, "is_template": null, "autosize": true, "caption": "", "figure": { "data": [ { "line": { "dash": "solid", "color": "rgba(55, 128, 191, 1.0)", "shape": "linear", "width": 1.3 }, "mode": "lines", "name": "BOLL(close,20)", "text": "", "type": "scatter", "xsrc": "kbsnom:10:b73e5c", "ysrc": "kbsnom:10:5f27bb", "yaxis": "y2", "showlegend": true, "legendgroup": "BOLL(close,20)" }, { "line": { "dash": "solid", "color": "rgba(55, 128, 191, 0.8999999999999999)", "shape": "linear", "width": 1.3 }, "mode": "lines", "name": "UPPER(close,20)", "text": "", "type": "scatter", "xsrc": "kbsnom:10:054d83", "ysrc": "kbsnom:10:d1aa2e", "yaxis": "y2", "showlegend": false, "legendgroup": "BOLL(close,20)" }, { "fill": "tonexty", "line": { "dash": "solid", "color": "rgba(55, 128, 191, 0.7999999999999998)", "shape": "linear", "width": 1.3 }, "mode": "lines", "name": "LOWER(close,20)", "text": "", "type": "scatter", "xsrc": "kbsnom:10:ef5dce", "ysrc": "kbsnom:10:e0d0e2", "yaxis": "y2", "fillcolor": "rgba(55, 128, 191, 0.1)", "showlegend": false, "legendgroup": "BOLL(close,20)" }, { "name": "GS", "type": "candlestick", "xsrc": "kbsnom:10:4f039f", "yaxis": "y2", "lowsrc": "kbsnom:10:cb3620", "highsrc": "kbsnom:10:20a772", "opensrc": "kbsnom:10:bd8f28", "closesrc": "kbsnom:10:b0244e", "decreasing": { "line": { "color": "#808080" } }, "increasing": { "line": { "color": "#17BECF" } }, "showlegend": true } ], "layout": { "title": { "font": { "color": "#4D5663" }, "text": "First Quant Figure" }, "xaxis": { "title": { "font": { "color": "#4D5663" }, "text": "" }, "anchor": "y2", "showgrid": true, "tickfont": { "color": "#4D5663" }, "gridcolor": "#E1E5ED", "rangeslider": { "visible": false }, "rangeselector": { "x": 0, "y": 0.9, "font": { "size": 13 }, "bgcolor": "rgba(150, 200, 250, 1)", "buttons": [ { "step": "month", "count": 1, "label": "1m", "stepmode": "backward" }, { "step": "year", "count": 1, "label": "1y", "stepmode": "backward" } ], "visible": false }, "zerolinecolor": "#E1E5ED" }, "yaxis": { "title": { "font": { "color": "#4D5663" }, "text": "" }, "showgrid": true, "tickfont": { "color": "#4D5663" }, "gridcolor": "#E1E5ED", "zerolinecolor": "#E1E5ED", "showticklabels": false }, "legend": { "x": 0.3, "y": 0.95, "font": { "color": "#4D5663" }, "bgcolor": "#F5F6F9", "yanchor": "bottom", "orientation": "h" }, "margin": { "b": 30, "l": 30, "r": 30, "t": 30 }, "yaxis2": { "title": { "font": { "color": "#4D5663" }, "text": "" }, "domain": [ 0.0, 0.9 ], "showgrid": true, "tickfont": { "color": "#4D5663" }, "gridcolor": "#E1E5ED", "zerolinecolor": "#E1E5ED" }, "template": { "data": { "bar": [ { "type": "bar", "marker": { "line": { "color": "#E5ECF6", "width": 0.5 }, "pattern": { "size": 10, "fillmode": "overlay", "solidity": 0.2 } }, "error_x": { "color": "#2a3f5f" }, "error_y": { "color": "#2a3f5f" } } ], "pie": [ { "type": "pie", "automargin": true } ], "table": [ { "type": "table", "cells": { "fill": { "color": "#EBF0F8" }, "line": { "color": "white" } }, "header": { "fill": { "color": "#C8D4E3" }, "line": { "color": "white" } } } ], "carpet": [ { "type": "carpet", "aaxis": { "gridcolor": "white", "linecolor": "white", "endlinecolor": "#2a3f5f", "minorgridcolor": "white", "startlinecolor": "#2a3f5f" }, "baxis": { "gridcolor": "white", "linecolor": "white", "endlinecolor": "#2a3f5f", "minorgridcolor": "white", "startlinecolor": "#2a3f5f" } } ], "mesh3d": [ { "type": "mesh3d", "colorbar": { "ticks": "", "outlinewidth": 0 } } ], "contour": [ { "type": "contour", "colorbar": { "ticks": "", "outlinewidth": 0 }, "colorscale": [ [ 0.0, "#0d0887" ], [ 0.1111111111111111, "#46039f" ], [ 0.2222222222222222, "#7201a8" ], [ 0.3333333333333333, "#9c179e" ], [ 0.4444444444444444, "#bd3786" ], [ 0.5555555555555556, "#d8576b" ], [ 0.6666666666666666, "#ed7953" ], [ 0.7777777777777778, "#fb9f3a" ], [ 0.8888888888888888, "#fdca26" ], [ 1.0, "#f0f921" ] ] } ], "heatmap": [ { "type": "heatmap", "colorbar": { "ticks": "", "outlinewidth": 0 }, "colorscale": [ [ 0.0, "#0d0887" ], [ 0.1111111111111111, "#46039f" ], [ 0.2222222222222222, "#7201a8" ], [ 0.3333333333333333, "#9c179e" ], [ 0.4444444444444444, "#bd3786" ], [ 0.5555555555555556, "#d8576b" ], [ 0.6666666666666666, "#ed7953" ], [ 0.7777777777777778, "#fb9f3a" ], [ 0.8888888888888888, "#fdca26" ], [ 1.0, "#f0f921" ] ] } ], "scatter": [ { "type": "scatter", "fillpattern": { "size": 10, "fillmode": "overlay", "solidity": 0.2 } } ], "surface": [ { "type": "surface", "colorbar": { "ticks": "", "outlinewidth": 0 }, "colorscale": [ [ 0.0, "#0d0887" ], [ 0.1111111111111111, "#46039f" ], [ 0.2222222222222222, "#7201a8" ], [ 0.3333333333333333, "#9c179e" ], [ 0.4444444444444444, "#bd3786" ], [ 0.5555555555555556, "#d8576b" ], [ 0.6666666666666666, "#ed7953" ], [ 0.7777777777777778, "#fb9f3a" ], [ 0.8888888888888888, "#fdca26" ], [ 1.0, "#f0f921" ] ] } ], "barpolar": [ { "type": "barpolar", "marker": { "line": { "color": "#E5ECF6", "width": 0.5 }, "pattern": { "size": 10, "fillmode": "overlay", "solidity": 0.2 } } } ], "heatmapgl": [ { "type": "heatmapgl", "colorbar": { "ticks": "", "outlinewidth": 0 }, "colorscale": [ [ 0.0, "#0d0887" ], [ 0.1111111111111111, "#46039f" ], [ 0.2222222222222222, "#7201a8" ], [ 0.3333333333333333, "#9c179e" ], [ 0.4444444444444444, "#bd3786" ], [ 0.5555555555555556, "#d8576b" ], [ 0.6666666666666666, "#ed7953" ], [ 0.7777777777777778, "#fb9f3a" ], [ 0.8888888888888888, "#fdca26" ], [ 1.0, "#f0f921" ] ] } ], "histogram": [ { "type": "histogram", "marker": { "pattern": { "size": 10, "fillmode": "overlay", "solidity": 0.2 } } } ], "parcoords": [ { "line": { "colorbar": { "ticks": "", "outlinewidth": 0 } }, "type": "parcoords" } ], "scatter3d": [ { "line": { "colorbar": { "ticks": "", "outlinewidth": 0 } }, "type": "scatter3d", "marker": { "colorbar": { "ticks": "", "outlinewidth": 0 } } } ], "scattergl": [ { "type": "scattergl", "marker": { "colorbar": { "ticks": "", "outlinewidth": 0 } } } ], "choropleth": [ { "type": "choropleth", "colorbar": { "ticks": "", "outlinewidth": 0 } } ], "scattergeo": [ { "type": "scattergeo", "marker": { "colorbar": { "ticks": "", "outlinewidth": 0 } } } ], "histogram2d": [ { "type": "histogram2d", "colorbar": { "ticks": "", "outlinewidth": 0 }, "colorscale": [ [ 0.0, "#0d0887" ], [ 0.1111111111111111, "#46039f" ], [ 0.2222222222222222, "#7201a8" ], [ 0.3333333333333333, "#9c179e" ], [ 0.4444444444444444, "#bd3786" ], [ 0.5555555555555556, "#d8576b" ], [ 0.6666666666666666, "#ed7953" ], [ 0.7777777777777778, "#fb9f3a" ], [ 0.8888888888888888, "#fdca26" ], [ 1.0, "#f0f921" ] ] } ], "scatterpolar": [ { "type": "scatterpolar", "marker": { "colorbar": { "ticks": "", "outlinewidth": 0 } } } ], "contourcarpet": [ { "type": "contourcarpet", "colorbar": { "ticks": "", "outlinewidth": 0 } } ], "scattercarpet": [ { "type": "scattercarpet", "marker": { "colorbar": { "ticks": "", "outlinewidth": 0 } } } ], "scattermapbox": [ { "type": "scattermapbox", "marker": { "colorbar": { "ticks": "", "outlinewidth": 0 } } } ], "scatterpolargl": [ { "type": "scatterpolargl", "marker": { "colorbar": { "ticks": "", "outlinewidth": 0 } } } ], "scatterternary": [ { "type": "scatterternary", "marker": { "colorbar": { "ticks": "", "outlinewidth": 0 } } } ], "histogram2dcontour": [ { "type": "histogram2dcontour", "colorbar": { "ticks": "", "outlinewidth": 0 }, "colorscale": [ [ 0.0, "#0d0887" ], [ 0.1111111111111111, "#46039f" ], [ 0.2222222222222222, "#7201a8" ], [ 0.3333333333333333, "#9c179e" ], [ 0.4444444444444444, "#bd3786" ], [ 0.5555555555555556, "#d8576b" ], [ 0.6666666666666666, "#ed7953" ], [ 0.7777777777777778, "#fb9f3a" ], [ 0.8888888888888888, "#fdca26" ], [ 1.0, "#f0f921" ] ] } ] }, "layout": { "geo": { "bgcolor": "white", "showland": true, "lakecolor": "white", "landcolor": "#E5ECF6", "showlakes": true, "subunitcolor": "white" }, "font": { "color": "#2a3f5f" }, "polar": { "bgcolor": "#E5ECF6", "radialaxis": { "ticks": "", "gridcolor": "white", "linecolor": "white" }, "angularaxis": { "ticks": "", "gridcolor": "white", "linecolor": "white" } }, "scene": { "xaxis": { "ticks": "", "gridcolor": "white", "gridwidth": 2, "linecolor": "white", "zerolinecolor": "white", "showbackground": true, "backgroundcolor": "#E5ECF6" }, "yaxis": { "ticks": "", "gridcolor": "white", "gridwidth": 2, "linecolor": "white", "zerolinecolor": "white", "showbackground": true, "backgroundcolor": "#E5ECF6" }, "zaxis": { "ticks": "", "gridcolor": "white", "gridwidth": 2, "linecolor": "white", "zerolinecolor": "white", "showbackground": true, "backgroundcolor": "#E5ECF6" } }, "title": { "x": 0.05 }, "xaxis": { "ticks": "", "title": { "standoff": 15 }, "gridcolor": "white", "linecolor": "white", "automargin": true, "zerolinecolor": "white", "zerolinewidth": 2 }, "yaxis": { "ticks": "", "title": { "standoff": 15 }, "gridcolor": "white", "linecolor": "white", "automargin": true, "zerolinecolor": "white", "zerolinewidth": 2 }, "mapbox": { "style": "light" }, "ternary": { "aaxis": { "ticks": "", "gridcolor": "white", "linecolor": "white" }, "baxis": { "ticks": "", "gridcolor": "white", "linecolor": "white" }, "caxis": { "ticks": "", "gridcolor": "white", "linecolor": "white" }, "bgcolor": "#E5ECF6" }, "colorway": [ "#636efa", "#EF553B", "#00cc96", "#ab63fa", "#FFA15A", "#19d3f3", "#FF6692", "#B6E880", "#FF97FF", "#FECB52" ], "coloraxis": { "colorbar": { "ticks": "", "outlinewidth": 0 } }, "hovermode": "closest", "colorscale": { "diverging": [ [ 0, "#8e0152" ], [ 0.1, "#c51b7d" ], [ 0.2, "#de77ae" ], [ 0.3, "#f1b6da" ], [ 0.4, "#fde0ef" ], [ 0.5, "#f7f7f7" ], [ 0.6, "#e6f5d0" ], [ 0.7, "#b8e186" ], [ 0.8, "#7fbc41" ], [ 0.9, "#4d9221" ], [ 1, "#276419" ] ], "sequential": [ [ 0.0, "#0d0887" ], [ 0.1111111111111111, "#46039f" ], [ 0.2222222222222222, "#7201a8" ], [ 0.3333333333333333, "#9c179e" ], [ 0.4444444444444444, "#bd3786" ], [ 0.5555555555555556, "#d8576b" ], [ 0.6666666666666666, "#ed7953" ], [ 0.7777777777777778, "#fb9f3a" ], [ 0.8888888888888888, "#fdca26" ], [ 1.0, "#f0f921" ] ], "sequentialminus": [ [ 0.0, "#0d0887" ], [ 0.1111111111111111, "#46039f" ], [ 0.2222222222222222, "#7201a8" ], [ 0.3333333333333333, "#9c179e" ], [ 0.4444444444444444, "#bd3786" ], [ 0.5555555555555556, "#d8576b" ], [ 0.6666666666666666, "#ed7953" ], [ 0.7777777777777778, "#fb9f3a" ], [ 0.8888888888888888, "#fdca26" ], [ 1.0, "#f0f921" ] ] }, "hoverlabel": { "align": "left" }, "plot_bgcolor": "#E5ECF6", "paper_bgcolor": "white", "shapedefaults": { "line": { "color": "#2a3f5f" } }, "autotypenumbers": "strict", "annotationdefaults": { "arrowhead": 0, "arrowcolor": "#2a3f5f", "arrowwidth": 1 } } }, "showlegend": true, "plot_bgcolor": "#F5F6F9", "paper_bgcolor": "#F5F6F9" } }, "height": null, "width": null, "user": { "profile_url": "https://chart-studio.plotly.com/~kbsnom", "avatar_url": "https://storage.googleapis.com/plotly-prod-profiles/91.jpg", "background_url": "https://storage.googleapis.com/plotly-prod-profiles/bg-10.jpg", "bio": "", "nickname": "", "website": "", "stream_tokens": null, "feature_set_id": null, "csrf_token": null, "date_joined": "2024-03-31 12:11:20", "mapbox_access_tokens": null, "has_password": null, "username": "kbsnom", "email": null, "is_active": null, "readonly": null, "is_dash_creator": null, "dash_created_count": null, "is_chart_creator": null, "charts_created_count": null } }, { "creation_time": "2024-03-31T12:18:14.253562Z", "comments": { "results": [], "count": 0 }, "parented": true, "embed_url": "https://chart-studio.plotly.com/~kbsnom/9.embed", "fid": "kbsnom:9", "filename": "Plotly Playground 2024-03-31 21:18:10", "filetype": "plot", "img_url": "https://storage.googleapis.com/plotly-prod-images/kbsnom/9/9_7TKMCOVO7MQJ8RRGK1596BU7GTMNPB.png", "image_urls": { "default": "https://storage.googleapis.com/plotly-prod-images/kbsnom/9/2_4DUYLIMUYGBSX2TR8T8X2WC4FF2XII.png", "block-thumb": "https://storage.googleapis.com/plotly-prod-images/kbsnom/9/8_FOGMHMONS89OSLP439DVPWAC4X5E3X.png", "list-thumb": "https://storage.googleapis.com/plotly-prod-images/kbsnom/9/9_7TKMCOVO7MQJ8RRGK1596BU7GTMNPB.png" }, "api_urls": { "files": "https://api.plotly.com/v2/files/kbsnom:9", "plots": "https://api.plotly.com/v2/plots/kbsnom:9", "parent": "https://api.plotly.com/v2/folders/home?user=kbsnom" }, "owner": "kbsnom", "parent": -1, "preview": "", "referencers": [], "references": [], "title": "", "views": 1, "web_url": "https://chart-studio.plotly.com/~kbsnom/9/", "world_readable": true, "date_modified": "2024-03-31T12:18:14.263Z", "stars": { "results": [], "count": 0 }, "collaborators": { "results": [], "count": 0 }, "subfolder_count": null, "refresh_interval": null, "organize_view_url": "https://chart-studio.plotly.com/~kbsnom/9/", "current_user_permission": "read", "is_theme": null, "is_template": null, "autosize": true, "caption": "", "figure": { "data": [ { "line": { "dash": "solid", "color": "rgba(55, 128, 191, 1.0)", "shape": "linear", "width": 1.3 }, "mode": "lines", "name": "BOLL(close,20)", "text": "", "type": "scatter", "xsrc": "kbsnom:8:d1ea84", "ysrc": "kbsnom:8:cf0761", "yaxis": "y2", "showlegend": true, "legendgroup": "BOLL(close,20)" }, { "line": { "dash": "solid", "color": "rgba(55, 128, 191, 0.8999999999999999)", "shape": "linear", "width": 1.3 }, "mode": "lines", "name": "UPPER(close,20)", "text": "", "type": "scatter", "xsrc": "kbsnom:8:708c44", "ysrc": "kbsnom:8:59f7c3", "yaxis": "y2", "showlegend": false, "legendgroup": "BOLL(close,20)" }, { "fill": "tonexty", "line": { "dash": "solid", "color": "rgba(55, 128, 191, 0.7999999999999998)", "shape": "linear", "width": 1.3 }, "mode": "lines", "name": "LOWER(close,20)", "text": "", "type": "scatter", "xsrc": "kbsnom:8:682056", "ysrc": "kbsnom:8:5e01a3", "yaxis": "y2", "fillcolor": "rgba(55, 128, 191, 0.1)", "showlegend": false, "legendgroup": "BOLL(close,20)" }, { "name": "GS", "type": "candlestick", "xsrc": "kbsnom:8:703c39", "yaxis": "y2", "lowsrc": "kbsnom:8:77a651", "highsrc": "kbsnom:8:cffae8", "opensrc": "kbsnom:8:d1bdb1", "closesrc": "kbsnom:8:118410", "decreasing": { "line": { "color": "#808080" } }, "increasing": { "line": { "color": "#17BECF" } }, "showlegend": true } ], "layout": { "title": { "font": { "color": "#4D5663" }, "text": "First Quant Figure" }, "xaxis": { "title": { "font": { "color": "#4D5663" }, "text": "" }, "anchor": "y2", "showgrid": true, "tickfont": { "color": "#4D5663" }, "gridcolor": "#E1E5ED", "rangeslider": { "visible": false }, "rangeselector": { "x": 0, "y": 0.9, "font": { "size": 13 }, "bgcolor": "rgba(150, 200, 250, 1)", "buttons": [ { "step": "month", "count": 1, "label": "1m", "stepmode": "backward" }, { "step": "year", "count": 1, "label": "1y", "stepmode": "backward" } ], "visible": false }, "zerolinecolor": "#E1E5ED" }, "yaxis": { "title": { "font": { "color": "#4D5663" }, "text": "" }, "showgrid": true, "tickfont": { "color": "#4D5663" }, "gridcolor": "#E1E5ED", "zerolinecolor": "#E1E5ED", "showticklabels": false }, "legend": { "x": 0.3, "y": 0.95, "font": { "color": "#4D5663" }, "bgcolor": "#F5F6F9", "yanchor": "bottom", "orientation": "h" }, "margin": { "b": 30, "l": 30, "r": 30, "t": 30 }, "yaxis2": { "title": { "font": { "color": "#4D5663" }, "text": "" }, "domain": [ 0.0, 0.9 ], "showgrid": true, "tickfont": { "color": "#4D5663" }, "gridcolor": "#E1E5ED", "zerolinecolor": "#E1E5ED" }, "template": { "data": { "bar": [ { "type": "bar", "marker": { "line": { "color": "#E5ECF6", "width": 0.5 }, "pattern": { "size": 10, "fillmode": "overlay", "solidity": 0.2 } }, "error_x": { "color": "#2a3f5f" }, "error_y": { "color": "#2a3f5f" } } ], "pie": [ { "type": "pie", "automargin": true } ], "table": [ { "type": "table", "cells": { "fill": { "color": "#EBF0F8" }, "line": { "color": "white" } }, "header": { "fill": { "color": "#C8D4E3" }, "line": { "color": "white" } } } ], "carpet": [ { "type": "carpet", "aaxis": { "gridcolor": "white", "linecolor": "white", "endlinecolor": "#2a3f5f", "minorgridcolor": "white", "startlinecolor": "#2a3f5f" }, "baxis": { "gridcolor": "white", "linecolor": "white", "endlinecolor": "#2a3f5f", "minorgridcolor": "white", "startlinecolor": "#2a3f5f" } } ], "mesh3d": [ { "type": "mesh3d", "colorbar": { "ticks": "", "outlinewidth": 0 } } ], "contour": [ { "type": "contour", "colorbar": { "ticks": "", "outlinewidth": 0 }, "colorscale": [ [ 0.0, "#0d0887" ], [ 0.1111111111111111, "#46039f" ], [ 0.2222222222222222, "#7201a8" ], [ 0.3333333333333333, "#9c179e" ], [ 0.4444444444444444, "#bd3786" ], [ 0.5555555555555556, "#d8576b" ], [ 0.6666666666666666, "#ed7953" ], [ 0.7777777777777778, "#fb9f3a" ], [ 0.8888888888888888, "#fdca26" ], [ 1.0, "#f0f921" ] ] } ], "heatmap": [ { "type": "heatmap", "colorbar": { "ticks": "", "outlinewidth": 0 }, "colorscale": [ [ 0.0, "#0d0887" ], [ 0.1111111111111111, "#46039f" ], [ 0.2222222222222222, "#7201a8" ], [ 0.3333333333333333, "#9c179e" ], [ 0.4444444444444444, "#bd3786" ], [ 0.5555555555555556, "#d8576b" ], [ 0.6666666666666666, "#ed7953" ], [ 0.7777777777777778, "#fb9f3a" ], [ 0.8888888888888888, "#fdca26" ], [ 1.0, "#f0f921" ] ] } ], "scatter": [ { "type": "scatter", "fillpattern": { "size": 10, "fillmode": "overlay", "solidity": 0.2 } } ], "surface": [ { "type": "surface", "colorbar": { "ticks": "", "outlinewidth": 0 }, "colorscale": [ [ 0.0, "#0d0887" ], [ 0.1111111111111111, "#46039f" ], [ 0.2222222222222222, "#7201a8" ], [ 0.3333333333333333, "#9c179e" ], [ 0.4444444444444444, "#bd3786" ], [ 0.5555555555555556, "#d8576b" ], [ 0.6666666666666666, "#ed7953" ], [ 0.7777777777777778, "#fb9f3a" ], [ 0.8888888888888888, "#fdca26" ], [ 1.0, "#f0f921" ] ] } ], "barpolar": [ { "type": "barpolar", "marker": { "line": { "color": "#E5ECF6", "width": 0.5 }, "pattern": { "size": 10, "fillmode": "overlay", "solidity": 0.2 } } } ], "heatmapgl": [ { "type": "heatmapgl", "colorbar": { "ticks": "", "outlinewidth": 0 }, "colorscale": [ [ 0.0, "#0d0887" ], [ 0.1111111111111111, "#46039f" ], [ 0.2222222222222222, "#7201a8" ], [ 0.3333333333333333, "#9c179e" ], [ 0.4444444444444444, "#bd3786" ], [ 0.5555555555555556, "#d8576b" ], [ 0.6666666666666666, "#ed7953" ], [ 0.7777777777777778, "#fb9f3a" ], [ 0.8888888888888888, "#fdca26" ], [ 1.0, "#f0f921" ] ] } ], "histogram": [ { "type": "histogram", "marker": { "pattern": { "size": 10, "fillmode": "overlay", "solidity": 0.2 } } } ], "parcoords": [ { "line": { "colorbar": { "ticks": "", "outlinewidth": 0 } }, "type": "parcoords" } ], "scatter3d": [ { "line": { "colorbar": { "ticks": "", "outlinewidth": 0 } }, "type": "scatter3d", "marker": { "colorbar": { "ticks": "", "outlinewidth": 0 } } } ], "scattergl": [ { "type": "scattergl", "marker": { "colorbar": { "ticks": "", "outlinewidth": 0 } } } ], "choropleth": [ { "type": "choropleth", "colorbar": { "ticks": "", "outlinewidth": 0 } } ], "scattergeo": [ { "type": "scattergeo", "marker": { "colorbar": { "ticks": "", "outlinewidth": 0 } } } ], "histogram2d": [ { "type": "histogram2d", "colorbar": { "ticks": "", "outlinewidth": 0 }, "colorscale": [ [ 0.0, "#0d0887" ], [ 0.1111111111111111, "#46039f" ], [ 0.2222222222222222, "#7201a8" ], [ 0.3333333333333333, "#9c179e" ], [ 0.4444444444444444, "#bd3786" ], [ 0.5555555555555556, "#d8576b" ], [ 0.6666666666666666, "#ed7953" ], [ 0.7777777777777778, "#fb9f3a" ], [ 0.8888888888888888, "#fdca26" ], [ 1.0, "#f0f921" ] ] } ], "scatterpolar": [ { "type": "scatterpolar", "marker": { "colorbar": { "ticks": "", "outlinewidth": 0 } } } ], "contourcarpet": [ { "type": "contourcarpet", "colorbar": { "ticks": "", "outlinewidth": 0 } } ], "scattercarpet": [ { "type": "scattercarpet", "marker": { "colorbar": { "ticks": "", "outlinewidth": 0 } } } ], "scattermapbox": [ { "type": "scattermapbox", "marker": { "colorbar": { "ticks": "", "outlinewidth": 0 } } } ], "scatterpolargl": [ { "type": "scatterpolargl", "marker": { "colorbar": { "ticks": "", "outlinewidth": 0 } } } ], "scatterternary": [ { "type": "scatterternary", "marker": { "colorbar": { "ticks": "", "outlinewidth": 0 } } } ], "histogram2dcontour": [ { "type": "histogram2dcontour", "colorbar": { "ticks": "", "outlinewidth": 0 }, "colorscale": [ [ 0.0, "#0d0887" ], [ 0.1111111111111111, "#46039f" ], [ 0.2222222222222222, "#7201a8" ], [ 0.3333333333333333, "#9c179e" ], [ 0.4444444444444444, "#bd3786" ], [ 0.5555555555555556, "#d8576b" ], [ 0.6666666666666666, "#ed7953" ], [ 0.7777777777777778, "#fb9f3a" ], [ 0.8888888888888888, "#fdca26" ], [ 1.0, "#f0f921" ] ] } ] }, "layout": { "geo": { "bgcolor": "white", "showland": true, "lakecolor": "white", "landcolor": "#E5ECF6", "showlakes": true, "subunitcolor": "white" }, "font": { "color": "#2a3f5f" }, "polar": { "bgcolor": "#E5ECF6", "radialaxis": { "ticks": "", "gridcolor": "white", "linecolor": "white" }, "angularaxis": { "ticks": "", "gridcolor": "white", "linecolor": "white" } }, "scene": { "xaxis": { "ticks": "", "gridcolor": "white", "gridwidth": 2, "linecolor": "white", "zerolinecolor": "white", "showbackground": true, "backgroundcolor": "#E5ECF6" }, "yaxis": { "ticks": "", "gridcolor": "white", "gridwidth": 2, "linecolor": "white", "zerolinecolor": "white", "showbackground": true, "backgroundcolor": "#E5ECF6" }, "zaxis": { "ticks": "", "gridcolor": "white", "gridwidth": 2, "linecolor": "white", "zerolinecolor": "white", "showbackground": true, "backgroundcolor": "#E5ECF6" } }, "title": { "x": 0.05 }, "xaxis": { "ticks": "", "title": { "standoff": 15 }, "gridcolor": "white", "linecolor": "white", "automargin": true, "zerolinecolor": "white", "zerolinewidth": 2 }, "yaxis": { "ticks": "", "title": { "standoff": 15 }, "gridcolor": "white", "linecolor": "white", "automargin": true, "zerolinecolor": "white", "zerolinewidth": 2 }, "mapbox": { "style": "light" }, "ternary": { "aaxis": { "ticks": "", "gridcolor": "white", "linecolor": "white" }, "baxis": { "ticks": "", "gridcolor": "white", "linecolor": "white" }, "caxis": { "ticks": "", "gridcolor": "white", "linecolor": "white" }, "bgcolor": "#E5ECF6" }, "colorway": [ "#636efa", "#EF553B", "#00cc96", "#ab63fa", "#FFA15A", "#19d3f3", "#FF6692", "#B6E880", "#FF97FF", "#FECB52" ], "coloraxis": { "colorbar": { "ticks": "", "outlinewidth": 0 } }, "hovermode": "closest", "colorscale": { "diverging": [ [ 0, "#8e0152" ], [ 0.1, "#c51b7d" ], [ 0.2, "#de77ae" ], [ 0.3, "#f1b6da" ], [ 0.4, "#fde0ef" ], [ 0.5, "#f7f7f7" ], [ 0.6, "#e6f5d0" ], [ 0.7, "#b8e186" ], [ 0.8, "#7fbc41" ], [ 0.9, "#4d9221" ], [ 1, "#276419" ] ], "sequential": [ [ 0.0, "#0d0887" ], [ 0.1111111111111111, "#46039f" ], [ 0.2222222222222222, "#7201a8" ], [ 0.3333333333333333, "#9c179e" ], [ 0.4444444444444444, "#bd3786" ], [ 0.5555555555555556, "#d8576b" ], [ 0.6666666666666666, "#ed7953" ], [ 0.7777777777777778, "#fb9f3a" ], [ 0.8888888888888888, "#fdca26" ], [ 1.0, "#f0f921" ] ], "sequentialminus": [ [ 0.0, "#0d0887" ], [ 0.1111111111111111, "#46039f" ], [ 0.2222222222222222, "#7201a8" ], [ 0.3333333333333333, "#9c179e" ], [ 0.4444444444444444, "#bd3786" ], [ 0.5555555555555556, "#d8576b" ], [ 0.6666666666666666, "#ed7953" ], [ 0.7777777777777778, "#fb9f3a" ], [ 0.8888888888888888, "#fdca26" ], [ 1.0, "#f0f921" ] ] }, "hoverlabel": { "align": "left" }, "plot_bgcolor": "#E5ECF6", "paper_bgcolor": "white", "shapedefaults": { "line": { "color": "#2a3f5f" } }, "autotypenumbers": "strict", "annotationdefaults": { "arrowhead": 0, "arrowcolor": "#2a3f5f", "arrowwidth": 1 } } }, "showlegend": true, "plot_bgcolor": "#F5F6F9", "paper_bgcolor": "#F5F6F9" } }, "height": null, "width": null, "user": { "profile_url": "https://chart-studio.plotly.com/~kbsnom", "avatar_url": "https://storage.googleapis.com/plotly-prod-profiles/91.jpg", "background_url": "https://storage.googleapis.com/plotly-prod-profiles/bg-10.jpg", "bio": "", "nickname": "", "website": "", "stream_tokens": null, "feature_set_id": null, "csrf_token": null, "date_joined": "2024-03-31 12:11:20", "mapbox_access_tokens": null, "has_password": null, "username": "kbsnom", "email": null, "is_active": null, "readonly": null, "is_dash_creator": null, "dash_created_count": null, "is_chart_creator": null, "charts_created_count": null } }, { "creation_time": "2024-03-31T12:18:02.524863Z", "comments": { "results": [], "count": 0 }, "parented": true, "embed_url": "https://chart-studio.plotly.com/~kbsnom/7.embed", "fid": "kbsnom:7", "filename": "Plotly Playground 2024-03-31 21:17:58", "filetype": "plot", "img_url": "https://storage.googleapis.com/plotly-prod-images/kbsnom/7/9_3T2VP6HKQLQYUDORRG8KX3KRCPKUSU.png", "image_urls": { "default": "https://storage.googleapis.com/plotly-prod-images/kbsnom/7/2_HD8NDVL5PASI4R35B1QZUYU2XW1I2Q.png", "block-thumb": "https://storage.googleapis.com/plotly-prod-images/kbsnom/7/8_DWNTKEVUBG9VKMP3NICUNMET0SJPR8.png", "list-thumb": "https://storage.googleapis.com/plotly-prod-images/kbsnom/7/9_3T2VP6HKQLQYUDORRG8KX3KRCPKUSU.png" }, "api_urls": { "files": "https://api.plotly.com/v2/files/kbsnom:7", "plots": "https://api.plotly.com/v2/plots/kbsnom:7", "parent": "https://api.plotly.com/v2/folders/home?user=kbsnom" }, "owner": "kbsnom", "parent": -1, "preview": "", "referencers": [], "references": [], "title": "", "views": 3, "web_url": "https://chart-studio.plotly.com/~kbsnom/7/", "world_readable": true, "date_modified": "2024-03-31T12:18:02.534Z", "stars": { "results": [], "count": 0 }, "collaborators": { "results": [], "count": 0 }, "subfolder_count": null, "refresh_interval": null, "organize_view_url": "https://chart-studio.plotly.com/~kbsnom/7/", "current_user_permission": "read", "is_theme": null, "is_template": null, "autosize": true, "caption": "", "figure": { "data": [ { "name": "GS", "type": "candlestick", "xsrc": "kbsnom:6:f5221f", "yaxis": "y2", "lowsrc": "kbsnom:6:d05d1d", "highsrc": "kbsnom:6:16b47c", "opensrc": "kbsnom:6:45aff7", "closesrc": "kbsnom:6:4f4fda", "decreasing": { "line": { "color": "#808080" } }, "increasing": { "line": { "color": "#17BECF" } }, "showlegend": true } ], "layout": { "title": { "font": { "color": "#4D5663" }, "text": "First Quant Figure" }, "xaxis": { "title": { "font": { "color": "#4D5663" }, "text": "" }, "anchor": "y2", "showgrid": true, "tickfont": { "color": "#4D5663" }, "gridcolor": "#E1E5ED", "rangeslider": { "visible": false }, "rangeselector": { "x": 0, "y": 0.9, "font": { "size": 13 }, "bgcolor": "rgba(150, 200, 250, 1)", "buttons": [ { "step": "month", "count": 1, "label": "1m", "stepmode": "backward" }, { "step": "year", "count": 1, "label": "1y", "stepmode": "backward" } ], "visible": false }, "zerolinecolor": "#E1E5ED" }, "yaxis": { "title": { "font": { "color": "#4D5663" }, "text": "" }, "showgrid": true, "tickfont": { "color": "#4D5663" }, "gridcolor": "#E1E5ED", "zerolinecolor": "#E1E5ED", "showticklabels": false }, "legend": { "x": 0.3, "y": 0.95, "font": { "color": "#4D5663" }, "bgcolor": "#F5F6F9", "yanchor": "bottom", "orientation": "h" }, "margin": { "b": 30, "l": 30, "r": 30, "t": 30 }, "yaxis2": { "title": { "font": { "color": "#4D5663" }, "text": "" }, "domain": [ 0.0, 0.9 ], "showgrid": true, "tickfont": { "color": "#4D5663" }, "gridcolor": "#E1E5ED", "zerolinecolor": "#E1E5ED" }, "template": { "data": { "bar": [ { "type": "bar", "marker": { "line": { "color": "#E5ECF6", "width": 0.5 }, "pattern": { "size": 10, "fillmode": "overlay", "solidity": 0.2 } }, "error_x": { "color": "#2a3f5f" }, "error_y": { "color": "#2a3f5f" } } ], "pie": [ { "type": "pie", "automargin": true } ], "table": [ { "type": "table", "cells": { "fill": { "color": "#EBF0F8" }, "line": { "color": "white" } }, "header": { "fill": { "color": "#C8D4E3" }, "line": { "color": "white" } } } ], "carpet": [ { "type": "carpet", "aaxis": { "gridcolor": "white", "linecolor": "white", "endlinecolor": "#2a3f5f", "minorgridcolor": "white", "startlinecolor": "#2a3f5f" }, "baxis": { "gridcolor": "white", "linecolor": "white", "endlinecolor": "#2a3f5f", "minorgridcolor": "white", "startlinecolor": "#2a3f5f" } } ], "mesh3d": [ { "type": "mesh3d", "colorbar": { "ticks": "", "outlinewidth": 0 } } ], "contour": [ { "type": "contour", "colorbar": { "ticks": "", "outlinewidth": 0 }, "colorscale": [ [ 0.0, "#0d0887" ], [ 0.1111111111111111, "#46039f" ], [ 0.2222222222222222, "#7201a8" ], [ 0.3333333333333333, "#9c179e" ], [ 0.4444444444444444, "#bd3786" ], [ 0.5555555555555556, "#d8576b" ], [ 0.6666666666666666, "#ed7953" ], [ 0.7777777777777778, "#fb9f3a" ], [ 0.8888888888888888, "#fdca26" ], [ 1.0, "#f0f921" ] ] } ], "heatmap": [ { "type": "heatmap", "colorbar": { "ticks": "", "outlinewidth": 0 }, "colorscale": [ [ 0.0, "#0d0887" ], [ 0.1111111111111111, "#46039f" ], [ 0.2222222222222222, "#7201a8" ], [ 0.3333333333333333, "#9c179e" ], [ 0.4444444444444444, "#bd3786" ], [ 0.5555555555555556, "#d8576b" ], [ 0.6666666666666666, "#ed7953" ], [ 0.7777777777777778, "#fb9f3a" ], [ 0.8888888888888888, "#fdca26" ], [ 1.0, "#f0f921" ] ] } ], "scatter": [ { "type": "scatter", "fillpattern": { "size": 10, "fillmode": "overlay", "solidity": 0.2 } } ], "surface": [ { "type": "surface", "colorbar": { "ticks": "", "outlinewidth": 0 }, "colorscale": [ [ 0.0, "#0d0887" ], [ 0.1111111111111111, "#46039f" ], [ 0.2222222222222222, "#7201a8" ], [ 0.3333333333333333, "#9c179e" ], [ 0.4444444444444444, "#bd3786" ], [ 0.5555555555555556, "#d8576b" ], [ 0.6666666666666666, "#ed7953" ], [ 0.7777777777777778, "#fb9f3a" ], [ 0.8888888888888888, "#fdca26" ], [ 1.0, "#f0f921" ] ] } ], "barpolar": [ { "type": "barpolar", "marker": { "line": { "color": "#E5ECF6", "width": 0.5 }, "pattern": { "size": 10, "fillmode": "overlay", "solidity": 0.2 } } } ], "heatmapgl": [ { "type": "heatmapgl", "colorbar": { "ticks": "", "outlinewidth": 0 }, "colorscale": [ [ 0.0, "#0d0887" ], [ 0.1111111111111111, "#46039f" ], [ 0.2222222222222222, "#7201a8" ], [ 0.3333333333333333, "#9c179e" ], [ 0.4444444444444444, "#bd3786" ], [ 0.5555555555555556, "#d8576b" ], [ 0.6666666666666666, "#ed7953" ], [ 0.7777777777777778, "#fb9f3a" ], [ 0.8888888888888888, "#fdca26" ], [ 1.0, "#f0f921" ] ] } ], "histogram": [ { "type": "histogram", "marker": { "pattern": { "size": 10, "fillmode": "overlay", "solidity": 0.2 } } } ], "parcoords": [ { "line": { "colorbar": { "ticks": "", "outlinewidth": 0 } }, "type": "parcoords" } ], "scatter3d": [ { "line": { "colorbar": { "ticks": "", "outlinewidth": 0 } }, "type": "scatter3d", "marker": { "colorbar": { "ticks": "", "outlinewidth": 0 } } } ], "scattergl": [ { "type": "scattergl", "marker": { "colorbar": { "ticks": "", "outlinewidth": 0 } } } ], "choropleth": [ { "type": "choropleth", "colorbar": { "ticks": "", "outlinewidth": 0 } } ], "scattergeo": [ { "type": "scattergeo", "marker": { "colorbar": { "ticks": "", "outlinewidth": 0 } } } ], "histogram2d": [ { "type": "histogram2d", "colorbar": { "ticks": "", "outlinewidth": 0 }, "colorscale": [ [ 0.0, "#0d0887" ], [ 0.1111111111111111, "#46039f" ], [ 0.2222222222222222, "#7201a8" ], [ 0.3333333333333333, "#9c179e" ], [ 0.4444444444444444, "#bd3786" ], [ 0.5555555555555556, "#d8576b" ], [ 0.6666666666666666, "#ed7953" ], [ 0.7777777777777778, "#fb9f3a" ], [ 0.8888888888888888, "#fdca26" ], [ 1.0, "#f0f921" ] ] } ], "scatterpolar": [ { "type": "scatterpolar", "marker": { "colorbar": { "ticks": "", "outlinewidth": 0 } } } ], "contourcarpet": [ { "type": "contourcarpet", "colorbar": { "ticks": "", "outlinewidth": 0 } } ], "scattercarpet": [ { "type": "scattercarpet", "marker": { "colorbar": { "ticks": "", "outlinewidth": 0 } } } ], "scattermapbox": [ { "type": "scattermapbox", "marker": { "colorbar": { "ticks": "", "outlinewidth": 0 } } } ], "scatterpolargl": [ { "type": "scatterpolargl", "marker": { "colorbar": { "ticks": "", "outlinewidth": 0 } } } ], "scatterternary": [ { "type": "scatterternary", "marker": { "colorbar": { "ticks": "", "outlinewidth": 0 } } } ], "histogram2dcontour": [ { "type": "histogram2dcontour", "colorbar": { "ticks": "", "outlinewidth": 0 }, "colorscale": [ [ 0.0, "#0d0887" ], [ 0.1111111111111111, "#46039f" ], [ 0.2222222222222222, "#7201a8" ], [ 0.3333333333333333, "#9c179e" ], [ 0.4444444444444444, "#bd3786" ], [ 0.5555555555555556, "#d8576b" ], [ 0.6666666666666666, "#ed7953" ], [ 0.7777777777777778, "#fb9f3a" ], [ 0.8888888888888888, "#fdca26" ], [ 1.0, "#f0f921" ] ] } ] }, "layout": { "geo": { "bgcolor": "white", "showland": true, "lakecolor": "white", "landcolor": "#E5ECF6", "showlakes": true, "subunitcolor": "white" }, "font": { "color": "#2a3f5f" }, "polar": { "bgcolor": "#E5ECF6", "radialaxis": { "ticks": "", "gridcolor": "white", "linecolor": "white" }, "angularaxis": { "ticks": "", "gridcolor": "white", "linecolor": "white" } }, "scene": { "xaxis": { "ticks": "", "gridcolor": "white", "gridwidth": 2, "linecolor": "white", "zerolinecolor": "white", "showbackground": true, "backgroundcolor": "#E5ECF6" }, "yaxis": { "ticks": "", "gridcolor": "white", "gridwidth": 2, "linecolor": "white", "zerolinecolor": "white", "showbackground": true, "backgroundcolor": "#E5ECF6" }, "zaxis": { "ticks": "", "gridcolor": "white", "gridwidth": 2, "linecolor": "white", "zerolinecolor": "white", "showbackground": true, "backgroundcolor": "#E5ECF6" } }, "title": { "x": 0.05 }, "xaxis": { "ticks": "", "title": { "standoff": 15 }, "gridcolor": "white", "linecolor": "white", "automargin": true, "zerolinecolor": "white", "zerolinewidth": 2 }, "yaxis": { "ticks": "", "title": { "standoff": 15 }, "gridcolor": "white", "linecolor": "white", "automargin": true, "zerolinecolor": "white", "zerolinewidth": 2 }, "mapbox": { "style": "light" }, "ternary": { "aaxis": { "ticks": "", "gridcolor": "white", "linecolor": "white" }, "baxis": { "ticks": "", "gridcolor": "white", "linecolor": "white" }, "caxis": { "ticks": "", "gridcolor": "white", "linecolor": "white" }, "bgcolor": "#E5ECF6" }, "colorway": [ "#636efa", "#EF553B", "#00cc96", "#ab63fa", "#FFA15A", "#19d3f3", "#FF6692", "#B6E880", "#FF97FF", "#FECB52" ], "coloraxis": { "colorbar": { "ticks": "", "outlinewidth": 0 } }, "hovermode": "closest", "colorscale": { "diverging": [ [ 0, "#8e0152" ], [ 0.1, "#c51b7d" ], [ 0.2, "#de77ae" ], [ 0.3, "#f1b6da" ], [ 0.4, "#fde0ef" ], [ 0.5, "#f7f7f7" ], [ 0.6, "#e6f5d0" ], [ 0.7, "#b8e186" ], [ 0.8, "#7fbc41" ], [ 0.9, "#4d9221" ], [ 1, "#276419" ] ], "sequential": [ [ 0.0, "#0d0887" ], [ 0.1111111111111111, "#46039f" ], [ 0.2222222222222222, "#7201a8" ], [ 0.3333333333333333, "#9c179e" ], [ 0.4444444444444444, "#bd3786" ], [ 0.5555555555555556, "#d8576b" ], [ 0.6666666666666666, "#ed7953" ], [ 0.7777777777777778, "#fb9f3a" ], [ 0.8888888888888888, "#fdca26" ], [ 1.0, "#f0f921" ] ], "sequentialminus": [ [ 0.0, "#0d0887" ], [ 0.1111111111111111, "#46039f" ], [ 0.2222222222222222, "#7201a8" ], [ 0.3333333333333333, "#9c179e" ], [ 0.4444444444444444, "#bd3786" ], [ 0.5555555555555556, "#d8576b" ], [ 0.6666666666666666, "#ed7953" ], [ 0.7777777777777778, "#fb9f3a" ], [ 0.8888888888888888, "#fdca26" ], [ 1.0, "#f0f921" ] ] }, "hoverlabel": { "align": "left" }, "plot_bgcolor": "#E5ECF6", "paper_bgcolor": "white", "shapedefaults": { "line": { "color": "#2a3f5f" } }, "autotypenumbers": "strict", "annotationdefaults": { "arrowhead": 0, "arrowcolor": "#2a3f5f", "arrowwidth": 1 } } }, "showlegend": true, "plot_bgcolor": "#F5F6F9", "paper_bgcolor": "#F5F6F9" } }, "height": null, "width": null, "user": { "profile_url": "https://chart-studio.plotly.com/~kbsnom", "avatar_url": "https://storage.googleapis.com/plotly-prod-profiles/91.jpg", "background_url": "https://storage.googleapis.com/plotly-prod-profiles/bg-10.jpg", "bio": "", "nickname": "", "website": "", "stream_tokens": null, "feature_set_id": null, "csrf_token": null, "date_joined": "2024-03-31 12:11:20", "mapbox_access_tokens": null, "has_password": null, "username": "kbsnom", "email": null, "is_active": null, "readonly": null, "is_dash_creator": null, "dash_created_count": null, "is_chart_creator": null, "charts_created_count": null } } ] }
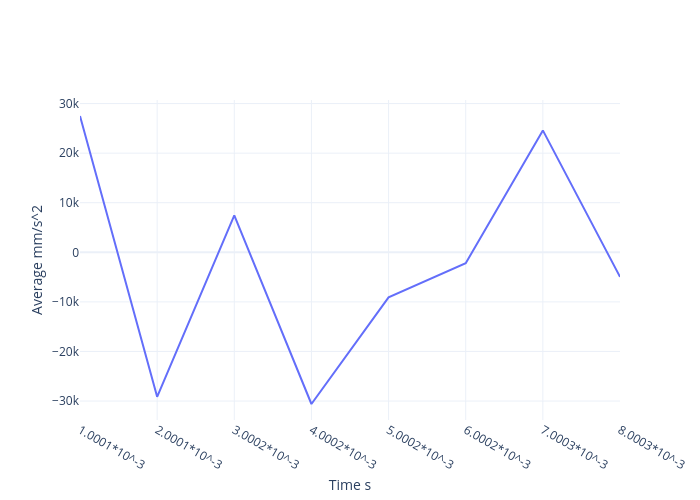
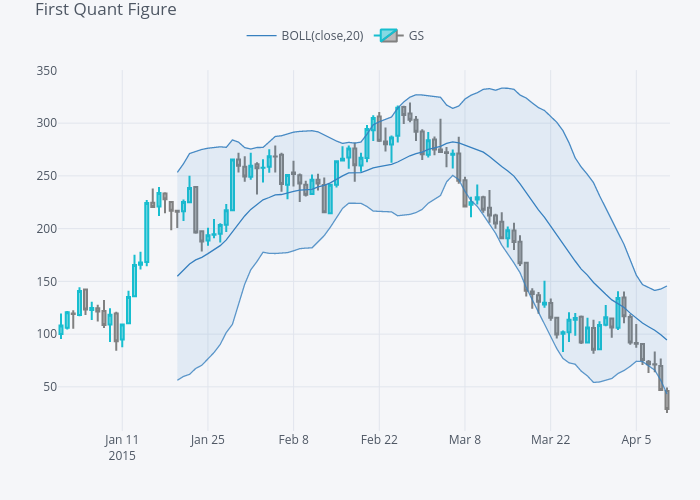