Plots List
Plots
This endpoint handles manipulation of Plotly plot files.
Reference
Authorization
Any user with or without a Plotly account may view public plots. For private plots, see authentication.
Actions
list
Listing all public plots can be done via a GET request to this endpoint.
By default, plots will be listed in order of date created. The order_by
query parameter is accepted at this endpoint. Currently, only ordering by
views is supported. It is possible to filter the plots by quality
with min_quality or max_quality as query parameter.
Example:
// GET https://api.plotly.com/v2/plots/ ---> 200

// GET https://api.plotly.com/v2/plots/?order_by=-views ---> 200

// GET https://api.plotly.com/v2/plots/?min_quality=5 ---> 200

// GET https://api.plotly.com/v2/plots/?max_quality=5 ---> 200
feed
Listing all handpicked feed plots can be done via a GET request to this endpoint. By default, plots will be listed in a random order.
Example:
// GET https://api.plotly.com/v2/plots/feed ---> 200
create
You can create new plot resources here. The only required field is 'figure'. Currently, the figure is restricted to only contain references to grid data. That is, this will fail if raw data arrays are passed in. To create and manipulate underlying grids for plots, see the grids endpoint.
Example:
// This fails because a figure field is required.
// POST https://api.plotly.com/v2/plots ---> 400 Bad Request
{}

// This fails because the figure has raw data
//POST https://api.plotly.com/v2/plots ---> 400 Bad Request
{
    "figure": {"data": [{"y": ['this', 'is', 'raw', 'data']}]}
}

// This succeeds because the figure has src keys, not raw data.
//POST https://api.plotly.com/v2/plots ---> 200 OK
{
    "figure": {"data": [{"ysrc": "sven:88:u8nd62"}]}
}
When creating a grid, you can optionally specify a source_fid to specify where a plot has come from:
- source_fid: the fid of a plot that was copied (and presumably edited) to produce this one
detail
There is a lot of meta information stored about plot files including filename, title, share_url, and content_url to name a few.
This information can only be reached with a GET to this endpoint.
Example:
// GET https://api.plotly.com/v2/plots/iheartgraphs:90
content
The contents of a plot can be downloaded via the content resource. The plot
content contains referenced grid/column data by default. If you wish to
return the raw grid/column data, the inline_data=true query must be included
in the request url. The Content-Type header will be appropriately set for the
response body.
Alternatively, you can set ?map_data=unreadable to append a mapping of
sources to data that belongs to grids which are unreadable for the
requestor. This is useful when you have read access to another users plot,
but that plot contains grid references which you don't have access to.
Examples:
// Returns referenced grid/column data
// GET https://api.plotly.com/v2/plots/iheartgraphs:90/content ---> 200 OK

// Returns full grid/column data
// GET https://api.plotly.com/v2/plots/iheartgraphs:90/content?inline_data=true ---> 200 OK

// Returns full grid/column data when requestor doesn't have permission
// to read the referenced grid.
// GET https://api.plotly.com/v2/plots/iheartgraphs:90/content?map_data=unreadable ---> 200 OK
GET /v2/plots?cursor=cD0yMDI0LTAzLTMxKzE2JTNBNTUlM0EzMy40MzQzMTElMkIwMCUzQTAw&format=api
{ "next": "https://api.plot.ly/v2/plots?cursor=cD0yMDI0LTAzLTMxKzEzJTNBNDUlM0EwNS45MTQ4NzIlMkIwMCUzQTAw&format=api", "previous": "https://api.plot.ly/v2/plots?cursor=cj0xJnA9MjAyNC0wMy0zMSsxNiUzQTI3JTNBNDcuOTY4NDI1JTJCMDAlM0EwMA%3D%3D&format=api", "results": [ { "creation_time": "2024-03-31T16:27:47.968425Z", "comments": { "results": [], "count": 0 }, "parented": true, "embed_url": "https://chart-studio.plotly.com/~tiennguyen/1.embed", "fid": "tiennguyen:1", "filename": "Plot 1", "filetype": "plot", "img_url": "https://storage.googleapis.com/plotly-prod-images/tiennguyen/1/9_PXM2PZTUSD657N974ERKX1H16FGSBP.png", "image_urls": { "default": "https://storage.googleapis.com/plotly-prod-images/tiennguyen/1/2_HAOCH1JJYKSWKWZS76X7ASPVIKSDT7.png", "block-thumb": "https://storage.googleapis.com/plotly-prod-images/tiennguyen/1/8_46AIH19FKS19TJ3F7UQHB1LKZ2EIG8.png", "list-thumb": "https://storage.googleapis.com/plotly-prod-images/tiennguyen/1/9_PXM2PZTUSD657N974ERKX1H16FGSBP.png" }, "api_urls": { "files": "https://api.plotly.com/v2/files/tiennguyen:1", "plots": "https://api.plotly.com/v2/plots/tiennguyen:1", "parent": "https://api.plotly.com/v2/folders/home?user=tiennguyen" }, "owner": "tiennguyen", "parent": -1, "preview": "", "referencers": [], "references": [], "title": "", "views": 1, "web_url": "https://chart-studio.plotly.com/~tiennguyen/1/", "world_readable": true, "date_modified": "2024-03-31T16:27:59.676Z", "stars": { "results": [], "count": 0 }, "collaborators": { "results": [], "count": 0 }, "subfolder_count": null, "refresh_interval": null, "organize_view_url": "https://chart-studio.plotly.com/~tiennguyen/1/", "current_user_permission": "read", "is_theme": null, "is_template": false, "autosize": true, "caption": "", "figure": { "data": [ { "mode": "markers", "type": "scatter" }, { "mode": "markers", "type": "scatter", "stackgroup": null } ], "frames": [], "layout": { "xaxis": { "range": [ -1, 6 ], "autorange": true }, "yaxis": { "range": [ -1, 4 ], "autorange": true }, "autosize": true, "template": { "data": { "bar": [ { "type": "bar", "marker": { "colorbar": { "ticks": "", "outlinewidth": 0 } } } ], "table": [ { "type": "table", "cells": { "fill": { "color": "#EBF0F8" }, "line": { "color": "white" } }, "header": { "fill": { "color": "#C8D4E3" }, "line": { "color": "white" } } } ], "carpet": [ { "type": "carpet", "aaxis": { "gridcolor": "#C8D4E3", "linecolor": "#C8D4E3", "endlinecolor": "#2a3f5f", "minorgridcolor": "#C8D4E3", "startlinecolor": "#2a3f5f" }, "baxis": { "gridcolor": "#C8D4E3", "linecolor": "#C8D4E3", "endlinecolor": "#2a3f5f", "minorgridcolor": "#C8D4E3", "startlinecolor": "#2a3f5f" } } ], "mesh3d": [ { "type": "mesh3d", "colorbar": { "ticks": "", "outlinewidth": 0 } } ], "contour": [ { "type": "contour", "colorbar": { "ticks": "", "outlinewidth": 0 }, "autocolorscale": true } ], "heatmap": [ { "type": "heatmap", "colorbar": { "ticks": "", "outlinewidth": 0 }, "autocolorscale": true } ], "scatter": [ { "type": "scatter", "marker": { "colorbar": { "ticks": "", "outlinewidth": 0 } } } ], "surface": [ { "type": "surface", "colorbar": { "ticks": "", "outlinewidth": 0 } } ], "heatmapgl": [ { "type": "heatmapgl", "colorbar": { "ticks": "", "outlinewidth": 0 } } ], "histogram": [ { "type": "histogram", "marker": { "colorbar": { "ticks": "", "outlinewidth": 0 } } } ], "parcoords": [ { "line": { "colorbar": { "ticks": "", "outlinewidth": 0 } }, "type": "parcoords" } ], "scatter3d": [ { "type": "scatter3d", "marker": { "colorbar": { "ticks": "", "outlinewidth": 0 } } } ], "scattergl": [ { "type": "scattergl", "marker": { "colorbar": { "ticks": "", "outlinewidth": 0 } } } ], "choropleth": [ { "type": "choropleth", "colorbar": { "ticks": "", "outlinewidth": 0 } } ], "scattergeo": [ { "type": "scattergeo", "marker": { "colorbar": { "ticks": "", "outlinewidth": 0 } } } ], "histogram2d": [ { "type": "histogram2d", "colorbar": { "ticks": "", "outlinewidth": 0 }, "autocolorscale": true } ], "scatterpolar": [ { "type": "scatterpolar", "marker": { "colorbar": { "ticks": "", "outlinewidth": 0 } } } ], "contourcarpet": [ { "type": "contourcarpet", "colorbar": { "ticks": "", "outlinewidth": 0 } } ], "scattercarpet": [ { "type": "scattercarpet", "marker": { "colorbar": { "ticks": "", "outlinewidth": 0 } } } ], "scattermapbox": [ { "type": "scattermapbox", "marker": { "colorbar": { "ticks": "", "outlinewidth": 0 } } } ], "scatterpolargl": [ { "type": "scatterpolargl", "marker": { "colorbar": { "ticks": "", "outlinewidth": 0 } } } ], "scatterternary": [ { "type": "scatterternary", "marker": { "colorbar": { "ticks": "", "outlinewidth": 0 } } } ], "histogram2dcontour": [ { "type": "histogram2dcontour", "colorbar": { "ticks": "", "outlinewidth": 0 }, "autocolorscale": true } ] }, "layout": { "geo": { "bgcolor": "white", "showland": true, "lakecolor": "white", "landcolor": "white", "showlakes": true, "subunitcolor": "#C8D4E3" }, "font": { "color": "#2a3f5f" }, "polar": { "bgcolor": "white", "radialaxis": { "ticks": "", "gridcolor": "#EBF0F8", "linecolor": "#EBF0F8" }, "angularaxis": { "ticks": "", "gridcolor": "#EBF0F8", "linecolor": "#EBF0F8" } }, "scene": { "xaxis": { "ticks": "", "gridcolor": "#DFE8F3", "gridwidth": 2, "linecolor": "#EBF0F8", "zerolinecolor": "#EBF0F8", "showbackground": true, "backgroundcolor": "white" }, "yaxis": { "ticks": "", "gridcolor": "#DFE8F3", "gridwidth": 2, "linecolor": "#EBF0F8", "zerolinecolor": "#EBF0F8", "showbackground": true, "backgroundcolor": "white" }, "zaxis": { "ticks": "", "gridcolor": "#DFE8F3", "gridwidth": 2, "linecolor": "#EBF0F8", "zerolinecolor": "#EBF0F8", "showbackground": true, "backgroundcolor": "white" } }, "title": { "x": 0.05 }, "xaxis": { "ticks": "", "gridcolor": "#EBF0F8", "linecolor": "#EBF0F8", "automargin": true, "zerolinecolor": "#EBF0F8", "zerolinewidth": 2 }, "yaxis": { "ticks": "", "gridcolor": "#EBF0F8", "linecolor": "#EBF0F8", "automargin": true, "zerolinecolor": "#EBF0F8", "zerolinewidth": 2 }, "ternary": { "aaxis": { "ticks": "", "gridcolor": "#DFE8F3", "linecolor": "#A2B1C6" }, "baxis": { "ticks": "", "gridcolor": "#DFE8F3", "linecolor": "#A2B1C6" }, "caxis": { "ticks": "", "gridcolor": "#DFE8F3", "linecolor": "#A2B1C6" }, "bgcolor": "white" }, "colorway": [ "#636efa", "#EF553B", "#00cc96", "#ab63fa", "#19d3f3", "#e763fa", "#fecb52", "#ffa15a", "#ff6692", "#b6e880" ], "hovermode": "closest", "colorscale": { "diverging": [ [ 0, "#8e0152" ], [ 0.1, "#c51b7d" ], [ 0.2, "#de77ae" ], [ 0.3, "#f1b6da" ], [ 0.4, "#fde0ef" ], [ 0.5, "#f7f7f7" ], [ 0.6, "#e6f5d0" ], [ 0.7, "#b8e186" ], [ 0.8, "#7fbc41" ], [ 0.9, "#4d9221" ], [ 1, "#276419" ] ], "sequential": [ [ 0, "#0508b8" ], [ 0.0893854748603352, "#1910d8" ], [ 0.1787709497206704, "#3c19f0" ], [ 0.2681564245810056, "#6b1cfb" ], [ 0.3575418994413408, "#981cfd" ], [ 0.44692737430167595, "#bf1cfd" ], [ 0.5363128491620112, "#dd2bfd" ], [ 0.6256983240223464, "#f246fe" ], [ 0.7150837988826816, "#fc67fd" ], [ 0.8044692737430168, "#fe88fc" ], [ 0.8938547486033519, "#fea5fd" ], [ 0.9832402234636871, "#febefe" ], [ 1, "#fec3fe" ] ], "sequentialminus": [ [ 0, "#0508b8" ], [ 0.0893854748603352, "#1910d8" ], [ 0.1787709497206704, "#3c19f0" ], [ 0.2681564245810056, "#6b1cfb" ], [ 0.3575418994413408, "#981cfd" ], [ 0.44692737430167595, "#bf1cfd" ], [ 0.5363128491620112, "#dd2bfd" ], [ 0.6256983240223464, "#f246fe" ], [ 0.7150837988826816, "#fc67fd" ], [ 0.8044692737430168, "#fe88fc" ], [ 0.8938547486033519, "#fea5fd" ], [ 0.9832402234636871, "#febefe" ], [ 1, "#fec3fe" ] ] }, "plot_bgcolor": "white", "paper_bgcolor": "white", "shapedefaults": { "line": { "width": 0 }, "opacity": 0.4, "fillcolor": "#506784" }, "annotationdefaults": { "arrowhead": 0, "arrowcolor": "#506784", "arrowwidth": 1 } }, "themeRef": "PLOTLY_WHITE" } } }, "height": null, "width": null, "user": { "profile_url": "https://chart-studio.plotly.com/~tiennguyen", "avatar_url": "https://storage.googleapis.com/plotly-prod-profiles/94.jpg", "background_url": "https://storage.googleapis.com/plotly-prod-profiles/bg-7.jpg", "bio": "", "nickname": "", "website": "", "stream_tokens": null, "feature_set_id": null, "csrf_token": null, "date_joined": "2024-03-31 16:27:24", "mapbox_access_tokens": null, "has_password": null, "username": "tiennguyen", "email": null, "is_active": null, "readonly": null, "is_dash_creator": null, "dash_created_count": null, "is_chart_creator": null, "charts_created_count": null } }, { "creation_time": "2024-03-31T15:39:32.230812Z", "comments": { "results": [], "count": 0 }, "parented": true, "embed_url": "https://chart-studio.plotly.com/~winsonchee199/33.embed", "fid": "winsonchee199:33", "filename": "Cumulative PnL by Day for 8 Charts", "filetype": "plot", "img_url": "https://api.plotly.com/v2/files/winsonchee199:33/image?image_name=list-thumb", "image_urls": { "default": "https://api.plotly.com/v2/files/winsonchee199:33/image?image_name=default", "block-thumb": "https://api.plotly.com/v2/files/winsonchee199:33/image?image_name=block-thumb", "list-thumb": "https://api.plotly.com/v2/files/winsonchee199:33/image?image_name=list-thumb" }, "api_urls": { "files": "https://api.plotly.com/v2/files/winsonchee199:33", "plots": "https://api.plotly.com/v2/plots/winsonchee199:33", "parent": "https://api.plotly.com/v2/folders/home?user=winsonchee199" }, "owner": "winsonchee199", "parent": -1, "preview": "", "referencers": [], "references": [], "title": "", "views": 2, "web_url": "https://chart-studio.plotly.com/~winsonchee199/33/", "world_readable": true, "date_modified": "2024-03-31T15:45:25.974Z", "stars": { "results": [], "count": 0 }, "collaborators": { "results": [], "count": 0 }, "subfolder_count": null, "refresh_interval": null, "organize_view_url": "https://chart-studio.plotly.com/~winsonchee199/33/", "current_user_permission": "read", "is_theme": null, "is_template": null, "autosize": true, "caption": "", "figure": { "data": [ { "line": { "width": 3 }, "mode": "lines", "name": "Cumulative PnL 1", "type": "scatter", "xsrc": "winsonchee199:35:53df47", "ysrc": "winsonchee199:35:30f65f", "xaxis": "x", "yaxis": "y" }, { "line": { "color": "red", "width": 2 }, "mode": "lines", "name": "Loss Day", "type": "scatter", "xsrc": "winsonchee199:35:9de348", "ysrc": "winsonchee199:35:fe4a7a", "xaxis": "x", "yaxis": "y", "showlegend": true }, { "line": { "color": "red", "width": 2 }, "mode": "lines", "name": "", "type": "scatter", "xsrc": "winsonchee199:35:f4d584", "ysrc": "winsonchee199:35:9529b5", "xaxis": "x", "yaxis": "y", "showlegend": false }, { "line": { "color": "red", "width": 2 }, "mode": "lines", "name": "", "type": "scatter", "xsrc": "winsonchee199:35:4cf798", "ysrc": "winsonchee199:35:84fac9", "xaxis": "x", "yaxis": "y", "showlegend": false }, { "line": { "color": "red", "width": 2 }, "mode": "lines", "name": "", "type": "scatter", "xsrc": "winsonchee199:35:976dcf", "ysrc": "winsonchee199:35:00f70d", "xaxis": "x", "yaxis": "y", "showlegend": false }, { "line": { "color": "red", "width": 2 }, "mode": "lines", "name": "", "type": "scatter", "xsrc": "winsonchee199:35:25ffc4", "ysrc": "winsonchee199:35:456869", "xaxis": "x", "yaxis": "y", "showlegend": false }, { "line": { "width": 3 }, "mode": "lines", "name": "Cumulative PnL 2", "type": "scatter", "xsrc": "winsonchee199:35:7d348a", "ysrc": "winsonchee199:35:d85ae1", "xaxis": "x2", "yaxis": "y2" }, { "line": { "color": "red", "width": 2 }, "mode": "lines", "name": "", "type": "scatter", "xsrc": "winsonchee199:35:61bd32", "ysrc": "winsonchee199:35:9a096f", "xaxis": "x2", "yaxis": "y2", "showlegend": false }, { "line": { "color": "red", "width": 2 }, "mode": "lines", "name": "", "type": "scatter", "xsrc": "winsonchee199:35:c58584", "ysrc": "winsonchee199:35:28ab18", "xaxis": "x2", "yaxis": "y2", "showlegend": false }, { "line": { "color": "red", "width": 2 }, "mode": "lines", "name": "", "type": "scatter", "xsrc": "winsonchee199:35:25b437", "ysrc": "winsonchee199:35:0111f2", "xaxis": "x2", "yaxis": "y2", "showlegend": false }, { "line": { "color": "red", "width": 2 }, "mode": "lines", "name": "", "type": "scatter", "xsrc": "winsonchee199:35:67965d", "ysrc": "winsonchee199:35:0d3160", "xaxis": "x2", "yaxis": "y2", "showlegend": false }, { "line": { "color": "red", "width": 2 }, "mode": "lines", "name": "", "type": "scatter", "xsrc": "winsonchee199:35:b388e4", "ysrc": "winsonchee199:35:71b1a2", "xaxis": "x2", "yaxis": "y2", "showlegend": false }, { "line": { "color": "red", "width": 2 }, "mode": "lines", "name": "", "type": "scatter", "xsrc": "winsonchee199:35:facc62", "ysrc": "winsonchee199:35:0391d8", "xaxis": "x2", "yaxis": "y2", "showlegend": false }, { "line": { "color": "red", "width": 2 }, "mode": "lines", "name": "", "type": "scatter", "xsrc": "winsonchee199:35:bcde62", "ysrc": "winsonchee199:35:735b41", "xaxis": "x2", "yaxis": "y2", "showlegend": false }, { "line": { "color": "red", "width": 2 }, "mode": "lines", "name": "", "type": "scatter", "xsrc": "winsonchee199:35:be43e8", "ysrc": "winsonchee199:35:88a389", "xaxis": "x2", "yaxis": "y2", "showlegend": false }, { "line": { "color": "red", "width": 2 }, "mode": "lines", "name": "", "type": "scatter", "xsrc": "winsonchee199:35:6a70b5", "ysrc": "winsonchee199:35:99cc36", "xaxis": "x2", "yaxis": "y2", "showlegend": false }, { "line": { "color": "red", "width": 2 }, "mode": "lines", "name": "", "type": "scatter", "xsrc": "winsonchee199:35:a4ee52", "ysrc": "winsonchee199:35:d8ece4", "xaxis": "x2", "yaxis": "y2", "showlegend": false }, { "line": { "color": "red", "width": 2 }, "mode": "lines", "name": "", "type": "scatter", "xsrc": "winsonchee199:35:a0d9ab", "ysrc": "winsonchee199:35:c85c1a", "xaxis": "x2", "yaxis": "y2", "showlegend": false }, { "line": { "color": "red", "width": 2 }, "mode": "lines", "name": "", "type": "scatter", "xsrc": "winsonchee199:35:15e576", "ysrc": "winsonchee199:35:86d857", "xaxis": "x2", "yaxis": "y2", "showlegend": false }, { "line": { "color": "red", "width": 2 }, "mode": "lines", "name": "", "type": "scatter", "xsrc": "winsonchee199:35:3c20a4", "ysrc": "winsonchee199:35:be897a", "xaxis": "x2", "yaxis": "y2", "showlegend": false }, { "line": { "color": "red", "width": 2 }, "mode": "lines", "name": "", "type": "scatter", "xsrc": "winsonchee199:35:43bd1b", "ysrc": "winsonchee199:35:3bb875", "xaxis": "x2", "yaxis": "y2", "showlegend": false }, { "line": { "color": "red", "width": 2 }, "mode": "lines", "name": "", "type": "scatter", "xsrc": "winsonchee199:35:d2d5f5", "ysrc": "winsonchee199:35:c107ba", "xaxis": "x2", "yaxis": "y2", "showlegend": false }, { "line": { "color": "red", "width": 2 }, "mode": "lines", "name": "", "type": "scatter", "xsrc": "winsonchee199:35:f44cd7", "ysrc": "winsonchee199:35:beb790", "xaxis": "x2", "yaxis": "y2", "showlegend": false }, { "line": { "color": "red", "width": 2 }, "mode": "lines", "name": "", "type": "scatter", "xsrc": "winsonchee199:35:c5419d", "ysrc": "winsonchee199:35:d0d88d", "xaxis": "x2", "yaxis": "y2", "showlegend": false }, { "line": { "color": "red", "width": 2 }, "mode": "lines", "name": "", "type": "scatter", "xsrc": "winsonchee199:35:064f26", "ysrc": "winsonchee199:35:92c876", "xaxis": "x2", "yaxis": "y2", "showlegend": false }, { "line": { "color": "red", "width": 2 }, "mode": "lines", "name": "", "type": "scatter", "xsrc": "winsonchee199:35:743972", "ysrc": "winsonchee199:35:f3226d", "xaxis": "x2", "yaxis": "y2", "showlegend": false }, { "line": { "color": "red", "width": 2 }, "mode": "lines", "name": "", "type": "scatter", "xsrc": "winsonchee199:35:ba0364", "ysrc": "winsonchee199:35:b2648e", "xaxis": "x2", "yaxis": "y2", "showlegend": false }, { "line": { "color": "red", "width": 2 }, "mode": "lines", "name": "", "type": "scatter", "xsrc": "winsonchee199:35:0a2285", "ysrc": "winsonchee199:35:8de77d", "xaxis": "x2", "yaxis": "y2", "showlegend": false }, { "line": { "color": "red", "width": 2 }, "mode": "lines", "name": "", "type": "scatter", "xsrc": "winsonchee199:35:0ebea4", "ysrc": "winsonchee199:35:47f938", "xaxis": "x2", "yaxis": "y2", "showlegend": false }, { "line": { "color": "red", "width": 2 }, "mode": "lines", "name": "", "type": "scatter", "xsrc": "winsonchee199:35:b4bdf1", "ysrc": "winsonchee199:35:f2dc35", "xaxis": "x2", "yaxis": "y2", "showlegend": false }, { "line": { "color": "red", "width": 2 }, "mode": "lines", "name": "", "type": "scatter", "xsrc": "winsonchee199:35:8daca1", "ysrc": "winsonchee199:35:626e3b", "xaxis": "x2", "yaxis": "y2", "showlegend": false }, { "line": { "color": "red", "width": 2 }, "mode": "lines", "name": "", "type": "scatter", "xsrc": "winsonchee199:35:67dba2", "ysrc": "winsonchee199:35:e64395", "xaxis": "x2", "yaxis": "y2", "showlegend": false }, { "line": { "color": "red", "width": 2 }, "mode": "lines", "name": "", "type": "scatter", "xsrc": "winsonchee199:35:ce4958", "ysrc": "winsonchee199:35:737c25", "xaxis": "x2", "yaxis": "y2", "showlegend": false }, { "line": { "color": "red", "width": 2 }, "mode": "lines", "name": "", "type": "scatter", "xsrc": "winsonchee199:35:911b00", "ysrc": "winsonchee199:35:a46898", "xaxis": "x2", "yaxis": "y2", "showlegend": false }, { "line": { "color": "red", "width": 2 }, "mode": "lines", "name": "", "type": "scatter", "xsrc": "winsonchee199:35:6d8c9a", "ysrc": "winsonchee199:35:9dcee6", "xaxis": "x2", "yaxis": "y2", "showlegend": false }, { "line": { "color": "red", "width": 2 }, "mode": "lines", "name": "", "type": "scatter", "xsrc": "winsonchee199:35:1c9560", "ysrc": "winsonchee199:35:c3000e", "xaxis": "x2", "yaxis": "y2", "showlegend": false }, { "line": { "color": "red", "width": 2 }, "mode": "lines", "name": "", "type": "scatter", "xsrc": "winsonchee199:35:0b1e50", "ysrc": "winsonchee199:35:06ab4b", "xaxis": "x2", "yaxis": "y2", "showlegend": false }, { "line": { "color": "red", "width": 2 }, "mode": "lines", "name": "", "type": "scatter", "xsrc": "winsonchee199:35:c02318", "ysrc": "winsonchee199:35:36470f", "xaxis": "x2", "yaxis": "y2", "showlegend": false }, { "line": { "color": "red", "width": 2 }, "mode": "lines", "name": "", "type": "scatter", "xsrc": "winsonchee199:35:7b578e", "ysrc": "winsonchee199:35:f9d5ef", "xaxis": "x2", "yaxis": "y2", "showlegend": false }, { "line": { "color": "red", "width": 2 }, "mode": "lines", "name": "", "type": "scatter", "xsrc": "winsonchee199:35:0019d9", "ysrc": "winsonchee199:35:35fd61", "xaxis": "x2", "yaxis": "y2", "showlegend": false }, { "line": { "color": "red", "width": 2 }, "mode": "lines", "name": "", "type": "scatter", "xsrc": "winsonchee199:35:e0e654", "ysrc": "winsonchee199:35:60989d", "xaxis": "x2", "yaxis": "y2", "showlegend": false }, { "line": { "color": "red", "width": 2 }, "mode": "lines", "name": "", "type": "scatter", "xsrc": "winsonchee199:35:97914e", "ysrc": "winsonchee199:35:0f756a", "xaxis": "x2", "yaxis": "y2", "showlegend": false }, { "line": { "color": "red", "width": 2 }, "mode": "lines", "name": "", "type": "scatter", "xsrc": "winsonchee199:35:238170", "ysrc": "winsonchee199:35:bb2c10", "xaxis": "x2", "yaxis": "y2", "showlegend": false }, { "line": { "color": "red", "width": 2 }, "mode": "lines", "name": "", "type": "scatter", "xsrc": "winsonchee199:35:0fb3b7", "ysrc": "winsonchee199:35:cd4023", "xaxis": "x2", "yaxis": "y2", "showlegend": false }, { "line": { "color": "red", "width": 2 }, "mode": "lines", "name": "", "type": "scatter", "xsrc": "winsonchee199:35:6d4893", "ysrc": "winsonchee199:35:3e4dc6", "xaxis": "x2", "yaxis": "y2", "showlegend": false }, { "line": { "color": "red", "width": 2 }, "mode": "lines", "name": "", "type": "scatter", "xsrc": "winsonchee199:35:414f1a", "ysrc": "winsonchee199:35:ba2a84", "xaxis": "x2", "yaxis": "y2", "showlegend": false }, { "line": { "color": "red", "width": 2 }, "mode": "lines", "name": "", "type": "scatter", "xsrc": "winsonchee199:35:6ac171", "ysrc": "winsonchee199:35:f9b2dd", "xaxis": "x2", "yaxis": "y2", "showlegend": false }, { "line": { "color": "red", "width": 2 }, "mode": "lines", "name": "", "type": "scatter", "xsrc": "winsonchee199:35:921c45", "ysrc": "winsonchee199:35:66262c", "xaxis": "x2", "yaxis": "y2", "showlegend": false }, { "line": { "color": "red", "width": 2 }, "mode": "lines", "name": "", "type": "scatter", "xsrc": "winsonchee199:35:dde76b", "ysrc": "winsonchee199:35:0a6870", "xaxis": "x2", "yaxis": "y2", "showlegend": false }, { "line": { "color": "red", "width": 2 }, "mode": "lines", "name": "", "type": "scatter", "xsrc": "winsonchee199:35:83519a", "ysrc": "winsonchee199:35:583571", "xaxis": "x2", "yaxis": "y2", "showlegend": false }, { "line": { "color": "red", "width": 2 }, "mode": "lines", "name": "", "type": "scatter", "xsrc": "winsonchee199:35:9d6bf7", "ysrc": "winsonchee199:35:a78246", "xaxis": "x2", "yaxis": "y2", "showlegend": false }, { "line": { "color": "red", "width": 2 }, "mode": "lines", "name": "", "type": "scatter", "xsrc": "winsonchee199:35:95fe83", "ysrc": "winsonchee199:35:ad3830", "xaxis": "x2", "yaxis": "y2", "showlegend": false }, { "line": { "color": "red", "width": 2 }, "mode": "lines", "name": "", "type": "scatter", "xsrc": "winsonchee199:35:f12ead", "ysrc": "winsonchee199:35:244c33", "xaxis": "x2", "yaxis": "y2", "showlegend": false }, { "line": { "color": "red", "width": 2 }, "mode": "lines", "name": "", "type": "scatter", "xsrc": "winsonchee199:35:404ea4", "ysrc": "winsonchee199:35:3ef00c", "xaxis": "x2", "yaxis": "y2", "showlegend": false }, { "line": { "color": "red", "width": 2 }, "mode": "lines", "name": "", "type": "scatter", "xsrc": "winsonchee199:35:5e53f3", "ysrc": "winsonchee199:35:33c841", "xaxis": "x2", "yaxis": "y2", "showlegend": false }, { "line": { "color": "red", "width": 2 }, "mode": "lines", "name": "", "type": "scatter", "xsrc": "winsonchee199:35:4a0556", "ysrc": "winsonchee199:35:0592cb", "xaxis": "x2", "yaxis": "y2", "showlegend": false }, { "line": { "color": "red", "width": 2 }, "mode": "lines", "name": "", "type": "scatter", "xsrc": "winsonchee199:35:58126a", "ysrc": "winsonchee199:35:bbde0f", "xaxis": "x2", "yaxis": "y2", "showlegend": false }, { "line": { "color": "red", "width": 2 }, "mode": "lines", "name": "", "type": "scatter", "xsrc": "winsonchee199:35:d8a725", "ysrc": "winsonchee199:35:17735b", "xaxis": "x2", "yaxis": "y2", "showlegend": false }, { "line": { "color": "red", "width": 2 }, "mode": "lines", "name": "", "type": "scatter", "xsrc": "winsonchee199:35:0d27b3", "ysrc": "winsonchee199:35:e96dba", "xaxis": "x2", "yaxis": "y2", "showlegend": false }, { "line": { "color": "red", "width": 2 }, "mode": "lines", "name": "", "type": "scatter", "xsrc": "winsonchee199:35:7268f0", "ysrc": "winsonchee199:35:d0e699", "xaxis": "x2", "yaxis": "y2", "showlegend": false }, { "line": { "color": "red", "width": 2 }, "mode": "lines", "name": "", "type": "scatter", "xsrc": "winsonchee199:35:4526e4", "ysrc": "winsonchee199:35:241cad", "xaxis": "x2", "yaxis": "y2", "showlegend": false }, { "line": { "color": "red", "width": 2 }, "mode": "lines", "name": "", "type": "scatter", "xsrc": "winsonchee199:35:e27a44", "ysrc": "winsonchee199:35:54e189", "xaxis": "x2", "yaxis": "y2", "showlegend": false }, { "line": { "color": "red", "width": 2 }, "mode": "lines", "name": "", "type": "scatter", "xsrc": "winsonchee199:35:f0ccea", "ysrc": "winsonchee199:35:f07666", "xaxis": "x2", "yaxis": "y2", "showlegend": false }, { "line": { "color": "red", "width": 2 }, "mode": "lines", "name": "", "type": "scatter", "xsrc": "winsonchee199:35:1e6513", "ysrc": "winsonchee199:35:c18fcf", "xaxis": "x2", "yaxis": "y2", "showlegend": false }, { "line": { "color": "red", "width": 2 }, "mode": "lines", "name": "", "type": "scatter", "xsrc": "winsonchee199:35:ac1700", "ysrc": "winsonchee199:35:a91240", "xaxis": "x2", "yaxis": "y2", "showlegend": false }, { "line": { "color": "red", "width": 2 }, "mode": "lines", "name": "", "type": "scatter", "xsrc": "winsonchee199:35:59b169", "ysrc": "winsonchee199:35:fdbea8", "xaxis": "x2", "yaxis": "y2", "showlegend": false }, { "line": { "color": "red", "width": 2 }, "mode": "lines", "name": "", "type": "scatter", "xsrc": "winsonchee199:35:239790", "ysrc": "winsonchee199:35:16d260", "xaxis": "x2", "yaxis": "y2", "showlegend": false }, { "line": { "color": "red", "width": 2 }, "mode": "lines", "name": "", "type": "scatter", "xsrc": "winsonchee199:35:b6e8da", "ysrc": "winsonchee199:35:0dc571", "xaxis": "x2", "yaxis": "y2", "showlegend": false }, { "line": { "color": "red", "width": 2 }, "mode": "lines", "name": "", "type": "scatter", "xsrc": "winsonchee199:35:beb576", "ysrc": "winsonchee199:35:8505cc", "xaxis": "x2", "yaxis": "y2", "showlegend": false }, { "line": { "color": "red", "width": 2 }, "mode": "lines", "name": "", "type": "scatter", "xsrc": "winsonchee199:35:e79979", "ysrc": "winsonchee199:35:3a086c", "xaxis": "x2", "yaxis": "y2", "showlegend": false }, { "line": { "color": "red", "width": 2 }, "mode": "lines", "name": "", "type": "scatter", "xsrc": "winsonchee199:35:ffa6fb", "ysrc": "winsonchee199:35:8a482c", "xaxis": "x2", "yaxis": "y2", "showlegend": false }, { "line": { "color": "red", "width": 2 }, "mode": "lines", "name": "", "type": "scatter", "xsrc": "winsonchee199:35:3ae1ad", "ysrc": "winsonchee199:35:70088e", "xaxis": "x2", "yaxis": "y2", "showlegend": false }, { "line": { "color": "red", "width": 2 }, "mode": "lines", "name": "", "type": "scatter", "xsrc": "winsonchee199:35:8bc299", "ysrc": "winsonchee199:35:a4b9d0", "xaxis": "x2", "yaxis": "y2", "showlegend": false }, { "line": { "color": "red", "width": 2 }, "mode": "lines", "name": "", "type": "scatter", "xsrc": "winsonchee199:35:00364b", "ysrc": "winsonchee199:35:887643", "xaxis": "x2", "yaxis": "y2", "showlegend": false }, { "line": { "color": "red", "width": 2 }, "mode": "lines", "name": "", "type": "scatter", "xsrc": "winsonchee199:35:05dd18", "ysrc": "winsonchee199:35:a56ebc", "xaxis": "x2", "yaxis": "y2", "showlegend": false }, { "line": { "color": "red", "width": 2 }, "mode": "lines", "name": "", "type": "scatter", "xsrc": "winsonchee199:35:170b0c", "ysrc": "winsonchee199:35:2f0dd6", "xaxis": "x2", "yaxis": "y2", "showlegend": false }, { "line": { "color": "red", "width": 2 }, "mode": "lines", "name": "", "type": "scatter", "xsrc": "winsonchee199:35:a2ea5b", "ysrc": "winsonchee199:35:02b851", "xaxis": "x2", "yaxis": "y2", "showlegend": false }, { "line": { "color": "red", "width": 2 }, "mode": "lines", "name": "", "type": "scatter", "xsrc": "winsonchee199:35:67915e", "ysrc": "winsonchee199:35:60b8e4", "xaxis": "x2", "yaxis": "y2", "showlegend": false }, { "line": { "color": "red", "width": 2 }, "mode": "lines", "name": "", "type": "scatter", "xsrc": "winsonchee199:35:244e40", "ysrc": "winsonchee199:35:68b6c8", "xaxis": "x2", "yaxis": "y2", "showlegend": false }, { "line": { "color": "red", "width": 2 }, "mode": "lines", "name": "", "type": "scatter", "xsrc": "winsonchee199:35:4ad6f5", "ysrc": "winsonchee199:35:b4120f", "xaxis": "x2", "yaxis": "y2", "showlegend": false }, { "line": { "color": "red", "width": 2 }, "mode": "lines", "name": "", "type": "scatter", "xsrc": "winsonchee199:35:03e783", "ysrc": "winsonchee199:35:d7f079", "xaxis": "x2", "yaxis": "y2", "showlegend": false }, { "line": { "color": "red", "width": 2 }, "mode": "lines", "name": "", "type": "scatter", "xsrc": "winsonchee199:35:45e2c4", "ysrc": "winsonchee199:35:3f8ee7", "xaxis": "x2", "yaxis": "y2", "showlegend": false }, { "line": { "color": "red", "width": 2 }, "mode": "lines", "name": "", "type": "scatter", "xsrc": "winsonchee199:35:eb4f83", "ysrc": "winsonchee199:35:a7f52f", "xaxis": "x2", "yaxis": "y2", "showlegend": false }, { "line": { "width": 3 }, "mode": "lines", "name": "Cumulative PnL 3", "type": "scatter", "xsrc": "winsonchee199:35:8b32ec", "ysrc": "winsonchee199:35:2ea262", "xaxis": "x3", "yaxis": "y3" }, { "line": { "width": 3 }, "mode": "lines", "name": "Cumulative PnL 4", "type": "scatter", "xsrc": "winsonchee199:35:a9f29b", "ysrc": "winsonchee199:35:4ae04b", "xaxis": "x4", "yaxis": "y4" }, { "line": { "color": "red", "width": 2 }, "mode": "lines", "name": "", "type": "scatter", "xsrc": "winsonchee199:35:55e2dd", "ysrc": "winsonchee199:35:146a19", "xaxis": "x4", "yaxis": "y4", "showlegend": false }, { "line": { "color": "red", "width": 2 }, "mode": "lines", "name": "", "type": "scatter", "xsrc": "winsonchee199:35:867814", "ysrc": "winsonchee199:35:f36b8c", "xaxis": "x4", "yaxis": "y4", "showlegend": false }, { "line": { "color": "red", "width": 2 }, "mode": "lines", "name": "", "type": "scatter", "xsrc": "winsonchee199:35:99631e", "ysrc": "winsonchee199:35:1cf422", "xaxis": "x4", "yaxis": "y4", "showlegend": false }, { "line": { "color": "red", "width": 2 }, "mode": "lines", "name": "", "type": "scatter", "xsrc": "winsonchee199:35:1cecde", "ysrc": "winsonchee199:35:dd8d0c", "xaxis": "x4", "yaxis": "y4", "showlegend": false }, { "line": { "color": "red", "width": 2 }, "mode": "lines", "name": "", "type": "scatter", "xsrc": "winsonchee199:35:6f9b96", "ysrc": "winsonchee199:35:f062cc", "xaxis": "x4", "yaxis": "y4", "showlegend": false }, { "line": { "color": "red", "width": 2 }, "mode": "lines", "name": "", "type": "scatter", "xsrc": "winsonchee199:35:72fb95", "ysrc": "winsonchee199:35:47c250", "xaxis": "x4", "yaxis": "y4", "showlegend": false }, { "line": { "color": "red", "width": 2 }, "mode": "lines", "name": "", "type": "scatter", "xsrc": "winsonchee199:35:2f838c", "ysrc": "winsonchee199:35:b0e950", "xaxis": "x4", "yaxis": "y4", "showlegend": false }, { "line": { "color": "red", "width": 2 }, "mode": "lines", "name": "", "type": "scatter", "xsrc": "winsonchee199:35:c3a02d", "ysrc": "winsonchee199:35:0a2832", "xaxis": "x4", "yaxis": "y4", "showlegend": false }, { "line": { "width": 3 }, "mode": "lines", "name": "Cumulative PnL 5", "type": "scatter", "xsrc": "winsonchee199:35:0ff98d", "ysrc": "winsonchee199:35:85ad42", "xaxis": "x5", "yaxis": "y5" }, { "line": { "color": "red", "width": 2 }, "mode": "lines", "name": "", "type": "scatter", "xsrc": "winsonchee199:35:508acf", "ysrc": "winsonchee199:35:985cfa", "xaxis": "x5", "yaxis": "y5", "showlegend": false }, { "line": { "color": "red", "width": 2 }, "mode": "lines", "name": "", "type": "scatter", "xsrc": "winsonchee199:35:dc2fc9", "ysrc": "winsonchee199:35:ea9685", "xaxis": "x5", "yaxis": "y5", "showlegend": false }, { "line": { "color": "red", "width": 2 }, "mode": "lines", "name": "", "type": "scatter", "xsrc": "winsonchee199:35:e8419f", "ysrc": "winsonchee199:35:3ccbef", "xaxis": "x5", "yaxis": "y5", "showlegend": false }, { "line": { "color": "red", "width": 2 }, "mode": "lines", "name": "", "type": "scatter", "xsrc": "winsonchee199:35:50167b", "ysrc": "winsonchee199:35:2e63ee", "xaxis": "x5", "yaxis": "y5", "showlegend": false }, { "line": { "color": "red", "width": 2 }, "mode": "lines", "name": "", "type": "scatter", "xsrc": "winsonchee199:35:82cc8b", "ysrc": "winsonchee199:35:f3744a", "xaxis": "x5", "yaxis": "y5", "showlegend": false }, { "line": { "color": "red", "width": 2 }, "mode": "lines", "name": "", "type": "scatter", "xsrc": "winsonchee199:35:748102", "ysrc": "winsonchee199:35:c7de63", "xaxis": "x5", "yaxis": "y5", "showlegend": false }, { "line": { "color": "red", "width": 2 }, "mode": "lines", "name": "", "type": "scatter", "xsrc": "winsonchee199:35:76ff10", "ysrc": "winsonchee199:35:0323f3", "xaxis": "x5", "yaxis": "y5", "showlegend": false }, { "line": { "color": "red", "width": 2 }, "mode": "lines", "name": "", "type": "scatter", "xsrc": "winsonchee199:35:77ce4f", "ysrc": "winsonchee199:35:187c89", "xaxis": "x5", "yaxis": "y5", "showlegend": false }, { "line": { "color": "red", "width": 2 }, "mode": "lines", "name": "", "type": "scatter", "xsrc": "winsonchee199:35:2ea8d1", "ysrc": "winsonchee199:35:c5eb04", "xaxis": "x5", "yaxis": "y5", "showlegend": false }, { "line": { "color": "red", "width": 2 }, "mode": "lines", "name": "", "type": "scatter", "xsrc": "winsonchee199:35:eb4829", "ysrc": "winsonchee199:35:63ed48", "xaxis": "x5", "yaxis": "y5", "showlegend": false }, { "line": { "color": "red", "width": 2 }, "mode": "lines", "name": "", "type": "scatter", "xsrc": "winsonchee199:35:460c91", "ysrc": "winsonchee199:35:ce1e08", "xaxis": "x5", "yaxis": "y5", "showlegend": false }, { "line": { "color": "red", "width": 2 }, "mode": "lines", "name": "", "type": "scatter", "xsrc": "winsonchee199:35:5a6b08", "ysrc": "winsonchee199:35:4651bf", "xaxis": "x5", "yaxis": "y5", "showlegend": false }, { "line": { "color": "red", "width": 2 }, "mode": "lines", "name": "", "type": "scatter", "xsrc": "winsonchee199:35:de7beb", "ysrc": "winsonchee199:35:cb3c32", "xaxis": "x5", "yaxis": "y5", "showlegend": false }, { "line": { "color": "red", "width": 2 }, "mode": "lines", "name": "", "type": "scatter", "xsrc": "winsonchee199:35:3e6636", "ysrc": "winsonchee199:35:d707bb", "xaxis": "x5", "yaxis": "y5", "showlegend": false }, { "line": { "color": "red", "width": 2 }, "mode": "lines", "name": "", "type": "scatter", "xsrc": "winsonchee199:35:c378ff", "ysrc": "winsonchee199:35:6d6256", "xaxis": "x5", "yaxis": "y5", "showlegend": false }, { "line": { "color": "red", "width": 2 }, "mode": "lines", "name": "", "type": "scatter", "xsrc": "winsonchee199:35:7655b3", "ysrc": "winsonchee199:35:147553", "xaxis": "x5", "yaxis": "y5", "showlegend": false }, { "line": { "color": "red", "width": 2 }, "mode": "lines", "name": "", "type": "scatter", "xsrc": "winsonchee199:35:26512c", "ysrc": "winsonchee199:35:23bfe9", "xaxis": "x5", "yaxis": "y5", "showlegend": false }, { "line": { "color": "red", "width": 2 }, "mode": "lines", "name": "", "type": "scatter", "xsrc": "winsonchee199:35:f93307", "ysrc": "winsonchee199:35:1e43ba", "xaxis": "x5", "yaxis": "y5", "showlegend": false }, { "line": { "color": "red", "width": 2 }, "mode": "lines", "name": "", "type": "scatter", "xsrc": "winsonchee199:35:cb1f1f", "ysrc": "winsonchee199:35:cf23f5", "xaxis": "x5", "yaxis": "y5", "showlegend": false }, { "line": { "color": "red", "width": 2 }, "mode": "lines", "name": "", "type": "scatter", "xsrc": "winsonchee199:35:009588", "ysrc": "winsonchee199:35:e4b560", "xaxis": "x5", "yaxis": "y5", "showlegend": false }, { "line": { "color": "red", "width": 2 }, "mode": "lines", "name": "", "type": "scatter", "xsrc": "winsonchee199:35:d003a4", "ysrc": "winsonchee199:35:94c007", "xaxis": "x5", "yaxis": "y5", "showlegend": false }, { "line": { "color": "red", "width": 2 }, "mode": "lines", "name": "", "type": "scatter", "xsrc": "winsonchee199:35:2cf505", "ysrc": "winsonchee199:35:71967a", "xaxis": "x5", "yaxis": "y5", "showlegend": false }, { "line": { "color": "red", "width": 2 }, "mode": "lines", "name": "", "type": "scatter", "xsrc": "winsonchee199:35:90dcaa", "ysrc": "winsonchee199:35:f61e7b", "xaxis": "x5", "yaxis": "y5", "showlegend": false }, { "line": { "color": "red", "width": 2 }, "mode": "lines", "name": "", "type": "scatter", "xsrc": "winsonchee199:35:7aa69c", "ysrc": "winsonchee199:35:93fd5d", "xaxis": "x5", "yaxis": "y5", "showlegend": false }, { "line": { "color": "red", "width": 2 }, "mode": "lines", "name": "", "type": "scatter", "xsrc": "winsonchee199:35:80c530", "ysrc": "winsonchee199:35:07843f", "xaxis": "x5", "yaxis": "y5", "showlegend": false }, { "line": { "color": "red", "width": 2 }, "mode": "lines", "name": "", "type": "scatter", "xsrc": "winsonchee199:35:b79c70", "ysrc": "winsonchee199:35:fba442", "xaxis": "x5", "yaxis": "y5", "showlegend": false }, { "line": { "color": "red", "width": 2 }, "mode": "lines", "name": "", "type": "scatter", "xsrc": "winsonchee199:35:31ba89", "ysrc": "winsonchee199:35:e16267", "xaxis": "x5", "yaxis": "y5", "showlegend": false }, { "line": { "color": "red", "width": 2 }, "mode": "lines", "name": "", "type": "scatter", "xsrc": "winsonchee199:35:cd121d", "ysrc": "winsonchee199:35:30ae3a", "xaxis": "x5", "yaxis": "y5", "showlegend": false }, { "line": { "color": "red", "width": 2 }, "mode": "lines", "name": "", "type": "scatter", "xsrc": "winsonchee199:35:cb7554", "ysrc": "winsonchee199:35:7eaab8", "xaxis": "x5", "yaxis": "y5", "showlegend": false }, { "line": { "color": "red", "width": 2 }, "mode": "lines", "name": "", "type": "scatter", "xsrc": "winsonchee199:35:0947e3", "ysrc": "winsonchee199:35:11b8d6", "xaxis": "x5", "yaxis": "y5", "showlegend": false }, { "line": { "color": "red", "width": 2 }, "mode": "lines", "name": "", "type": "scatter", "xsrc": "winsonchee199:35:a22179", "ysrc": "winsonchee199:35:cb9b27", "xaxis": "x5", "yaxis": "y5", "showlegend": false }, { "line": { "color": "red", "width": 2 }, "mode": "lines", "name": "", "type": "scatter", "xsrc": "winsonchee199:35:4db77b", "ysrc": "winsonchee199:35:c17ef5", "xaxis": "x5", "yaxis": "y5", "showlegend": false }, { "line": { "color": "red", "width": 2 }, "mode": "lines", "name": "", "type": "scatter", "xsrc": "winsonchee199:35:c5035a", "ysrc": "winsonchee199:35:de0a8e", "xaxis": "x5", "yaxis": "y5", "showlegend": false }, { "line": { "color": "red", "width": 2 }, "mode": "lines", "name": "", "type": "scatter", "xsrc": "winsonchee199:35:0ed707", "ysrc": "winsonchee199:35:bae043", "xaxis": "x5", "yaxis": "y5", "showlegend": false }, { "line": { "color": "red", "width": 2 }, "mode": "lines", "name": "", "type": "scatter", "xsrc": "winsonchee199:35:75cbd7", "ysrc": "winsonchee199:35:48f7ae", "xaxis": "x5", "yaxis": "y5", "showlegend": false }, { "line": { "color": "red", "width": 2 }, "mode": "lines", "name": "", "type": "scatter", "xsrc": "winsonchee199:35:86b408", "ysrc": "winsonchee199:35:322ffb", "xaxis": "x5", "yaxis": "y5", "showlegend": false }, { "line": { "color": "red", "width": 2 }, "mode": "lines", "name": "", "type": "scatter", "xsrc": "winsonchee199:35:dfb74d", "ysrc": "winsonchee199:35:20ebc2", "xaxis": "x5", "yaxis": "y5", "showlegend": false }, { "line": { "color": "red", "width": 2 }, "mode": "lines", "name": "", "type": "scatter", "xsrc": "winsonchee199:35:68c86d", "ysrc": "winsonchee199:35:10b1a3", "xaxis": "x5", "yaxis": "y5", "showlegend": false }, { "line": { "color": "red", "width": 2 }, "mode": "lines", "name": "", "type": "scatter", "xsrc": "winsonchee199:35:6d9623", "ysrc": "winsonchee199:35:26da6d", "xaxis": "x5", "yaxis": "y5", "showlegend": false }, { "line": { "color": "red", "width": 2 }, "mode": "lines", "name": "", "type": "scatter", "xsrc": "winsonchee199:35:4775c6", "ysrc": "winsonchee199:35:0074ad", "xaxis": "x5", "yaxis": "y5", "showlegend": false }, { "line": { "color": "red", "width": 2 }, "mode": "lines", "name": "", "type": "scatter", "xsrc": "winsonchee199:35:b5b01b", "ysrc": "winsonchee199:35:76c84e", "xaxis": "x5", "yaxis": "y5", "showlegend": false }, { "line": { "color": "red", "width": 2 }, "mode": "lines", "name": "", "type": "scatter", "xsrc": "winsonchee199:35:c2a07e", "ysrc": "winsonchee199:35:d4a32b", "xaxis": "x5", "yaxis": "y5", "showlegend": false }, { "line": { "width": 3 }, "mode": "lines", "name": "Cumulative PnL 6", "type": "scatter", "xsrc": "winsonchee199:35:3d5891", "ysrc": "winsonchee199:35:5a7ada", "xaxis": "x6", "yaxis": "y6" }, { "line": { "color": "red", "width": 2 }, "mode": "lines", "name": "", "type": "scatter", "xsrc": "winsonchee199:35:03863b", "ysrc": "winsonchee199:35:0ce7ad", "xaxis": "x6", "yaxis": "y6", "showlegend": false }, { "line": { "color": "red", "width": 2 }, "mode": "lines", "name": "", "type": "scatter", "xsrc": "winsonchee199:35:b5d7ba", "ysrc": "winsonchee199:35:819999", "xaxis": "x6", "yaxis": "y6", "showlegend": false }, { "line": { "color": "red", "width": 2 }, "mode": "lines", "name": "", "type": "scatter", "xsrc": "winsonchee199:35:b83c07", "ysrc": "winsonchee199:35:c05557", "xaxis": "x6", "yaxis": "y6", "showlegend": false }, { "line": { "color": "red", "width": 2 }, "mode": "lines", "name": "", "type": "scatter", "xsrc": "winsonchee199:35:98d8c9", "ysrc": "winsonchee199:35:7c9916", "xaxis": "x6", "yaxis": "y6", "showlegend": false }, { "line": { "color": "red", "width": 2 }, "mode": "lines", "name": "", "type": "scatter", "xsrc": "winsonchee199:35:c7f85e", "ysrc": "winsonchee199:35:08ed59", "xaxis": "x6", "yaxis": "y6", "showlegend": false }, { "line": { "color": "red", "width": 2 }, "mode": "lines", "name": "", "type": "scatter", "xsrc": "winsonchee199:35:c4b707", "ysrc": "winsonchee199:35:6ca4d1", "xaxis": "x6", "yaxis": "y6", "showlegend": false }, { "line": { "color": "red", "width": 2 }, "mode": "lines", "name": "", "type": "scatter", "xsrc": "winsonchee199:35:b4746d", "ysrc": "winsonchee199:35:db82fd", "xaxis": "x6", "yaxis": "y6", "showlegend": false }, { "line": { "color": "red", "width": 2 }, "mode": "lines", "name": "", "type": "scatter", "xsrc": "winsonchee199:35:26a3b5", "ysrc": "winsonchee199:35:fddb2a", "xaxis": "x6", "yaxis": "y6", "showlegend": false }, { "line": { "color": "red", "width": 2 }, "mode": "lines", "name": "", "type": "scatter", "xsrc": "winsonchee199:35:ff4ae9", "ysrc": "winsonchee199:35:5443a0", "xaxis": "x6", "yaxis": "y6", "showlegend": false }, { "line": { "color": "red", "width": 2 }, "mode": "lines", "name": "", "type": "scatter", "xsrc": "winsonchee199:35:653c92", "ysrc": "winsonchee199:35:b3437d", "xaxis": "x6", "yaxis": "y6", "showlegend": false }, { "line": { "color": "red", "width": 2 }, "mode": "lines", "name": "", "type": "scatter", "xsrc": "winsonchee199:35:1c5b7e", "ysrc": "winsonchee199:35:8aabf6", "xaxis": "x6", "yaxis": "y6", "showlegend": false }, { "line": { "color": "red", "width": 2 }, "mode": "lines", "name": "", "type": "scatter", "xsrc": "winsonchee199:35:cb2678", "ysrc": "winsonchee199:35:57487a", "xaxis": "x6", "yaxis": "y6", "showlegend": false }, { "line": { "color": "red", "width": 2 }, "mode": "lines", "name": "", "type": "scatter", "xsrc": "winsonchee199:35:3cd662", "ysrc": "winsonchee199:35:362464", "xaxis": "x6", "yaxis": "y6", "showlegend": false }, { "line": { "color": "red", "width": 2 }, "mode": "lines", "name": "", "type": "scatter", "xsrc": "winsonchee199:35:228f05", "ysrc": "winsonchee199:35:5b1275", "xaxis": "x6", "yaxis": "y6", "showlegend": false }, { "line": { "color": "red", "width": 2 }, "mode": "lines", "name": "", "type": "scatter", "xsrc": "winsonchee199:35:25f89b", "ysrc": "winsonchee199:35:4decd8", "xaxis": "x6", "yaxis": "y6", "showlegend": false }, { "line": { "color": "red", "width": 2 }, "mode": "lines", "name": "", "type": "scatter", "xsrc": "winsonchee199:35:be747f", "ysrc": "winsonchee199:35:5bce69", "xaxis": "x6", "yaxis": "y6", "showlegend": false }, { "line": { "color": "red", "width": 2 }, "mode": "lines", "name": "", "type": "scatter", "xsrc": "winsonchee199:35:656838", "ysrc": "winsonchee199:35:36ade4", "xaxis": "x6", "yaxis": "y6", "showlegend": false }, { "line": { "color": "red", "width": 2 }, "mode": "lines", "name": "", "type": "scatter", "xsrc": "winsonchee199:35:e5e1e3", "ysrc": "winsonchee199:35:d1a5be", "xaxis": "x6", "yaxis": "y6", "showlegend": false }, { "line": { "color": "red", "width": 2 }, "mode": "lines", "name": "", "type": "scatter", "xsrc": "winsonchee199:35:91204b", "ysrc": "winsonchee199:35:93a232", "xaxis": "x6", "yaxis": "y6", "showlegend": false }, { "line": { "color": "red", "width": 2 }, "mode": "lines", "name": "", "type": "scatter", "xsrc": "winsonchee199:35:239d89", "ysrc": "winsonchee199:35:2131ce", "xaxis": "x6", "yaxis": "y6", "showlegend": false }, { "line": { "color": "red", "width": 2 }, "mode": "lines", "name": "", "type": "scatter", "xsrc": "winsonchee199:35:d3bc7c", "ysrc": "winsonchee199:35:908f79", "xaxis": "x6", "yaxis": "y6", "showlegend": false }, { "line": { "color": "red", "width": 2 }, "mode": "lines", "name": "", "type": "scatter", "xsrc": "winsonchee199:35:730bd8", "ysrc": "winsonchee199:35:e5fc9c", "xaxis": "x6", "yaxis": "y6", "showlegend": false }, { "line": { "color": "red", "width": 2 }, "mode": "lines", "name": "", "type": "scatter", "xsrc": "winsonchee199:35:45b7c7", "ysrc": "winsonchee199:35:7d7020", "xaxis": "x6", "yaxis": "y6", "showlegend": false }, { "line": { "color": "red", "width": 2 }, "mode": "lines", "name": "", "type": "scatter", "xsrc": "winsonchee199:35:ccd57a", "ysrc": "winsonchee199:35:ed6e16", "xaxis": "x6", "yaxis": "y6", "showlegend": false }, { "line": { "color": "red", "width": 2 }, "mode": "lines", "name": "", "type": "scatter", "xsrc": "winsonchee199:35:a0b43e", "ysrc": "winsonchee199:35:61edf2", "xaxis": "x6", "yaxis": "y6", "showlegend": false }, { "line": { "color": "red", "width": 2 }, "mode": "lines", "name": "", "type": "scatter", "xsrc": "winsonchee199:35:d503fe", "ysrc": "winsonchee199:35:a0c492", "xaxis": "x6", "yaxis": "y6", "showlegend": false }, { "line": { "color": "red", "width": 2 }, "mode": "lines", "name": "", "type": "scatter", "xsrc": "winsonchee199:35:11a329", "ysrc": "winsonchee199:35:84664c", "xaxis": "x6", "yaxis": "y6", "showlegend": false }, { "line": { "color": "red", "width": 2 }, "mode": "lines", "name": "", "type": "scatter", "xsrc": "winsonchee199:35:f6965a", "ysrc": "winsonchee199:35:7765e3", "xaxis": "x6", "yaxis": "y6", "showlegend": false }, { "line": { "color": "red", "width": 2 }, "mode": "lines", "name": "", "type": "scatter", "xsrc": "winsonchee199:35:3bbb2c", "ysrc": "winsonchee199:35:05907a", "xaxis": "x6", "yaxis": "y6", "showlegend": false }, { "line": { "color": "red", "width": 2 }, "mode": "lines", "name": "", "type": "scatter", "xsrc": "winsonchee199:35:d7a7e3", "ysrc": "winsonchee199:35:f50879", "xaxis": "x6", "yaxis": "y6", "showlegend": false }, { "line": { "color": "red", "width": 2 }, "mode": "lines", "name": "", "type": "scatter", "xsrc": "winsonchee199:35:901176", "ysrc": "winsonchee199:35:a265e8", "xaxis": "x6", "yaxis": "y6", "showlegend": false }, { "line": { "color": "red", "width": 2 }, "mode": "lines", "name": "", "type": "scatter", "xsrc": "winsonchee199:35:abc06e", "ysrc": "winsonchee199:35:4344c9", "xaxis": "x6", "yaxis": "y6", "showlegend": false }, { "line": { "color": "red", "width": 2 }, "mode": "lines", "name": "", "type": "scatter", "xsrc": "winsonchee199:35:d4a925", "ysrc": "winsonchee199:35:010815", "xaxis": "x6", "yaxis": "y6", "showlegend": false }, { "line": { "color": "red", "width": 2 }, "mode": "lines", "name": "", "type": "scatter", "xsrc": "winsonchee199:35:1044c8", "ysrc": "winsonchee199:35:1691c2", "xaxis": "x6", "yaxis": "y6", "showlegend": false }, { "line": { "color": "red", "width": 2 }, "mode": "lines", "name": "", "type": "scatter", "xsrc": "winsonchee199:35:f21390", "ysrc": "winsonchee199:35:dd9a37", "xaxis": "x6", "yaxis": "y6", "showlegend": false }, { "line": { "color": "red", "width": 2 }, "mode": "lines", "name": "", "type": "scatter", "xsrc": "winsonchee199:35:dde086", "ysrc": "winsonchee199:35:30159c", "xaxis": "x6", "yaxis": "y6", "showlegend": false }, { "line": { "color": "red", "width": 2 }, "mode": "lines", "name": "", "type": "scatter", "xsrc": "winsonchee199:35:64d973", "ysrc": "winsonchee199:35:89a4a7", "xaxis": "x6", "yaxis": "y6", "showlegend": false }, { "line": { "color": "red", "width": 2 }, "mode": "lines", "name": "", "type": "scatter", "xsrc": "winsonchee199:35:93ced1", "ysrc": "winsonchee199:35:849434", "xaxis": "x6", "yaxis": "y6", "showlegend": false }, { "line": { "color": "red", "width": 2 }, "mode": "lines", "name": "", "type": "scatter", "xsrc": "winsonchee199:35:18fc8b", "ysrc": "winsonchee199:35:fd68f0", "xaxis": "x6", "yaxis": "y6", "showlegend": false }, { "line": { "color": "red", "width": 2 }, "mode": "lines", "name": "", "type": "scatter", "xsrc": "winsonchee199:35:5fcf96", "ysrc": "winsonchee199:35:6f9f38", "xaxis": "x6", "yaxis": "y6", "showlegend": false }, { "line": { "color": "red", "width": 2 }, "mode": "lines", "name": "", "type": "scatter", "xsrc": "winsonchee199:35:d7e103", "ysrc": "winsonchee199:35:57ca36", "xaxis": "x6", "yaxis": "y6", "showlegend": false }, { "line": { "color": "red", "width": 2 }, "mode": "lines", "name": "", "type": "scatter", "xsrc": "winsonchee199:35:338a2a", "ysrc": "winsonchee199:35:c4ff1c", "xaxis": "x6", "yaxis": "y6", "showlegend": false }, { "line": { "color": "red", "width": 2 }, "mode": "lines", "name": "", "type": "scatter", "xsrc": "winsonchee199:35:ca2982", "ysrc": "winsonchee199:35:99d048", "xaxis": "x6", "yaxis": "y6", "showlegend": false }, { "line": { "color": "red", "width": 2 }, "mode": "lines", "name": "", "type": "scatter", "xsrc": "winsonchee199:35:c250a5", "ysrc": "winsonchee199:35:760dbe", "xaxis": "x6", "yaxis": "y6", "showlegend": false }, { "line": { "color": "red", "width": 2 }, "mode": "lines", "name": "", "type": "scatter", "xsrc": "winsonchee199:35:4a853f", "ysrc": "winsonchee199:35:d218ec", "xaxis": "x6", "yaxis": "y6", "showlegend": false }, { "line": { "color": "red", "width": 2 }, "mode": "lines", "name": "", "type": "scatter", "xsrc": "winsonchee199:35:87834c", "ysrc": "winsonchee199:35:1dc7bd", "xaxis": "x6", "yaxis": "y6", "showlegend": false }, { "line": { "color": "red", "width": 2 }, "mode": "lines", "name": "", "type": "scatter", "xsrc": "winsonchee199:35:148034", "ysrc": "winsonchee199:35:42779f", "xaxis": "x6", "yaxis": "y6", "showlegend": false }, { "line": { "width": 3 }, "mode": "lines", "name": "Cumulative PnL 7", "type": "scatter", "xsrc": "winsonchee199:35:d7c699", "ysrc": "winsonchee199:35:476ddc", "xaxis": "x7", "yaxis": "y7" }, { "line": { "color": "red", "width": 2 }, "mode": "lines", "name": "", "type": "scatter", "xsrc": "winsonchee199:35:fb2cc0", "ysrc": "winsonchee199:35:3743a8", "xaxis": "x7", "yaxis": "y7", "showlegend": false }, { "line": { "width": 3 }, "mode": "lines", "name": "Cumulative PnL 8", "type": "scatter", "xsrc": "winsonchee199:35:1e874c", "ysrc": "winsonchee199:35:db53b0", "xaxis": "x8", "yaxis": "y8" }, { "line": { "color": "red", "width": 2 }, "mode": "lines", "name": "", "type": "scatter", "xsrc": "winsonchee199:35:f20e8d", "ysrc": "winsonchee199:35:ca301a", "xaxis": "x8", "yaxis": "y8", "showlegend": false }, { "line": { "color": "red", "width": 2 }, "mode": "lines", "name": "", "type": "scatter", "xsrc": "winsonchee199:35:111469", "ysrc": "winsonchee199:35:f75b08", "xaxis": "x8", "yaxis": "y8", "showlegend": false }, { "line": { "color": "red", "width": 2 }, "mode": "lines", "name": "", "type": "scatter", "xsrc": "winsonchee199:35:39a0e7", "ysrc": "winsonchee199:35:97b1c9", "xaxis": "x8", "yaxis": "y8", "showlegend": false }, { "line": { "color": "red", "width": 2 }, "mode": "lines", "name": "", "type": "scatter", "xsrc": "winsonchee199:35:73ccc0", "ysrc": "winsonchee199:35:8fa650", "xaxis": "x8", "yaxis": "y8", "showlegend": false }, { "line": { "color": "red", "width": 2 }, "mode": "lines", "name": "", "type": "scatter", "xsrc": "winsonchee199:35:6a718c", "ysrc": "winsonchee199:35:489e07", "xaxis": "x8", "yaxis": "y8", "showlegend": false }, { "line": { "color": "red", "width": 2 }, "mode": "lines", "name": "", "type": "scatter", "xsrc": "winsonchee199:35:0b3d9f", "ysrc": "winsonchee199:35:bd76f7", "xaxis": "x8", "yaxis": "y8", "showlegend": false }, { "line": { "color": "red", "width": 2 }, "mode": "lines", "name": "", "type": "scatter", "xsrc": "winsonchee199:35:0a9db1", "ysrc": "winsonchee199:35:4d55f8", "xaxis": "x8", "yaxis": "y8", "showlegend": false }, { "line": { "color": "red", "width": 2 }, "mode": "lines", "name": "", "type": "scatter", "xsrc": "winsonchee199:35:68d79b", "ysrc": "winsonchee199:35:b16361", "xaxis": "x8", "yaxis": "y8", "showlegend": false }, { "line": { "color": "red", "width": 2 }, "mode": "lines", "name": "", "type": "scatter", "xsrc": "winsonchee199:35:4cd9b5", "ysrc": "winsonchee199:35:26dcc4", "xaxis": "x8", "yaxis": "y8", "showlegend": false }, { "line": { "color": "red", "width": 2 }, "mode": "lines", "name": "", "type": "scatter", "xsrc": "winsonchee199:35:9d3e42", "ysrc": "winsonchee199:35:15e3b2", "xaxis": "x8", "yaxis": "y8", "showlegend": false }, { "line": { "color": "red", "width": 2 }, "mode": "lines", "name": "", "type": "scatter", "xsrc": "winsonchee199:35:032834", "ysrc": "winsonchee199:35:bc1294", "xaxis": "x8", "yaxis": "y8", "showlegend": false }, { "line": { "color": "red", "width": 2 }, "mode": "lines", "name": "", "type": "scatter", "xsrc": "winsonchee199:35:8e7c48", "ysrc": "winsonchee199:35:ad600d", "xaxis": "x8", "yaxis": "y8", "showlegend": false }, { "line": { "color": "red", "width": 2 }, "mode": "lines", "name": "", "type": "scatter", "xsrc": "winsonchee199:35:0aaad4", "ysrc": "winsonchee199:35:f630ec", "xaxis": "x8", "yaxis": "y8", "showlegend": false }, { "line": { "color": "red", "width": 2 }, "mode": "lines", "name": "", "type": "scatter", "xsrc": "winsonchee199:35:6db840", "ysrc": "winsonchee199:35:c583fd", "xaxis": "x8", "yaxis": "y8", "showlegend": false }, { "line": { "color": "red", "width": 2 }, "mode": "lines", "name": "", "type": "scatter", "xsrc": "winsonchee199:35:9798e5", "ysrc": "winsonchee199:35:b80c57", "xaxis": "x8", "yaxis": "y8", "showlegend": false }, { "line": { "color": "red", "width": 2 }, "mode": "lines", "name": "", "type": "scatter", "xsrc": "winsonchee199:35:f83be8", "ysrc": "winsonchee199:35:09c8de", "xaxis": "x8", "yaxis": "y8", "showlegend": false }, { "line": { "color": "red", "width": 2 }, "mode": "lines", "name": "", "type": "scatter", "xsrc": "winsonchee199:35:8276b8", "ysrc": "winsonchee199:35:f2039f", "xaxis": "x8", "yaxis": "y8", "showlegend": false }, { "line": { "color": "red", "width": 2 }, "mode": "lines", "name": "", "type": "scatter", "xsrc": "winsonchee199:35:083b0f", "ysrc": "winsonchee199:35:cd92aa", "xaxis": "x8", "yaxis": "y8", "showlegend": false }, { "line": { "color": "red", "width": 2 }, "mode": "lines", "name": "", "type": "scatter", "xsrc": "winsonchee199:35:8db4de", "ysrc": "winsonchee199:35:05b5ef", "xaxis": "x8", "yaxis": "y8", "showlegend": false }, { "line": { "color": "red", "width": 2 }, "mode": "lines", "name": "", "type": "scatter", "xsrc": "winsonchee199:35:a4d34e", "ysrc": "winsonchee199:35:4619ae", "xaxis": "x8", "yaxis": "y8", "showlegend": false }, { "line": { "color": "red", "width": 2 }, "mode": "lines", "name": "", "type": "scatter", "xsrc": "winsonchee199:35:de0c66", "ysrc": "winsonchee199:35:1c0c3d", "xaxis": "x8", "yaxis": "y8", "showlegend": false }, { "line": { "color": "red", "width": 2 }, "mode": "lines", "name": "", "type": "scatter", "xsrc": "winsonchee199:35:05bfac", "ysrc": "winsonchee199:35:87d039", "xaxis": "x8", "yaxis": "y8", "showlegend": false }, { "line": { "color": "red", "width": 2 }, "mode": "lines", "name": "", "type": "scatter", "xsrc": "winsonchee199:35:d59644", "ysrc": "winsonchee199:35:8b33cb", "xaxis": "x8", "yaxis": "y8", "showlegend": false }, { "line": { "color": "red", "width": 2 }, "mode": "lines", "name": "", "type": "scatter", "xsrc": "winsonchee199:35:05f076", "ysrc": "winsonchee199:35:54e170", "xaxis": "x8", "yaxis": "y8", "showlegend": false }, { "line": { "color": "red", "width": 2 }, "mode": "lines", "name": "", "type": "scatter", "xsrc": "winsonchee199:35:21654c", "ysrc": "winsonchee199:35:f26d82", "xaxis": "x8", "yaxis": "y8", "showlegend": false }, { "line": { "color": "red", "width": 2 }, "mode": "lines", "name": "", "type": "scatter", "xsrc": "winsonchee199:35:1f013e", "ysrc": "winsonchee199:35:5c863a", "xaxis": "x8", "yaxis": "y8", "showlegend": false }, { "line": { "color": "red", "width": 2 }, "mode": "lines", "name": "", "type": "scatter", "xsrc": "winsonchee199:35:3c4ac2", "ysrc": "winsonchee199:35:83c29b", "xaxis": "x8", "yaxis": "y8", "showlegend": false }, { "line": { "color": "red", "width": 2 }, "mode": "lines", "name": "", "type": "scatter", "xsrc": "winsonchee199:35:3eeb70", "ysrc": "winsonchee199:35:979fb7", "xaxis": "x8", "yaxis": "y8", "showlegend": false }, { "line": { "color": "red", "width": 2 }, "mode": "lines", "name": "", "type": "scatter", "xsrc": "winsonchee199:35:c9d083", "ysrc": "winsonchee199:35:a52ccc", "xaxis": "x8", "yaxis": "y8", "showlegend": false }, { "line": { "color": "red", "width": 2 }, "mode": "lines", "name": "", "type": "scatter", "xsrc": "winsonchee199:35:7b0da2", "ysrc": "winsonchee199:35:86ab4f", "xaxis": "x8", "yaxis": "y8", "showlegend": false }, { "line": { "color": "red", "width": 2 }, "mode": "lines", "name": "", "type": "scatter", "xsrc": "winsonchee199:35:b3ca6b", "ysrc": "winsonchee199:35:802dfe", "xaxis": "x8", "yaxis": "y8", "showlegend": false }, { "line": { "color": "red", "width": 2 }, "mode": "lines", "name": "", "type": "scatter", "xsrc": "winsonchee199:35:cd62cc", "ysrc": "winsonchee199:35:66d0cd", "xaxis": "x8", "yaxis": "y8", "showlegend": false }, { "line": { "color": "red", "width": 2 }, "mode": "lines", "name": "", "type": "scatter", "xsrc": "winsonchee199:35:58085d", "ysrc": "winsonchee199:35:7e813e", "xaxis": "x8", "yaxis": "y8", "showlegend": false }, { "line": { "color": "red", "width": 2 }, "mode": "lines", "name": "", "type": "scatter", "xsrc": "winsonchee199:35:573507", "ysrc": "winsonchee199:35:49c776", "xaxis": "x8", "yaxis": "y8", "showlegend": false }, { "line": { "color": "red", "width": 2 }, "mode": "lines", "name": "", "type": "scatter", "xsrc": "winsonchee199:35:39b051", "ysrc": "winsonchee199:35:7c99a2", "xaxis": "x8", "yaxis": "y8", "showlegend": false }, { "line": { "color": "red", "width": 2 }, "mode": "lines", "name": "", "type": "scatter", "xsrc": "winsonchee199:35:9938c3", "ysrc": "winsonchee199:35:94d121", "xaxis": "x8", "yaxis": "y8", "showlegend": false }, { "line": { "color": "red", "width": 2 }, "mode": "lines", "name": "", "type": "scatter", "xsrc": "winsonchee199:35:3ef9f6", "ysrc": "winsonchee199:35:336ad8", "xaxis": "x8", "yaxis": "y8", "showlegend": false }, { "line": { "color": "red", "width": 2 }, "mode": "lines", "name": "", "type": "scatter", "xsrc": "winsonchee199:35:91d54c", "ysrc": "winsonchee199:35:9102d6", "xaxis": "x8", "yaxis": "y8", "showlegend": false }, { "line": { "color": "red", "width": 2 }, "mode": "lines", "name": "", "type": "scatter", "xsrc": "winsonchee199:35:6c5487", "ysrc": "winsonchee199:35:983753", "xaxis": "x8", "yaxis": "y8", "showlegend": false }, { "line": { "color": "red", "width": 2 }, "mode": "lines", "name": "", "type": "scatter", "xsrc": "winsonchee199:35:daf734", "ysrc": "winsonchee199:35:f840c4", "xaxis": "x8", "yaxis": "y8", "showlegend": false }, { "line": { "color": "red", "width": 2 }, "mode": "lines", "name": "", "type": "scatter", "xsrc": "winsonchee199:35:e4410f", "ysrc": "winsonchee199:35:f7d16a", "xaxis": "x8", "yaxis": "y8", "showlegend": false }, { "line": { "color": "red", "width": 2 }, "mode": "lines", "name": "", "type": "scatter", "xsrc": "winsonchee199:35:f5ee02", "ysrc": "winsonchee199:35:5ec282", "xaxis": "x8", "yaxis": "y8", "showlegend": false }, { "line": { "color": "red", "width": 2 }, "mode": "lines", "name": "", "type": "scatter", "xsrc": "winsonchee199:35:fe8ce0", "ysrc": "winsonchee199:35:056634", "xaxis": "x8", "yaxis": "y8", "showlegend": false }, { "line": { "color": "red", "width": 2 }, "mode": "lines", "name": "", "type": "scatter", "xsrc": "winsonchee199:35:d21005", "ysrc": "winsonchee199:35:c06943", "xaxis": "x8", "yaxis": "y8", "showlegend": false }, { "line": { "color": "red", "width": 2 }, "mode": "lines", "name": "", "type": "scatter", "xsrc": "winsonchee199:35:dd2ade", "ysrc": "winsonchee199:35:7de680", "xaxis": "x8", "yaxis": "y8", "showlegend": false }, { "line": { "color": "red", "width": 2 }, "mode": "lines", "name": "", "type": "scatter", "xsrc": "winsonchee199:35:9359c4", "ysrc": "winsonchee199:35:cd9250", "xaxis": "x8", "yaxis": "y8", "showlegend": false }, { "line": { "color": "red", "width": 2 }, "mode": "lines", "name": "", "type": "scatter", "xsrc": "winsonchee199:35:d7e959", "ysrc": "winsonchee199:35:783d12", "xaxis": "x8", "yaxis": "y8", "showlegend": false }, { "line": { "color": "red", "width": 2 }, "mode": "lines", "name": "", "type": "scatter", "xsrc": "winsonchee199:35:cda2be", "ysrc": "winsonchee199:35:8d528a", "xaxis": "x8", "yaxis": "y8", "showlegend": false }, { "line": { "color": "red", "width": 2 }, "mode": "lines", "name": "", "type": "scatter", "xsrc": "winsonchee199:35:dfdd97", "ysrc": "winsonchee199:35:827419", "xaxis": "x8", "yaxis": "y8", "showlegend": false }, { "line": { "color": "red", "width": 2 }, "mode": "lines", "name": "", "type": "scatter", "xsrc": "winsonchee199:35:5c8e8d", "ysrc": "winsonchee199:35:700597", "xaxis": "x8", "yaxis": "y8", "showlegend": false }, { "line": { "color": "red", "width": 2 }, "mode": "lines", "name": "", "type": "scatter", "xsrc": "winsonchee199:35:5b7790", "ysrc": "winsonchee199:35:762c1a", "xaxis": "x8", "yaxis": "y8", "showlegend": false }, { "line": { "color": "red", "width": 2 }, "mode": "lines", "name": "", "type": "scatter", "xsrc": "winsonchee199:35:47d073", "ysrc": "winsonchee199:35:1d20a5", "xaxis": "x8", "yaxis": "y8", "showlegend": false }, { "line": { "color": "red", "width": 2 }, "mode": "lines", "name": "", "type": "scatter", "xsrc": "winsonchee199:35:c83b87", "ysrc": "winsonchee199:35:1cf2b0", "xaxis": "x8", "yaxis": "y8", "showlegend": false }, { "line": { "color": "red", "width": 2 }, "mode": "lines", "name": "", "type": "scatter", "xsrc": "winsonchee199:35:45098e", "ysrc": "winsonchee199:35:9a741b", "xaxis": "x8", "yaxis": "y8", "showlegend": false }, { "line": { "color": "red", "width": 2 }, "mode": "lines", "name": "", "type": "scatter", "xsrc": "winsonchee199:35:1af54e", "ysrc": "winsonchee199:35:38450c", "xaxis": "x8", "yaxis": "y8", "showlegend": false }, { "line": { "color": "red", "width": 2 }, "mode": "lines", "name": "", "type": "scatter", "xsrc": "winsonchee199:35:a51510", "ysrc": "winsonchee199:35:005ac5", "xaxis": "x8", "yaxis": "y8", "showlegend": false }, { "line": { "color": "red", "width": 2 }, "mode": "lines", "name": "", "type": "scatter", "xsrc": "winsonchee199:35:120952", "ysrc": "winsonchee199:35:aeb629", "xaxis": "x8", "yaxis": "y8", "showlegend": false }, { "line": { "color": "red", "width": 2 }, "mode": "lines", "name": "", "type": "scatter", "xsrc": "winsonchee199:35:66bb61", "ysrc": "winsonchee199:35:5dedb1", "xaxis": "x8", "yaxis": "y8", "showlegend": false }, { "line": { "color": "red", "width": 2 }, "mode": "lines", "name": "", "type": "scatter", "xsrc": "winsonchee199:35:6a704e", "ysrc": "winsonchee199:35:7916e9", "xaxis": "x8", "yaxis": "y8", "showlegend": false }, { "line": { "color": "red", "width": 2 }, "mode": "lines", "name": "", "type": "scatter", "xsrc": "winsonchee199:35:e495e7", "ysrc": "winsonchee199:35:faa4a4", "xaxis": "x8", "yaxis": "y8", "showlegend": false }, { "line": { "color": "red", "width": 2 }, "mode": "lines", "name": "", "type": "scatter", "xsrc": "winsonchee199:35:7cc917", "ysrc": "winsonchee199:35:6a062c", "xaxis": "x8", "yaxis": "y8", "showlegend": false }, { "line": { "color": "red", "width": 2 }, "mode": "lines", "name": "", "type": "scatter", "xsrc": "winsonchee199:35:e6d020", "ysrc": "winsonchee199:35:07970d", "xaxis": "x8", "yaxis": "y8", "showlegend": false }, { "line": { "color": "red", "width": 2 }, "mode": "lines", "name": "", "type": "scatter", "xsrc": "winsonchee199:35:2610dd", "ysrc": "winsonchee199:35:b22d25", "xaxis": "x8", "yaxis": "y8", "showlegend": false }, { "line": { "color": "red", "width": 2 }, "mode": "lines", "name": "", "type": "scatter", "xsrc": "winsonchee199:35:3da2cd", "ysrc": "winsonchee199:35:02eb7e", "xaxis": "x8", "yaxis": "y8", "showlegend": false }, { "line": { "color": "red", "width": 2 }, "mode": "lines", "name": "", "type": "scatter", "xsrc": "winsonchee199:35:d3d76a", "ysrc": "winsonchee199:35:cc0063", "xaxis": "x8", "yaxis": "y8", "showlegend": false }, { "line": { "color": "red", "width": 2 }, "mode": "lines", "name": "", "type": "scatter", "xsrc": "winsonchee199:35:fba20e", "ysrc": "winsonchee199:35:ea4a32", "xaxis": "x8", "yaxis": "y8", "showlegend": false }, { "line": { "color": "red", "width": 2 }, "mode": "lines", "name": "", "type": "scatter", "xsrc": "winsonchee199:35:f5859c", "ysrc": "winsonchee199:35:441e96", "xaxis": "x8", "yaxis": "y8", "showlegend": false }, { "line": { "color": "red", "width": 2 }, "mode": "lines", "name": "", "type": "scatter", "xsrc": "winsonchee199:35:ddd76b", "ysrc": "winsonchee199:35:bb09f0", "xaxis": "x8", "yaxis": "y8", "showlegend": false }, { "line": { "color": "red", "width": 2 }, "mode": "lines", "name": "", "type": "scatter", "xsrc": "winsonchee199:35:dbbd56", "ysrc": "winsonchee199:35:809a87", "xaxis": "x8", "yaxis": "y8", "showlegend": false }, { "line": { "color": "red", "width": 2 }, "mode": "lines", "name": "", "type": "scatter", "xsrc": "winsonchee199:35:7fc227", "ysrc": "winsonchee199:35:ee75e9", "xaxis": "x8", "yaxis": "y8", "showlegend": false }, { "line": { "color": "red", "width": 2 }, "mode": "lines", "name": "", "type": "scatter", "xsrc": "winsonchee199:35:241e43", "ysrc": "winsonchee199:35:7f7d68", "xaxis": "x8", "yaxis": "y8", "showlegend": false }, { "line": { "color": "red", "width": 2 }, "mode": "lines", "name": "", "type": "scatter", "xsrc": "winsonchee199:35:d0a8a6", "ysrc": "winsonchee199:35:cfe66a", "xaxis": "x8", "yaxis": "y8", "showlegend": false }, { "line": { "color": "red", "width": 2 }, "mode": "lines", "name": "", "type": "scatter", "xsrc": "winsonchee199:35:40dec8", "ysrc": "winsonchee199:35:525cf9", "xaxis": "x8", "yaxis": "y8", "showlegend": false }, { "line": { "color": "red", "width": 2 }, "mode": "lines", "name": "", "type": "scatter", "xsrc": "winsonchee199:35:e5d183", "ysrc": "winsonchee199:35:41247e", "xaxis": "x8", "yaxis": "y8", "showlegend": false }, { "line": { "color": "red", "width": 2 }, "mode": "lines", "name": "", "type": "scatter", "xsrc": "winsonchee199:35:8cb9bb", "ysrc": "winsonchee199:35:750113", "xaxis": "x8", "yaxis": "y8", "showlegend": false }, { "line": { "color": "red", "width": 2 }, "mode": "lines", "name": "", "type": "scatter", "xsrc": "winsonchee199:35:ec188d", "ysrc": "winsonchee199:35:277773", "xaxis": "x8", "yaxis": "y8", "showlegend": false }, { "line": { "color": "red", "width": 2 }, "mode": "lines", "name": "", "type": "scatter", "xsrc": "winsonchee199:35:a581c9", "ysrc": "winsonchee199:35:d30a03", "xaxis": "x8", "yaxis": "y8", "showlegend": false }, { "line": { "color": "red", "width": 2 }, "mode": "lines", "name": "", "type": "scatter", "xsrc": "winsonchee199:35:aa8af5", "ysrc": "winsonchee199:35:0594ad", "xaxis": "x8", "yaxis": "y8", "showlegend": false }, { "line": { "color": "red", "width": 2 }, "mode": "lines", "name": "", "type": "scatter", "xsrc": "winsonchee199:35:4773a8", "ysrc": "winsonchee199:35:9cae2d", "xaxis": "x8", "yaxis": "y8", "showlegend": false }, { "line": { "color": "red", "width": 2 }, "mode": "lines", "name": "", "type": "scatter", "xsrc": "winsonchee199:35:461231", "ysrc": "winsonchee199:35:dd4ec6", "xaxis": "x8", "yaxis": "y8", "showlegend": false }, { "line": { "color": "red", "width": 2 }, "mode": "lines", "name": "", "type": "scatter", "xsrc": "winsonchee199:35:704080", "ysrc": "winsonchee199:35:0c182c", "xaxis": "x8", "yaxis": "y8", "showlegend": false }, { "line": { "color": "red", "width": 2 }, "mode": "lines", "name": "", "type": "scatter", "xsrc": "winsonchee199:35:aa4446", "ysrc": "winsonchee199:35:b69652", "xaxis": "x8", "yaxis": "y8", "showlegend": false }, { "line": { "color": "red", "width": 2 }, "mode": "lines", "name": "", "type": "scatter", "xsrc": "winsonchee199:35:9fc297", "ysrc": "winsonchee199:35:7825ac", "xaxis": "x8", "yaxis": "y8", "showlegend": false }, { "line": { "color": "red", "width": 2 }, "mode": "lines", "name": "", "type": "scatter", "xsrc": "winsonchee199:35:fe4ae3", "ysrc": "winsonchee199:35:dbcfd3", "xaxis": "x8", "yaxis": "y8", "showlegend": false }, { "line": { "color": "red", "width": 2 }, "mode": "lines", "name": "", "type": "scatter", "xsrc": "winsonchee199:35:0d85e5", "ysrc": "winsonchee199:35:40b95b", "xaxis": "x8", "yaxis": "y8", "showlegend": false }, { "line": { "color": "red", "width": 2 }, "mode": "lines", "name": "", "type": "scatter", "xsrc": "winsonchee199:35:900e68", "ysrc": "winsonchee199:35:90ee07", "xaxis": "x8", "yaxis": "y8", "showlegend": false }, { "line": { "color": "red", "width": 2 }, "mode": "lines", "name": "", "type": "scatter", "xsrc": "winsonchee199:35:f4ebbf", "ysrc": "winsonchee199:35:38d0b7", "xaxis": "x8", "yaxis": "y8", "showlegend": false }, { "line": { "color": "red", "width": 2 }, "mode": "lines", "name": "", "type": "scatter", "xsrc": "winsonchee199:35:e7c33e", "ysrc": "winsonchee199:35:ed3f41", "xaxis": "x8", "yaxis": "y8", "showlegend": false }, { "line": { "color": "red", "width": 2 }, "mode": "lines", "name": "", "type": "scatter", "xsrc": "winsonchee199:35:d8994c", "ysrc": "winsonchee199:35:19d40f", "xaxis": "x8", "yaxis": "y8", "showlegend": false }, { "line": { "color": "red", "width": 2 }, "mode": "lines", "name": "", "type": "scatter", "xsrc": "winsonchee199:35:93ee20", "ysrc": "winsonchee199:35:125f47", "xaxis": "x8", "yaxis": "y8", "showlegend": false }, { "line": { "color": "red", "width": 2 }, "mode": "lines", "name": "", "type": "scatter", "xsrc": "winsonchee199:35:648656", "ysrc": "winsonchee199:35:ba48aa", "xaxis": "x8", "yaxis": "y8", "showlegend": false }, { "line": { "color": "red", "width": 2 }, "mode": "lines", "name": "", "type": "scatter", "xsrc": "winsonchee199:35:65953f", "ysrc": "winsonchee199:35:b72d73", "xaxis": "x8", "yaxis": "y8", "showlegend": false }, { "line": { "color": "red", "width": 2 }, "mode": "lines", "name": "", "type": "scatter", "xsrc": "winsonchee199:35:7fcd47", "ysrc": "winsonchee199:35:33ca6f", "xaxis": "x8", "yaxis": "y8", "showlegend": false }, { "line": { "color": "red", "width": 2 }, "mode": "lines", "name": "", "type": "scatter", "xsrc": "winsonchee199:35:42e9cc", "ysrc": "winsonchee199:35:a92720", "xaxis": "x8", "yaxis": "y8", "showlegend": false }, { "line": { "color": "red", "width": 2 }, "mode": "lines", "name": "", "type": "scatter", "xsrc": "winsonchee199:35:dc6676", "ysrc": "winsonchee199:35:30affe", "xaxis": "x8", "yaxis": "y8", "showlegend": false }, { "line": { "color": "red", "width": 2 }, "mode": "lines", "name": "", "type": "scatter", "xsrc": "winsonchee199:35:bb8c77", "ysrc": "winsonchee199:35:206014", "xaxis": "x8", "yaxis": "y8", "showlegend": false }, { "line": { "color": "red", "width": 2 }, "mode": "lines", "name": "", "type": "scatter", "xsrc": "winsonchee199:35:d2ff02", "ysrc": "winsonchee199:35:a71be0", "xaxis": "x8", "yaxis": "y8", "showlegend": false }, { "line": { "color": "red", "width": 2 }, "mode": "lines", "name": "", "type": "scatter", "xsrc": "winsonchee199:35:497d49", "ysrc": "winsonchee199:35:6b1d36", "xaxis": "x8", "yaxis": "y8", "showlegend": false }, { "line": { "color": "red", "width": 2 }, "mode": "lines", "name": "", "type": "scatter", "xsrc": "winsonchee199:35:94066c", "ysrc": "winsonchee199:35:12668a", "xaxis": "x8", "yaxis": "y8", "showlegend": false }, { "line": { "color": "red", "width": 2 }, "mode": "lines", "name": "", "type": "scatter", "xsrc": "winsonchee199:35:68524a", "ysrc": "winsonchee199:35:7568af", "xaxis": "x8", "yaxis": "y8", "showlegend": false } ], "layout": { "font": { "color": "black" }, "title": { "x": 0.5, "font": { "size": 20, "color": "black" }, "text": "Cumulative PnL by Day for Charts", "xanchor": "center" }, "width": 1000, "xaxis": { "title": { "font": { "color": "black" } }, "anchor": "y", "domain": [ 0.0, 1.0 ], "tickfont": { "color": "black" }, "zeroline": true, "gridcolor": "gray", "linecolor": "black", "zerolinecolor": "black" }, "yaxis": { "title": { "font": { "color": "black" } }, "anchor": "x", "domain": [ 0.9296875, 1.0 ], "tickfont": { "color": "black" }, "zeroline": true, "gridcolor": "gray", "linecolor": "black", "zerolinecolor": "black" }, "height": 2000, "xaxis2": { "title": { "font": { "color": "black" } }, "anchor": "y2", "domain": [ 0.0, 1.0 ], "tickfont": { "color": "black" }, "zeroline": true, "gridcolor": "gray", "linecolor": "black", "zerolinecolor": "black" }, "xaxis3": { "title": { "font": { "color": "black" } }, "anchor": "y3", "domain": [ 0.0, 1.0 ], "tickfont": { "color": "black" }, "zeroline": true, "gridcolor": "gray", "linecolor": "black", "zerolinecolor": "black" }, "xaxis4": { "title": { "font": { "color": "black" } }, "anchor": "y4", "domain": [ 0.0, 1.0 ], "tickfont": { "color": "black" }, "zeroline": true, "gridcolor": "gray", "linecolor": "black", "zerolinecolor": "black" }, "xaxis5": { "title": { "font": { "color": "black" } }, "anchor": "y5", "domain": [ 0.0, 1.0 ], "tickfont": { "color": "black" }, "zeroline": true, "gridcolor": "gray", "linecolor": "black", "zerolinecolor": "black" }, "xaxis6": { "title": { "font": { "color": "black" } }, "anchor": "y6", "domain": [ 0.0, 1.0 ], "tickfont": { "color": "black" }, "zeroline": true, "gridcolor": "gray", "linecolor": "black", "zerolinecolor": "black" }, "xaxis7": { "title": { "font": { "color": "black" } }, "anchor": "y7", "domain": [ 0.0, 1.0 ], "tickfont": { "color": "black" }, "zeroline": true, "gridcolor": "gray", "linecolor": "black", "zerolinecolor": "black" }, "xaxis8": { "title": { "font": { "color": "black" } }, "anchor": "y8", "domain": [ 0.0, 1.0 ], "tickfont": { "color": "black" }, "zeroline": true, "gridcolor": "gray", "linecolor": "black", "zerolinecolor": "black" }, "yaxis2": { "title": { "font": { "color": "black" } }, "anchor": "x2", "domain": [ 0.796875, 0.8671875 ], "tickfont": { "color": "black" }, "zeroline": true, "gridcolor": "gray", "linecolor": "black", "zerolinecolor": "black" }, "yaxis3": { "title": { "font": { "color": "black" } }, "anchor": "x3", "domain": [ 0.6640625, 0.734375 ], "tickfont": { "color": "black" }, "zeroline": true, "gridcolor": "gray", "linecolor": "black", "zerolinecolor": "black" }, "yaxis4": { "title": { "font": { "color": "black" } }, "anchor": "x4", "domain": [ 0.53125, 0.6015625 ], "tickfont": { "color": "black" }, "zeroline": true, "gridcolor": "gray", "linecolor": "black", "zerolinecolor": "black" }, "yaxis5": { "title": { "font": { "color": "black" } }, "anchor": "x5", "domain": [ 0.3984375, 0.46875 ], "tickfont": { "color": "black" }, "zeroline": true, "gridcolor": "gray", "linecolor": "black", "zerolinecolor": "black" }, "yaxis6": { "title": { "font": { "color": "black" } }, "anchor": "x6", "domain": [ 0.265625, 0.3359375 ], "tickfont": { "color": "black" }, "zeroline": true, "gridcolor": "gray", "linecolor": "black", "zerolinecolor": "black" }, "yaxis7": { "title": { "font": { "color": "black" } }, "anchor": "x7", "domain": [ 0.1328125, 0.203125 ], "tickfont": { "color": "black" }, "zeroline": true, "gridcolor": "gray", "linecolor": "black", "zerolinecolor": "black" }, "yaxis8": { "title": { "font": { "color": "black" } }, "anchor": "x8", "domain": [ 0.0, 0.0703125 ], "tickfont": { "color": "black" }, "zeroline": true, "gridcolor": "gray", "linecolor": "black", "zerolinecolor": "black" }, "template": { "data": { "bar": [ { "type": "bar", "marker": { "line": { "color": "#E5ECF6", "width": 0.5 }, "pattern": { "size": 10, "fillmode": "overlay", "solidity": 0.2 } }, "error_x": { "color": "#2a3f5f" }, "error_y": { "color": "#2a3f5f" } } ], "pie": [ { "type": "pie", "automargin": true } ], "table": [ { "type": "table", "cells": { "fill": { "color": "#EBF0F8" }, "line": { "color": "white" } }, "header": { "fill": { "color": "#C8D4E3" }, "line": { "color": "white" } } } ], "carpet": [ { "type": "carpet", "aaxis": { "gridcolor": "white", "linecolor": "white", "endlinecolor": "#2a3f5f", "minorgridcolor": "white", "startlinecolor": "#2a3f5f" }, "baxis": { "gridcolor": "white", "linecolor": "white", "endlinecolor": "#2a3f5f", "minorgridcolor": "white", "startlinecolor": "#2a3f5f" } } ], "mesh3d": [ { "type": "mesh3d", "colorbar": { "ticks": "", "outlinewidth": 0 } } ], "contour": [ { "type": "contour", "colorbar": { "ticks": "", "outlinewidth": 0 }, "colorscale": [ [ 0.0, "#0d0887" ], [ 0.1111111111111111, "#46039f" ], [ 0.2222222222222222, "#7201a8" ], [ 0.3333333333333333, "#9c179e" ], [ 0.4444444444444444, "#bd3786" ], [ 0.5555555555555556, "#d8576b" ], [ 0.6666666666666666, "#ed7953" ], [ 0.7777777777777778, "#fb9f3a" ], [ 0.8888888888888888, "#fdca26" ], [ 1.0, "#f0f921" ] ] } ], "heatmap": [ { "type": "heatmap", "colorbar": { "ticks": "", "outlinewidth": 0 }, "colorscale": [ [ 0.0, "#0d0887" ], [ 0.1111111111111111, "#46039f" ], [ 0.2222222222222222, "#7201a8" ], [ 0.3333333333333333, "#9c179e" ], [ 0.4444444444444444, "#bd3786" ], [ 0.5555555555555556, "#d8576b" ], [ 0.6666666666666666, "#ed7953" ], [ 0.7777777777777778, "#fb9f3a" ], [ 0.8888888888888888, "#fdca26" ], [ 1.0, "#f0f921" ] ] } ], "scatter": [ { "type": "scatter", "fillpattern": { "size": 10, "fillmode": "overlay", "solidity": 0.2 } } ], "surface": [ { "type": "surface", "colorbar": { "ticks": "", "outlinewidth": 0 }, "colorscale": [ [ 0.0, "#0d0887" ], [ 0.1111111111111111, "#46039f" ], [ 0.2222222222222222, "#7201a8" ], [ 0.3333333333333333, "#9c179e" ], [ 0.4444444444444444, "#bd3786" ], [ 0.5555555555555556, "#d8576b" ], [ 0.6666666666666666, "#ed7953" ], [ 0.7777777777777778, "#fb9f3a" ], [ 0.8888888888888888, "#fdca26" ], [ 1.0, "#f0f921" ] ] } ], "barpolar": [ { "type": "barpolar", "marker": { "line": { "color": "#E5ECF6", "width": 0.5 }, "pattern": { "size": 10, "fillmode": "overlay", "solidity": 0.2 } } } ], "heatmapgl": [ { "type": "heatmapgl", "colorbar": { "ticks": "", "outlinewidth": 0 }, "colorscale": [ [ 0.0, "#0d0887" ], [ 0.1111111111111111, "#46039f" ], [ 0.2222222222222222, "#7201a8" ], [ 0.3333333333333333, "#9c179e" ], [ 0.4444444444444444, "#bd3786" ], [ 0.5555555555555556, "#d8576b" ], [ 0.6666666666666666, "#ed7953" ], [ 0.7777777777777778, "#fb9f3a" ], [ 0.8888888888888888, "#fdca26" ], [ 1.0, "#f0f921" ] ] } ], "histogram": [ { "type": "histogram", "marker": { "pattern": { "size": 10, "fillmode": "overlay", "solidity": 0.2 } } } ], "parcoords": [ { "line": { "colorbar": { "ticks": "", "outlinewidth": 0 } }, "type": "parcoords" } ], "scatter3d": [ { "line": { "colorbar": { "ticks": "", "outlinewidth": 0 } }, "type": "scatter3d", "marker": { "colorbar": { "ticks": "", "outlinewidth": 0 } } } ], "scattergl": [ { "type": "scattergl", "marker": { "colorbar": { "ticks": "", "outlinewidth": 0 } } } ], "choropleth": [ { "type": "choropleth", "colorbar": { "ticks": "", "outlinewidth": 0 } } ], "scattergeo": [ { "type": "scattergeo", "marker": { "colorbar": { "ticks": "", "outlinewidth": 0 } } } ], "histogram2d": [ { "type": "histogram2d", "colorbar": { "ticks": "", "outlinewidth": 0 }, "colorscale": [ [ 0.0, "#0d0887" ], [ 0.1111111111111111, "#46039f" ], [ 0.2222222222222222, "#7201a8" ], [ 0.3333333333333333, "#9c179e" ], [ 0.4444444444444444, "#bd3786" ], [ 0.5555555555555556, "#d8576b" ], [ 0.6666666666666666, "#ed7953" ], [ 0.7777777777777778, "#fb9f3a" ], [ 0.8888888888888888, "#fdca26" ], [ 1.0, "#f0f921" ] ] } ], "scatterpolar": [ { "type": "scatterpolar", "marker": { "colorbar": { "ticks": "", "outlinewidth": 0 } } } ], "contourcarpet": [ { "type": "contourcarpet", "colorbar": { "ticks": "", "outlinewidth": 0 } } ], "scattercarpet": [ { "type": "scattercarpet", "marker": { "colorbar": { "ticks": "", "outlinewidth": 0 } } } ], "scattermapbox": [ { "type": "scattermapbox", "marker": { "colorbar": { "ticks": "", "outlinewidth": 0 } } } ], "scatterpolargl": [ { "type": "scatterpolargl", "marker": { "colorbar": { "ticks": "", "outlinewidth": 0 } } } ], "scatterternary": [ { "type": "scatterternary", "marker": { "colorbar": { "ticks": "", "outlinewidth": 0 } } } ], "histogram2dcontour": [ { "type": "histogram2dcontour", "colorbar": { "ticks": "", "outlinewidth": 0 }, "colorscale": [ [ 0.0, "#0d0887" ], [ 0.1111111111111111, "#46039f" ], [ 0.2222222222222222, "#7201a8" ], [ 0.3333333333333333, "#9c179e" ], [ 0.4444444444444444, "#bd3786" ], [ 0.5555555555555556, "#d8576b" ], [ 0.6666666666666666, "#ed7953" ], [ 0.7777777777777778, "#fb9f3a" ], [ 0.8888888888888888, "#fdca26" ], [ 1.0, "#f0f921" ] ] } ] }, "layout": { "geo": { "bgcolor": "white", "showland": true, "lakecolor": "white", "landcolor": "#E5ECF6", "showlakes": true, "subunitcolor": "white" }, "font": { "color": "#2a3f5f" }, "polar": { "bgcolor": "#E5ECF6", "radialaxis": { "ticks": "", "gridcolor": "white", "linecolor": "white" }, "angularaxis": { "ticks": "", "gridcolor": "white", "linecolor": "white" } }, "scene": { "xaxis": { "ticks": "", "gridcolor": "white", "gridwidth": 2, "linecolor": "white", "zerolinecolor": "white", "showbackground": true, "backgroundcolor": "#E5ECF6" }, "yaxis": { "ticks": "", "gridcolor": "white", "gridwidth": 2, "linecolor": "white", "zerolinecolor": "white", "showbackground": true, "backgroundcolor": "#E5ECF6" }, "zaxis": { "ticks": "", "gridcolor": "white", "gridwidth": 2, "linecolor": "white", "zerolinecolor": "white", "showbackground": true, "backgroundcolor": "#E5ECF6" } }, "title": { "x": 0.05 }, "xaxis": { "ticks": "", "title": { "standoff": 15 }, "gridcolor": "white", "linecolor": "white", "automargin": true, "zerolinecolor": "white", "zerolinewidth": 2 }, "yaxis": { "ticks": "", "title": { "standoff": 15 }, "gridcolor": "white", "linecolor": "white", "automargin": true, "zerolinecolor": "white", "zerolinewidth": 2 }, "mapbox": { "style": "light" }, "ternary": { "aaxis": { "ticks": "", "gridcolor": "white", "linecolor": "white" }, "baxis": { "ticks": "", "gridcolor": "white", "linecolor": "white" }, "caxis": { "ticks": "", "gridcolor": "white", "linecolor": "white" }, "bgcolor": "#E5ECF6" }, "colorway": [ "#636efa", "#EF553B", "#00cc96", "#ab63fa", "#FFA15A", "#19d3f3", "#FF6692", "#B6E880", "#FF97FF", "#FECB52" ], "coloraxis": { "colorbar": { "ticks": "", "outlinewidth": 0 } }, "hovermode": "closest", "colorscale": { "diverging": [ [ 0, "#8e0152" ], [ 0.1, "#c51b7d" ], [ 0.2, "#de77ae" ], [ 0.3, "#f1b6da" ], [ 0.4, "#fde0ef" ], [ 0.5, "#f7f7f7" ], [ 0.6, "#e6f5d0" ], [ 0.7, "#b8e186" ], [ 0.8, "#7fbc41" ], [ 0.9, "#4d9221" ], [ 1, "#276419" ] ], "sequential": [ [ 0.0, "#0d0887" ], [ 0.1111111111111111, "#46039f" ], [ 0.2222222222222222, "#7201a8" ], [ 0.3333333333333333, "#9c179e" ], [ 0.4444444444444444, "#bd3786" ], [ 0.5555555555555556, "#d8576b" ], [ 0.6666666666666666, "#ed7953" ], [ 0.7777777777777778, "#fb9f3a" ], [ 0.8888888888888888, "#fdca26" ], [ 1.0, "#f0f921" ] ], "sequentialminus": [ [ 0.0, "#0d0887" ], [ 0.1111111111111111, "#46039f" ], [ 0.2222222222222222, "#7201a8" ], [ 0.3333333333333333, "#9c179e" ], [ 0.4444444444444444, "#bd3786" ], [ 0.5555555555555556, "#d8576b" ], [ 0.6666666666666666, "#ed7953" ], [ 0.7777777777777778, "#fb9f3a" ], [ 0.8888888888888888, "#fdca26" ], [ 1.0, "#f0f921" ] ] }, "hoverlabel": { "align": "left" }, "plot_bgcolor": "#E5ECF6", "paper_bgcolor": "white", "shapedefaults": { "line": { "color": "#2a3f5f" } }, "autotypenumbers": "strict", "annotationdefaults": { "arrowhead": 0, "arrowcolor": "#2a3f5f", "arrowwidth": 1 } } }, "annotations": [ { "x": 0.5, "y": 1.0, "font": { "size": 16 }, "text": "ETH 4h SIM 50U", "xref": "paper", "yref": "paper", "xanchor": "center", "yanchor": "bottom", "showarrow": false }, { "x": 0.5, "y": 0.8671875, "font": { "size": 16 }, "text": "ETH 4h Test 50U", "xref": "paper", "yref": "paper", "xanchor": "center", "yanchor": "bottom", "showarrow": false }, { "x": 0.5, "y": 0.734375, "font": { "size": 16 }, "text": "BTC 4h SIM 50U", "xref": "paper", "yref": "paper", "xanchor": "center", "yanchor": "bottom", "showarrow": false }, { "x": 0.5, "y": 0.6015625, "font": { "size": 16 }, "text": "BTC 4h Test 50U", "xref": "paper", "yref": "paper", "xanchor": "center", "yanchor": "bottom", "showarrow": false }, { "x": 0.5, "y": 0.46875, "font": { "size": 16 }, "text": "ETH 8h SIM 100U", "xref": "paper", "yref": "paper", "xanchor": "center", "yanchor": "bottom", "showarrow": false }, { "x": 0.5, "y": 0.3359375, "font": { "size": 16 }, "text": "ETH 8h Test 100U", "xref": "paper", "yref": "paper", "xanchor": "center", "yanchor": "bottom", "showarrow": false }, { "x": 0.5, "y": 0.203125, "font": { "size": 16 }, "text": "BTC 8h SIM 100U", "xref": "paper", "yref": "paper", "xanchor": "center", "yanchor": "bottom", "showarrow": false }, { "x": 0.5, "y": 0.0703125, "font": { "size": 16 }, "text": "BTC 8h Test 100U", "xref": "paper", "yref": "paper", "xanchor": "center", "yanchor": "bottom", "showarrow": false } ], "plot_bgcolor": "#FFDAB9", "paper_bgcolor": "#FFDAB9" } }, "height": 2000, "width": 1000, "user": { "profile_url": "https://chart-studio.plotly.com/~winsonchee199", "avatar_url": "https://storage.googleapis.com/plotly-prod-profiles/85.jpg", "background_url": "https://storage.googleapis.com/plotly-prod-profiles/bg-0.jpg", "bio": "", "nickname": "", "website": "", "stream_tokens": null, "feature_set_id": null, "csrf_token": null, "date_joined": "2024-03-20 02:22:53", "mapbox_access_tokens": null, "has_password": null, "username": "winsonchee199", "email": null, "is_active": null, "readonly": null, "is_dash_creator": null, "dash_created_count": null, "is_chart_creator": null, "charts_created_count": null } }, { "creation_time": "2024-03-31T15:27:11.765741Z", "comments": { "results": [], "count": 0 }, "parented": true, "embed_url": "https://chart-studio.plotly.com/~dhiablqs/1.embed", "fid": "dhiablqs:1", "filename": "Plot 1", "filetype": "plot", "img_url": "https://storage.googleapis.com/plotly-prod-images/dhiablqs/1/9_6KL6K4D248MS6AWYM0MNBC83MCJ9DC.png", "image_urls": { "default": "https://storage.googleapis.com/plotly-prod-images/dhiablqs/1/2_U5SA58K1BV5BN50IEIQMXERK2VI262.png", "block-thumb": "https://storage.googleapis.com/plotly-prod-images/dhiablqs/1/8_5U5D6SZMM8LJ2PFIA707PAQNOM22D8.png", "list-thumb": "https://storage.googleapis.com/plotly-prod-images/dhiablqs/1/9_6KL6K4D248MS6AWYM0MNBC83MCJ9DC.png" }, "api_urls": { "files": "https://api.plotly.com/v2/files/dhiablqs:1", "plots": "https://api.plotly.com/v2/plots/dhiablqs:1", "parent": "https://api.plotly.com/v2/folders/home?user=dhiablqs" }, "owner": "dhiablqs", "parent": -1, "preview": "", "referencers": [], "references": [], "title": "", "views": 1, "web_url": "https://chart-studio.plotly.com/~dhiablqs/1/", "world_readable": true, "date_modified": "2024-03-31T15:33:48.881Z", "stars": { "results": [], "count": 0 }, "collaborators": { "results": [], "count": 0 }, "subfolder_count": null, "refresh_interval": null, "organize_view_url": "https://chart-studio.plotly.com/~dhiablqs/1/", "current_user_permission": "read", "is_theme": null, "is_template": false, "autosize": true, "caption": "", "figure": { "data": [ { "meta": { "columnNames": { "x": "B" } }, "type": "box", "xsrc": "dhiablqs:0:3cb7f8", "boxpoints": false }, { "meta": { "columnNames": { "x": "A", "y": "" } }, "mode": "markers", "type": "box", "xsrc": "dhiablqs:0:0246eb", "boxpoints": false, "orientation": "h" } ], "frames": [], "layout": { "title": { "text": "DATA AM025" }, "xaxis": { "type": "linear", "range": [ 7.216555555555557, 31.445444444444448 ], "autorange": true }, "yaxis": { "type": "category", "range": [ -0.5, 1.5 ], "autorange": true }, "autosize": true, "template": { "data": { "bar": [ { "type": "bar", "marker": { "colorbar": { "ticks": "", "outlinewidth": 0 } } } ], "table": [ { "type": "table", "cells": { "fill": { "color": "#EBF0F8" }, "line": { "color": "white" } }, "header": { "fill": { "color": "#C8D4E3" }, "line": { "color": "white" } } } ], "carpet": [ { "type": "carpet", "aaxis": { "gridcolor": "#C8D4E3", "linecolor": "#C8D4E3", "endlinecolor": "#2a3f5f", "minorgridcolor": "#C8D4E3", "startlinecolor": "#2a3f5f" }, "baxis": { "gridcolor": "#C8D4E3", "linecolor": "#C8D4E3", "endlinecolor": "#2a3f5f", "minorgridcolor": "#C8D4E3", "startlinecolor": "#2a3f5f" } } ], "mesh3d": [ { "type": "mesh3d", "colorbar": { "ticks": "", "outlinewidth": 0 } } ], "contour": [ { "type": "contour", "colorbar": { "ticks": "", "outlinewidth": 0 }, "autocolorscale": true } ], "heatmap": [ { "type": "heatmap", "colorbar": { "ticks": "", "outlinewidth": 0 }, "autocolorscale": true } ], "scatter": [ { "type": "scatter", "marker": { "colorbar": { "ticks": "", "outlinewidth": 0 } } } ], "surface": [ { "type": "surface", "colorbar": { "ticks": "", "outlinewidth": 0 } } ], "heatmapgl": [ { "type": "heatmapgl", "colorbar": { "ticks": "", "outlinewidth": 0 } } ], "histogram": [ { "type": "histogram", "marker": { "colorbar": { "ticks": "", "outlinewidth": 0 } } } ], "parcoords": [ { "line": { "colorbar": { "ticks": "", "outlinewidth": 0 } }, "type": "parcoords" } ], "scatter3d": [ { "type": "scatter3d", "marker": { "colorbar": { "ticks": "", "outlinewidth": 0 } } } ], "scattergl": [ { "type": "scattergl", "marker": { "colorbar": { "ticks": "", "outlinewidth": 0 } } } ], "choropleth": [ { "type": "choropleth", "colorbar": { "ticks": "", "outlinewidth": 0 } } ], "scattergeo": [ { "type": "scattergeo", "marker": { "colorbar": { "ticks": "", "outlinewidth": 0 } } } ], "histogram2d": [ { "type": "histogram2d", "colorbar": { "ticks": "", "outlinewidth": 0 }, "autocolorscale": true } ], "scatterpolar": [ { "type": "scatterpolar", "marker": { "colorbar": { "ticks": "", "outlinewidth": 0 } } } ], "contourcarpet": [ { "type": "contourcarpet", "colorbar": { "ticks": "", "outlinewidth": 0 } } ], "scattercarpet": [ { "type": "scattercarpet", "marker": { "colorbar": { "ticks": "", "outlinewidth": 0 } } } ], "scattermapbox": [ { "type": "scattermapbox", "marker": { "colorbar": { "ticks": "", "outlinewidth": 0 } } } ], "scatterpolargl": [ { "type": "scatterpolargl", "marker": { "colorbar": { "ticks": "", "outlinewidth": 0 } } } ], "scatterternary": [ { "type": "scatterternary", "marker": { "colorbar": { "ticks": "", "outlinewidth": 0 } } } ], "histogram2dcontour": [ { "type": "histogram2dcontour", "colorbar": { "ticks": "", "outlinewidth": 0 }, "autocolorscale": true } ] }, "layout": { "geo": { "bgcolor": "white", "showland": true, "lakecolor": "white", "landcolor": "white", "showlakes": true, "subunitcolor": "#C8D4E3" }, "font": { "color": "#2a3f5f" }, "polar": { "bgcolor": "white", "radialaxis": { "ticks": "", "gridcolor": "#EBF0F8", "linecolor": "#EBF0F8" }, "angularaxis": { "ticks": "", "gridcolor": "#EBF0F8", "linecolor": "#EBF0F8" } }, "scene": { "xaxis": { "ticks": "", "gridcolor": "#DFE8F3", "gridwidth": 2, "linecolor": "#EBF0F8", "zerolinecolor": "#EBF0F8", "showbackground": true, "backgroundcolor": "white" }, "yaxis": { "ticks": "", "gridcolor": "#DFE8F3", "gridwidth": 2, "linecolor": "#EBF0F8", "zerolinecolor": "#EBF0F8", "showbackground": true, "backgroundcolor": "white" }, "zaxis": { "ticks": "", "gridcolor": "#DFE8F3", "gridwidth": 2, "linecolor": "#EBF0F8", "zerolinecolor": "#EBF0F8", "showbackground": true, "backgroundcolor": "white" } }, "title": { "x": 0.05 }, "xaxis": { "ticks": "", "gridcolor": "#EBF0F8", "linecolor": "#EBF0F8", "automargin": true, "zerolinecolor": "#EBF0F8", "zerolinewidth": 2 }, "yaxis": { "ticks": "", "gridcolor": "#EBF0F8", "linecolor": "#EBF0F8", "automargin": true, "zerolinecolor": "#EBF0F8", "zerolinewidth": 2 }, "ternary": { "aaxis": { "ticks": "", "gridcolor": "#DFE8F3", "linecolor": "#A2B1C6" }, "baxis": { "ticks": "", "gridcolor": "#DFE8F3", "linecolor": "#A2B1C6" }, "caxis": { "ticks": "", "gridcolor": "#DFE8F3", "linecolor": "#A2B1C6" }, "bgcolor": "white" }, "colorway": [ "#636efa", "#EF553B", "#00cc96", "#ab63fa", "#19d3f3", "#e763fa", "#fecb52", "#ffa15a", "#ff6692", "#b6e880" ], "hovermode": "closest", "colorscale": { "diverging": [ [ 0, "#8e0152" ], [ 0.1, "#c51b7d" ], [ 0.2, "#de77ae" ], [ 0.3, "#f1b6da" ], [ 0.4, "#fde0ef" ], [ 0.5, "#f7f7f7" ], [ 0.6, "#e6f5d0" ], [ 0.7, "#b8e186" ], [ 0.8, "#7fbc41" ], [ 0.9, "#4d9221" ], [ 1, "#276419" ] ], "sequential": [ [ 0, "#0508b8" ], [ 0.0893854748603352, "#1910d8" ], [ 0.1787709497206704, "#3c19f0" ], [ 0.2681564245810056, "#6b1cfb" ], [ 0.3575418994413408, "#981cfd" ], [ 0.44692737430167595, "#bf1cfd" ], [ 0.5363128491620112, "#dd2bfd" ], [ 0.6256983240223464, "#f246fe" ], [ 0.7150837988826816, "#fc67fd" ], [ 0.8044692737430168, "#fe88fc" ], [ 0.8938547486033519, "#fea5fd" ], [ 0.9832402234636871, "#febefe" ], [ 1, "#fec3fe" ] ], "sequentialminus": [ [ 0, "#0508b8" ], [ 0.0893854748603352, "#1910d8" ], [ 0.1787709497206704, "#3c19f0" ], [ 0.2681564245810056, "#6b1cfb" ], [ 0.3575418994413408, "#981cfd" ], [ 0.44692737430167595, "#bf1cfd" ], [ 0.5363128491620112, "#dd2bfd" ], [ 0.6256983240223464, "#f246fe" ], [ 0.7150837988826816, "#fc67fd" ], [ 0.8044692737430168, "#fe88fc" ], [ 0.8938547486033519, "#fea5fd" ], [ 0.9832402234636871, "#febefe" ], [ 1, "#fec3fe" ] ] }, "plot_bgcolor": "white", "paper_bgcolor": "white", "shapedefaults": { "line": { "width": 0 }, "opacity": 0.4, "fillcolor": "#506784" }, "annotationdefaults": { "arrowhead": 0, "arrowcolor": "#506784", "arrowwidth": 1 } }, "themeRef": "PLOTLY_WHITE" } } }, "height": null, "width": null, "user": { "profile_url": "https://chart-studio.plotly.com/~dhiablqs", "avatar_url": "https://storage.googleapis.com/plotly-prod-profiles/79.jpg", "background_url": "https://storage.googleapis.com/plotly-prod-profiles/bg-5.jpg", "bio": "", "nickname": "", "website": "", "stream_tokens": null, "feature_set_id": null, "csrf_token": null, "date_joined": "2024-03-31 15:26:29", "mapbox_access_tokens": null, "has_password": null, "username": "dhiablqs", "email": null, "is_active": null, "readonly": null, "is_dash_creator": null, "dash_created_count": null, "is_chart_creator": null, "charts_created_count": null } }, { "creation_time": "2024-03-31T15:13:08.470117Z", "comments": { "results": [], "count": 0 }, "parented": true, "embed_url": "https://chart-studio.plotly.com/~viggi_ravi_uri/9.embed", "fid": "viggi_ravi_uri:9", "filename": "PPG_red_test", "filetype": "plot", "img_url": "https://storage.googleapis.com/plotly-prod-images/viggi_ravi_uri/9/9_S6TEQD2QCRZW75P4HXAQTXYZOFGFI4.png", "image_urls": { "default": "https://storage.googleapis.com/plotly-prod-images/viggi_ravi_uri/9/2_2E7EL35GM7ZE7QDXCOSIK9TM76HHDM.png", "block-thumb": "https://storage.googleapis.com/plotly-prod-images/viggi_ravi_uri/9/8_F0JKOMLME9R4WAWNE8VXZ11OCMMQT4.png", "list-thumb": "https://storage.googleapis.com/plotly-prod-images/viggi_ravi_uri/9/9_S6TEQD2QCRZW75P4HXAQTXYZOFGFI4.png" }, "api_urls": { "files": "https://api.plotly.com/v2/files/viggi_ravi_uri:9", "plots": "https://api.plotly.com/v2/plots/viggi_ravi_uri:9", "parent": "https://api.plotly.com/v2/folders/home?user=viggi_ravi_uri" }, "owner": "viggi_ravi_uri", "parent": -1, "preview": "", "referencers": [], "references": [], "title": "", "views": 7, "web_url": "https://chart-studio.plotly.com/~viggi_ravi_uri/9/", "world_readable": true, "date_modified": "2024-03-31T15:13:08.479Z", "stars": { "results": [], "count": 0 }, "collaborators": { "results": [], "count": 0 }, "subfolder_count": null, "refresh_interval": null, "organize_view_url": "https://chart-studio.plotly.com/~viggi_ravi_uri/9/", "current_user_permission": "read", "is_theme": null, "is_template": false, "autosize": true, "caption": "", "figure": { "data": [ { "line": { "color": "rgb(230, 59, 23)", "shape": "spline", "width": 3, "smoothing": 1.3 }, "meta": { "columnNames": { "y": "PPG_Red" } }, "mode": "lines", "type": "scatter", "ysrc": "viggi_ravi_uri:8:b6265b", "connectgaps": true } ], "frames": [], "layout": { "font": { "size": 20 }, "title": { "x": 0.52, "font": { "size": 24 }, "text": "Optical heartbeat (Red LED)" }, "xaxis": { "range": [ -1.928629441538046, 199.29170895892102 ], "title": { "text": "Samples" }, "autorange": false, "showexponent": "all", "exponentformat": "none", "separatethousands": true }, "yaxis": { "type": "linear", "range": [ 163565.9958428277, 163851.354695638 ], "title": { "text": "Photo-detector value" }, "tickfont": { "size": 20 }, "autorange": false, "exponentformat": "none" }, "autosize": true, "dragmode": "pan", "template": { "data": { "bar": [ { "type": "bar", "marker": { "colorbar": { "ticks": "", "outlinewidth": 0 } } } ], "table": [ { "type": "table", "cells": { "fill": { "color": "#EBF0F8" }, "line": { "color": "white" } }, "header": { "fill": { "color": "#C8D4E3" }, "line": { "color": "white" } } } ], "carpet": [ { "type": "carpet", "aaxis": { "gridcolor": "#C8D4E3", "linecolor": "#C8D4E3", "endlinecolor": "#2a3f5f", "minorgridcolor": "#C8D4E3", "startlinecolor": "#2a3f5f" }, "baxis": { "gridcolor": "#C8D4E3", "linecolor": "#C8D4E3", "endlinecolor": "#2a3f5f", "minorgridcolor": "#C8D4E3", "startlinecolor": "#2a3f5f" } } ], "mesh3d": [ { "type": "mesh3d", "colorbar": { "ticks": "", "outlinewidth": 0 } } ], "contour": [ { "type": "contour", "colorbar": { "ticks": "", "outlinewidth": 0 }, "autocolorscale": true } ], "heatmap": [ { "type": "heatmap", "colorbar": { "ticks": "", "outlinewidth": 0 }, "autocolorscale": true } ], "scatter": [ { "type": "scatter", "marker": { "colorbar": { "ticks": "", "outlinewidth": 0 } } } ], "surface": [ { "type": "surface", "colorbar": { "ticks": "", "outlinewidth": 0 } } ], "heatmapgl": [ { "type": "heatmapgl", "colorbar": { "ticks": "", "outlinewidth": 0 } } ], "histogram": [ { "type": "histogram", "marker": { "colorbar": { "ticks": "", "outlinewidth": 0 } } } ], "parcoords": [ { "line": { "colorbar": { "ticks": "", "outlinewidth": 0 } }, "type": "parcoords" } ], "scatter3d": [ { "type": "scatter3d", "marker": { "colorbar": { "ticks": "", "outlinewidth": 0 } } } ], "scattergl": [ { "type": "scattergl", "marker": { "colorbar": { "ticks": "", "outlinewidth": 0 } } } ], "choropleth": [ { "type": "choropleth", "colorbar": { "ticks": "", "outlinewidth": 0 } } ], "scattergeo": [ { "type": "scattergeo", "marker": { "colorbar": { "ticks": "", "outlinewidth": 0 } } } ], "histogram2d": [ { "type": "histogram2d", "colorbar": { "ticks": "", "outlinewidth": 0 }, "autocolorscale": true } ], "scatterpolar": [ { "type": "scatterpolar", "marker": { "colorbar": { "ticks": "", "outlinewidth": 0 } } } ], "contourcarpet": [ { "type": "contourcarpet", "colorbar": { "ticks": "", "outlinewidth": 0 } } ], "scattercarpet": [ { "type": "scattercarpet", "marker": { "colorbar": { "ticks": "", "outlinewidth": 0 } } } ], "scattermapbox": [ { "type": "scattermapbox", "marker": { "colorbar": { "ticks": "", "outlinewidth": 0 } } } ], "scatterpolargl": [ { "type": "scatterpolargl", "marker": { "colorbar": { "ticks": "", "outlinewidth": 0 } } } ], "scatterternary": [ { "type": "scatterternary", "marker": { "colorbar": { "ticks": "", "outlinewidth": 0 } } } ], "histogram2dcontour": [ { "type": "histogram2dcontour", "colorbar": { "ticks": "", "outlinewidth": 0 }, "autocolorscale": true } ] }, "layout": { "geo": { "bgcolor": "white", "showland": true, "lakecolor": "white", "landcolor": "white", "showlakes": true, "subunitcolor": "#C8D4E3" }, "font": { "color": "#2a3f5f" }, "polar": { "bgcolor": "white", "radialaxis": { "ticks": "", "gridcolor": "#EBF0F8", "linecolor": "#EBF0F8" }, "angularaxis": { "ticks": "", "gridcolor": "#EBF0F8", "linecolor": "#EBF0F8" } }, "scene": { "xaxis": { "ticks": "", "gridcolor": "#DFE8F3", "gridwidth": 2, "linecolor": "#EBF0F8", "zerolinecolor": "#EBF0F8", "showbackground": true, "backgroundcolor": "white" }, "yaxis": { "ticks": "", "gridcolor": "#DFE8F3", "gridwidth": 2, "linecolor": "#EBF0F8", "zerolinecolor": "#EBF0F8", "showbackground": true, "backgroundcolor": "white" }, "zaxis": { "ticks": "", "gridcolor": "#DFE8F3", "gridwidth": 2, "linecolor": "#EBF0F8", "zerolinecolor": "#EBF0F8", "showbackground": true, "backgroundcolor": "white" } }, "title": { "x": 0.05 }, "xaxis": { "ticks": "", "gridcolor": "#EBF0F8", "linecolor": "#EBF0F8", "automargin": true, "zerolinecolor": "#EBF0F8", "zerolinewidth": 2 }, "yaxis": { "ticks": "", "gridcolor": "#EBF0F8", "linecolor": "#EBF0F8", "automargin": true, "zerolinecolor": "#EBF0F8", "zerolinewidth": 2 }, "ternary": { "aaxis": { "ticks": "", "gridcolor": "#DFE8F3", "linecolor": "#A2B1C6" }, "baxis": { "ticks": "", "gridcolor": "#DFE8F3", "linecolor": "#A2B1C6" }, "caxis": { "ticks": "", "gridcolor": "#DFE8F3", "linecolor": "#A2B1C6" }, "bgcolor": "white" }, "colorway": [ "#636efa", "#EF553B", "#00cc96", "#ab63fa", "#19d3f3", "#e763fa", "#fecb52", "#ffa15a", "#ff6692", "#b6e880" ], "hovermode": "closest", "colorscale": { "diverging": [ [ 0, "#8e0152" ], [ 0.1, "#c51b7d" ], [ 0.2, "#de77ae" ], [ 0.3, "#f1b6da" ], [ 0.4, "#fde0ef" ], [ 0.5, "#f7f7f7" ], [ 0.6, "#e6f5d0" ], [ 0.7, "#b8e186" ], [ 0.8, "#7fbc41" ], [ 0.9, "#4d9221" ], [ 1, "#276419" ] ], "sequential": [ [ 0, "#0508b8" ], [ 0.0893854748603352, "#1910d8" ], [ 0.1787709497206704, "#3c19f0" ], [ 0.2681564245810056, "#6b1cfb" ], [ 0.3575418994413408, "#981cfd" ], [ 0.44692737430167595, "#bf1cfd" ], [ 0.5363128491620112, "#dd2bfd" ], [ 0.6256983240223464, "#f246fe" ], [ 0.7150837988826816, "#fc67fd" ], [ 0.8044692737430168, "#fe88fc" ], [ 0.8938547486033519, "#fea5fd" ], [ 0.9832402234636871, "#febefe" ], [ 1, "#fec3fe" ] ], "sequentialminus": [ [ 0, "#0508b8" ], [ 0.0893854748603352, "#1910d8" ], [ 0.1787709497206704, "#3c19f0" ], [ 0.2681564245810056, "#6b1cfb" ], [ 0.3575418994413408, "#981cfd" ], [ 0.44692737430167595, "#bf1cfd" ], [ 0.5363128491620112, "#dd2bfd" ], [ 0.6256983240223464, "#f246fe" ], [ 0.7150837988826816, "#fc67fd" ], [ 0.8044692737430168, "#fe88fc" ], [ 0.8938547486033519, "#fea5fd" ], [ 0.9832402234636871, "#febefe" ], [ 1, "#fec3fe" ] ] }, "plot_bgcolor": "white", "paper_bgcolor": "white", "shapedefaults": { "line": { "width": 0 }, "opacity": 0.4, "fillcolor": "#506784" }, "annotationdefaults": { "arrowhead": 0, "arrowcolor": "#506784", "arrowwidth": 1 } }, "themeRef": "PLOTLY_WHITE" }, "uniformtext": { "mode": "show", "minsize": 20 } } }, "height": null, "width": null, "user": { "profile_url": "https://chart-studio.plotly.com/~viggi_ravi_uri", "avatar_url": "https://storage.googleapis.com/plotly-prod-profiles/25.jpg", "background_url": "https://storage.googleapis.com/plotly-prod-profiles/bg-11.jpg", "bio": "", "nickname": "", "website": "", "stream_tokens": null, "feature_set_id": null, "csrf_token": null, "date_joined": "2022-12-08 23:32:46", "mapbox_access_tokens": null, "has_password": null, "username": "viggi_ravi_uri", "email": null, "is_active": null, "readonly": null, "is_dash_creator": null, "dash_created_count": null, "is_chart_creator": null, "charts_created_count": null } }, { "creation_time": "2024-03-31T14:49:17.223460Z", "comments": { "results": [], "count": 0 }, "parented": true, "embed_url": "https://chart-studio.plotly.com/~jelka/14.embed", "fid": "jelka:14", "filename": "Tropfenfallzeit-Höhe", "filetype": "plot", "img_url": "https://storage.googleapis.com/plotly-prod-images/jelka/14/9_81FIM8FF5UUBF464EXG8HLX9SAULYH.png", "image_urls": { "default": "https://storage.googleapis.com/plotly-prod-images/jelka/14/2_RGJV4D56DS9LD6UEBTGXCSM2V80E0M.png", "block-thumb": "https://storage.googleapis.com/plotly-prod-images/jelka/14/8_ZXONBD9CS90VIOC8H0A1AX9AS0WQ9X.png", "list-thumb": "https://storage.googleapis.com/plotly-prod-images/jelka/14/9_81FIM8FF5UUBF464EXG8HLX9SAULYH.png" }, "api_urls": { "files": "https://api.plotly.com/v2/files/jelka:14", "plots": "https://api.plotly.com/v2/plots/jelka:14", "parent": "https://api.plotly.com/v2/folders/home?user=jelka" }, "owner": "jelka", "parent": -1, "preview": "", "referencers": [], "references": [], "title": "", "views": 2, "web_url": "https://chart-studio.plotly.com/~jelka/14/", "world_readable": true, "date_modified": "2024-03-31T16:27:10.348Z", "stars": { "results": [], "count": 0 }, "collaborators": { "results": [], "count": 0 }, "subfolder_count": null, "refresh_interval": null, "organize_view_url": "https://chart-studio.plotly.com/~jelka/14/", "current_user_permission": "read", "is_theme": null, "is_template": false, "autosize": true, "caption": "", "figure": { "data": [ { "line": { "color": "rgb(255, 0, 0)" }, "meta": { "columnNames": { "x": "A", "y": "B" } }, "mode": "markers+lines", "name": "0,75mm Loch", "type": "scatter", "xsrc": "jelka:13:d8d25f", "ysrc": "jelka:13:d09dba", "marker": { "size": 10, "symbol": "x-thin-open" } }, { "line": { "color": "rgb(0, 176, 255)" }, "meta": { "columnNames": { "x": "A", "y": "C" } }, "mode": "markers+lines", "name": "1mm Loch", "type": "scatter", "xsrc": "jelka:13:d8d25f", "ysrc": "jelka:13:83cc98", "marker": { "size": 10, "symbol": "x-thin-open" }, "stackgroup": null } ], "frames": [], "layout": { "title": { "text": "Tropfenfallzeit in Abhängigkeit von der Höhe" }, "xaxis": { "type": "linear", "range": [ 13.185123415610407, 37.814876584389594 ], "title": { "text": "Höhe [cm]" }, "tickmode": "linear", "autorange": true, "gridcolor": "rgb(154, 154, 158)" }, "yaxis": { "type": "linear", "range": [ 0.17829328654661017, 0.2726067134533898 ], "title": { "text": "Fallzeit [s]" }, "tickmode": "auto", "autorange": true, "gridcolor": "rgb(154, 154, 158)" }, "autosize": true, "template": { "data": { "bar": [ { "type": "bar", "marker": { "colorbar": { "ticks": "", "outlinewidth": 0 } } } ], "table": [ { "type": "table", "cells": { "fill": { "color": "#EBF0F8" }, "line": { "color": "white" } }, "header": { "fill": { "color": "#C8D4E3" }, "line": { "color": "white" } } } ], "carpet": [ { "type": "carpet", "aaxis": { "gridcolor": "#C8D4E3", "linecolor": "#C8D4E3", "endlinecolor": "#2a3f5f", "minorgridcolor": "#C8D4E3", "startlinecolor": "#2a3f5f" }, "baxis": { "gridcolor": "#C8D4E3", "linecolor": "#C8D4E3", "endlinecolor": "#2a3f5f", "minorgridcolor": "#C8D4E3", "startlinecolor": "#2a3f5f" } } ], "mesh3d": [ { "type": "mesh3d", "colorbar": { "ticks": "", "outlinewidth": 0 } } ], "contour": [ { "type": "contour", "colorbar": { "ticks": "", "outlinewidth": 0 }, "autocolorscale": true } ], "heatmap": [ { "type": "heatmap", "colorbar": { "ticks": "", "outlinewidth": 0 }, "autocolorscale": true } ], "scatter": [ { "type": "scatter", "marker": { "colorbar": { "ticks": "", "outlinewidth": 0 } } } ], "surface": [ { "type": "surface", "colorbar": { "ticks": "", "outlinewidth": 0 } } ], "heatmapgl": [ { "type": "heatmapgl", "colorbar": { "ticks": "", "outlinewidth": 0 } } ], "histogram": [ { "type": "histogram", "marker": { "colorbar": { "ticks": "", "outlinewidth": 0 } } } ], "parcoords": [ { "line": { "colorbar": { "ticks": "", "outlinewidth": 0 } }, "type": "parcoords" } ], "scatter3d": [ { "type": "scatter3d", "marker": { "colorbar": { "ticks": "", "outlinewidth": 0 } } } ], "scattergl": [ { "type": "scattergl", "marker": { "colorbar": { "ticks": "", "outlinewidth": 0 } } } ], "choropleth": [ { "type": "choropleth", "colorbar": { "ticks": "", "outlinewidth": 0 } } ], "scattergeo": [ { "type": "scattergeo", "marker": { "colorbar": { "ticks": "", "outlinewidth": 0 } } } ], "histogram2d": [ { "type": "histogram2d", "colorbar": { "ticks": "", "outlinewidth": 0 }, "autocolorscale": true } ], "scatterpolar": [ { "type": "scatterpolar", "marker": { "colorbar": { "ticks": "", "outlinewidth": 0 } } } ], "contourcarpet": [ { "type": "contourcarpet", "colorbar": { "ticks": "", "outlinewidth": 0 } } ], "scattercarpet": [ { "type": "scattercarpet", "marker": { "colorbar": { "ticks": "", "outlinewidth": 0 } } } ], "scattermapbox": [ { "type": "scattermapbox", "marker": { "colorbar": { "ticks": "", "outlinewidth": 0 } } } ], "scatterpolargl": [ { "type": "scatterpolargl", "marker": { "colorbar": { "ticks": "", "outlinewidth": 0 } } } ], "scatterternary": [ { "type": "scatterternary", "marker": { "colorbar": { "ticks": "", "outlinewidth": 0 } } } ], "histogram2dcontour": [ { "type": "histogram2dcontour", "colorbar": { "ticks": "", "outlinewidth": 0 }, "autocolorscale": true } ] }, "layout": { "geo": { "bgcolor": "white", "showland": true, "lakecolor": "white", "landcolor": "white", "showlakes": true, "subunitcolor": "#C8D4E3" }, "font": { "color": "#2a3f5f" }, "polar": { "bgcolor": "white", "radialaxis": { "ticks": "", "gridcolor": "#EBF0F8", "linecolor": "#EBF0F8" }, "angularaxis": { "ticks": "", "gridcolor": "#EBF0F8", "linecolor": "#EBF0F8" } }, "scene": { "xaxis": { "ticks": "", "gridcolor": "#DFE8F3", "gridwidth": 2, "linecolor": "#EBF0F8", "zerolinecolor": "#EBF0F8", "showbackground": true, "backgroundcolor": "white" }, "yaxis": { "ticks": "", "gridcolor": "#DFE8F3", "gridwidth": 2, "linecolor": "#EBF0F8", "zerolinecolor": "#EBF0F8", "showbackground": true, "backgroundcolor": "white" }, "zaxis": { "ticks": "", "gridcolor": "#DFE8F3", "gridwidth": 2, "linecolor": "#EBF0F8", "zerolinecolor": "#EBF0F8", "showbackground": true, "backgroundcolor": "white" } }, "title": { "x": 0.05 }, "xaxis": { "ticks": "", "gridcolor": "#EBF0F8", "linecolor": "#EBF0F8", "automargin": true, "zerolinecolor": "#EBF0F8", "zerolinewidth": 2 }, "yaxis": { "ticks": "", "gridcolor": "#EBF0F8", "linecolor": "#EBF0F8", "automargin": true, "zerolinecolor": "#EBF0F8", "zerolinewidth": 2 }, "ternary": { "aaxis": { "ticks": "", "gridcolor": "#DFE8F3", "linecolor": "#A2B1C6" }, "baxis": { "ticks": "", "gridcolor": "#DFE8F3", "linecolor": "#A2B1C6" }, "caxis": { "ticks": "", "gridcolor": "#DFE8F3", "linecolor": "#A2B1C6" }, "bgcolor": "white" }, "colorway": [ "#636efa", "#EF553B", "#00cc96", "#ab63fa", "#19d3f3", "#e763fa", "#fecb52", "#ffa15a", "#ff6692", "#b6e880" ], "hovermode": "closest", "colorscale": { "diverging": [ [ 0, "#8e0152" ], [ 0.1, "#c51b7d" ], [ 0.2, "#de77ae" ], [ 0.3, "#f1b6da" ], [ 0.4, "#fde0ef" ], [ 0.5, "#f7f7f7" ], [ 0.6, "#e6f5d0" ], [ 0.7, "#b8e186" ], [ 0.8, "#7fbc41" ], [ 0.9, "#4d9221" ], [ 1, "#276419" ] ], "sequential": [ [ 0, "#0508b8" ], [ 0.0893854748603352, "#1910d8" ], [ 0.1787709497206704, "#3c19f0" ], [ 0.2681564245810056, "#6b1cfb" ], [ 0.3575418994413408, "#981cfd" ], [ 0.44692737430167595, "#bf1cfd" ], [ 0.5363128491620112, "#dd2bfd" ], [ 0.6256983240223464, "#f246fe" ], [ 0.7150837988826816, "#fc67fd" ], [ 0.8044692737430168, "#fe88fc" ], [ 0.8938547486033519, "#fea5fd" ], [ 0.9832402234636871, "#febefe" ], [ 1, "#fec3fe" ] ], "sequentialminus": [ [ 0, "#0508b8" ], [ 0.0893854748603352, "#1910d8" ], [ 0.1787709497206704, "#3c19f0" ], [ 0.2681564245810056, "#6b1cfb" ], [ 0.3575418994413408, "#981cfd" ], [ 0.44692737430167595, "#bf1cfd" ], [ 0.5363128491620112, "#dd2bfd" ], [ 0.6256983240223464, "#f246fe" ], [ 0.7150837988826816, "#fc67fd" ], [ 0.8044692737430168, "#fe88fc" ], [ 0.8938547486033519, "#fea5fd" ], [ 0.9832402234636871, "#febefe" ], [ 1, "#fec3fe" ] ] }, "plot_bgcolor": "white", "paper_bgcolor": "white", "shapedefaults": { "line": { "width": 0 }, "opacity": 0.4, "fillcolor": "#506784" }, "annotationdefaults": { "arrowhead": 0, "arrowcolor": "#506784", "arrowwidth": 1 } }, "themeRef": "PLOTLY_WHITE" } } }, "height": null, "width": null, "user": { "profile_url": "https://chart-studio.plotly.com/~jelka", "avatar_url": "https://storage.googleapis.com/plotly-prod-profiles/76.jpg", "background_url": "https://storage.googleapis.com/plotly-prod-profiles/bg-3.jpg", "bio": "", "nickname": "", "website": "", "stream_tokens": null, "feature_set_id": null, "csrf_token": null, "date_joined": "2023-12-06 13:28:27", "mapbox_access_tokens": null, "has_password": null, "username": "jelka", "email": null, "is_active": null, "readonly": null, "is_dash_creator": null, "dash_created_count": null, "is_chart_creator": null, "charts_created_count": null } }, { "creation_time": "2024-03-31T14:45:27.274577Z", "comments": { "results": [], "count": 0 }, "parented": true, "embed_url": "https://chart-studio.plotly.com/~skpurnell/3.embed", "fid": "skpurnell:3", "filename": "B.J. Hill Chart2", "filetype": "plot", "img_url": "https://storage.googleapis.com/plotly-prod-images/skpurnell/3/9_QTYS5GRWZ9ZM2F6CV59G7IBRB2N8D4.png", "image_urls": { "default": "https://storage.googleapis.com/plotly-prod-images/skpurnell/3/2_T4G1JSUVL3OWV1UN1M8JDEMUTAT9MJ.png", "block-thumb": "https://storage.googleapis.com/plotly-prod-images/skpurnell/3/8_YWGVSRWOVNKP0CPO3J3A57CQC94GPQ.png", "list-thumb": "https://storage.googleapis.com/plotly-prod-images/skpurnell/3/9_QTYS5GRWZ9ZM2F6CV59G7IBRB2N8D4.png" }, "api_urls": { "files": "https://api.plotly.com/v2/files/skpurnell:3", "plots": "https://api.plotly.com/v2/plots/skpurnell:3", "parent": "https://api.plotly.com/v2/folders/home?user=skpurnell" }, "owner": "skpurnell", "parent": -1, "preview": "", "referencers": [], "references": [], "title": "", "views": 85, "web_url": "https://chart-studio.plotly.com/~skpurnell/3/", "world_readable": true, "date_modified": "2024-04-01T21:59:29.238Z", "stars": { "results": [], "count": 0 }, "collaborators": { "results": [], "count": 0 }, "subfolder_count": null, "refresh_interval": null, "organize_view_url": "https://chart-studio.plotly.com/~skpurnell/3/", "current_user_permission": "read", "is_theme": null, "is_template": null, "autosize": true, "caption": "", "figure": { "data": [ { "mode": "markers", "text": " QB Knockdowns : 0.187", "type": "scatter", "xsrc": "skpurnell:2:345fa9", "ysrc": "skpurnell:2:c550d5", "frame": null, "xaxis": "x", "yaxis": "y", "marker": { "line": { "color": "rgba(0,255,0,1)", "width": 1.8897637795275593 }, "size": 37.795275590551185, "color": "rgba(0,255,0,1)", "symbol": "circle", "opacity": 0.7, "autocolorscale": false }, "hoveron": "points", "hoverinfo": "text", "showlegend": false }, { "mode": "markers", "text": " Interceptions : 0.174", "type": "scatter", "xsrc": "skpurnell:2:645857", "ysrc": "skpurnell:2:e6ff67", "frame": null, "xaxis": "x", "yaxis": "y", "marker": { "line": { "color": "rgba(72,247,0,1)", "width": 1.8897637795275593 }, "size": 36.96001173646382, "color": "rgba(72,247,0,1)", "symbol": "circle", "opacity": 0.7, "autocolorscale": false }, "hoveron": "points", "hoverinfo": "text", "showlegend": false }, { "mode": "markers", "text": " QBHits : 0.141", "type": "scatter", "xsrc": "skpurnell:2:5b28f8", "ysrc": "skpurnell:2:e8bf24", "frame": null, "xaxis": "x", "yaxis": "y", "marker": { "line": { "color": "rgba(129,228,0,1)", "width": 1.8897637795275593 }, "size": 34.73868380958432, "color": "rgba(129,228,0,1)", "symbol": "circle", "opacity": 0.7, "autocolorscale": false }, "hoveron": "points", "hoverinfo": "text", "showlegend": false }, { "mode": "markers", "text": " QB Pressures : 0.089", "type": "scatter", "xsrc": "skpurnell:2:86b311", "ysrc": "skpurnell:2:3c0041", "frame": null, "xaxis": "x", "yaxis": "y", "marker": { "line": { "color": "rgba(177,195,0,1)", "width": 1.8897637795275593 }, "size": 30.871279443435842, "color": "rgba(177,195,0,1)", "symbol": "circle", "opacity": 0.7, "autocolorscale": false }, "hoveron": "points", "hoverinfo": "text", "showlegend": false }, { "mode": "markers", "text": " Pass Deflections : 0.076", "type": "scatter", "xsrc": "skpurnell:2:be55d7", "ysrc": "skpurnell:2:15f8ff", "frame": null, "xaxis": "x", "yaxis": "y", "marker": { "line": { "color": "rgba(186,187,0,1)", "width": 1.8897637795275593 }, "size": 29.8148196885836, "color": "rgba(186,187,0,1)", "symbol": "circle", "opacity": 0.7, "autocolorscale": false }, "hoveron": "points", "hoverinfo": "text", "showlegend": false }, { "mode": "markers", "text": " Sacks : 0.032", "type": "scatter", "xsrc": "skpurnell:2:2072ca", "ysrc": "skpurnell:2:4e4bc1", "frame": null, "xaxis": "x", "yaxis": "y", "marker": { "line": { "color": "rgba(212,156,0,1)", "width": 1.8897637795275593 }, "size": 25.86729650327182, "color": "rgba(212,156,0,1)", "symbol": "circle", "opacity": 0.7, "autocolorscale": false }, "hoveron": "points", "hoverinfo": "text", "showlegend": false }, { "mode": "markers", "text": " Assists : 0.03", "type": "scatter", "xsrc": "skpurnell:2:845587", "ysrc": "skpurnell:2:4ce347", "frame": null, "xaxis": "x", "yaxis": "y", "marker": { "line": { "color": "rgba(213,154,0,1)", "width": 1.8897637795275593 }, "size": 25.67095688361821, "color": "rgba(213,154,0,1)", "symbol": "circle", "opacity": 0.7, "autocolorscale": false }, "hoveron": "points", "hoverinfo": "text", "showlegend": false }, { "mode": "markers", "text": " Fumble Recoveries : 0.02", "type": "scatter", "xsrc": "skpurnell:2:20123c", "ysrc": "skpurnell:2:942c77", "frame": null, "xaxis": "x", "yaxis": "y", "marker": { "line": { "color": "rgba(218,147,0,1)", "width": 1.8897637795275593 }, "size": 24.661586427100822, "color": "rgba(218,147,0,1)", "symbol": "circle", "opacity": 0.7, "autocolorscale": false }, "hoveron": "points", "hoverinfo": "text", "showlegend": false }, { "mode": "markers", "text": " Solo Tackles : -0.002", "type": "scatter", "xsrc": "skpurnell:2:b01b98", "ysrc": "skpurnell:2:6bea8c", "frame": null, "xaxis": "x", "yaxis": "y", "marker": { "line": { "color": "rgba(227,129,0,1)", "width": 1.8897637795275593 }, "size": 22.2477958292567, "color": "rgba(227,129,0,1)", "symbol": "circle", "opacity": 0.7, "autocolorscale": false }, "hoveron": "points", "hoverinfo": "text", "showlegend": false }, { "mode": "markers", "text": " Hurries : -0.004", "type": "scatter", "xsrc": "skpurnell:2:64776b", "ysrc": "skpurnell:2:a1a8b3", "frame": null, "xaxis": "x", "yaxis": "y", "marker": { "line": { "color": "rgba(228,127,0,1)", "width": 1.8897637795275593 }, "size": 22.01252165874625, "color": "rgba(228,127,0,1)", "symbol": "circle", "opacity": 0.7, "autocolorscale": false }, "hoveron": "points", "hoverinfo": "text", "showlegend": false }, { "mode": "markers", "type": "scatter", "xsrc": "skpurnell:2:d52a3c", "ysrc": "skpurnell:2:05884d", "frame": null, "xaxis": "x", "yaxis": "y", "marker": { "line": { "color": "rgba(229,126,0,1)", "width": 1.8897637795275593 }, "size": 21.893738673784625, "color": "rgba(229,126,0,1)", "symbol": "circle", "opacity": 0.7, "autocolorscale": false }, "hoveron": "points", "textsrc": "skpurnell:2:2a5e52", "hoverinfo": "text", "showlegend": false }, { "mode": "markers", "text": " TFL : -0.046", "type": "scatter", "xsrc": "skpurnell:2:157fbe", "ysrc": "skpurnell:2:7104c8", "frame": null, "xaxis": "x", "yaxis": "y", "marker": { "line": { "color": "rgba(244,85,0,1)", "width": 1.8897637795275593 }, "size": 16.072209673359986, "color": "rgba(244,85,0,1)", "symbol": "circle", "opacity": 0.7, "autocolorscale": false }, "hoveron": "points", "hoverinfo": "text", "showlegend": false }, { "mode": "markers", "text": " Forced Fumbles : -0.081", "type": "scatter", "xsrc": "skpurnell:2:95bff3", "ysrc": "skpurnell:2:5b8cb4", "frame": null, "xaxis": "x", "yaxis": "y", "marker": { "line": { "color": "rgba(255,0,0,1)", "width": 1.8897637795275593 }, "size": 3.7795275590551185, "color": "rgba(255,0,0,1)", "symbol": "circle", "opacity": 0.7, "autocolorscale": false }, "hoveron": "points", "hoverinfo": "text", "showlegend": false }, { "line": { "dash": "solid", "color": "rgba(0,0,0,1)", "width": 3.7795275590551185 }, "mode": "lines", "text": "", "type": "scatter", "xsrc": "skpurnell:2:8b70f7", "ysrc": "skpurnell:2:985b49", "frame": null, "xaxis": "x", "yaxis": "y", "hoveron": "points", "hoverinfo": "text", "showlegend": false } ], "layout": { "font": { "size": 14.611872146118724, "color": "rgba(0,0,0,1)", "family": "" }, "title": { "x": 0, "font": { "size": 17.534246575342465, "color": "rgba(0,0,0,1)", "family": "" }, "text": "Weighted Score Contribution for B.J. Hill", "xref": "paper" }, "xaxis": { "type": "linear", "range": [ 0.4, 14.6 ], "ticks": "outside", "title": { "font": { "size": 14.611872146118724, "color": "rgba(0,0,0,1)", "family": "" }, "text": "Weighted Metrics" }, "anchor": "y", "domain": [ 0, 1 ], "nticks": null, "ticklen": 3.652968036529681, "showgrid": true, "showline": false, "tickfont": { "size": 11.68949771689498, "color": "rgba(77,77,77,1)", "family": "" }, "tickmode": "array", "ticktext": [ "Weighted Interceptions", "Weighted Interception Touchdowns", "Weighted Pass Deflections", "Weighted Forced Fumbles", "Weighted Fumble Recoveries", "Weighted Fumble Touchdowns", "Weighted Sacks", "Weighted Solo Tackles", "Weighted Assists", "Weighted TFL", "Weighted QBHits", "Weighted Hurries", "Weighted QB Knockdowns", "Weighted QB Pressures" ], "tickvals": [ 1, 2, 3, 3.9999999999999996, 5, 6, 7, 7.999999999999999, 9, 10, 11, 12, 13, 14 ], "zeroline": false, "autorange": false, "gridcolor": "rgba(255,255,255,1)", "gridwidth": 0.66417600664176, "linecolor": null, "linewidth": 0, "tickangle": -45, "tickcolor": "rgba(51,51,51,1)", "tickwidth": 0.66417600664176, "automargin": true, "hoverformat": ".2f", "categoryarray": [ "Weighted Interceptions", "Weighted Interception Touchdowns", "Weighted Pass Deflections", "Weighted Forced Fumbles", "Weighted Fumble Recoveries", "Weighted Fumble Touchdowns", "Weighted Sacks", "Weighted Solo Tackles", "Weighted Assists", "Weighted TFL", "Weighted QBHits", "Weighted Hurries", "Weighted QB Knockdowns", "Weighted QB Pressures" ], "categoryorder": "array", "showticklabels": true }, "yaxis": { "type": "linear", "range": [ -0.09440000000000001, 0.2004 ], "ticks": "outside", "title": { "font": { "size": 14.611872146118724, "color": "rgba(0,0,0,1)", "family": "" }, "text": "Weighted Score" }, "anchor": "x", "domain": [ 0, 1 ], "nticks": null, "ticklen": 3.652968036529681, "showgrid": true, "showline": false, "tickfont": { "size": 11.68949771689498, "color": "rgba(77,77,77,1)", "family": "" }, "tickmode": "array", "ticktext": [ "0.0", "0.1", "0.2" ], "tickvals": [ 0, 0.09999999999999998, 0.20000000000000004 ], "zeroline": false, "autorange": false, "gridcolor": "rgba(255,255,255,1)", "gridwidth": 0.66417600664176, "linecolor": null, "linewidth": 0, "tickangle": 0, "tickcolor": "rgba(51,51,51,1)", "tickwidth": 0.66417600664176, "automargin": true, "hoverformat": ".2f", "categoryarray": [ "0.0", "0.1", "0.2" ], "categoryorder": "array", "showticklabels": true }, "legend": { "font": { "size": 11.68949771689498, "color": "rgba(0,0,0,1)", "family": "" }, "title": { "font": { "size": 14.611872146118724, "color": "rgba(0,0,0,1)", "family": "" }, "text": "" }, "bgcolor": "rgba(255,255,255,1)", "bordercolor": "transparent", "borderwidth": 1.8897637795275593 }, "margin": { "b": 123.28149381037623, "l": 43.105022831050235, "r": 7.305936073059362, "t": 40.1071857726508 }, "shapes": [ { "x0": 0, "x1": 1, "y0": 0, "y1": 1, "line": { "color": null, "width": 0, "linetype": [] }, "type": "rect", "xref": "paper", "yref": "paper", "fillcolor": null } ], "barmode": "relative", "autosize": true, "dragmode": "pan", "hovermode": "closest", "showlegend": false, "plot_bgcolor": "rgba(235,235,235,1)", "paper_bgcolor": "rgba(255,255,255,1)" } }, "height": null, "width": null, "user": { "profile_url": "https://chart-studio.plotly.com/~skpurnell", "avatar_url": "https://storage.googleapis.com/plotly-prod-profiles/95.jpg", "background_url": "https://storage.googleapis.com/plotly-prod-profiles/bg-14.jpg", "bio": "", "nickname": "", "website": "", "stream_tokens": null, "feature_set_id": null, "csrf_token": null, "date_joined": "2024-03-31 12:34:35", "mapbox_access_tokens": null, "has_password": null, "username": "skpurnell", "email": null, "is_active": null, "readonly": null, "is_dash_creator": null, "dash_created_count": null, "is_chart_creator": null, "charts_created_count": null } }, { "creation_time": "2024-03-31T14:34:20.024968Z", "comments": { "results": [], "count": 0 }, "parented": true, "embed_url": "https://chart-studio.plotly.com/~13579246801357924680abcde/3.embed", "fid": "13579246801357924680abcde:3", "filename": "POWDER", "filetype": "plot", "img_url": "https://storage.googleapis.com/plotly-prod-images/13579246801357924680abcde/3/9_53N4Q3556YDXPOSSQ0F9S5TFE81J83.png", "image_urls": { "default": "https://storage.googleapis.com/plotly-prod-images/13579246801357924680abcde/3/2_DTNCPTXB5GB2WOMV5YMCTV28PBO5ZR.png", "block-thumb": "https://storage.googleapis.com/plotly-prod-images/13579246801357924680abcde/3/8_58BOSCBTWBH4PVSJ2O39UNNYINEYW4.png", "list-thumb": "https://storage.googleapis.com/plotly-prod-images/13579246801357924680abcde/3/9_53N4Q3556YDXPOSSQ0F9S5TFE81J83.png" }, "api_urls": { "files": "https://api.plotly.com/v2/files/13579246801357924680abcde:3", "plots": "https://api.plotly.com/v2/plots/13579246801357924680abcde:3", "parent": "https://api.plotly.com/v2/folders/home?user=13579246801357924680abcde" }, "owner": "13579246801357924680abcde", "parent": -1, "preview": "", "referencers": [], "references": [], "title": "", "views": 2, "web_url": "https://chart-studio.plotly.com/~13579246801357924680abcde/3/", "world_readable": true, "date_modified": "2024-03-31T14:34:20.036Z", "stars": { "results": [], "count": 0 }, "collaborators": { "results": [], "count": 0 }, "subfolder_count": null, "refresh_interval": null, "organize_view_url": "https://chart-studio.plotly.com/~13579246801357924680abcde/3/", "current_user_permission": "read", "is_theme": null, "is_template": false, "autosize": true, "caption": "", "figure": { "data": [ { "meta": { "columnNames": { "x": "A", "y": "B" } }, "mode": "lines", "name": "CaO", "type": "scatter", "xsrc": "13579246801357924680abcde:2:47a0ea", "ysrc": "13579246801357924680abcde:2:ed3c04" }, { "meta": { "columnNames": { "x": "A", "y": "C" } }, "mode": "lines", "name": "CaCl2", "type": "scatter", "xsrc": "13579246801357924680abcde:2:47a0ea", "ysrc": "13579246801357924680abcde:2:f6ce0a" }, { "meta": { "columnNames": { "x": "A", "y": "D" } }, "mode": "lines", "name": "MgO", "type": "scatter", "xsrc": "13579246801357924680abcde:2:47a0ea", "ysrc": "13579246801357924680abcde:2:7f01ac" }, { "meta": { "columnNames": { "x": "A", "y": "E" } }, "mode": "lines", "name": "MgCl2", "type": "scatter", "xsrc": "13579246801357924680abcde:2:47a0ea", "ysrc": "13579246801357924680abcde:2:c8973a", "visible": true }, { "meta": { "columnNames": { "x": "A", "y": "F" } }, "mode": "lines", "name": "BaCl2", "type": "scatter", "xsrc": "13579246801357924680abcde:2:47a0ea", "ysrc": "13579246801357924680abcde:2:bd5892" }, { "line": { "color": "rgb(0, 0, 0)" }, "meta": { "columnNames": { "x": "A", "y": "G" } }, "mode": "lines", "name": "市售", "type": "scatter", "xsrc": "13579246801357924680abcde:2:47a0ea", "ysrc": "13579246801357924680abcde:2:1f1c61", "stackgroup": null }, { "line": { "color": "rgb(0, 0, 0)" }, "meta": { "columnNames": { "x": "A", "y": "H" } }, "mode": "lines", "name": "自製", "type": "scatter", "xsrc": "13579246801357924680abcde:2:47a0ea", "ysrc": "13579246801357924680abcde:2:ceb7dd", "stackgroup": null } ], "frames": [], "layout": { "title": { "text": "化學藥劑濃度與粉筆粉塵掉落關係圖" }, "xaxis": { "type": "linear", "range": [ 1, 5 ], "domain": [ 0, 0.35 ], "autorange": true }, "yaxis": { "type": "linear", "range": [ -0.0026166666666666664, 0.26171666666666665 ], "title": { "text": "掉落重量 (g)" }, "autorange": true }, "legend": { "x": 0.005227272727272753, "y": 1 }, "autosize": true, "template": { "data": { "bar": [ { "type": "bar", "marker": { "colorbar": { "ticks": "", "outlinewidth": 0 } } } ], "table": [ { "type": "table", "cells": { "fill": { "color": "#EBF0F8" }, "line": { "color": "white" } }, "header": { "fill": { "color": "#C8D4E3" }, "line": { "color": "white" } } } ], "carpet": [ { "type": "carpet", "aaxis": { "gridcolor": "#C8D4E3", "linecolor": "#C8D4E3", "endlinecolor": "#2a3f5f", "minorgridcolor": "#C8D4E3", "startlinecolor": "#2a3f5f" }, "baxis": { "gridcolor": "#C8D4E3", "linecolor": "#C8D4E3", "endlinecolor": "#2a3f5f", "minorgridcolor": "#C8D4E3", "startlinecolor": "#2a3f5f" } } ], "mesh3d": [ { "type": "mesh3d", "colorbar": { "ticks": "", "outlinewidth": 0 } } ], "contour": [ { "type": "contour", "colorbar": { "ticks": "", "outlinewidth": 0 }, "autocolorscale": true } ], "heatmap": [ { "type": "heatmap", "colorbar": { "ticks": "", "outlinewidth": 0 }, "autocolorscale": true } ], "scatter": [ { "type": "scatter", "marker": { "colorbar": { "ticks": "", "outlinewidth": 0 } } } ], "surface": [ { "type": "surface", "colorbar": { "ticks": "", "outlinewidth": 0 } } ], "heatmapgl": [ { "type": "heatmapgl", "colorbar": { "ticks": "", "outlinewidth": 0 } } ], "histogram": [ { "type": "histogram", "marker": { "colorbar": { "ticks": "", "outlinewidth": 0 } } } ], "parcoords": [ { "line": { "colorbar": { "ticks": "", "outlinewidth": 0 } }, "type": "parcoords" } ], "scatter3d": [ { "type": "scatter3d", "marker": { "colorbar": { "ticks": "", "outlinewidth": 0 } } } ], "scattergl": [ { "type": "scattergl", "marker": { "colorbar": { "ticks": "", "outlinewidth": 0 } } } ], "choropleth": [ { "type": "choropleth", "colorbar": { "ticks": "", "outlinewidth": 0 } } ], "scattergeo": [ { "type": "scattergeo", "marker": { "colorbar": { "ticks": "", "outlinewidth": 0 } } } ], "histogram2d": [ { "type": "histogram2d", "colorbar": { "ticks": "", "outlinewidth": 0 }, "autocolorscale": true } ], "scatterpolar": [ { "type": "scatterpolar", "marker": { "colorbar": { "ticks": "", "outlinewidth": 0 } } } ], "contourcarpet": [ { "type": "contourcarpet", "colorbar": { "ticks": "", "outlinewidth": 0 } } ], "scattercarpet": [ { "type": "scattercarpet", "marker": { "colorbar": { "ticks": "", "outlinewidth": 0 } } } ], "scattermapbox": [ { "type": "scattermapbox", "marker": { "colorbar": { "ticks": "", "outlinewidth": 0 } } } ], "scatterpolargl": [ { "type": "scatterpolargl", "marker": { "colorbar": { "ticks": "", "outlinewidth": 0 } } } ], "scatterternary": [ { "type": "scatterternary", "marker": { "colorbar": { "ticks": "", "outlinewidth": 0 } } } ], "histogram2dcontour": [ { "type": "histogram2dcontour", "colorbar": { "ticks": "", "outlinewidth": 0 }, "autocolorscale": true } ] }, "layout": { "geo": { "bgcolor": "white", "showland": true, "lakecolor": "white", "landcolor": "white", "showlakes": true, "subunitcolor": "#C8D4E3" }, "font": { "color": "#2a3f5f" }, "polar": { "bgcolor": "white", "radialaxis": { "ticks": "", "gridcolor": "#EBF0F8", "linecolor": "#EBF0F8" }, "angularaxis": { "ticks": "", "gridcolor": "#EBF0F8", "linecolor": "#EBF0F8" } }, "scene": { "xaxis": { "ticks": "", "gridcolor": "#DFE8F3", "gridwidth": 2, "linecolor": "#EBF0F8", "zerolinecolor": "#EBF0F8", "showbackground": true, "backgroundcolor": "white" }, "yaxis": { "ticks": "", "gridcolor": "#DFE8F3", "gridwidth": 2, "linecolor": "#EBF0F8", "zerolinecolor": "#EBF0F8", "showbackground": true, "backgroundcolor": "white" }, "zaxis": { "ticks": "", "gridcolor": "#DFE8F3", "gridwidth": 2, "linecolor": "#EBF0F8", "zerolinecolor": "#EBF0F8", "showbackground": true, "backgroundcolor": "white" } }, "title": { "x": 0.05 }, "xaxis": { "ticks": "", "gridcolor": "#EBF0F8", "linecolor": "#EBF0F8", "automargin": true, "zerolinecolor": "#EBF0F8", "zerolinewidth": 2 }, "yaxis": { "ticks": "", "gridcolor": "#EBF0F8", "linecolor": "#EBF0F8", "automargin": true, "zerolinecolor": "#EBF0F8", "zerolinewidth": 2 }, "ternary": { "aaxis": { "ticks": "", "gridcolor": "#DFE8F3", "linecolor": "#A2B1C6" }, "baxis": { "ticks": "", "gridcolor": "#DFE8F3", "linecolor": "#A2B1C6" }, "caxis": { "ticks": "", "gridcolor": "#DFE8F3", "linecolor": "#A2B1C6" }, "bgcolor": "white" }, "colorway": [ "#636efa", "#EF553B", "#00cc96", "#ab63fa", "#19d3f3", "#e763fa", "#fecb52", "#ffa15a", "#ff6692", "#b6e880" ], "hovermode": "closest", "colorscale": { "diverging": [ [ 0, "#8e0152" ], [ 0.1, "#c51b7d" ], [ 0.2, "#de77ae" ], [ 0.3, "#f1b6da" ], [ 0.4, "#fde0ef" ], [ 0.5, "#f7f7f7" ], [ 0.6, "#e6f5d0" ], [ 0.7, "#b8e186" ], [ 0.8, "#7fbc41" ], [ 0.9, "#4d9221" ], [ 1, "#276419" ] ], "sequential": [ [ 0, "#0508b8" ], [ 0.0893854748603352, "#1910d8" ], [ 0.1787709497206704, "#3c19f0" ], [ 0.2681564245810056, "#6b1cfb" ], [ 0.3575418994413408, "#981cfd" ], [ 0.44692737430167595, "#bf1cfd" ], [ 0.5363128491620112, "#dd2bfd" ], [ 0.6256983240223464, "#f246fe" ], [ 0.7150837988826816, "#fc67fd" ], [ 0.8044692737430168, "#fe88fc" ], [ 0.8938547486033519, "#fea5fd" ], [ 0.9832402234636871, "#febefe" ], [ 1, "#fec3fe" ] ], "sequentialminus": [ [ 0, "#0508b8" ], [ 0.0893854748603352, "#1910d8" ], [ 0.1787709497206704, "#3c19f0" ], [ 0.2681564245810056, "#6b1cfb" ], [ 0.3575418994413408, "#981cfd" ], [ 0.44692737430167595, "#bf1cfd" ], [ 0.5363128491620112, "#dd2bfd" ], [ 0.6256983240223464, "#f246fe" ], [ 0.7150837988826816, "#fc67fd" ], [ 0.8044692737430168, "#fe88fc" ], [ 0.8938547486033519, "#fea5fd" ], [ 0.9832402234636871, "#febefe" ], [ 1, "#fec3fe" ] ] }, "plot_bgcolor": "white", "paper_bgcolor": "white", "shapedefaults": { "line": { "width": 0 }, "opacity": 0.4, "fillcolor": "#506784" }, "annotationdefaults": { "arrowhead": 0, "arrowcolor": "#506784", "arrowwidth": 1 } }, "themeRef": "PLOTLY_WHITE" }, "annotations": [ { "x": 2.875160031225605, "y": 0.11271348195329088, "text": "自製" }, { "x": 3.462201405152225, "y": 0.09419331210191084, "ax": -45, "ay": 26, "text": "市售" } ] } }, "height": null, "width": null, "user": { "profile_url": "https://chart-studio.plotly.com/~13579246801357924680abcde", "avatar_url": "https://storage.googleapis.com/plotly-prod-profiles/58.jpg", "background_url": "https://storage.googleapis.com/plotly-prod-profiles/bg-10.jpg", "bio": "", "nickname": "", "website": "", "stream_tokens": null, "feature_set_id": null, "csrf_token": null, "date_joined": "2024-03-20 13:43:58", "mapbox_access_tokens": null, "has_password": null, "username": "13579246801357924680abcde", "email": null, "is_active": null, "readonly": null, "is_dash_creator": null, "dash_created_count": null, "is_chart_creator": null, "charts_created_count": null } }, { "creation_time": "2024-03-31T14:31:00.284383Z", "comments": { "results": [], "count": 0 }, "parented": true, "embed_url": "https://chart-studio.plotly.com/~202410170/3.embed", "fid": "202410170:3", "filename": "Plot 3", "filetype": "plot", "img_url": "https://storage.googleapis.com/plotly-prod-images/202410170/3/9_KDUUK186EDE9732E1NVMEDKUPONQYK.png", "image_urls": { "default": "https://storage.googleapis.com/plotly-prod-images/202410170/3/2_8G7GNSKUEI6GRUCZ7LQFGU54CI9UA0.png", "block-thumb": "https://storage.googleapis.com/plotly-prod-images/202410170/3/8_8D8FQOJAJD7T5BV577OBNYSFCF44C3.png", "list-thumb": "https://storage.googleapis.com/plotly-prod-images/202410170/3/9_KDUUK186EDE9732E1NVMEDKUPONQYK.png" }, "api_urls": { "files": "https://api.plotly.com/v2/files/202410170:3", "plots": "https://api.plotly.com/v2/plots/202410170:3", "parent": "https://api.plotly.com/v2/folders/home?user=202410170" }, "owner": "202410170", "parent": -1, "preview": "", "referencers": [], "references": [], "title": "", "views": 1, "web_url": "https://chart-studio.plotly.com/~202410170/3/", "world_readable": true, "date_modified": "2024-04-02T12:23:44.409Z", "stars": { "results": [], "count": 0 }, "collaborators": { "results": [], "count": 0 }, "subfolder_count": null, "refresh_interval": null, "organize_view_url": "https://chart-studio.plotly.com/~202410170/3/", "current_user_permission": "read", "is_theme": null, "is_template": false, "autosize": true, "caption": "", "figure": { "data": [ { "meta": { "columnNames": { "x": "A", "y": "B" } }, "mode": "lines", "type": "scatter", "xsrc": "202410170:7:32f08e", "ysrc": "202410170:7:40c82f" } ], "frames": [], "layout": { "scene": { "camera": { "up": { "x": 0, "y": 0, "z": 1 }, "eye": { "x": 1.2499999999999998, "y": 1.25, "z": 1.25 }, "center": { "x": 0, "y": 0, "z": 0 }, "projection": { "type": "perspective" } }, "aspectmode": "auto", "aspectratio": { "x": 1, "y": 1, "z": 1 } }, "title": { "text": "Acceleration - Time Graph" }, "xaxis": { "type": "linear", "range": [ 0, 3.5 ], "autorange": true }, "yaxis": { "type": "linear", "range": [ 0.0027777777777777783, 0.14722222222222223 ], "autorange": true }, "autosize": true, "template": { "data": { "bar": [ { "type": "bar", "marker": { "colorbar": { "ticks": "", "outlinewidth": 0 } } } ], "table": [ { "type": "table", "cells": { "fill": { "color": "#EBF0F8" }, "line": { "color": "white" } }, "header": { "fill": { "color": "#C8D4E3" }, "line": { "color": "white" } } } ], "carpet": [ { "type": "carpet", "aaxis": { "gridcolor": "#C8D4E3", "linecolor": "#C8D4E3", "endlinecolor": "#2a3f5f", "minorgridcolor": "#C8D4E3", "startlinecolor": "#2a3f5f" }, "baxis": { "gridcolor": "#C8D4E3", "linecolor": "#C8D4E3", "endlinecolor": "#2a3f5f", "minorgridcolor": "#C8D4E3", "startlinecolor": "#2a3f5f" } } ], "mesh3d": [ { "type": "mesh3d", "colorbar": { "ticks": "", "outlinewidth": 0 } } ], "contour": [ { "type": "contour", "colorbar": { "ticks": "", "outlinewidth": 0 }, "autocolorscale": true } ], "heatmap": [ { "type": "heatmap", "colorbar": { "ticks": "", "outlinewidth": 0 }, "autocolorscale": true } ], "scatter": [ { "type": "scatter", "marker": { "colorbar": { "ticks": "", "outlinewidth": 0 } } } ], "surface": [ { "type": "surface", "colorbar": { "ticks": "", "outlinewidth": 0 } } ], "heatmapgl": [ { "type": "heatmapgl", "colorbar": { "ticks": "", "outlinewidth": 0 } } ], "histogram": [ { "type": "histogram", "marker": { "colorbar": { "ticks": "", "outlinewidth": 0 } } } ], "parcoords": [ { "line": { "colorbar": { "ticks": "", "outlinewidth": 0 } }, "type": "parcoords" } ], "scatter3d": [ { "type": "scatter3d", "marker": { "colorbar": { "ticks": "", "outlinewidth": 0 } } } ], "scattergl": [ { "type": "scattergl", "marker": { "colorbar": { "ticks": "", "outlinewidth": 0 } } } ], "choropleth": [ { "type": "choropleth", "colorbar": { "ticks": "", "outlinewidth": 0 } } ], "scattergeo": [ { "type": "scattergeo", "marker": { "colorbar": { "ticks": "", "outlinewidth": 0 } } } ], "histogram2d": [ { "type": "histogram2d", "colorbar": { "ticks": "", "outlinewidth": 0 }, "autocolorscale": true } ], "scatterpolar": [ { "type": "scatterpolar", "marker": { "colorbar": { "ticks": "", "outlinewidth": 0 } } } ], "contourcarpet": [ { "type": "contourcarpet", "colorbar": { "ticks": "", "outlinewidth": 0 } } ], "scattercarpet": [ { "type": "scattercarpet", "marker": { "colorbar": { "ticks": "", "outlinewidth": 0 } } } ], "scattermapbox": [ { "type": "scattermapbox", "marker": { "colorbar": { "ticks": "", "outlinewidth": 0 } } } ], "scatterpolargl": [ { "type": "scatterpolargl", "marker": { "colorbar": { "ticks": "", "outlinewidth": 0 } } } ], "scatterternary": [ { "type": "scatterternary", "marker": { "colorbar": { "ticks": "", "outlinewidth": 0 } } } ], "histogram2dcontour": [ { "type": "histogram2dcontour", "colorbar": { "ticks": "", "outlinewidth": 0 }, "autocolorscale": true } ] }, "layout": { "geo": { "bgcolor": "white", "showland": true, "lakecolor": "white", "landcolor": "white", "showlakes": true, "subunitcolor": "#C8D4E3" }, "font": { "color": "#2a3f5f" }, "polar": { "bgcolor": "white", "radialaxis": { "ticks": "", "gridcolor": "#EBF0F8", "linecolor": "#EBF0F8" }, "angularaxis": { "ticks": "", "gridcolor": "#EBF0F8", "linecolor": "#EBF0F8" } }, "scene": { "xaxis": { "ticks": "", "gridcolor": "#DFE8F3", "gridwidth": 2, "linecolor": "#EBF0F8", "zerolinecolor": "#EBF0F8", "showbackground": true, "backgroundcolor": "white" }, "yaxis": { "ticks": "", "gridcolor": "#DFE8F3", "gridwidth": 2, "linecolor": "#EBF0F8", "zerolinecolor": "#EBF0F8", "showbackground": true, "backgroundcolor": "white" }, "zaxis": { "ticks": "", "gridcolor": "#DFE8F3", "gridwidth": 2, "linecolor": "#EBF0F8", "zerolinecolor": "#EBF0F8", "showbackground": true, "backgroundcolor": "white" } }, "title": { "x": 0.05 }, "xaxis": { "ticks": "", "gridcolor": "#EBF0F8", "linecolor": "#EBF0F8", "automargin": true, "zerolinecolor": "#EBF0F8", "zerolinewidth": 2 }, "yaxis": { "ticks": "", "gridcolor": "#EBF0F8", "linecolor": "#EBF0F8", "automargin": true, "zerolinecolor": "#EBF0F8", "zerolinewidth": 2 }, "ternary": { "aaxis": { "ticks": "", "gridcolor": "#DFE8F3", "linecolor": "#A2B1C6" }, "baxis": { "ticks": "", "gridcolor": "#DFE8F3", "linecolor": "#A2B1C6" }, "caxis": { "ticks": "", "gridcolor": "#DFE8F3", "linecolor": "#A2B1C6" }, "bgcolor": "white" }, "colorway": [ "#636efa", "#EF553B", "#00cc96", "#ab63fa", "#19d3f3", "#e763fa", "#fecb52", "#ffa15a", "#ff6692", "#b6e880" ], "hovermode": "closest", "colorscale": { "diverging": [ [ 0, "#8e0152" ], [ 0.1, "#c51b7d" ], [ 0.2, "#de77ae" ], [ 0.3, "#f1b6da" ], [ 0.4, "#fde0ef" ], [ 0.5, "#f7f7f7" ], [ 0.6, "#e6f5d0" ], [ 0.7, "#b8e186" ], [ 0.8, "#7fbc41" ], [ 0.9, "#4d9221" ], [ 1, "#276419" ] ], "sequential": [ [ 0, "#0508b8" ], [ 0.0893854748603352, "#1910d8" ], [ 0.1787709497206704, "#3c19f0" ], [ 0.2681564245810056, "#6b1cfb" ], [ 0.3575418994413408, "#981cfd" ], [ 0.44692737430167595, "#bf1cfd" ], [ 0.5363128491620112, "#dd2bfd" ], [ 0.6256983240223464, "#f246fe" ], [ 0.7150837988826816, "#fc67fd" ], [ 0.8044692737430168, "#fe88fc" ], [ 0.8938547486033519, "#fea5fd" ], [ 0.9832402234636871, "#febefe" ], [ 1, "#fec3fe" ] ], "sequentialminus": [ [ 0, "#0508b8" ], [ 0.0893854748603352, "#1910d8" ], [ 0.1787709497206704, "#3c19f0" ], [ 0.2681564245810056, "#6b1cfb" ], [ 0.3575418994413408, "#981cfd" ], [ 0.44692737430167595, "#bf1cfd" ], [ 0.5363128491620112, "#dd2bfd" ], [ 0.6256983240223464, "#f246fe" ], [ 0.7150837988826816, "#fc67fd" ], [ 0.8044692737430168, "#fe88fc" ], [ 0.8938547486033519, "#fea5fd" ], [ 0.9832402234636871, "#febefe" ], [ 1, "#fec3fe" ] ] }, "plot_bgcolor": "white", "paper_bgcolor": "white", "shapedefaults": { "line": { "width": 0 }, "opacity": 0.4, "fillcolor": "#506784" }, "annotationdefaults": { "arrowhead": 0, "arrowcolor": "#506784", "arrowwidth": 1 } }, "themeRef": "PLOTLY_WHITE" } } }, "height": null, "width": null, "user": { "profile_url": "https://chart-studio.plotly.com/~202410170", "avatar_url": "https://storage.googleapis.com/plotly-prod-profiles/15.jpg", "background_url": "https://storage.googleapis.com/plotly-prod-profiles/bg-0.jpg", "bio": "", "nickname": "", "website": "", "stream_tokens": null, "feature_set_id": null, "csrf_token": null, "date_joined": "2024-03-17 13:29:42", "mapbox_access_tokens": null, "has_password": null, "username": "202410170", "email": null, "is_active": null, "readonly": null, "is_dash_creator": null, "dash_created_count": null, "is_chart_creator": null, "charts_created_count": null } }, { "creation_time": "2024-03-31T14:06:41.788783Z", "comments": { "results": [], "count": 0 }, "parented": true, "embed_url": "https://chart-studio.plotly.com/~nishadbasheer/1.embed", "fid": "nishadbasheer:1", "filename": "Combinator RPM Graph", "filetype": "plot", "img_url": "https://storage.googleapis.com/plotly-prod-images/nishadbasheer/1/9_GYKMM2RTAIK5EQR35ODS50J9ZFOV8V.png", "image_urls": { "default": "https://storage.googleapis.com/plotly-prod-images/nishadbasheer/1/2_MPOVT2WJZ7XC48RR8OPG6AUED2ZOD9.png", "block-thumb": "https://storage.googleapis.com/plotly-prod-images/nishadbasheer/1/8_HAJZDCBF19SYM40RRZ7ZON4YI9FLXC.png", "list-thumb": "https://storage.googleapis.com/plotly-prod-images/nishadbasheer/1/9_GYKMM2RTAIK5EQR35ODS50J9ZFOV8V.png" }, "api_urls": { "files": "https://api.plotly.com/v2/files/nishadbasheer:1", "plots": "https://api.plotly.com/v2/plots/nishadbasheer:1", "parent": "https://api.plotly.com/v2/folders/home?user=nishadbasheer" }, "owner": "nishadbasheer", "parent": -1, "preview": "", "referencers": [], "references": [], "title": "", "views": 2, "web_url": "https://chart-studio.plotly.com/~nishadbasheer/1/", "world_readable": true, "date_modified": "2024-03-31T14:11:22.962Z", "stars": { "results": [], "count": 0 }, "collaborators": { "results": [], "count": 0 }, "subfolder_count": null, "refresh_interval": null, "organize_view_url": "https://chart-studio.plotly.com/~nishadbasheer/1/", "current_user_permission": "read", "is_theme": null, "is_template": false, "autosize": true, "caption": "", "figure": { "data": [ { "meta": { "columnNames": { "x": "A", "y": "B" } }, "mode": "markers+lines+text", "type": "scatter", "xsrc": "nishadbasheer:0:57848f", "ysrc": "nishadbasheer:0:edc389" } ], "frames": [], "layout": { "title": { "x": 0.5, "font": { "family": "Arial" }, "text": "<b>COMBINATOR - RPM CHART PLOTTED ON 04 FEB 24</b>" }, "xaxis": { "type": "linear", "range": [ -5.942579968536969, 10.94257996853697 ], "title": { "text": "NOTCH POSITION" }, "domain": [ 0, 1 ], "autorange": true, "showspikes": true }, "yaxis": { "type": "linear", "range": [ 489.44690265486724, 1040.5530973451328 ], "title": { "text": "RPM" }, "autorange": true, "showspikes": true }, "margin": { "b": 74, "r": 95, "t": 64, "pad": 6 }, "modebar": { "color": "rgba(68, 68, 68, 0.3)", "bgcolor": "rgba(199, 236, 151, 0.5)", "activecolor": "rgba(15, 15, 15, 0.7)", "orientation": "v" }, "autosize": true, "dragmode": "zoom", "template": { "data": { "bar": [ { "type": "bar", "marker": { "colorbar": { "ticks": "", "outlinewidth": 0 } } } ], "table": [ { "type": "table", "cells": { "fill": { "color": "#EBF0F8" }, "line": { "color": "white" } }, "header": { "fill": { "color": "#C8D4E3" }, "line": { "color": "white" } } } ], "carpet": [ { "type": "carpet", "aaxis": { "gridcolor": "#C8D4E3", "linecolor": "#C8D4E3", "endlinecolor": "#2a3f5f", "minorgridcolor": "#C8D4E3", "startlinecolor": "#2a3f5f" }, "baxis": { "gridcolor": "#C8D4E3", "linecolor": "#C8D4E3", "endlinecolor": "#2a3f5f", "minorgridcolor": "#C8D4E3", "startlinecolor": "#2a3f5f" } } ], "mesh3d": [ { "type": "mesh3d", "colorbar": { "ticks": "", "outlinewidth": 0 } } ], "contour": [ { "type": "contour", "colorbar": { "ticks": "", "outlinewidth": 0 }, "autocolorscale": true } ], "heatmap": [ { "type": "heatmap", "colorbar": { "ticks": "", "outlinewidth": 0 }, "autocolorscale": true } ], "scatter": [ { "type": "scatter", "marker": { "colorbar": { "ticks": "", "outlinewidth": 0 } } } ], "surface": [ { "type": "surface", "colorbar": { "ticks": "", "outlinewidth": 0 } } ], "heatmapgl": [ { "type": "heatmapgl", "colorbar": { "ticks": "", "outlinewidth": 0 } } ], "histogram": [ { "type": "histogram", "marker": { "colorbar": { "ticks": "", "outlinewidth": 0 } } } ], "parcoords": [ { "line": { "colorbar": { "ticks": "", "outlinewidth": 0 } }, "type": "parcoords" } ], "scatter3d": [ { "type": "scatter3d", "marker": { "colorbar": { "ticks": "", "outlinewidth": 0 } } } ], "scattergl": [ { "type": "scattergl", "marker": { "colorbar": { "ticks": "", "outlinewidth": 0 } } } ], "choropleth": [ { "type": "choropleth", "colorbar": { "ticks": "", "outlinewidth": 0 } } ], "scattergeo": [ { "type": "scattergeo", "marker": { "colorbar": { "ticks": "", "outlinewidth": 0 } } } ], "histogram2d": [ { "type": "histogram2d", "colorbar": { "ticks": "", "outlinewidth": 0 }, "autocolorscale": true } ], "scatterpolar": [ { "type": "scatterpolar", "marker": { "colorbar": { "ticks": "", "outlinewidth": 0 } } } ], "contourcarpet": [ { "type": "contourcarpet", "colorbar": { "ticks": "", "outlinewidth": 0 } } ], "scattercarpet": [ { "type": "scattercarpet", "marker": { "colorbar": { "ticks": "", "outlinewidth": 0 } } } ], "scattermapbox": [ { "type": "scattermapbox", "marker": { "colorbar": { "ticks": "", "outlinewidth": 0 } } } ], "scatterpolargl": [ { "type": "scatterpolargl", "marker": { "colorbar": { "ticks": "", "outlinewidth": 0 } } } ], "scatterternary": [ { "type": "scatterternary", "marker": { "colorbar": { "ticks": "", "outlinewidth": 0 } } } ], "histogram2dcontour": [ { "type": "histogram2dcontour", "colorbar": { "ticks": "", "outlinewidth": 0 }, "autocolorscale": true } ] }, "layout": { "geo": { "bgcolor": "white", "showland": true, "lakecolor": "white", "landcolor": "white", "showlakes": true, "subunitcolor": "#C8D4E3" }, "font": { "color": "#2a3f5f" }, "polar": { "bgcolor": "white", "radialaxis": { "ticks": "", "gridcolor": "#EBF0F8", "linecolor": "#EBF0F8" }, "angularaxis": { "ticks": "", "gridcolor": "#EBF0F8", "linecolor": "#EBF0F8" } }, "scene": { "xaxis": { "ticks": "", "gridcolor": "#DFE8F3", "gridwidth": 2, "linecolor": "#EBF0F8", "zerolinecolor": "#EBF0F8", "showbackground": true, "backgroundcolor": "white" }, "yaxis": { "ticks": "", "gridcolor": "#DFE8F3", "gridwidth": 2, "linecolor": "#EBF0F8", "zerolinecolor": "#EBF0F8", "showbackground": true, "backgroundcolor": "white" }, "zaxis": { "ticks": "", "gridcolor": "#DFE8F3", "gridwidth": 2, "linecolor": "#EBF0F8", "zerolinecolor": "#EBF0F8", "showbackground": true, "backgroundcolor": "white" } }, "title": { "x": 0.05 }, "xaxis": { "ticks": "", "gridcolor": "#EBF0F8", "linecolor": "#EBF0F8", "automargin": true, "zerolinecolor": "#EBF0F8", "zerolinewidth": 2 }, "yaxis": { "ticks": "", "gridcolor": "#EBF0F8", "linecolor": "#EBF0F8", "automargin": true, "zerolinecolor": "#EBF0F8", "zerolinewidth": 2 }, "ternary": { "aaxis": { "ticks": "", "gridcolor": "#DFE8F3", "linecolor": "#A2B1C6" }, "baxis": { "ticks": "", "gridcolor": "#DFE8F3", "linecolor": "#A2B1C6" }, "caxis": { "ticks": "", "gridcolor": "#DFE8F3", "linecolor": "#A2B1C6" }, "bgcolor": "white" }, "colorway": [ "#636efa", "#EF553B", "#00cc96", "#ab63fa", "#19d3f3", "#e763fa", "#fecb52", "#ffa15a", "#ff6692", "#b6e880" ], "hovermode": "closest", "colorscale": { "diverging": [ [ 0, "#8e0152" ], [ 0.1, "#c51b7d" ], [ 0.2, "#de77ae" ], [ 0.3, "#f1b6da" ], [ 0.4, "#fde0ef" ], [ 0.5, "#f7f7f7" ], [ 0.6, "#e6f5d0" ], [ 0.7, "#b8e186" ], [ 0.8, "#7fbc41" ], [ 0.9, "#4d9221" ], [ 1, "#276419" ] ], "sequential": [ [ 0, "#0508b8" ], [ 0.0893854748603352, "#1910d8" ], [ 0.1787709497206704, "#3c19f0" ], [ 0.2681564245810056, "#6b1cfb" ], [ 0.3575418994413408, "#981cfd" ], [ 0.44692737430167595, "#bf1cfd" ], [ 0.5363128491620112, "#dd2bfd" ], [ 0.6256983240223464, "#f246fe" ], [ 0.7150837988826816, "#fc67fd" ], [ 0.8044692737430168, "#fe88fc" ], [ 0.8938547486033519, "#fea5fd" ], [ 0.9832402234636871, "#febefe" ], [ 1, "#fec3fe" ] ], "sequentialminus": [ [ 0, "#0508b8" ], [ 0.0893854748603352, "#1910d8" ], [ 0.1787709497206704, "#3c19f0" ], [ 0.2681564245810056, "#6b1cfb" ], [ 0.3575418994413408, "#981cfd" ], [ 0.44692737430167595, "#bf1cfd" ], [ 0.5363128491620112, "#dd2bfd" ], [ 0.6256983240223464, "#f246fe" ], [ 0.7150837988826816, "#fc67fd" ], [ 0.8044692737430168, "#fe88fc" ], [ 0.8938547486033519, "#fea5fd" ], [ 0.9832402234636871, "#febefe" ], [ 1, "#fec3fe" ] ] }, "plot_bgcolor": "white", "paper_bgcolor": "white", "shapedefaults": { "line": { "width": 0 }, "opacity": 0.4, "fillcolor": "#506784" }, "annotationdefaults": { "arrowhead": 0, "arrowcolor": "#506784", "arrowwidth": 1 } }, "themeRef": "PLOTLY_WHITE" }, "hovermode": "x" } }, "height": null, "width": null, "user": { "profile_url": "https://chart-studio.plotly.com/~nishadbasheer", "avatar_url": "https://storage.googleapis.com/plotly-prod-profiles/40.jpg", "background_url": "https://storage.googleapis.com/plotly-prod-profiles/bg-5.jpg", "bio": "", "nickname": "", "website": "", "stream_tokens": null, "feature_set_id": null, "csrf_token": null, "date_joined": "2024-03-31 14:05:51", "mapbox_access_tokens": null, "has_password": null, "username": "nishadbasheer", "email": null, "is_active": null, "readonly": null, "is_dash_creator": null, "dash_created_count": null, "is_chart_creator": null, "charts_created_count": null } }, { "creation_time": "2024-03-31T13:45:05.914872Z", "comments": { "results": [], "count": 0 }, "parented": true, "embed_url": "https://chart-studio.plotly.com/~jaatmehriya/1.embed", "fid": "jaatmehriya:1", "filename": "Plot 1", "filetype": "plot", "img_url": "https://storage.googleapis.com/plotly-prod-images/jaatmehriya/1/9_PVXYO35HLATU2PUNAU00QBLS1WKTA2.png", "image_urls": { "default": "https://storage.googleapis.com/plotly-prod-images/jaatmehriya/1/2_I7JH8THWF62BMFIUVHKUQ5SSPPGDJ5.png", "block-thumb": "https://storage.googleapis.com/plotly-prod-images/jaatmehriya/1/8_XTWPGZ901FWX73NKD4JDX1YB5S0JUV.png", "list-thumb": "https://storage.googleapis.com/plotly-prod-images/jaatmehriya/1/9_PVXYO35HLATU2PUNAU00QBLS1WKTA2.png" }, "api_urls": { "files": "https://api.plotly.com/v2/files/jaatmehriya:1", "plots": "https://api.plotly.com/v2/plots/jaatmehriya:1", "parent": "https://api.plotly.com/v2/folders/home?user=jaatmehriya" }, "owner": "jaatmehriya", "parent": -1, "preview": "", "referencers": [], "references": [], "title": "", "views": 1, "web_url": "https://chart-studio.plotly.com/~jaatmehriya/1/", "world_readable": true, "date_modified": "2024-04-01T16:36:30.254Z", "stars": { "results": [], "count": 0 }, "collaborators": { "results": [], "count": 0 }, "subfolder_count": null, "refresh_interval": null, "organize_view_url": "https://chart-studio.plotly.com/~jaatmehriya/1/", "current_user_permission": "read", "is_theme": null, "is_template": false, "autosize": true, "caption": "", "figure": { "data": [ { "meta": { "columnNames": { "x": "No. of oscillation", "y": "Logarithm of Relative Amplitude log10[ᶿ(n)/ᶿ(0)" } }, "mode": "lines", "type": "scatter", "xsrc": "jaatmehriya:0:e8f225", "ysrc": "jaatmehriya:0:7cd804" } ], "frames": [], "layout": { "title": { "text": "No. of Oscillation V/S logarithm of relative amplitude (normal water distance of vane 44.5cm)" }, "xaxis": { "type": "linear", "range": [ 0, 40 ], "title": { "text": "No. of oscillation" }, "autorange": true }, "yaxis": { "type": "linear", "range": [ -0.475, 0.024999999999999994 ], "title": { "text": "Logarithm of Relative Amplitude log10[ᶿ(n)/ᶿ(0)" }, "autorange": true }, "autosize": true, "template": { "data": { "bar": [ { "type": "bar", "marker": { "colorbar": { "ticks": "", "outlinewidth": 0 } } } ], "table": [ { "type": "table", "cells": { "fill": { "color": "#EBF0F8" }, "line": { "color": "white" } }, "header": { "fill": { "color": "#C8D4E3" }, "line": { "color": "white" } } } ], "carpet": [ { "type": "carpet", "aaxis": { "gridcolor": "#C8D4E3", "linecolor": "#C8D4E3", "endlinecolor": "#2a3f5f", "minorgridcolor": "#C8D4E3", "startlinecolor": "#2a3f5f" }, "baxis": { "gridcolor": "#C8D4E3", "linecolor": "#C8D4E3", "endlinecolor": "#2a3f5f", "minorgridcolor": "#C8D4E3", "startlinecolor": "#2a3f5f" } } ], "mesh3d": [ { "type": "mesh3d", "colorbar": { "ticks": "", "outlinewidth": 0 } } ], "contour": [ { "type": "contour", "colorbar": { "ticks": "", "outlinewidth": 0 }, "autocolorscale": true } ], "heatmap": [ { "type": "heatmap", "colorbar": { "ticks": "", "outlinewidth": 0 }, "autocolorscale": true } ], "scatter": [ { "type": "scatter", "marker": { "colorbar": { "ticks": "", "outlinewidth": 0 } } } ], "surface": [ { "type": "surface", "colorbar": { "ticks": "", "outlinewidth": 0 } } ], "heatmapgl": [ { "type": "heatmapgl", "colorbar": { "ticks": "", "outlinewidth": 0 } } ], "histogram": [ { "type": "histogram", "marker": { "colorbar": { "ticks": "", "outlinewidth": 0 } } } ], "parcoords": [ { "line": { "colorbar": { "ticks": "", "outlinewidth": 0 } }, "type": "parcoords" } ], "scatter3d": [ { "type": "scatter3d", "marker": { "colorbar": { "ticks": "", "outlinewidth": 0 } } } ], "scattergl": [ { "type": "scattergl", "marker": { "colorbar": { "ticks": "", "outlinewidth": 0 } } } ], "choropleth": [ { "type": "choropleth", "colorbar": { "ticks": "", "outlinewidth": 0 } } ], "scattergeo": [ { "type": "scattergeo", "marker": { "colorbar": { "ticks": "", "outlinewidth": 0 } } } ], "histogram2d": [ { "type": "histogram2d", "colorbar": { "ticks": "", "outlinewidth": 0 }, "autocolorscale": true } ], "scatterpolar": [ { "type": "scatterpolar", "marker": { "colorbar": { "ticks": "", "outlinewidth": 0 } } } ], "contourcarpet": [ { "type": "contourcarpet", "colorbar": { "ticks": "", "outlinewidth": 0 } } ], "scattercarpet": [ { "type": "scattercarpet", "marker": { "colorbar": { "ticks": "", "outlinewidth": 0 } } } ], "scattermapbox": [ { "type": "scattermapbox", "marker": { "colorbar": { "ticks": "", "outlinewidth": 0 } } } ], "scatterpolargl": [ { "type": "scatterpolargl", "marker": { "colorbar": { "ticks": "", "outlinewidth": 0 } } } ], "scatterternary": [ { "type": "scatterternary", "marker": { "colorbar": { "ticks": "", "outlinewidth": 0 } } } ], "histogram2dcontour": [ { "type": "histogram2dcontour", "colorbar": { "ticks": "", "outlinewidth": 0 }, "autocolorscale": true } ] }, "layout": { "geo": { "bgcolor": "white", "showland": true, "lakecolor": "white", "landcolor": "white", "showlakes": true, "subunitcolor": "#C8D4E3" }, "font": { "color": "#2a3f5f" }, "polar": { "bgcolor": "white", "radialaxis": { "ticks": "", "gridcolor": "#EBF0F8", "linecolor": "#EBF0F8" }, "angularaxis": { "ticks": "", "gridcolor": "#EBF0F8", "linecolor": "#EBF0F8" } }, "scene": { "xaxis": { "ticks": "", "gridcolor": "#DFE8F3", "gridwidth": 2, "linecolor": "#EBF0F8", "zerolinecolor": "#EBF0F8", "showbackground": true, "backgroundcolor": "white" }, "yaxis": { "ticks": "", "gridcolor": "#DFE8F3", "gridwidth": 2, "linecolor": "#EBF0F8", "zerolinecolor": "#EBF0F8", "showbackground": true, "backgroundcolor": "white" }, "zaxis": { "ticks": "", "gridcolor": "#DFE8F3", "gridwidth": 2, "linecolor": "#EBF0F8", "zerolinecolor": "#EBF0F8", "showbackground": true, "backgroundcolor": "white" } }, "title": { "x": 0.05 }, "xaxis": { "ticks": "", "gridcolor": "#EBF0F8", "linecolor": "#EBF0F8", "automargin": true, "zerolinecolor": "#EBF0F8", "zerolinewidth": 2 }, "yaxis": { "ticks": "", "gridcolor": "#EBF0F8", "linecolor": "#EBF0F8", "automargin": true, "zerolinecolor": "#EBF0F8", "zerolinewidth": 2 }, "ternary": { "aaxis": { "ticks": "", "gridcolor": "#DFE8F3", "linecolor": "#A2B1C6" }, "baxis": { "ticks": "", "gridcolor": "#DFE8F3", "linecolor": "#A2B1C6" }, "caxis": { "ticks": "", "gridcolor": "#DFE8F3", "linecolor": "#A2B1C6" }, "bgcolor": "white" }, "colorway": [ "#636efa", "#EF553B", "#00cc96", "#ab63fa", "#19d3f3", "#e763fa", "#fecb52", "#ffa15a", "#ff6692", "#b6e880" ], "hovermode": "closest", "colorscale": { "diverging": [ [ 0, "#8e0152" ], [ 0.1, "#c51b7d" ], [ 0.2, "#de77ae" ], [ 0.3, "#f1b6da" ], [ 0.4, "#fde0ef" ], [ 0.5, "#f7f7f7" ], [ 0.6, "#e6f5d0" ], [ 0.7, "#b8e186" ], [ 0.8, "#7fbc41" ], [ 0.9, "#4d9221" ], [ 1, "#276419" ] ], "sequential": [ [ 0, "#0508b8" ], [ 0.0893854748603352, "#1910d8" ], [ 0.1787709497206704, "#3c19f0" ], [ 0.2681564245810056, "#6b1cfb" ], [ 0.3575418994413408, "#981cfd" ], [ 0.44692737430167595, "#bf1cfd" ], [ 0.5363128491620112, "#dd2bfd" ], [ 0.6256983240223464, "#f246fe" ], [ 0.7150837988826816, "#fc67fd" ], [ 0.8044692737430168, "#fe88fc" ], [ 0.8938547486033519, "#fea5fd" ], [ 0.9832402234636871, "#febefe" ], [ 1, "#fec3fe" ] ], "sequentialminus": [ [ 0, "#0508b8" ], [ 0.0893854748603352, "#1910d8" ], [ 0.1787709497206704, "#3c19f0" ], [ 0.2681564245810056, "#6b1cfb" ], [ 0.3575418994413408, "#981cfd" ], [ 0.44692737430167595, "#bf1cfd" ], [ 0.5363128491620112, "#dd2bfd" ], [ 0.6256983240223464, "#f246fe" ], [ 0.7150837988826816, "#fc67fd" ], [ 0.8044692737430168, "#fe88fc" ], [ 0.8938547486033519, "#fea5fd" ], [ 0.9832402234636871, "#febefe" ], [ 1, "#fec3fe" ] ] }, "plot_bgcolor": "white", "paper_bgcolor": "white", "shapedefaults": { "line": { "width": 0 }, "opacity": 0.4, "fillcolor": "#506784" }, "annotationdefaults": { "arrowhead": 0, "arrowcolor": "#506784", "arrowwidth": 1 } }, "themeRef": "PLOTLY_WHITE" } } }, "height": null, "width": null, "user": { "profile_url": "https://chart-studio.plotly.com/~jaatmehriya", "avatar_url": "https://storage.googleapis.com/plotly-prod-profiles/67.jpg", "background_url": "https://storage.googleapis.com/plotly-prod-profiles/bg-11.jpg", "bio": "", "nickname": "", "website": "", "stream_tokens": null, "feature_set_id": null, "csrf_token": null, "date_joined": "2024-03-31 13:44:20", "mapbox_access_tokens": null, "has_password": null, "username": "jaatmehriya", "email": null, "is_active": null, "readonly": null, "is_dash_creator": null, "dash_created_count": null, "is_chart_creator": null, "charts_created_count": null } } ] }
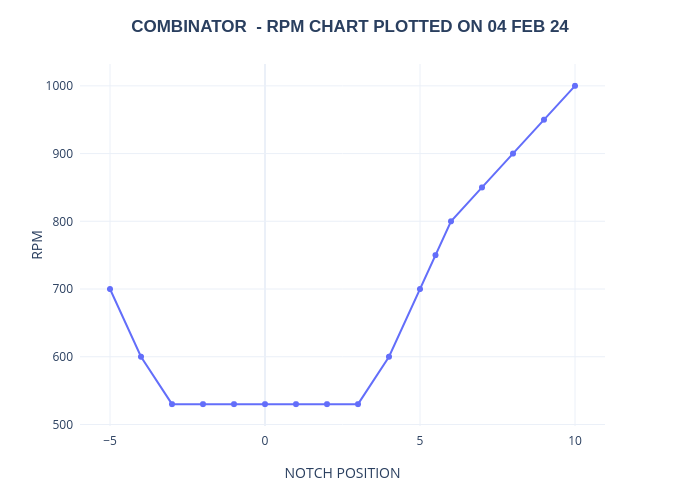