Plots


Jump to API response

This endpoint handles manipulation of Plotly plot files.

Reference

Authorization


Any user with or without a Plotly account may view public plots. For private plots, see authentication.

Actions


list

Listing all public plots can be done via a GET request to this endpoint. By default, plots will be listed in order of date created. The order_by query parameter is accepted at this endpoint. Currently, only ordering by views is supported. It is possible to filter the plots by quality with min_quality or max_quality as query parameter.

Example:

// GET https://api.plotly.com/v2/plots/ ---> 200

// GET https://api.plotly.com/v2/plots/?order_by=-views ---> 200

// GET https://api.plotly.com/v2/plots/?min_quality=5 ---> 200

// GET https://api.plotly.com/v2/plots/?max_quality=5 ---> 200

feed

Listing all handpicked feed plots can be done via a GET request to this endpoint. By default, plots will be listed in a random order.

Example:

// GET https://api.plotly.com/v2/plots/feed ---> 200

create

You can create new plot resources here. The only required field is 'figure'. Currently, the figure is restricted to only contain references to grid data. That is, this will fail if raw data arrays are passed in. To create and manipulate underlying grids for plots, see the grids endpoint.

Example:

// This fails because a figure field is required.
// POST https://api.plotly.com/v2/plots ---> 400 Bad Request
{}

// This fails because the figure has raw data
//POST https://api.plotly.com/v2/plots ---> 400 Bad Request
{
    "figure": {"data": [{"y": ['this', 'is', 'raw', 'data']}]}
}

// This succeeds because the figure has src keys, not raw data.
//POST https://api.plotly.com/v2/plots ---> 200 OK
{
    "figure": {"data": [{"ysrc": "sven:88:u8nd62"}]}
}

When creating a grid, you can optionally specify a source_fid to specify where a plot has come from:

  • source_fid: the fid of a plot that was copied (and presumably edited) to produce this one

detail

There is a lot of meta information stored about plot files including filename, title, share_url, and content_url to name a few.

This information can only be reached with a GET to this endpoint.

Example:

// GET https://api.plotly.com/v2/plots/iheartgraphs:90

content

The contents of a plot can be downloaded via the content resource. The plot content contains referenced grid/column data by default. If you wish to return the raw grid/column data, the inline_data=true query must be included in the request url. The Content-Type header will be appropriately set for the response body.

Alternatively, you can set ?map_data=unreadable to append a mapping of sources to data that belongs to grids which are unreadable for the requestor. This is useful when you have read access to another users plot, but that plot contains grid references which you don't have access to.

Examples:

// Returns referenced grid/column data
// GET https://api.plotly.com/v2/plots/iheartgraphs:90/content ---> 200 OK

// Returns full grid/column data
// GET https://api.plotly.com/v2/plots/iheartgraphs:90/content?inline_data=true ---> 200 OK

// Returns full grid/column data when requestor doesn't have permission
// to read the referenced grid.
// GET https://api.plotly.com/v2/plots/iheartgraphs:90/content?map_data=unreadable ---> 200 OK

GET /v2/plots?cursor=cD0yMDI0LTAzLTIzKzIzJTNBMTIlM0E1Ni4zNjczMTQlMkIwMCUzQTAw&format=api
HTTP 200 OK
Allow: GET, POST, HEAD, OPTIONS
Content-Type: application/json
Vary: Accept

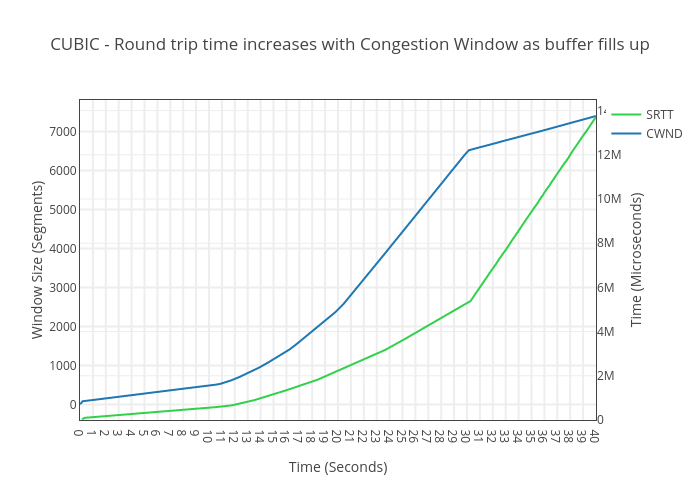
{
    "next": "https://api.plot.ly/v2/plots?cursor=cD0yMDI0LTAzLTIzKzE4JTNBMzUlM0ExMS4yNDMxODMlMkIwMCUzQTAw&format=api",
    "previous": "https://api.plot.ly/v2/plots?cursor=cj0xJnA9MjAyNC0wMy0yMysyMyUzQTA4JTNBMDYuNTM0MDIxJTJCMDAlM0EwMA%3D%3D&format=api",
    "results": [
        {
            "creation_time": "2024-03-23T23:08:06.534021Z",
            "comments": {
                "results": [],
                "count": 0
            },
            "parented": true,
            "embed_url": "https://chart-studio.plotly.com/~mm.crj/51.embed",
            "fid": "mm.crj:51",
            "filename": "Min temp plot",
            "filetype": "plot",
            "img_url": "https://storage.googleapis.com/plotly-prod-images/mm.crj/51/9_A4EAFSZQYQ0MGFPUVTBCCKBJKVO124.png",
            "image_urls": {
                "default": "https://storage.googleapis.com/plotly-prod-images/mm.crj/51/2_G6SYO6JW0QRPQ0PS4JF7G6UIGJOG3L.png",
                "block-thumb": "https://storage.googleapis.com/plotly-prod-images/mm.crj/51/8_TE0T17Y3DJ8DW7Q3YWNFE04XCUF8YO.png",
                "list-thumb": "https://storage.googleapis.com/plotly-prod-images/mm.crj/51/9_A4EAFSZQYQ0MGFPUVTBCCKBJKVO124.png"
            },
            "api_urls": {
                "files": "https://api.plotly.com/v2/files/mm.crj:51",
                "plots": "https://api.plotly.com/v2/plots/mm.crj:51",
                "parent": "https://api.plotly.com/v2/folders/home?user=mm.crj"
            },
            "owner": "mm.crj",
            "parent": -1,
            "preview": "",
            "referencers": [],
            "references": [],
            "title": "",
            "views": 3,
            "web_url": "https://chart-studio.plotly.com/~mm.crj/51/",
            "world_readable": true,
            "date_modified": "2024-03-23T23:08:06.545Z",
            "stars": {
                "results": [],
                "count": 0
            },
            "collaborators": {
                "results": [],
                "count": 0
            },
            "subfolder_count": null,
            "refresh_interval": null,
            "organize_view_url": "https://chart-studio.plotly.com/~mm.crj/51/",
            "current_user_permission": "read",
            "is_theme": null,
            "is_template": false,
            "autosize": true,
            "caption": "",
            "figure": {
                "data": [
                    {
                        "meta": {
                            "columnNames": {
                                "x": "A",
                                "y": "B"
                            }
                        },
                        "mode": "lines",
                        "name": "RCP 2.6 2030",
                        "type": "scatter",
                        "xsrc": "mm.crj:50:e02791",
                        "ysrc": "mm.crj:50:362aad",
                        "visible": true
                    },
                    {
                        "meta": {
                            "columnNames": {
                                "x": "A",
                                "y": "C"
                            }
                        },
                        "mode": "lines",
                        "name": "RCP 4.5 2030",
                        "type": "scatter",
                        "xsrc": "mm.crj:50:e02791",
                        "ysrc": "mm.crj:50:34e422",
                        "visible": true,
                        "stackgroup": null
                    },
                    {
                        "meta": {
                            "columnNames": {
                                "x": "A",
                                "y": "D"
                            }
                        },
                        "mode": "lines",
                        "name": "RCP 8.5 2030",
                        "type": "scatter",
                        "xsrc": "mm.crj:50:e02791",
                        "ysrc": "mm.crj:50:8a1064",
                        "visible": true,
                        "stackgroup": null
                    },
                    {
                        "meta": {
                            "columnNames": {
                                "x": "A",
                                "y": "E"
                            }
                        },
                        "mode": "lines",
                        "name": "RCP 2.6 2050",
                        "type": "scatter",
                        "xsrc": "mm.crj:50:e02791",
                        "ysrc": "mm.crj:50:32e329",
                        "visible": true,
                        "stackgroup": null
                    },
                    {
                        "meta": {
                            "columnNames": {
                                "x": "A",
                                "y": "F"
                            }
                        },
                        "mode": "lines",
                        "name": "RCP 4.5 2050",
                        "type": "scatter",
                        "xsrc": "mm.crj:50:e02791",
                        "ysrc": "mm.crj:50:4fe34b",
                        "visible": true,
                        "stackgroup": null
                    },
                    {
                        "meta": {
                            "columnNames": {
                                "x": "A",
                                "y": "G"
                            }
                        },
                        "mode": "lines",
                        "name": "RCP 8.5 2050",
                        "type": "scatter",
                        "xsrc": "mm.crj:50:e02791",
                        "ysrc": "mm.crj:50:08e40a",
                        "visible": true,
                        "stackgroup": null
                    },
                    {
                        "meta": {
                            "columnNames": {
                                "x": "A",
                                "y": "H"
                            }
                        },
                        "mode": "lines",
                        "name": "RCP 2.6 2070",
                        "type": "scatter",
                        "xsrc": "mm.crj:50:e02791",
                        "ysrc": "mm.crj:50:78e17d",
                        "visible": true,
                        "stackgroup": null
                    },
                    {
                        "meta": {
                            "columnNames": {
                                "x": "A",
                                "y": "I"
                            }
                        },
                        "mode": "lines",
                        "name": "RCP 4.5 2070",
                        "type": "scatter",
                        "xsrc": "mm.crj:50:e02791",
                        "ysrc": "mm.crj:50:910fa8",
                        "visible": true,
                        "stackgroup": null
                    },
                    {
                        "meta": {
                            "columnNames": {
                                "x": "A",
                                "y": "J"
                            }
                        },
                        "mode": "lines",
                        "name": "RCP 8.5 2070",
                        "type": "scatter",
                        "xsrc": "mm.crj:50:e02791",
                        "ysrc": "mm.crj:50:d94b3e",
                        "visible": true,
                        "stackgroup": null
                    },
                    {
                        "meta": {
                            "columnNames": {
                                "x": "A",
                                "y": "K"
                            }
                        },
                        "mode": "lines",
                        "name": "RCP 2.6 2100",
                        "type": "scatter",
                        "xsrc": "mm.crj:50:e02791",
                        "ysrc": "mm.crj:50:73e56d",
                        "visible": true,
                        "stackgroup": null
                    },
                    {
                        "meta": {
                            "columnNames": {
                                "x": "A",
                                "y": "L"
                            }
                        },
                        "mode": "lines",
                        "name": "RCP 4.5 2100",
                        "type": "scatter",
                        "xsrc": "mm.crj:50:e02791",
                        "ysrc": "mm.crj:50:13e98e",
                        "visible": true,
                        "stackgroup": null
                    },
                    {
                        "meta": {
                            "columnNames": {
                                "x": "A",
                                "y": "M"
                            }
                        },
                        "mode": "lines",
                        "name": "RCP 8.5 2100",
                        "type": "scatter",
                        "xsrc": "mm.crj:50:e02791",
                        "ysrc": "mm.crj:50:a8e38b",
                        "visible": true,
                        "stackgroup": null
                    }
                ],
                "frames": [],
                "layout": {
                    "title": {
                        "text": "Anomaly of maximum temperature (°C) from RCP scenarios over predicted periods relative to baseline"
                    },
                    "xaxis": {
                        "type": "category",
                        "range": [
                            0,
                            18
                        ],
                        "autorange": true
                    },
                    "yaxis": {
                        "type": "linear",
                        "range": [
                            -6.894444444444445,
                            10.994444444444444
                        ],
                        "autorange": true
                    },
                    "autosize": true,
                    "template": {
                        "data": {
                            "bar": [
                                {
                                    "type": "bar",
                                    "marker": {
                                        "colorbar": {
                                            "ticks": "",
                                            "outlinewidth": 0
                                        }
                                    }
                                }
                            ],
                            "table": [
                                {
                                    "type": "table",
                                    "cells": {
                                        "fill": {
                                            "color": "#EBF0F8"
                                        },
                                        "line": {
                                            "color": "white"
                                        }
                                    },
                                    "header": {
                                        "fill": {
                                            "color": "#C8D4E3"
                                        },
                                        "line": {
                                            "color": "white"
                                        }
                                    }
                                }
                            ],
                            "carpet": [
                                {
                                    "type": "carpet",
                                    "aaxis": {
                                        "gridcolor": "#C8D4E3",
                                        "linecolor": "#C8D4E3",
                                        "endlinecolor": "#2a3f5f",
                                        "minorgridcolor": "#C8D4E3",
                                        "startlinecolor": "#2a3f5f"
                                    },
                                    "baxis": {
                                        "gridcolor": "#C8D4E3",
                                        "linecolor": "#C8D4E3",
                                        "endlinecolor": "#2a3f5f",
                                        "minorgridcolor": "#C8D4E3",
                                        "startlinecolor": "#2a3f5f"
                                    }
                                }
                            ],
                            "mesh3d": [
                                {
                                    "type": "mesh3d",
                                    "colorbar": {
                                        "ticks": "",
                                        "outlinewidth": 0
                                    }
                                }
                            ],
                            "contour": [
                                {
                                    "type": "contour",
                                    "colorbar": {
                                        "ticks": "",
                                        "outlinewidth": 0
                                    },
                                    "autocolorscale": true
                                }
                            ],
                            "heatmap": [
                                {
                                    "type": "heatmap",
                                    "colorbar": {
                                        "ticks": "",
                                        "outlinewidth": 0
                                    },
                                    "autocolorscale": true
                                }
                            ],
                            "scatter": [
                                {
                                    "type": "scatter",
                                    "marker": {
                                        "colorbar": {
                                            "ticks": "",
                                            "outlinewidth": 0
                                        }
                                    }
                                }
                            ],
                            "surface": [
                                {
                                    "type": "surface",
                                    "colorbar": {
                                        "ticks": "",
                                        "outlinewidth": 0
                                    }
                                }
                            ],
                            "heatmapgl": [
                                {
                                    "type": "heatmapgl",
                                    "colorbar": {
                                        "ticks": "",
                                        "outlinewidth": 0
                                    }
                                }
                            ],
                            "histogram": [
                                {
                                    "type": "histogram",
                                    "marker": {
                                        "colorbar": {
                                            "ticks": "",
                                            "outlinewidth": 0
                                        }
                                    }
                                }
                            ],
                            "parcoords": [
                                {
                                    "line": {
                                        "colorbar": {
                                            "ticks": "",
                                            "outlinewidth": 0
                                        }
                                    },
                                    "type": "parcoords"
                                }
                            ],
                            "scatter3d": [
                                {
                                    "type": "scatter3d",
                                    "marker": {
                                        "colorbar": {
                                            "ticks": "",
                                            "outlinewidth": 0
                                        }
                                    }
                                }
                            ],
                            "scattergl": [
                                {
                                    "type": "scattergl",
                                    "marker": {
                                        "colorbar": {
                                            "ticks": "",
                                            "outlinewidth": 0
                                        }
                                    }
                                }
                            ],
                            "choropleth": [
                                {
                                    "type": "choropleth",
                                    "colorbar": {
                                        "ticks": "",
                                        "outlinewidth": 0
                                    }
                                }
                            ],
                            "scattergeo": [
                                {
                                    "type": "scattergeo",
                                    "marker": {
                                        "colorbar": {
                                            "ticks": "",
                                            "outlinewidth": 0
                                        }
                                    }
                                }
                            ],
                            "histogram2d": [
                                {
                                    "type": "histogram2d",
                                    "colorbar": {
                                        "ticks": "",
                                        "outlinewidth": 0
                                    },
                                    "autocolorscale": true
                                }
                            ],
                            "scatterpolar": [
                                {
                                    "type": "scatterpolar",
                                    "marker": {
                                        "colorbar": {
                                            "ticks": "",
                                            "outlinewidth": 0
                                        }
                                    }
                                }
                            ],
                            "contourcarpet": [
                                {
                                    "type": "contourcarpet",
                                    "colorbar": {
                                        "ticks": "",
                                        "outlinewidth": 0
                                    }
                                }
                            ],
                            "scattercarpet": [
                                {
                                    "type": "scattercarpet",
                                    "marker": {
                                        "colorbar": {
                                            "ticks": "",
                                            "outlinewidth": 0
                                        }
                                    }
                                }
                            ],
                            "scattermapbox": [
                                {
                                    "type": "scattermapbox",
                                    "marker": {
                                        "colorbar": {
                                            "ticks": "",
                                            "outlinewidth": 0
                                        }
                                    }
                                }
                            ],
                            "scatterpolargl": [
                                {
                                    "type": "scatterpolargl",
                                    "marker": {
                                        "colorbar": {
                                            "ticks": "",
                                            "outlinewidth": 0
                                        }
                                    }
                                }
                            ],
                            "scatterternary": [
                                {
                                    "type": "scatterternary",
                                    "marker": {
                                        "colorbar": {
                                            "ticks": "",
                                            "outlinewidth": 0
                                        }
                                    }
                                }
                            ],
                            "histogram2dcontour": [
                                {
                                    "type": "histogram2dcontour",
                                    "colorbar": {
                                        "ticks": "",
                                        "outlinewidth": 0
                                    },
                                    "autocolorscale": true
                                }
                            ]
                        },
                        "layout": {
                            "geo": {
                                "bgcolor": "white",
                                "showland": true,
                                "lakecolor": "white",
                                "landcolor": "white",
                                "showlakes": true,
                                "subunitcolor": "#C8D4E3"
                            },
                            "font": {
                                "color": "#2a3f5f"
                            },
                            "polar": {
                                "bgcolor": "white",
                                "radialaxis": {
                                    "ticks": "",
                                    "gridcolor": "#EBF0F8",
                                    "linecolor": "#EBF0F8"
                                },
                                "angularaxis": {
                                    "ticks": "",
                                    "gridcolor": "#EBF0F8",
                                    "linecolor": "#EBF0F8"
                                }
                            },
                            "scene": {
                                "xaxis": {
                                    "ticks": "",
                                    "gridcolor": "#DFE8F3",
                                    "gridwidth": 2,
                                    "linecolor": "#EBF0F8",
                                    "zerolinecolor": "#EBF0F8",
                                    "showbackground": true,
                                    "backgroundcolor": "white"
                                },
                                "yaxis": {
                                    "ticks": "",
                                    "gridcolor": "#DFE8F3",
                                    "gridwidth": 2,
                                    "linecolor": "#EBF0F8",
                                    "zerolinecolor": "#EBF0F8",
                                    "showbackground": true,
                                    "backgroundcolor": "white"
                                },
                                "zaxis": {
                                    "ticks": "",
                                    "gridcolor": "#DFE8F3",
                                    "gridwidth": 2,
                                    "linecolor": "#EBF0F8",
                                    "zerolinecolor": "#EBF0F8",
                                    "showbackground": true,
                                    "backgroundcolor": "white"
                                }
                            },
                            "title": {
                                "x": 0.05
                            },
                            "xaxis": {
                                "ticks": "",
                                "gridcolor": "#EBF0F8",
                                "linecolor": "#EBF0F8",
                                "automargin": true,
                                "zerolinecolor": "#EBF0F8",
                                "zerolinewidth": 2
                            },
                            "yaxis": {
                                "ticks": "",
                                "gridcolor": "#EBF0F8",
                                "linecolor": "#EBF0F8",
                                "automargin": true,
                                "zerolinecolor": "#EBF0F8",
                                "zerolinewidth": 2
                            },
                            "ternary": {
                                "aaxis": {
                                    "ticks": "",
                                    "gridcolor": "#DFE8F3",
                                    "linecolor": "#A2B1C6"
                                },
                                "baxis": {
                                    "ticks": "",
                                    "gridcolor": "#DFE8F3",
                                    "linecolor": "#A2B1C6"
                                },
                                "caxis": {
                                    "ticks": "",
                                    "gridcolor": "#DFE8F3",
                                    "linecolor": "#A2B1C6"
                                },
                                "bgcolor": "white"
                            },
                            "colorway": [
                                "#636efa",
                                "#EF553B",
                                "#00cc96",
                                "#ab63fa",
                                "#19d3f3",
                                "#e763fa",
                                "#fecb52",
                                "#ffa15a",
                                "#ff6692",
                                "#b6e880"
                            ],
                            "hovermode": "closest",
                            "colorscale": {
                                "diverging": [
                                    [
                                        0,
                                        "#8e0152"
                                    ],
                                    [
                                        0.1,
                                        "#c51b7d"
                                    ],
                                    [
                                        0.2,
                                        "#de77ae"
                                    ],
                                    [
                                        0.3,
                                        "#f1b6da"
                                    ],
                                    [
                                        0.4,
                                        "#fde0ef"
                                    ],
                                    [
                                        0.5,
                                        "#f7f7f7"
                                    ],
                                    [
                                        0.6,
                                        "#e6f5d0"
                                    ],
                                    [
                                        0.7,
                                        "#b8e186"
                                    ],
                                    [
                                        0.8,
                                        "#7fbc41"
                                    ],
                                    [
                                        0.9,
                                        "#4d9221"
                                    ],
                                    [
                                        1,
                                        "#276419"
                                    ]
                                ],
                                "sequential": [
                                    [
                                        0,
                                        "#0508b8"
                                    ],
                                    [
                                        0.0893854748603352,
                                        "#1910d8"
                                    ],
                                    [
                                        0.1787709497206704,
                                        "#3c19f0"
                                    ],
                                    [
                                        0.2681564245810056,
                                        "#6b1cfb"
                                    ],
                                    [
                                        0.3575418994413408,
                                        "#981cfd"
                                    ],
                                    [
                                        0.44692737430167595,
                                        "#bf1cfd"
                                    ],
                                    [
                                        0.5363128491620112,
                                        "#dd2bfd"
                                    ],
                                    [
                                        0.6256983240223464,
                                        "#f246fe"
                                    ],
                                    [
                                        0.7150837988826816,
                                        "#fc67fd"
                                    ],
                                    [
                                        0.8044692737430168,
                                        "#fe88fc"
                                    ],
                                    [
                                        0.8938547486033519,
                                        "#fea5fd"
                                    ],
                                    [
                                        0.9832402234636871,
                                        "#febefe"
                                    ],
                                    [
                                        1,
                                        "#fec3fe"
                                    ]
                                ],
                                "sequentialminus": [
                                    [
                                        0,
                                        "#0508b8"
                                    ],
                                    [
                                        0.0893854748603352,
                                        "#1910d8"
                                    ],
                                    [
                                        0.1787709497206704,
                                        "#3c19f0"
                                    ],
                                    [
                                        0.2681564245810056,
                                        "#6b1cfb"
                                    ],
                                    [
                                        0.3575418994413408,
                                        "#981cfd"
                                    ],
                                    [
                                        0.44692737430167595,
                                        "#bf1cfd"
                                    ],
                                    [
                                        0.5363128491620112,
                                        "#dd2bfd"
                                    ],
                                    [
                                        0.6256983240223464,
                                        "#f246fe"
                                    ],
                                    [
                                        0.7150837988826816,
                                        "#fc67fd"
                                    ],
                                    [
                                        0.8044692737430168,
                                        "#fe88fc"
                                    ],
                                    [
                                        0.8938547486033519,
                                        "#fea5fd"
                                    ],
                                    [
                                        0.9832402234636871,
                                        "#febefe"
                                    ],
                                    [
                                        1,
                                        "#fec3fe"
                                    ]
                                ]
                            },
                            "plot_bgcolor": "white",
                            "paper_bgcolor": "white",
                            "shapedefaults": {
                                "line": {
                                    "width": 0
                                },
                                "opacity": 0.4,
                                "fillcolor": "#506784"
                            },
                            "annotationdefaults": {
                                "arrowhead": 0,
                                "arrowcolor": "#506784",
                                "arrowwidth": 1
                            }
                        },
                        "themeRef": "PLOTLY_WHITE"
                    }
                }
            },
            "height": null,
            "width": null,
            "user": {
                "profile_url": "https://chart-studio.plotly.com/~mm.crj",
                "avatar_url": "https://storage.googleapis.com/plotly-prod-profiles/96.jpg",
                "background_url": "https://storage.googleapis.com/plotly-prod-profiles/bg-11.jpg",
                "bio": "",
                "nickname": "",
                "website": "",
                "stream_tokens": null,
                "feature_set_id": null,
                "csrf_token": null,
                "date_joined": "2016-04-17 23:13:47",
                "mapbox_access_tokens": null,
                "has_password": null,
                "username": "mm.crj",
                "email": null,
                "is_active": null,
                "readonly": null,
                "is_dash_creator": null,
                "dash_created_count": null,
                "is_chart_creator": null,
                "charts_created_count": null
            }
        },
        {
            "creation_time": "2024-03-23T22:00:17.456629Z",
            "comments": {
                "results": [],
                "count": 0
            },
            "parented": true,
            "embed_url": "https://chart-studio.plotly.com/~hayesn31/1.embed",
            "fid": "hayesn31:1",
            "filename": "Plot 1",
            "filetype": "plot",
            "img_url": "https://storage.googleapis.com/plotly-prod-images/hayesn31/1/9_B1Y0K86P8CPQ28YI8FL447CLMLFVOQ.png",
            "image_urls": {
                "default": "https://storage.googleapis.com/plotly-prod-images/hayesn31/1/2_F7VKXWL29S484QEM36UJHRVJMPCQKD.png",
                "block-thumb": "https://storage.googleapis.com/plotly-prod-images/hayesn31/1/8_7SCGANDPIF1R6TQLAPT3ICBCATIW67.png",
                "list-thumb": "https://storage.googleapis.com/plotly-prod-images/hayesn31/1/9_B1Y0K86P8CPQ28YI8FL447CLMLFVOQ.png"
            },
            "api_urls": {
                "files": "https://api.plotly.com/v2/files/hayesn31:1",
                "plots": "https://api.plotly.com/v2/plots/hayesn31:1",
                "parent": "https://api.plotly.com/v2/folders/home?user=hayesn31"
            },
            "owner": "hayesn31",
            "parent": -1,
            "preview": "",
            "referencers": [],
            "references": [],
            "title": "",
            "views": 2,
            "web_url": "https://chart-studio.plotly.com/~hayesn31/1/",
            "world_readable": true,
            "date_modified": "2024-03-23T22:44:57.929Z",
            "stars": {
                "results": [],
                "count": 0
            },
            "collaborators": {
                "results": [],
                "count": 0
            },
            "subfolder_count": null,
            "refresh_interval": null,
            "organize_view_url": "https://chart-studio.plotly.com/~hayesn31/1/",
            "current_user_permission": "read",
            "is_theme": null,
            "is_template": false,
            "autosize": true,
            "caption": "",
            "figure": {
                "data": [
                    {
                        "meta": {
                            "columnNames": {
                                "x": "A",
                                "y": "B"
                            }
                        },
                        "mode": "lines",
                        "type": "scatter",
                        "xsrc": "hayesn31:0:f06900",
                        "ysrc": "hayesn31:0:6bed13"
                    }
                ],
                "frames": [],
                "layout": {
                    "title": {
                        "text": "Nitrate Levels in Lake Erie "
                    },
                    "xaxis": {
                        "type": "category",
                        "range": [
                            0,
                            11
                        ],
                        "title": {
                            "text": "Months"
                        },
                        "autorange": true
                    },
                    "yaxis": {
                        "type": "linear",
                        "range": [
                            -0.067,
                            1.793
                        ],
                        "title": {
                            "text": "Average Nitrate Level (mgN/L)"
                        },
                        "autorange": true
                    },
                    "autosize": true,
                    "dragmode": "pan",
                    "template": {
                        "data": {
                            "bar": [
                                {
                                    "type": "bar",
                                    "marker": {
                                        "colorbar": {
                                            "ticks": "",
                                            "outlinewidth": 0
                                        }
                                    }
                                }
                            ],
                            "table": [
                                {
                                    "type": "table",
                                    "cells": {
                                        "fill": {
                                            "color": "#EBF0F8"
                                        },
                                        "line": {
                                            "color": "white"
                                        }
                                    },
                                    "header": {
                                        "fill": {
                                            "color": "#C8D4E3"
                                        },
                                        "line": {
                                            "color": "white"
                                        }
                                    }
                                }
                            ],
                            "carpet": [
                                {
                                    "type": "carpet",
                                    "aaxis": {
                                        "gridcolor": "#C8D4E3",
                                        "linecolor": "#C8D4E3",
                                        "endlinecolor": "#2a3f5f",
                                        "minorgridcolor": "#C8D4E3",
                                        "startlinecolor": "#2a3f5f"
                                    },
                                    "baxis": {
                                        "gridcolor": "#C8D4E3",
                                        "linecolor": "#C8D4E3",
                                        "endlinecolor": "#2a3f5f",
                                        "minorgridcolor": "#C8D4E3",
                                        "startlinecolor": "#2a3f5f"
                                    }
                                }
                            ],
                            "mesh3d": [
                                {
                                    "type": "mesh3d",
                                    "colorbar": {
                                        "ticks": "",
                                        "outlinewidth": 0
                                    }
                                }
                            ],
                            "contour": [
                                {
                                    "type": "contour",
                                    "colorbar": {
                                        "ticks": "",
                                        "outlinewidth": 0
                                    },
                                    "autocolorscale": true
                                }
                            ],
                            "heatmap": [
                                {
                                    "type": "heatmap",
                                    "colorbar": {
                                        "ticks": "",
                                        "outlinewidth": 0
                                    },
                                    "autocolorscale": true
                                }
                            ],
                            "scatter": [
                                {
                                    "type": "scatter",
                                    "marker": {
                                        "colorbar": {
                                            "ticks": "",
                                            "outlinewidth": 0
                                        }
                                    }
                                }
                            ],
                            "surface": [
                                {
                                    "type": "surface",
                                    "colorbar": {
                                        "ticks": "",
                                        "outlinewidth": 0
                                    }
                                }
                            ],
                            "heatmapgl": [
                                {
                                    "type": "heatmapgl",
                                    "colorbar": {
                                        "ticks": "",
                                        "outlinewidth": 0
                                    }
                                }
                            ],
                            "histogram": [
                                {
                                    "type": "histogram",
                                    "marker": {
                                        "colorbar": {
                                            "ticks": "",
                                            "outlinewidth": 0
                                        }
                                    }
                                }
                            ],
                            "parcoords": [
                                {
                                    "line": {
                                        "colorbar": {
                                            "ticks": "",
                                            "outlinewidth": 0
                                        }
                                    },
                                    "type": "parcoords"
                                }
                            ],
                            "scatter3d": [
                                {
                                    "type": "scatter3d",
                                    "marker": {
                                        "colorbar": {
                                            "ticks": "",
                                            "outlinewidth": 0
                                        }
                                    }
                                }
                            ],
                            "scattergl": [
                                {
                                    "type": "scattergl",
                                    "marker": {
                                        "colorbar": {
                                            "ticks": "",
                                            "outlinewidth": 0
                                        }
                                    }
                                }
                            ],
                            "choropleth": [
                                {
                                    "type": "choropleth",
                                    "colorbar": {
                                        "ticks": "",
                                        "outlinewidth": 0
                                    }
                                }
                            ],
                            "scattergeo": [
                                {
                                    "type": "scattergeo",
                                    "marker": {
                                        "colorbar": {
                                            "ticks": "",
                                            "outlinewidth": 0
                                        }
                                    }
                                }
                            ],
                            "histogram2d": [
                                {
                                    "type": "histogram2d",
                                    "colorbar": {
                                        "ticks": "",
                                        "outlinewidth": 0
                                    },
                                    "autocolorscale": true
                                }
                            ],
                            "scatterpolar": [
                                {
                                    "type": "scatterpolar",
                                    "marker": {
                                        "colorbar": {
                                            "ticks": "",
                                            "outlinewidth": 0
                                        }
                                    }
                                }
                            ],
                            "contourcarpet": [
                                {
                                    "type": "contourcarpet",
                                    "colorbar": {
                                        "ticks": "",
                                        "outlinewidth": 0
                                    }
                                }
                            ],
                            "scattercarpet": [
                                {
                                    "type": "scattercarpet",
                                    "marker": {
                                        "colorbar": {
                                            "ticks": "",
                                            "outlinewidth": 0
                                        }
                                    }
                                }
                            ],
                            "scattermapbox": [
                                {
                                    "type": "scattermapbox",
                                    "marker": {
                                        "colorbar": {
                                            "ticks": "",
                                            "outlinewidth": 0
                                        }
                                    }
                                }
                            ],
                            "scatterpolargl": [
                                {
                                    "type": "scatterpolargl",
                                    "marker": {
                                        "colorbar": {
                                            "ticks": "",
                                            "outlinewidth": 0
                                        }
                                    }
                                }
                            ],
                            "scatterternary": [
                                {
                                    "type": "scatterternary",
                                    "marker": {
                                        "colorbar": {
                                            "ticks": "",
                                            "outlinewidth": 0
                                        }
                                    }
                                }
                            ],
                            "histogram2dcontour": [
                                {
                                    "type": "histogram2dcontour",
                                    "colorbar": {
                                        "ticks": "",
                                        "outlinewidth": 0
                                    },
                                    "autocolorscale": true
                                }
                            ]
                        },
                        "layout": {
                            "geo": {
                                "bgcolor": "white",
                                "showland": true,
                                "lakecolor": "white",
                                "landcolor": "white",
                                "showlakes": true,
                                "subunitcolor": "#C8D4E3"
                            },
                            "font": {
                                "color": "#2a3f5f"
                            },
                            "polar": {
                                "bgcolor": "white",
                                "radialaxis": {
                                    "ticks": "",
                                    "gridcolor": "#EBF0F8",
                                    "linecolor": "#EBF0F8"
                                },
                                "angularaxis": {
                                    "ticks": "",
                                    "gridcolor": "#EBF0F8",
                                    "linecolor": "#EBF0F8"
                                }
                            },
                            "scene": {
                                "xaxis": {
                                    "ticks": "",
                                    "gridcolor": "#DFE8F3",
                                    "gridwidth": 2,
                                    "linecolor": "#EBF0F8",
                                    "zerolinecolor": "#EBF0F8",
                                    "showbackground": true,
                                    "backgroundcolor": "white"
                                },
                                "yaxis": {
                                    "ticks": "",
                                    "gridcolor": "#DFE8F3",
                                    "gridwidth": 2,
                                    "linecolor": "#EBF0F8",
                                    "zerolinecolor": "#EBF0F8",
                                    "showbackground": true,
                                    "backgroundcolor": "white"
                                },
                                "zaxis": {
                                    "ticks": "",
                                    "gridcolor": "#DFE8F3",
                                    "gridwidth": 2,
                                    "linecolor": "#EBF0F8",
                                    "zerolinecolor": "#EBF0F8",
                                    "showbackground": true,
                                    "backgroundcolor": "white"
                                }
                            },
                            "title": {
                                "x": 0.05
                            },
                            "xaxis": {
                                "ticks": "",
                                "gridcolor": "#EBF0F8",
                                "linecolor": "#EBF0F8",
                                "automargin": true,
                                "zerolinecolor": "#EBF0F8",
                                "zerolinewidth": 2
                            },
                            "yaxis": {
                                "ticks": "",
                                "gridcolor": "#EBF0F8",
                                "linecolor": "#EBF0F8",
                                "automargin": true,
                                "zerolinecolor": "#EBF0F8",
                                "zerolinewidth": 2
                            },
                            "ternary": {
                                "aaxis": {
                                    "ticks": "",
                                    "gridcolor": "#DFE8F3",
                                    "linecolor": "#A2B1C6"
                                },
                                "baxis": {
                                    "ticks": "",
                                    "gridcolor": "#DFE8F3",
                                    "linecolor": "#A2B1C6"
                                },
                                "caxis": {
                                    "ticks": "",
                                    "gridcolor": "#DFE8F3",
                                    "linecolor": "#A2B1C6"
                                },
                                "bgcolor": "white"
                            },
                            "colorway": [
                                "#636efa",
                                "#EF553B",
                                "#00cc96",
                                "#ab63fa",
                                "#19d3f3",
                                "#e763fa",
                                "#fecb52",
                                "#ffa15a",
                                "#ff6692",
                                "#b6e880"
                            ],
                            "hovermode": "closest",
                            "colorscale": {
                                "diverging": [
                                    [
                                        0,
                                        "#8e0152"
                                    ],
                                    [
                                        0.1,
                                        "#c51b7d"
                                    ],
                                    [
                                        0.2,
                                        "#de77ae"
                                    ],
                                    [
                                        0.3,
                                        "#f1b6da"
                                    ],
                                    [
                                        0.4,
                                        "#fde0ef"
                                    ],
                                    [
                                        0.5,
                                        "#f7f7f7"
                                    ],
                                    [
                                        0.6,
                                        "#e6f5d0"
                                    ],
                                    [
                                        0.7,
                                        "#b8e186"
                                    ],
                                    [
                                        0.8,
                                        "#7fbc41"
                                    ],
                                    [
                                        0.9,
                                        "#4d9221"
                                    ],
                                    [
                                        1,
                                        "#276419"
                                    ]
                                ],
                                "sequential": [
                                    [
                                        0,
                                        "#0508b8"
                                    ],
                                    [
                                        0.0893854748603352,
                                        "#1910d8"
                                    ],
                                    [
                                        0.1787709497206704,
                                        "#3c19f0"
                                    ],
                                    [
                                        0.2681564245810056,
                                        "#6b1cfb"
                                    ],
                                    [
                                        0.3575418994413408,
                                        "#981cfd"
                                    ],
                                    [
                                        0.44692737430167595,
                                        "#bf1cfd"
                                    ],
                                    [
                                        0.5363128491620112,
                                        "#dd2bfd"
                                    ],
                                    [
                                        0.6256983240223464,
                                        "#f246fe"
                                    ],
                                    [
                                        0.7150837988826816,
                                        "#fc67fd"
                                    ],
                                    [
                                        0.8044692737430168,
                                        "#fe88fc"
                                    ],
                                    [
                                        0.8938547486033519,
                                        "#fea5fd"
                                    ],
                                    [
                                        0.9832402234636871,
                                        "#febefe"
                                    ],
                                    [
                                        1,
                                        "#fec3fe"
                                    ]
                                ],
                                "sequentialminus": [
                                    [
                                        0,
                                        "#0508b8"
                                    ],
                                    [
                                        0.0893854748603352,
                                        "#1910d8"
                                    ],
                                    [
                                        0.1787709497206704,
                                        "#3c19f0"
                                    ],
                                    [
                                        0.2681564245810056,
                                        "#6b1cfb"
                                    ],
                                    [
                                        0.3575418994413408,
                                        "#981cfd"
                                    ],
                                    [
                                        0.44692737430167595,
                                        "#bf1cfd"
                                    ],
                                    [
                                        0.5363128491620112,
                                        "#dd2bfd"
                                    ],
                                    [
                                        0.6256983240223464,
                                        "#f246fe"
                                    ],
                                    [
                                        0.7150837988826816,
                                        "#fc67fd"
                                    ],
                                    [
                                        0.8044692737430168,
                                        "#fe88fc"
                                    ],
                                    [
                                        0.8938547486033519,
                                        "#fea5fd"
                                    ],
                                    [
                                        0.9832402234636871,
                                        "#febefe"
                                    ],
                                    [
                                        1,
                                        "#fec3fe"
                                    ]
                                ]
                            },
                            "plot_bgcolor": "white",
                            "paper_bgcolor": "white",
                            "shapedefaults": {
                                "line": {
                                    "width": 0
                                },
                                "opacity": 0.4,
                                "fillcolor": "#506784"
                            },
                            "annotationdefaults": {
                                "arrowhead": 0,
                                "arrowcolor": "#506784",
                                "arrowwidth": 1
                            }
                        },
                        "themeRef": "PLOTLY_WHITE"
                    }
                }
            },
            "height": null,
            "width": null,
            "user": {
                "profile_url": "https://chart-studio.plotly.com/~hayesn31",
                "avatar_url": "https://storage.googleapis.com/plotly-prod-profiles/67.jpg",
                "background_url": "https://storage.googleapis.com/plotly-prod-profiles/bg-12.jpg",
                "bio": "",
                "nickname": "",
                "website": "",
                "stream_tokens": null,
                "feature_set_id": null,
                "csrf_token": null,
                "date_joined": "2024-03-23 21:59:43",
                "mapbox_access_tokens": null,
                "has_password": null,
                "username": "hayesn31",
                "email": null,
                "is_active": null,
                "readonly": null,
                "is_dash_creator": null,
                "dash_created_count": null,
                "is_chart_creator": null,
                "charts_created_count": null
            }
        },
        {
            "creation_time": "2024-03-23T21:57:12.979518Z",
            "comments": {
                "results": [],
                "count": 0
            },
            "parented": true,
            "embed_url": "https://chart-studio.plotly.com/~murnsal/1.embed",
            "fid": "murnsal:1",
            "filename": "Plot 1",
            "filetype": "plot",
            "img_url": "https://storage.googleapis.com/plotly-prod-images/murnsal/1/9_M46Y1SKA9QYY3Z911LN0QE8X8SHP5E.png",
            "image_urls": {
                "default": "https://storage.googleapis.com/plotly-prod-images/murnsal/1/2_04MJPJ92BR1YEVSJZJ01K7L5M8L00D.png",
                "block-thumb": "https://storage.googleapis.com/plotly-prod-images/murnsal/1/8_AS21MS9CMNZNVD4YPSMUQF0ZARVB50.png",
                "list-thumb": "https://storage.googleapis.com/plotly-prod-images/murnsal/1/9_M46Y1SKA9QYY3Z911LN0QE8X8SHP5E.png"
            },
            "api_urls": {
                "files": "https://api.plotly.com/v2/files/murnsal:1",
                "plots": "https://api.plotly.com/v2/plots/murnsal:1",
                "parent": "https://api.plotly.com/v2/folders/home?user=murnsal"
            },
            "owner": "murnsal",
            "parent": -1,
            "preview": "",
            "referencers": [],
            "references": [],
            "title": "",
            "views": 4,
            "web_url": "https://chart-studio.plotly.com/~murnsal/1/",
            "world_readable": true,
            "date_modified": "2024-03-24T02:09:33.335Z",
            "stars": {
                "results": [],
                "count": 0
            },
            "collaborators": {
                "results": [],
                "count": 0
            },
            "subfolder_count": null,
            "refresh_interval": null,
            "organize_view_url": "https://chart-studio.plotly.com/~murnsal/1/",
            "current_user_permission": "read",
            "is_theme": null,
            "is_template": false,
            "autosize": true,
            "caption": "",
            "figure": {
                "data": [
                    {
                        "fill": "none",
                        "line": {
                            "shape": "spline",
                            "width": 2,
                            "smoothing": 0.8
                        },
                        "meta": {
                            "columnNames": {
                                "x": "B",
                                "y": "DFS"
                            }
                        },
                        "mode": "lines",
                        "name": "%{meta.columnNames.y}",
                        "type": "scatter",
                        "xsrc": "murnsal:0:9722bf",
                        "ysrc": "murnsal:0:7df762",
                        "stackgroup": null,
                        "connectgaps": false
                    },
                    {
                        "fill": "none",
                        "line": {
                            "shape": "spline",
                            "width": 2,
                            "smoothing": 0.8
                        },
                        "meta": {
                            "columnNames": {
                                "x": "B",
                                "y": "BFS"
                            }
                        },
                        "mode": "lines",
                        "name": "%{meta.columnNames.y}",
                        "type": "scatter",
                        "xsrc": "murnsal:0:9722bf",
                        "ysrc": "murnsal:0:a878ab",
                        "stackgroup": null
                    }
                ],
                "frames": [],
                "layout": {
                    "title": {
                        "text": "DFS vs BFS Performance"
                    },
                    "xaxis": {
                        "type": "linear",
                        "range": [
                            3,
                            50
                        ],
                        "title": {
                            "font": {
                                "color": "rgb(0, 0, 0)"
                            },
                            "text": "Map Size n (n x n)"
                        },
                        "showgrid": false,
                        "showline": false,
                        "tickfont": {
                            "color": "rgb(0, 0, 0)"
                        },
                        "tickmode": "auto",
                        "autorange": true,
                        "gridcolor": "rgb(0, 0, 0)",
                        "showspikes": false,
                        "zerolinecolor": "rgb(0, 0, 0)"
                    },
                    "yaxis": {
                        "type": "linear",
                        "range": [
                            -18654.38888888889,
                            464753.3888888889
                        ],
                        "title": {
                            "text": "Performance (nanoseconds)"
                        },
                        "showgrid": true,
                        "autorange": true,
                        "gridcolor": "rgb(214, 208, 208)",
                        "showspikes": false,
                        "zerolinecolor": "rgb(0, 0, 0)"
                    },
                    "legend": {
                        "orientation": "v"
                    },
                    "autosize": true,
                    "dragmode": "zoom",
                    "template": {
                        "data": {
                            "bar": [
                                {
                                    "type": "bar",
                                    "marker": {
                                        "colorbar": {
                                            "ticks": "",
                                            "outlinewidth": 0
                                        }
                                    }
                                }
                            ],
                            "table": [
                                {
                                    "type": "table",
                                    "cells": {
                                        "fill": {
                                            "color": "#EBF0F8"
                                        },
                                        "line": {
                                            "color": "white"
                                        }
                                    },
                                    "header": {
                                        "fill": {
                                            "color": "#C8D4E3"
                                        },
                                        "line": {
                                            "color": "white"
                                        }
                                    }
                                }
                            ],
                            "carpet": [
                                {
                                    "type": "carpet",
                                    "aaxis": {
                                        "gridcolor": "#C8D4E3",
                                        "linecolor": "#C8D4E3",
                                        "endlinecolor": "#2a3f5f",
                                        "minorgridcolor": "#C8D4E3",
                                        "startlinecolor": "#2a3f5f"
                                    },
                                    "baxis": {
                                        "gridcolor": "#C8D4E3",
                                        "linecolor": "#C8D4E3",
                                        "endlinecolor": "#2a3f5f",
                                        "minorgridcolor": "#C8D4E3",
                                        "startlinecolor": "#2a3f5f"
                                    }
                                }
                            ],
                            "mesh3d": [
                                {
                                    "type": "mesh3d",
                                    "colorbar": {
                                        "ticks": "",
                                        "outlinewidth": 0
                                    }
                                }
                            ],
                            "contour": [
                                {
                                    "type": "contour",
                                    "colorbar": {
                                        "ticks": "",
                                        "outlinewidth": 0
                                    },
                                    "autocolorscale": true
                                }
                            ],
                            "heatmap": [
                                {
                                    "type": "heatmap",
                                    "colorbar": {
                                        "ticks": "",
                                        "outlinewidth": 0
                                    },
                                    "autocolorscale": true
                                }
                            ],
                            "scatter": [
                                {
                                    "type": "scatter",
                                    "marker": {
                                        "colorbar": {
                                            "ticks": "",
                                            "outlinewidth": 0
                                        }
                                    }
                                }
                            ],
                            "surface": [
                                {
                                    "type": "surface",
                                    "colorbar": {
                                        "ticks": "",
                                        "outlinewidth": 0
                                    }
                                }
                            ],
                            "heatmapgl": [
                                {
                                    "type": "heatmapgl",
                                    "colorbar": {
                                        "ticks": "",
                                        "outlinewidth": 0
                                    }
                                }
                            ],
                            "histogram": [
                                {
                                    "type": "histogram",
                                    "marker": {
                                        "colorbar": {
                                            "ticks": "",
                                            "outlinewidth": 0
                                        }
                                    }
                                }
                            ],
                            "parcoords": [
                                {
                                    "line": {
                                        "colorbar": {
                                            "ticks": "",
                                            "outlinewidth": 0
                                        }
                                    },
                                    "type": "parcoords"
                                }
                            ],
                            "scatter3d": [
                                {
                                    "type": "scatter3d",
                                    "marker": {
                                        "colorbar": {
                                            "ticks": "",
                                            "outlinewidth": 0
                                        }
                                    }
                                }
                            ],
                            "scattergl": [
                                {
                                    "type": "scattergl",
                                    "marker": {
                                        "colorbar": {
                                            "ticks": "",
                                            "outlinewidth": 0
                                        }
                                    }
                                }
                            ],
                            "choropleth": [
                                {
                                    "type": "choropleth",
                                    "colorbar": {
                                        "ticks": "",
                                        "outlinewidth": 0
                                    }
                                }
                            ],
                            "scattergeo": [
                                {
                                    "type": "scattergeo",
                                    "marker": {
                                        "colorbar": {
                                            "ticks": "",
                                            "outlinewidth": 0
                                        }
                                    }
                                }
                            ],
                            "histogram2d": [
                                {
                                    "type": "histogram2d",
                                    "colorbar": {
                                        "ticks": "",
                                        "outlinewidth": 0
                                    },
                                    "autocolorscale": true
                                }
                            ],
                            "scatterpolar": [
                                {
                                    "type": "scatterpolar",
                                    "marker": {
                                        "colorbar": {
                                            "ticks": "",
                                            "outlinewidth": 0
                                        }
                                    }
                                }
                            ],
                            "contourcarpet": [
                                {
                                    "type": "contourcarpet",
                                    "colorbar": {
                                        "ticks": "",
                                        "outlinewidth": 0
                                    }
                                }
                            ],
                            "scattercarpet": [
                                {
                                    "type": "scattercarpet",
                                    "marker": {
                                        "colorbar": {
                                            "ticks": "",
                                            "outlinewidth": 0
                                        }
                                    }
                                }
                            ],
                            "scattermapbox": [
                                {
                                    "type": "scattermapbox",
                                    "marker": {
                                        "colorbar": {
                                            "ticks": "",
                                            "outlinewidth": 0
                                        }
                                    }
                                }
                            ],
                            "scatterpolargl": [
                                {
                                    "type": "scatterpolargl",
                                    "marker": {
                                        "colorbar": {
                                            "ticks": "",
                                            "outlinewidth": 0
                                        }
                                    }
                                }
                            ],
                            "scatterternary": [
                                {
                                    "type": "scatterternary",
                                    "marker": {
                                        "colorbar": {
                                            "ticks": "",
                                            "outlinewidth": 0
                                        }
                                    }
                                }
                            ],
                            "histogram2dcontour": [
                                {
                                    "type": "histogram2dcontour",
                                    "colorbar": {
                                        "ticks": "",
                                        "outlinewidth": 0
                                    },
                                    "autocolorscale": true
                                }
                            ]
                        },
                        "layout": {
                            "geo": {
                                "bgcolor": "white",
                                "showland": true,
                                "lakecolor": "white",
                                "landcolor": "white",
                                "showlakes": true,
                                "subunitcolor": "#C8D4E3"
                            },
                            "font": {
                                "color": "#2a3f5f"
                            },
                            "polar": {
                                "bgcolor": "white",
                                "radialaxis": {
                                    "ticks": "",
                                    "gridcolor": "#EBF0F8",
                                    "linecolor": "#EBF0F8"
                                },
                                "angularaxis": {
                                    "ticks": "",
                                    "gridcolor": "#EBF0F8",
                                    "linecolor": "#EBF0F8"
                                }
                            },
                            "scene": {
                                "xaxis": {
                                    "ticks": "",
                                    "gridcolor": "#DFE8F3",
                                    "gridwidth": 2,
                                    "linecolor": "#EBF0F8",
                                    "zerolinecolor": "#EBF0F8",
                                    "showbackground": true,
                                    "backgroundcolor": "white"
                                },
                                "yaxis": {
                                    "ticks": "",
                                    "gridcolor": "#DFE8F3",
                                    "gridwidth": 2,
                                    "linecolor": "#EBF0F8",
                                    "zerolinecolor": "#EBF0F8",
                                    "showbackground": true,
                                    "backgroundcolor": "white"
                                },
                                "zaxis": {
                                    "ticks": "",
                                    "gridcolor": "#DFE8F3",
                                    "gridwidth": 2,
                                    "linecolor": "#EBF0F8",
                                    "zerolinecolor": "#EBF0F8",
                                    "showbackground": true,
                                    "backgroundcolor": "white"
                                }
                            },
                            "title": {
                                "x": 0.05
                            },
                            "xaxis": {
                                "ticks": "",
                                "gridcolor": "#EBF0F8",
                                "linecolor": "#EBF0F8",
                                "automargin": true,
                                "zerolinecolor": "#EBF0F8",
                                "zerolinewidth": 2
                            },
                            "yaxis": {
                                "ticks": "",
                                "gridcolor": "#EBF0F8",
                                "linecolor": "#EBF0F8",
                                "automargin": true,
                                "zerolinecolor": "#EBF0F8",
                                "zerolinewidth": 2
                            },
                            "ternary": {
                                "aaxis": {
                                    "ticks": "",
                                    "gridcolor": "#DFE8F3",
                                    "linecolor": "#A2B1C6"
                                },
                                "baxis": {
                                    "ticks": "",
                                    "gridcolor": "#DFE8F3",
                                    "linecolor": "#A2B1C6"
                                },
                                "caxis": {
                                    "ticks": "",
                                    "gridcolor": "#DFE8F3",
                                    "linecolor": "#A2B1C6"
                                },
                                "bgcolor": "white"
                            },
                            "colorway": [
                                "#636efa",
                                "#EF553B",
                                "#00cc96",
                                "#ab63fa",
                                "#19d3f3",
                                "#e763fa",
                                "#fecb52",
                                "#ffa15a",
                                "#ff6692",
                                "#b6e880"
                            ],
                            "hovermode": "closest",
                            "colorscale": {
                                "diverging": [
                                    [
                                        0,
                                        "#8e0152"
                                    ],
                                    [
                                        0.1,
                                        "#c51b7d"
                                    ],
                                    [
                                        0.2,
                                        "#de77ae"
                                    ],
                                    [
                                        0.3,
                                        "#f1b6da"
                                    ],
                                    [
                                        0.4,
                                        "#fde0ef"
                                    ],
                                    [
                                        0.5,
                                        "#f7f7f7"
                                    ],
                                    [
                                        0.6,
                                        "#e6f5d0"
                                    ],
                                    [
                                        0.7,
                                        "#b8e186"
                                    ],
                                    [
                                        0.8,
                                        "#7fbc41"
                                    ],
                                    [
                                        0.9,
                                        "#4d9221"
                                    ],
                                    [
                                        1,
                                        "#276419"
                                    ]
                                ],
                                "sequential": [
                                    [
                                        0,
                                        "#0508b8"
                                    ],
                                    [
                                        0.0893854748603352,
                                        "#1910d8"
                                    ],
                                    [
                                        0.1787709497206704,
                                        "#3c19f0"
                                    ],
                                    [
                                        0.2681564245810056,
                                        "#6b1cfb"
                                    ],
                                    [
                                        0.3575418994413408,
                                        "#981cfd"
                                    ],
                                    [
                                        0.44692737430167595,
                                        "#bf1cfd"
                                    ],
                                    [
                                        0.5363128491620112,
                                        "#dd2bfd"
                                    ],
                                    [
                                        0.6256983240223464,
                                        "#f246fe"
                                    ],
                                    [
                                        0.7150837988826816,
                                        "#fc67fd"
                                    ],
                                    [
                                        0.8044692737430168,
                                        "#fe88fc"
                                    ],
                                    [
                                        0.8938547486033519,
                                        "#fea5fd"
                                    ],
                                    [
                                        0.9832402234636871,
                                        "#febefe"
                                    ],
                                    [
                                        1,
                                        "#fec3fe"
                                    ]
                                ],
                                "sequentialminus": [
                                    [
                                        0,
                                        "#0508b8"
                                    ],
                                    [
                                        0.0893854748603352,
                                        "#1910d8"
                                    ],
                                    [
                                        0.1787709497206704,
                                        "#3c19f0"
                                    ],
                                    [
                                        0.2681564245810056,
                                        "#6b1cfb"
                                    ],
                                    [
                                        0.3575418994413408,
                                        "#981cfd"
                                    ],
                                    [
                                        0.44692737430167595,
                                        "#bf1cfd"
                                    ],
                                    [
                                        0.5363128491620112,
                                        "#dd2bfd"
                                    ],
                                    [
                                        0.6256983240223464,
                                        "#f246fe"
                                    ],
                                    [
                                        0.7150837988826816,
                                        "#fc67fd"
                                    ],
                                    [
                                        0.8044692737430168,
                                        "#fe88fc"
                                    ],
                                    [
                                        0.8938547486033519,
                                        "#fea5fd"
                                    ],
                                    [
                                        0.9832402234636871,
                                        "#febefe"
                                    ],
                                    [
                                        1,
                                        "#fec3fe"
                                    ]
                                ]
                            },
                            "plot_bgcolor": "white",
                            "paper_bgcolor": "white",
                            "shapedefaults": {
                                "line": {
                                    "width": 0
                                },
                                "opacity": 0.4,
                                "fillcolor": "#506784"
                            },
                            "annotationdefaults": {
                                "arrowhead": 0,
                                "arrowcolor": "#506784",
                                "arrowwidth": 1
                            }
                        },
                        "themeRef": "PLOTLY_WHITE"
                    },
                    "plot_bgcolor": "rgb(243, 243, 243)",
                    "paper_bgcolor": "rgb(243, 243, 243)"
                }
            },
            "height": null,
            "width": null,
            "user": {
                "profile_url": "https://chart-studio.plotly.com/~murnsal",
                "avatar_url": "https://storage.googleapis.com/plotly-prod-profiles/62.jpg",
                "background_url": "https://storage.googleapis.com/plotly-prod-profiles/bg-5.jpg",
                "bio": "",
                "nickname": "",
                "website": "",
                "stream_tokens": null,
                "feature_set_id": null,
                "csrf_token": null,
                "date_joined": "2024-03-23 21:56:47",
                "mapbox_access_tokens": null,
                "has_password": null,
                "username": "murnsal",
                "email": null,
                "is_active": null,
                "readonly": null,
                "is_dash_creator": null,
                "dash_created_count": null,
                "is_chart_creator": null,
                "charts_created_count": null
            }
        },
        {
            "creation_time": "2024-03-23T21:23:48.326816Z",
            "comments": {
                "results": [],
                "count": 0
            },
            "parented": true,
            "embed_url": "https://chart-studio.plotly.com/~kakawajazz/1.embed",
            "fid": "kakawajazz:1",
            "filename": "Plot 1",
            "filetype": "plot",
            "img_url": "https://storage.googleapis.com/plotly-prod-images/kakawajazz/1/9_WPRX2N2G50HIY4VUVMH8S7UI4K62RV.png",
            "image_urls": {
                "default": "https://storage.googleapis.com/plotly-prod-images/kakawajazz/1/2_7B1KH6WHCOUNKOZCRL49GEAVSSM1T1.png",
                "block-thumb": "https://storage.googleapis.com/plotly-prod-images/kakawajazz/1/8_6KC8XIS88AL0JODKXZKPPYDGWCYWK2.png",
                "list-thumb": "https://storage.googleapis.com/plotly-prod-images/kakawajazz/1/9_WPRX2N2G50HIY4VUVMH8S7UI4K62RV.png"
            },
            "api_urls": {
                "files": "https://api.plotly.com/v2/files/kakawajazz:1",
                "plots": "https://api.plotly.com/v2/plots/kakawajazz:1",
                "parent": "https://api.plotly.com/v2/folders/home?user=kakawajazz"
            },
            "owner": "kakawajazz",
            "parent": -1,
            "preview": "",
            "referencers": [],
            "references": [],
            "title": "",
            "views": 1,
            "web_url": "https://chart-studio.plotly.com/~kakawajazz/1/",
            "world_readable": true,
            "date_modified": "2024-03-23T21:23:48.341Z",
            "stars": {
                "results": [],
                "count": 0
            },
            "collaborators": {
                "results": [],
                "count": 0
            },
            "subfolder_count": null,
            "refresh_interval": null,
            "organize_view_url": "https://chart-studio.plotly.com/~kakawajazz/1/",
            "current_user_permission": "read",
            "is_theme": null,
            "is_template": false,
            "autosize": true,
            "caption": "",
            "figure": {
                "data": [
                    {
                        "uid": "723fe8",
                        "meta": {
                            "columnNames": {
                                "x": "title length",
                                "y": "C",
                                "z": "Avg per project"
                            }
                        },
                        "mode": "lines",
                        "name": "Avg per project",
                        "type": "scatter3d",
                        "xsrc": "kakawajazz:0:761a6a",
                        "ysrc": "kakawajazz:0:551e6d",
                        "zsrc": "kakawajazz:0:40be9a",
                        "marker": {
                            "color": "rgb(255, 127, 14)",
                            "sizeref": 0.028149617325,
                            "sizemode": "area"
                        }
                    }
                ],
                "frames": [],
                "layout": {
                    "scene": {
                        "camera": {
                            "up": {
                                "x": -0.21406021731041147,
                                "y": -0.968619644894569,
                                "z": 0.12630996353946047
                            },
                            "eye": {
                                "x": 1.3863215341343755,
                                "y": -0.5126687481881046,
                                "z": -1.5820187605166258
                            },
                            "center": {
                                "x": -2.220446049250313e-16,
                                "y": 0,
                                "z": 0
                            },
                            "projection": {
                                "type": "orthographic"
                            }
                        },
                        "dragmode": "orbit",
                        "aspectmode": "mode",
                        "aspectratio": {
                            "x": 1,
                            "y": 1,
                            "z": 1
                        }
                    },
                    "title": {
                        "text": "Project reads by the length of the project's title"
                    },
                    "xaxis": {
                        "type": "linear",
                        "range": [
                            -0.39682539682539186,
                            99.60317460317461
                        ],
                        "title": {
                            "text": "Project title length by characters"
                        },
                        "autorange": true
                    },
                    "yaxis": {
                        "type": "linear",
                        "range": [
                            0,
                            38.94736842105263
                        ],
                        "title": {
                            "text": "Average number of project reads"
                        },
                        "autorange": true
                    },
                    "bargap": 0.38,
                    "autosize": true,
                    "dragmode": "zoom",
                    "hovermode": "closest"
                }
            },
            "height": null,
            "width": null,
            "user": {
                "profile_url": "https://chart-studio.plotly.com/~kakawajazz",
                "avatar_url": "https://storage.googleapis.com/plotly-prod-profiles/64.jpg",
                "background_url": "https://storage.googleapis.com/plotly-prod-profiles/bg-4.jpg",
                "bio": "",
                "nickname": "",
                "website": "",
                "stream_tokens": null,
                "feature_set_id": null,
                "csrf_token": null,
                "date_joined": "2024-03-23 21:23:29",
                "mapbox_access_tokens": null,
                "has_password": null,
                "username": "kakawajazz",
                "email": null,
                "is_active": null,
                "readonly": null,
                "is_dash_creator": null,
                "dash_created_count": null,
                "is_chart_creator": null,
                "charts_created_count": null
            }
        },
        {
            "creation_time": "2024-03-23T21:08:37.349411Z",
            "comments": {
                "results": [],
                "count": 0
            },
            "parented": true,
            "embed_url": "https://chart-studio.plotly.com/~jwolf083/82.embed",
            "fid": "jwolf083:82",
            "filename": "Cubic small",
            "filetype": "plot",
            "img_url": "https://storage.googleapis.com/plotly-prod-images/jwolf083/82/9_D8KTELOD9DTF9TP6R86W0ILDASFL4L.png",
            "image_urls": {
                "default": "https://storage.googleapis.com/plotly-prod-images/jwolf083/82/2_0XUZDVKDN2CF8XRUEVNGFDG9MD5EVB.png",
                "block-thumb": "https://storage.googleapis.com/plotly-prod-images/jwolf083/82/8_NSD9I0V0G57FOB9FZRQ3SQM2NJGBOO.png",
                "list-thumb": "https://storage.googleapis.com/plotly-prod-images/jwolf083/82/9_D8KTELOD9DTF9TP6R86W0ILDASFL4L.png"
            },
            "api_urls": {
                "files": "https://api.plotly.com/v2/files/jwolf083:82",
                "plots": "https://api.plotly.com/v2/plots/jwolf083:82",
                "parent": "https://api.plotly.com/v2/folders/home?user=jwolf083"
            },
            "owner": "jwolf083",
            "parent": -1,
            "preview": "",
            "referencers": [],
            "references": [],
            "title": "",
            "views": 2,
            "web_url": "https://chart-studio.plotly.com/~jwolf083/82/",
            "world_readable": true,
            "date_modified": "2024-03-23T22:41:34.276Z",
            "stars": {
                "results": [],
                "count": 0
            },
            "collaborators": {
                "results": [],
                "count": 0
            },
            "subfolder_count": null,
            "refresh_interval": null,
            "organize_view_url": "https://chart-studio.plotly.com/~jwolf083/82/",
            "current_user_permission": "read",
            "is_theme": null,
            "is_template": false,
            "autosize": true,
            "caption": "",
            "figure": {
                "data": [
                    {
                        "uid": "fd4f4f",
                        "line": {
                            "color": "rgb(168, 125, 61)",
                            "width": 5
                        },
                        "meta": {
                            "columnNames": {
                                "x": "Time",
                                "y": "SSThresh",
                                "marker": {
                                    "color": "Y"
                                }
                            }
                        },
                        "mode": "lines",
                        "name": "<b>SSTHRESH</b>",
                        "type": "scatter",
                        "xsrc": "jwolf083:62:e56e95",
                        "ysrc": "jwolf083:62:354df0",
                        "marker": {
                            "meta": {
                                "columnNames": {
                                    "color": "SSThresh"
                                }
                            },
                            "cauto": true,
                            "colorsrc": "jwolf083:62:354df0",
                            "colorscale": [
                                [
                                    0,
                                    "#4c78a8"
                                ],
                                [
                                    0.1111111111111111,
                                    "#f58518"
                                ],
                                [
                                    0.2222222222222222,
                                    "#e45756"
                                ],
                                [
                                    0.3333333333333333,
                                    "#72b7b2"
                                ],
                                [
                                    0.4444444444444444,
                                    "#54a24b"
                                ],
                                [
                                    0.5555555555555556,
                                    "#eeca3b"
                                ],
                                [
                                    0.6666666666666666,
                                    "#b279a2"
                                ],
                                [
                                    0.7777777777777778,
                                    "#ff9da6"
                                ],
                                [
                                    0.8888888888888888,
                                    "#9d755d"
                                ],
                                [
                                    1,
                                    "#bab0ac"
                                ]
                            ],
                            "reversescale": false
                        },
                        "transforms": [
                            {
                                "meta": {
                                    "columnNames": {
                                        "target": "SSThresh"
                                    }
                                },
                                "type": "filter",
                                "value": [
                                    "-1",
                                    "50000"
                                ],
                                "enabled": true,
                                "operation": "[]",
                                "targetsrc": "jwolf083:62:354df0"
                            }
                        ],
                        "connectgaps": false,
                        "autocolorscale": false
                    },
                    {
                        "line": {
                            "color": "rgb(31, 119, 180)",
                            "width": 5
                        },
                        "meta": {
                            "columnNames": {
                                "x": "Time",
                                "y": "CWND"
                            }
                        },
                        "mode": "lines",
                        "name": "<b>CWND</b>",
                        "type": "scatter",
                        "xsrc": "jwolf083:62:e56e95",
                        "ysrc": "jwolf083:62:eda16b",
                        "stackgroup": null
                    },
                    {
                        "line": {
                            "width": 5
                        },
                        "meta": {
                            "columnNames": {
                                "x": "Time",
                                "y": "SRTT"
                            }
                        },
                        "mode": "lines",
                        "name": "<b>SRTT</b>",
                        "type": "scatter",
                        "xsrc": "jwolf083:62:e56e95",
                        "ysrc": "jwolf083:62:004d55",
                        "yaxis": "y2",
                        "stackgroup": null
                    }
                ],
                "frames": [],
                "layout": {
                    "scene": {
                        "aspectmode": "auto",
                        "aspectratio": {
                            "x": 1,
                            "y": 1,
                            "z": 1
                        }
                    },
                    "title": {
                        "font": {
                            "size": 38,
                            "color": "rgb(15, 7, 247)"
                        },
                        "text": "<b>CUBIC reacts to buffer overflow</b>"
                    },
                    "xaxis": {
                        "side": "bottom",
                        "type": "linear",
                        "range": [
                            0,
                            17.5
                        ],
                        "title": {
                            "font": {
                                "size": 27
                            },
                            "text": "<b>Time (Seconds)</b>"
                        },
                        "domain": [
                            0.01,
                            0.96
                        ],
                        "mirror": "ticks",
                        "showgrid": false,
                        "showline": true,
                        "tickfont": {
                            "size": 24
                        },
                        "tickmode": "auto",
                        "autorange": false,
                        "gridwidth": 2,
                        "linewidth": 5,
                        "fixedrange": true,
                        "tickformat": "",
                        "zerolinewidth": 4
                    },
                    "yaxis": {
                        "type": "linear",
                        "dtick": 10,
                        "range": [
                            -2.010840503727989,
                            238.2059695708318
                        ],
                        "title": {
                            "font": {
                                "size": 27
                            },
                            "text": "<b>Window Size (Segments)</b>"
                        },
                        "mirror": "ticks",
                        "showgrid": false,
                        "showline": true,
                        "tickfont": {
                            "size": 24
                        },
                        "tickmode": "auto",
                        "zeroline": false,
                        "autorange": true,
                        "gridwidth": 2,
                        "linewidth": 5,
                        "fixedrange": true,
                        "zerolinewidth": 4
                    },
                    "images": [],
                    "legend": {
                        "x": 0.8245079834067315,
                        "y": 1,
                        "font": {
                            "size": 22
                        },
                        "traceorder": "reversed"
                    },
                    "shapes": [
                        {
                            "x0": 4.335480734167983,
                            "x1": 13.444187836797536,
                            "y0": 135,
                            "y1": 135,
                            "line": {
                                "dash": "dash",
                                "color": "rgb(255, 4, 4)",
                                "width": 5
                            },
                            "type": "line",
                            "opacity": 1,
                            "fillcolor": "rgb(242, 4, 4)"
                        },
                        {
                            "x0": 3.67,
                            "x1": 3.67,
                            "y0": -1,
                            "y1": 233.66666666666666,
                            "line": {
                                "dash": "dot",
                                "color": "rgb(13, 13, 13)",
                                "width": 4
                            },
                            "type": "line",
                            "opacity": 0.8,
                            "fillcolor": "#7f7f7f"
                        },
                        {
                            "x0": 3.7,
                            "x1": 3.93,
                            "y0": 119,
                            "y1": 119,
                            "line": {
                                "dash": "dot",
                                "color": "#444444"
                            },
                            "type": "line",
                            "opacity": 1,
                            "visible": false,
                            "fillcolor": "#7f7f7f"
                        },
                        {
                            "x0": 4.3,
                            "x1": 4.3,
                            "y0": -1,
                            "y1": 234,
                            "line": {
                                "dash": "dot",
                                "color": "#444444",
                                "width": 4
                            },
                            "type": "line",
                            "opacity": 1,
                            "visible": false,
                            "fillcolor": "#7f7f7f"
                        }
                    ],
                    "yaxis2": {
                        "side": "right",
                        "type": "linear",
                        "range": [
                            11205.166666666662,
                            500000
                        ],
                        "title": {
                            "font": {
                                "size": 27
                            },
                            "text": "<b>Smoothed Round Trip Time </b><br><b>(Microseconds)</b>"
                        },
                        "showgrid": false,
                        "tickfont": {
                            "size": 24
                        },
                        "tickmode": "auto",
                        "autorange": false,
                        "linewidth": 5,
                        "fixedrange": true,
                        "overlaying": "y",
                        "zerolinewidth": 4
                    },
                    "autosize": true,
                    "annotations": [
                        {
                            "x": 4.554596653296057,
                            "y": 109.05765199161425,
                            "ax": 121,
                            "ay": 155,
                            "font": {
                                "size": 24
                            },
                            "text": "<b>CWND reaches SSTHRESH<br>begin logarithmic growth</b>",
                            "arrowwidth": 3
                        },
                        {
                            "x": 8.47666220979701,
                            "y": 154.21861908456168,
                            "ax": -6,
                            "ay": -54,
                            "font": {
                                "size": 24
                            },
                            "text": "<b>CWND reaches Wmax<br>begin exponential growth</b>",
                            "showarrow": false,
                            "arrowwidth": 4
                        },
                        {
                            "x": 3.736112799319314,
                            "y": 222.84619450317126,
                            "ax": 215,
                            "ay": 19,
                            "font": {
                                "size": 24
                            },
                            "text": "<b>Packet loss: enter</b><br><b>congestion avoidance</b><br>\n<b> phase</b>",
                            "showarrow": true,
                            "arrowwidth": 3
                        },
                        {
                            "x": 4.31149467201491,
                            "y": 160.1617749825297,
                            "ax": 34,
                            "ay": -98,
                            "text": "<br>",
                            "arrowwidth": 3
                        },
                        {
                            "x": 5.138041408370811,
                            "y": 144.28476589797344,
                            "ax": -317,
                            "ay": -55,
                            "font": {
                                "size": 24,
                                "color": "rgb(247, 0, 0)"
                            },
                            "text": "<b>W</b><sub><b>max</b></sub>",
                            "showarrow": false
                        },
                        {
                            "x": 0.2273813864916328,
                            "y": 75.31900768693221,
                            "ax": 96,
                            "ay": 74,
                            "font": {
                                "size": 24
                            },
                            "text": "<b>End of</b><br><b>Slow Start</b>",
                            "arrowsize": 1,
                            "arrowwidth": 3
                        }
                    ]
                }
            },
            "height": null,
            "width": null,
            "user": {
                "profile_url": "https://chart-studio.plotly.com/~jwolf083",
                "avatar_url": "https://storage.googleapis.com/plotly-prod-profiles/27.jpg",
                "background_url": "https://storage.googleapis.com/plotly-prod-profiles/bg-8.jpg",
                "bio": "",
                "nickname": "",
                "website": "",
                "stream_tokens": null,
                "feature_set_id": null,
                "csrf_token": null,
                "date_joined": "2021-04-13 01:49:19",
                "mapbox_access_tokens": null,
                "has_password": null,
                "username": "jwolf083",
                "email": null,
                "is_active": null,
                "readonly": null,
                "is_dash_creator": null,
                "dash_created_count": null,
                "is_chart_creator": null,
                "charts_created_count": null
            }
        },
        {
            "creation_time": "2024-03-23T20:35:03.027916Z",
            "comments": {
                "results": [],
                "count": 0
            },
            "parented": true,
            "embed_url": "https://chart-studio.plotly.com/~jwolf083/81.embed",
            "fid": "jwolf083:81",
            "filename": "Poster Base Size",
            "filetype": "plot",
            "img_url": "https://storage.googleapis.com/plotly-prod-images/jwolf083/81/9_S0XOJEBYKUJM9QUG6UVRJC3NTL2786.png",
            "image_urls": {
                "default": "https://storage.googleapis.com/plotly-prod-images/jwolf083/81/2_63LK1Y7FRI0R4VZVW5OLKYHKA2X177.png",
                "block-thumb": "https://storage.googleapis.com/plotly-prod-images/jwolf083/81/8_NCCF18WTP769DL5F37SXZBDZV70P98.png",
                "list-thumb": "https://storage.googleapis.com/plotly-prod-images/jwolf083/81/9_S0XOJEBYKUJM9QUG6UVRJC3NTL2786.png"
            },
            "api_urls": {
                "files": "https://api.plotly.com/v2/files/jwolf083:81",
                "plots": "https://api.plotly.com/v2/plots/jwolf083:81",
                "parent": "https://api.plotly.com/v2/folders/home?user=jwolf083"
            },
            "owner": "jwolf083",
            "parent": -1,
            "preview": "",
            "referencers": [],
            "references": [],
            "title": "",
            "views": 2,
            "web_url": "https://chart-studio.plotly.com/~jwolf083/81/",
            "world_readable": true,
            "date_modified": "2024-03-23T20:42:02.834Z",
            "stars": {
                "results": [],
                "count": 0
            },
            "collaborators": {
                "results": [],
                "count": 0
            },
            "subfolder_count": null,
            "refresh_interval": null,
            "organize_view_url": "https://chart-studio.plotly.com/~jwolf083/81/",
            "current_user_permission": "read",
            "is_theme": null,
            "is_template": true,
            "autosize": true,
            "caption": "",
            "figure": {
                "data": [
                    {
                        "uid": "fd4f4f",
                        "line": {
                            "color": "rgb(168, 125, 61)",
                            "width": 5
                        },
                        "meta": {
                            "columnNames": {
                                "x": "Time",
                                "y": "SSThresh",
                                "marker": {
                                    "color": "Y"
                                }
                            }
                        },
                        "mode": "lines",
                        "name": "<b>SSTHRESH</b>",
                        "type": "scatter",
                        "xsrc": "jwolf083:62:e56e95",
                        "ysrc": "jwolf083:62:354df0",
                        "marker": {
                            "meta": {
                                "columnNames": {
                                    "color": "SSThresh"
                                }
                            },
                            "cauto": true,
                            "colorsrc": "jwolf083:62:354df0",
                            "colorscale": [
                                [
                                    0,
                                    "#4c78a8"
                                ],
                                [
                                    0.1111111111111111,
                                    "#f58518"
                                ],
                                [
                                    0.2222222222222222,
                                    "#e45756"
                                ],
                                [
                                    0.3333333333333333,
                                    "#72b7b2"
                                ],
                                [
                                    0.4444444444444444,
                                    "#54a24b"
                                ],
                                [
                                    0.5555555555555556,
                                    "#eeca3b"
                                ],
                                [
                                    0.6666666666666666,
                                    "#b279a2"
                                ],
                                [
                                    0.7777777777777778,
                                    "#ff9da6"
                                ],
                                [
                                    0.8888888888888888,
                                    "#9d755d"
                                ],
                                [
                                    1,
                                    "#bab0ac"
                                ]
                            ],
                            "reversescale": false
                        },
                        "transforms": [
                            {
                                "meta": {
                                    "columnNames": {
                                        "target": "SSThresh"
                                    }
                                },
                                "type": "filter",
                                "value": [
                                    "-1",
                                    "50000"
                                ],
                                "enabled": true,
                                "operation": "[]",
                                "targetsrc": "jwolf083:62:354df0"
                            }
                        ],
                        "connectgaps": false,
                        "autocolorscale": false
                    },
                    {
                        "line": {
                            "color": "rgb(31, 119, 180)",
                            "width": 5
                        },
                        "meta": {
                            "columnNames": {
                                "x": "Time",
                                "y": "CWND"
                            }
                        },
                        "mode": "lines",
                        "name": "<b>CWND</b>",
                        "type": "scatter",
                        "xsrc": "jwolf083:62:e56e95",
                        "ysrc": "jwolf083:62:eda16b",
                        "stackgroup": null
                    },
                    {
                        "line": {
                            "width": 5
                        },
                        "meta": {
                            "columnNames": {
                                "x": "Time",
                                "y": "SRTT"
                            }
                        },
                        "mode": "lines",
                        "name": "<b>SRTT</b>",
                        "type": "scatter",
                        "xsrc": "jwolf083:62:e56e95",
                        "ysrc": "jwolf083:62:004d55",
                        "yaxis": "y2",
                        "stackgroup": null
                    }
                ],
                "frames": [],
                "layout": {
                    "scene": {
                        "aspectmode": "auto",
                        "aspectratio": {
                            "x": 1,
                            "y": 1,
                            "z": 1
                        }
                    },
                    "title": {
                        "font": {
                            "size": 38,
                            "color": "rgb(15, 7, 247)"
                        },
                        "text": "<b>CWND vs SSTHRESH Small Buffer - CUBIC</b>"
                    },
                    "xaxis": {
                        "side": "bottom",
                        "type": "linear",
                        "range": [
                            0,
                            20
                        ],
                        "title": {
                            "font": {
                                "size": 27
                            },
                            "text": "<b>Time (Seconds)</b>"
                        },
                        "domain": [
                            0.01,
                            0.96
                        ],
                        "mirror": "ticks",
                        "showgrid": false,
                        "showline": true,
                        "tickfont": {
                            "size": 24
                        },
                        "tickmode": "auto",
                        "autorange": false,
                        "gridwidth": 2,
                        "linewidth": 5,
                        "fixedrange": true,
                        "tickformat": "",
                        "zerolinewidth": 4
                    },
                    "yaxis": {
                        "type": "linear",
                        "dtick": 10,
                        "range": [
                            -1.8333333333333357,
                            234.83333333333334
                        ],
                        "title": {
                            "font": {
                                "size": 27
                            },
                            "text": "<b>Window Size (Segments)</b>"
                        },
                        "mirror": "ticks",
                        "showgrid": false,
                        "showline": true,
                        "tickfont": {
                            "size": 24
                        },
                        "tickmode": "auto",
                        "zeroline": false,
                        "autorange": true,
                        "gridwidth": 2,
                        "linewidth": 5,
                        "fixedrange": true,
                        "zerolinewidth": 4
                    },
                    "images": [],
                    "legend": {
                        "x": 0.8399044422212042,
                        "y": 1,
                        "font": {
                            "size": 22
                        },
                        "traceorder": "reversed"
                    },
                    "shapes": [],
                    "yaxis2": {
                        "side": "right",
                        "type": "linear",
                        "range": [
                            11205.166666666662,
                            500000
                        ],
                        "title": {
                            "font": {
                                "size": 27
                            },
                            "text": "<b>Smoothed Round Trip Time </b><br><b>(Microseconds)</b>"
                        },
                        "showgrid": false,
                        "tickfont": {
                            "size": 24
                        },
                        "tickmode": "auto",
                        "autorange": false,
                        "linewidth": 5,
                        "fixedrange": true,
                        "overlaying": "y",
                        "zerolinewidth": 4
                    },
                    "autosize": true,
                    "annotations": [
                        {
                            "x": 4.554596653296057,
                            "y": 109.05765199161425,
                            "ax": 224,
                            "ay": 40,
                            "font": {
                                "size": 24
                            },
                            "text": "<b>CWND reaches SSTHRESH<br>begin logarithmic growth</b>",
                            "arrowwidth": 4
                        },
                        {
                            "x": 8.47664195129857,
                            "y": 136.3462613556953,
                            "ax": -6,
                            "ay": -54,
                            "font": {
                                "size": 24
                            },
                            "text": "<b>CWND reaches Wmax<br>begin exponential growth</b>",
                            "arrowwidth": 4
                        }
                    ]
                }
            },
            "height": null,
            "width": null,
            "user": {
                "profile_url": "https://chart-studio.plotly.com/~jwolf083",
                "avatar_url": "https://storage.googleapis.com/plotly-prod-profiles/27.jpg",
                "background_url": "https://storage.googleapis.com/plotly-prod-profiles/bg-8.jpg",
                "bio": "",
                "nickname": "",
                "website": "",
                "stream_tokens": null,
                "feature_set_id": null,
                "csrf_token": null,
                "date_joined": "2021-04-13 01:49:19",
                "mapbox_access_tokens": null,
                "has_password": null,
                "username": "jwolf083",
                "email": null,
                "is_active": null,
                "readonly": null,
                "is_dash_creator": null,
                "dash_created_count": null,
                "is_chart_creator": null,
                "charts_created_count": null
            }
        },
        {
            "creation_time": "2024-03-23T20:28:37.595867Z",
            "comments": {
                "results": [],
                "count": 0
            },
            "parented": true,
            "embed_url": "https://chart-studio.plotly.com/~vanessa.arlene24/1.embed",
            "fid": "vanessa.arlene24:1",
            "filename": "Plot 1",
            "filetype": "plot",
            "img_url": "https://storage.googleapis.com/plotly-prod-images/vanessa.arlene24/1/9_QXFYGU9JIXF5I2XQSGCVCZYZGVNM3W.png",
            "image_urls": {
                "default": "https://storage.googleapis.com/plotly-prod-images/vanessa.arlene24/1/2_7Z6L4C57VHSIC5YSFGN01EM01XM2JV.png",
                "block-thumb": "https://storage.googleapis.com/plotly-prod-images/vanessa.arlene24/1/8_3LK1UMZKALH7DDR9QZWEFI0PMN95N6.png",
                "list-thumb": "https://storage.googleapis.com/plotly-prod-images/vanessa.arlene24/1/9_QXFYGU9JIXF5I2XQSGCVCZYZGVNM3W.png"
            },
            "api_urls": {
                "files": "https://api.plotly.com/v2/files/vanessa.arlene24:1",
                "plots": "https://api.plotly.com/v2/plots/vanessa.arlene24:1",
                "parent": "https://api.plotly.com/v2/folders/home?user=vanessa.arlene24"
            },
            "owner": "vanessa.arlene24",
            "parent": -1,
            "preview": "",
            "referencers": [],
            "references": [],
            "title": "",
            "views": 1,
            "web_url": "https://chart-studio.plotly.com/~vanessa.arlene24/1/",
            "world_readable": true,
            "date_modified": "2024-03-23T20:28:37.612Z",
            "stars": {
                "results": [],
                "count": 0
            },
            "collaborators": {
                "results": [],
                "count": 0
            },
            "subfolder_count": null,
            "refresh_interval": null,
            "organize_view_url": "https://chart-studio.plotly.com/~vanessa.arlene24/1/",
            "current_user_permission": "read",
            "is_theme": null,
            "is_template": false,
            "autosize": true,
            "caption": "",
            "figure": {
                "data": [
                    {
                        "uid": "9478dd",
                        "meta": {
                            "columnNames": {
                                "x": "Col1",
                                "y": "Col2"
                            }
                        },
                        "mode": "lines",
                        "name": "Col2",
                        "type": "scatter",
                        "xsrc": "vanessa.arlene24:0:253201",
                        "ysrc": "vanessa.arlene24:0:11e2c8"
                    }
                ],
                "frames": [],
                "layout": {
                    "title": {
                        "text": "Heating Curve Graph"
                    },
                    "width": 1119,
                    "xaxis": {
                        "type": "linear",
                        "range": [
                            -7.5,
                            22.5
                        ],
                        "title": {
                            "text": "Time (Minutes)"
                        },
                        "autorange": false
                    },
                    "yaxis": {
                        "type": "linear",
                        "range": [
                            -23.055555555555543,
                            148.05555555555554
                        ],
                        "title": {
                            "text": "Temperature (°C)"
                        },
                        "autorange": false
                    },
                    "height": 547,
                    "autosize": true,
                    "dragmode": "zoom"
                }
            },
            "height": 547,
            "width": 1119,
            "user": {
                "profile_url": "https://chart-studio.plotly.com/~vanessa.arlene24",
                "avatar_url": "https://storage.googleapis.com/plotly-prod-profiles/37.jpg",
                "background_url": "https://storage.googleapis.com/plotly-prod-profiles/bg-0.jpg",
                "bio": "",
                "nickname": "",
                "website": "",
                "stream_tokens": null,
                "feature_set_id": null,
                "csrf_token": null,
                "date_joined": "2024-03-23 20:28:12",
                "mapbox_access_tokens": null,
                "has_password": null,
                "username": "vanessa.arlene24",
                "email": null,
                "is_active": null,
                "readonly": null,
                "is_dash_creator": null,
                "dash_created_count": null,
                "is_chart_creator": null,
                "charts_created_count": null
            }
        },
        {
            "creation_time": "2024-03-23T19:42:42.051385Z",
            "comments": {
                "results": [],
                "count": 0
            },
            "parented": true,
            "embed_url": "https://chart-studio.plotly.com/~katochris86/1.embed",
            "fid": "katochris86:1",
            "filename": "Plot 1",
            "filetype": "plot",
            "img_url": "https://storage.googleapis.com/plotly-prod-images/katochris86/1/9_NVXY3MJOU6V5E4Q5B4D8B4P8ZS6XSR.png",
            "image_urls": {
                "default": "https://storage.googleapis.com/plotly-prod-images/katochris86/1/2_GR9DFMJS6IYVUQSOU3KVMP1Y3ZD68S.png",
                "block-thumb": "https://storage.googleapis.com/plotly-prod-images/katochris86/1/8_W2N4TQ1OOA08B4LTHRAIXF5BPR1GGY.png",
                "list-thumb": "https://storage.googleapis.com/plotly-prod-images/katochris86/1/9_NVXY3MJOU6V5E4Q5B4D8B4P8ZS6XSR.png"
            },
            "api_urls": {
                "files": "https://api.plotly.com/v2/files/katochris86:1",
                "plots": "https://api.plotly.com/v2/plots/katochris86:1",
                "parent": "https://api.plotly.com/v2/folders/home?user=katochris86"
            },
            "owner": "katochris86",
            "parent": -1,
            "preview": "",
            "referencers": [],
            "references": [],
            "title": "",
            "views": 1,
            "web_url": "https://chart-studio.plotly.com/~katochris86/1/",
            "world_readable": true,
            "date_modified": "2024-03-23T19:42:42.067Z",
            "stars": {
                "results": [],
                "count": 0
            },
            "collaborators": {
                "results": [],
                "count": 0
            },
            "subfolder_count": null,
            "refresh_interval": null,
            "organize_view_url": "https://chart-studio.plotly.com/~katochris86/1/",
            "current_user_permission": "read",
            "is_theme": null,
            "is_template": false,
            "autosize": true,
            "caption": "",
            "figure": {
                "data": [
                    {
                        "meta": {
                            "columnNames": {
                                "x": "FREQUENCY",
                                "y": "PERCENTAGE"
                            }
                        },
                        "mode": "markers",
                        "type": "bar",
                        "xsrc": "katochris86:0:f1dbcc",
                        "ysrc": "katochris86:0:df31e5",
                        "orientation": "v"
                    }
                ],
                "frames": [],
                "layout": {
                    "xaxis": {
                        "type": "linear",
                        "range": [
                            -0.6960651289009498,
                            1.1940298507462686
                        ],
                        "autorange": false
                    },
                    "yaxis": {
                        "type": "linear",
                        "range": [
                            -0.003537735849056589,
                            3.982311320754717
                        ],
                        "autorange": false
                    },
                    "autosize": true,
                    "template": {
                        "data": {
                            "bar": [
                                {
                                    "type": "bar",
                                    "marker": {
                                        "colorbar": {
                                            "ticks": "",
                                            "outlinewidth": 0
                                        }
                                    }
                                }
                            ],
                            "table": [
                                {
                                    "type": "table",
                                    "cells": {
                                        "fill": {
                                            "color": "#EBF0F8"
                                        },
                                        "line": {
                                            "color": "white"
                                        }
                                    },
                                    "header": {
                                        "fill": {
                                            "color": "#C8D4E3"
                                        },
                                        "line": {
                                            "color": "white"
                                        }
                                    }
                                }
                            ],
                            "carpet": [
                                {
                                    "type": "carpet",
                                    "aaxis": {
                                        "gridcolor": "#C8D4E3",
                                        "linecolor": "#C8D4E3",
                                        "endlinecolor": "#2a3f5f",
                                        "minorgridcolor": "#C8D4E3",
                                        "startlinecolor": "#2a3f5f"
                                    },
                                    "baxis": {
                                        "gridcolor": "#C8D4E3",
                                        "linecolor": "#C8D4E3",
                                        "endlinecolor": "#2a3f5f",
                                        "minorgridcolor": "#C8D4E3",
                                        "startlinecolor": "#2a3f5f"
                                    }
                                }
                            ],
                            "mesh3d": [
                                {
                                    "type": "mesh3d",
                                    "colorbar": {
                                        "ticks": "",
                                        "outlinewidth": 0
                                    }
                                }
                            ],
                            "contour": [
                                {
                                    "type": "contour",
                                    "colorbar": {
                                        "ticks": "",
                                        "outlinewidth": 0
                                    },
                                    "autocolorscale": true
                                }
                            ],
                            "heatmap": [
                                {
                                    "type": "heatmap",
                                    "colorbar": {
                                        "ticks": "",
                                        "outlinewidth": 0
                                    },
                                    "autocolorscale": true
                                }
                            ],
                            "scatter": [
                                {
                                    "type": "scatter",
                                    "marker": {
                                        "colorbar": {
                                            "ticks": "",
                                            "outlinewidth": 0
                                        }
                                    }
                                }
                            ],
                            "surface": [
                                {
                                    "type": "surface",
                                    "colorbar": {
                                        "ticks": "",
                                        "outlinewidth": 0
                                    }
                                }
                            ],
                            "heatmapgl": [
                                {
                                    "type": "heatmapgl",
                                    "colorbar": {
                                        "ticks": "",
                                        "outlinewidth": 0
                                    }
                                }
                            ],
                            "histogram": [
                                {
                                    "type": "histogram",
                                    "marker": {
                                        "colorbar": {
                                            "ticks": "",
                                            "outlinewidth": 0
                                        }
                                    }
                                }
                            ],
                            "parcoords": [
                                {
                                    "line": {
                                        "colorbar": {
                                            "ticks": "",
                                            "outlinewidth": 0
                                        }
                                    },
                                    "type": "parcoords"
                                }
                            ],
                            "scatter3d": [
                                {
                                    "type": "scatter3d",
                                    "marker": {
                                        "colorbar": {
                                            "ticks": "",
                                            "outlinewidth": 0
                                        }
                                    }
                                }
                            ],
                            "scattergl": [
                                {
                                    "type": "scattergl",
                                    "marker": {
                                        "colorbar": {
                                            "ticks": "",
                                            "outlinewidth": 0
                                        }
                                    }
                                }
                            ],
                            "choropleth": [
                                {
                                    "type": "choropleth",
                                    "colorbar": {
                                        "ticks": "",
                                        "outlinewidth": 0
                                    }
                                }
                            ],
                            "scattergeo": [
                                {
                                    "type": "scattergeo",
                                    "marker": {
                                        "colorbar": {
                                            "ticks": "",
                                            "outlinewidth": 0
                                        }
                                    }
                                }
                            ],
                            "histogram2d": [
                                {
                                    "type": "histogram2d",
                                    "colorbar": {
                                        "ticks": "",
                                        "outlinewidth": 0
                                    },
                                    "autocolorscale": true
                                }
                            ],
                            "scatterpolar": [
                                {
                                    "type": "scatterpolar",
                                    "marker": {
                                        "colorbar": {
                                            "ticks": "",
                                            "outlinewidth": 0
                                        }
                                    }
                                }
                            ],
                            "contourcarpet": [
                                {
                                    "type": "contourcarpet",
                                    "colorbar": {
                                        "ticks": "",
                                        "outlinewidth": 0
                                    }
                                }
                            ],
                            "scattercarpet": [
                                {
                                    "type": "scattercarpet",
                                    "marker": {
                                        "colorbar": {
                                            "ticks": "",
                                            "outlinewidth": 0
                                        }
                                    }
                                }
                            ],
                            "scattermapbox": [
                                {
                                    "type": "scattermapbox",
                                    "marker": {
                                        "colorbar": {
                                            "ticks": "",
                                            "outlinewidth": 0
                                        }
                                    }
                                }
                            ],
                            "scatterpolargl": [
                                {
                                    "type": "scatterpolargl",
                                    "marker": {
                                        "colorbar": {
                                            "ticks": "",
                                            "outlinewidth": 0
                                        }
                                    }
                                }
                            ],
                            "scatterternary": [
                                {
                                    "type": "scatterternary",
                                    "marker": {
                                        "colorbar": {
                                            "ticks": "",
                                            "outlinewidth": 0
                                        }
                                    }
                                }
                            ],
                            "histogram2dcontour": [
                                {
                                    "type": "histogram2dcontour",
                                    "colorbar": {
                                        "ticks": "",
                                        "outlinewidth": 0
                                    },
                                    "autocolorscale": true
                                }
                            ]
                        },
                        "layout": {
                            "geo": {
                                "bgcolor": "white",
                                "showland": true,
                                "lakecolor": "white",
                                "landcolor": "white",
                                "showlakes": true,
                                "subunitcolor": "#C8D4E3"
                            },
                            "font": {
                                "color": "#2a3f5f"
                            },
                            "polar": {
                                "bgcolor": "white",
                                "radialaxis": {
                                    "ticks": "",
                                    "gridcolor": "#EBF0F8",
                                    "linecolor": "#EBF0F8"
                                },
                                "angularaxis": {
                                    "ticks": "",
                                    "gridcolor": "#EBF0F8",
                                    "linecolor": "#EBF0F8"
                                }
                            },
                            "scene": {
                                "xaxis": {
                                    "ticks": "",
                                    "gridcolor": "#DFE8F3",
                                    "gridwidth": 2,
                                    "linecolor": "#EBF0F8",
                                    "zerolinecolor": "#EBF0F8",
                                    "showbackground": true,
                                    "backgroundcolor": "white"
                                },
                                "yaxis": {
                                    "ticks": "",
                                    "gridcolor": "#DFE8F3",
                                    "gridwidth": 2,
                                    "linecolor": "#EBF0F8",
                                    "zerolinecolor": "#EBF0F8",
                                    "showbackground": true,
                                    "backgroundcolor": "white"
                                },
                                "zaxis": {
                                    "ticks": "",
                                    "gridcolor": "#DFE8F3",
                                    "gridwidth": 2,
                                    "linecolor": "#EBF0F8",
                                    "zerolinecolor": "#EBF0F8",
                                    "showbackground": true,
                                    "backgroundcolor": "white"
                                }
                            },
                            "title": {
                                "x": 0.05
                            },
                            "xaxis": {
                                "ticks": "",
                                "gridcolor": "#EBF0F8",
                                "linecolor": "#EBF0F8",
                                "automargin": true,
                                "zerolinecolor": "#EBF0F8",
                                "zerolinewidth": 2
                            },
                            "yaxis": {
                                "ticks": "",
                                "gridcolor": "#EBF0F8",
                                "linecolor": "#EBF0F8",
                                "automargin": true,
                                "zerolinecolor": "#EBF0F8",
                                "zerolinewidth": 2
                            },
                            "ternary": {
                                "aaxis": {
                                    "ticks": "",
                                    "gridcolor": "#DFE8F3",
                                    "linecolor": "#A2B1C6"
                                },
                                "baxis": {
                                    "ticks": "",
                                    "gridcolor": "#DFE8F3",
                                    "linecolor": "#A2B1C6"
                                },
                                "caxis": {
                                    "ticks": "",
                                    "gridcolor": "#DFE8F3",
                                    "linecolor": "#A2B1C6"
                                },
                                "bgcolor": "white"
                            },
                            "colorway": [
                                "#636efa",
                                "#EF553B",
                                "#00cc96",
                                "#ab63fa",
                                "#19d3f3",
                                "#e763fa",
                                "#fecb52",
                                "#ffa15a",
                                "#ff6692",
                                "#b6e880"
                            ],
                            "hovermode": "closest",
                            "colorscale": {
                                "diverging": [
                                    [
                                        0,
                                        "#8e0152"
                                    ],
                                    [
                                        0.1,
                                        "#c51b7d"
                                    ],
                                    [
                                        0.2,
                                        "#de77ae"
                                    ],
                                    [
                                        0.3,
                                        "#f1b6da"
                                    ],
                                    [
                                        0.4,
                                        "#fde0ef"
                                    ],
                                    [
                                        0.5,
                                        "#f7f7f7"
                                    ],
                                    [
                                        0.6,
                                        "#e6f5d0"
                                    ],
                                    [
                                        0.7,
                                        "#b8e186"
                                    ],
                                    [
                                        0.8,
                                        "#7fbc41"
                                    ],
                                    [
                                        0.9,
                                        "#4d9221"
                                    ],
                                    [
                                        1,
                                        "#276419"
                                    ]
                                ],
                                "sequential": [
                                    [
                                        0,
                                        "#0508b8"
                                    ],
                                    [
                                        0.0893854748603352,
                                        "#1910d8"
                                    ],
                                    [
                                        0.1787709497206704,
                                        "#3c19f0"
                                    ],
                                    [
                                        0.2681564245810056,
                                        "#6b1cfb"
                                    ],
                                    [
                                        0.3575418994413408,
                                        "#981cfd"
                                    ],
                                    [
                                        0.44692737430167595,
                                        "#bf1cfd"
                                    ],
                                    [
                                        0.5363128491620112,
                                        "#dd2bfd"
                                    ],
                                    [
                                        0.6256983240223464,
                                        "#f246fe"
                                    ],
                                    [
                                        0.7150837988826816,
                                        "#fc67fd"
                                    ],
                                    [
                                        0.8044692737430168,
                                        "#fe88fc"
                                    ],
                                    [
                                        0.8938547486033519,
                                        "#fea5fd"
                                    ],
                                    [
                                        0.9832402234636871,
                                        "#febefe"
                                    ],
                                    [
                                        1,
                                        "#fec3fe"
                                    ]
                                ],
                                "sequentialminus": [
                                    [
                                        0,
                                        "#0508b8"
                                    ],
                                    [
                                        0.0893854748603352,
                                        "#1910d8"
                                    ],
                                    [
                                        0.1787709497206704,
                                        "#3c19f0"
                                    ],
                                    [
                                        0.2681564245810056,
                                        "#6b1cfb"
                                    ],
                                    [
                                        0.3575418994413408,
                                        "#981cfd"
                                    ],
                                    [
                                        0.44692737430167595,
                                        "#bf1cfd"
                                    ],
                                    [
                                        0.5363128491620112,
                                        "#dd2bfd"
                                    ],
                                    [
                                        0.6256983240223464,
                                        "#f246fe"
                                    ],
                                    [
                                        0.7150837988826816,
                                        "#fc67fd"
                                    ],
                                    [
                                        0.8044692737430168,
                                        "#fe88fc"
                                    ],
                                    [
                                        0.8938547486033519,
                                        "#fea5fd"
                                    ],
                                    [
                                        0.9832402234636871,
                                        "#febefe"
                                    ],
                                    [
                                        1,
                                        "#fec3fe"
                                    ]
                                ]
                            },
                            "plot_bgcolor": "white",
                            "paper_bgcolor": "white",
                            "shapedefaults": {
                                "line": {
                                    "width": 0
                                },
                                "opacity": 0.4,
                                "fillcolor": "#506784"
                            },
                            "annotationdefaults": {
                                "arrowhead": 0,
                                "arrowcolor": "#506784",
                                "arrowwidth": 1
                            }
                        },
                        "themeRef": "PLOTLY_WHITE"
                    }
                }
            },
            "height": null,
            "width": null,
            "user": {
                "profile_url": "https://chart-studio.plotly.com/~katochris86",
                "avatar_url": "https://storage.googleapis.com/plotly-prod-profiles/51.jpg",
                "background_url": "https://storage.googleapis.com/plotly-prod-profiles/bg-14.jpg",
                "bio": "",
                "nickname": "",
                "website": "",
                "stream_tokens": null,
                "feature_set_id": null,
                "csrf_token": null,
                "date_joined": "2024-03-23 19:39:46",
                "mapbox_access_tokens": null,
                "has_password": null,
                "username": "katochris86",
                "email": null,
                "is_active": null,
                "readonly": null,
                "is_dash_creator": null,
                "dash_created_count": null,
                "is_chart_creator": null,
                "charts_created_count": null
            }
        },
        {
            "creation_time": "2024-03-23T19:20:58.394655Z",
            "comments": {
                "results": [],
                "count": 0
            },
            "parented": true,
            "embed_url": "https://chart-studio.plotly.com/~NoBrain77/1.embed",
            "fid": "NoBrain77:1",
            "filename": "Lab 6",
            "filetype": "plot",
            "img_url": "https://storage.googleapis.com/plotly-prod-images/NoBrain77/1/9_MA8T0XKO77V9MINVJO2SRLNCEUVXA6.png",
            "image_urls": {
                "default": "https://storage.googleapis.com/plotly-prod-images/NoBrain77/1/2_VE272LDOUEMTL7DYXU4JHRV80612UK.png",
                "block-thumb": "https://storage.googleapis.com/plotly-prod-images/NoBrain77/1/8_JD6FKI5U142FXILA4ZLBU1V1NQMN8Q.png",
                "list-thumb": "https://storage.googleapis.com/plotly-prod-images/NoBrain77/1/9_MA8T0XKO77V9MINVJO2SRLNCEUVXA6.png"
            },
            "api_urls": {
                "files": "https://api.plotly.com/v2/files/NoBrain77:1",
                "plots": "https://api.plotly.com/v2/plots/NoBrain77:1",
                "parent": "https://api.plotly.com/v2/folders/home?user=NoBrain77"
            },
            "owner": "NoBrain77",
            "parent": -1,
            "preview": "",
            "referencers": [],
            "references": [],
            "title": "",
            "views": 1,
            "web_url": "https://chart-studio.plotly.com/~NoBrain77/1/",
            "world_readable": true,
            "date_modified": "2024-03-23T19:20:58.407Z",
            "stars": {
                "results": [],
                "count": 0
            },
            "collaborators": {
                "results": [],
                "count": 0
            },
            "subfolder_count": null,
            "refresh_interval": null,
            "organize_view_url": "https://chart-studio.plotly.com/~NoBrain77/1/",
            "current_user_permission": "read",
            "is_theme": null,
            "is_template": false,
            "autosize": true,
            "caption": "",
            "figure": {
                "data": [
                    {
                        "uid": "f610cb",
                        "meta": {
                            "columnNames": {
                                "x": "x",
                                "y": "y"
                            }
                        },
                        "mode": "lines+markers",
                        "name": "Col2",
                        "type": "scatter",
                        "xsrc": "NoBrain77:0:912c33",
                        "ysrc": "NoBrain77:0:9035b9"
                    }
                ],
                "frames": [],
                "layout": {
                    "title": {
                        "text": "Beer's Law Plot"
                    },
                    "width": 1121,
                    "xaxis": {
                        "type": "linear",
                        "range": [
                            -1.6104407761369137,
                            15.946349353501862
                        ],
                        "title": {
                            "text": "Concentration of Standard Solutions (mg ASA/mL)"
                        },
                        "autorange": true
                    },
                    "yaxis": {
                        "type": "linear",
                        "range": [
                            -0.08062874684001446,
                            1.2226287468400143
                        ],
                        "title": {
                            "text": "Absorbance "
                        },
                        "autorange": true
                    },
                    "height": 496,
                    "autosize": true,
                    "annotations": [
                        {
                            "x": 0.05206484487986937,
                            "y": 0.49509118815456843,
                            "font": {
                                "size": 14
                            },
                            "text": "y = 9.280608x -0.002428"
                        }
                    ]
                }
            },
            "height": 496,
            "width": 1121,
            "user": {
                "profile_url": "https://chart-studio.plotly.com/~NoBrain77",
                "avatar_url": "https://storage.googleapis.com/plotly-prod-profiles/81.jpg",
                "background_url": "https://storage.googleapis.com/plotly-prod-profiles/bg-3.jpg",
                "bio": "",
                "nickname": "",
                "website": "",
                "stream_tokens": null,
                "feature_set_id": null,
                "csrf_token": null,
                "date_joined": "2024-03-23 19:20:39",
                "mapbox_access_tokens": null,
                "has_password": null,
                "username": "NoBrain77",
                "email": null,
                "is_active": null,
                "readonly": null,
                "is_dash_creator": null,
                "dash_created_count": null,
                "is_chart_creator": null,
                "charts_created_count": null
            }
        },
        {
            "creation_time": "2024-03-23T18:35:11.243183Z",
            "comments": {
                "results": [],
                "count": 0
            },
            "parented": true,
            "embed_url": "https://chart-studio.plotly.com/~jwolf083/80.embed",
            "fid": "jwolf083:80",
            "filename": "CUBIC - Large",
            "filetype": "plot",
            "img_url": "https://storage.googleapis.com/plotly-prod-images/jwolf083/80/9_TFNC451WZZ5IVCQACVFDG44JHNOE2X.png",
            "image_urls": {
                "default": "https://storage.googleapis.com/plotly-prod-images/jwolf083/80/2_QY66NKXA1VY3Y2I2PV3VMS0LBP45BV.png",
                "block-thumb": "https://storage.googleapis.com/plotly-prod-images/jwolf083/80/8_O6SMS9SLG8N48KRW6SXIH59KB3GC29.png",
                "list-thumb": "https://storage.googleapis.com/plotly-prod-images/jwolf083/80/9_TFNC451WZZ5IVCQACVFDG44JHNOE2X.png"
            },
            "api_urls": {
                "files": "https://api.plotly.com/v2/files/jwolf083:80",
                "plots": "https://api.plotly.com/v2/plots/jwolf083:80",
                "parent": "https://api.plotly.com/v2/folders/home?user=jwolf083"
            },
            "owner": "jwolf083",
            "parent": -1,
            "preview": "",
            "referencers": [],
            "references": [],
            "title": "",
            "views": 2,
            "web_url": "https://chart-studio.plotly.com/~jwolf083/80/",
            "world_readable": true,
            "date_modified": "2024-03-23T18:35:11.256Z",
            "stars": {
                "results": [],
                "count": 0
            },
            "collaborators": {
                "results": [],
                "count": 0
            },
            "subfolder_count": null,
            "refresh_interval": null,
            "organize_view_url": "https://chart-studio.plotly.com/~jwolf083/80/",
            "current_user_permission": "read",
            "is_theme": null,
            "is_template": false,
            "autosize": true,
            "caption": "",
            "figure": {
                "data": [
                    {
                        "uid": "fd4f4f",
                        "line": {
                            "color": "rgb(50, 209, 76)",
                            "width": 2
                        },
                        "meta": {
                            "columnNames": {
                                "x": "Time",
                                "y": "SRTT",
                                "marker": {
                                    "color": "Y"
                                }
                            }
                        },
                        "mode": "lines",
                        "name": "SRTT",
                        "type": "scatter",
                        "xsrc": "jwolf083:70:bfa1ed",
                        "ysrc": "jwolf083:70:8af44d",
                        "yaxis": "y2",
                        "marker": {
                            "meta": {
                                "columnNames": {
                                    "color": "SSThresh"
                                }
                            },
                            "cauto": true,
                            "colorsrc": "jwolf083:70:069790",
                            "colorscale": [
                                [
                                    0,
                                    "#4c78a8"
                                ],
                                [
                                    0.1111111111111111,
                                    "#f58518"
                                ],
                                [
                                    0.2222222222222222,
                                    "#e45756"
                                ],
                                [
                                    0.3333333333333333,
                                    "#72b7b2"
                                ],
                                [
                                    0.4444444444444444,
                                    "#54a24b"
                                ],
                                [
                                    0.5555555555555556,
                                    "#eeca3b"
                                ],
                                [
                                    0.6666666666666666,
                                    "#b279a2"
                                ],
                                [
                                    0.7777777777777778,
                                    "#ff9da6"
                                ],
                                [
                                    0.8888888888888888,
                                    "#9d755d"
                                ],
                                [
                                    1,
                                    "#bab0ac"
                                ]
                            ],
                            "reversescale": false
                        },
                        "transforms": [
                            {
                                "meta": {
                                    "columnNames": {
                                        "target": "SSThresh"
                                    }
                                },
                                "type": "filter",
                                "value": [
                                    "-1",
                                    "50000"
                                ],
                                "enabled": true,
                                "operation": "[]",
                                "targetsrc": "jwolf083:70:069790"
                            }
                        ],
                        "connectgaps": false,
                        "autocolorscale": false
                    },
                    {
                        "line": {
                            "color": "rgb(31, 119, 180)"
                        },
                        "meta": {
                            "columnNames": {
                                "x": "Time",
                                "y": "CWND"
                            }
                        },
                        "mode": "lines",
                        "name": "CWND",
                        "type": "scatter",
                        "xsrc": "jwolf083:70:bfa1ed",
                        "ysrc": "jwolf083:70:644013",
                        "xaxis": "x",
                        "stackgroup": null
                    }
                ],
                "frames": [],
                "layout": {
                    "scene": {
                        "aspectmode": "auto",
                        "aspectratio": {
                            "x": 1,
                            "y": 1,
                            "z": 1
                        }
                    },
                    "title": {
                        "text": "CUBIC - Round trip time increases with Congestion Window as buffer fills up"
                    },
                    "xaxis": {
                        "side": "bottom",
                        "type": "linear",
                        "range": [
                            0,
                            40.000137
                        ],
                        "title": {
                            "text": "Time (Seconds)"
                        },
                        "mirror": "ticks",
                        "showline": true,
                        "tickmode": "linear",
                        "autorange": true,
                        "gridwidth": 2,
                        "tickformat": "",
                        "zerolinewidth": 4
                    },
                    "yaxis": {
                        "side": "left",
                        "type": "linear",
                        "dtick": 10,
                        "range": [
                            -400.38888888888897,
                            7807.388888888889
                        ],
                        "title": {
                            "text": "Window Size (Segments)"
                        },
                        "mirror": "ticks",
                        "showline": true,
                        "tickmode": "auto",
                        "zeroline": false,
                        "autorange": true,
                        "gridwidth": 2,
                        "zerolinewidth": 5
                    },
                    "images": [],
                    "shapes": [],
                    "yaxis2": {
                        "side": "right",
                        "type": "linear",
                        "range": [
                            0,
                            14479792
                        ],
                        "title": {
                            "text": "Time (Microseconds)"
                        },
                        "autorange": false,
                        "overlaying": "y"
                    },
                    "autosize": true,
                    "annotations": []
                }
            },
            "height": null,
            "width": null,
            "user": {
                "profile_url": "https://chart-studio.plotly.com/~jwolf083",
                "avatar_url": "https://storage.googleapis.com/plotly-prod-profiles/27.jpg",
                "background_url": "https://storage.googleapis.com/plotly-prod-profiles/bg-8.jpg",
                "bio": "",
                "nickname": "",
                "website": "",
                "stream_tokens": null,
                "feature_set_id": null,
                "csrf_token": null,
                "date_joined": "2021-04-13 01:49:19",
                "mapbox_access_tokens": null,
                "has_password": null,
                "username": "jwolf083",
                "email": null,
                "is_active": null,
                "readonly": null,
                "is_dash_creator": null,
                "dash_created_count": null,
                "is_chart_creator": null,
                "charts_created_count": null
            }
        }
    ]
}