Plots List
Plots
This endpoint handles manipulation of Plotly plot files.
Reference
Authorization
Any user with or without a Plotly account may view public plots. For private plots, see authentication.
Actions
list
Listing all public plots can be done via a GET request to this endpoint.
By default, plots will be listed in order of date created. The order_by
query parameter is accepted at this endpoint. Currently, only ordering by
views is supported. It is possible to filter the plots by quality
with min_quality or max_quality as query parameter.
Example:
// GET https://api.plotly.com/v2/plots/ ---> 200

// GET https://api.plotly.com/v2/plots/?order_by=-views ---> 200

// GET https://api.plotly.com/v2/plots/?min_quality=5 ---> 200

// GET https://api.plotly.com/v2/plots/?max_quality=5 ---> 200
feed
Listing all handpicked feed plots can be done via a GET request to this endpoint. By default, plots will be listed in a random order.
Example:
// GET https://api.plotly.com/v2/plots/feed ---> 200
create
You can create new plot resources here. The only required field is 'figure'. Currently, the figure is restricted to only contain references to grid data. That is, this will fail if raw data arrays are passed in. To create and manipulate underlying grids for plots, see the grids endpoint.
Example:
// This fails because a figure field is required.
// POST https://api.plotly.com/v2/plots ---> 400 Bad Request
{}

// This fails because the figure has raw data
//POST https://api.plotly.com/v2/plots ---> 400 Bad Request
{
    "figure": {"data": [{"y": ['this', 'is', 'raw', 'data']}]}
}

// This succeeds because the figure has src keys, not raw data.
//POST https://api.plotly.com/v2/plots ---> 200 OK
{
    "figure": {"data": [{"ysrc": "sven:88:u8nd62"}]}
}
When creating a grid, you can optionally specify a source_fid to specify where a plot has come from:
- source_fid: the fid of a plot that was copied (and presumably edited) to produce this one
detail
There is a lot of meta information stored about plot files including filename, title, share_url, and content_url to name a few.
This information can only be reached with a GET to this endpoint.
Example:
// GET https://api.plotly.com/v2/plots/iheartgraphs:90
content
The contents of a plot can be downloaded via the content resource. The plot
content contains referenced grid/column data by default. If you wish to
return the raw grid/column data, the inline_data=true query must be included
in the request url. The Content-Type header will be appropriately set for the
response body.
Alternatively, you can set ?map_data=unreadable to append a mapping of
sources to data that belongs to grids which are unreadable for the
requestor. This is useful when you have read access to another users plot,
but that plot contains grid references which you don't have access to.
Examples:
// Returns referenced grid/column data
// GET https://api.plotly.com/v2/plots/iheartgraphs:90/content ---> 200 OK

// Returns full grid/column data
// GET https://api.plotly.com/v2/plots/iheartgraphs:90/content?inline_data=true ---> 200 OK

// Returns full grid/column data when requestor doesn't have permission
// to read the referenced grid.
// GET https://api.plotly.com/v2/plots/iheartgraphs:90/content?map_data=unreadable ---> 200 OK
GET /v2/plots?cursor=cD0yMDI0LTAzLTIyKzEwJTNBMjQlM0E0Ny40MTYxNjIlMkIwMCUzQTAw&format=api
{ "next": "https://api.plot.ly/v2/plots?cursor=cD0yMDI0LTAzLTIyKzA5JTNBMDYlM0EyMS4xODY2NDAlMkIwMCUzQTAw&format=api", "previous": "https://api.plot.ly/v2/plots?cursor=cj0xJnA9MjAyNC0wMy0yMisxMCUzQTE4JTNBMjEuNzcxNTQ0JTJCMDAlM0EwMA%3D%3D&format=api", "results": [ { "creation_time": "2024-03-22T10:18:21.771544Z", "comments": { "results": [], "count": 0 }, "parented": true, "embed_url": "https://chart-studio.plotly.com/~researchkarthi/810.embed", "fid": "researchkarthi:810", "filename": "Plot 810", "filetype": "plot", "img_url": "https://storage.googleapis.com/plotly-prod-images/researchkarthi/810/9_O38G8UZDCOWZ01FLENLQ5QX50J4WH4.png", "image_urls": { "default": "https://storage.googleapis.com/plotly-prod-images/researchkarthi/810/2_A2H0J890IR9I2I48MRM6PNV55R7KZU.png", "block-thumb": "https://storage.googleapis.com/plotly-prod-images/researchkarthi/810/8_GJIP2F1MWZROSS0VB1JD3S42F0E1KE.png", "list-thumb": "https://storage.googleapis.com/plotly-prod-images/researchkarthi/810/9_O38G8UZDCOWZ01FLENLQ5QX50J4WH4.png" }, "api_urls": { "files": "https://api.plotly.com/v2/files/researchkarthi:810", "plots": "https://api.plotly.com/v2/plots/researchkarthi:810", "parent": "https://api.plotly.com/v2/folders/home?user=researchkarthi" }, "owner": "researchkarthi", "parent": -1, "preview": "", "referencers": [], "references": [], "title": "", "views": 4, "web_url": "https://chart-studio.plotly.com/~researchkarthi/810/", "world_readable": true, "date_modified": "2024-07-03T09:22:11.487Z", "stars": { "results": [], "count": 0 }, "collaborators": { "results": [], "count": 0 }, "subfolder_count": null, "refresh_interval": null, "organize_view_url": "https://chart-studio.plotly.com/~researchkarthi/810/", "current_user_permission": "read", "is_theme": null, "is_template": false, "autosize": true, "caption": "", "figure": { "data": [ { "meta": { "columnNames": { "x": "A", "y": "B" } }, "mode": "markers", "name": "<b>Neighbour discovery, k-hop</b>", "type": "bar", "xsrc": "researchkarthi:809:96d231", "ysrc": "researchkarthi:809:874be6", "marker": { "color": "rgb(64, 203, 41)" }, "orientation": "v" }, { "meta": { "columnNames": { "x": "A", "y": "C" } }, "name": "<b>CRAV-NET</b>", "type": "bar", "xsrc": "researchkarthi:809:96d231", "ysrc": "researchkarthi:809:db6c0f", "marker": { "color": "rgb(200, 21, 21)" }, "orientation": "v" }, { "meta": { "columnNames": { "x": "A", "y": "D" } }, "name": "<b>Proposed</b>", "type": "bar", "xsrc": "researchkarthi:809:96d231", "ysrc": "researchkarthi:809:333ea5", "marker": { "color": "rgb(17, 23, 152)" }, "orientation": "v" }, { "type": "bar", "orientation": "v" } ], "frames": [], "layout": { "xaxis": { "type": "linear", "range": [ 2.5, 52.5 ], "title": { "font": { "size": 24, "family": "Times New Roman" }, "text": "<b>Number of Vehicle Users</b>" }, "autorange": true }, "yaxis": { "type": "linear", "range": [ 0, 101.05263157894737 ], "title": { "font": { "size": 24, "family": "Times New Roman" }, "text": "<b>Number of Alive Nodes (%)</b>" }, "autorange": true }, "legend": { "x": 0.22609579100145133, "y": 1.0765027322404372 }, "autosize": true, "template": { "data": { "bar": [ { "type": "bar", "marker": { "colorbar": { "ticks": "", "outlinewidth": 0 } } } ], "table": [ { "type": "table", "cells": { "fill": { "color": "#EBF0F8" }, "line": { "color": "white" } }, "header": { "fill": { "color": "#C8D4E3" }, "line": { "color": "white" } } } ], "carpet": [ { "type": "carpet", "aaxis": { "gridcolor": "#C8D4E3", "linecolor": "#C8D4E3", "endlinecolor": "#2a3f5f", "minorgridcolor": "#C8D4E3", "startlinecolor": "#2a3f5f" }, "baxis": { "gridcolor": "#C8D4E3", "linecolor": "#C8D4E3", "endlinecolor": "#2a3f5f", "minorgridcolor": "#C8D4E3", "startlinecolor": "#2a3f5f" } } ], "mesh3d": [ { "type": "mesh3d", "colorbar": { "ticks": "", "outlinewidth": 0 } } ], "contour": [ { "type": "contour", "colorbar": { "ticks": "", "outlinewidth": 0 }, "autocolorscale": true } ], "heatmap": [ { "type": "heatmap", "colorbar": { "ticks": "", "outlinewidth": 0 }, "autocolorscale": true } ], "scatter": [ { "type": "scatter", "marker": { "colorbar": { "ticks": "", "outlinewidth": 0 } } } ], "surface": [ { "type": "surface", "colorbar": { "ticks": "", "outlinewidth": 0 } } ], "heatmapgl": [ { "type": "heatmapgl", "colorbar": { "ticks": "", "outlinewidth": 0 } } ], "histogram": [ { "type": "histogram", "marker": { "colorbar": { "ticks": "", "outlinewidth": 0 } } } ], "parcoords": [ { "line": { "colorbar": { "ticks": "", "outlinewidth": 0 } }, "type": "parcoords" } ], "scatter3d": [ { "type": "scatter3d", "marker": { "colorbar": { "ticks": "", "outlinewidth": 0 } } } ], "scattergl": [ { "type": "scattergl", "marker": { "colorbar": { "ticks": "", "outlinewidth": 0 } } } ], "choropleth": [ { "type": "choropleth", "colorbar": { "ticks": "", "outlinewidth": 0 } } ], "scattergeo": [ { "type": "scattergeo", "marker": { "colorbar": { "ticks": "", "outlinewidth": 0 } } } ], "histogram2d": [ { "type": "histogram2d", "colorbar": { "ticks": "", "outlinewidth": 0 }, "autocolorscale": true } ], "scatterpolar": [ { "type": "scatterpolar", "marker": { "colorbar": { "ticks": "", "outlinewidth": 0 } } } ], "contourcarpet": [ { "type": "contourcarpet", "colorbar": { "ticks": "", "outlinewidth": 0 } } ], "scattercarpet": [ { "type": "scattercarpet", "marker": { "colorbar": { "ticks": "", "outlinewidth": 0 } } } ], "scattermapbox": [ { "type": "scattermapbox", "marker": { "colorbar": { "ticks": "", "outlinewidth": 0 } } } ], "scatterpolargl": [ { "type": "scatterpolargl", "marker": { "colorbar": { "ticks": "", "outlinewidth": 0 } } } ], "scatterternary": [ { "type": "scatterternary", "marker": { "colorbar": { "ticks": "", "outlinewidth": 0 } } } ], "histogram2dcontour": [ { "type": "histogram2dcontour", "colorbar": { "ticks": "", "outlinewidth": 0 }, "autocolorscale": true } ] }, "layout": { "geo": { "bgcolor": "white", "showland": true, "lakecolor": "white", "landcolor": "white", "showlakes": true, "subunitcolor": "#C8D4E3" }, "font": { "color": "#2a3f5f" }, "polar": { "bgcolor": "white", "radialaxis": { "ticks": "", "gridcolor": "#EBF0F8", "linecolor": "#EBF0F8" }, "angularaxis": { "ticks": "", "gridcolor": "#EBF0F8", "linecolor": "#EBF0F8" } }, "scene": { "xaxis": { "ticks": "", "gridcolor": "#DFE8F3", "gridwidth": 2, "linecolor": "#EBF0F8", "zerolinecolor": "#EBF0F8", "showbackground": true, "backgroundcolor": "white" }, "yaxis": { "ticks": "", "gridcolor": "#DFE8F3", "gridwidth": 2, "linecolor": "#EBF0F8", "zerolinecolor": "#EBF0F8", "showbackground": true, "backgroundcolor": "white" }, "zaxis": { "ticks": "", "gridcolor": "#DFE8F3", "gridwidth": 2, "linecolor": "#EBF0F8", "zerolinecolor": "#EBF0F8", "showbackground": true, "backgroundcolor": "white" } }, "title": { "x": 0.05 }, "xaxis": { "ticks": "", "gridcolor": "#EBF0F8", "linecolor": "#EBF0F8", "automargin": true, "zerolinecolor": "#EBF0F8", "zerolinewidth": 2 }, "yaxis": { "ticks": "", "gridcolor": "#EBF0F8", "linecolor": "#EBF0F8", "automargin": true, "zerolinecolor": "#EBF0F8", "zerolinewidth": 2 }, "ternary": { "aaxis": { "ticks": "", "gridcolor": "#DFE8F3", "linecolor": "#A2B1C6" }, "baxis": { "ticks": "", "gridcolor": "#DFE8F3", "linecolor": "#A2B1C6" }, "caxis": { "ticks": "", "gridcolor": "#DFE8F3", "linecolor": "#A2B1C6" }, "bgcolor": "white" }, "colorway": [ "#636efa", "#EF553B", "#00cc96", "#ab63fa", "#19d3f3", "#e763fa", "#fecb52", "#ffa15a", "#ff6692", "#b6e880" ], "hovermode": "closest", "colorscale": { "diverging": [ [ 0, "#8e0152" ], [ 0.1, "#c51b7d" ], [ 0.2, "#de77ae" ], [ 0.3, "#f1b6da" ], [ 0.4, "#fde0ef" ], [ 0.5, "#f7f7f7" ], [ 0.6, "#e6f5d0" ], [ 0.7, "#b8e186" ], [ 0.8, "#7fbc41" ], [ 0.9, "#4d9221" ], [ 1, "#276419" ] ], "sequential": [ [ 0, "#0508b8" ], [ 0.0893854748603352, "#1910d8" ], [ 0.1787709497206704, "#3c19f0" ], [ 0.2681564245810056, "#6b1cfb" ], [ 0.3575418994413408, "#981cfd" ], [ 0.44692737430167595, "#bf1cfd" ], [ 0.5363128491620112, "#dd2bfd" ], [ 0.6256983240223464, "#f246fe" ], [ 0.7150837988826816, "#fc67fd" ], [ 0.8044692737430168, "#fe88fc" ], [ 0.8938547486033519, "#fea5fd" ], [ 0.9832402234636871, "#febefe" ], [ 1, "#fec3fe" ] ], "sequentialminus": [ [ 0, "#0508b8" ], [ 0.0893854748603352, "#1910d8" ], [ 0.1787709497206704, "#3c19f0" ], [ 0.2681564245810056, "#6b1cfb" ], [ 0.3575418994413408, "#981cfd" ], [ 0.44692737430167595, "#bf1cfd" ], [ 0.5363128491620112, "#dd2bfd" ], [ 0.6256983240223464, "#f246fe" ], [ 0.7150837988826816, "#fc67fd" ], [ 0.8044692737430168, "#fe88fc" ], [ 0.8938547486033519, "#fea5fd" ], [ 0.9832402234636871, "#febefe" ], [ 1, "#fec3fe" ] ] }, "plot_bgcolor": "white", "paper_bgcolor": "white", "shapedefaults": { "line": { "width": 0 }, "opacity": 0.4, "fillcolor": "#506784" }, "annotationdefaults": { "arrowhead": 0, "arrowcolor": "#506784", "arrowwidth": 1 } }, "themeRef": "PLOTLY_WHITE" } } }, "height": null, "width": null, "user": { "profile_url": "https://chart-studio.plotly.com/~researchkarthi", "avatar_url": "https://storage.googleapis.com/plotly-prod-profiles/12.jpg", "background_url": "https://storage.googleapis.com/plotly-prod-profiles/bg-2.jpg", "bio": "", "nickname": "", "website": "", "stream_tokens": null, "feature_set_id": null, "csrf_token": null, "date_joined": "2023-07-19 04:36:34", "mapbox_access_tokens": null, "has_password": null, "username": "researchkarthi", "email": null, "is_active": null, "readonly": null, "is_dash_creator": null, "dash_created_count": null, "is_chart_creator": null, "charts_created_count": null } }, { "creation_time": "2024-03-22T10:17:49.527217Z", "comments": { "results": [], "count": 0 }, "parented": true, "embed_url": "https://chart-studio.plotly.com/~ydarhi/1003.embed", "fid": "ydarhi:1003", "filename": "Plot 1003", "filetype": "plot", "img_url": "https://storage.googleapis.com/plotly-prod-images/ydarhi/1003/9_CKZOEVJXL0XHES6GGRR8PDBU90Z9Y6.png", "image_urls": { "default": "https://storage.googleapis.com/plotly-prod-images/ydarhi/1003/2_8Y5Q01NY5Q1EXUU0DZJEMZL7XKQ3PW.png", "block-thumb": "https://storage.googleapis.com/plotly-prod-images/ydarhi/1003/8_XJ1G0DN50NQ2D0YZGCNGW93I19TUTJ.png", "list-thumb": "https://storage.googleapis.com/plotly-prod-images/ydarhi/1003/9_CKZOEVJXL0XHES6GGRR8PDBU90Z9Y6.png" }, "api_urls": { "files": "https://api.plotly.com/v2/files/ydarhi:1003", "plots": "https://api.plotly.com/v2/plots/ydarhi:1003", "parent": "https://api.plotly.com/v2/folders/home?user=ydarhi" }, "owner": "ydarhi", "parent": -1, "preview": "", "referencers": [], "references": [], "title": "", "views": 3, "web_url": "https://chart-studio.plotly.com/~ydarhi/1003/", "world_readable": true, "date_modified": "2024-03-22T10:17:49.573Z", "stars": { "results": [], "count": 0 }, "collaborators": { "results": [], "count": 0 }, "subfolder_count": null, "refresh_interval": null, "organize_view_url": "https://chart-studio.plotly.com/~ydarhi/1003/", "current_user_permission": "read", "is_theme": null, "is_template": null, "autosize": true, "caption": "", "figure": { "data": [ { "link": { "colorsrc": "ydarhi:1002:64e8c3", "valuesrc": "ydarhi:1002:9e8471", "sourcesrc": "ydarhi:1002:aa05a3", "targetsrc": "ydarhi:1002:bc08a1" }, "node": { "pad": 10, "line": { "color": "white", "width": 0.0 }, "colorsrc": "ydarhi:1002:33a4d2", "labelsrc": "ydarhi:1002:2fa4cd", "thickness": 20 }, "type": "sankey" } ], "layout": { "font": { "size": 10, "color": "white" }, "title": "", "plot_bgcolor": "rgba(250, 243, 235, 1)", "paper_bgcolor": "rgba(250, 243, 235, 1)" } }, "height": null, "width": null, "user": { "profile_url": "https://chart-studio.plotly.com/~ydarhi", "avatar_url": "https://storage.googleapis.com/plotly-prod-profiles/75.jpg", "background_url": "https://storage.googleapis.com/plotly-prod-profiles/bg-1.jpg", "bio": "", "nickname": "", "website": "", "stream_tokens": null, "feature_set_id": null, "csrf_token": null, "date_joined": "2019-01-28 23:33:04", "mapbox_access_tokens": null, "has_password": null, "username": "ydarhi", "email": null, "is_active": null, "readonly": null, "is_dash_creator": null, "dash_created_count": null, "is_chart_creator": null, "charts_created_count": null } }, { "creation_time": "2024-03-22T10:15:10.398308Z", "comments": { "results": [], "count": 0 }, "parented": true, "embed_url": "https://chart-studio.plotly.com/~sugandh.sai/6.embed", "fid": "sugandh.sai:6", "filename": "x2", "filetype": "plot", "img_url": "https://storage.googleapis.com/plotly-prod-images/sugandh.sai/6/9_Y0RXMW4I31389GB3V2FEASYGU57RBA.png", "image_urls": { "default": "https://storage.googleapis.com/plotly-prod-images/sugandh.sai/6/2_X9Y4U97XP7GDN65EVO2OZINB060108.png", "block-thumb": "https://storage.googleapis.com/plotly-prod-images/sugandh.sai/6/8_AWWEBMXM430QZF030V8O3X2DCXL01X.png", "list-thumb": "https://storage.googleapis.com/plotly-prod-images/sugandh.sai/6/9_Y0RXMW4I31389GB3V2FEASYGU57RBA.png" }, "api_urls": { "files": "https://api.plotly.com/v2/files/sugandh.sai:6", "plots": "https://api.plotly.com/v2/plots/sugandh.sai:6", "parent": "https://api.plotly.com/v2/folders/home?user=sugandh.sai" }, "owner": "sugandh.sai", "parent": -1, "preview": "", "referencers": [], "references": [], "title": "", "views": 1, "web_url": "https://chart-studio.plotly.com/~sugandh.sai/6/", "world_readable": true, "date_modified": "2024-03-22T10:23:46.828Z", "stars": { "results": [], "count": 0 }, "collaborators": { "results": [], "count": 0 }, "subfolder_count": null, "refresh_interval": null, "organize_view_url": "https://chart-studio.plotly.com/~sugandh.sai/6/", "current_user_permission": "read", "is_theme": null, "is_template": null, "autosize": true, "caption": "", "figure": { "data": [ { "type": "line", "xsrc": "sugandh.sai:7:a8d824", "ysrc": "sugandh.sai:7:23536c" } ], "layout": {} }, "height": null, "width": null, "user": { "profile_url": "https://chart-studio.plotly.com/~sugandh.sai", "avatar_url": "https://storage.googleapis.com/plotly-prod-profiles/88.jpg", "background_url": "https://storage.googleapis.com/plotly-prod-profiles/bg-9.jpg", "bio": "", "nickname": "", "website": "", "stream_tokens": null, "feature_set_id": null, "csrf_token": null, "date_joined": "2024-03-21 13:23:19", "mapbox_access_tokens": null, "has_password": null, "username": "sugandh.sai", "email": null, "is_active": null, "readonly": null, "is_dash_creator": null, "dash_created_count": null, "is_chart_creator": null, "charts_created_count": null } }, { "creation_time": "2024-03-22T10:15:02.365161Z", "comments": { "results": [], "count": 0 }, "parented": true, "embed_url": "https://chart-studio.plotly.com/~sugandh.sai/4.embed", "fid": "sugandh.sai:4", "filename": "x0", "filetype": "plot", "img_url": "https://storage.googleapis.com/plotly-prod-images/sugandh.sai/4/9_GE56IBKDYUJ62IPLC72W7XJ067HWCZ.png", "image_urls": { "default": "https://storage.googleapis.com/plotly-prod-images/sugandh.sai/4/2_3ZWXSZJ5H0XFRCQ6XDM8AGW05HVVPI.png", "block-thumb": "https://storage.googleapis.com/plotly-prod-images/sugandh.sai/4/8_NBDLLB10PQPJEMALCC11IMV1OJFBNP.png", "list-thumb": "https://storage.googleapis.com/plotly-prod-images/sugandh.sai/4/9_GE56IBKDYUJ62IPLC72W7XJ067HWCZ.png" }, "api_urls": { "files": "https://api.plotly.com/v2/files/sugandh.sai:4", "plots": "https://api.plotly.com/v2/plots/sugandh.sai:4", "parent": "https://api.plotly.com/v2/folders/home?user=sugandh.sai" }, "owner": "sugandh.sai", "parent": -1, "preview": "", "referencers": [], "references": [], "title": "", "views": 3, "web_url": "https://chart-studio.plotly.com/~sugandh.sai/4/", "world_readable": true, "date_modified": "2024-03-22T10:23:56.203Z", "stars": { "results": [], "count": 0 }, "collaborators": { "results": [], "count": 0 }, "subfolder_count": null, "refresh_interval": null, "organize_view_url": "https://chart-studio.plotly.com/~sugandh.sai/4/", "current_user_permission": "read", "is_theme": null, "is_template": null, "autosize": true, "caption": "", "figure": { "data": [ { "type": "line", "xsrc": "sugandh.sai:5:6fb772", "ysrc": "sugandh.sai:5:a21681" } ], "layout": {} }, "height": null, "width": null, "user": { "profile_url": "https://chart-studio.plotly.com/~sugandh.sai", "avatar_url": "https://storage.googleapis.com/plotly-prod-profiles/88.jpg", "background_url": "https://storage.googleapis.com/plotly-prod-profiles/bg-9.jpg", "bio": "", "nickname": "", "website": "", "stream_tokens": null, "feature_set_id": null, "csrf_token": null, "date_joined": "2024-03-21 13:23:19", "mapbox_access_tokens": null, "has_password": null, "username": "sugandh.sai", "email": null, "is_active": null, "readonly": null, "is_dash_creator": null, "dash_created_count": null, "is_chart_creator": null, "charts_created_count": null } }, { "creation_time": "2024-03-22T10:06:00.763441Z", "comments": { "results": [], "count": 0 }, "parented": true, "embed_url": "https://chart-studio.plotly.com/~libertihub/7.embed", "fid": "libertihub:7", "filename": "3d-iris-svr", "filetype": "plot", "img_url": "https://storage.googleapis.com/plotly-prod-images/libertihub/7/9_TIRD9HRLIXS796RAAYWG1P2HI69XVJ.png", "image_urls": { "default": "https://storage.googleapis.com/plotly-prod-images/libertihub/7/2_Z3TWCZOJRL33R4FGUQYCNRN86FTVLD.png", "block-thumb": "https://storage.googleapis.com/plotly-prod-images/libertihub/7/8_OESQMQODBAV42QKSY13RACPDHTE2CS.png", "list-thumb": "https://storage.googleapis.com/plotly-prod-images/libertihub/7/9_TIRD9HRLIXS796RAAYWG1P2HI69XVJ.png" }, "api_urls": { "files": "https://api.plotly.com/v2/files/libertihub:7", "plots": "https://api.plotly.com/v2/plots/libertihub:7", "parent": "https://api.plotly.com/v2/folders/home?user=libertihub" }, "owner": "libertihub", "parent": -1, "preview": "", "referencers": [], "references": [], "title": "", "views": 6, "web_url": "https://chart-studio.plotly.com/~libertihub/7/", "world_readable": true, "date_modified": "2024-03-22T17:31:57.145Z", "stars": { "results": [], "count": 0 }, "collaborators": { "results": [], "count": 0 }, "subfolder_count": null, "refresh_interval": null, "organize_view_url": "https://chart-studio.plotly.com/~libertihub/7/", "current_user_permission": "read", "is_theme": null, "is_template": null, "autosize": true, "caption": "", "figure": { "data": [ { "mode": "markers", "name": "", "type": "scatter3d", "xsrc": "libertihub:6:35c1ed", "ysrc": "libertihub:6:365c68", "zsrc": "libertihub:6:d8cdc1", "scene": "scene", "marker": { "size": 5, "color": "#636efa", "symbol": "circle" }, "showlegend": false, "legendgroup": "", "hovertemplate": "sepal_width=%{x}<br>sepal_length=%{y}<br>petal_width=%{z}<extra></extra>" }, { "name": "pred_surface", "type": "surface", "xsrc": "libertihub:6:20dfaf", "ysrc": "libertihub:6:7c99eb", "zsrc": "libertihub:6:4f119a" } ], "layout": { "scene": { "xaxis": { "title": { "text": "sepal_width" } }, "yaxis": { "title": { "text": "sepal_length" } }, "zaxis": { "title": { "text": "petal_width" } }, "domain": { "x": [ 0.0, 1.0 ], "y": [ 0.0, 1.0 ] } }, "legend": { "tracegroupgap": 0 }, "margin": { "t": 60 }, "template": { "data": { "bar": [ { "type": "bar", "marker": { "line": { "color": "#E5ECF6", "width": 0.5 }, "pattern": { "size": 10, "fillmode": "overlay", "solidity": 0.2 } }, "error_x": { "color": "#2a3f5f" }, "error_y": { "color": "#2a3f5f" } } ], "pie": [ { "type": "pie", "automargin": true } ], "table": [ { "type": "table", "cells": { "fill": { "color": "#EBF0F8" }, "line": { "color": "white" } }, "header": { "fill": { "color": "#C8D4E3" }, "line": { "color": "white" } } } ], "carpet": [ { "type": "carpet", "aaxis": { "gridcolor": "white", "linecolor": "white", "endlinecolor": "#2a3f5f", "minorgridcolor": "white", "startlinecolor": "#2a3f5f" }, "baxis": { "gridcolor": "white", "linecolor": "white", "endlinecolor": "#2a3f5f", "minorgridcolor": "white", "startlinecolor": "#2a3f5f" } } ], "mesh3d": [ { "type": "mesh3d", "colorbar": { "ticks": "", "outlinewidth": 0 } } ], "contour": [ { "type": "contour", "colorbar": { "ticks": "", "outlinewidth": 0 }, "colorscale": [ [ 0.0, "#0d0887" ], [ 0.1111111111111111, "#46039f" ], [ 0.2222222222222222, "#7201a8" ], [ 0.3333333333333333, "#9c179e" ], [ 0.4444444444444444, "#bd3786" ], [ 0.5555555555555556, "#d8576b" ], [ 0.6666666666666666, "#ed7953" ], [ 0.7777777777777778, "#fb9f3a" ], [ 0.8888888888888888, "#fdca26" ], [ 1.0, "#f0f921" ] ] } ], "heatmap": [ { "type": "heatmap", "colorbar": { "ticks": "", "outlinewidth": 0 }, "colorscale": [ [ 0.0, "#0d0887" ], [ 0.1111111111111111, "#46039f" ], [ 0.2222222222222222, "#7201a8" ], [ 0.3333333333333333, "#9c179e" ], [ 0.4444444444444444, "#bd3786" ], [ 0.5555555555555556, "#d8576b" ], [ 0.6666666666666666, "#ed7953" ], [ 0.7777777777777778, "#fb9f3a" ], [ 0.8888888888888888, "#fdca26" ], [ 1.0, "#f0f921" ] ] } ], "scatter": [ { "type": "scatter", "fillpattern": { "size": 10, "fillmode": "overlay", "solidity": 0.2 } } ], "surface": [ { "type": "surface", "colorbar": { "ticks": "", "outlinewidth": 0 }, "colorscale": [ [ 0.0, "#0d0887" ], [ 0.1111111111111111, "#46039f" ], [ 0.2222222222222222, "#7201a8" ], [ 0.3333333333333333, "#9c179e" ], [ 0.4444444444444444, "#bd3786" ], [ 0.5555555555555556, "#d8576b" ], [ 0.6666666666666666, "#ed7953" ], [ 0.7777777777777778, "#fb9f3a" ], [ 0.8888888888888888, "#fdca26" ], [ 1.0, "#f0f921" ] ] } ], "barpolar": [ { "type": "barpolar", "marker": { "line": { "color": "#E5ECF6", "width": 0.5 }, "pattern": { "size": 10, "fillmode": "overlay", "solidity": 0.2 } } } ], "heatmapgl": [ { "type": "heatmapgl", "colorbar": { "ticks": "", "outlinewidth": 0 }, "colorscale": [ [ 0.0, "#0d0887" ], [ 0.1111111111111111, "#46039f" ], [ 0.2222222222222222, "#7201a8" ], [ 0.3333333333333333, "#9c179e" ], [ 0.4444444444444444, "#bd3786" ], [ 0.5555555555555556, "#d8576b" ], [ 0.6666666666666666, "#ed7953" ], [ 0.7777777777777778, "#fb9f3a" ], [ 0.8888888888888888, "#fdca26" ], [ 1.0, "#f0f921" ] ] } ], "histogram": [ { "type": "histogram", "marker": { "pattern": { "size": 10, "fillmode": "overlay", "solidity": 0.2 } } } ], "parcoords": [ { "line": { "colorbar": { "ticks": "", "outlinewidth": 0 } }, "type": "parcoords" } ], "scatter3d": [ { "line": { "colorbar": { "ticks": "", "outlinewidth": 0 } }, "type": "scatter3d", "marker": { "colorbar": { "ticks": "", "outlinewidth": 0 } } } ], "scattergl": [ { "type": "scattergl", "marker": { "colorbar": { "ticks": "", "outlinewidth": 0 } } } ], "choropleth": [ { "type": "choropleth", "colorbar": { "ticks": "", "outlinewidth": 0 } } ], "scattergeo": [ { "type": "scattergeo", "marker": { "colorbar": { "ticks": "", "outlinewidth": 0 } } } ], "histogram2d": [ { "type": "histogram2d", "colorbar": { "ticks": "", "outlinewidth": 0 }, "colorscale": [ [ 0.0, "#0d0887" ], [ 0.1111111111111111, "#46039f" ], [ 0.2222222222222222, "#7201a8" ], [ 0.3333333333333333, "#9c179e" ], [ 0.4444444444444444, "#bd3786" ], [ 0.5555555555555556, "#d8576b" ], [ 0.6666666666666666, "#ed7953" ], [ 0.7777777777777778, "#fb9f3a" ], [ 0.8888888888888888, "#fdca26" ], [ 1.0, "#f0f921" ] ] } ], "scatterpolar": [ { "type": "scatterpolar", "marker": { "colorbar": { "ticks": "", "outlinewidth": 0 } } } ], "contourcarpet": [ { "type": "contourcarpet", "colorbar": { "ticks": "", "outlinewidth": 0 } } ], "scattercarpet": [ { "type": "scattercarpet", "marker": { "colorbar": { "ticks": "", "outlinewidth": 0 } } } ], "scattermapbox": [ { "type": "scattermapbox", "marker": { "colorbar": { "ticks": "", "outlinewidth": 0 } } } ], "scatterpolargl": [ { "type": "scatterpolargl", "marker": { "colorbar": { "ticks": "", "outlinewidth": 0 } } } ], "scatterternary": [ { "type": "scatterternary", "marker": { "colorbar": { "ticks": "", "outlinewidth": 0 } } } ], "histogram2dcontour": [ { "type": "histogram2dcontour", "colorbar": { "ticks": "", "outlinewidth": 0 }, "colorscale": [ [ 0.0, "#0d0887" ], [ 0.1111111111111111, "#46039f" ], [ 0.2222222222222222, "#7201a8" ], [ 0.3333333333333333, "#9c179e" ], [ 0.4444444444444444, "#bd3786" ], [ 0.5555555555555556, "#d8576b" ], [ 0.6666666666666666, "#ed7953" ], [ 0.7777777777777778, "#fb9f3a" ], [ 0.8888888888888888, "#fdca26" ], [ 1.0, "#f0f921" ] ] } ] }, "layout": { "geo": { "bgcolor": "white", "showland": true, "lakecolor": "white", "landcolor": "#E5ECF6", "showlakes": true, "subunitcolor": "white" }, "font": { "color": "#2a3f5f" }, "polar": { "bgcolor": "#E5ECF6", "radialaxis": { "ticks": "", "gridcolor": "white", "linecolor": "white" }, "angularaxis": { "ticks": "", "gridcolor": "white", "linecolor": "white" } }, "scene": { "xaxis": { "ticks": "", "gridcolor": "white", "gridwidth": 2, "linecolor": "white", "zerolinecolor": "white", "showbackground": true, "backgroundcolor": "#E5ECF6" }, "yaxis": { "ticks": "", "gridcolor": "white", "gridwidth": 2, "linecolor": "white", "zerolinecolor": "white", "showbackground": true, "backgroundcolor": "#E5ECF6" }, "zaxis": { "ticks": "", "gridcolor": "white", "gridwidth": 2, "linecolor": "white", "zerolinecolor": "white", "showbackground": true, "backgroundcolor": "#E5ECF6" } }, "title": { "x": 0.05 }, "xaxis": { "ticks": "", "title": { "standoff": 15 }, "gridcolor": "white", "linecolor": "white", "automargin": true, "zerolinecolor": "white", "zerolinewidth": 2 }, "yaxis": { "ticks": "", "title": { "standoff": 15 }, "gridcolor": "white", "linecolor": "white", "automargin": true, "zerolinecolor": "white", "zerolinewidth": 2 }, "mapbox": { "style": "light" }, "ternary": { "aaxis": { "ticks": "", "gridcolor": "white", "linecolor": "white" }, "baxis": { "ticks": "", "gridcolor": "white", "linecolor": "white" }, "caxis": { "ticks": "", "gridcolor": "white", "linecolor": "white" }, "bgcolor": "#E5ECF6" }, "colorway": [ "#636efa", "#EF553B", "#00cc96", "#ab63fa", "#FFA15A", "#19d3f3", "#FF6692", "#B6E880", "#FF97FF", "#FECB52" ], "coloraxis": { "colorbar": { "ticks": "", "outlinewidth": 0 } }, "hovermode": "closest", "colorscale": { "diverging": [ [ 0, "#8e0152" ], [ 0.1, "#c51b7d" ], [ 0.2, "#de77ae" ], [ 0.3, "#f1b6da" ], [ 0.4, "#fde0ef" ], [ 0.5, "#f7f7f7" ], [ 0.6, "#e6f5d0" ], [ 0.7, "#b8e186" ], [ 0.8, "#7fbc41" ], [ 0.9, "#4d9221" ], [ 1, "#276419" ] ], "sequential": [ [ 0.0, "#0d0887" ], [ 0.1111111111111111, "#46039f" ], [ 0.2222222222222222, "#7201a8" ], [ 0.3333333333333333, "#9c179e" ], [ 0.4444444444444444, "#bd3786" ], [ 0.5555555555555556, "#d8576b" ], [ 0.6666666666666666, "#ed7953" ], [ 0.7777777777777778, "#fb9f3a" ], [ 0.8888888888888888, "#fdca26" ], [ 1.0, "#f0f921" ] ], "sequentialminus": [ [ 0.0, "#0d0887" ], [ 0.1111111111111111, "#46039f" ], [ 0.2222222222222222, "#7201a8" ], [ 0.3333333333333333, "#9c179e" ], [ 0.4444444444444444, "#bd3786" ], [ 0.5555555555555556, "#d8576b" ], [ 0.6666666666666666, "#ed7953" ], [ 0.7777777777777778, "#fb9f3a" ], [ 0.8888888888888888, "#fdca26" ], [ 1.0, "#f0f921" ] ] }, "hoverlabel": { "align": "left" }, "plot_bgcolor": "#E5ECF6", "paper_bgcolor": "white", "shapedefaults": { "line": { "color": "#2a3f5f" } }, "autotypenumbers": "strict", "annotationdefaults": { "arrowhead": 0, "arrowcolor": "#2a3f5f", "arrowwidth": 1 } } } } }, "height": null, "width": null, "user": { "profile_url": "https://chart-studio.plotly.com/~libertihub", "avatar_url": "https://storage.googleapis.com/plotly-prod-profiles/68.jpg", "background_url": "https://storage.googleapis.com/plotly-prod-profiles/bg-8.jpg", "bio": "", "nickname": "", "website": "", "stream_tokens": null, "feature_set_id": null, "csrf_token": null, "date_joined": "2024-03-21 18:34:14", "mapbox_access_tokens": null, "has_password": null, "username": "libertihub", "email": null, "is_active": null, "readonly": null, "is_dash_creator": null, "dash_created_count": null, "is_chart_creator": null, "charts_created_count": null } }, { "creation_time": "2024-03-22T09:55:03.989057Z", "comments": { "results": [], "count": 0 }, "parented": true, "embed_url": "https://chart-studio.plotly.com/~researchkarthi/808.embed", "fid": "researchkarthi:808", "filename": "Plot 808", "filetype": "plot", "img_url": "https://storage.googleapis.com/plotly-prod-images/researchkarthi/808/9_0JZKG585NLRUMKDMC5H93T0EKY0VOF.png", "image_urls": { "default": "https://storage.googleapis.com/plotly-prod-images/researchkarthi/808/2_JJEKV1VA7P6OCSEH6EBXSXBBXB86UZ.png", "block-thumb": "https://storage.googleapis.com/plotly-prod-images/researchkarthi/808/8_TX6SJ4BS0Y3IWKF5DNWB5641IBF8RG.png", "list-thumb": "https://storage.googleapis.com/plotly-prod-images/researchkarthi/808/9_0JZKG585NLRUMKDMC5H93T0EKY0VOF.png" }, "api_urls": { "files": "https://api.plotly.com/v2/files/researchkarthi:808", "plots": "https://api.plotly.com/v2/plots/researchkarthi:808", "parent": "https://api.plotly.com/v2/folders/home?user=researchkarthi" }, "owner": "researchkarthi", "parent": -1, "preview": "", "referencers": [], "references": [], "title": "", "views": 2, "web_url": "https://chart-studio.plotly.com/~researchkarthi/808/", "world_readable": true, "date_modified": "2024-07-03T09:22:07.814Z", "stars": { "results": [], "count": 0 }, "collaborators": { "results": [], "count": 0 }, "subfolder_count": null, "refresh_interval": null, "organize_view_url": "https://chart-studio.plotly.com/~researchkarthi/808/", "current_user_permission": "read", "is_theme": null, "is_template": false, "autosize": true, "caption": "", "figure": { "data": [ { "meta": { "columnNames": { "x": "A", "y": "B" } }, "mode": "markers", "name": "<b>RFMCRP</b>", "type": "bar", "xsrc": "researchkarthi:806:56a768", "ysrc": "researchkarthi:806:be6d98", "marker": { "color": "rgb(19, 141, 35)" }, "orientation": "v" }, { "meta": { "columnNames": { "x": "A", "y": "C" } }, "name": "<b>CRAV-NET</b>", "type": "bar", "xsrc": "researchkarthi:806:56a768", "ysrc": "researchkarthi:806:09308e", "marker": { "color": "rgb(213, 40, 12)" }, "orientation": "v" }, { "meta": { "columnNames": { "x": "A", "y": "D" } }, "name": "<b>Proposed</b>", "type": "bar", "xsrc": "researchkarthi:806:56a768", "ysrc": "researchkarthi:806:d4c52a", "marker": { "color": "rgb(38, 46, 121)" }, "orientation": "v" }, { "type": "bar", "orientation": "v" } ], "frames": [], "layout": { "xaxis": { "type": "linear", "range": [ 2.5, 52.5 ], "title": { "font": { "size": 24, "family": "Times New Roman" }, "text": "<b>Number of Vehicles User</b>" }, "autorange": true }, "yaxis": { "type": "linear", "range": [ 0, 103.15789473684211 ], "title": { "font": { "size": 24, "family": "Times New Roman" }, "text": "<b>Energy Consumption (%)</b>" }, "autorange": true }, "legend": { "x": 0.24379448423664762, "y": 0.947854024219458 }, "autosize": true, "template": { "data": { "bar": [ { "type": "bar", "marker": { "colorbar": { "ticks": "", "outlinewidth": 0 } } } ], "table": [ { "type": "table", "cells": { "fill": { "color": "#EBF0F8" }, "line": { "color": "white" } }, "header": { "fill": { "color": "#C8D4E3" }, "line": { "color": "white" } } } ], "carpet": [ { "type": "carpet", "aaxis": { "gridcolor": "#C8D4E3", "linecolor": "#C8D4E3", "endlinecolor": "#2a3f5f", "minorgridcolor": "#C8D4E3", "startlinecolor": "#2a3f5f" }, "baxis": { "gridcolor": "#C8D4E3", "linecolor": "#C8D4E3", "endlinecolor": "#2a3f5f", "minorgridcolor": "#C8D4E3", "startlinecolor": "#2a3f5f" } } ], "mesh3d": [ { "type": "mesh3d", "colorbar": { "ticks": "", "outlinewidth": 0 } } ], "contour": [ { "type": "contour", "colorbar": { "ticks": "", "outlinewidth": 0 }, "autocolorscale": true } ], "heatmap": [ { "type": "heatmap", "colorbar": { "ticks": "", "outlinewidth": 0 }, "autocolorscale": true } ], "scatter": [ { "type": "scatter", "marker": { "colorbar": { "ticks": "", "outlinewidth": 0 } } } ], "surface": [ { "type": "surface", "colorbar": { "ticks": "", "outlinewidth": 0 } } ], "heatmapgl": [ { "type": "heatmapgl", "colorbar": { "ticks": "", "outlinewidth": 0 } } ], "histogram": [ { "type": "histogram", "marker": { "colorbar": { "ticks": "", "outlinewidth": 0 } } } ], "parcoords": [ { "line": { "colorbar": { "ticks": "", "outlinewidth": 0 } }, "type": "parcoords" } ], "scatter3d": [ { "type": "scatter3d", "marker": { "colorbar": { "ticks": "", "outlinewidth": 0 } } } ], "scattergl": [ { "type": "scattergl", "marker": { "colorbar": { "ticks": "", "outlinewidth": 0 } } } ], "choropleth": [ { "type": "choropleth", "colorbar": { "ticks": "", "outlinewidth": 0 } } ], "scattergeo": [ { "type": "scattergeo", "marker": { "colorbar": { "ticks": "", "outlinewidth": 0 } } } ], "histogram2d": [ { "type": "histogram2d", "colorbar": { "ticks": "", "outlinewidth": 0 }, "autocolorscale": true } ], "scatterpolar": [ { "type": "scatterpolar", "marker": { "colorbar": { "ticks": "", "outlinewidth": 0 } } } ], "contourcarpet": [ { "type": "contourcarpet", "colorbar": { "ticks": "", "outlinewidth": 0 } } ], "scattercarpet": [ { "type": "scattercarpet", "marker": { "colorbar": { "ticks": "", "outlinewidth": 0 } } } ], "scattermapbox": [ { "type": "scattermapbox", "marker": { "colorbar": { "ticks": "", "outlinewidth": 0 } } } ], "scatterpolargl": [ { "type": "scatterpolargl", "marker": { "colorbar": { "ticks": "", "outlinewidth": 0 } } } ], "scatterternary": [ { "type": "scatterternary", "marker": { "colorbar": { "ticks": "", "outlinewidth": 0 } } } ], "histogram2dcontour": [ { "type": "histogram2dcontour", "colorbar": { "ticks": "", "outlinewidth": 0 }, "autocolorscale": true } ] }, "layout": { "geo": { "bgcolor": "white", "showland": true, "lakecolor": "white", "landcolor": "white", "showlakes": true, "subunitcolor": "#C8D4E3" }, "font": { "color": "#2a3f5f" }, "polar": { "bgcolor": "white", "radialaxis": { "ticks": "", "gridcolor": "#EBF0F8", "linecolor": "#EBF0F8" }, "angularaxis": { "ticks": "", "gridcolor": "#EBF0F8", "linecolor": "#EBF0F8" } }, "scene": { "xaxis": { "ticks": "", "gridcolor": "#DFE8F3", "gridwidth": 2, "linecolor": "#EBF0F8", "zerolinecolor": "#EBF0F8", "showbackground": true, "backgroundcolor": "white" }, "yaxis": { "ticks": "", "gridcolor": "#DFE8F3", "gridwidth": 2, "linecolor": "#EBF0F8", "zerolinecolor": "#EBF0F8", "showbackground": true, "backgroundcolor": "white" }, "zaxis": { "ticks": "", "gridcolor": "#DFE8F3", "gridwidth": 2, "linecolor": "#EBF0F8", "zerolinecolor": "#EBF0F8", "showbackground": true, "backgroundcolor": "white" } }, "title": { "x": 0.05 }, "xaxis": { "ticks": "", "gridcolor": "#EBF0F8", "linecolor": "#EBF0F8", "automargin": true, "zerolinecolor": "#EBF0F8", "zerolinewidth": 2 }, "yaxis": { "ticks": "", "gridcolor": "#EBF0F8", "linecolor": "#EBF0F8", "automargin": true, "zerolinecolor": "#EBF0F8", "zerolinewidth": 2 }, "ternary": { "aaxis": { "ticks": "", "gridcolor": "#DFE8F3", "linecolor": "#A2B1C6" }, "baxis": { "ticks": "", "gridcolor": "#DFE8F3", "linecolor": "#A2B1C6" }, "caxis": { "ticks": "", "gridcolor": "#DFE8F3", "linecolor": "#A2B1C6" }, "bgcolor": "white" }, "colorway": [ "#636efa", "#EF553B", "#00cc96", "#ab63fa", "#19d3f3", "#e763fa", "#fecb52", "#ffa15a", "#ff6692", "#b6e880" ], "hovermode": "closest", "colorscale": { "diverging": [ [ 0, "#8e0152" ], [ 0.1, "#c51b7d" ], [ 0.2, "#de77ae" ], [ 0.3, "#f1b6da" ], [ 0.4, "#fde0ef" ], [ 0.5, "#f7f7f7" ], [ 0.6, "#e6f5d0" ], [ 0.7, "#b8e186" ], [ 0.8, "#7fbc41" ], [ 0.9, "#4d9221" ], [ 1, "#276419" ] ], "sequential": [ [ 0, "#0508b8" ], [ 0.0893854748603352, "#1910d8" ], [ 0.1787709497206704, "#3c19f0" ], [ 0.2681564245810056, "#6b1cfb" ], [ 0.3575418994413408, "#981cfd" ], [ 0.44692737430167595, "#bf1cfd" ], [ 0.5363128491620112, "#dd2bfd" ], [ 0.6256983240223464, "#f246fe" ], [ 0.7150837988826816, "#fc67fd" ], [ 0.8044692737430168, "#fe88fc" ], [ 0.8938547486033519, "#fea5fd" ], [ 0.9832402234636871, "#febefe" ], [ 1, "#fec3fe" ] ], "sequentialminus": [ [ 0, "#0508b8" ], [ 0.0893854748603352, "#1910d8" ], [ 0.1787709497206704, "#3c19f0" ], [ 0.2681564245810056, "#6b1cfb" ], [ 0.3575418994413408, "#981cfd" ], [ 0.44692737430167595, "#bf1cfd" ], [ 0.5363128491620112, "#dd2bfd" ], [ 0.6256983240223464, "#f246fe" ], [ 0.7150837988826816, "#fc67fd" ], [ 0.8044692737430168, "#fe88fc" ], [ 0.8938547486033519, "#fea5fd" ], [ 0.9832402234636871, "#febefe" ], [ 1, "#fec3fe" ] ] }, "plot_bgcolor": "white", "paper_bgcolor": "white", "shapedefaults": { "line": { "width": 0 }, "opacity": 0.4, "fillcolor": "#506784" }, "annotationdefaults": { "arrowhead": 0, "arrowcolor": "#506784", "arrowwidth": 1 } }, "themeRef": "PLOTLY_WHITE" } } }, "height": null, "width": null, "user": { "profile_url": "https://chart-studio.plotly.com/~researchkarthi", "avatar_url": "https://storage.googleapis.com/plotly-prod-profiles/12.jpg", "background_url": "https://storage.googleapis.com/plotly-prod-profiles/bg-2.jpg", "bio": "", "nickname": "", "website": "", "stream_tokens": null, "feature_set_id": null, "csrf_token": null, "date_joined": "2023-07-19 04:36:34", "mapbox_access_tokens": null, "has_password": null, "username": "researchkarthi", "email": null, "is_active": null, "readonly": null, "is_dash_creator": null, "dash_created_count": null, "is_chart_creator": null, "charts_created_count": null } }, { "creation_time": "2024-03-22T09:53:06.435612Z", "comments": { "results": [], "count": 0 }, "parented": true, "embed_url": "https://chart-studio.plotly.com/~faulag/26.embed", "fid": "faulag:26", "filename": "Plot 26", "filetype": "plot", "img_url": "https://storage.googleapis.com/plotly-prod-images/faulag/26/9_CD59AKQ783IMIB93TXKPFB1R81HXJ8.png", "image_urls": { "default": "https://storage.googleapis.com/plotly-prod-images/faulag/26/2_POOVPM139DTGU9PKGCSPI5RRTEAMOV.png", "block-thumb": "https://storage.googleapis.com/plotly-prod-images/faulag/26/8_59YVP5VHWP72E6W8AAO1M3I331DK7B.png", "list-thumb": "https://storage.googleapis.com/plotly-prod-images/faulag/26/9_CD59AKQ783IMIB93TXKPFB1R81HXJ8.png" }, "api_urls": { "files": "https://api.plotly.com/v2/files/faulag:26", "plots": "https://api.plotly.com/v2/plots/faulag:26", "parent": "https://api.plotly.com/v2/folders/home?user=faulag" }, "owner": "faulag", "parent": -1, "preview": "", "referencers": [], "references": [], "title": "", "views": 3, "web_url": "https://chart-studio.plotly.com/~faulag/26/", "world_readable": true, "date_modified": "2024-03-22T12:56:52.135Z", "stars": { "results": [], "count": 0 }, "collaborators": { "results": [], "count": 0 }, "subfolder_count": null, "refresh_interval": null, "organize_view_url": "https://chart-studio.plotly.com/~faulag/26/", "current_user_permission": "read", "is_theme": null, "is_template": false, "autosize": true, "caption": "", "figure": { "data": [ { "line": { "color": "rgb(239, 85, 59)", "width": 2 }, "meta": { "columnNames": { "x": "timeRoll_WayPointTracking", "y": "Roll_WayPointTracking" } }, "mode": "lines", "type": "scatter", "xsrc": "faulag:25:c0efac", "ysrc": "faulag:25:f73e51", "xaxis": "x2", "yaxis": "y2", "stackgroup": null }, { "line": { "color": "rgb(239, 85, 59)", "width": 3 }, "meta": { "columnNames": { "x": "timeX_WayPointTracking", "y": "X_WayPointTracking" } }, "mode": "lines", "type": "scatter", "xsrc": "faulag:24:1f7ce0", "ysrc": "faulag:24:3432c2", "stackgroup": null }, { "line": { "dash": "dash", "color": "rgb(0, 0, 0)", "width": 1 }, "meta": { "columnNames": { "x": "timeX_ref", "y": "ref" } }, "mode": "lines", "type": "scatter", "xsrc": "faulag:24:dfa05f", "ysrc": "faulag:24:7c6fc4", "xaxis": "x", "stackgroup": null }, { "line": { "width": 3 }, "meta": { "columnNames": { "x": "timeY_WayPointTracking", "y": "Y_WayPointTracking" } }, "mode": "lines", "type": "scatter", "xsrc": "faulag:20:da8af5", "ysrc": "faulag:20:01b812", "xaxis": "x3", "yaxis": "y3", "stackgroup": null }, { "line": { "dash": "dash", "color": "rgb(0, 0, 0)", "width": 1 }, "meta": { "columnNames": { "x": "timeY_ref", "y": "Y_ref" } }, "mode": "lines", "type": "scatter", "xsrc": "faulag:20:76e9e3", "ysrc": "faulag:20:708a1f", "xaxis": "x3", "yaxis": "y3", "stackgroup": null }, { "line": { "color": "rgb(171, 99, 250)" }, "meta": { "columnNames": { "x": "timePitch_WayPointTracking", "y": "Pitch_WayPointTracking" } }, "mode": "lines", "type": "scatter", "xsrc": "faulag:23:527d6f", "ysrc": "faulag:23:4708d8", "xaxis": "x4", "yaxis": "y4", "stackgroup": null }, { "line": { "color": "rgb(82, 161, 254)", "width": 3 }, "meta": { "columnNames": { "x": "timeZ_WayPointTracking", "y": "Z_WayPointTracking" } }, "mode": "lines", "type": "scatter", "xsrc": "faulag:21:edab33", "ysrc": "faulag:21:7c6a18", "xaxis": "x5", "yaxis": "y5", "stackgroup": null }, { "line": { "dash": "dash", "color": "rgb(0, 0, 0)", "width": 1 }, "meta": { "columnNames": { "x": "timeZ_ref", "y": "z_ref" } }, "mode": "lines", "type": "scatter", "xsrc": "faulag:21:f372a5", "ysrc": "faulag:21:5e9efd", "xaxis": "x5", "yaxis": "y5", "stackgroup": null }, { "line": { "color": "rgb(82, 161, 254)", "width": 3 }, "meta": { "columnNames": { "x": "timeYaw_WayPointTracking", "y": "Yaw_WayPointTracking" } }, "mode": "lines", "type": "scatter", "xsrc": "faulag:22:79ecc0", "ysrc": "faulag:22:e95028", "xaxis": "x6", "yaxis": "y6", "stackgroup": null }, { "line": { "dash": "dash", "color": "rgb(4, 4, 4)", "width": 1 }, "meta": { "columnNames": { "x": "timeYAW_ref", "y": "YAW_ref" } }, "mode": "lines", "type": "scatter", "xsrc": "faulag:22:6b4723", "ysrc": "faulag:22:9fd973", "xaxis": "x6", "yaxis": "y6", "stackgroup": null } ], "frames": [], "layout": { "xaxis": { "side": "top", "type": "linear", "range": [ 0, 99.96666666666667 ], "ticks": "outside", "title": { "font": { "size": 16, "family": "Roboto" }, "text": "<b>t (s)</b>" }, "domain": [ 0, 0.5 ], "tickfont": { "size": 14, "color": "rgb(0, 0, 0)", "family": "Roboto" }, "autorange": true, "tickformat": "" }, "yaxis": { "type": "linear", "range": [ -1, 0.2 ], "ticks": "outside", "title": { "font": { "size": 16, "family": "Roboto" }, "text": "<b>x (m)</b>" }, "domain": [ 0.6861321855850598, 1 ], "tickfont": { "size": 14, "family": "Roboto" }, "autorange": false }, "xaxis2": { "side": "top", "type": "linear", "range": [ 0, 99.96666666666667 ], "ticks": "outside", "title": { "font": { "size": 16, "family": "Roboto" }, "text": "<b>t (s)</b>" }, "anchor": "y", "domain": [ 0.5471014492753623, 1 ], "showgrid": true, "showline": true, "tickfont": { "size": 14, "family": "Roboto" }, "autorange": true, "overlaying": false, "zerolinewidth": 2, "showticklabels": true }, "xaxis3": { "side": "bottom", "type": "linear", "range": [ 0, 99.96666666666667 ], "title": { "font": { "size": 16, "family": "Roboto" } }, "anchor": "y3", "domain": [ 0, 0.5 ], "tickfont": { "size": 14, "family": "Roboto" }, "autorange": true, "overlaying": false }, "xaxis4": { "side": "bottom", "type": "linear", "range": [ 0, 99.96666666666667 ], "title": { "font": { "size": 16, "family": "Roboto" } }, "anchor": "y4", "domain": [ 0.5434782608695652, 1 ], "tickfont": { "size": 14, "family": "Roboto" }, "autorange": true, "overlaying": false }, "xaxis5": { "side": "bottom", "type": "linear", "range": [ 0, 99.96666666666667 ], "title": { "font": { "size": 16, "family": "Roboto" }, "text": "<b>t (s)</b>" }, "anchor": "y5", "domain": [ 0, 0.5 ], "tickfont": { "size": 14, "family": "Roboto" }, "autorange": true, "overlaying": false }, "xaxis6": { "side": "bottom", "type": "linear", "range": [ 0, 99.96666666666667 ], "title": { "font": { "size": 16, "family": "Roboto" }, "text": "<b>t (s)</b>" }, "anchor": "y6", "domain": [ 0.5416666666666666, 1 ], "autorange": true, "overlaying": false }, "yaxis2": { "side": "left", "type": "linear", "range": [ -7.991642518804725, 10.704598963953176 ], "ticks": "outside", "title": { "font": { "size": 16, "family": "Roboto" }, "text": "<b>roll (deg)</b>" }, "anchor": "x2", "domain": [ 0.6888678144149402, 1 ], "showgrid": true, "showline": true, "tickfont": { "size": 14, "family": "Roboto" }, "autorange": false, "overlaying": false, "zerolinewidth": 2, "showticklabels": true }, "yaxis3": { "side": "left", "type": "linear", "range": [ -1, 0.2 ], "title": { "font": { "size": 16, "family": "Roboto" }, "text": "<b>y (m)</b>" }, "anchor": "x3", "domain": [ 0.32405651201245006, 0.625 ], "tickfont": { "size": 14, "family": "Roboto" }, "autorange": false, "overlaying": false }, "yaxis4": { "side": "left", "type": "linear", "range": [ -5.772145841221473, 7.570083522121183 ], "title": { "font": { "size": 16, "family": "Roboto" }, "text": "<b>pitch (deg)</b>" }, "anchor": "x4", "domain": [ 0.31858525435268953, 0.6324530687676296 ], "tickfont": { "size": 14, "family": "Roboto" }, "autorange": true, "overlaying": false }, "yaxis5": { "side": "left", "type": "linear", "range": [ -0.048245872396768794, 1.0691745388580278 ], "title": { "font": { "size": 16, "family": "Roboto" }, "text": "<b>z (m)</b>" }, "anchor": "x5", "domain": [ 1.447901012953419e-16, 0.2703773951950201 ], "tickfont": { "size": 14, "family": "Roboto" }, "autorange": true, "overlaying": false }, "yaxis6": { "side": "left", "type": "linear", "range": [ -5.063522757095797, 109.40771669116188 ], "title": { "font": { "size": 16, "family": "Roboto" }, "text": "<b>yaw (deg)</b>" }, "anchor": "x6", "domain": [ 4.3437030388602564e-16, 0.27037739519502035 ], "autorange": true, "overlaying": false }, "autosize": true, "template": { "data": { "bar": [ { "type": "bar", "marker": { "colorbar": { "ticks": "", "outlinewidth": 0 } } } ], "table": [ { "type": "table", "cells": { "fill": { "color": "#EBF0F8" }, "line": { "color": "white" } }, "header": { "fill": { "color": "#C8D4E3" }, "line": { "color": "white" } } } ], "carpet": [ { "type": "carpet", "aaxis": { "gridcolor": "#C8D4E3", "linecolor": "#C8D4E3", "endlinecolor": "#2a3f5f", "minorgridcolor": "#C8D4E3", "startlinecolor": "#2a3f5f" }, "baxis": { "gridcolor": "#C8D4E3", "linecolor": "#C8D4E3", "endlinecolor": "#2a3f5f", "minorgridcolor": "#C8D4E3", "startlinecolor": "#2a3f5f" } } ], "mesh3d": [ { "type": "mesh3d", "colorbar": { "ticks": "", "outlinewidth": 0 } } ], "contour": [ { "type": "contour", "colorbar": { "ticks": "", "outlinewidth": 0 }, "autocolorscale": true } ], "heatmap": [ { "type": "heatmap", "colorbar": { "ticks": "", "outlinewidth": 0 }, "autocolorscale": true } ], "scatter": [ { "type": "scatter", "marker": { "colorbar": { "ticks": "", "outlinewidth": 0 } } } ], "surface": [ { "type": "surface", "colorbar": { "ticks": "", "outlinewidth": 0 } } ], "heatmapgl": [ { "type": "heatmapgl", "colorbar": { "ticks": "", "outlinewidth": 0 } } ], "histogram": [ { "type": "histogram", "marker": { "colorbar": { "ticks": "", "outlinewidth": 0 } } } ], "parcoords": [ { "line": { "colorbar": { "ticks": "", "outlinewidth": 0 } }, "type": "parcoords" } ], "scatter3d": [ { "type": "scatter3d", "marker": { "colorbar": { "ticks": "", "outlinewidth": 0 } } } ], "scattergl": [ { "type": "scattergl", "marker": { "colorbar": { "ticks": "", "outlinewidth": 0 } } } ], "choropleth": [ { "type": "choropleth", "colorbar": { "ticks": "", "outlinewidth": 0 } } ], "scattergeo": [ { "type": "scattergeo", "marker": { "colorbar": { "ticks": "", "outlinewidth": 0 } } } ], "histogram2d": [ { "type": "histogram2d", "colorbar": { "ticks": "", "outlinewidth": 0 }, "autocolorscale": true } ], "scatterpolar": [ { "type": "scatterpolar", "marker": { "colorbar": { "ticks": "", "outlinewidth": 0 } } } ], "contourcarpet": [ { "type": "contourcarpet", "colorbar": { "ticks": "", "outlinewidth": 0 } } ], "scattercarpet": [ { "type": "scattercarpet", "marker": { "colorbar": { "ticks": "", "outlinewidth": 0 } } } ], "scattermapbox": [ { "type": "scattermapbox", "marker": { "colorbar": { "ticks": "", "outlinewidth": 0 } } } ], "scatterpolargl": [ { "type": "scatterpolargl", "marker": { "colorbar": { "ticks": "", "outlinewidth": 0 } } } ], "scatterternary": [ { "type": "scatterternary", "marker": { "colorbar": { "ticks": "", "outlinewidth": 0 } } } ], "histogram2dcontour": [ { "type": "histogram2dcontour", "colorbar": { "ticks": "", "outlinewidth": 0 }, "autocolorscale": true } ] }, "layout": { "geo": { "bgcolor": "white", "showland": true, "lakecolor": "white", "landcolor": "white", "showlakes": true, "subunitcolor": "#C8D4E3" }, "font": { "color": "#2a3f5f" }, "polar": { "bgcolor": "white", "radialaxis": { "ticks": "", "gridcolor": "#EBF0F8", "linecolor": "#EBF0F8" }, "angularaxis": { "ticks": "", "gridcolor": "#EBF0F8", "linecolor": "#EBF0F8" } }, "scene": { "xaxis": { "ticks": "", "gridcolor": "#DFE8F3", "gridwidth": 2, "linecolor": "#EBF0F8", "zerolinecolor": "#EBF0F8", "showbackground": true, "backgroundcolor": "white" }, "yaxis": { "ticks": "", "gridcolor": "#DFE8F3", "gridwidth": 2, "linecolor": "#EBF0F8", "zerolinecolor": "#EBF0F8", "showbackground": true, "backgroundcolor": "white" }, "zaxis": { "ticks": "", "gridcolor": "#DFE8F3", "gridwidth": 2, "linecolor": "#EBF0F8", "zerolinecolor": "#EBF0F8", "showbackground": true, "backgroundcolor": "white" } }, "title": { "x": 0.05 }, "xaxis": { "ticks": "", "gridcolor": "#EBF0F8", "linecolor": "#EBF0F8", "automargin": true, "zerolinecolor": "#EBF0F8", "zerolinewidth": 2 }, "yaxis": { "ticks": "", "gridcolor": "#EBF0F8", "linecolor": "#EBF0F8", "automargin": true, "zerolinecolor": "#EBF0F8", "zerolinewidth": 2 }, "ternary": { "aaxis": { "ticks": "", "gridcolor": "#DFE8F3", "linecolor": "#A2B1C6" }, "baxis": { "ticks": "", "gridcolor": "#DFE8F3", "linecolor": "#A2B1C6" }, "caxis": { "ticks": "", "gridcolor": "#DFE8F3", "linecolor": "#A2B1C6" }, "bgcolor": "white" }, "colorway": [ "#636efa", "#EF553B", "#00cc96", "#ab63fa", "#19d3f3", "#e763fa", "#fecb52", "#ffa15a", "#ff6692", "#b6e880" ], "hovermode": "closest", "colorscale": { "diverging": [ [ 0, "#8e0152" ], [ 0.1, "#c51b7d" ], [ 0.2, "#de77ae" ], [ 0.3, "#f1b6da" ], [ 0.4, "#fde0ef" ], [ 0.5, "#f7f7f7" ], [ 0.6, "#e6f5d0" ], [ 0.7, "#b8e186" ], [ 0.8, "#7fbc41" ], [ 0.9, "#4d9221" ], [ 1, "#276419" ] ], "sequential": [ [ 0, "#0508b8" ], [ 0.0893854748603352, "#1910d8" ], [ 0.1787709497206704, "#3c19f0" ], [ 0.2681564245810056, "#6b1cfb" ], [ 0.3575418994413408, "#981cfd" ], [ 0.44692737430167595, "#bf1cfd" ], [ 0.5363128491620112, "#dd2bfd" ], [ 0.6256983240223464, "#f246fe" ], [ 0.7150837988826816, "#fc67fd" ], [ 0.8044692737430168, "#fe88fc" ], [ 0.8938547486033519, "#fea5fd" ], [ 0.9832402234636871, "#febefe" ], [ 1, "#fec3fe" ] ], "sequentialminus": [ [ 0, "#0508b8" ], [ 0.0893854748603352, "#1910d8" ], [ 0.1787709497206704, "#3c19f0" ], [ 0.2681564245810056, "#6b1cfb" ], [ 0.3575418994413408, "#981cfd" ], [ 0.44692737430167595, "#bf1cfd" ], [ 0.5363128491620112, "#dd2bfd" ], [ 0.6256983240223464, "#f246fe" ], [ 0.7150837988826816, "#fc67fd" ], [ 0.8044692737430168, "#fe88fc" ], [ 0.8938547486033519, "#fea5fd" ], [ 0.9832402234636871, "#febefe" ], [ 1, "#fec3fe" ] ] }, "plot_bgcolor": "white", "paper_bgcolor": "white", "shapedefaults": { "line": { "width": 0 }, "opacity": 0.4, "fillcolor": "#506784" }, "annotationdefaults": { "arrowhead": 0, "arrowcolor": "#506784", "arrowwidth": 1 } }, "themeRef": "PLOTLY_WHITE" }, "showlegend": false } }, "height": null, "width": null, "user": { "profile_url": "https://chart-studio.plotly.com/~faulag", "avatar_url": "https://storage.googleapis.com/plotly-prod-profiles/95.jpg", "background_url": "https://storage.googleapis.com/plotly-prod-profiles/bg-4.jpg", "bio": "", "nickname": "", "website": "", "stream_tokens": null, "feature_set_id": null, "csrf_token": null, "date_joined": "2024-03-20 10:21:12", "mapbox_access_tokens": null, "has_password": null, "username": "faulag", "email": null, "is_active": null, "readonly": null, "is_dash_creator": null, "dash_created_count": null, "is_chart_creator": null, "charts_created_count": null } }, { "creation_time": "2024-03-22T09:51:25.223015Z", "comments": { "results": [], "count": 0 }, "parented": true, "embed_url": "https://chart-studio.plotly.com/~sugandh.sai/2.embed", "fid": "sugandh.sai:2", "filename": "x1", "filetype": "plot", "img_url": "https://storage.googleapis.com/plotly-prod-images/sugandh.sai/2/9_2BAUJJT6BDVFQJOBMR0OM5GBY3Q3UF.png", "image_urls": { "default": "https://storage.googleapis.com/plotly-prod-images/sugandh.sai/2/2_IHPGQNYZAMFIFKKKTG9XTM5RZY91FC.png", "block-thumb": "https://storage.googleapis.com/plotly-prod-images/sugandh.sai/2/8_NDWNUMGT34I476JKRLK3NK3R23X7L8.png", "list-thumb": "https://storage.googleapis.com/plotly-prod-images/sugandh.sai/2/9_2BAUJJT6BDVFQJOBMR0OM5GBY3Q3UF.png" }, "api_urls": { "files": "https://api.plotly.com/v2/files/sugandh.sai:2", "plots": "https://api.plotly.com/v2/plots/sugandh.sai:2", "parent": "https://api.plotly.com/v2/folders/home?user=sugandh.sai" }, "owner": "sugandh.sai", "parent": -1, "preview": "", "referencers": [], "references": [], "title": "", "views": 2, "web_url": "https://chart-studio.plotly.com/~sugandh.sai/2/", "world_readable": true, "date_modified": "2024-03-22T10:23:58.281Z", "stars": { "results": [], "count": 0 }, "collaborators": { "results": [], "count": 0 }, "subfolder_count": null, "refresh_interval": null, "organize_view_url": "https://chart-studio.plotly.com/~sugandh.sai/2/", "current_user_permission": "read", "is_theme": null, "is_template": null, "autosize": true, "caption": "", "figure": { "data": [ { "type": "line", "xsrc": "sugandh.sai:3:6c83ea", "ysrc": "sugandh.sai:3:3630d7" } ], "layout": {} }, "height": null, "width": null, "user": { "profile_url": "https://chart-studio.plotly.com/~sugandh.sai", "avatar_url": "https://storage.googleapis.com/plotly-prod-profiles/88.jpg", "background_url": "https://storage.googleapis.com/plotly-prod-profiles/bg-9.jpg", "bio": "", "nickname": "", "website": "", "stream_tokens": null, "feature_set_id": null, "csrf_token": null, "date_joined": "2024-03-21 13:23:19", "mapbox_access_tokens": null, "has_password": null, "username": "sugandh.sai", "email": null, "is_active": null, "readonly": null, "is_dash_creator": null, "dash_created_count": null, "is_chart_creator": null, "charts_created_count": null } }, { "creation_time": "2024-03-22T09:43:31.509488Z", "comments": { "results": [], "count": 0 }, "parented": true, "embed_url": "https://chart-studio.plotly.com/~libertihub/5.embed", "fid": "libertihub:5", "filename": "Plot 5", "filetype": "plot", "img_url": "https://storage.googleapis.com/plotly-prod-images/libertihub/5/9_J4BWFW94SZKAOGKOVENLICBHBOXK5M.png", "image_urls": { "default": "https://storage.googleapis.com/plotly-prod-images/libertihub/5/2_0I4LRIVF55G61UUQ4YRDODRR5OM4NG.png", "block-thumb": "https://storage.googleapis.com/plotly-prod-images/libertihub/5/8_N72EYA6MPCZFV1N7FIKZK80IE2HDSG.png", "list-thumb": "https://storage.googleapis.com/plotly-prod-images/libertihub/5/9_J4BWFW94SZKAOGKOVENLICBHBOXK5M.png" }, "api_urls": { "files": "https://api.plotly.com/v2/files/libertihub:5", "plots": "https://api.plotly.com/v2/plots/libertihub:5", "parent": "https://api.plotly.com/v2/folders/home?user=libertihub" }, "owner": "libertihub", "parent": -1, "preview": "", "referencers": [], "references": [], "title": "", "views": 1, "web_url": "https://chart-studio.plotly.com/~libertihub/5/", "world_readable": true, "date_modified": "2024-03-22T09:43:31.525Z", "stars": { "results": [], "count": 0 }, "collaborators": { "results": [], "count": 0 }, "subfolder_count": null, "refresh_interval": null, "organize_view_url": "https://chart-studio.plotly.com/~libertihub/5/", "current_user_permission": "read", "is_theme": null, "is_template": false, "autosize": true, "caption": "", "figure": { "data": [ { "meta": { "columnNames": { "x": "virginica_sepal.length", "y": "virginica_sepal.width", "z": "virginica_petal.width" } }, "mode": "markers", "name": "Virginica", "type": "scatter3d", "xsrc": "libertihub:4:daf3d3", "ysrc": "libertihub:4:4493c0", "zsrc": "libertihub:4:0e43ee", "hoverinfo": "x+y+z+name", "hoverlabel": { "namelength": 15 } }, { "meta": { "columnNames": { "x": "setosa_sepal.length", "y": "setosa_sepal.width", "z": "setosa_petal.length" } }, "mode": "markers", "name": "Setosa", "type": "scatter3d", "xsrc": "libertihub:4:3351f0", "ysrc": "libertihub:4:d85914", "zsrc": "libertihub:4:96a188", "hoverinfo": "x+y+z+name", "hoverlabel": { "namelength": 15 } }, { "meta": { "columnNames": { "x": "versicolor_sepal.length", "y": "versicolor_sepal.width", "z": "versicolor_petal.length", "text": "virginica_sepal.length" } }, "mode": "markers", "name": "Versicolor", "type": "scatter3d", "xsrc": "libertihub:4:bdda36", "ysrc": "libertihub:4:a33819", "zsrc": "libertihub:4:435b9c", "scene": "scene", "error_x": { "type": "percent", "color": "rgb(85,168,104)", "value": 10, "width": 0, "visible": false, "symmetric": true, "thickness": 2 }, "textsrc": "libertihub:4:daf3d3", "hoverinfo": "x+y+z+name", "hoverlabel": { "namelength": 15 }, "hovertemplate": "" } ], "frames": [], "layout": { "scene": { "xaxis": { "type": "linear", "title": { "text": "Sepal lenght" } }, "yaxis": { "type": "linear", "title": { "text": "Sepal width" } }, "zaxis": { "type": "linear", "title": { "text": "petal lenght" } }, "camera": { "up": { "x": 0.21720981258802494, "y": -0.17712916196004763, "z": 0.9599193493720222 }, "eye": { "x": 1.3365350477280382, "y": 1.33653504772804, "z": 1.336535047728041 }, "center": { "x": 0, "y": 0, "z": 0 }, "projection": { "type": "perspective" } }, "aspectmode": "mode", "aspectratio": { "x": 1, "y": 1, "z": 1 } }, "width": 1532, "xaxis": { "range": [ -1, 6 ], "autorange": true }, "yaxis": { "range": [ -1, 4 ], "autorange": true }, "height": 1006, "legend": { "x": 0.02228484386900228, "y": 1.0157384987893463 }, "autosize": true, "template": { "data": { "bar": [ { "type": "bar", "marker": { "colorbar": { "ticks": "outside", "ticklen": 8, "tickcolor": "rgb(36,36,36)", "tickwidth": 2, "outlinewidth": 0 } } } ], "table": [ { "type": "table", "cells": { "fill": { "color": "rgb(231,231,240)" }, "line": { "color": "white" } }, "header": { "fill": { "color": "rgb(183,183,191)" }, "line": { "color": "white" } } } ], "carpet": [ { "type": "carpet", "aaxis": { "gridcolor": "white", "linecolor": "white", "endlinecolor": "rgb(36,36,36)", "minorgridcolor": "white", "startlinecolor": "rgb(36,36,36)" }, "baxis": { "gridcolor": "white", "linecolor": "white", "endlinecolor": "rgb(36,36,36)", "minorgridcolor": "white", "startlinecolor": "rgb(36,36,36)" } } ], "mesh3d": [ { "type": "mesh3d", "colorbar": { "ticks": "outside", "ticklen": 8, "tickcolor": "rgb(36,36,36)", "tickwidth": 2, "outlinewidth": 0 } } ], "contour": [ { "type": "contour", "colorbar": { "ticks": "outside", "ticklen": 8, "tickcolor": "rgb(36,36,36)", "tickwidth": 2, "outlinewidth": 0 }, "autocolorscale": true } ], "heatmap": [ { "type": "heatmap", "colorbar": { "ticks": "outside", "ticklen": 8, "tickcolor": "rgb(36,36,36)", "tickwidth": 2, "outlinewidth": 0 }, "autocolorscale": true } ], "scatter": [ { "type": "scatter", "marker": { "colorbar": { "ticks": "outside", "ticklen": 8, "tickcolor": "rgb(36,36,36)", "tickwidth": 2, "outlinewidth": 0 } } } ], "surface": [ { "type": "surface", "colorbar": { "ticks": "outside", "ticklen": 8, "tickcolor": "rgb(36,36,36)", "tickwidth": 2, "outlinewidth": 0 } } ], "heatmapgl": [ { "type": "heatmapgl", "colorbar": { "ticks": "outside", "ticklen": 8, "tickcolor": "rgb(36,36,36)", "tickwidth": 2, "outlinewidth": 0 } } ], "histogram": [ { "type": "histogram", "marker": { "colorbar": { "ticks": "outside", "ticklen": 8, "tickcolor": "rgb(36,36,36)", "tickwidth": 2, "outlinewidth": 0 } } } ], "parcoords": [ { "line": { "colorbar": { "ticks": "outside", "ticklen": 8, "tickcolor": "rgb(36,36,36)", "tickwidth": 2, "outlinewidth": 0 } }, "type": "parcoords" } ], "scatter3d": [ { "type": "scatter3d", "marker": { "colorbar": { "ticks": "outside", "ticklen": 8, "tickcolor": "rgb(36,36,36)", "tickwidth": 2, "outlinewidth": 0 } } } ], "scattergl": [ { "type": "scattergl", "marker": { "colorbar": { "ticks": "outside", "ticklen": 8, "tickcolor": "rgb(36,36,36)", "tickwidth": 2, "outlinewidth": 0 } } } ], "choropleth": [ { "type": "choropleth", "colorbar": { "ticks": "outside", "ticklen": 8, "tickcolor": "rgb(36,36,36)", "tickwidth": 2, "outlinewidth": 0 } } ], "scattergeo": [ { "type": "scattergeo", "marker": { "colorbar": { "ticks": "outside", "ticklen": 8, "tickcolor": "rgb(36,36,36)", "tickwidth": 2, "outlinewidth": 0 } } } ], "histogram2d": [ { "type": "histogram2d", "colorbar": { "ticks": "outside", "ticklen": 8, "tickcolor": "rgb(36,36,36)", "tickwidth": 2, "outlinewidth": 0 }, "autocolorscale": true } ], "scatterpolar": [ { "type": "scatterpolar", "marker": { "colorbar": { "ticks": "outside", "ticklen": 8, "tickcolor": "rgb(36,36,36)", "tickwidth": 2, "outlinewidth": 0 } } } ], "contourcarpet": [ { "type": "contourcarpet", "colorbar": { "ticks": "outside", "ticklen": 8, "tickcolor": "rgb(36,36,36)", "tickwidth": 2, "outlinewidth": 0 } } ], "scattercarpet": [ { "type": "scattercarpet", "marker": { "colorbar": { "ticks": "outside", "ticklen": 8, "tickcolor": "rgb(36,36,36)", "tickwidth": 2, "outlinewidth": 0 } } } ], "scattermapbox": [ { "type": "scattermapbox", "marker": { "colorbar": { "ticks": "outside", "ticklen": 8, "tickcolor": "rgb(36,36,36)", "tickwidth": 2, "outlinewidth": 0 } } } ], "scatterpolargl": [ { "type": "scatterpolargl", "marker": { "colorbar": { "ticks": "outside", "ticklen": 8, "tickcolor": "rgb(36,36,36)", "tickwidth": 2, "outlinewidth": 0 } } } ], "scatterternary": [ { "type": "scatterternary", "marker": { "colorbar": { "ticks": "outside", "ticklen": 8, "tickcolor": "rgb(36,36,36)", "tickwidth": 2, "outlinewidth": 0 } } } ], "histogram2dcontour": [ { "type": "histogram2dcontour", "colorbar": { "ticks": "outside", "ticklen": 8, "tickcolor": "rgb(36,36,36)", "tickwidth": 2, "outlinewidth": 0 }, "autocolorscale": true } ] }, "layout": { "geo": { "bgcolor": "white", "showland": true, "lakecolor": "white", "landcolor": "rgb(234,234,242)", "showlakes": true, "subunitcolor": "white" }, "font": { "color": "rgb(36,36,36)" }, "polar": { "bgcolor": "rgb(234,234,242)", "radialaxis": { "ticks": "", "showgrid": true, "gridcolor": "white", "linecolor": "white" }, "angularaxis": { "ticks": "", "showgrid": true, "gridcolor": "white", "linecolor": "white" } }, "scene": { "xaxis": { "ticks": "", "showgrid": true, "gridcolor": "white", "gridwidth": 2, "linecolor": "white", "zerolinecolor": "white", "showbackground": true, "backgroundcolor": "rgb(234,234,242)" }, "yaxis": { "ticks": "", "showgrid": true, "gridcolor": "white", "gridwidth": 2, "linecolor": "white", "zerolinecolor": "white", "showbackground": true, "backgroundcolor": "rgb(234,234,242)" }, "zaxis": { "ticks": "", "showgrid": true, "gridcolor": "white", "gridwidth": 2, "linecolor": "white", "zerolinecolor": "white", "showbackground": true, "backgroundcolor": "rgb(234,234,242)" } }, "xaxis": { "ticks": "", "showgrid": true, "gridcolor": "white", "linecolor": "white", "automargin": true, "zerolinecolor": "white" }, "yaxis": { "ticks": "", "showgrid": true, "gridcolor": "white", "linecolor": "white", "automargin": true, "zerolinecolor": "white" }, "ternary": { "aaxis": { "ticks": "", "showgrid": true, "gridcolor": "white", "linecolor": "white" }, "baxis": { "ticks": "", "showgrid": true, "gridcolor": "white", "linecolor": "white" }, "caxis": { "ticks": "", "showgrid": true, "gridcolor": "white", "linecolor": "white" }, "bgcolor": "rgb(234,234,242)" }, "colorway": [ "rgb(76,114,176)", "rgb(221,132,82)", "rgb(85,168,104)", "rgb(196,78,82)", "rgb(129,114,179)", "rgb(147,120,96)", "rgb(218,139,195)", "rgb(140,140,140)", "rgb(204,185,116)", "rgb(100,181,205)" ], "hovermode": "closest", "colorscale": { "diverging": [ [ 0, "#67001f" ], [ 0.1, "#b2182b" ], [ 0.2, "#d6604d" ], [ 0.3, "#f4a582" ], [ 0.4, "#fddbc7" ], [ 0.5, "#f7f7f7" ], [ 0.6, "#d1e5f0" ], [ 0.7, "#92c5de" ], [ 0.8, "#4393c3" ], [ 0.9, "#2166ac" ], [ 1, "#053061" ] ], "sequential": [ [ 0, "rgb(2,4,25)" ], [ 0.06274509803921569, "rgb(24,15,41)" ], [ 0.12549019607843137, "rgb(47,23,57)" ], [ 0.18823529411764706, "rgb(71,28,72)" ], [ 0.25098039215686274, "rgb(97,30,82)" ], [ 0.3137254901960784, "rgb(123,30,89)" ], [ 0.3764705882352941, "rgb(150,27,91)" ], [ 0.4392156862745098, "rgb(177,22,88)" ], [ 0.5019607843137255, "rgb(203,26,79)" ], [ 0.5647058823529412, "rgb(223,47,67)" ], [ 0.6274509803921569, "rgb(236,76,61)" ], [ 0.6901960784313725, "rgb(242,107,73)" ], [ 0.7529411764705882, "rgb(244,135,95)" ], [ 0.8156862745098039, "rgb(245,162,122)" ], [ 0.8784313725490196, "rgb(246,188,153)" ], [ 0.9411764705882353, "rgb(247,212,187)" ], [ 1, "rgb(250,234,220)" ] ], "sequentialminus": [ [ 0, "rgb(2,4,25)" ], [ 0.06274509803921569, "rgb(24,15,41)" ], [ 0.12549019607843137, "rgb(47,23,57)" ], [ 0.18823529411764706, "rgb(71,28,72)" ], [ 0.25098039215686274, "rgb(97,30,82)" ], [ 0.3137254901960784, "rgb(123,30,89)" ], [ 0.3764705882352941, "rgb(150,27,91)" ], [ 0.4392156862745098, "rgb(177,22,88)" ], [ 0.5019607843137255, "rgb(203,26,79)" ], [ 0.5647058823529412, "rgb(223,47,67)" ], [ 0.6274509803921569, "rgb(236,76,61)" ], [ 0.6901960784313725, "rgb(242,107,73)" ], [ 0.7529411764705882, "rgb(244,135,95)" ], [ 0.8156862745098039, "rgb(245,162,122)" ], [ 0.8784313725490196, "rgb(246,188,153)" ], [ 0.9411764705882353, "rgb(247,212,187)" ], [ 1, "rgb(250,234,220)" ] ] }, "plot_bgcolor": "rgb(234,234,242)", "paper_bgcolor": "white", "shapedefaults": { "line": { "width": 0 }, "opacity": 0.5, "fillcolor": "rgb(67,103,167)" }, "annotationdefaults": { "arrowcolor": "rgb(67,103,167)" } }, "themeRef": "SEABORN" } } }, "height": 1006, "width": 1532, "user": { "profile_url": "https://chart-studio.plotly.com/~libertihub", "avatar_url": "https://storage.googleapis.com/plotly-prod-profiles/68.jpg", "background_url": "https://storage.googleapis.com/plotly-prod-profiles/bg-8.jpg", "bio": "", "nickname": "", "website": "", "stream_tokens": null, "feature_set_id": null, "csrf_token": null, "date_joined": "2024-03-21 18:34:14", "mapbox_access_tokens": null, "has_password": null, "username": "libertihub", "email": null, "is_active": null, "readonly": null, "is_dash_creator": null, "dash_created_count": null, "is_chart_creator": null, "charts_created_count": null } }, { "creation_time": "2024-03-22T09:06:21.186640Z", "comments": { "results": [], "count": 0 }, "parented": true, "embed_url": "https://chart-studio.plotly.com/~Chanamnom/16.embed", "fid": "Chanamnom:16", "filename": "Rheo HPMC,Benecel", "filetype": "plot", "img_url": "https://storage.googleapis.com/plotly-prod-images/Chanamnom/16/9_FLABWT1JSUSDQRUOU3NFP41WGO1T8M.png", "image_urls": { "default": "https://storage.googleapis.com/plotly-prod-images/Chanamnom/16/2_P0SQP4VCOL903KZOS1OK5535ZESSR3.png", "block-thumb": "https://storage.googleapis.com/plotly-prod-images/Chanamnom/16/8_6J5VFTJV6W2CEUPO1T6ARG8IOZP951.png", "list-thumb": "https://storage.googleapis.com/plotly-prod-images/Chanamnom/16/9_FLABWT1JSUSDQRUOU3NFP41WGO1T8M.png" }, "api_urls": { "files": "https://api.plotly.com/v2/files/Chanamnom:16", "plots": "https://api.plotly.com/v2/plots/Chanamnom:16", "parent": "https://api.plotly.com/v2/folders/home?user=Chanamnom" }, "owner": "Chanamnom", "parent": -1, "preview": "", "referencers": [], "references": [], "title": "", "views": 1, "web_url": "https://chart-studio.plotly.com/~Chanamnom/16/", "world_readable": true, "date_modified": "2024-03-22T10:39:11.940Z", "stars": { "results": [], "count": 0 }, "collaborators": { "results": [], "count": 0 }, "subfolder_count": null, "refresh_interval": null, "organize_view_url": "https://chart-studio.plotly.com/~Chanamnom/16/", "current_user_permission": "read", "is_theme": null, "is_template": false, "autosize": true, "caption": "", "figure": { "data": [ { "fill": "none", "line": { "shape": "linear" }, "meta": { "columnNames": { "x": "T in °C", "y": "G&amp;amp;#39; in Pa", "marker": { "size": "" } } }, "mode": "markers", "name": "G' of 0.5% HPMC", "type": "scatter", "xsrc": "Chanamnom:5:0c96bc", "ysrc": "Chanamnom:5:7da795", "yaxis": "y2", "marker": { "meta": { "columnNames": { "size": "G&amp;amp;#39; in Pa" } }, "size": 6, "color": "#1f77b4", "symbol": "circle", "sizeref": 2.41409167654321, "sizemode": "area", "maxdisplayed": 0 }, "error_x": { "type": "percent", "color": "#636efa", "value": 10, "width": 4, "visible": false, "symmetric": true, "thickness": 2 }, "visible": true, "stackgroup": null, "connectgaps": false }, { "meta": { "columnNames": { "x": "T in °C", "y": "G&amp;amp;#39; in Pa" } }, "mode": "markers", "name": "G' of 1.0% HPMC", "type": "scatter", "xsrc": "Chanamnom:4:01f7a2", "ysrc": "Chanamnom:4:c925bf", "yaxis": "y2", "marker": { "color": "#ff7f0e", "symbol": "triangle-up" }, "stackgroup": null }, { "meta": { "columnNames": { "x": "T in °C", "y": "G&#39; in Pa" } }, "mode": "markers", "name": "G' of 1.5% HPMC", "type": "scatter", "xsrc": "Chanamnom:11:f19b05", "ysrc": "Chanamnom:11:e97bf0", "yaxis": "y2", "marker": { "size": 6, "color": "#2ca02c", "symbol": "cross" } }, { "meta": { "columnNames": { "x": "T in °C", "y": "G&#39; in Pa" } }, "mode": "markers", "name": "G' of 2.0% HPMC", "type": "scatter", "xsrc": "Chanamnom:14:f4d83f", "ysrc": "Chanamnom:14:c2c5cb", "yaxis": "y2", "marker": { "size": 6, "color": "#d62728", "symbol": "square" } }, { "meta": { "columnNames": { "x": "T in °C", "y": "G&amp;amp;quot; in Pa" } }, "mode": "markers", "name": "G\" of 0.5% HPMC", "type": "scatter", "xsrc": "Chanamnom:5:0c96bc", "ysrc": "Chanamnom:5:871420", "marker": { "color": "#9467bd" }, "orientation": "v" }, { "meta": { "columnNames": { "x": "T in °C", "y": "G&amp;amp;quot; in Pa" } }, "mode": "markers", "name": "G\" of 1.0% HPMC", "type": "scatter", "xsrc": "Chanamnom:4:01f7a2", "ysrc": "Chanamnom:4:cf5d01", "marker": { "color": "#8c564b" }, "stackgroup": null }, { "meta": { "columnNames": { "x": "T in °C", "y": "G&quot; in Pa" } }, "mode": "markers", "name": "G\" of 1.5% HPMC", "type": "scatter", "xsrc": "Chanamnom:11:f19b05", "ysrc": "Chanamnom:11:be3eed", "marker": { "color": "#e377c2" } }, { "meta": { "columnNames": { "x": "T in °C", "y": "G&quot; in Pa" } }, "mode": "markers", "name": "G\" of 2.0% HPMC", "type": "scatter", "xsrc": "Chanamnom:14:f4d83f", "ysrc": "Chanamnom:14:319769", "marker": { "color": "#7f7f7f" } } ], "frames": [], "layout": { "font": { "size": 12 }, "title": { "x": 0.5, "text": "Temperature sweep (0.5 - 2.0% HPMC)" }, "xaxis": { "side": "bottom", "type": "linear", "range": [ 25, 90 ], "ticks": "", "title": { "text": "Temperature (C)" }, "anchor": "y", "domain": [ 0, 1 ], "showline": true, "autorange": false, "showspikes": true, "tickformat": "", "showticklabels": true, "separatethousands": false }, "yaxis": { "side": "right", "type": "log", "range": [ 1, 5 ], "title": { "text": "G\" (Pa)" }, "domain": [ 0, 1 ], "tickmode": "linear", "autorange": false, "fixedrange": false, "showspikes": true, "exponentformat": "power", "separatethousands": false }, "legend": { "x": 1.0370827858081473, "y": 1 }, "yaxis2": { "side": "left", "type": "log", "range": [ 0, 5 ], "title": { "text": "G' (Pa)" }, "tickmode": "linear", "autorange": false, "automargin": true, "overlaying": "y", "showspikes": true, "showexponent": "all", "exponentformat": "power", "separatethousands": false }, "barmode": "group", "autosize": true, "dragmode": "select", "template": { "data": { "bar": [ { "type": "bar", "marker": { "colorbar": { "ticks": "", "outlinewidth": 0 } } } ], "table": [ { "type": "table", "cells": { "fill": { "color": "#EBF0F8" }, "line": { "color": "white" } }, "header": { "fill": { "color": "#C8D4E3" }, "line": { "color": "white" } } } ], "carpet": [ { "type": "carpet", "aaxis": { "gridcolor": "#C8D4E3", "linecolor": "#C8D4E3", "endlinecolor": "#2a3f5f", "minorgridcolor": "#C8D4E3", "startlinecolor": "#2a3f5f" }, "baxis": { "gridcolor": "#C8D4E3", "linecolor": "#C8D4E3", "endlinecolor": "#2a3f5f", "minorgridcolor": "#C8D4E3", "startlinecolor": "#2a3f5f" } } ], "mesh3d": [ { "type": "mesh3d", "colorbar": { "ticks": "", "outlinewidth": 0 } } ], "contour": [ { "type": "contour", "colorbar": { "ticks": "", "outlinewidth": 0 }, "autocolorscale": true } ], "heatmap": [ { "type": "heatmap", "colorbar": { "ticks": "", "outlinewidth": 0 }, "autocolorscale": true } ], "scatter": [ { "type": "scatter", "marker": { "colorbar": { "ticks": "", "outlinewidth": 0 } } } ], "surface": [ { "type": "surface", "colorbar": { "ticks": "", "outlinewidth": 0 } } ], "heatmapgl": [ { "type": "heatmapgl", "colorbar": { "ticks": "", "outlinewidth": 0 } } ], "histogram": [ { "type": "histogram", "marker": { "colorbar": { "ticks": "", "outlinewidth": 0 } } } ], "parcoords": [ { "line": { "colorbar": { "ticks": "", "outlinewidth": 0 } }, "type": "parcoords" } ], "scatter3d": [ { "type": "scatter3d", "marker": { "colorbar": { "ticks": "", "outlinewidth": 0 } } } ], "scattergl": [ { "type": "scattergl", "marker": { "colorbar": { "ticks": "", "outlinewidth": 0 } } } ], "choropleth": [ { "type": "choropleth", "colorbar": { "ticks": "", "outlinewidth": 0 } } ], "scattergeo": [ { "type": "scattergeo", "marker": { "colorbar": { "ticks": "", "outlinewidth": 0 } } } ], "histogram2d": [ { "type": "histogram2d", "colorbar": { "ticks": "", "outlinewidth": 0 }, "autocolorscale": true } ], "scatterpolar": [ { "type": "scatterpolar", "marker": { "colorbar": { "ticks": "", "outlinewidth": 0 } } } ], "contourcarpet": [ { "type": "contourcarpet", "colorbar": { "ticks": "", "outlinewidth": 0 } } ], "scattercarpet": [ { "type": "scattercarpet", "marker": { "colorbar": { "ticks": "", "outlinewidth": 0 } } } ], "scattermapbox": [ { "type": "scattermapbox", "marker": { "colorbar": { "ticks": "", "outlinewidth": 0 } } } ], "scatterpolargl": [ { "type": "scatterpolargl", "marker": { "colorbar": { "ticks": "", "outlinewidth": 0 } } } ], "scatterternary": [ { "type": "scatterternary", "marker": { "colorbar": { "ticks": "", "outlinewidth": 0 } } } ], "histogram2dcontour": [ { "type": "histogram2dcontour", "colorbar": { "ticks": "", "outlinewidth": 0 }, "autocolorscale": true } ] }, "layout": { "geo": { "bgcolor": "white", "showland": true, "lakecolor": "white", "landcolor": "white", "showlakes": true, "subunitcolor": "#C8D4E3" }, "font": { "color": "#2a3f5f" }, "polar": { "bgcolor": "white", "radialaxis": { "ticks": "", "gridcolor": "#EBF0F8", "linecolor": "#EBF0F8" }, "angularaxis": { "ticks": "", "gridcolor": "#EBF0F8", "linecolor": "#EBF0F8" } }, "scene": { "xaxis": { "ticks": "", "gridcolor": "#DFE8F3", "gridwidth": 2, "linecolor": "#EBF0F8", "zerolinecolor": "#EBF0F8", "showbackground": true, "backgroundcolor": "white" }, "yaxis": { "ticks": "", "gridcolor": "#DFE8F3", "gridwidth": 2, "linecolor": "#EBF0F8", "zerolinecolor": "#EBF0F8", "showbackground": true, "backgroundcolor": "white" }, "zaxis": { "ticks": "", "gridcolor": "#DFE8F3", "gridwidth": 2, "linecolor": "#EBF0F8", "zerolinecolor": "#EBF0F8", "showbackground": true, "backgroundcolor": "white" } }, "title": { "x": 0.05 }, "xaxis": { "ticks": "", "gridcolor": "#EBF0F8", "linecolor": "#EBF0F8", "automargin": true, "zerolinecolor": "#EBF0F8", "zerolinewidth": 2 }, "yaxis": { "ticks": "", "gridcolor": "#EBF0F8", "linecolor": "#EBF0F8", "automargin": true, "zerolinecolor": "#EBF0F8", "zerolinewidth": 2 }, "ternary": { "aaxis": { "ticks": "", "gridcolor": "#DFE8F3", "linecolor": "#A2B1C6" }, "baxis": { "ticks": "", "gridcolor": "#DFE8F3", "linecolor": "#A2B1C6" }, "caxis": { "ticks": "", "gridcolor": "#DFE8F3", "linecolor": "#A2B1C6" }, "bgcolor": "white" }, "colorway": [ "#636efa", "#EF553B", "#00cc96", "#ab63fa", "#19d3f3", "#e763fa", "#fecb52", "#ffa15a", "#ff6692", "#b6e880" ], "hovermode": "closest", "colorscale": { "diverging": [ [ 0, "#8e0152" ], [ 0.1, "#c51b7d" ], [ 0.2, "#de77ae" ], [ 0.3, "#f1b6da" ], [ 0.4, "#fde0ef" ], [ 0.5, "#f7f7f7" ], [ 0.6, "#e6f5d0" ], [ 0.7, "#b8e186" ], [ 0.8, "#7fbc41" ], [ 0.9, "#4d9221" ], [ 1, "#276419" ] ], "sequential": [ [ 0, "#0508b8" ], [ 0.0893854748603352, "#1910d8" ], [ 0.1787709497206704, "#3c19f0" ], [ 0.2681564245810056, "#6b1cfb" ], [ 0.3575418994413408, "#981cfd" ], [ 0.44692737430167595, "#bf1cfd" ], [ 0.5363128491620112, "#dd2bfd" ], [ 0.6256983240223464, "#f246fe" ], [ 0.7150837988826816, "#fc67fd" ], [ 0.8044692737430168, "#fe88fc" ], [ 0.8938547486033519, "#fea5fd" ], [ 0.9832402234636871, "#febefe" ], [ 1, "#fec3fe" ] ], "sequentialminus": [ [ 0, "#0508b8" ], [ 0.0893854748603352, "#1910d8" ], [ 0.1787709497206704, "#3c19f0" ], [ 0.2681564245810056, "#6b1cfb" ], [ 0.3575418994413408, "#981cfd" ], [ 0.44692737430167595, "#bf1cfd" ], [ 0.5363128491620112, "#dd2bfd" ], [ 0.6256983240223464, "#f246fe" ], [ 0.7150837988826816, "#fc67fd" ], [ 0.8044692737430168, "#fe88fc" ], [ 0.8938547486033519, "#fea5fd" ], [ 0.9832402234636871, "#febefe" ], [ 1, "#fec3fe" ] ] }, "plot_bgcolor": "white", "paper_bgcolor": "white", "shapedefaults": { "line": { "width": 0 }, "opacity": 0.4, "fillcolor": "#506784" }, "annotationdefaults": { "arrowhead": 0, "arrowcolor": "#506784", "arrowwidth": 1 } }, "themeRef": "PLOTLY_WHITE" }, "hovermode": "closest" } }, "height": null, "width": null, "user": { "profile_url": "https://chart-studio.plotly.com/~Chanamnom", "avatar_url": "https://storage.googleapis.com/plotly-prod-profiles/30.jpg", "background_url": "https://storage.googleapis.com/plotly-prod-profiles/bg-0.jpg", "bio": "", "nickname": "", "website": "", "stream_tokens": null, "feature_set_id": null, "csrf_token": null, "date_joined": "2024-03-22 08:46:24", "mapbox_access_tokens": null, "has_password": null, "username": "Chanamnom", "email": null, "is_active": null, "readonly": null, "is_dash_creator": null, "dash_created_count": null, "is_chart_creator": null, "charts_created_count": null } } ] }
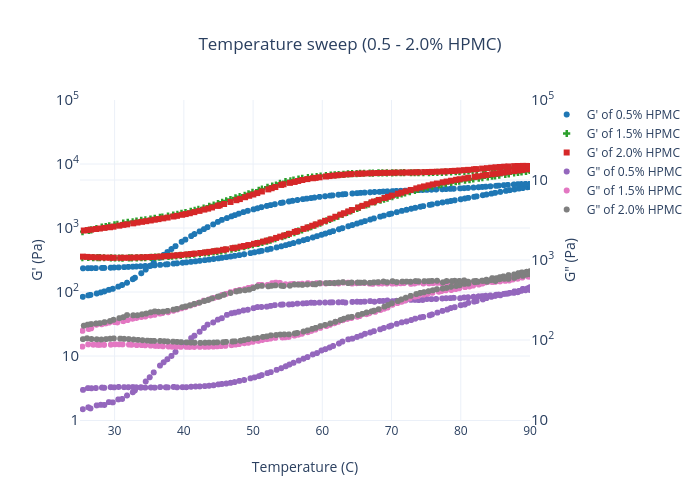