Plots


Jump to API response

This endpoint handles manipulation of Plotly plot files.

Reference

Authorization


Any user with or without a Plotly account may view public plots. For private plots, see authentication.

Actions


list

Listing all public plots can be done via a GET request to this endpoint. By default, plots will be listed in order of date created. The order_by query parameter is accepted at this endpoint. Currently, only ordering by views is supported. It is possible to filter the plots by quality with min_quality or max_quality as query parameter.

Example:

// GET https://api.plotly.com/v2/plots/ ---> 200

// GET https://api.plotly.com/v2/plots/?order_by=-views ---> 200

// GET https://api.plotly.com/v2/plots/?min_quality=5 ---> 200

// GET https://api.plotly.com/v2/plots/?max_quality=5 ---> 200

feed

Listing all handpicked feed plots can be done via a GET request to this endpoint. By default, plots will be listed in a random order.

Example:

// GET https://api.plotly.com/v2/plots/feed ---> 200

create

You can create new plot resources here. The only required field is 'figure'. Currently, the figure is restricted to only contain references to grid data. That is, this will fail if raw data arrays are passed in. To create and manipulate underlying grids for plots, see the grids endpoint.

Example:

// This fails because a figure field is required.
// POST https://api.plotly.com/v2/plots ---> 400 Bad Request
{}

// This fails because the figure has raw data
//POST https://api.plotly.com/v2/plots ---> 400 Bad Request
{
    "figure": {"data": [{"y": ['this', 'is', 'raw', 'data']}]}
}

// This succeeds because the figure has src keys, not raw data.
//POST https://api.plotly.com/v2/plots ---> 200 OK
{
    "figure": {"data": [{"ysrc": "sven:88:u8nd62"}]}
}

When creating a grid, you can optionally specify a source_fid to specify where a plot has come from:

  • source_fid: the fid of a plot that was copied (and presumably edited) to produce this one

detail

There is a lot of meta information stored about plot files including filename, title, share_url, and content_url to name a few.

This information can only be reached with a GET to this endpoint.

Example:

// GET https://api.plotly.com/v2/plots/iheartgraphs:90

content

The contents of a plot can be downloaded via the content resource. The plot content contains referenced grid/column data by default. If you wish to return the raw grid/column data, the inline_data=true query must be included in the request url. The Content-Type header will be appropriately set for the response body.

Alternatively, you can set ?map_data=unreadable to append a mapping of sources to data that belongs to grids which are unreadable for the requestor. This is useful when you have read access to another users plot, but that plot contains grid references which you don't have access to.

Examples:

// Returns referenced grid/column data
// GET https://api.plotly.com/v2/plots/iheartgraphs:90/content ---> 200 OK

// Returns full grid/column data
// GET https://api.plotly.com/v2/plots/iheartgraphs:90/content?inline_data=true ---> 200 OK

// Returns full grid/column data when requestor doesn't have permission
// to read the referenced grid.
// GET https://api.plotly.com/v2/plots/iheartgraphs:90/content?map_data=unreadable ---> 200 OK

GET /v2/plots?cursor=cD0yMDI0LTAzLTIwKzIzJTNBMDElM0EyMC4xMjMyOTYlMkIwMCUzQTAw&format=api
HTTP 200 OK
Allow: GET, POST, HEAD, OPTIONS
Content-Type: application/json
Vary: Accept

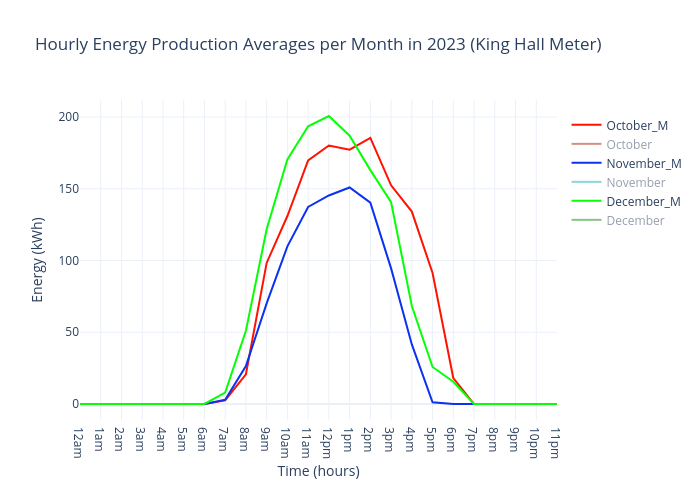
{
    "next": "https://api.plot.ly/v2/plots?cursor=cD0yMDI0LTAzLTIwKzIyJTNBMTIlM0EwNS43ODI3MDMlMkIwMCUzQTAw&format=api",
    "previous": "https://api.plot.ly/v2/plots?cursor=cj0xJnA9MjAyNC0wMy0yMCsyMiUzQTQ4JTNBNTkuOTY1NjY4JTJCMDAlM0EwMA%3D%3D&format=api",
    "results": [
        {
            "creation_time": "2024-03-20T22:48:59.965668Z",
            "comments": {
                "results": [],
                "count": 0
            },
            "parented": true,
            "embed_url": "https://chart-studio.plotly.com/~evaliuu/17.embed",
            "fid": "evaliuu:17",
            "filename": "Plot 17",
            "filetype": "plot",
            "img_url": "https://storage.googleapis.com/plotly-prod-images/evaliuu/17/9_ODIW7CXW81BP2Q98OGWKNBI5JY52UB.png",
            "image_urls": {
                "default": "https://storage.googleapis.com/plotly-prod-images/evaliuu/17/2_AIT7WA0XS6FR0ONDX4UZYW724K7IDF.png",
                "block-thumb": "https://storage.googleapis.com/plotly-prod-images/evaliuu/17/8_3WYG11O27ZKLDSL7A3BBYOEB85WHP1.png",
                "list-thumb": "https://storage.googleapis.com/plotly-prod-images/evaliuu/17/9_ODIW7CXW81BP2Q98OGWKNBI5JY52UB.png"
            },
            "api_urls": {
                "files": "https://api.plotly.com/v2/files/evaliuu:17",
                "plots": "https://api.plotly.com/v2/plots/evaliuu:17",
                "parent": "https://api.plotly.com/v2/folders/home?user=evaliuu"
            },
            "owner": "evaliuu",
            "parent": -1,
            "preview": "",
            "referencers": [],
            "references": [],
            "title": "",
            "views": 1,
            "web_url": "https://chart-studio.plotly.com/~evaliuu/17/",
            "world_readable": true,
            "date_modified": "2024-03-20T22:48:59.979Z",
            "stars": {
                "results": [],
                "count": 0
            },
            "collaborators": {
                "results": [],
                "count": 0
            },
            "subfolder_count": null,
            "refresh_interval": null,
            "organize_view_url": "https://chart-studio.plotly.com/~evaliuu/17/",
            "current_user_permission": "read",
            "is_theme": null,
            "is_template": false,
            "autosize": true,
            "caption": "",
            "figure": {
                "data": [
                    {
                        "meta": {
                            "columnNames": {
                                "x": "C",
                                "y": "A"
                            }
                        },
                        "mode": "markers",
                        "name": "Actual data ",
                        "type": "scatter",
                        "xsrc": "evaliuu:16:38652b",
                        "ysrc": "evaliuu:16:12e187"
                    },
                    {
                        "meta": {
                            "columnNames": {
                                "x": "C",
                                "y": "B"
                            }
                        },
                        "mode": "lines",
                        "name": "Predicted values with the exponential model",
                        "type": "scatter",
                        "xsrc": "evaliuu:16:38652b",
                        "ysrc": "evaliuu:16:3789b2"
                    }
                ],
                "frames": [],
                "layout": {
                    "title": {
                        "text": "Year against the world population of Black Rhinos"
                    },
                    "xaxis": {
                        "type": "linear",
                        "range": [
                            2004.142269736842,
                            2019.857730263158
                        ],
                        "title": {
                            "text": "Year"
                        },
                        "autorange": true
                    },
                    "yaxis": {
                        "type": "linear",
                        "range": [
                            3585.9059295586267,
                            5923.899687917967
                        ],
                        "title": {
                            "text": "World population of Black Rhinos"
                        },
                        "autorange": true
                    },
                    "legend": {
                        "x": 0.6038587025027704,
                        "y": 0.37566137566137564
                    },
                    "autosize": true,
                    "template": {
                        "data": {
                            "bar": [
                                {
                                    "type": "bar",
                                    "marker": {
                                        "colorbar": {
                                            "ticks": "",
                                            "outlinewidth": 0
                                        }
                                    }
                                }
                            ],
                            "table": [
                                {
                                    "type": "table",
                                    "cells": {
                                        "fill": {
                                            "color": "#EBF0F8"
                                        },
                                        "line": {
                                            "color": "white"
                                        }
                                    },
                                    "header": {
                                        "fill": {
                                            "color": "#C8D4E3"
                                        },
                                        "line": {
                                            "color": "white"
                                        }
                                    }
                                }
                            ],
                            "carpet": [
                                {
                                    "type": "carpet",
                                    "aaxis": {
                                        "gridcolor": "#C8D4E3",
                                        "linecolor": "#C8D4E3",
                                        "endlinecolor": "#2a3f5f",
                                        "minorgridcolor": "#C8D4E3",
                                        "startlinecolor": "#2a3f5f"
                                    },
                                    "baxis": {
                                        "gridcolor": "#C8D4E3",
                                        "linecolor": "#C8D4E3",
                                        "endlinecolor": "#2a3f5f",
                                        "minorgridcolor": "#C8D4E3",
                                        "startlinecolor": "#2a3f5f"
                                    }
                                }
                            ],
                            "mesh3d": [
                                {
                                    "type": "mesh3d",
                                    "colorbar": {
                                        "ticks": "",
                                        "outlinewidth": 0
                                    }
                                }
                            ],
                            "contour": [
                                {
                                    "type": "contour",
                                    "colorbar": {
                                        "ticks": "",
                                        "outlinewidth": 0
                                    },
                                    "autocolorscale": true
                                }
                            ],
                            "heatmap": [
                                {
                                    "type": "heatmap",
                                    "colorbar": {
                                        "ticks": "",
                                        "outlinewidth": 0
                                    },
                                    "autocolorscale": true
                                }
                            ],
                            "scatter": [
                                {
                                    "type": "scatter",
                                    "marker": {
                                        "colorbar": {
                                            "ticks": "",
                                            "outlinewidth": 0
                                        }
                                    }
                                }
                            ],
                            "surface": [
                                {
                                    "type": "surface",
                                    "colorbar": {
                                        "ticks": "",
                                        "outlinewidth": 0
                                    }
                                }
                            ],
                            "heatmapgl": [
                                {
                                    "type": "heatmapgl",
                                    "colorbar": {
                                        "ticks": "",
                                        "outlinewidth": 0
                                    }
                                }
                            ],
                            "histogram": [
                                {
                                    "type": "histogram",
                                    "marker": {
                                        "colorbar": {
                                            "ticks": "",
                                            "outlinewidth": 0
                                        }
                                    }
                                }
                            ],
                            "parcoords": [
                                {
                                    "line": {
                                        "colorbar": {
                                            "ticks": "",
                                            "outlinewidth": 0
                                        }
                                    },
                                    "type": "parcoords"
                                }
                            ],
                            "scatter3d": [
                                {
                                    "type": "scatter3d",
                                    "marker": {
                                        "colorbar": {
                                            "ticks": "",
                                            "outlinewidth": 0
                                        }
                                    }
                                }
                            ],
                            "scattergl": [
                                {
                                    "type": "scattergl",
                                    "marker": {
                                        "colorbar": {
                                            "ticks": "",
                                            "outlinewidth": 0
                                        }
                                    }
                                }
                            ],
                            "choropleth": [
                                {
                                    "type": "choropleth",
                                    "colorbar": {
                                        "ticks": "",
                                        "outlinewidth": 0
                                    }
                                }
                            ],
                            "scattergeo": [
                                {
                                    "type": "scattergeo",
                                    "marker": {
                                        "colorbar": {
                                            "ticks": "",
                                            "outlinewidth": 0
                                        }
                                    }
                                }
                            ],
                            "histogram2d": [
                                {
                                    "type": "histogram2d",
                                    "colorbar": {
                                        "ticks": "",
                                        "outlinewidth": 0
                                    },
                                    "autocolorscale": true
                                }
                            ],
                            "scatterpolar": [
                                {
                                    "type": "scatterpolar",
                                    "marker": {
                                        "colorbar": {
                                            "ticks": "",
                                            "outlinewidth": 0
                                        }
                                    }
                                }
                            ],
                            "contourcarpet": [
                                {
                                    "type": "contourcarpet",
                                    "colorbar": {
                                        "ticks": "",
                                        "outlinewidth": 0
                                    }
                                }
                            ],
                            "scattercarpet": [
                                {
                                    "type": "scattercarpet",
                                    "marker": {
                                        "colorbar": {
                                            "ticks": "",
                                            "outlinewidth": 0
                                        }
                                    }
                                }
                            ],
                            "scattermapbox": [
                                {
                                    "type": "scattermapbox",
                                    "marker": {
                                        "colorbar": {
                                            "ticks": "",
                                            "outlinewidth": 0
                                        }
                                    }
                                }
                            ],
                            "scatterpolargl": [
                                {
                                    "type": "scatterpolargl",
                                    "marker": {
                                        "colorbar": {
                                            "ticks": "",
                                            "outlinewidth": 0
                                        }
                                    }
                                }
                            ],
                            "scatterternary": [
                                {
                                    "type": "scatterternary",
                                    "marker": {
                                        "colorbar": {
                                            "ticks": "",
                                            "outlinewidth": 0
                                        }
                                    }
                                }
                            ],
                            "histogram2dcontour": [
                                {
                                    "type": "histogram2dcontour",
                                    "colorbar": {
                                        "ticks": "",
                                        "outlinewidth": 0
                                    },
                                    "autocolorscale": true
                                }
                            ]
                        },
                        "layout": {
                            "geo": {
                                "bgcolor": "white",
                                "showland": true,
                                "lakecolor": "white",
                                "landcolor": "white",
                                "showlakes": true,
                                "subunitcolor": "#C8D4E3"
                            },
                            "font": {
                                "color": "#2a3f5f"
                            },
                            "polar": {
                                "bgcolor": "white",
                                "radialaxis": {
                                    "ticks": "",
                                    "gridcolor": "#EBF0F8",
                                    "linecolor": "#EBF0F8"
                                },
                                "angularaxis": {
                                    "ticks": "",
                                    "gridcolor": "#EBF0F8",
                                    "linecolor": "#EBF0F8"
                                }
                            },
                            "scene": {
                                "xaxis": {
                                    "ticks": "",
                                    "gridcolor": "#DFE8F3",
                                    "gridwidth": 2,
                                    "linecolor": "#EBF0F8",
                                    "zerolinecolor": "#EBF0F8",
                                    "showbackground": true,
                                    "backgroundcolor": "white"
                                },
                                "yaxis": {
                                    "ticks": "",
                                    "gridcolor": "#DFE8F3",
                                    "gridwidth": 2,
                                    "linecolor": "#EBF0F8",
                                    "zerolinecolor": "#EBF0F8",
                                    "showbackground": true,
                                    "backgroundcolor": "white"
                                },
                                "zaxis": {
                                    "ticks": "",
                                    "gridcolor": "#DFE8F3",
                                    "gridwidth": 2,
                                    "linecolor": "#EBF0F8",
                                    "zerolinecolor": "#EBF0F8",
                                    "showbackground": true,
                                    "backgroundcolor": "white"
                                }
                            },
                            "title": {
                                "x": 0.05
                            },
                            "xaxis": {
                                "ticks": "",
                                "gridcolor": "#EBF0F8",
                                "linecolor": "#EBF0F8",
                                "automargin": true,
                                "zerolinecolor": "#EBF0F8",
                                "zerolinewidth": 2
                            },
                            "yaxis": {
                                "ticks": "",
                                "gridcolor": "#EBF0F8",
                                "linecolor": "#EBF0F8",
                                "automargin": true,
                                "zerolinecolor": "#EBF0F8",
                                "zerolinewidth": 2
                            },
                            "ternary": {
                                "aaxis": {
                                    "ticks": "",
                                    "gridcolor": "#DFE8F3",
                                    "linecolor": "#A2B1C6"
                                },
                                "baxis": {
                                    "ticks": "",
                                    "gridcolor": "#DFE8F3",
                                    "linecolor": "#A2B1C6"
                                },
                                "caxis": {
                                    "ticks": "",
                                    "gridcolor": "#DFE8F3",
                                    "linecolor": "#A2B1C6"
                                },
                                "bgcolor": "white"
                            },
                            "colorway": [
                                "#636efa",
                                "#EF553B",
                                "#00cc96",
                                "#ab63fa",
                                "#19d3f3",
                                "#e763fa",
                                "#fecb52",
                                "#ffa15a",
                                "#ff6692",
                                "#b6e880"
                            ],
                            "hovermode": "closest",
                            "colorscale": {
                                "diverging": [
                                    [
                                        0,
                                        "#8e0152"
                                    ],
                                    [
                                        0.1,
                                        "#c51b7d"
                                    ],
                                    [
                                        0.2,
                                        "#de77ae"
                                    ],
                                    [
                                        0.3,
                                        "#f1b6da"
                                    ],
                                    [
                                        0.4,
                                        "#fde0ef"
                                    ],
                                    [
                                        0.5,
                                        "#f7f7f7"
                                    ],
                                    [
                                        0.6,
                                        "#e6f5d0"
                                    ],
                                    [
                                        0.7,
                                        "#b8e186"
                                    ],
                                    [
                                        0.8,
                                        "#7fbc41"
                                    ],
                                    [
                                        0.9,
                                        "#4d9221"
                                    ],
                                    [
                                        1,
                                        "#276419"
                                    ]
                                ],
                                "sequential": [
                                    [
                                        0,
                                        "#0508b8"
                                    ],
                                    [
                                        0.0893854748603352,
                                        "#1910d8"
                                    ],
                                    [
                                        0.1787709497206704,
                                        "#3c19f0"
                                    ],
                                    [
                                        0.2681564245810056,
                                        "#6b1cfb"
                                    ],
                                    [
                                        0.3575418994413408,
                                        "#981cfd"
                                    ],
                                    [
                                        0.44692737430167595,
                                        "#bf1cfd"
                                    ],
                                    [
                                        0.5363128491620112,
                                        "#dd2bfd"
                                    ],
                                    [
                                        0.6256983240223464,
                                        "#f246fe"
                                    ],
                                    [
                                        0.7150837988826816,
                                        "#fc67fd"
                                    ],
                                    [
                                        0.8044692737430168,
                                        "#fe88fc"
                                    ],
                                    [
                                        0.8938547486033519,
                                        "#fea5fd"
                                    ],
                                    [
                                        0.9832402234636871,
                                        "#febefe"
                                    ],
                                    [
                                        1,
                                        "#fec3fe"
                                    ]
                                ],
                                "sequentialminus": [
                                    [
                                        0,
                                        "#0508b8"
                                    ],
                                    [
                                        0.0893854748603352,
                                        "#1910d8"
                                    ],
                                    [
                                        0.1787709497206704,
                                        "#3c19f0"
                                    ],
                                    [
                                        0.2681564245810056,
                                        "#6b1cfb"
                                    ],
                                    [
                                        0.3575418994413408,
                                        "#981cfd"
                                    ],
                                    [
                                        0.44692737430167595,
                                        "#bf1cfd"
                                    ],
                                    [
                                        0.5363128491620112,
                                        "#dd2bfd"
                                    ],
                                    [
                                        0.6256983240223464,
                                        "#f246fe"
                                    ],
                                    [
                                        0.7150837988826816,
                                        "#fc67fd"
                                    ],
                                    [
                                        0.8044692737430168,
                                        "#fe88fc"
                                    ],
                                    [
                                        0.8938547486033519,
                                        "#fea5fd"
                                    ],
                                    [
                                        0.9832402234636871,
                                        "#febefe"
                                    ],
                                    [
                                        1,
                                        "#fec3fe"
                                    ]
                                ]
                            },
                            "plot_bgcolor": "white",
                            "paper_bgcolor": "white",
                            "shapedefaults": {
                                "line": {
                                    "width": 0
                                },
                                "opacity": 0.4,
                                "fillcolor": "#506784"
                            },
                            "annotationdefaults": {
                                "arrowhead": 0,
                                "arrowcolor": "#506784",
                                "arrowwidth": 1
                            }
                        },
                        "themeRef": "PLOTLY_WHITE"
                    }
                }
            },
            "height": null,
            "width": null,
            "user": {
                "profile_url": "https://chart-studio.plotly.com/~evaliuu",
                "avatar_url": "https://storage.googleapis.com/plotly-prod-profiles/52.jpg",
                "background_url": "https://storage.googleapis.com/plotly-prod-profiles/bg-9.jpg",
                "bio": "",
                "nickname": "",
                "website": "",
                "stream_tokens": null,
                "feature_set_id": null,
                "csrf_token": null,
                "date_joined": "2023-03-28 14:52:41",
                "mapbox_access_tokens": null,
                "has_password": null,
                "username": "evaliuu",
                "email": null,
                "is_active": null,
                "readonly": null,
                "is_dash_creator": null,
                "dash_created_count": null,
                "is_chart_creator": null,
                "charts_created_count": null
            }
        },
        {
            "creation_time": "2024-03-20T22:43:02.933349Z",
            "comments": {
                "results": [],
                "count": 0
            },
            "parented": true,
            "embed_url": "https://chart-studio.plotly.com/~yosistady/8.embed",
            "fid": "yosistady:8",
            "filename": "plot from API (3)",
            "filetype": "plot",
            "img_url": "https://storage.googleapis.com/plotly-prod-images/yosistady/8/9_5HB3WMY9RF3XC9443HPNFH8N1BVJVR.png",
            "image_urls": {
                "default": "https://storage.googleapis.com/plotly-prod-images/yosistady/8/2_0EFKRBN7TH5YSAWW76FQQ9GF2GTYHP.png",
                "block-thumb": "https://storage.googleapis.com/plotly-prod-images/yosistady/8/8_KGNSEBFONDKZUOZJ3XHZ8RXF2XU8QD.png",
                "list-thumb": "https://storage.googleapis.com/plotly-prod-images/yosistady/8/9_5HB3WMY9RF3XC9443HPNFH8N1BVJVR.png"
            },
            "api_urls": {
                "files": "https://api.plotly.com/v2/files/yosistady:8",
                "plots": "https://api.plotly.com/v2/plots/yosistady:8",
                "parent": "https://api.plotly.com/v2/folders/home?user=yosistady"
            },
            "owner": "yosistady",
            "parent": -1,
            "preview": "",
            "referencers": [],
            "references": [],
            "title": "",
            "views": 2,
            "web_url": "https://chart-studio.plotly.com/~yosistady/8/",
            "world_readable": true,
            "date_modified": "2024-03-20T22:43:03.271Z",
            "stars": {
                "results": [],
                "count": 0
            },
            "collaborators": {
                "results": [],
                "count": 0
            },
            "subfolder_count": null,
            "refresh_interval": null,
            "organize_view_url": "https://chart-studio.plotly.com/~yosistady/8/",
            "current_user_permission": "read",
            "is_theme": null,
            "is_template": null,
            "autosize": true,
            "caption": "",
            "figure": {
                "data": [
                    {
                        "type": "histogram",
                        "xsrc": "yosistady:9:70ad73"
                    }
                ],
                "layout": {}
            },
            "height": null,
            "width": null,
            "user": {
                "profile_url": "https://chart-studio.plotly.com/~yosistady",
                "avatar_url": "https://storage.googleapis.com/plotly-prod-profiles/47.jpg",
                "background_url": "https://storage.googleapis.com/plotly-prod-profiles/bg-1.jpg",
                "bio": "",
                "nickname": "",
                "website": "",
                "stream_tokens": null,
                "feature_set_id": null,
                "csrf_token": null,
                "date_joined": "2024-03-20 18:46:37",
                "mapbox_access_tokens": null,
                "has_password": null,
                "username": "yosistady",
                "email": null,
                "is_active": null,
                "readonly": null,
                "is_dash_creator": null,
                "dash_created_count": null,
                "is_chart_creator": null,
                "charts_created_count": null
            }
        },
        {
            "creation_time": "2024-03-20T22:42:21.679495Z",
            "comments": {
                "results": [],
                "count": 0
            },
            "parented": true,
            "embed_url": "https://chart-studio.plotly.com/~Amsale/108.embed",
            "fid": "Amsale:108",
            "filename": "Plot 108",
            "filetype": "plot",
            "img_url": "https://storage.googleapis.com/plotly-prod-images/Amsale/108/9_8YRVCL3255B2DN1GCQD4FJ5599L3BJ.png",
            "image_urls": {
                "default": "https://storage.googleapis.com/plotly-prod-images/Amsale/108/2_FVM8F7LDJTSU4DJW6SXWG9SFO3D3JE.png",
                "block-thumb": "https://storage.googleapis.com/plotly-prod-images/Amsale/108/8_28DZZAC71H9ND0R942R43EG0CRYK53.png",
                "list-thumb": "https://storage.googleapis.com/plotly-prod-images/Amsale/108/9_8YRVCL3255B2DN1GCQD4FJ5599L3BJ.png"
            },
            "api_urls": {
                "files": "https://api.plotly.com/v2/files/Amsale:108",
                "plots": "https://api.plotly.com/v2/plots/Amsale:108",
                "parent": "https://api.plotly.com/v2/folders/home?user=Amsale"
            },
            "owner": "Amsale",
            "parent": -1,
            "preview": "",
            "referencers": [],
            "references": [],
            "title": "",
            "views": 1,
            "web_url": "https://chart-studio.plotly.com/~Amsale/108/",
            "world_readable": true,
            "date_modified": "2024-03-23T08:38:33.535Z",
            "stars": {
                "results": [],
                "count": 0
            },
            "collaborators": {
                "results": [],
                "count": 0
            },
            "subfolder_count": null,
            "refresh_interval": null,
            "organize_view_url": "https://chart-studio.plotly.com/~Amsale/108/",
            "current_user_permission": "read",
            "is_theme": null,
            "is_template": false,
            "autosize": true,
            "caption": "",
            "figure": {
                "data": [
                    {
                        "meta": {
                            "columnNames": {
                                "x": "A",
                                "y": "B",
                                "marker": {
                                    "color": "B"
                                }
                            }
                        },
                        "mode": "markers",
                        "type": "bar",
                        "xsrc": "Amsale:107:c9df60",
                        "ysrc": "Amsale:107:337205",
                        "marker": {
                            "cmax": 15,
                            "cmin": 1,
                            "meta": {
                                "columnNames": {
                                    "color": "B"
                                }
                            },
                            "cauto": false,
                            "opacity": 1,
                            "colorsrc": "Amsale:107:337205",
                            "showscale": false,
                            "colorscale": [
                                [
                                    0,
                                    "#b3e2cd"
                                ],
                                [
                                    0.14285714285714285,
                                    "#fdcdac"
                                ],
                                [
                                    0.2857142857142857,
                                    "#cbd5e8"
                                ],
                                [
                                    0.42857142857142855,
                                    "#f4cae4"
                                ],
                                [
                                    0.5714285714285714,
                                    "#e6f5c9"
                                ],
                                [
                                    0.7142857142857143,
                                    "#fff2ae"
                                ],
                                [
                                    0.8571428571428571,
                                    "#f1e2cc"
                                ],
                                [
                                    1,
                                    "#cccccc"
                                ]
                            ],
                            "reversescale": false
                        },
                        "orientation": "v",
                        "autocolorscale": false
                    }
                ],
                "frames": [],
                "layout": {
                    "font": {
                        "size": 20,
                        "color": "rgb(21, 1, 1)",
                        "family": "Times New Roman"
                    },
                    "title": {
                        "x": 0.02,
                        "font": {
                            "size": 20
                        },
                        "text": "(B)"
                    },
                    "xaxis": {
                        "type": "category",
                        "range": [
                            -0.5,
                            9.5
                        ],
                        "title": {
                            "font": {
                                "color": "rgb(15, 0, 0)",
                                "family": "Times New Roman"
                            },
                            "text": "<br><br>\nPhylum composition<b><br>\n</b>Figure 2<br>\n<br>"
                        },
                        "showgrid": false,
                        "showline": false,
                        "zeroline": false,
                        "autorange": false,
                        "tickangle": "auto",
                        "zerolinewidth": 1
                    },
                    "yaxis": {
                        "type": "linear",
                        "dtick": 5,
                        "range": [
                            0,
                            20.5555
                        ],
                        "title": {
                            "text": "Number of sequences"
                        },
                        "nticks": 10.5,
                        "showgrid": false,
                        "showline": false,
                        "tickmode": "linear",
                        "zeroline": false,
                        "autorange": false,
                        "gridwidth": 1,
                        "zerolinecolor": "rgb(225, 221, 221)",
                        "zerolinewidth": 0
                    },
                    "bargap": 0.5,
                    "margin": {
                        "b": 210,
                        "t": 50
                    },
                    "modebar": {
                        "color": "rgba(252, 243, 243, 0.3)",
                        "activecolor": "rgba(241, 235, 235, 0.7)",
                        "orientation": "v"
                    },
                    "autosize": true,
                    "colorway": [
                        "#b3e2cd",
                        "#fdcdac",
                        "#cbd5e8",
                        "#f4cae4",
                        "#e6f5c9",
                        "#fff2ae",
                        "#f1e2cc",
                        "#cccccc"
                    ],
                    "dragmode": "select",
                    "colorscale": {
                        "diverging": [
                            [
                                0,
                                "#9e0142"
                            ],
                            [
                                0.1,
                                "#d53e4f"
                            ],
                            [
                                0.2,
                                "#f46d43"
                            ],
                            [
                                0.3,
                                "#fdae61"
                            ],
                            [
                                0.4,
                                "#fee08b"
                            ],
                            [
                                0.5,
                                "#ffffbf"
                            ],
                            [
                                0.6,
                                "#e6f598"
                            ],
                            [
                                0.7,
                                "#abdda4"
                            ],
                            [
                                0.8,
                                "#66c2a5"
                            ],
                            [
                                0.9,
                                "#3288bd"
                            ],
                            [
                                1,
                                "#5e4fa2"
                            ]
                        ]
                    },
                    "hoverlabel": {
                        "font": {
                            "size": 13
                        }
                    },
                    "bargroupgap": 0
                }
            },
            "height": null,
            "width": null,
            "user": {
                "profile_url": "https://chart-studio.plotly.com/~Amsale",
                "avatar_url": "https://storage.googleapis.com/plotly-prod-profiles/7.jpg",
                "background_url": "https://storage.googleapis.com/plotly-prod-profiles/bg-8.jpg",
                "bio": "",
                "nickname": "",
                "website": "",
                "stream_tokens": null,
                "feature_set_id": null,
                "csrf_token": null,
                "date_joined": "2023-03-10 17:24:16",
                "mapbox_access_tokens": null,
                "has_password": null,
                "username": "Amsale",
                "email": null,
                "is_active": null,
                "readonly": null,
                "is_dash_creator": null,
                "dash_created_count": null,
                "is_chart_creator": null,
                "charts_created_count": null
            }
        },
        {
            "creation_time": "2024-03-20T22:41:51.994051Z",
            "comments": {
                "results": [],
                "count": 0
            },
            "parented": true,
            "embed_url": "https://chart-studio.plotly.com/~yosistady/6.embed",
            "fid": "yosistady:6",
            "filename": "plot from API (2)",
            "filetype": "plot",
            "img_url": "https://storage.googleapis.com/plotly-prod-images/yosistady/6/9_H9MYLTXEY4GFHLT0EK4DMA44HUTEHB.png",
            "image_urls": {
                "default": "https://storage.googleapis.com/plotly-prod-images/yosistady/6/2_5CZ5T6TN3LMC3R2N7YOW79JIL5V32X.png",
                "block-thumb": "https://storage.googleapis.com/plotly-prod-images/yosistady/6/8_D29L5XNKF01735C320CJ7HUL6PRI5U.png",
                "list-thumb": "https://storage.googleapis.com/plotly-prod-images/yosistady/6/9_H9MYLTXEY4GFHLT0EK4DMA44HUTEHB.png"
            },
            "api_urls": {
                "files": "https://api.plotly.com/v2/files/yosistady:6",
                "plots": "https://api.plotly.com/v2/plots/yosistady:6",
                "parent": "https://api.plotly.com/v2/folders/home?user=yosistady"
            },
            "owner": "yosistady",
            "parent": -1,
            "preview": "",
            "referencers": [],
            "references": [],
            "title": "",
            "views": 2,
            "web_url": "https://chart-studio.plotly.com/~yosistady/6/",
            "world_readable": true,
            "date_modified": "2024-03-20T22:41:52.302Z",
            "stars": {
                "results": [],
                "count": 0
            },
            "collaborators": {
                "results": [],
                "count": 0
            },
            "subfolder_count": null,
            "refresh_interval": null,
            "organize_view_url": "https://chart-studio.plotly.com/~yosistady/6/",
            "current_user_permission": "read",
            "is_theme": null,
            "is_template": null,
            "autosize": true,
            "caption": "",
            "figure": {
                "data": [
                    {
                        "type": "histogram",
                        "xsrc": "yosistady:7:45786d"
                    }
                ],
                "layout": {}
            },
            "height": null,
            "width": null,
            "user": {
                "profile_url": "https://chart-studio.plotly.com/~yosistady",
                "avatar_url": "https://storage.googleapis.com/plotly-prod-profiles/47.jpg",
                "background_url": "https://storage.googleapis.com/plotly-prod-profiles/bg-1.jpg",
                "bio": "",
                "nickname": "",
                "website": "",
                "stream_tokens": null,
                "feature_set_id": null,
                "csrf_token": null,
                "date_joined": "2024-03-20 18:46:37",
                "mapbox_access_tokens": null,
                "has_password": null,
                "username": "yosistady",
                "email": null,
                "is_active": null,
                "readonly": null,
                "is_dash_creator": null,
                "dash_created_count": null,
                "is_chart_creator": null,
                "charts_created_count": null
            }
        },
        {
            "creation_time": "2024-03-20T22:37:56.516586Z",
            "comments": {
                "results": [],
                "count": 0
            },
            "parented": true,
            "embed_url": "https://chart-studio.plotly.com/~yosistady/4.embed",
            "fid": "yosistady:4",
            "filename": "plot from API (1)",
            "filetype": "plot",
            "img_url": "https://storage.googleapis.com/plotly-prod-images/yosistady/4/9_FSOTELL8TAUHPB88VDSTNKYA7XETFA.png",
            "image_urls": {
                "default": "https://storage.googleapis.com/plotly-prod-images/yosistady/4/2_MD8U51ITOKDQYD0WO4VHUSUCDV8OOD.png",
                "block-thumb": "https://storage.googleapis.com/plotly-prod-images/yosistady/4/8_V9K5IF94852OEHFD4TBRL2PJBRJXPD.png",
                "list-thumb": "https://storage.googleapis.com/plotly-prod-images/yosistady/4/9_FSOTELL8TAUHPB88VDSTNKYA7XETFA.png"
            },
            "api_urls": {
                "files": "https://api.plotly.com/v2/files/yosistady:4",
                "plots": "https://api.plotly.com/v2/plots/yosistady:4",
                "parent": "https://api.plotly.com/v2/folders/home?user=yosistady"
            },
            "owner": "yosistady",
            "parent": -1,
            "preview": "",
            "referencers": [],
            "references": [],
            "title": "",
            "views": 2,
            "web_url": "https://chart-studio.plotly.com/~yosistady/4/",
            "world_readable": true,
            "date_modified": "2024-03-20T22:37:56.837Z",
            "stars": {
                "results": [],
                "count": 0
            },
            "collaborators": {
                "results": [],
                "count": 0
            },
            "subfolder_count": null,
            "refresh_interval": null,
            "organize_view_url": "https://chart-studio.plotly.com/~yosistady/4/",
            "current_user_permission": "read",
            "is_theme": null,
            "is_template": null,
            "autosize": true,
            "caption": "",
            "figure": {
                "data": [
                    {
                        "type": "histogram",
                        "xsrc": "yosistady:5:2bc6c6"
                    }
                ],
                "layout": {}
            },
            "height": null,
            "width": null,
            "user": {
                "profile_url": "https://chart-studio.plotly.com/~yosistady",
                "avatar_url": "https://storage.googleapis.com/plotly-prod-profiles/47.jpg",
                "background_url": "https://storage.googleapis.com/plotly-prod-profiles/bg-1.jpg",
                "bio": "",
                "nickname": "",
                "website": "",
                "stream_tokens": null,
                "feature_set_id": null,
                "csrf_token": null,
                "date_joined": "2024-03-20 18:46:37",
                "mapbox_access_tokens": null,
                "has_password": null,
                "username": "yosistady",
                "email": null,
                "is_active": null,
                "readonly": null,
                "is_dash_creator": null,
                "dash_created_count": null,
                "is_chart_creator": null,
                "charts_created_count": null
            }
        },
        {
            "creation_time": "2024-03-20T22:37:06.465196Z",
            "comments": {
                "results": [],
                "count": 0
            },
            "parented": true,
            "embed_url": "https://chart-studio.plotly.com/~yosistady/2.embed",
            "fid": "yosistady:2",
            "filename": "plot from API",
            "filetype": "plot",
            "img_url": "https://storage.googleapis.com/plotly-prod-images/yosistady/2/9_6FEXFUXHN2EU9U6RSXP4IBQA7RGS5P.png",
            "image_urls": {
                "default": "https://storage.googleapis.com/plotly-prod-images/yosistady/2/2_PLRK10MTJ7ZX291JJRYBSTMPMG9W89.png",
                "block-thumb": "https://storage.googleapis.com/plotly-prod-images/yosistady/2/8_8UT0ZITHWBU5TUA8LGNVQ7M00TWHTR.png",
                "list-thumb": "https://storage.googleapis.com/plotly-prod-images/yosistady/2/9_6FEXFUXHN2EU9U6RSXP4IBQA7RGS5P.png"
            },
            "api_urls": {
                "files": "https://api.plotly.com/v2/files/yosistady:2",
                "plots": "https://api.plotly.com/v2/plots/yosistady:2",
                "parent": "https://api.plotly.com/v2/folders/home?user=yosistady"
            },
            "owner": "yosistady",
            "parent": -1,
            "preview": "",
            "referencers": [],
            "references": [],
            "title": "",
            "views": 2,
            "web_url": "https://chart-studio.plotly.com/~yosistady/2/",
            "world_readable": true,
            "date_modified": "2024-03-20T22:37:06.877Z",
            "stars": {
                "results": [],
                "count": 0
            },
            "collaborators": {
                "results": [],
                "count": 0
            },
            "subfolder_count": null,
            "refresh_interval": null,
            "organize_view_url": "https://chart-studio.plotly.com/~yosistady/2/",
            "current_user_permission": "read",
            "is_theme": null,
            "is_template": null,
            "autosize": true,
            "caption": "",
            "figure": {
                "data": [
                    {
                        "type": "histogram",
                        "xsrc": "yosistady:3:ca9a51"
                    }
                ],
                "layout": {}
            },
            "height": null,
            "width": null,
            "user": {
                "profile_url": "https://chart-studio.plotly.com/~yosistady",
                "avatar_url": "https://storage.googleapis.com/plotly-prod-profiles/47.jpg",
                "background_url": "https://storage.googleapis.com/plotly-prod-profiles/bg-1.jpg",
                "bio": "",
                "nickname": "",
                "website": "",
                "stream_tokens": null,
                "feature_set_id": null,
                "csrf_token": null,
                "date_joined": "2024-03-20 18:46:37",
                "mapbox_access_tokens": null,
                "has_password": null,
                "username": "yosistady",
                "email": null,
                "is_active": null,
                "readonly": null,
                "is_dash_creator": null,
                "dash_created_count": null,
                "is_chart_creator": null,
                "charts_created_count": null
            }
        },
        {
            "creation_time": "2024-03-20T22:23:46.097975Z",
            "comments": {
                "results": [],
                "count": 0
            },
            "parented": true,
            "embed_url": "https://chart-studio.plotly.com/~ameenu.aneesah/1.embed",
            "fid": "ameenu.aneesah:1",
            "filename": "Plot 1",
            "filetype": "plot",
            "img_url": "https://storage.googleapis.com/plotly-prod-images/ameenu.aneesah/1/9_4I4TDTXW8MKRINX8H3T8XPLVOE4QDK.png",
            "image_urls": {
                "default": "https://storage.googleapis.com/plotly-prod-images/ameenu.aneesah/1/2_SYM30CO5NJ78AWC9VKFXEWYJPS0YYK.png",
                "block-thumb": "https://storage.googleapis.com/plotly-prod-images/ameenu.aneesah/1/8_N0X6WDZT5MKH6G3MH42CAUZLX51WDB.png",
                "list-thumb": "https://storage.googleapis.com/plotly-prod-images/ameenu.aneesah/1/9_4I4TDTXW8MKRINX8H3T8XPLVOE4QDK.png"
            },
            "api_urls": {
                "files": "https://api.plotly.com/v2/files/ameenu.aneesah:1",
                "plots": "https://api.plotly.com/v2/plots/ameenu.aneesah:1",
                "parent": "https://api.plotly.com/v2/folders/home?user=ameenu.aneesah"
            },
            "owner": "ameenu.aneesah",
            "parent": -1,
            "preview": "",
            "referencers": [],
            "references": [],
            "title": "",
            "views": 1,
            "web_url": "https://chart-studio.plotly.com/~ameenu.aneesah/1/",
            "world_readable": true,
            "date_modified": "2024-03-20T22:23:46.113Z",
            "stars": {
                "results": [],
                "count": 0
            },
            "collaborators": {
                "results": [],
                "count": 0
            },
            "subfolder_count": null,
            "refresh_interval": null,
            "organize_view_url": "https://chart-studio.plotly.com/~ameenu.aneesah/1/",
            "current_user_permission": "read",
            "is_theme": null,
            "is_template": false,
            "autosize": true,
            "caption": "",
            "figure": {
                "data": [
                    {
                        "meta": {
                            "columnNames": {
                                "x": "B",
                                "y": "A"
                            }
                        },
                        "mode": "lines",
                        "name": "R1",
                        "type": "scatter",
                        "xsrc": "ameenu.aneesah:0:7c3d94",
                        "ysrc": "ameenu.aneesah:0:ad98f6"
                    },
                    {
                        "meta": {
                            "columnNames": {
                                "x": "C",
                                "y": "A"
                            }
                        },
                        "mode": "lines",
                        "name": "R2",
                        "type": "scatter",
                        "xsrc": "ameenu.aneesah:0:fd8cf2",
                        "ysrc": "ameenu.aneesah:0:ad98f6",
                        "stackgroup": null
                    },
                    {
                        "meta": {
                            "columnNames": {
                                "x": "D",
                                "y": "A"
                            }
                        },
                        "mode": "lines",
                        "name": "R3",
                        "type": "scatter",
                        "xsrc": "ameenu.aneesah:0:0cddbd",
                        "ysrc": "ameenu.aneesah:0:ad98f6",
                        "stackgroup": null
                    },
                    {
                        "meta": {
                            "columnNames": {
                                "x": "E",
                                "y": "A"
                            }
                        },
                        "mode": "lines",
                        "name": "Bu;b",
                        "type": "scatter",
                        "xsrc": "ameenu.aneesah:0:09ac19",
                        "ysrc": "ameenu.aneesah:0:ad98f6",
                        "stackgroup": null
                    }
                ],
                "frames": [],
                "layout": {
                    "title": {
                        "text": "Graph of Voltage against Current"
                    },
                    "xaxis": {
                        "type": "linear",
                        "range": [
                            0,
                            0.13
                        ],
                        "title": {
                            "text": "Current (A)"
                        },
                        "autorange": true
                    },
                    "yaxis": {
                        "type": "linear",
                        "range": [
                            -0.16666666666666669,
                            3.1666666666666665
                        ],
                        "title": {
                            "text": "Voltage (V)"
                        },
                        "autorange": true
                    },
                    "autosize": true,
                    "template": {
                        "data": {
                            "bar": [
                                {
                                    "type": "bar",
                                    "marker": {
                                        "colorbar": {
                                            "ticks": "",
                                            "outlinewidth": 0
                                        }
                                    }
                                }
                            ],
                            "table": [
                                {
                                    "type": "table",
                                    "cells": {
                                        "fill": {
                                            "color": "#EBF0F8"
                                        },
                                        "line": {
                                            "color": "white"
                                        }
                                    },
                                    "header": {
                                        "fill": {
                                            "color": "#C8D4E3"
                                        },
                                        "line": {
                                            "color": "white"
                                        }
                                    }
                                }
                            ],
                            "carpet": [
                                {
                                    "type": "carpet",
                                    "aaxis": {
                                        "gridcolor": "#C8D4E3",
                                        "linecolor": "#C8D4E3",
                                        "endlinecolor": "#2a3f5f",
                                        "minorgridcolor": "#C8D4E3",
                                        "startlinecolor": "#2a3f5f"
                                    },
                                    "baxis": {
                                        "gridcolor": "#C8D4E3",
                                        "linecolor": "#C8D4E3",
                                        "endlinecolor": "#2a3f5f",
                                        "minorgridcolor": "#C8D4E3",
                                        "startlinecolor": "#2a3f5f"
                                    }
                                }
                            ],
                            "mesh3d": [
                                {
                                    "type": "mesh3d",
                                    "colorbar": {
                                        "ticks": "",
                                        "outlinewidth": 0
                                    }
                                }
                            ],
                            "contour": [
                                {
                                    "type": "contour",
                                    "colorbar": {
                                        "ticks": "",
                                        "outlinewidth": 0
                                    },
                                    "autocolorscale": true
                                }
                            ],
                            "heatmap": [
                                {
                                    "type": "heatmap",
                                    "colorbar": {
                                        "ticks": "",
                                        "outlinewidth": 0
                                    },
                                    "autocolorscale": true
                                }
                            ],
                            "scatter": [
                                {
                                    "type": "scatter",
                                    "marker": {
                                        "colorbar": {
                                            "ticks": "",
                                            "outlinewidth": 0
                                        }
                                    }
                                }
                            ],
                            "surface": [
                                {
                                    "type": "surface",
                                    "colorbar": {
                                        "ticks": "",
                                        "outlinewidth": 0
                                    }
                                }
                            ],
                            "heatmapgl": [
                                {
                                    "type": "heatmapgl",
                                    "colorbar": {
                                        "ticks": "",
                                        "outlinewidth": 0
                                    }
                                }
                            ],
                            "histogram": [
                                {
                                    "type": "histogram",
                                    "marker": {
                                        "colorbar": {
                                            "ticks": "",
                                            "outlinewidth": 0
                                        }
                                    }
                                }
                            ],
                            "parcoords": [
                                {
                                    "line": {
                                        "colorbar": {
                                            "ticks": "",
                                            "outlinewidth": 0
                                        }
                                    },
                                    "type": "parcoords"
                                }
                            ],
                            "scatter3d": [
                                {
                                    "type": "scatter3d",
                                    "marker": {
                                        "colorbar": {
                                            "ticks": "",
                                            "outlinewidth": 0
                                        }
                                    }
                                }
                            ],
                            "scattergl": [
                                {
                                    "type": "scattergl",
                                    "marker": {
                                        "colorbar": {
                                            "ticks": "",
                                            "outlinewidth": 0
                                        }
                                    }
                                }
                            ],
                            "choropleth": [
                                {
                                    "type": "choropleth",
                                    "colorbar": {
                                        "ticks": "",
                                        "outlinewidth": 0
                                    }
                                }
                            ],
                            "scattergeo": [
                                {
                                    "type": "scattergeo",
                                    "marker": {
                                        "colorbar": {
                                            "ticks": "",
                                            "outlinewidth": 0
                                        }
                                    }
                                }
                            ],
                            "histogram2d": [
                                {
                                    "type": "histogram2d",
                                    "colorbar": {
                                        "ticks": "",
                                        "outlinewidth": 0
                                    },
                                    "autocolorscale": true
                                }
                            ],
                            "scatterpolar": [
                                {
                                    "type": "scatterpolar",
                                    "marker": {
                                        "colorbar": {
                                            "ticks": "",
                                            "outlinewidth": 0
                                        }
                                    }
                                }
                            ],
                            "contourcarpet": [
                                {
                                    "type": "contourcarpet",
                                    "colorbar": {
                                        "ticks": "",
                                        "outlinewidth": 0
                                    }
                                }
                            ],
                            "scattercarpet": [
                                {
                                    "type": "scattercarpet",
                                    "marker": {
                                        "colorbar": {
                                            "ticks": "",
                                            "outlinewidth": 0
                                        }
                                    }
                                }
                            ],
                            "scattermapbox": [
                                {
                                    "type": "scattermapbox",
                                    "marker": {
                                        "colorbar": {
                                            "ticks": "",
                                            "outlinewidth": 0
                                        }
                                    }
                                }
                            ],
                            "scatterpolargl": [
                                {
                                    "type": "scatterpolargl",
                                    "marker": {
                                        "colorbar": {
                                            "ticks": "",
                                            "outlinewidth": 0
                                        }
                                    }
                                }
                            ],
                            "scatterternary": [
                                {
                                    "type": "scatterternary",
                                    "marker": {
                                        "colorbar": {
                                            "ticks": "",
                                            "outlinewidth": 0
                                        }
                                    }
                                }
                            ],
                            "histogram2dcontour": [
                                {
                                    "type": "histogram2dcontour",
                                    "colorbar": {
                                        "ticks": "",
                                        "outlinewidth": 0
                                    },
                                    "autocolorscale": true
                                }
                            ]
                        },
                        "layout": {
                            "geo": {
                                "bgcolor": "white",
                                "showland": true,
                                "lakecolor": "white",
                                "landcolor": "white",
                                "showlakes": true,
                                "subunitcolor": "#C8D4E3"
                            },
                            "font": {
                                "color": "#2a3f5f"
                            },
                            "polar": {
                                "bgcolor": "white",
                                "radialaxis": {
                                    "ticks": "",
                                    "gridcolor": "#EBF0F8",
                                    "linecolor": "#EBF0F8"
                                },
                                "angularaxis": {
                                    "ticks": "",
                                    "gridcolor": "#EBF0F8",
                                    "linecolor": "#EBF0F8"
                                }
                            },
                            "scene": {
                                "xaxis": {
                                    "ticks": "",
                                    "gridcolor": "#DFE8F3",
                                    "gridwidth": 2,
                                    "linecolor": "#EBF0F8",
                                    "zerolinecolor": "#EBF0F8",
                                    "showbackground": true,
                                    "backgroundcolor": "white"
                                },
                                "yaxis": {
                                    "ticks": "",
                                    "gridcolor": "#DFE8F3",
                                    "gridwidth": 2,
                                    "linecolor": "#EBF0F8",
                                    "zerolinecolor": "#EBF0F8",
                                    "showbackground": true,
                                    "backgroundcolor": "white"
                                },
                                "zaxis": {
                                    "ticks": "",
                                    "gridcolor": "#DFE8F3",
                                    "gridwidth": 2,
                                    "linecolor": "#EBF0F8",
                                    "zerolinecolor": "#EBF0F8",
                                    "showbackground": true,
                                    "backgroundcolor": "white"
                                }
                            },
                            "title": {
                                "x": 0.05
                            },
                            "xaxis": {
                                "ticks": "",
                                "gridcolor": "#EBF0F8",
                                "linecolor": "#EBF0F8",
                                "automargin": true,
                                "zerolinecolor": "#EBF0F8",
                                "zerolinewidth": 2
                            },
                            "yaxis": {
                                "ticks": "",
                                "gridcolor": "#EBF0F8",
                                "linecolor": "#EBF0F8",
                                "automargin": true,
                                "zerolinecolor": "#EBF0F8",
                                "zerolinewidth": 2
                            },
                            "ternary": {
                                "aaxis": {
                                    "ticks": "",
                                    "gridcolor": "#DFE8F3",
                                    "linecolor": "#A2B1C6"
                                },
                                "baxis": {
                                    "ticks": "",
                                    "gridcolor": "#DFE8F3",
                                    "linecolor": "#A2B1C6"
                                },
                                "caxis": {
                                    "ticks": "",
                                    "gridcolor": "#DFE8F3",
                                    "linecolor": "#A2B1C6"
                                },
                                "bgcolor": "white"
                            },
                            "colorway": [
                                "#636efa",
                                "#EF553B",
                                "#00cc96",
                                "#ab63fa",
                                "#19d3f3",
                                "#e763fa",
                                "#fecb52",
                                "#ffa15a",
                                "#ff6692",
                                "#b6e880"
                            ],
                            "hovermode": "closest",
                            "colorscale": {
                                "diverging": [
                                    [
                                        0,
                                        "#8e0152"
                                    ],
                                    [
                                        0.1,
                                        "#c51b7d"
                                    ],
                                    [
                                        0.2,
                                        "#de77ae"
                                    ],
                                    [
                                        0.3,
                                        "#f1b6da"
                                    ],
                                    [
                                        0.4,
                                        "#fde0ef"
                                    ],
                                    [
                                        0.5,
                                        "#f7f7f7"
                                    ],
                                    [
                                        0.6,
                                        "#e6f5d0"
                                    ],
                                    [
                                        0.7,
                                        "#b8e186"
                                    ],
                                    [
                                        0.8,
                                        "#7fbc41"
                                    ],
                                    [
                                        0.9,
                                        "#4d9221"
                                    ],
                                    [
                                        1,
                                        "#276419"
                                    ]
                                ],
                                "sequential": [
                                    [
                                        0,
                                        "#0508b8"
                                    ],
                                    [
                                        0.0893854748603352,
                                        "#1910d8"
                                    ],
                                    [
                                        0.1787709497206704,
                                        "#3c19f0"
                                    ],
                                    [
                                        0.2681564245810056,
                                        "#6b1cfb"
                                    ],
                                    [
                                        0.3575418994413408,
                                        "#981cfd"
                                    ],
                                    [
                                        0.44692737430167595,
                                        "#bf1cfd"
                                    ],
                                    [
                                        0.5363128491620112,
                                        "#dd2bfd"
                                    ],
                                    [
                                        0.6256983240223464,
                                        "#f246fe"
                                    ],
                                    [
                                        0.7150837988826816,
                                        "#fc67fd"
                                    ],
                                    [
                                        0.8044692737430168,
                                        "#fe88fc"
                                    ],
                                    [
                                        0.8938547486033519,
                                        "#fea5fd"
                                    ],
                                    [
                                        0.9832402234636871,
                                        "#febefe"
                                    ],
                                    [
                                        1,
                                        "#fec3fe"
                                    ]
                                ],
                                "sequentialminus": [
                                    [
                                        0,
                                        "#0508b8"
                                    ],
                                    [
                                        0.0893854748603352,
                                        "#1910d8"
                                    ],
                                    [
                                        0.1787709497206704,
                                        "#3c19f0"
                                    ],
                                    [
                                        0.2681564245810056,
                                        "#6b1cfb"
                                    ],
                                    [
                                        0.3575418994413408,
                                        "#981cfd"
                                    ],
                                    [
                                        0.44692737430167595,
                                        "#bf1cfd"
                                    ],
                                    [
                                        0.5363128491620112,
                                        "#dd2bfd"
                                    ],
                                    [
                                        0.6256983240223464,
                                        "#f246fe"
                                    ],
                                    [
                                        0.7150837988826816,
                                        "#fc67fd"
                                    ],
                                    [
                                        0.8044692737430168,
                                        "#fe88fc"
                                    ],
                                    [
                                        0.8938547486033519,
                                        "#fea5fd"
                                    ],
                                    [
                                        0.9832402234636871,
                                        "#febefe"
                                    ],
                                    [
                                        1,
                                        "#fec3fe"
                                    ]
                                ]
                            },
                            "plot_bgcolor": "white",
                            "paper_bgcolor": "white",
                            "shapedefaults": {
                                "line": {
                                    "width": 0
                                },
                                "opacity": 0.4,
                                "fillcolor": "#506784"
                            },
                            "annotationdefaults": {
                                "arrowhead": 0,
                                "arrowcolor": "#506784",
                                "arrowwidth": 1
                            }
                        },
                        "themeRef": "PLOTLY_WHITE"
                    }
                }
            },
            "height": null,
            "width": null,
            "user": {
                "profile_url": "https://chart-studio.plotly.com/~ameenu.aneesah",
                "avatar_url": "https://storage.googleapis.com/plotly-prod-profiles/12.jpg",
                "background_url": "https://storage.googleapis.com/plotly-prod-profiles/bg-5.jpg",
                "bio": "",
                "nickname": "",
                "website": "",
                "stream_tokens": null,
                "feature_set_id": null,
                "csrf_token": null,
                "date_joined": "2024-03-20 22:21:07",
                "mapbox_access_tokens": null,
                "has_password": null,
                "username": "ameenu.aneesah",
                "email": null,
                "is_active": null,
                "readonly": null,
                "is_dash_creator": null,
                "dash_created_count": null,
                "is_chart_creator": null,
                "charts_created_count": null
            }
        },
        {
            "creation_time": "2024-03-20T22:20:54.940308Z",
            "comments": {
                "results": [],
                "count": 0
            },
            "parented": true,
            "embed_url": "https://chart-studio.plotly.com/~lKOREAl/2.embed",
            "fid": "lKOREAl:2",
            "filename": "Plot 2",
            "filetype": "plot",
            "img_url": "https://storage.googleapis.com/plotly-prod-images/lKOREAl/2/9_HJFPYE68KO0NE2617V2UY4EWWUVB11.png",
            "image_urls": {
                "default": "https://storage.googleapis.com/plotly-prod-images/lKOREAl/2/2_0DZQOQEK8KYAXC5G8FPZDMBRU279LY.png",
                "block-thumb": "https://storage.googleapis.com/plotly-prod-images/lKOREAl/2/8_DQJF6IU8CPS2OAKTKMQHX3U0O1OVW0.png",
                "list-thumb": "https://storage.googleapis.com/plotly-prod-images/lKOREAl/2/9_HJFPYE68KO0NE2617V2UY4EWWUVB11.png"
            },
            "api_urls": {
                "files": "https://api.plotly.com/v2/files/lKOREAl:2",
                "plots": "https://api.plotly.com/v2/plots/lKOREAl:2",
                "parent": "https://api.plotly.com/v2/folders/home?user=lKOREAl"
            },
            "owner": "lKOREAl",
            "parent": -1,
            "preview": "",
            "referencers": [],
            "references": [],
            "title": "",
            "views": 1,
            "web_url": "https://chart-studio.plotly.com/~lKOREAl/2/",
            "world_readable": true,
            "date_modified": "2024-03-20T22:55:11.244Z",
            "stars": {
                "results": [],
                "count": 0
            },
            "collaborators": {
                "results": [],
                "count": 0
            },
            "subfolder_count": null,
            "refresh_interval": null,
            "organize_view_url": "https://chart-studio.plotly.com/~lKOREAl/2/",
            "current_user_permission": "read",
            "is_theme": null,
            "is_template": false,
            "autosize": true,
            "caption": "",
            "figure": {
                "data": [
                    {
                        "mode": "markers",
                        "type": "scatter"
                    },
                    {
                        "meta": {
                            "columnNames": {
                                "x": "A",
                                "y": "B"
                            }
                        },
                        "mode": "lines",
                        "type": "scatter",
                        "xsrc": "lKOREAl:0:d49cfe",
                        "ysrc": "lKOREAl:0:d441e9"
                    }
                ],
                "frames": [],
                "layout": {
                    "title": {
                        "text": "Particular Matter 2.5 In Mammoth Cave National Park"
                    },
                    "xaxis": {
                        "type": "category",
                        "range": [
                            0,
                            87
                        ],
                        "title": {
                            "text": "TIME"
                        },
                        "autorange": true
                    },
                    "yaxis": {
                        "type": "linear",
                        "range": [
                            -3.3888888888888884,
                            104.38888888888889
                        ],
                        "title": {
                            "text": "PM 2.5 (μm)"
                        },
                        "autorange": true
                    },
                    "autosize": true,
                    "dragmode": "pan",
                    "template": {
                        "data": {
                            "bar": [
                                {
                                    "type": "bar",
                                    "marker": {
                                        "colorbar": {
                                            "ticks": "",
                                            "outlinewidth": 0
                                        }
                                    }
                                }
                            ],
                            "table": [
                                {
                                    "type": "table",
                                    "cells": {
                                        "fill": {
                                            "color": "#EBF0F8"
                                        },
                                        "line": {
                                            "color": "white"
                                        }
                                    },
                                    "header": {
                                        "fill": {
                                            "color": "#C8D4E3"
                                        },
                                        "line": {
                                            "color": "white"
                                        }
                                    }
                                }
                            ],
                            "carpet": [
                                {
                                    "type": "carpet",
                                    "aaxis": {
                                        "gridcolor": "#C8D4E3",
                                        "linecolor": "#C8D4E3",
                                        "endlinecolor": "#2a3f5f",
                                        "minorgridcolor": "#C8D4E3",
                                        "startlinecolor": "#2a3f5f"
                                    },
                                    "baxis": {
                                        "gridcolor": "#C8D4E3",
                                        "linecolor": "#C8D4E3",
                                        "endlinecolor": "#2a3f5f",
                                        "minorgridcolor": "#C8D4E3",
                                        "startlinecolor": "#2a3f5f"
                                    }
                                }
                            ],
                            "mesh3d": [
                                {
                                    "type": "mesh3d",
                                    "colorbar": {
                                        "ticks": "",
                                        "outlinewidth": 0
                                    }
                                }
                            ],
                            "contour": [
                                {
                                    "type": "contour",
                                    "colorbar": {
                                        "ticks": "",
                                        "outlinewidth": 0
                                    },
                                    "autocolorscale": true
                                }
                            ],
                            "heatmap": [
                                {
                                    "type": "heatmap",
                                    "colorbar": {
                                        "ticks": "",
                                        "outlinewidth": 0
                                    },
                                    "autocolorscale": true
                                }
                            ],
                            "scatter": [
                                {
                                    "type": "scatter",
                                    "marker": {
                                        "colorbar": {
                                            "ticks": "",
                                            "outlinewidth": 0
                                        }
                                    }
                                }
                            ],
                            "surface": [
                                {
                                    "type": "surface",
                                    "colorbar": {
                                        "ticks": "",
                                        "outlinewidth": 0
                                    }
                                }
                            ],
                            "heatmapgl": [
                                {
                                    "type": "heatmapgl",
                                    "colorbar": {
                                        "ticks": "",
                                        "outlinewidth": 0
                                    }
                                }
                            ],
                            "histogram": [
                                {
                                    "type": "histogram",
                                    "marker": {
                                        "colorbar": {
                                            "ticks": "",
                                            "outlinewidth": 0
                                        }
                                    }
                                }
                            ],
                            "parcoords": [
                                {
                                    "line": {
                                        "colorbar": {
                                            "ticks": "",
                                            "outlinewidth": 0
                                        }
                                    },
                                    "type": "parcoords"
                                }
                            ],
                            "scatter3d": [
                                {
                                    "type": "scatter3d",
                                    "marker": {
                                        "colorbar": {
                                            "ticks": "",
                                            "outlinewidth": 0
                                        }
                                    }
                                }
                            ],
                            "scattergl": [
                                {
                                    "type": "scattergl",
                                    "marker": {
                                        "colorbar": {
                                            "ticks": "",
                                            "outlinewidth": 0
                                        }
                                    }
                                }
                            ],
                            "choropleth": [
                                {
                                    "type": "choropleth",
                                    "colorbar": {
                                        "ticks": "",
                                        "outlinewidth": 0
                                    }
                                }
                            ],
                            "scattergeo": [
                                {
                                    "type": "scattergeo",
                                    "marker": {
                                        "colorbar": {
                                            "ticks": "",
                                            "outlinewidth": 0
                                        }
                                    }
                                }
                            ],
                            "histogram2d": [
                                {
                                    "type": "histogram2d",
                                    "colorbar": {
                                        "ticks": "",
                                        "outlinewidth": 0
                                    },
                                    "autocolorscale": true
                                }
                            ],
                            "scatterpolar": [
                                {
                                    "type": "scatterpolar",
                                    "marker": {
                                        "colorbar": {
                                            "ticks": "",
                                            "outlinewidth": 0
                                        }
                                    }
                                }
                            ],
                            "contourcarpet": [
                                {
                                    "type": "contourcarpet",
                                    "colorbar": {
                                        "ticks": "",
                                        "outlinewidth": 0
                                    }
                                }
                            ],
                            "scattercarpet": [
                                {
                                    "type": "scattercarpet",
                                    "marker": {
                                        "colorbar": {
                                            "ticks": "",
                                            "outlinewidth": 0
                                        }
                                    }
                                }
                            ],
                            "scattermapbox": [
                                {
                                    "type": "scattermapbox",
                                    "marker": {
                                        "colorbar": {
                                            "ticks": "",
                                            "outlinewidth": 0
                                        }
                                    }
                                }
                            ],
                            "scatterpolargl": [
                                {
                                    "type": "scatterpolargl",
                                    "marker": {
                                        "colorbar": {
                                            "ticks": "",
                                            "outlinewidth": 0
                                        }
                                    }
                                }
                            ],
                            "scatterternary": [
                                {
                                    "type": "scatterternary",
                                    "marker": {
                                        "colorbar": {
                                            "ticks": "",
                                            "outlinewidth": 0
                                        }
                                    }
                                }
                            ],
                            "histogram2dcontour": [
                                {
                                    "type": "histogram2dcontour",
                                    "colorbar": {
                                        "ticks": "",
                                        "outlinewidth": 0
                                    },
                                    "autocolorscale": true
                                }
                            ]
                        },
                        "layout": {
                            "geo": {
                                "bgcolor": "white",
                                "showland": true,
                                "lakecolor": "white",
                                "landcolor": "white",
                                "showlakes": true,
                                "subunitcolor": "#C8D4E3"
                            },
                            "font": {
                                "color": "#2a3f5f"
                            },
                            "polar": {
                                "bgcolor": "white",
                                "radialaxis": {
                                    "ticks": "",
                                    "gridcolor": "#EBF0F8",
                                    "linecolor": "#EBF0F8"
                                },
                                "angularaxis": {
                                    "ticks": "",
                                    "gridcolor": "#EBF0F8",
                                    "linecolor": "#EBF0F8"
                                }
                            },
                            "scene": {
                                "xaxis": {
                                    "ticks": "",
                                    "gridcolor": "#DFE8F3",
                                    "gridwidth": 2,
                                    "linecolor": "#EBF0F8",
                                    "zerolinecolor": "#EBF0F8",
                                    "showbackground": true,
                                    "backgroundcolor": "white"
                                },
                                "yaxis": {
                                    "ticks": "",
                                    "gridcolor": "#DFE8F3",
                                    "gridwidth": 2,
                                    "linecolor": "#EBF0F8",
                                    "zerolinecolor": "#EBF0F8",
                                    "showbackground": true,
                                    "backgroundcolor": "white"
                                },
                                "zaxis": {
                                    "ticks": "",
                                    "gridcolor": "#DFE8F3",
                                    "gridwidth": 2,
                                    "linecolor": "#EBF0F8",
                                    "zerolinecolor": "#EBF0F8",
                                    "showbackground": true,
                                    "backgroundcolor": "white"
                                }
                            },
                            "title": {
                                "x": 0.05
                            },
                            "xaxis": {
                                "ticks": "",
                                "gridcolor": "#EBF0F8",
                                "linecolor": "#EBF0F8",
                                "automargin": true,
                                "zerolinecolor": "#EBF0F8",
                                "zerolinewidth": 2
                            },
                            "yaxis": {
                                "ticks": "",
                                "gridcolor": "#EBF0F8",
                                "linecolor": "#EBF0F8",
                                "automargin": true,
                                "zerolinecolor": "#EBF0F8",
                                "zerolinewidth": 2
                            },
                            "ternary": {
                                "aaxis": {
                                    "ticks": "",
                                    "gridcolor": "#DFE8F3",
                                    "linecolor": "#A2B1C6"
                                },
                                "baxis": {
                                    "ticks": "",
                                    "gridcolor": "#DFE8F3",
                                    "linecolor": "#A2B1C6"
                                },
                                "caxis": {
                                    "ticks": "",
                                    "gridcolor": "#DFE8F3",
                                    "linecolor": "#A2B1C6"
                                },
                                "bgcolor": "white"
                            },
                            "colorway": [
                                "#636efa",
                                "#EF553B",
                                "#00cc96",
                                "#ab63fa",
                                "#19d3f3",
                                "#e763fa",
                                "#fecb52",
                                "#ffa15a",
                                "#ff6692",
                                "#b6e880"
                            ],
                            "hovermode": "closest",
                            "colorscale": {
                                "diverging": [
                                    [
                                        0,
                                        "#8e0152"
                                    ],
                                    [
                                        0.1,
                                        "#c51b7d"
                                    ],
                                    [
                                        0.2,
                                        "#de77ae"
                                    ],
                                    [
                                        0.3,
                                        "#f1b6da"
                                    ],
                                    [
                                        0.4,
                                        "#fde0ef"
                                    ],
                                    [
                                        0.5,
                                        "#f7f7f7"
                                    ],
                                    [
                                        0.6,
                                        "#e6f5d0"
                                    ],
                                    [
                                        0.7,
                                        "#b8e186"
                                    ],
                                    [
                                        0.8,
                                        "#7fbc41"
                                    ],
                                    [
                                        0.9,
                                        "#4d9221"
                                    ],
                                    [
                                        1,
                                        "#276419"
                                    ]
                                ],
                                "sequential": [
                                    [
                                        0,
                                        "#0508b8"
                                    ],
                                    [
                                        0.0893854748603352,
                                        "#1910d8"
                                    ],
                                    [
                                        0.1787709497206704,
                                        "#3c19f0"
                                    ],
                                    [
                                        0.2681564245810056,
                                        "#6b1cfb"
                                    ],
                                    [
                                        0.3575418994413408,
                                        "#981cfd"
                                    ],
                                    [
                                        0.44692737430167595,
                                        "#bf1cfd"
                                    ],
                                    [
                                        0.5363128491620112,
                                        "#dd2bfd"
                                    ],
                                    [
                                        0.6256983240223464,
                                        "#f246fe"
                                    ],
                                    [
                                        0.7150837988826816,
                                        "#fc67fd"
                                    ],
                                    [
                                        0.8044692737430168,
                                        "#fe88fc"
                                    ],
                                    [
                                        0.8938547486033519,
                                        "#fea5fd"
                                    ],
                                    [
                                        0.9832402234636871,
                                        "#febefe"
                                    ],
                                    [
                                        1,
                                        "#fec3fe"
                                    ]
                                ],
                                "sequentialminus": [
                                    [
                                        0,
                                        "#0508b8"
                                    ],
                                    [
                                        0.0893854748603352,
                                        "#1910d8"
                                    ],
                                    [
                                        0.1787709497206704,
                                        "#3c19f0"
                                    ],
                                    [
                                        0.2681564245810056,
                                        "#6b1cfb"
                                    ],
                                    [
                                        0.3575418994413408,
                                        "#981cfd"
                                    ],
                                    [
                                        0.44692737430167595,
                                        "#bf1cfd"
                                    ],
                                    [
                                        0.5363128491620112,
                                        "#dd2bfd"
                                    ],
                                    [
                                        0.6256983240223464,
                                        "#f246fe"
                                    ],
                                    [
                                        0.7150837988826816,
                                        "#fc67fd"
                                    ],
                                    [
                                        0.8044692737430168,
                                        "#fe88fc"
                                    ],
                                    [
                                        0.8938547486033519,
                                        "#fea5fd"
                                    ],
                                    [
                                        0.9832402234636871,
                                        "#febefe"
                                    ],
                                    [
                                        1,
                                        "#fec3fe"
                                    ]
                                ]
                            },
                            "plot_bgcolor": "white",
                            "paper_bgcolor": "white",
                            "shapedefaults": {
                                "line": {
                                    "width": 0
                                },
                                "opacity": 0.4,
                                "fillcolor": "#506784"
                            },
                            "annotationdefaults": {
                                "arrowhead": 0,
                                "arrowcolor": "#506784",
                                "arrowwidth": 1
                            }
                        },
                        "themeRef": "PLOTLY_WHITE"
                    }
                }
            },
            "height": null,
            "width": null,
            "user": {
                "profile_url": "https://chart-studio.plotly.com/~lKOREAl",
                "avatar_url": "https://storage.googleapis.com/plotly-prod-profiles/70.jpg",
                "background_url": "https://storage.googleapis.com/plotly-prod-profiles/bg-6.jpg",
                "bio": "",
                "nickname": "",
                "website": "",
                "stream_tokens": null,
                "feature_set_id": null,
                "csrf_token": null,
                "date_joined": "2024-03-20 21:22:08",
                "mapbox_access_tokens": null,
                "has_password": null,
                "username": "lKOREAl",
                "email": null,
                "is_active": null,
                "readonly": null,
                "is_dash_creator": null,
                "dash_created_count": null,
                "is_chart_creator": null,
                "charts_created_count": null
            }
        },
        {
            "creation_time": "2024-03-20T22:17:35.400598Z",
            "comments": {
                "results": [],
                "count": 0
            },
            "parented": true,
            "embed_url": "https://chart-studio.plotly.com/~Amsale/106.embed",
            "fid": "Amsale:106",
            "filename": "Plot 106",
            "filetype": "plot",
            "img_url": "https://storage.googleapis.com/plotly-prod-images/Amsale/106/9_L9J4NN7RTAUCUVXWUXL2KUTZOO2IF7.png",
            "image_urls": {
                "default": "https://storage.googleapis.com/plotly-prod-images/Amsale/106/2_QWC1UWLYG98X7J5TIWADTLTWOZX0US.png",
                "block-thumb": "https://storage.googleapis.com/plotly-prod-images/Amsale/106/8_OZD7SNZHVSDWIM8H1VUV1SD25O6M4K.png",
                "list-thumb": "https://storage.googleapis.com/plotly-prod-images/Amsale/106/9_L9J4NN7RTAUCUVXWUXL2KUTZOO2IF7.png"
            },
            "api_urls": {
                "files": "https://api.plotly.com/v2/files/Amsale:106",
                "plots": "https://api.plotly.com/v2/plots/Amsale:106",
                "parent": "https://api.plotly.com/v2/folders/home?user=Amsale"
            },
            "owner": "Amsale",
            "parent": -1,
            "preview": "",
            "referencers": [],
            "references": [],
            "title": "",
            "views": 1,
            "web_url": "https://chart-studio.plotly.com/~Amsale/106/",
            "world_readable": true,
            "date_modified": "2024-03-23T08:20:13.259Z",
            "stars": {
                "results": [],
                "count": 0
            },
            "collaborators": {
                "results": [],
                "count": 0
            },
            "subfolder_count": null,
            "refresh_interval": null,
            "organize_view_url": "https://chart-studio.plotly.com/~Amsale/106/",
            "current_user_permission": "read",
            "is_theme": null,
            "is_template": false,
            "autosize": true,
            "caption": "",
            "figure": {
                "data": [
                    {
                        "meta": {
                            "columnNames": {
                                "x": "A",
                                "y": "B",
                                "marker": {
                                    "color": "B"
                                }
                            }
                        },
                        "mode": "markers",
                        "type": "bar",
                        "xsrc": "Amsale:105:636643",
                        "ysrc": "Amsale:105:c16aea",
                        "marker": {
                            "cmax": 15,
                            "cmin": 1,
                            "meta": {
                                "columnNames": {
                                    "color": "B"
                                }
                            },
                            "cauto": false,
                            "opacity": 1,
                            "colorsrc": "Amsale:105:c16aea",
                            "showscale": false,
                            "colorscale": [
                                [
                                    0,
                                    "#b3e2cd"
                                ],
                                [
                                    0.14285714285714285,
                                    "#fdcdac"
                                ],
                                [
                                    0.2857142857142857,
                                    "#cbd5e8"
                                ],
                                [
                                    0.42857142857142855,
                                    "#f4cae4"
                                ],
                                [
                                    0.5714285714285714,
                                    "#e6f5c9"
                                ],
                                [
                                    0.7142857142857143,
                                    "#fff2ae"
                                ],
                                [
                                    0.8571428571428571,
                                    "#f1e2cc"
                                ],
                                [
                                    1,
                                    "#cccccc"
                                ]
                            ],
                            "reversescale": false
                        },
                        "orientation": "v",
                        "autocolorscale": false
                    }
                ],
                "frames": [],
                "layout": {
                    "font": {
                        "size": 20,
                        "color": "rgb(21, 1, 1)",
                        "family": "Times New Roman"
                    },
                    "title": {
                        "x": 0.02,
                        "font": {
                            "size": 20
                        },
                        "text": "(A)"
                    },
                    "xaxis": {
                        "type": "category",
                        "range": [
                            -0.5,
                            9.5
                        ],
                        "title": {
                            "text": "<br><br>\nPhylum composition<br>"
                        },
                        "showgrid": false,
                        "showline": false,
                        "zeroline": true,
                        "autorange": false,
                        "tickangle": "auto",
                        "zerolinewidth": 1
                    },
                    "yaxis": {
                        "type": "linear",
                        "dtick": 5,
                        "range": [
                            0,
                            20.5555
                        ],
                        "title": {
                            "text": "Number of sequences"
                        },
                        "nticks": 10.5,
                        "showgrid": false,
                        "showline": false,
                        "tickmode": "linear",
                        "zeroline": false,
                        "autorange": false,
                        "gridwidth": 0,
                        "linewidth": 0,
                        "zerolinecolor": "rgb(225, 221, 221)",
                        "zerolinewidth": 0
                    },
                    "bargap": 0.5,
                    "margin": {
                        "b": 210,
                        "t": 50
                    },
                    "modebar": {
                        "color": "rgba(252, 243, 243, 0.3)",
                        "activecolor": "rgba(241, 235, 235, 0.7)",
                        "orientation": "v"
                    },
                    "autosize": true,
                    "colorway": [
                        "#b3e2cd",
                        "#fdcdac",
                        "#cbd5e8",
                        "#f4cae4",
                        "#e6f5c9",
                        "#fff2ae",
                        "#f1e2cc",
                        "#cccccc"
                    ],
                    "dragmode": "select",
                    "colorscale": {
                        "diverging": [
                            [
                                0,
                                "#9e0142"
                            ],
                            [
                                0.1,
                                "#d53e4f"
                            ],
                            [
                                0.2,
                                "#f46d43"
                            ],
                            [
                                0.3,
                                "#fdae61"
                            ],
                            [
                                0.4,
                                "#fee08b"
                            ],
                            [
                                0.5,
                                "#ffffbf"
                            ],
                            [
                                0.6,
                                "#e6f598"
                            ],
                            [
                                0.7,
                                "#abdda4"
                            ],
                            [
                                0.8,
                                "#66c2a5"
                            ],
                            [
                                0.9,
                                "#3288bd"
                            ],
                            [
                                1,
                                "#5e4fa2"
                            ]
                        ]
                    },
                    "hoverlabel": {
                        "font": {
                            "size": 13
                        }
                    },
                    "bargroupgap": 0
                }
            },
            "height": null,
            "width": null,
            "user": {
                "profile_url": "https://chart-studio.plotly.com/~Amsale",
                "avatar_url": "https://storage.googleapis.com/plotly-prod-profiles/7.jpg",
                "background_url": "https://storage.googleapis.com/plotly-prod-profiles/bg-8.jpg",
                "bio": "",
                "nickname": "",
                "website": "",
                "stream_tokens": null,
                "feature_set_id": null,
                "csrf_token": null,
                "date_joined": "2023-03-10 17:24:16",
                "mapbox_access_tokens": null,
                "has_password": null,
                "username": "Amsale",
                "email": null,
                "is_active": null,
                "readonly": null,
                "is_dash_creator": null,
                "dash_created_count": null,
                "is_chart_creator": null,
                "charts_created_count": null
            }
        },
        {
            "creation_time": "2024-03-20T22:12:05.782703Z",
            "comments": {
                "results": [],
                "count": 0
            },
            "parented": true,
            "embed_url": "https://chart-studio.plotly.com/~samwillis8/5.embed",
            "fid": "samwillis8:5",
            "filename": "Plot 5",
            "filetype": "plot",
            "img_url": "https://storage.googleapis.com/plotly-prod-images/samwillis8/5/9_3XPC45MBQ4KOXI80RESEGRXLQ88DWE.png",
            "image_urls": {
                "default": "https://storage.googleapis.com/plotly-prod-images/samwillis8/5/2_SNFAWASMM4W1OWV9POL0LZ11CIXAUB.png",
                "block-thumb": "https://storage.googleapis.com/plotly-prod-images/samwillis8/5/8_EODOXKZRIXS5C8KTWYRPQ6TJJLLQP6.png",
                "list-thumb": "https://storage.googleapis.com/plotly-prod-images/samwillis8/5/9_3XPC45MBQ4KOXI80RESEGRXLQ88DWE.png"
            },
            "api_urls": {
                "files": "https://api.plotly.com/v2/files/samwillis8:5",
                "plots": "https://api.plotly.com/v2/plots/samwillis8:5",
                "parent": "https://api.plotly.com/v2/folders/home?user=samwillis8"
            },
            "owner": "samwillis8",
            "parent": -1,
            "preview": "",
            "referencers": [],
            "references": [],
            "title": "",
            "views": 3,
            "web_url": "https://chart-studio.plotly.com/~samwillis8/5/",
            "world_readable": true,
            "date_modified": "2024-03-20T22:12:05.799Z",
            "stars": {
                "results": [],
                "count": 0
            },
            "collaborators": {
                "results": [],
                "count": 0
            },
            "subfolder_count": null,
            "refresh_interval": null,
            "organize_view_url": "https://chart-studio.plotly.com/~samwillis8/5/",
            "current_user_permission": "read",
            "is_theme": null,
            "is_template": false,
            "autosize": true,
            "caption": "",
            "figure": {
                "data": [
                    {
                        "line": {
                            "color": "rgb(255, 18, 1)"
                        },
                        "meta": {
                            "columnNames": {
                                "x": "Date Range",
                                "y": "October_M"
                            }
                        },
                        "mode": "lines",
                        "name": "October_M",
                        "type": "scatter",
                        "xsrc": "samwillis8:4:3ed0e4",
                        "ysrc": "samwillis8:4:b857a6",
                        "visible": true
                    },
                    {
                        "line": {
                            "color": "rgb(174, 29, 4)"
                        },
                        "meta": {
                            "columnNames": {
                                "x": "Date Range",
                                "y": "October"
                            }
                        },
                        "mode": "lines",
                        "name": "October",
                        "type": "scatter",
                        "xsrc": "samwillis8:4:3ed0e4",
                        "ysrc": "samwillis8:4:9a5cdc",
                        "visible": "legendonly",
                        "stackgroup": null
                    },
                    {
                        "line": {
                            "color": "rgb(12, 50, 239)"
                        },
                        "meta": {
                            "columnNames": {
                                "x": "Date Range",
                                "y": "December_M"
                            }
                        },
                        "mode": "lines",
                        "name": "November_M",
                        "type": "scatter",
                        "xsrc": "samwillis8:4:3ed0e4",
                        "ysrc": "samwillis8:4:c81516",
                        "visible": true
                    },
                    {
                        "line": {
                            "color": "rgb(21, 176, 175)"
                        },
                        "meta": {
                            "columnNames": {
                                "x": "Date Range",
                                "y": "November"
                            }
                        },
                        "mode": "lines",
                        "name": "November",
                        "type": "scatter",
                        "xsrc": "samwillis8:4:3ed0e4",
                        "ysrc": "samwillis8:4:a28724",
                        "visible": "legendonly",
                        "stackgroup": null
                    },
                    {
                        "line": {
                            "color": "rgb(6, 255, 6)"
                        },
                        "meta": {
                            "columnNames": {
                                "x": "Date Range",
                                "y": "November_M"
                            }
                        },
                        "mode": "lines",
                        "name": "December_M",
                        "type": "scatter",
                        "xsrc": "samwillis8:4:3ed0e4",
                        "ysrc": "samwillis8:4:86ad2c",
                        "visible": true
                    },
                    {
                        "line": {
                            "color": "rgb(8, 141, 8)"
                        },
                        "meta": {
                            "columnNames": {
                                "x": "Date Range",
                                "y": "December"
                            }
                        },
                        "mode": "lines",
                        "name": "December",
                        "type": "scatter",
                        "xsrc": "samwillis8:4:3ed0e4",
                        "ysrc": "samwillis8:4:c90419",
                        "visible": "legendonly",
                        "stackgroup": null
                    }
                ],
                "frames": [],
                "layout": {
                    "title": {
                        "text": "Hourly Energy Production Averages per Month in 2023 (King Hall Meter)"
                    },
                    "xaxis": {
                        "type": "category",
                        "range": [
                            0,
                            23
                        ],
                        "title": {
                            "text": "Time (hours)"
                        },
                        "autorange": true
                    },
                    "yaxis": {
                        "type": "linear",
                        "range": [
                            -11.150000000000002,
                            211.85
                        ],
                        "title": {
                            "text": "Energy (kWh)"
                        },
                        "autorange": true
                    },
                    "legend": {
                        "x": 1.02,
                        "y": 0.9676616915422885
                    },
                    "autosize": true,
                    "template": {
                        "data": {
                            "bar": [
                                {
                                    "type": "bar",
                                    "marker": {
                                        "colorbar": {
                                            "ticks": "",
                                            "outlinewidth": 0
                                        }
                                    }
                                }
                            ],
                            "table": [
                                {
                                    "type": "table",
                                    "cells": {
                                        "fill": {
                                            "color": "#EBF0F8"
                                        },
                                        "line": {
                                            "color": "white"
                                        }
                                    },
                                    "header": {
                                        "fill": {
                                            "color": "#C8D4E3"
                                        },
                                        "line": {
                                            "color": "white"
                                        }
                                    }
                                }
                            ],
                            "carpet": [
                                {
                                    "type": "carpet",
                                    "aaxis": {
                                        "gridcolor": "#C8D4E3",
                                        "linecolor": "#C8D4E3",
                                        "endlinecolor": "#2a3f5f",
                                        "minorgridcolor": "#C8D4E3",
                                        "startlinecolor": "#2a3f5f"
                                    },
                                    "baxis": {
                                        "gridcolor": "#C8D4E3",
                                        "linecolor": "#C8D4E3",
                                        "endlinecolor": "#2a3f5f",
                                        "minorgridcolor": "#C8D4E3",
                                        "startlinecolor": "#2a3f5f"
                                    }
                                }
                            ],
                            "mesh3d": [
                                {
                                    "type": "mesh3d",
                                    "colorbar": {
                                        "ticks": "",
                                        "outlinewidth": 0
                                    }
                                }
                            ],
                            "contour": [
                                {
                                    "type": "contour",
                                    "colorbar": {
                                        "ticks": "",
                                        "outlinewidth": 0
                                    },
                                    "autocolorscale": true
                                }
                            ],
                            "heatmap": [
                                {
                                    "type": "heatmap",
                                    "colorbar": {
                                        "ticks": "",
                                        "outlinewidth": 0
                                    },
                                    "autocolorscale": true
                                }
                            ],
                            "scatter": [
                                {
                                    "type": "scatter",
                                    "marker": {
                                        "colorbar": {
                                            "ticks": "",
                                            "outlinewidth": 0
                                        }
                                    }
                                }
                            ],
                            "surface": [
                                {
                                    "type": "surface",
                                    "colorbar": {
                                        "ticks": "",
                                        "outlinewidth": 0
                                    }
                                }
                            ],
                            "heatmapgl": [
                                {
                                    "type": "heatmapgl",
                                    "colorbar": {
                                        "ticks": "",
                                        "outlinewidth": 0
                                    }
                                }
                            ],
                            "histogram": [
                                {
                                    "type": "histogram",
                                    "marker": {
                                        "colorbar": {
                                            "ticks": "",
                                            "outlinewidth": 0
                                        }
                                    }
                                }
                            ],
                            "parcoords": [
                                {
                                    "line": {
                                        "colorbar": {
                                            "ticks": "",
                                            "outlinewidth": 0
                                        }
                                    },
                                    "type": "parcoords"
                                }
                            ],
                            "scatter3d": [
                                {
                                    "type": "scatter3d",
                                    "marker": {
                                        "colorbar": {
                                            "ticks": "",
                                            "outlinewidth": 0
                                        }
                                    }
                                }
                            ],
                            "scattergl": [
                                {
                                    "type": "scattergl",
                                    "marker": {
                                        "colorbar": {
                                            "ticks": "",
                                            "outlinewidth": 0
                                        }
                                    }
                                }
                            ],
                            "choropleth": [
                                {
                                    "type": "choropleth",
                                    "colorbar": {
                                        "ticks": "",
                                        "outlinewidth": 0
                                    }
                                }
                            ],
                            "scattergeo": [
                                {
                                    "type": "scattergeo",
                                    "marker": {
                                        "colorbar": {
                                            "ticks": "",
                                            "outlinewidth": 0
                                        }
                                    }
                                }
                            ],
                            "histogram2d": [
                                {
                                    "type": "histogram2d",
                                    "colorbar": {
                                        "ticks": "",
                                        "outlinewidth": 0
                                    },
                                    "autocolorscale": true
                                }
                            ],
                            "scatterpolar": [
                                {
                                    "type": "scatterpolar",
                                    "marker": {
                                        "colorbar": {
                                            "ticks": "",
                                            "outlinewidth": 0
                                        }
                                    }
                                }
                            ],
                            "contourcarpet": [
                                {
                                    "type": "contourcarpet",
                                    "colorbar": {
                                        "ticks": "",
                                        "outlinewidth": 0
                                    }
                                }
                            ],
                            "scattercarpet": [
                                {
                                    "type": "scattercarpet",
                                    "marker": {
                                        "colorbar": {
                                            "ticks": "",
                                            "outlinewidth": 0
                                        }
                                    }
                                }
                            ],
                            "scattermapbox": [
                                {
                                    "type": "scattermapbox",
                                    "marker": {
                                        "colorbar": {
                                            "ticks": "",
                                            "outlinewidth": 0
                                        }
                                    }
                                }
                            ],
                            "scatterpolargl": [
                                {
                                    "type": "scatterpolargl",
                                    "marker": {
                                        "colorbar": {
                                            "ticks": "",
                                            "outlinewidth": 0
                                        }
                                    }
                                }
                            ],
                            "scatterternary": [
                                {
                                    "type": "scatterternary",
                                    "marker": {
                                        "colorbar": {
                                            "ticks": "",
                                            "outlinewidth": 0
                                        }
                                    }
                                }
                            ],
                            "histogram2dcontour": [
                                {
                                    "type": "histogram2dcontour",
                                    "colorbar": {
                                        "ticks": "",
                                        "outlinewidth": 0
                                    },
                                    "autocolorscale": true
                                }
                            ]
                        },
                        "layout": {
                            "geo": {
                                "bgcolor": "white",
                                "showland": true,
                                "lakecolor": "white",
                                "landcolor": "white",
                                "showlakes": true,
                                "subunitcolor": "#C8D4E3"
                            },
                            "font": {
                                "color": "#2a3f5f"
                            },
                            "polar": {
                                "bgcolor": "white",
                                "radialaxis": {
                                    "ticks": "",
                                    "gridcolor": "#EBF0F8",
                                    "linecolor": "#EBF0F8"
                                },
                                "angularaxis": {
                                    "ticks": "",
                                    "gridcolor": "#EBF0F8",
                                    "linecolor": "#EBF0F8"
                                }
                            },
                            "scene": {
                                "xaxis": {
                                    "ticks": "",
                                    "gridcolor": "#DFE8F3",
                                    "gridwidth": 2,
                                    "linecolor": "#EBF0F8",
                                    "zerolinecolor": "#EBF0F8",
                                    "showbackground": true,
                                    "backgroundcolor": "white"
                                },
                                "yaxis": {
                                    "ticks": "",
                                    "gridcolor": "#DFE8F3",
                                    "gridwidth": 2,
                                    "linecolor": "#EBF0F8",
                                    "zerolinecolor": "#EBF0F8",
                                    "showbackground": true,
                                    "backgroundcolor": "white"
                                },
                                "zaxis": {
                                    "ticks": "",
                                    "gridcolor": "#DFE8F3",
                                    "gridwidth": 2,
                                    "linecolor": "#EBF0F8",
                                    "zerolinecolor": "#EBF0F8",
                                    "showbackground": true,
                                    "backgroundcolor": "white"
                                }
                            },
                            "title": {
                                "x": 0.05
                            },
                            "xaxis": {
                                "ticks": "",
                                "gridcolor": "#EBF0F8",
                                "linecolor": "#EBF0F8",
                                "automargin": true,
                                "zerolinecolor": "#EBF0F8",
                                "zerolinewidth": 2
                            },
                            "yaxis": {
                                "ticks": "",
                                "gridcolor": "#EBF0F8",
                                "linecolor": "#EBF0F8",
                                "automargin": true,
                                "zerolinecolor": "#EBF0F8",
                                "zerolinewidth": 2
                            },
                            "ternary": {
                                "aaxis": {
                                    "ticks": "",
                                    "gridcolor": "#DFE8F3",
                                    "linecolor": "#A2B1C6"
                                },
                                "baxis": {
                                    "ticks": "",
                                    "gridcolor": "#DFE8F3",
                                    "linecolor": "#A2B1C6"
                                },
                                "caxis": {
                                    "ticks": "",
                                    "gridcolor": "#DFE8F3",
                                    "linecolor": "#A2B1C6"
                                },
                                "bgcolor": "white"
                            },
                            "colorway": [
                                "#636efa",
                                "#EF553B",
                                "#00cc96",
                                "#ab63fa",
                                "#19d3f3",
                                "#e763fa",
                                "#fecb52",
                                "#ffa15a",
                                "#ff6692",
                                "#b6e880"
                            ],
                            "hovermode": "closest",
                            "colorscale": {
                                "diverging": [
                                    [
                                        0,
                                        "#8e0152"
                                    ],
                                    [
                                        0.1,
                                        "#c51b7d"
                                    ],
                                    [
                                        0.2,
                                        "#de77ae"
                                    ],
                                    [
                                        0.3,
                                        "#f1b6da"
                                    ],
                                    [
                                        0.4,
                                        "#fde0ef"
                                    ],
                                    [
                                        0.5,
                                        "#f7f7f7"
                                    ],
                                    [
                                        0.6,
                                        "#e6f5d0"
                                    ],
                                    [
                                        0.7,
                                        "#b8e186"
                                    ],
                                    [
                                        0.8,
                                        "#7fbc41"
                                    ],
                                    [
                                        0.9,
                                        "#4d9221"
                                    ],
                                    [
                                        1,
                                        "#276419"
                                    ]
                                ],
                                "sequential": [
                                    [
                                        0,
                                        "#0508b8"
                                    ],
                                    [
                                        0.0893854748603352,
                                        "#1910d8"
                                    ],
                                    [
                                        0.1787709497206704,
                                        "#3c19f0"
                                    ],
                                    [
                                        0.2681564245810056,
                                        "#6b1cfb"
                                    ],
                                    [
                                        0.3575418994413408,
                                        "#981cfd"
                                    ],
                                    [
                                        0.44692737430167595,
                                        "#bf1cfd"
                                    ],
                                    [
                                        0.5363128491620112,
                                        "#dd2bfd"
                                    ],
                                    [
                                        0.6256983240223464,
                                        "#f246fe"
                                    ],
                                    [
                                        0.7150837988826816,
                                        "#fc67fd"
                                    ],
                                    [
                                        0.8044692737430168,
                                        "#fe88fc"
                                    ],
                                    [
                                        0.8938547486033519,
                                        "#fea5fd"
                                    ],
                                    [
                                        0.9832402234636871,
                                        "#febefe"
                                    ],
                                    [
                                        1,
                                        "#fec3fe"
                                    ]
                                ],
                                "sequentialminus": [
                                    [
                                        0,
                                        "#0508b8"
                                    ],
                                    [
                                        0.0893854748603352,
                                        "#1910d8"
                                    ],
                                    [
                                        0.1787709497206704,
                                        "#3c19f0"
                                    ],
                                    [
                                        0.2681564245810056,
                                        "#6b1cfb"
                                    ],
                                    [
                                        0.3575418994413408,
                                        "#981cfd"
                                    ],
                                    [
                                        0.44692737430167595,
                                        "#bf1cfd"
                                    ],
                                    [
                                        0.5363128491620112,
                                        "#dd2bfd"
                                    ],
                                    [
                                        0.6256983240223464,
                                        "#f246fe"
                                    ],
                                    [
                                        0.7150837988826816,
                                        "#fc67fd"
                                    ],
                                    [
                                        0.8044692737430168,
                                        "#fe88fc"
                                    ],
                                    [
                                        0.8938547486033519,
                                        "#fea5fd"
                                    ],
                                    [
                                        0.9832402234636871,
                                        "#febefe"
                                    ],
                                    [
                                        1,
                                        "#fec3fe"
                                    ]
                                ]
                            },
                            "plot_bgcolor": "white",
                            "paper_bgcolor": "white",
                            "shapedefaults": {
                                "line": {
                                    "width": 0
                                },
                                "opacity": 0.4,
                                "fillcolor": "#506784"
                            },
                            "annotationdefaults": {
                                "arrowhead": 0,
                                "arrowcolor": "#506784",
                                "arrowwidth": 1
                            }
                        },
                        "themeRef": "PLOTLY_WHITE"
                    }
                }
            },
            "height": null,
            "width": null,
            "user": {
                "profile_url": "https://chart-studio.plotly.com/~samwillis8",
                "avatar_url": "https://storage.googleapis.com/plotly-prod-profiles/21.jpg",
                "background_url": "https://storage.googleapis.com/plotly-prod-profiles/bg-2.jpg",
                "bio": "",
                "nickname": "",
                "website": "",
                "stream_tokens": null,
                "feature_set_id": null,
                "csrf_token": null,
                "date_joined": "2024-02-15 20:42:00",
                "mapbox_access_tokens": null,
                "has_password": null,
                "username": "samwillis8",
                "email": null,
                "is_active": null,
                "readonly": null,
                "is_dash_creator": null,
                "dash_created_count": null,
                "is_chart_creator": null,
                "charts_created_count": null
            }
        }
    ]
}