Plots List
Plots
This endpoint handles manipulation of Plotly plot files.
Reference
Authorization
Any user with or without a Plotly account may view public plots. For private plots, see authentication.
Actions
list
Listing all public plots can be done via a GET request to this endpoint.
By default, plots will be listed in order of date created. The order_by
query parameter is accepted at this endpoint. Currently, only ordering by
views is supported. It is possible to filter the plots by quality
with min_quality or max_quality as query parameter.
Example:
// GET https://api.plotly.com/v2/plots/ ---> 200

// GET https://api.plotly.com/v2/plots/?order_by=-views ---> 200

// GET https://api.plotly.com/v2/plots/?min_quality=5 ---> 200

// GET https://api.plotly.com/v2/plots/?max_quality=5 ---> 200
feed
Listing all handpicked feed plots can be done via a GET request to this endpoint. By default, plots will be listed in a random order.
Example:
// GET https://api.plotly.com/v2/plots/feed ---> 200
create
You can create new plot resources here. The only required field is 'figure'. Currently, the figure is restricted to only contain references to grid data. That is, this will fail if raw data arrays are passed in. To create and manipulate underlying grids for plots, see the grids endpoint.
Example:
// This fails because a figure field is required.
// POST https://api.plotly.com/v2/plots ---> 400 Bad Request
{}

// This fails because the figure has raw data
//POST https://api.plotly.com/v2/plots ---> 400 Bad Request
{
    "figure": {"data": [{"y": ['this', 'is', 'raw', 'data']}]}
}

// This succeeds because the figure has src keys, not raw data.
//POST https://api.plotly.com/v2/plots ---> 200 OK
{
    "figure": {"data": [{"ysrc": "sven:88:u8nd62"}]}
}
When creating a grid, you can optionally specify a source_fid to specify where a plot has come from:
- source_fid: the fid of a plot that was copied (and presumably edited) to produce this one
detail
There is a lot of meta information stored about plot files including filename, title, share_url, and content_url to name a few.
This information can only be reached with a GET to this endpoint.
Example:
// GET https://api.plotly.com/v2/plots/iheartgraphs:90
content
The contents of a plot can be downloaded via the content resource. The plot
content contains referenced grid/column data by default. If you wish to
return the raw grid/column data, the inline_data=true query must be included
in the request url. The Content-Type header will be appropriately set for the
response body.
Alternatively, you can set ?map_data=unreadable to append a mapping of
sources to data that belongs to grids which are unreadable for the
requestor. This is useful when you have read access to another users plot,
but that plot contains grid references which you don't have access to.
Examples:
// Returns referenced grid/column data
// GET https://api.plotly.com/v2/plots/iheartgraphs:90/content ---> 200 OK

// Returns full grid/column data
// GET https://api.plotly.com/v2/plots/iheartgraphs:90/content?inline_data=true ---> 200 OK

// Returns full grid/column data when requestor doesn't have permission
// to read the referenced grid.
// GET https://api.plotly.com/v2/plots/iheartgraphs:90/content?map_data=unreadable ---> 200 OK
GET /v2/plots?cursor=cD0yMDI0LTAzLTI4KzE1JTNBMzglM0ExMC4wMjQyNzMlMkIwMCUzQTAw&format=api
{ "next": "https://api.plot.ly/v2/plots?cursor=cD0yMDI0LTAzLTI4KzE0JTNBNDUlM0E1NS4yMDA2MzYlMkIwMCUzQTAw&format=api", "previous": "https://api.plot.ly/v2/plots?cursor=cj0xJnA9MjAyNC0wMy0yOCsxNSUzQTMzJTNBNTguMTUxMTQyJTJCMDAlM0EwMA%3D%3D&format=api", "results": [ { "creation_time": "2024-03-28T15:33:58.151142Z", "comments": { "results": [], "count": 0 }, "parented": true, "embed_url": "https://chart-studio.plotly.com/~kaladines/1.embed", "fid": "kaladines:1", "filename": "Plot 1", "filetype": "plot", "img_url": "https://storage.googleapis.com/plotly-prod-images/kaladines/1/9_EM3QTDY4KKWGGM0XWRS1H3FTZIPYOF.png", "image_urls": { "default": "https://storage.googleapis.com/plotly-prod-images/kaladines/1/2_DGNWV1JG9VNJIWIAAZMH0OGYEED106.png", "block-thumb": "https://storage.googleapis.com/plotly-prod-images/kaladines/1/8_UO13W1CLUK25SMS0VDIXCVRTCRIYDL.png", "list-thumb": "https://storage.googleapis.com/plotly-prod-images/kaladines/1/9_EM3QTDY4KKWGGM0XWRS1H3FTZIPYOF.png" }, "api_urls": { "files": "https://api.plotly.com/v2/files/kaladines:1", "plots": "https://api.plotly.com/v2/plots/kaladines:1", "parent": "https://api.plotly.com/v2/folders/home?user=kaladines" }, "owner": "kaladines", "parent": -1, "preview": "", "referencers": [], "references": [], "title": "", "views": 2, "web_url": "https://chart-studio.plotly.com/~kaladines/1/", "world_readable": true, "date_modified": "2024-03-28T16:23:47.268Z", "stars": { "results": [], "count": 0 }, "collaborators": { "results": [], "count": 0 }, "subfolder_count": null, "refresh_interval": null, "organize_view_url": "https://chart-studio.plotly.com/~kaladines/1/", "current_user_permission": "read", "is_theme": null, "is_template": false, "autosize": true, "caption": "", "figure": { "data": [ { "cmax": 0, "meta": { "columnNames": { "x": "B", "y": "A", "z": "C - D - E - F - G - H - I" } }, "type": "surface", "xsrc": "kaladines:0:e0a0d0", "ysrc": "kaladines:0:415cdb", "zsrc": "kaladines:0:977b03,78dda4,eec9ad,899a3d,9d8700,48f9d7,20de12", "cauto": true, "opacity": 1, "colorbar": { "x": 1.02, "y": 0.5171245816690058, "title": { "text": "" }, "lenmode": "fraction", "ticklen": 2, "thicknessmode": "pixels" }, "lighting": { "ambient": 1, "diffuse": 1, "fresnel": 0, "specular": 0, "roughness": 0 }, "showscale": true, "colorscale": [ [ 0, "#f7fbff" ], [ 0.125, "#deebf7" ], [ 0.25, "#c6dbef" ], [ 0.375, "#9ecae1" ], [ 0.5, "#6baed6" ], [ 0.625, "#4292c6" ], [ 0.75, "#2171b5" ], [ 0.875, "#08519c" ], [ 1, "#08306b" ] ], "reversescale": true, "hovertemplate": "", "lightposition": { "x": 0 }, "autocolorscale": false } ], "frames": [], "layout": { "scene": { "xaxis": { "type": "linear", "ticks": "", "showline": false, "tickmode": "auto", "zeroline": false, "autorange": true, "gridwidth": 1, "tickangle": 45, "showbackground": true }, "yaxis": { "type": "linear", "range": [ 0, 150 ], "showline": false, "zeroline": false, "autorange": true, "showbackground": true }, "zaxis": { "type": "linear", "range": [ -80.99999999999999, -2.0872192862952943e-14 ], "title": { "text": "z" }, "showline": false, "zeroline": false, "autorange": false, "showbackground": true }, "camera": { "up": { "x": 0.5655808590028603, "y": -0.3387710128016045, "z": 0.7518992570916412 }, "eye": { "x": -0.7548452399057906, "y": 1.599756471083868, "z": 1.2885730767879366 }, "center": { "x": 0, "y": 0, "z": 0 }, "projection": { "type": "orthographic" } }, "dragmode": "orbit", "aspectmode": "auto", "aspectratio": { "x": 1, "y": 1, "z": 1 } }, "xaxis": { "domain": [ 0, 1 ] }, "yaxis": { "domain": [ 0, 1 ] }, "margin": { "b": 40, "l": 60, "r": 10, "t": 20, "pad": 13 }, "modebar": { "orientation": "h" }, "autosize": true, "dragmode": "zoom", "template": { "data": { "bar": [ { "type": "bar", "marker": { "colorbar": { "ticks": "", "outlinewidth": 0 } } } ], "table": [ { "type": "table", "cells": { "fill": { "color": "#EBF0F8" }, "line": { "color": "white" } }, "header": { "fill": { "color": "#C8D4E3" }, "line": { "color": "white" } } } ], "carpet": [ { "type": "carpet", "aaxis": { "gridcolor": "#C8D4E3", "linecolor": "#C8D4E3", "endlinecolor": "#2a3f5f", "minorgridcolor": "#C8D4E3", "startlinecolor": "#2a3f5f" }, "baxis": { "gridcolor": "#C8D4E3", "linecolor": "#C8D4E3", "endlinecolor": "#2a3f5f", "minorgridcolor": "#C8D4E3", "startlinecolor": "#2a3f5f" } } ], "mesh3d": [ { "type": "mesh3d", "colorbar": { "ticks": "", "outlinewidth": 0 } } ], "contour": [ { "type": "contour", "colorbar": { "ticks": "", "outlinewidth": 0 }, "autocolorscale": true } ], "heatmap": [ { "type": "heatmap", "colorbar": { "ticks": "", "outlinewidth": 0 }, "autocolorscale": true } ], "scatter": [ { "type": "scatter", "marker": { "colorbar": { "ticks": "", "outlinewidth": 0 } } } ], "surface": [ { "type": "surface", "colorbar": { "ticks": "", "outlinewidth": 0 } } ], "heatmapgl": [ { "type": "heatmapgl", "colorbar": { "ticks": "", "outlinewidth": 0 } } ], "histogram": [ { "type": "histogram", "marker": { "colorbar": { "ticks": "", "outlinewidth": 0 } } } ], "parcoords": [ { "line": { "colorbar": { "ticks": "", "outlinewidth": 0 } }, "type": "parcoords" } ], "scatter3d": [ { "type": "scatter3d", "marker": { "colorbar": { "ticks": "", "outlinewidth": 0 } } } ], "scattergl": [ { "type": "scattergl", "marker": { "colorbar": { "ticks": "", "outlinewidth": 0 } } } ], "choropleth": [ { "type": "choropleth", "colorbar": { "ticks": "", "outlinewidth": 0 } } ], "scattergeo": [ { "type": "scattergeo", "marker": { "colorbar": { "ticks": "", "outlinewidth": 0 } } } ], "histogram2d": [ { "type": "histogram2d", "colorbar": { "ticks": "", "outlinewidth": 0 }, "autocolorscale": true } ], "scatterpolar": [ { "type": "scatterpolar", "marker": { "colorbar": { "ticks": "", "outlinewidth": 0 } } } ], "contourcarpet": [ { "type": "contourcarpet", "colorbar": { "ticks": "", "outlinewidth": 0 } } ], "scattercarpet": [ { "type": "scattercarpet", "marker": { "colorbar": { "ticks": "", "outlinewidth": 0 } } } ], "scattermapbox": [ { "type": "scattermapbox", "marker": { "colorbar": { "ticks": "", "outlinewidth": 0 } } } ], "scatterpolargl": [ { "type": "scatterpolargl", "marker": { "colorbar": { "ticks": "", "outlinewidth": 0 } } } ], "scatterternary": [ { "type": "scatterternary", "marker": { "colorbar": { "ticks": "", "outlinewidth": 0 } } } ], "histogram2dcontour": [ { "type": "histogram2dcontour", "colorbar": { "ticks": "", "outlinewidth": 0 }, "autocolorscale": true } ] }, "layout": { "geo": { "bgcolor": "white", "showland": true, "lakecolor": "white", "landcolor": "white", "showlakes": true, "subunitcolor": "#C8D4E3" }, "font": { "color": "#2a3f5f" }, "polar": { "bgcolor": "white", "radialaxis": { "ticks": "", "gridcolor": "#EBF0F8", "linecolor": "#EBF0F8" }, "angularaxis": { "ticks": "", "gridcolor": "#EBF0F8", "linecolor": "#EBF0F8" } }, "scene": { "xaxis": { "ticks": "", "gridcolor": "#DFE8F3", "gridwidth": 2, "linecolor": "#EBF0F8", "zerolinecolor": "#EBF0F8", "showbackground": true, "backgroundcolor": "white" }, "yaxis": { "ticks": "", "gridcolor": "#DFE8F3", "gridwidth": 2, "linecolor": "#EBF0F8", "zerolinecolor": "#EBF0F8", "showbackground": true, "backgroundcolor": "white" }, "zaxis": { "ticks": "", "gridcolor": "#DFE8F3", "gridwidth": 2, "linecolor": "#EBF0F8", "zerolinecolor": "#EBF0F8", "showbackground": true, "backgroundcolor": "white" } }, "title": { "x": 0.05 }, "xaxis": { "ticks": "", "gridcolor": "#EBF0F8", "linecolor": "#EBF0F8", "automargin": true, "zerolinecolor": "#EBF0F8", "zerolinewidth": 2 }, "yaxis": { "ticks": "", "gridcolor": "#EBF0F8", "linecolor": "#EBF0F8", "automargin": true, "zerolinecolor": "#EBF0F8", "zerolinewidth": 2 }, "ternary": { "aaxis": { "ticks": "", "gridcolor": "#DFE8F3", "linecolor": "#A2B1C6" }, "baxis": { "ticks": "", "gridcolor": "#DFE8F3", "linecolor": "#A2B1C6" }, "caxis": { "ticks": "", "gridcolor": "#DFE8F3", "linecolor": "#A2B1C6" }, "bgcolor": "white" }, "colorway": [ "#636efa", "#EF553B", "#00cc96", "#ab63fa", "#19d3f3", "#e763fa", "#fecb52", "#ffa15a", "#ff6692", "#b6e880" ], "hovermode": "closest", "colorscale": { "diverging": [ [ 0, "#8e0152" ], [ 0.1, "#c51b7d" ], [ 0.2, "#de77ae" ], [ 0.3, "#f1b6da" ], [ 0.4, "#fde0ef" ], [ 0.5, "#f7f7f7" ], [ 0.6, "#e6f5d0" ], [ 0.7, "#b8e186" ], [ 0.8, "#7fbc41" ], [ 0.9, "#4d9221" ], [ 1, "#276419" ] ], "sequential": [ [ 0, "#0508b8" ], [ 0.0893854748603352, "#1910d8" ], [ 0.1787709497206704, "#3c19f0" ], [ 0.2681564245810056, "#6b1cfb" ], [ 0.3575418994413408, "#981cfd" ], [ 0.44692737430167595, "#bf1cfd" ], [ 0.5363128491620112, "#dd2bfd" ], [ 0.6256983240223464, "#f246fe" ], [ 0.7150837988826816, "#fc67fd" ], [ 0.8044692737430168, "#fe88fc" ], [ 0.8938547486033519, "#fea5fd" ], [ 0.9832402234636871, "#febefe" ], [ 1, "#fec3fe" ] ], "sequentialminus": [ [ 0, "#0508b8" ], [ 0.0893854748603352, "#1910d8" ], [ 0.1787709497206704, "#3c19f0" ], [ 0.2681564245810056, "#6b1cfb" ], [ 0.3575418994413408, "#981cfd" ], [ 0.44692737430167595, "#bf1cfd" ], [ 0.5363128491620112, "#dd2bfd" ], [ 0.6256983240223464, "#f246fe" ], [ 0.7150837988826816, "#fc67fd" ], [ 0.8044692737430168, "#fe88fc" ], [ 0.8938547486033519, "#fea5fd" ], [ 0.9832402234636871, "#febefe" ], [ 1, "#fec3fe" ] ] }, "plot_bgcolor": "white", "paper_bgcolor": "white", "shapedefaults": { "line": { "width": 0 }, "opacity": 0.4, "fillcolor": "#506784" }, "annotationdefaults": { "arrowhead": 0, "arrowcolor": "#506784", "arrowwidth": 1 } }, "themeRef": "PLOTLY_WHITE" }, "showlegend": false } }, "height": null, "width": null, "user": { "profile_url": "https://chart-studio.plotly.com/~kaladines", "avatar_url": "https://storage.googleapis.com/plotly-prod-profiles/96.jpg", "background_url": "https://storage.googleapis.com/plotly-prod-profiles/bg-8.jpg", "bio": "", "nickname": "", "website": "", "stream_tokens": null, "feature_set_id": null, "csrf_token": null, "date_joined": "2024-03-28 13:47:47", "mapbox_access_tokens": null, "has_password": null, "username": "kaladines", "email": null, "is_active": null, "readonly": null, "is_dash_creator": null, "dash_created_count": null, "is_chart_creator": null, "charts_created_count": null } }, { "creation_time": "2024-03-28T15:28:16.819650Z", "comments": { "results": [], "count": 0 }, "parented": true, "embed_url": "https://chart-studio.plotly.com/~lviktor/3.embed", "fid": "lviktor:3", "filename": "my_plot.html", "filetype": "plot", "img_url": "https://storage.googleapis.com/plotly-prod-images/lviktor/3/9_X9Z4IH3YDA6CF5R82XVW8PYM4YUS5V.png", "image_urls": { "default": "https://storage.googleapis.com/plotly-prod-images/lviktor/3/2_Z0QLRBVWSB6S67M8VFZJGONPQWP9U9.png", "block-thumb": "https://storage.googleapis.com/plotly-prod-images/lviktor/3/8_DA1FGDMFQXVUM9ZWZ23SNFGWDR3N4Z.png", "list-thumb": "https://storage.googleapis.com/plotly-prod-images/lviktor/3/9_X9Z4IH3YDA6CF5R82XVW8PYM4YUS5V.png" }, "api_urls": { "files": "https://api.plotly.com/v2/files/lviktor:3", "plots": "https://api.plotly.com/v2/plots/lviktor:3", "parent": "https://api.plotly.com/v2/folders/home?user=lviktor" }, "owner": "lviktor", "parent": -1, "preview": "", "referencers": [], "references": [], "title": "", "views": 4, "web_url": "https://chart-studio.plotly.com/~lviktor/3/", "world_readable": true, "date_modified": "2024-04-03T10:23:52.597Z", "stars": { "results": [], "count": 0 }, "collaborators": { "results": [], "count": 0 }, "subfolder_count": null, "refresh_interval": null, "organize_view_url": "https://chart-studio.plotly.com/~lviktor/3/", "current_user_permission": "read", "is_theme": null, "is_template": null, "autosize": true, "caption": "", "figure": { "data": [ { "type": "choropleth", "zsrc": "lviktor:61:d62c5b", "geojson": "https://raw.githubusercontent.com/python-visualization/folium/master/examples/data/world-countries.json", "showscale": false, "colorscale": [ [ 0.0, "rgba(228, 26, 28, 0.5)" ], [ 0.022727272727272728, "rgba(55, 126, 184, 0.5)" ], [ 0.045454545454545456, "rgba(77, 175, 74, 0.5)" ], [ 0.06818181818181818, "rgba(255, 127, 0, 0.5)" ], [ 0.09090909090909091, "rgba(152, 78, 163, 0.5)" ], [ 0.11363636363636363, "rgba(255, 255, 51, 0.5)" ], [ 0.13636363636363635, "rgba(166, 86, 40, 0.5)" ], [ 0.1590909090909091, "rgba(247, 129, 191, 0.5)" ], [ 0.18181818181818182, "rgba(153, 153, 153, 0.5)" ], [ 0.20454545454545456, "rgba(102, 194, 165, 0.5)" ], [ 0.22727272727272727, "rgba(140, 86, 75, 0.5)" ], [ 0.25, "rgba(178, 223, 138, 0.5)" ], [ 0.2727272727272727, "rgba(251, 154, 153, 0.5)" ], [ 0.29545454545454547, "rgba(227, 26, 28, 0.5)" ], [ 0.3181818181818182, "rgba(253, 191, 111, 0.5)" ], [ 0.3409090909090909, "rgba(255, 127, 0, 0.5)" ], [ 0.36363636363636365, "rgba(202, 178, 214, 0.5)" ], [ 0.38636363636363635, "rgba(106, 61, 154, 0.5)" ], [ 0.4090909090909091, "rgba(255, 255, 153, 0.5)" ], [ 0.4318181818181818, "rgba(177, 89, 40, 0.5)" ], [ 0.45454545454545453, "rgba(247, 129, 191, 0.5)" ], [ 0.4772727272727273, "rgba(255, 127, 0, 0.5)" ], [ 0.5, "rgba(166, 206, 227, 0.5)" ], [ 0.5227272727272727, "rgba(31, 120, 180, 0.5)" ], [ 0.5454545454545454, "rgba(178, 223, 138, 0.5)" ], [ 0.5681818181818182, "rgba(51, 160, 44, 0.5)" ], [ 0.5909090909090909, "rgba(251, 154, 153, 0.5)" ], [ 0.6136363636363636, "rgba(255, 127, 0, 0.5)" ], [ 0.6363636363636364, "rgba(106, 61, 154, 0.5)" ], [ 0.6590909090909091, "rgba(228, 26, 28, 0.5)" ], [ 0.6818181818181818, "rgba(55, 126, 184, 0.5)" ], [ 0.7045454545454546, "rgba(152, 78, 163, 0.5)" ], [ 0.7272727272727273, "rgba(247, 129, 191, 0.5)" ], [ 0.75, "rgba(255, 127, 0, 0.5)" ], [ 0.7727272727272727, "rgba(166, 86, 40, 0.5)" ], [ 0.7954545454545454, "rgba(253, 191, 111, 0.5)" ], [ 0.8181818181818182, "rgba(178, 223, 138, 0.5)" ], [ 0.8409090909090909, "rgba(255, 127, 0, 0.5)" ], [ 0.8636363636363636, "rgba(202, 178, 214, 0.5)" ], [ 0.8863636363636364, "rgba(102, 194, 165, 0.5)" ], [ 0.9090909090909091, "rgba(255, 127, 0, 0.5)" ], [ 0.9318181818181818, "rgba(140, 86, 75, 0.5)" ], [ 0.9545454545454546, "rgba(177, 89, 40, 0.5)" ], [ 0.9772727272727273, "rgba(106, 61, 154, 0.5)" ], [ 1.0, "rgba(255, 255, 153, 0.5)" ] ], "locationssrc": "lviktor:61:4206d4" }, { "mode": "markers", "name": "BEL Export: 1098103 Tons", "text": "BEL Export: 1098103 Tons", "type": "scattergeo", "latsrc": "lviktor:61:efce58", "lonsrc": "lviktor:61:292691", "marker": { "line": { "width": 0 }, "size": 10.98103, "color": "rgb(152, 78, 163)", "opacity": 1 }, "hoverinfo": "text", "locationmode": "country names" }, { "mode": "markers", "name": "FRA Export: 905280 Tons", "text": "FRA Export: 905280 Tons", "type": "scattergeo", "latsrc": "lviktor:61:6b178e", "lonsrc": "lviktor:61:cf4d81", "marker": { "line": { "width": 0 }, "size": 9.052800000000001, "color": "rgb(227, 26, 28)", "opacity": 1 }, "hoverinfo": "text", "locationmode": "country names" }, { "mode": "markers", "name": "AUT Export: 3216222 Tons", "text": "AUT Export: 3216222 Tons", "type": "scattergeo", "latsrc": "lviktor:61:e4581b", "lonsrc": "lviktor:61:0b6acb", "marker": { "line": { "width": 0 }, "size": 32.162220000000005, "color": "rgb(77, 175, 74)", "opacity": 1 }, "hoverinfo": "text", "locationmode": "country names" }, { "mode": "markers", "name": "POL Export: 569677 Tons", "text": "POL Export: 569677 Tons", "type": "scattergeo", "latsrc": "lviktor:61:59023e", "lonsrc": "lviktor:61:f342db", "marker": { "line": { "width": 0 }, "size": 5.696770000000001, "color": "rgb(152, 78, 163)", "opacity": 1 }, "hoverinfo": "text", "locationmode": "country names" }, { "mode": "markers", "name": "PRT Export: 169688 Tons", "text": "PRT Export: 169688 Tons", "type": "scattergeo", "latsrc": "lviktor:61:a2fdde", "lonsrc": "lviktor:61:bc1d11", "marker": { "line": { "width": 0 }, "size": 1.6968800000000002, "color": "rgb(247, 129, 191)", "opacity": 1 }, "hoverinfo": "text", "locationmode": "country names" }, { "mode": "markers", "name": "GBR Export: 106129 Tons", "text": "GBR Export: 106129 Tons", "type": "scattergeo", "latsrc": "lviktor:61:559470", "lonsrc": "lviktor:61:3c53dc", "marker": { "line": { "width": 0 }, "size": 1.06129, "color": "rgb(106, 61, 154)", "opacity": 1 }, "hoverinfo": "text", "locationmode": "country names" }, { "mode": "markers", "name": "SWE Export: 6953567 Tons", "text": "SWE Export: 6953567 Tons", "type": "scattergeo", "latsrc": "lviktor:61:9f427e", "lonsrc": "lviktor:61:3388b0", "marker": { "line": { "width": 0 }, "size": 69.53567000000001, "color": "rgb(255, 127, 0)", "opacity": 1 }, "hoverinfo": "text", "locationmode": "country names" }, { "mode": "markers", "name": "EST Export: 498298 Tons", "text": "EST Export: 498298 Tons", "type": "scattergeo", "latsrc": "lviktor:61:84d582", "lonsrc": "lviktor:61:44540a", "marker": { "line": { "width": 0 }, "size": 4.98298, "color": "rgb(178, 223, 138)", "opacity": 1 }, "hoverinfo": "text", "locationmode": "country names" }, { "mode": "markers", "name": "NOR Export: 412990 Tons", "text": "NOR Export: 412990 Tons", "type": "scattergeo", "latsrc": "lviktor:61:55f480", "lonsrc": "lviktor:61:66173a", "marker": { "line": { "width": 0 }, "size": 4.1299, "color": "rgb(55, 126, 184)", "opacity": 1 }, "hoverinfo": "text", "locationmode": "country names" }, { "mode": "markers", "name": "DNK Export: 214206 Tons", "text": "DNK Export: 214206 Tons", "type": "scattergeo", "latsrc": "lviktor:61:c3c434", "lonsrc": "lviktor:61:aa661e", "marker": { "line": { "width": 0 }, "size": 2.1420600000000003, "color": "rgb(140, 86, 75)", "opacity": 1 }, "hoverinfo": "text", "locationmode": "country names" }, { "mode": "markers", "name": "CHE Export: 113508 Tons", "text": "CHE Export: 113508 Tons", "type": "scattergeo", "latsrc": "lviktor:61:164590", "lonsrc": "lviktor:61:694a82", "marker": { "line": { "width": 0 }, "size": 1.13508, "color": "rgb(140, 86, 75)", "opacity": 1 }, "hoverinfo": "text", "locationmode": "country names" }, { "mode": "markers", "name": "FIN Export: 4368360 Tons", "text": "FIN Export: 4368360 Tons", "type": "scattergeo", "latsrc": "lviktor:61:d28ce0", "lonsrc": "lviktor:61:69afd1", "marker": { "line": { "width": 0 }, "size": 43.683600000000006, "color": "rgb(251, 154, 153)", "opacity": 1 }, "hoverinfo": "text", "locationmode": "country names" }, { "mode": "markers", "name": "LTU Export: 693657 Tons", "text": "LTU Export: 693657 Tons", "type": "scattergeo", "latsrc": "lviktor:61:fca6de", "lonsrc": "lviktor:61:9d354c", "marker": { "line": { "width": 0 }, "size": 6.936570000000001, "color": "rgb(166, 206, 227)", "opacity": 1 }, "hoverinfo": "text", "locationmode": "country names" }, { "mode": "markers", "name": "SVN Export: 608298 Tons", "text": "SVN Export: 608298 Tons", "type": "scattergeo", "latsrc": "lviktor:61:00fb27", "lonsrc": "lviktor:61:d94abf", "marker": { "line": { "width": 0 }, "size": 6.08298, "color": "rgb(202, 178, 214)", "opacity": 1 }, "hoverinfo": "text", "locationmode": "country names" }, { "mode": "markers", "name": "DEU Export: 6168871 Tons", "text": "DEU Export: 6168871 Tons", "type": "scattergeo", "latsrc": "lviktor:61:243b32", "lonsrc": "lviktor:61:306e2e", "marker": { "line": { "width": 0 }, "size": 61.68871000000001, "color": "rgb(253, 191, 111)", "opacity": 1 }, "hoverinfo": "text", "locationmode": "country names" }, { "mode": "markers", "name": "LVA Export: 2176792 Tons", "text": "LVA Export: 2176792 Tons", "type": "scattergeo", "latsrc": "lviktor:61:0024a9", "lonsrc": "lviktor:61:0373ed", "marker": { "line": { "width": 0 }, "size": 21.76792, "color": "rgb(247, 129, 191)", "opacity": 1 }, "hoverinfo": "text", "locationmode": "country names" }, { "mode": "markers", "name": "ITA Export: 240465 Tons", "text": "ITA Export: 240465 Tons", "type": "scattergeo", "latsrc": "lviktor:61:c5a22a", "lonsrc": "lviktor:61:e8e255", "marker": { "line": { "width": 0 }, "size": 2.40465, "color": "rgb(177, 89, 40)", "opacity": 1 }, "hoverinfo": "text", "locationmode": "country names" }, { "mode": "markers", "name": "SVK Export: 701939 Tons", "text": "SVK Export: 701939 Tons", "type": "scattergeo", "latsrc": "lviktor:61:7eefb7", "lonsrc": "lviktor:61:18023b", "marker": { "line": { "width": 0 }, "size": 7.0193900000000005, "color": "rgb(255, 127, 0)", "opacity": 1 }, "hoverinfo": "text", "locationmode": "country names" }, { "mode": "markers", "name": "NLD Export: 410061 Tons", "text": "NLD Export: 410061 Tons", "type": "scattergeo", "latsrc": "lviktor:61:dc063b", "lonsrc": "lviktor:61:ab0a38", "marker": { "line": { "width": 0 }, "size": 4.1006100000000005, "color": "rgb(228, 26, 28)", "opacity": 1 }, "hoverinfo": "text", "locationmode": "country names" }, { "mode": "markers", "name": "HRV Export: 1050098 Tons", "text": "HRV Export: 1050098 Tons", "type": "scattergeo", "latsrc": "lviktor:61:812d23", "lonsrc": "lviktor:61:83e0e1", "marker": { "line": { "width": 0 }, "size": 10.50098, "color": "rgb(247, 129, 191)", "opacity": 1 }, "hoverinfo": "text", "locationmode": "country names" }, { "mode": "markers", "name": "UKR Export: 1145411 Tons", "text": "UKR Export: 1145411 Tons", "type": "scattergeo", "latsrc": "lviktor:61:4bff8f", "lonsrc": "lviktor:61:1564e1", "marker": { "line": { "width": 0 }, "size": 11.454110000000002, "color": "rgb(177, 89, 40)", "opacity": 1 }, "hoverinfo": "text", "locationmode": "country names" }, { "mode": "markers", "name": "ROU Export: 983476 Tons", "text": "ROU Export: 983476 Tons", "type": "scattergeo", "latsrc": "lviktor:61:d32fdd", "lonsrc": "lviktor:61:95ae31", "marker": { "line": { "width": 0 }, "size": 9.834760000000001, "color": "rgb(255, 127, 0)", "opacity": 1 }, "hoverinfo": "text", "locationmode": "country names" }, { "mode": "markers", "name": "BIH Export: 518015 Tons", "text": "BIH Export: 518015 Tons", "type": "scattergeo", "latsrc": "lviktor:61:be77fa", "lonsrc": "lviktor:61:878ad4", "marker": { "line": { "width": 0 }, "size": 5.18015, "color": "rgb(255, 255, 51)", "opacity": 1 }, "hoverinfo": "text", "locationmode": "country names" }, { "mode": "markers", "name": "CZE Export: 1321869 Tons", "text": "CZE Export: 1321869 Tons", "type": "scattergeo", "latsrc": "lviktor:61:0f6c60", "lonsrc": "lviktor:61:6b098d", "marker": { "line": { "width": 0 }, "size": 13.21869, "color": "rgb(102, 194, 165)", "opacity": 1 }, "hoverinfo": "text", "locationmode": "country names" }, { "line": { "color": "rgb(152, 78, 163)", "width": 2.9962400000000002 }, "mode": "lines+markers", "name": "BEL to France: 299624 Tons", "text": "BEL to France: 299624 Tons", "type": "scattergeo", "latsrc": "lviktor:61:37154d", "lonsrc": "lviktor:61:caf2b0", "marker": { "line": { "width": 0 }, "angle": -158.0804610558197, "color": "rgb(152, 78, 163)", "symbol": "circle", "opacity": 1, "sizesrc": "lviktor:61:59117d" }, "hoverinfo": "text", "locationmode": "country names" }, { "line": { "color": "rgb(152, 78, 163)", "width": 2.8167600000000004 }, "mode": "lines+markers", "name": "BEL to Germany: 281676 Tons", "text": "BEL to Germany: 281676 Tons", "type": "scattergeo", "latsrc": "lviktor:61:8ec6b3", "lonsrc": "lviktor:61:8dd924", "marker": { "line": { "width": 0 }, "angle": 79.5659832094671, "color": "rgb(152, 78, 163)", "symbol": "circle", "opacity": 1, "sizesrc": "lviktor:61:ab79fe" }, "hoverinfo": "text", "locationmode": "country names" }, { "line": { "color": "rgb(152, 78, 163)", "width": 2.44695 }, "mode": "lines+markers", "name": "BEL to Netherlands: 244695 Tons", "text": "BEL to Netherlands: 244695 Tons", "type": "scattergeo", "latsrc": "lviktor:61:33270e", "lonsrc": "lviktor:61:873625", "marker": { "line": { "width": 0 }, "angle": 19.480508609393922, "color": "rgb(152, 78, 163)", "symbol": "circle", "opacity": 1, "sizesrc": "lviktor:61:6a232b" }, "hoverinfo": "text", "locationmode": "country names" }, { "line": { "color": "rgb(227, 26, 28)", "width": 2.0810600000000004 }, "mode": "lines+markers", "name": "FRA to Belgium: 208106 Tons", "text": "FRA to Belgium: 208106 Tons", "type": "scattergeo", "latsrc": "lviktor:61:e8da57", "lonsrc": "lviktor:61:a1dd31", "marker": { "line": { "width": 0 }, "angle": 19.92606228040455, "color": "rgb(227, 26, 28)", "symbol": "circle", "opacity": 1, "sizesrc": "lviktor:61:0dd3d9" }, "hoverinfo": "text", "locationmode": "country names" }, { "line": { "color": "rgb(227, 26, 28)", "width": 1.8225500000000001 }, "mode": "lines+markers", "name": "FRA to Spain: 182255 Tons", "text": "FRA to Spain: 182255 Tons", "type": "scattergeo", "latsrc": "lviktor:61:cebea0", "lonsrc": "lviktor:61:55e04d", "marker": { "line": { "width": 0 }, "angle": -141.73274007073414, "color": "rgb(227, 26, 28)", "symbol": "circle", "opacity": 1, "sizesrc": "lviktor:61:c2fad5" }, "hoverinfo": "text", "locationmode": "country names" }, { "line": { "color": "rgb(227, 26, 28)", "width": 1.05682 }, "mode": "lines+markers", "name": "FRA to Netherlands: 105682 Tons", "text": "FRA to Netherlands: 105682 Tons", "type": "scattergeo", "latsrc": "lviktor:61:1432b8", "lonsrc": "lviktor:61:ff3b5a", "marker": { "line": { "width": 0 }, "angle": 19.229930652428948, "color": "rgb(227, 26, 28)", "symbol": "circle", "opacity": 1, "sizesrc": "lviktor:61:00984b" }, "hoverinfo": "text", "locationmode": "country names" }, { "line": { "color": "rgb(227, 26, 28)", "width": 0.6406900000000001 }, "mode": "lines+markers", "name": "FRA to Germany: 64069 Tons", "text": "FRA to Germany: 64069 Tons", "type": "scattergeo", "latsrc": "lviktor:61:275bc9", "lonsrc": "lviktor:61:13bc72", "marker": { "line": { "width": 0 }, "angle": 44.150895851293, "color": "rgb(227, 26, 28)", "symbol": "circle", "opacity": 1, "sizesrc": "lviktor:61:0bf5da" }, "hoverinfo": "text", "locationmode": "country names" }, { "line": { "color": "rgb(227, 26, 28)", "width": 0.6019300000000001 }, "mode": "lines+markers", "name": "FRA to United Kingdom: 60193 Tons", "text": "FRA to United Kingdom: 60193 Tons", "type": "scattergeo", "latsrc": "lviktor:61:b96d82", "lonsrc": "lviktor:61:26a12c", "marker": { "line": { "width": 0 }, "angle": -16.301348453697415, "color": "rgb(227, 26, 28)", "symbol": "circle", "opacity": 1, "sizesrc": "lviktor:61:377653" }, "hoverinfo": "text", "locationmode": "country names" }, { "line": { "color": "rgb(77, 175, 74)", "width": 15.435860000000002 }, "mode": "lines+markers", "name": "AUT to Italy: 1543586 Tons", "text": "AUT to Italy: 1543586 Tons", "type": "scattergeo", "latsrc": "lviktor:61:8f88da", "lonsrc": "lviktor:61:546018", "marker": { "line": { "width": 0 }, "angle": -168.10371644467477, "color": "rgb(77, 175, 74)", "symbol": "circle", "opacity": 1, "sizesrc": "lviktor:61:4b8d24" }, "hoverinfo": "text", "locationmode": "country names" }, { "line": { "color": "rgb(77, 175, 74)", "width": 5.10871 }, "mode": "lines+markers", "name": "AUT to Germany: 510871 Tons", "text": "AUT to Germany: 510871 Tons", "type": "scattergeo", "latsrc": "lviktor:61:8818a8", "lonsrc": "lviktor:61:580ade", "marker": { "line": { "width": 0 }, "angle": -32.838568384491424, "color": "rgb(77, 175, 74)", "symbol": "circle", "opacity": 1, "sizesrc": "lviktor:61:88deb5" }, "hoverinfo": "text", "locationmode": "country names" }, { "line": { "color": "rgb(77, 175, 74)", "width": 2.4547100000000004 }, "mode": "lines+markers", "name": "AUT to Slovenia: 245471 Tons", "text": "AUT to Slovenia: 245471 Tons", "type": "scattergeo", "latsrc": "lviktor:61:fc80af", "lonsrc": "lviktor:61:63940b", "marker": { "line": { "width": 0 }, "angle": 158.81616270861014, "color": "rgb(77, 175, 74)", "symbol": "circle", "opacity": 1, "sizesrc": "lviktor:61:88ae61" }, "hoverinfo": "text", "locationmode": "country names" }, { "line": { "color": "rgb(77, 175, 74)", "width": 0.8170400000000001 }, "mode": "lines+markers", "name": "AUT to Croatia: 81704 Tons", "text": "AUT to Croatia: 81704 Tons", "type": "scattergeo", "latsrc": "lviktor:61:39106c", "lonsrc": "lviktor:61:ca99a3", "marker": { "line": { "width": 0 }, "angle": 164.03422251408517, "color": "rgb(77, 175, 74)", "symbol": "circle", "opacity": 1, "sizesrc": "lviktor:61:9a749b" }, "hoverinfo": "text", "locationmode": "country names" }, { "line": { "color": "rgb(77, 175, 74)", "width": 0.63117 }, "mode": "lines+markers", "name": "AUT to Czech Republic: 63117 Tons", "text": "AUT to Czech Republic: 63117 Tons", "type": "scattergeo", "latsrc": "lviktor:61:8b334f", "lonsrc": "lviktor:61:e2d04a", "marker": { "line": { "width": 0 }, "angle": 20.231308838025228, "color": "rgb(77, 175, 74)", "symbol": "circle", "opacity": 1, "sizesrc": "lviktor:61:690d22" }, "hoverinfo": "text", "locationmode": "country names" }, { "line": { "color": "rgb(77, 175, 74)", "width": 0.5784100000000001 }, "mode": "lines+markers", "name": "AUT to Switzerland: 57841 Tons", "text": "AUT to Switzerland: 57841 Tons", "type": "scattergeo", "latsrc": "lviktor:61:20f1eb", "lonsrc": "lviktor:61:94935d", "marker": { "line": { "width": 0 }, "angle": -95.65267999411253, "color": "rgb(77, 175, 74)", "symbol": "circle", "opacity": 1, "sizesrc": "lviktor:61:32dd59" }, "hoverinfo": "text", "locationmode": "country names" }, { "line": { "color": "rgb(77, 175, 74)", "width": 0.52602 }, "mode": "lines+markers", "name": "AUT to Slovakia: 52602 Tons", "text": "AUT to Slovakia: 52602 Tons", "type": "scattergeo", "latsrc": "lviktor:61:2eea62", "lonsrc": "lviktor:61:641b24", "marker": { "line": { "width": 0 }, "angle": 71.53524422786776, "color": "rgb(77, 175, 74)", "symbol": "circle", "opacity": 1, "sizesrc": "lviktor:61:cc7ddc" }, "hoverinfo": "text", "locationmode": "country names" }, { "line": { "color": "rgb(152, 78, 163)", "width": 1.2193900000000002 }, "mode": "lines+markers", "name": "POL to Germany: 121939 Tons", "text": "POL to Germany: 121939 Tons", "type": "scattergeo", "latsrc": "lviktor:61:b7b2fe", "lonsrc": "lviktor:61:619e42", "marker": { "line": { "width": 0 }, "angle": -94.24163714076593, "color": "rgb(152, 78, 163)", "symbol": "circle", "opacity": 1, "sizesrc": "lviktor:61:9839e7" }, "hoverinfo": "text", "locationmode": "country names" }, { "line": { "color": "rgb(152, 78, 163)", "width": 0.85223 }, "mode": "lines+markers", "name": "POL to Italy: 85223 Tons", "text": "POL to Italy: 85223 Tons", "type": "scattergeo", "latsrc": "lviktor:61:a6a407", "lonsrc": "lviktor:61:909750", "marker": { "line": { "width": 0 }, "angle": -149.41530296142219, "color": "rgb(152, 78, 163)", "symbol": "circle", "opacity": 1, "sizesrc": "lviktor:61:0ca908" }, "hoverinfo": "text", "locationmode": "country names" }, { "line": { "color": "rgb(152, 78, 163)", "width": 0.5104700000000001 }, "mode": "lines+markers", "name": "POL to France: 51047 Tons", "text": "POL to France: 51047 Tons", "type": "scattergeo", "latsrc": "lviktor:61:73a097", "lonsrc": "lviktor:61:26e819", "marker": { "line": { "width": 0 }, "angle": -109.90722102210212, "color": "rgb(152, 78, 163)", "symbol": "circle", "opacity": 1, "sizesrc": "lviktor:61:feb635" }, "hoverinfo": "text", "locationmode": "country names" }, { "line": { "color": "rgb(247, 129, 191)", "width": 1.47757 }, "mode": "lines+markers", "name": "PRT to Spain: 147757 Tons", "text": "PRT to Spain: 147757 Tons", "type": "scattergeo", "latsrc": "lviktor:61:cd6b00", "lonsrc": "lviktor:61:b26645", "marker": { "line": { "width": 0 }, "angle": 79.49004289093159, "color": "rgb(247, 129, 191)", "symbol": "circle", "opacity": 1, "sizesrc": "lviktor:61:9046bd" }, "hoverinfo": "text", "locationmode": "country names" }, { "line": { "color": "rgb(106, 61, 154)", "width": 0.9664900000000001 }, "mode": "lines+markers", "name": "GBR to Ireland: 96649 Tons", "text": "GBR to Ireland: 96649 Tons", "type": "scattergeo", "latsrc": "lviktor:61:83249c", "lonsrc": "lviktor:61:3dc640", "marker": { "line": { "width": 0 }, "angle": -100.27927028869813, "color": "rgb(106, 61, 154)", "symbol": "circle", "opacity": 1, "sizesrc": "lviktor:61:263d6c" }, "hoverinfo": "text", "locationmode": "country names" }, { "line": { "color": "rgb(255, 127, 0)", "width": 11.848590000000002 }, "mode": "lines+markers", "name": "SWE to United Kingdom: 1184859 Tons", "text": "SWE to United Kingdom: 1184859 Tons", "type": "scattergeo", "latsrc": "lviktor:61:ca7b2b", "lonsrc": "lviktor:61:8637fd", "marker": { "line": { "width": 0 }, "angle": -124.13281257271218, "color": "rgb(255, 127, 0)", "symbol": "circle", "opacity": 1, "sizesrc": "lviktor:61:71278a" }, "hoverinfo": "text", "locationmode": "country names" }, { "line": { "color": "rgb(255, 127, 0)", "width": 4.83772 }, "mode": "lines+markers", "name": "SWE to Netherlands: 483772 Tons", "text": "SWE to Netherlands: 483772 Tons", "type": "scattergeo", "latsrc": "lviktor:61:bac50a", "lonsrc": "lviktor:61:df520f", "marker": { "line": { "width": 0 }, "angle": -148.2383221433501, "color": "rgb(255, 127, 0)", "symbol": "circle", "opacity": 1, "sizesrc": "lviktor:61:649751" }, "hoverinfo": "text", "locationmode": "country names" }, { "line": { "color": "rgb(255, 127, 0)", "width": 4.32099 }, "mode": "lines+markers", "name": "SWE to Norway: 432099 Tons", "text": "SWE to Norway: 432099 Tons", "type": "scattergeo", "latsrc": "lviktor:61:1759a9", "lonsrc": "lviktor:61:337d27", "marker": { "line": { "width": 0 }, "angle": -87.7923223076729, "color": "rgb(255, 127, 0)", "symbol": "circle", "opacity": 1, "sizesrc": "lviktor:61:e0de6c" }, "hoverinfo": "text", "locationmode": "country names" }, { "line": { "color": "rgb(255, 127, 0)", "width": 3.8919200000000003 }, "mode": "lines+markers", "name": "SWE to Denmark: 389192 Tons", "text": "SWE to Denmark: 389192 Tons", "type": "scattergeo", "latsrc": "lviktor:61:8d25d5", "lonsrc": "lviktor:61:95dc2f", "marker": { "line": { "width": 0 }, "angle": -154.60216823520264, "color": "rgb(255, 127, 0)", "symbol": "circle", "opacity": 1, "sizesrc": "lviktor:61:abfd27" }, "hoverinfo": "text", "locationmode": "country names" }, { "line": { "color": "rgb(255, 127, 0)", "width": 3.7045900000000005 }, "mode": "lines+markers", "name": "SWE to Germany: 370459 Tons", "text": "SWE to Germany: 370459 Tons", "type": "scattergeo", "latsrc": "lviktor:61:fff6a3", "lonsrc": "lviktor:61:5d3015", "marker": { "line": { "width": 0 }, "angle": -165.04894798231575, "color": "rgb(255, 127, 0)", "symbol": "circle", "opacity": 1, "sizesrc": "lviktor:61:f7ea9d" }, "hoverinfo": "text", "locationmode": "country names" }, { "line": { "color": "rgb(255, 127, 0)", "width": 1.8893700000000002 }, "mode": "lines+markers", "name": "SWE to Poland: 188937 Tons", "text": "SWE to Poland: 188937 Tons", "type": "scattergeo", "latsrc": "lviktor:61:aff135", "lonsrc": "lviktor:61:462293", "marker": { "line": { "width": 0 }, "angle": 162.6338682756906, "color": "rgb(255, 127, 0)", "symbol": "circle", "opacity": 1, "sizesrc": "lviktor:61:0bc5a2" }, "hoverinfo": "text", "locationmode": "country names" }, { "line": { "color": "rgb(255, 127, 0)", "width": 1.82807 }, "mode": "lines+markers", "name": "SWE to France: 182807 Tons", "text": "SWE to France: 182807 Tons", "type": "scattergeo", "latsrc": "lviktor:61:f37cf5", "lonsrc": "lviktor:61:b90b47", "marker": { "line": { "width": 0 }, "angle": -148.98541657373056, "color": "rgb(255, 127, 0)", "symbol": "circle", "opacity": 1, "sizesrc": "lviktor:61:9b1fd2" }, "hoverinfo": "text", "locationmode": "country names" }, { "line": { "color": "rgb(255, 127, 0)", "width": 1.3020500000000002 }, "mode": "lines+markers", "name": "SWE to Belgium: 130205 Tons", "text": "SWE to Belgium: 130205 Tons", "type": "scattergeo", "latsrc": "lviktor:61:45b5cc", "lonsrc": "lviktor:61:bb9987", "marker": { "line": { "width": 0 }, "angle": -148.8069387959069, "color": "rgb(255, 127, 0)", "symbol": "circle", "opacity": 1, "sizesrc": "lviktor:61:5c9df9" }, "hoverinfo": "text", "locationmode": "country names" }, { "line": { "color": "rgb(255, 127, 0)", "width": 0.7358500000000001 }, "mode": "lines+markers", "name": "SWE to Spain: 73585 Tons", "text": "SWE to Spain: 73585 Tons", "type": "scattergeo", "latsrc": "lviktor:61:97e560", "lonsrc": "lviktor:61:ced785", "marker": { "line": { "width": 0 }, "angle": -143.55781823612037, "color": "rgb(255, 127, 0)", "symbol": "circle", "opacity": 1, "sizesrc": "lviktor:61:2b14d5" }, "hoverinfo": "text", "locationmode": "country names" }, { "line": { "color": "rgb(255, 127, 0)", "width": 0.6246200000000001 }, "mode": "lines+markers", "name": "SWE to Estonia: 62462 Tons", "text": "SWE to Estonia: 62462 Tons", "type": "scattergeo", "latsrc": "lviktor:61:9fb3fb", "lonsrc": "lviktor:61:0a1599", "marker": { "line": { "width": 0 }, "angle": 120.03221627244608, "color": "rgb(255, 127, 0)", "symbol": "circle", "opacity": 1, "sizesrc": "lviktor:61:55436b" }, "hoverinfo": "text", "locationmode": "country names" }, { "line": { "color": "rgb(178, 223, 138)", "width": 0.9565800000000001 }, "mode": "lines+markers", "name": "EST to Latvia: 95658 Tons", "text": "EST to Latvia: 95658 Tons", "type": "scattergeo", "latsrc": "lviktor:61:b191a7", "lonsrc": "lviktor:61:30b3bb", "marker": { "line": { "width": 0 }, "angle": -179.73393905188595, "color": "rgb(178, 223, 138)", "symbol": "circle", "opacity": 1, "sizesrc": "lviktor:61:43da33" }, "hoverinfo": "text", "locationmode": "country names" }, { "line": { "color": "rgb(55, 126, 184)", "width": 1.16669 }, "mode": "lines+markers", "name": "NOR to Sweden: 116669 Tons", "text": "NOR to Sweden: 116669 Tons", "type": "scattergeo", "latsrc": "lviktor:61:96df6c", "lonsrc": "lviktor:61:09cb94", "marker": { "line": { "width": 0 }, "angle": 87.79232230767292, "color": "rgb(55, 126, 184)", "symbol": "circle", "opacity": 1, "sizesrc": "lviktor:61:b0d6c1" }, "hoverinfo": "text", "locationmode": "country names" }, { "line": { "color": "rgb(55, 126, 184)", "width": 0.57027 }, "mode": "lines+markers", "name": "NOR to Germany: 57027 Tons", "text": "NOR to Germany: 57027 Tons", "type": "scattergeo", "latsrc": "lviktor:61:258c0c", "lonsrc": "lviktor:61:215ef3", "marker": { "line": { "width": 0 }, "angle": 178.494009741421, "color": "rgb(55, 126, 184)", "symbol": "circle", "opacity": 1, "sizesrc": "lviktor:61:4f1d9b" }, "hoverinfo": "text", "locationmode": "country names" }, { "line": { "color": "rgb(55, 126, 184)", "width": 0.5317200000000001 }, "mode": "lines+markers", "name": "NOR to Denmark: 53172 Tons", "text": "NOR to Denmark: 53172 Tons", "type": "scattergeo", "latsrc": "lviktor:61:ec9764", "lonsrc": "lviktor:61:63d4e7", "marker": { "line": { "width": 0 }, "angle": -180.0, "color": "rgb(55, 126, 184)", "symbol": "circle", "opacity": 1, "sizesrc": "lviktor:61:acea38" }, "hoverinfo": "text", "locationmode": "country names" }, { "line": { "color": "rgb(55, 126, 184)", "width": 0.5429700000000001 }, "mode": "lines+markers", "name": "NOR to United Kingdom: 54297 Tons", "text": "NOR to United Kingdom: 54297 Tons", "type": "scattergeo", "latsrc": "lviktor:61:d9edfd", "lonsrc": "lviktor:61:5ccdd9", "marker": { "line": { "width": 0 }, "angle": -136.28865139099722, "color": "rgb(55, 126, 184)", "symbol": "circle", "opacity": 1, "sizesrc": "lviktor:61:e54da0" }, "hoverinfo": "text", "locationmode": "country names" }, { "line": { "color": "rgb(140, 86, 75)", "width": 0.72711 }, "mode": "lines+markers", "name": "DNK to Sweden: 72711 Tons", "text": "DNK to Sweden: 72711 Tons", "type": "scattergeo", "latsrc": "lviktor:61:1f3f61", "lonsrc": "lviktor:61:e8127a", "marker": { "line": { "width": 0 }, "angle": 21.10539668854898, "color": "rgb(140, 86, 75)", "symbol": "circle", "opacity": 1, "sizesrc": "lviktor:61:cf68bd" }, "hoverinfo": "text", "locationmode": "country names" }, { "line": { "color": "rgb(251, 154, 153)", "width": 3.7618700000000005 }, "mode": "lines+markers", "name": "FIN to United Kingdom: 376187 Tons", "text": "FIN to United Kingdom: 376187 Tons", "type": "scattergeo", "latsrc": "lviktor:61:6f03b3", "lonsrc": "lviktor:61:529c4a", "marker": { "line": { "width": 0 }, "angle": -112.05695690053413, "color": "rgb(251, 154, 153)", "symbol": "circle", "opacity": 1, "sizesrc": "lviktor:61:60526a" }, "hoverinfo": "text", "locationmode": "country names" }, { "line": { "color": "rgb(251, 154, 153)", "width": 2.5963900000000004 }, "mode": "lines+markers", "name": "FIN to Estonia: 259639 Tons", "text": "FIN to Estonia: 259639 Tons", "type": "scattergeo", "latsrc": "lviktor:61:30aabd", "lonsrc": "lviktor:61:beb4c3", "marker": { "line": { "width": 0 }, "angle": -174.55570923746188, "color": "rgb(251, 154, 153)", "symbol": "circle", "opacity": 1, "sizesrc": "lviktor:61:041427" }, "hoverinfo": "text", "locationmode": "country names" }, { "line": { "color": "rgb(251, 154, 153)", "width": 2.2456400000000003 }, "mode": "lines+markers", "name": "FIN to Germany: 224564 Tons", "text": "FIN to Germany: 224564 Tons", "type": "scattergeo", "latsrc": "lviktor:61:e98143", "lonsrc": "lviktor:61:abd64b", "marker": { "line": { "width": 0 }, "angle": -140.16647238571636, "color": "rgb(251, 154, 153)", "symbol": "circle", "opacity": 1, "sizesrc": "lviktor:61:62eb64" }, "hoverinfo": "text", "locationmode": "country names" }, { "line": { "color": "rgb(251, 154, 153)", "width": 2.11774 }, "mode": "lines+markers", "name": "FIN to France: 211774 Tons", "text": "FIN to France: 211774 Tons", "type": "scattergeo", "latsrc": "lviktor:61:f25019", "lonsrc": "lviktor:61:5de26b", "marker": { "line": { "width": 0 }, "angle": -132.0711260118332, "color": "rgb(251, 154, 153)", "symbol": "circle", "opacity": 1, "sizesrc": "lviktor:61:6d83fd" }, "hoverinfo": "text", "locationmode": "country names" }, { "line": { "color": "rgb(251, 154, 153)", "width": 1.33627 }, "mode": "lines+markers", "name": "FIN to Netherlands: 133627 Tons", "text": "FIN to Netherlands: 133627 Tons", "type": "scattergeo", "latsrc": "lviktor:61:381135", "lonsrc": "lviktor:61:c5d7fc", "marker": { "line": { "width": 0 }, "angle": -128.15674241039727, "color": "rgb(251, 154, 153)", "symbol": "circle", "opacity": 1, "sizesrc": "lviktor:61:557984" }, "hoverinfo": "text", "locationmode": "country names" }, { "line": { "color": "rgb(251, 154, 153)", "width": 0.8516600000000001 }, "mode": "lines+markers", "name": "FIN to Italy: 85166 Tons", "text": "FIN to Italy: 85166 Tons", "type": "scattergeo", "latsrc": "lviktor:61:8e6aa6", "lonsrc": "lviktor:61:e9d832", "marker": { "line": { "width": 0 }, "angle": -154.08327646924585, "color": "rgb(251, 154, 153)", "symbol": "circle", "opacity": 1, "sizesrc": "lviktor:61:90dfdd" }, "hoverinfo": "text", "locationmode": "country names" }, { "line": { "color": "rgb(251, 154, 153)", "width": 0.7536700000000001 }, "mode": "lines+markers", "name": "FIN to Austria: 75367 Tons", "text": "FIN to Austria: 75367 Tons", "type": "scattergeo", "latsrc": "lviktor:61:2a91b8", "lonsrc": "lviktor:61:49d1c0", "marker": { "line": { "width": 0 }, "angle": -152.90833536562846, "color": "rgb(251, 154, 153)", "symbol": "circle", "opacity": 1, "sizesrc": "lviktor:61:cac8ca" }, "hoverinfo": "text", "locationmode": "country names" }, { "line": { "color": "rgb(251, 154, 153)", "width": 0.6906500000000001 }, "mode": "lines+markers", "name": "FIN to Latvia: 69065 Tons", "text": "FIN to Latvia: 69065 Tons", "type": "scattergeo", "latsrc": "lviktor:61:2ba61e", "lonsrc": "lviktor:61:92766a", "marker": { "line": { "width": 0 }, "angle": -175.53749612802488, "color": "rgb(251, 154, 153)", "symbol": "circle", "opacity": 1, "sizesrc": "lviktor:61:e7046b" }, "hoverinfo": "text", "locationmode": "country names" }, { "line": { "color": "rgb(251, 154, 153)", "width": 0.6024400000000001 }, "mode": "lines+markers", "name": "FIN to Denmark: 60244 Tons", "text": "FIN to Denmark: 60244 Tons", "type": "scattergeo", "latsrc": "lviktor:61:aaa17e", "lonsrc": "lviktor:61:c66bc9", "marker": { "line": { "width": 0 }, "angle": -127.83347956998998, "color": "rgb(251, 154, 153)", "symbol": "circle", "opacity": 1, "sizesrc": "lviktor:61:73cb30" }, "hoverinfo": "text", "locationmode": "country names" }, { "line": { "color": "rgb(251, 154, 153)", "width": 0.6004 }, "mode": "lines+markers", "name": "FIN to Belgium: 60040 Tons", "text": "FIN to Belgium: 60040 Tons", "type": "scattergeo", "latsrc": "lviktor:61:0c9134", "lonsrc": "lviktor:61:c56768", "marker": { "line": { "width": 0 }, "angle": -129.76840258908715, "color": "rgb(251, 154, 153)", "symbol": "circle", "opacity": 1, "sizesrc": "lviktor:61:8d6604" }, "hoverinfo": "text", "locationmode": "country names" }, { "line": { "color": "rgb(251, 154, 153)", "width": 0.5696 }, "mode": "lines+markers", "name": "FIN to Spain: 56960 Tons", "text": "FIN to Spain: 56960 Tons", "type": "scattergeo", "latsrc": "lviktor:61:a9b053", "lonsrc": "lviktor:61:2d289e", "marker": { "line": { "width": 0 }, "angle": -129.38882988231276, "color": "rgb(251, 154, 153)", "symbol": "circle", "opacity": 1, "sizesrc": "lviktor:61:85c78a" }, "hoverinfo": "text", "locationmode": "country names" }, { "line": { "color": "rgb(251, 154, 153)", "width": 0.5545 }, "mode": "lines+markers", "name": "FIN to Poland: 55450 Tons", "text": "FIN to Poland: 55450 Tons", "type": "scattergeo", "latsrc": "lviktor:61:f7b81d", "lonsrc": "lviktor:61:049027", "marker": { "line": { "width": 0 }, "angle": -162.5621843767621, "color": "rgb(251, 154, 153)", "symbol": "circle", "opacity": 1, "sizesrc": "lviktor:61:262f5e" }, "hoverinfo": "text", "locationmode": "country names" }, { "line": { "color": "rgb(166, 206, 227)", "width": 1.4235200000000001 }, "mode": "lines+markers", "name": "LTU to Germany: 142352 Tons", "text": "LTU to Germany: 142352 Tons", "type": "scattergeo", "latsrc": "lviktor:61:5284bf", "lonsrc": "lviktor:61:a41880", "marker": { "line": { "width": 0 }, "angle": -115.41687094109008, "color": "rgb(166, 206, 227)", "symbol": "circle", "opacity": 1, "sizesrc": "lviktor:61:c2b4f2" }, "hoverinfo": "text", "locationmode": "country names" }, { "line": { "color": "rgb(166, 206, 227)", "width": 0.6041200000000001 }, "mode": "lines+markers", "name": "LTU to France: 60412 Tons", "text": "LTU to France: 60412 Tons", "type": "scattergeo", "latsrc": "lviktor:61:4b0904", "lonsrc": "lviktor:61:112ae6", "marker": { "line": { "width": 0 }, "angle": -116.84648641507599, "color": "rgb(166, 206, 227)", "symbol": "circle", "opacity": 1, "sizesrc": "lviktor:61:1cda66" }, "hoverinfo": "text", "locationmode": "country names" }, { "line": { "color": "rgb(202, 178, 214)", "width": 1.59051 }, "mode": "lines+markers", "name": "SVN to Italy: 159051 Tons", "text": "SVN to Italy: 159051 Tons", "type": "scattergeo", "latsrc": "lviktor:61:550581", "lonsrc": "lviktor:61:44bdb1", "marker": { "line": { "width": 0 }, "angle": -154.30398294757194, "color": "rgb(202, 178, 214)", "symbol": "circle", "opacity": 1, "sizesrc": "lviktor:61:9e0bfd" }, "hoverinfo": "text", "locationmode": "country names" }, { "line": { "color": "rgb(253, 191, 111)", "width": 5.10888 }, "mode": "lines+markers", "name": "DEU to France: 510888 Tons", "text": "DEU to France: 510888 Tons", "type": "scattergeo", "latsrc": "lviktor:61:cf3c95", "lonsrc": "lviktor:61:54443b", "marker": { "line": { "width": 0 }, "angle": -129.49974571106284, "color": "rgb(253, 191, 111)", "symbol": "circle", "opacity": 1, "sizesrc": "lviktor:61:3e4caa" }, "hoverinfo": "text", "locationmode": "country names" }, { "line": { "color": "rgb(253, 191, 111)", "width": 4.710800000000001 }, "mode": "lines+markers", "name": "DEU to Austria: 471080 Tons", "text": "DEU to Austria: 471080 Tons", "type": "scattergeo", "latsrc": "lviktor:61:19f1e6", "lonsrc": "lviktor:61:81dc54", "marker": { "line": { "width": 0 }, "angle": 144.3186194799946, "color": "rgb(253, 191, 111)", "symbol": "circle", "opacity": 1, "sizesrc": "lviktor:61:593619" }, "hoverinfo": "text", "locationmode": "country names" }, { "line": { "color": "rgb(253, 191, 111)", "width": 4.61441 }, "mode": "lines+markers", "name": "DEU to Belgium: 461441 Tons", "text": "DEU to Belgium: 461441 Tons", "type": "scattergeo", "latsrc": "lviktor:61:d73bf0", "lonsrc": "lviktor:61:31ffed", "marker": { "line": { "width": 0 }, "angle": -95.94298850401717, "color": "rgb(253, 191, 111)", "symbol": "circle", "opacity": 1, "sizesrc": "lviktor:61:a9fb85" }, "hoverinfo": "text", "locationmode": "country names" }, { "line": { "color": "rgb(253, 191, 111)", "width": 4.563910000000001 }, "mode": "lines+markers", "name": "DEU to Netherlands: 456391 Tons", "text": "DEU to Netherlands: 456391 Tons", "type": "scattergeo", "latsrc": "lviktor:61:e13d00", "lonsrc": "lviktor:61:1fdb25", "marker": { "line": { "width": 0 }, "angle": -63.49656991321723, "color": "rgb(253, 191, 111)", "symbol": "circle", "opacity": 1, "sizesrc": "lviktor:61:814f36" }, "hoverinfo": "text", "locationmode": "country names" }, { "line": { "color": "rgb(253, 191, 111)", "width": 3.1500700000000004 }, "mode": "lines+markers", "name": "DEU to Italy: 315007 Tons", "text": "DEU to Italy: 315007 Tons", "type": "scattergeo", "latsrc": "lviktor:61:0bfe4c", "lonsrc": "lviktor:61:9257fa", "marker": { "line": { "width": 0 }, "angle": 168.0842001979509, "color": "rgb(253, 191, 111)", "symbol": "circle", "opacity": 1, "sizesrc": "lviktor:61:fe2092" }, "hoverinfo": "text", "locationmode": "country names" }, { "line": { "color": "rgb(253, 191, 111)", "width": 2.4773300000000003 }, "mode": "lines+markers", "name": "DEU to United Kingdom: 247733 Tons", "text": "DEU to United Kingdom: 247733 Tons", "type": "scattergeo", "latsrc": "lviktor:61:809166", "lonsrc": "lviktor:61:ce74d0", "marker": { "line": { "width": 0 }, "angle": -64.58549710541996, "color": "rgb(253, 191, 111)", "symbol": "circle", "opacity": 1, "sizesrc": "lviktor:61:1e67cf" }, "hoverinfo": "text", "locationmode": "country names" }, { "line": { "color": "rgb(253, 191, 111)", "width": 1.9280800000000002 }, "mode": "lines+markers", "name": "DEU to Poland: 192808 Tons", "text": "DEU to Poland: 192808 Tons", "type": "scattergeo", "latsrc": "lviktor:61:70fb38", "lonsrc": "lviktor:61:17a42b", "marker": { "line": { "width": 0 }, "angle": 78.27015656162581, "color": "rgb(253, 191, 111)", "symbol": "circle", "opacity": 1, "sizesrc": "lviktor:61:d6f315" }, "hoverinfo": "text", "locationmode": "country names" }, { "line": { "color": "rgb(253, 191, 111)", "width": 1.07583 }, "mode": "lines+markers", "name": "DEU to Czech Republic: 107583 Tons", "text": "DEU to Czech Republic: 107583 Tons", "type": "scattergeo", "latsrc": "lviktor:61:7804e7", "lonsrc": "lviktor:61:0857c5", "marker": { "line": { "width": 0 }, "angle": 110.9293488526323, "color": "rgb(253, 191, 111)", "symbol": "circle", "opacity": 1, "sizesrc": "lviktor:61:1c813a" }, "hoverinfo": "text", "locationmode": "country names" }, { "line": { "color": "rgb(253, 191, 111)", "width": 0.9135200000000001 }, "mode": "lines+markers", "name": "DEU to Spain: 91352 Tons", "text": "DEU to Spain: 91352 Tons", "type": "scattergeo", "latsrc": "lviktor:61:8aceae", "lonsrc": "lviktor:61:ff995d", "marker": { "line": { "width": 0 }, "angle": -132.4327055714385, "color": "rgb(253, 191, 111)", "symbol": "circle", "opacity": 1, "sizesrc": "lviktor:61:d76858" }, "hoverinfo": "text", "locationmode": "country names" }, { "line": { "color": "rgb(253, 191, 111)", "width": 0.6543000000000001 }, "mode": "lines+markers", "name": "DEU to Switzerland: 65430 Tons", "text": "DEU to Switzerland: 65430 Tons", "type": "scattergeo", "latsrc": "lviktor:61:bceeb4", "lonsrc": "lviktor:61:ec8a57", "marker": { "line": { "width": 0 }, "angle": -157.9869614765162, "color": "rgb(253, 191, 111)", "symbol": "circle", "opacity": 1, "sizesrc": "lviktor:61:baa0ac" }, "hoverinfo": "text", "locationmode": "country names" }, { "line": { "color": "rgb(253, 191, 111)", "width": 0.50921 }, "mode": "lines+markers", "name": "DEU to Denmark: 50921 Tons", "text": "DEU to Denmark: 50921 Tons", "type": "scattergeo", "latsrc": "lviktor:61:eb9350", "lonsrc": "lviktor:61:ecb7ac", "marker": { "line": { "width": 0 }, "angle": -2.992640055408799, "color": "rgb(253, 191, 111)", "symbol": "circle", "opacity": 1, "sizesrc": "lviktor:61:eb0e0b" }, "hoverinfo": "text", "locationmode": "country names" }, { "line": { "color": "rgb(247, 129, 191)", "width": 8.17425 }, "mode": "lines+markers", "name": "LVA to United Kingdom: 817425 Tons", "text": "LVA to United Kingdom: 817425 Tons", "type": "scattergeo", "latsrc": "lviktor:61:cfe360", "lonsrc": "lviktor:61:ff2f73", "marker": { "line": { "width": 0 }, "angle": -89.70085023462117, "color": "rgb(247, 129, 191)", "symbol": "circle", "opacity": 1, "sizesrc": "lviktor:61:55a8d2" }, "hoverinfo": "text", "locationmode": "country names" }, { "line": { "color": "rgb(247, 129, 191)", "width": 2.0204400000000002 }, "mode": "lines+markers", "name": "LVA to Netherlands: 202044 Tons", "text": "LVA to Netherlands: 202044 Tons", "type": "scattergeo", "latsrc": "lviktor:61:c8dda4", "lonsrc": "lviktor:61:89179d", "marker": { "line": { "width": 0 }, "angle": -103.96582471014084, "color": "rgb(247, 129, 191)", "symbol": "circle", "opacity": 1, "sizesrc": "lviktor:61:682642" }, "hoverinfo": "text", "locationmode": "country names" }, { "line": { "color": "rgb(247, 129, 191)", "width": 1.6686900000000002 }, "mode": "lines+markers", "name": "LVA to Estonia: 166869 Tons", "text": "LVA to Estonia: 166869 Tons", "type": "scattergeo", "latsrc": "lviktor:61:1babb9", "lonsrc": "lviktor:61:c18a44", "marker": { "line": { "width": 0 }, "angle": 0.2545519030168464, "color": "rgb(247, 129, 191)", "symbol": "circle", "opacity": 1, "sizesrc": "lviktor:61:090b8c" }, "hoverinfo": "text", "locationmode": "country names" }, { "line": { "color": "rgb(247, 129, 191)", "width": 1.20144 }, "mode": "lines+markers", "name": "LVA to Lithuania: 120144 Tons", "text": "LVA to Lithuania: 120144 Tons", "type": "scattergeo", "latsrc": "lviktor:61:469f56", "lonsrc": "lviktor:61:7765cf", "marker": { "line": { "width": 0 }, "angle": -150.6861847452231, "color": "rgb(247, 129, 191)", "symbol": "circle", "opacity": 1, "sizesrc": "lviktor:61:4735a1" }, "hoverinfo": "text", "locationmode": "country names" }, { "line": { "color": "rgb(247, 129, 191)", "width": 1.16154 }, "mode": "lines+markers", "name": "LVA to Germany: 116154 Tons", "text": "LVA to Germany: 116154 Tons", "type": "scattergeo", "latsrc": "lviktor:61:383eea", "lonsrc": "lviktor:61:eea986", "marker": { "line": { "width": 0 }, "angle": -118.29246355183294, "color": "rgb(247, 129, 191)", "symbol": "circle", "opacity": 1, "sizesrc": "lviktor:61:674ec9" }, "hoverinfo": "text", "locationmode": "country names" }, { "line": { "color": "rgb(247, 129, 191)", "width": 0.81196 }, "mode": "lines+markers", "name": "LVA to Belgium: 81196 Tons", "text": "LVA to Belgium: 81196 Tons", "type": "scattergeo", "latsrc": "lviktor:61:6a588f", "lonsrc": "lviktor:61:99002f", "marker": { "line": { "width": 0 }, "angle": -109.4054656567425, "color": "rgb(247, 129, 191)", "symbol": "circle", "opacity": 1, "sizesrc": "lviktor:61:a174cc" }, "hoverinfo": "text", "locationmode": "country names" }, { "line": { "color": "rgb(255, 127, 0)", "width": 3.0597200000000004 }, "mode": "lines+markers", "name": "SVK to Hungary: 305972 Tons", "text": "SVK to Hungary: 305972 Tons", "type": "scattergeo", "latsrc": "lviktor:61:0416d1", "lonsrc": "lviktor:61:c71b93", "marker": { "line": { "width": 0 }, "angle": -174.95134873240255, "color": "rgb(255, 127, 0)", "symbol": "circle", "opacity": 1, "sizesrc": "lviktor:61:254bf3" }, "hoverinfo": "text", "locationmode": "country names" }, { "line": { "color": "rgb(255, 127, 0)", "width": 0.8680200000000001 }, "mode": "lines+markers", "name": "SVK to Poland: 86802 Tons", "text": "SVK to Poland: 86802 Tons", "type": "scattergeo", "latsrc": "lviktor:61:a87520", "lonsrc": "lviktor:61:8da19d", "marker": { "line": { "width": 0 }, "angle": 3.1856907396364136, "color": "rgb(255, 127, 0)", "symbol": "circle", "opacity": 1, "sizesrc": "lviktor:61:1b154f" }, "hoverinfo": "text", "locationmode": "country names" }, { "line": { "color": "rgb(255, 127, 0)", "width": 0.7512700000000001 }, "mode": "lines+markers", "name": "SVK to Italy: 75127 Tons", "text": "SVK to Italy: 75127 Tons", "type": "scattergeo", "latsrc": "lviktor:61:86a828", "lonsrc": "lviktor:61:73b13d", "marker": { "line": { "width": 0 }, "angle": -138.10684935296226, "color": "rgb(255, 127, 0)", "symbol": "circle", "opacity": 1, "sizesrc": "lviktor:61:3261b5" }, "hoverinfo": "text", "locationmode": "country names" }, { "line": { "color": "rgb(255, 127, 0)", "width": 0.5494800000000001 }, "mode": "lines+markers", "name": "SVK to Czech Republic: 54948 Tons", "text": "SVK to Czech Republic: 54948 Tons", "type": "scattergeo", "latsrc": "lviktor:61:d27c04", "lonsrc": "lviktor:61:26f2fe", "marker": { "line": { "width": 0 }, "angle": -65.80745963255295, "color": "rgb(255, 127, 0)", "symbol": "circle", "opacity": 1, "sizesrc": "lviktor:61:7fcb80" }, "hoverinfo": "text", "locationmode": "country names" }, { "line": { "color": "rgb(228, 26, 28)", "width": 0.58767 }, "mode": "lines+markers", "name": "NLD to Belgium: 58767 Tons", "text": "NLD to Belgium: 58767 Tons", "type": "scattergeo", "latsrc": "lviktor:61:78e305", "lonsrc": "lviktor:61:8d320a", "marker": { "line": { "width": 0 }, "angle": -159.67074541498147, "color": "rgb(228, 26, 28)", "symbol": "circle", "opacity": 1, "sizesrc": "lviktor:61:531884" }, "hoverinfo": "text", "locationmode": "country names" }, { "line": { "color": "rgb(228, 26, 28)", "width": 0.5186700000000001 }, "mode": "lines+markers", "name": "NLD to United Kingdom: 51867 Tons", "text": "NLD to United Kingdom: 51867 Tons", "type": "scattergeo", "latsrc": "lviktor:61:852e02", "lonsrc": "lviktor:61:a1b1a9", "marker": { "line": { "width": 0 }, "angle": -68.99369265202876, "color": "rgb(228, 26, 28)", "symbol": "circle", "opacity": 1, "sizesrc": "lviktor:61:c6e008" }, "hoverinfo": "text", "locationmode": "country names" }, { "line": { "color": "rgb(247, 129, 191)", "width": 1.4850200000000002 }, "mode": "lines+markers", "name": "HRV to Italy: 148502 Tons", "text": "HRV to Italy: 148502 Tons", "type": "scattergeo", "latsrc": "lviktor:61:a731b5", "lonsrc": "lviktor:61:5e583f", "marker": { "line": { "width": 0 }, "angle": -142.2477919675032, "color": "rgb(247, 129, 191)", "symbol": "circle", "opacity": 1, "sizesrc": "lviktor:61:8e6628" }, "hoverinfo": "text", "locationmode": "country names" }, { "line": { "color": "rgb(247, 129, 191)", "width": 0.66266 }, "mode": "lines+markers", "name": "HRV to Bosnia and Herzegovina: 66266 Tons", "text": "HRV to Bosnia and Herzegovina: 66266 Tons", "type": "scattergeo", "latsrc": "lviktor:61:b41499", "lonsrc": "lviktor:61:fc8519", "marker": { "line": { "width": 0 }, "angle": 122.93846914326014, "color": "rgb(247, 129, 191)", "symbol": "circle", "opacity": 1, "sizesrc": "lviktor:61:92b32a" }, "hoverinfo": "text", "locationmode": "country names" }, { "line": { "color": "rgb(247, 129, 191)", "width": 0.65303 }, "mode": "lines+markers", "name": "HRV to Slovenia: 65303 Tons", "text": "HRV to Slovenia: 65303 Tons", "type": "scattergeo", "latsrc": "lviktor:61:5aaf47", "lonsrc": "lviktor:61:da721e", "marker": { "line": { "width": 0 }, "angle": -7.674554018338625, "color": "rgb(247, 129, 191)", "symbol": "circle", "opacity": 1, "sizesrc": "lviktor:61:40a5b9" }, "hoverinfo": "text", "locationmode": "country names" }, { "line": { "color": "rgb(247, 129, 191)", "width": 0.55462 }, "mode": "lines+markers", "name": "HRV to Austria: 55462 Tons", "text": "HRV to Austria: 55462 Tons", "type": "scattergeo", "latsrc": "lviktor:61:9808ec", "lonsrc": "lviktor:61:54f117", "marker": { "line": { "width": 0 }, "angle": -15.238206360743504, "color": "rgb(247, 129, 191)", "symbol": "circle", "opacity": 1, "sizesrc": "lviktor:61:e0428d" }, "hoverinfo": "text", "locationmode": "country names" }, { "line": { "color": "rgb(177, 89, 40)", "width": 1.30085 }, "mode": "lines+markers", "name": "UKR to Hungary: 130085 Tons", "text": "UKR to Hungary: 130085 Tons", "type": "scattergeo", "latsrc": "lviktor:61:c4770e", "lonsrc": "lviktor:61:21989e", "marker": { "line": { "width": 0 }, "angle": -97.70607253711874, "color": "rgb(177, 89, 40)", "symbol": "circle", "opacity": 1, "sizesrc": "lviktor:61:111f10" }, "hoverinfo": "text", "locationmode": "country names" }, { "line": { "color": "rgb(177, 89, 40)", "width": 1.12968 }, "mode": "lines+markers", "name": "UKR to Italy: 112968 Tons", "text": "UKR to Italy: 112968 Tons", "type": "scattergeo", "latsrc": "lviktor:61:bb4b14", "lonsrc": "lviktor:61:9e44ff", "marker": { "line": { "width": 0 }, "angle": -107.67917216320673, "color": "rgb(177, 89, 40)", "symbol": "circle", "opacity": 1, "sizesrc": "lviktor:61:69ce4f" }, "hoverinfo": "text", "locationmode": "country names" }, { "line": { "color": "rgb(177, 89, 40)", "width": 1.05841 }, "mode": "lines+markers", "name": "UKR to Poland: 105841 Tons", "text": "UKR to Poland: 105841 Tons", "type": "scattergeo", "latsrc": "lviktor:61:d9aa5f", "lonsrc": "lviktor:61:2e594a", "marker": { "line": { "width": 0 }, "angle": -63.9789456902991, "color": "rgb(177, 89, 40)", "symbol": "circle", "opacity": 1, "sizesrc": "lviktor:61:9891e6" }, "hoverinfo": "text", "locationmode": "country names" }, { "line": { "color": "rgb(177, 89, 40)", "width": 0.8857100000000001 }, "mode": "lines+markers", "name": "UKR to Germany: 88571 Tons", "text": "UKR to Germany: 88571 Tons", "type": "scattergeo", "latsrc": "lviktor:61:bc9f1f", "lonsrc": "lviktor:61:43199d", "marker": { "line": { "width": 0 }, "angle": -72.8971637190895, "color": "rgb(177, 89, 40)", "symbol": "circle", "opacity": 1, "sizesrc": "lviktor:61:6fa035" }, "hoverinfo": "text", "locationmode": "country names" }, { "line": { "color": "rgb(177, 89, 40)", "width": 0.73184 }, "mode": "lines+markers", "name": "UKR to Romania: 73184 Tons", "text": "UKR to Romania: 73184 Tons", "type": "scattergeo", "latsrc": "lviktor:61:703a38", "lonsrc": "lviktor:61:7718c4", "marker": { "line": { "width": 0 }, "angle": -119.77161558765268, "color": "rgb(177, 89, 40)", "symbol": "circle", "opacity": 1, "sizesrc": "lviktor:61:19346f" }, "hoverinfo": "text", "locationmode": "country names" }, { "line": { "color": "rgb(177, 89, 40)", "width": 0.57237 }, "mode": "lines+markers", "name": "UKR to Lithuania: 57237 Tons", "text": "UKR to Lithuania: 57237 Tons", "type": "scattergeo", "latsrc": "lviktor:61:5d9090", "lonsrc": "lviktor:61:c26846", "marker": { "line": { "width": 0 }, "angle": -31.706565175697023, "color": "rgb(177, 89, 40)", "symbol": "circle", "opacity": 1, "sizesrc": "lviktor:61:c1cafd" }, "hoverinfo": "text", "locationmode": "country names" }, { "line": { "color": "rgb(255, 255, 51)", "width": 0.9358500000000001 }, "mode": "lines+markers", "name": "BIH to Croatia: 93585 Tons", "text": "BIH to Croatia: 93585 Tons", "type": "scattergeo", "latsrc": "lviktor:61:954de0", "lonsrc": "lviktor:61:b18903", "marker": { "line": { "width": 0 }, "angle": -55.32343069077541, "color": "rgb(255, 255, 51)", "symbol": "circle", "opacity": 1, "sizesrc": "lviktor:61:da6650" }, "hoverinfo": "text", "locationmode": "country names" }, { "line": { "color": "rgb(255, 255, 51)", "width": 0.51795 }, "mode": "lines+markers", "name": "BIH to Italy: 51795 Tons", "text": "BIH to Italy: 51795 Tons", "type": "scattergeo", "latsrc": "lviktor:61:67467b", "lonsrc": "lviktor:61:a1d717", "marker": { "line": { "width": 0 }, "angle": -105.41067901295992, "color": "rgb(255, 255, 51)", "symbol": "circle", "opacity": 1, "sizesrc": "lviktor:61:feb913" }, "hoverinfo": "text", "locationmode": "country names" }, { "line": { "color": "rgb(102, 194, 165)", "width": 3.21646 }, "mode": "lines+markers", "name": "CZE to Austria: 321646 Tons", "text": "CZE to Austria: 321646 Tons", "type": "scattergeo", "latsrc": "lviktor:61:3f908e", "lonsrc": "lviktor:61:311c7f", "marker": { "line": { "width": 0 }, "angle": -158.80805127609625, "color": "rgb(102, 194, 165)", "symbol": "circle", "opacity": 1, "sizesrc": "lviktor:61:1202f3" }, "hoverinfo": "text", "locationmode": "country names" }, { "line": { "color": "rgb(102, 194, 165)", "width": 2.9863700000000004 }, "mode": "lines+markers", "name": "CZE to Germany: 298637 Tons", "text": "CZE to Germany: 298637 Tons", "type": "scattergeo", "latsrc": "lviktor:61:f480b5", "lonsrc": "lviktor:61:ddbc05", "marker": { "line": { "width": 0 }, "angle": -65.19513481819659, "color": "rgb(102, 194, 165)", "symbol": "circle", "opacity": 1, "sizesrc": "lviktor:61:40a5c5" }, "hoverinfo": "text", "locationmode": "country names" }, { "line": { "color": "rgb(102, 194, 165)", "width": 1.6566900000000002 }, "mode": "lines+markers", "name": "CZE to Italy: 165669 Tons", "text": "CZE to Italy: 165669 Tons", "type": "scattergeo", "latsrc": "lviktor:61:8b85c3", "lonsrc": "lviktor:61:f37d17", "marker": { "line": { "width": 0 }, "angle": -164.40451167748526, "color": "rgb(102, 194, 165)", "symbol": "circle", "opacity": 1, "sizesrc": "lviktor:61:b91f40" }, "hoverinfo": "text", "locationmode": "country names" }, { "line": { "color": "rgb(102, 194, 165)", "width": 1.2636800000000001 }, "mode": "lines+markers", "name": "CZE to Slovenia: 126368 Tons", "text": "CZE to Slovenia: 126368 Tons", "type": "scattergeo", "latsrc": "lviktor:61:e89c4c", "lonsrc": "lviktor:61:fd8b24", "marker": { "line": { "width": 0 }, "angle": -174.83953294342186, "color": "rgb(102, 194, 165)", "symbol": "circle", "opacity": 1, "sizesrc": "lviktor:61:4e4fe1" }, "hoverinfo": "text", "locationmode": "country names" }, { "line": { "color": "rgb(102, 194, 165)", "width": 0.8905400000000001 }, "mode": "lines+markers", "name": "CZE to Slovakia: 89054 Tons", "text": "CZE to Slovakia: 89054 Tons", "type": "scattergeo", "latsrc": "lviktor:61:8969b3", "lonsrc": "lviktor:61:5b6d67", "marker": { "line": { "width": 0 }, "angle": 110.9906164366688, "color": "rgb(102, 194, 165)", "symbol": "circle", "opacity": 1, "sizesrc": "lviktor:61:6847bf" }, "hoverinfo": "text", "locationmode": "country names" }, { "line": { "color": "rgb(102, 194, 165)", "width": 0.6276400000000001 }, "mode": "lines+markers", "name": "CZE to Poland: 62764 Tons", "text": "CZE to Poland: 62764 Tons", "type": "scattergeo", "latsrc": "lviktor:61:aa1ab9", "lonsrc": "lviktor:61:85a43a", "marker": { "line": { "width": 0 }, "angle": 50.85800841183817, "color": "rgb(102, 194, 165)", "symbol": "circle", "opacity": 1, "sizesrc": "lviktor:61:f559ef" }, "hoverinfo": "text", "locationmode": "country names" } ], "layout": { "geo": { "center": { "lat": 48, "lon": 10 }, "lataxis": { "range": [ 35, 60 ] }, "lonaxis": { "range": [ -5, 25 ] }, "showland": true, "landcolor": "rgb(243, 243, 243)", "showocean": true, "oceancolor": "rgb(215, 230, 250)", "projection": { "type": "equirectangular" }, "countrycolor": "rgb(204, 204, 204)", "showcountries": true }, "title": { "text": "Exports Volume of 4407: for European Countries" }, "template": { "data": { "bar": [ { "type": "bar", "marker": { "line": { "color": "#E5ECF6", "width": 0.5 }, "pattern": { "size": 10, "fillmode": "overlay", "solidity": 0.2 } }, "error_x": { "color": "#2a3f5f" }, "error_y": { "color": "#2a3f5f" } } ], "pie": [ { "type": "pie", "automargin": true } ], "table": [ { "type": "table", "cells": { "fill": { "color": "#EBF0F8" }, "line": { "color": "white" } }, "header": { "fill": { "color": "#C8D4E3" }, "line": { "color": "white" } } } ], "carpet": [ { "type": "carpet", "aaxis": { "gridcolor": "white", "linecolor": "white", "endlinecolor": "#2a3f5f", "minorgridcolor": "white", "startlinecolor": "#2a3f5f" }, "baxis": { "gridcolor": "white", "linecolor": "white", "endlinecolor": "#2a3f5f", "minorgridcolor": "white", "startlinecolor": "#2a3f5f" } } ], "mesh3d": [ { "type": "mesh3d", "colorbar": { "ticks": "", "outlinewidth": 0 } } ], "contour": [ { "type": "contour", "colorbar": { "ticks": "", "outlinewidth": 0 }, "colorscale": [ [ 0.0, "#0d0887" ], [ 0.1111111111111111, "#46039f" ], [ 0.2222222222222222, "#7201a8" ], [ 0.3333333333333333, "#9c179e" ], [ 0.4444444444444444, "#bd3786" ], [ 0.5555555555555556, "#d8576b" ], [ 0.6666666666666666, "#ed7953" ], [ 0.7777777777777778, "#fb9f3a" ], [ 0.8888888888888888, "#fdca26" ], [ 1.0, "#f0f921" ] ] } ], "heatmap": [ { "type": "heatmap", "colorbar": { "ticks": "", "outlinewidth": 0 }, "colorscale": [ [ 0.0, "#0d0887" ], [ 0.1111111111111111, "#46039f" ], [ 0.2222222222222222, "#7201a8" ], [ 0.3333333333333333, "#9c179e" ], [ 0.4444444444444444, "#bd3786" ], [ 0.5555555555555556, "#d8576b" ], [ 0.6666666666666666, "#ed7953" ], [ 0.7777777777777778, "#fb9f3a" ], [ 0.8888888888888888, "#fdca26" ], [ 1.0, "#f0f921" ] ] } ], "scatter": [ { "type": "scatter", "fillpattern": { "size": 10, "fillmode": "overlay", "solidity": 0.2 } } ], "surface": [ { "type": "surface", "colorbar": { "ticks": "", "outlinewidth": 0 }, "colorscale": [ [ 0.0, "#0d0887" ], [ 0.1111111111111111, "#46039f" ], [ 0.2222222222222222, "#7201a8" ], [ 0.3333333333333333, "#9c179e" ], [ 0.4444444444444444, "#bd3786" ], [ 0.5555555555555556, "#d8576b" ], [ 0.6666666666666666, "#ed7953" ], [ 0.7777777777777778, "#fb9f3a" ], [ 0.8888888888888888, "#fdca26" ], [ 1.0, "#f0f921" ] ] } ], "barpolar": [ { "type": "barpolar", "marker": { "line": { "color": "#E5ECF6", "width": 0.5 }, "pattern": { "size": 10, "fillmode": "overlay", "solidity": 0.2 } } } ], "heatmapgl": [ { "type": "heatmapgl", "colorbar": { "ticks": "", "outlinewidth": 0 }, "colorscale": [ [ 0.0, "#0d0887" ], [ 0.1111111111111111, "#46039f" ], [ 0.2222222222222222, "#7201a8" ], [ 0.3333333333333333, "#9c179e" ], [ 0.4444444444444444, "#bd3786" ], [ 0.5555555555555556, "#d8576b" ], [ 0.6666666666666666, "#ed7953" ], [ 0.7777777777777778, "#fb9f3a" ], [ 0.8888888888888888, "#fdca26" ], [ 1.0, "#f0f921" ] ] } ], "histogram": [ { "type": "histogram", "marker": { "pattern": { "size": 10, "fillmode": "overlay", "solidity": 0.2 } } } ], "parcoords": [ { "line": { "colorbar": { "ticks": "", "outlinewidth": 0 } }, "type": "parcoords" } ], "scatter3d": [ { "line": { "colorbar": { "ticks": "", "outlinewidth": 0 } }, "type": "scatter3d", "marker": { "colorbar": { "ticks": "", "outlinewidth": 0 } } } ], "scattergl": [ { "type": "scattergl", "marker": { "colorbar": { "ticks": "", "outlinewidth": 0 } } } ], "choropleth": [ { "type": "choropleth", "colorbar": { "ticks": "", "outlinewidth": 0 } } ], "scattergeo": [ { "type": "scattergeo", "marker": { "colorbar": { "ticks": "", "outlinewidth": 0 } } } ], "histogram2d": [ { "type": "histogram2d", "colorbar": { "ticks": "", "outlinewidth": 0 }, "colorscale": [ [ 0.0, "#0d0887" ], [ 0.1111111111111111, "#46039f" ], [ 0.2222222222222222, "#7201a8" ], [ 0.3333333333333333, "#9c179e" ], [ 0.4444444444444444, "#bd3786" ], [ 0.5555555555555556, "#d8576b" ], [ 0.6666666666666666, "#ed7953" ], [ 0.7777777777777778, "#fb9f3a" ], [ 0.8888888888888888, "#fdca26" ], [ 1.0, "#f0f921" ] ] } ], "scatterpolar": [ { "type": "scatterpolar", "marker": { "colorbar": { "ticks": "", "outlinewidth": 0 } } } ], "contourcarpet": [ { "type": "contourcarpet", "colorbar": { "ticks": "", "outlinewidth": 0 } } ], "scattercarpet": [ { "type": "scattercarpet", "marker": { "colorbar": { "ticks": "", "outlinewidth": 0 } } } ], "scattermapbox": [ { "type": "scattermapbox", "marker": { "colorbar": { "ticks": "", "outlinewidth": 0 } } } ], "scatterpolargl": [ { "type": "scatterpolargl", "marker": { "colorbar": { "ticks": "", "outlinewidth": 0 } } } ], "scatterternary": [ { "type": "scatterternary", "marker": { "colorbar": { "ticks": "", "outlinewidth": 0 } } } ], "histogram2dcontour": [ { "type": "histogram2dcontour", "colorbar": { "ticks": "", "outlinewidth": 0 }, "colorscale": [ [ 0.0, "#0d0887" ], [ 0.1111111111111111, "#46039f" ], [ 0.2222222222222222, "#7201a8" ], [ 0.3333333333333333, "#9c179e" ], [ 0.4444444444444444, "#bd3786" ], [ 0.5555555555555556, "#d8576b" ], [ 0.6666666666666666, "#ed7953" ], [ 0.7777777777777778, "#fb9f3a" ], [ 0.8888888888888888, "#fdca26" ], [ 1.0, "#f0f921" ] ] } ] }, "layout": { "geo": { "bgcolor": "white", "showland": true, "lakecolor": "white", "landcolor": "#E5ECF6", "showlakes": true, "subunitcolor": "white" }, "font": { "color": "#2a3f5f" }, "polar": { "bgcolor": "#E5ECF6", "radialaxis": { "ticks": "", "gridcolor": "white", "linecolor": "white" }, "angularaxis": { "ticks": "", "gridcolor": "white", "linecolor": "white" } }, "scene": { "xaxis": { "ticks": "", "gridcolor": "white", "gridwidth": 2, "linecolor": "white", "zerolinecolor": "white", "showbackground": true, "backgroundcolor": "#E5ECF6" }, "yaxis": { "ticks": "", "gridcolor": "white", "gridwidth": 2, "linecolor": "white", "zerolinecolor": "white", "showbackground": true, "backgroundcolor": "#E5ECF6" }, "zaxis": { "ticks": "", "gridcolor": "white", "gridwidth": 2, "linecolor": "white", "zerolinecolor": "white", "showbackground": true, "backgroundcolor": "#E5ECF6" } }, "title": { "x": 0.05 }, "xaxis": { "ticks": "", "title": { "standoff": 15 }, "gridcolor": "white", "linecolor": "white", "automargin": true, "zerolinecolor": "white", "zerolinewidth": 2 }, "yaxis": { "ticks": "", "title": { "standoff": 15 }, "gridcolor": "white", "linecolor": "white", "automargin": true, "zerolinecolor": "white", "zerolinewidth": 2 }, "mapbox": { "style": "light" }, "ternary": { "aaxis": { "ticks": "", "gridcolor": "white", "linecolor": "white" }, "baxis": { "ticks": "", "gridcolor": "white", "linecolor": "white" }, "caxis": { "ticks": "", "gridcolor": "white", "linecolor": "white" }, "bgcolor": "#E5ECF6" }, "colorway": [ "#636efa", "#EF553B", "#00cc96", "#ab63fa", "#FFA15A", "#19d3f3", "#FF6692", "#B6E880", "#FF97FF", "#FECB52" ], "coloraxis": { "colorbar": { "ticks": "", "outlinewidth": 0 } }, "hovermode": "closest", "colorscale": { "diverging": [ [ 0, "#8e0152" ], [ 0.1, "#c51b7d" ], [ 0.2, "#de77ae" ], [ 0.3, "#f1b6da" ], [ 0.4, "#fde0ef" ], [ 0.5, "#f7f7f7" ], [ 0.6, "#e6f5d0" ], [ 0.7, "#b8e186" ], [ 0.8, "#7fbc41" ], [ 0.9, "#4d9221" ], [ 1, "#276419" ] ], "sequential": [ [ 0.0, "#0d0887" ], [ 0.1111111111111111, "#46039f" ], [ 0.2222222222222222, "#7201a8" ], [ 0.3333333333333333, "#9c179e" ], [ 0.4444444444444444, "#bd3786" ], [ 0.5555555555555556, "#d8576b" ], [ 0.6666666666666666, "#ed7953" ], [ 0.7777777777777778, "#fb9f3a" ], [ 0.8888888888888888, "#fdca26" ], [ 1.0, "#f0f921" ] ], "sequentialminus": [ [ 0.0, "#0d0887" ], [ 0.1111111111111111, "#46039f" ], [ 0.2222222222222222, "#7201a8" ], [ 0.3333333333333333, "#9c179e" ], [ 0.4444444444444444, "#bd3786" ], [ 0.5555555555555556, "#d8576b" ], [ 0.6666666666666666, "#ed7953" ], [ 0.7777777777777778, "#fb9f3a" ], [ 0.8888888888888888, "#fdca26" ], [ 1.0, "#f0f921" ] ] }, "hoverlabel": { "align": "left" }, "plot_bgcolor": "#E5ECF6", "paper_bgcolor": "white", "shapedefaults": { "line": { "color": "#2a3f5f" } }, "autotypenumbers": "strict", "annotationdefaults": { "arrowhead": 0, "arrowcolor": "#2a3f5f", "arrowwidth": 1 } } } } }, "height": null, "width": null, "user": { "profile_url": "https://chart-studio.plotly.com/~lviktor", "avatar_url": "https://storage.googleapis.com/plotly-prod-profiles/21.jpg", "background_url": "https://storage.googleapis.com/plotly-prod-profiles/bg-3.jpg", "bio": "", "nickname": "", "website": "", "stream_tokens": null, "feature_set_id": null, "csrf_token": null, "date_joined": "2024-03-28 14:45:39", "mapbox_access_tokens": null, "has_password": null, "username": "lviktor", "email": null, "is_active": null, "readonly": null, "is_dash_creator": null, "dash_created_count": null, "is_chart_creator": null, "charts_created_count": null } }, { "creation_time": "2024-03-28T15:27:49.550215Z", "comments": { "results": [], "count": 0 }, "parented": true, "embed_url": "https://chart-studio.plotly.com/~reinout.kramer/3.embed", "fid": "reinout.kramer:3", "filename": "Plot 3", "filetype": "plot", "img_url": "https://storage.googleapis.com/plotly-prod-images/reinout.kramer/3/9_4S1RG7ELGCC2JDGWSERUMGQAVNF4IH.png", "image_urls": { "default": "https://storage.googleapis.com/plotly-prod-images/reinout.kramer/3/2_B32B2F2RVQMHXOYENUI2IW6TJIQRKC.png", "block-thumb": "https://storage.googleapis.com/plotly-prod-images/reinout.kramer/3/8_K4VBIVD8CZWUSEDLRKBQB94PZT8976.png", "list-thumb": "https://storage.googleapis.com/plotly-prod-images/reinout.kramer/3/9_4S1RG7ELGCC2JDGWSERUMGQAVNF4IH.png" }, "api_urls": { "files": "https://api.plotly.com/v2/files/reinout.kramer:3", "plots": "https://api.plotly.com/v2/plots/reinout.kramer:3", "parent": "https://api.plotly.com/v2/folders/home?user=reinout.kramer" }, "owner": "reinout.kramer", "parent": -1, "preview": "", "referencers": [], "references": [], "title": "", "views": 6, "web_url": "https://chart-studio.plotly.com/~reinout.kramer/3/", "world_readable": true, "date_modified": "2024-03-28T15:27:49.560Z", "stars": { "results": [], "count": 0 }, "collaborators": { "results": [], "count": 0 }, "subfolder_count": null, "refresh_interval": null, "organize_view_url": "https://chart-studio.plotly.com/~reinout.kramer/3/", "current_user_permission": "read", "is_theme": null, "is_template": false, "autosize": true, "caption": "", "figure": { "data": [ { "meta": { "columnNames": { "x": "A", "y": "B" } }, "mode": "lines", "type": "scatter", "xsrc": "reinout.kramer:2:d42b56", "ysrc": "reinout.kramer:2:3db9d2" } ], "frames": [], "layout": { "xaxis": { "type": "date", "range": [ "2024-03-08 13:12:29", "2024-03-15 06:56:24" ], "title": { "text": "Date" }, "autorange": true }, "yaxis": { "type": "linear", "range": [ 0.38081666666666664, 0.47848333333333337 ], "title": { "text": "Strategy Performance" }, "autorange": true }, "autosize": true, "template": { "data": { "bar": [ { "type": "bar", "marker": { "colorbar": { "ticks": "", "outlinewidth": 0 } } } ], "table": [ { "type": "table", "cells": { "fill": { "color": "#EBF0F8" }, "line": { "color": "white" } }, "header": { "fill": { "color": "#C8D4E3" }, "line": { "color": "white" } } } ], "carpet": [ { "type": "carpet", "aaxis": { "gridcolor": "#C8D4E3", "linecolor": "#C8D4E3", "endlinecolor": "#2a3f5f", "minorgridcolor": "#C8D4E3", "startlinecolor": "#2a3f5f" }, "baxis": { "gridcolor": "#C8D4E3", "linecolor": "#C8D4E3", "endlinecolor": "#2a3f5f", "minorgridcolor": "#C8D4E3", "startlinecolor": "#2a3f5f" } } ], "mesh3d": [ { "type": "mesh3d", "colorbar": { "ticks": "", "outlinewidth": 0 } } ], "contour": [ { "type": "contour", "colorbar": { "ticks": "", "outlinewidth": 0 }, "autocolorscale": true } ], "heatmap": [ { "type": "heatmap", "colorbar": { "ticks": "", "outlinewidth": 0 }, "autocolorscale": true } ], "scatter": [ { "type": "scatter", "marker": { "colorbar": { "ticks": "", "outlinewidth": 0 } } } ], "surface": [ { "type": "surface", "colorbar": { "ticks": "", "outlinewidth": 0 } } ], "heatmapgl": [ { "type": "heatmapgl", "colorbar": { "ticks": "", "outlinewidth": 0 } } ], "histogram": [ { "type": "histogram", "marker": { "colorbar": { "ticks": "", "outlinewidth": 0 } } } ], "parcoords": [ { "line": { "colorbar": { "ticks": "", "outlinewidth": 0 } }, "type": "parcoords" } ], "scatter3d": [ { "type": "scatter3d", "marker": { "colorbar": { "ticks": "", "outlinewidth": 0 } } } ], "scattergl": [ { "type": "scattergl", "marker": { "colorbar": { "ticks": "", "outlinewidth": 0 } } } ], "choropleth": [ { "type": "choropleth", "colorbar": { "ticks": "", "outlinewidth": 0 } } ], "scattergeo": [ { "type": "scattergeo", "marker": { "colorbar": { "ticks": "", "outlinewidth": 0 } } } ], "histogram2d": [ { "type": "histogram2d", "colorbar": { "ticks": "", "outlinewidth": 0 }, "autocolorscale": true } ], "scatterpolar": [ { "type": "scatterpolar", "marker": { "colorbar": { "ticks": "", "outlinewidth": 0 } } } ], "contourcarpet": [ { "type": "contourcarpet", "colorbar": { "ticks": "", "outlinewidth": 0 } } ], "scattercarpet": [ { "type": "scattercarpet", "marker": { "colorbar": { "ticks": "", "outlinewidth": 0 } } } ], "scattermapbox": [ { "type": "scattermapbox", "marker": { "colorbar": { "ticks": "", "outlinewidth": 0 } } } ], "scatterpolargl": [ { "type": "scatterpolargl", "marker": { "colorbar": { "ticks": "", "outlinewidth": 0 } } } ], "scatterternary": [ { "type": "scatterternary", "marker": { "colorbar": { "ticks": "", "outlinewidth": 0 } } } ], "histogram2dcontour": [ { "type": "histogram2dcontour", "colorbar": { "ticks": "", "outlinewidth": 0 }, "autocolorscale": true } ] }, "layout": { "geo": { "bgcolor": "white", "showland": true, "lakecolor": "white", "landcolor": "white", "showlakes": true, "subunitcolor": "#C8D4E3" }, "font": { "color": "#2a3f5f" }, "polar": { "bgcolor": "white", "radialaxis": { "ticks": "", "gridcolor": "#EBF0F8", "linecolor": "#EBF0F8" }, "angularaxis": { "ticks": "", "gridcolor": "#EBF0F8", "linecolor": "#EBF0F8" } }, "scene": { "xaxis": { "ticks": "", "gridcolor": "#DFE8F3", "gridwidth": 2, "linecolor": "#EBF0F8", "zerolinecolor": "#EBF0F8", "showbackground": true, "backgroundcolor": "white" }, "yaxis": { "ticks": "", "gridcolor": "#DFE8F3", "gridwidth": 2, "linecolor": "#EBF0F8", "zerolinecolor": "#EBF0F8", "showbackground": true, "backgroundcolor": "white" }, "zaxis": { "ticks": "", "gridcolor": "#DFE8F3", "gridwidth": 2, "linecolor": "#EBF0F8", "zerolinecolor": "#EBF0F8", "showbackground": true, "backgroundcolor": "white" } }, "title": { "x": 0.05 }, "xaxis": { "ticks": "", "gridcolor": "#EBF0F8", "linecolor": "#EBF0F8", "automargin": true, "zerolinecolor": "#EBF0F8", "zerolinewidth": 2 }, "yaxis": { "ticks": "", "gridcolor": "#EBF0F8", "linecolor": "#EBF0F8", "automargin": true, "zerolinecolor": "#EBF0F8", "zerolinewidth": 2 }, "ternary": { "aaxis": { "ticks": "", "gridcolor": "#DFE8F3", "linecolor": "#A2B1C6" }, "baxis": { "ticks": "", "gridcolor": "#DFE8F3", "linecolor": "#A2B1C6" }, "caxis": { "ticks": "", "gridcolor": "#DFE8F3", "linecolor": "#A2B1C6" }, "bgcolor": "white" }, "colorway": [ "#636efa", "#EF553B", "#00cc96", "#ab63fa", "#19d3f3", "#e763fa", "#fecb52", "#ffa15a", "#ff6692", "#b6e880" ], "hovermode": "closest", "colorscale": { "diverging": [ [ 0, "#8e0152" ], [ 0.1, "#c51b7d" ], [ 0.2, "#de77ae" ], [ 0.3, "#f1b6da" ], [ 0.4, "#fde0ef" ], [ 0.5, "#f7f7f7" ], [ 0.6, "#e6f5d0" ], [ 0.7, "#b8e186" ], [ 0.8, "#7fbc41" ], [ 0.9, "#4d9221" ], [ 1, "#276419" ] ], "sequential": [ [ 0, "#0508b8" ], [ 0.0893854748603352, "#1910d8" ], [ 0.1787709497206704, "#3c19f0" ], [ 0.2681564245810056, "#6b1cfb" ], [ 0.3575418994413408, "#981cfd" ], [ 0.44692737430167595, "#bf1cfd" ], [ 0.5363128491620112, "#dd2bfd" ], [ 0.6256983240223464, "#f246fe" ], [ 0.7150837988826816, "#fc67fd" ], [ 0.8044692737430168, "#fe88fc" ], [ 0.8938547486033519, "#fea5fd" ], [ 0.9832402234636871, "#febefe" ], [ 1, "#fec3fe" ] ], "sequentialminus": [ [ 0, "#0508b8" ], [ 0.0893854748603352, "#1910d8" ], [ 0.1787709497206704, "#3c19f0" ], [ 0.2681564245810056, "#6b1cfb" ], [ 0.3575418994413408, "#981cfd" ], [ 0.44692737430167595, "#bf1cfd" ], [ 0.5363128491620112, "#dd2bfd" ], [ 0.6256983240223464, "#f246fe" ], [ 0.7150837988826816, "#fc67fd" ], [ 0.8044692737430168, "#fe88fc" ], [ 0.8938547486033519, "#fea5fd" ], [ 0.9832402234636871, "#febefe" ], [ 1, "#fec3fe" ] ] }, "plot_bgcolor": "white", "paper_bgcolor": "white", "shapedefaults": { "line": { "width": 0 }, "opacity": 0.4, "fillcolor": "#506784" }, "annotationdefaults": { "arrowhead": 0, "arrowcolor": "#506784", "arrowwidth": 1 } }, "themeRef": "PLOTLY_WHITE" } } }, "height": null, "width": null, "user": { "profile_url": "https://chart-studio.plotly.com/~reinout.kramer", "avatar_url": "https://storage.googleapis.com/plotly-prod-profiles/58.jpg", "background_url": "https://storage.googleapis.com/plotly-prod-profiles/bg-14.jpg", "bio": "", "nickname": "", "website": "", "stream_tokens": null, "feature_set_id": null, "csrf_token": null, "date_joined": "2024-03-07 10:59:49", "mapbox_access_tokens": null, "has_password": null, "username": "reinout.kramer", "email": null, "is_active": null, "readonly": null, "is_dash_creator": null, "dash_created_count": null, "is_chart_creator": null, "charts_created_count": null } }, { "creation_time": "2024-03-28T15:24:19.982480Z", "comments": { "results": [], "count": 0 }, "parented": true, "embed_url": "https://chart-studio.plotly.com/~lviktor/1.embed", "fid": "lviktor:1", "filename": "basic-line", "filetype": "plot", "img_url": "https://storage.googleapis.com/plotly-prod-images/lviktor/1/9_CKUFHS9VTW9893078294LJ9SO808RE.png", "image_urls": { "default": "https://storage.googleapis.com/plotly-prod-images/lviktor/1/2_NH9Q2JZ0QZMV2KDL3G23JPJNSRJBJZ.png", "block-thumb": "https://storage.googleapis.com/plotly-prod-images/lviktor/1/8_6AY25URM2RR18PMWUN1199ELI2F8NM.png", "list-thumb": "https://storage.googleapis.com/plotly-prod-images/lviktor/1/9_CKUFHS9VTW9893078294LJ9SO808RE.png" }, "api_urls": { "files": "https://api.plotly.com/v2/files/lviktor:1", "plots": "https://api.plotly.com/v2/plots/lviktor:1", "parent": "https://api.plotly.com/v2/folders/home?user=lviktor" }, "owner": "lviktor", "parent": -1, "preview": "", "referencers": [], "references": [], "title": "", "views": 2, "web_url": "https://chart-studio.plotly.com/~lviktor/1/", "world_readable": true, "date_modified": "2024-03-28T15:24:19.992Z", "stars": { "results": [], "count": 0 }, "collaborators": { "results": [], "count": 0 }, "subfolder_count": null, "refresh_interval": null, "organize_view_url": "https://chart-studio.plotly.com/~lviktor/1/", "current_user_permission": "read", "is_theme": null, "is_template": null, "autosize": true, "caption": "", "figure": { "data": [ { "type": "scatter", "xsrc": "lviktor:0:e66353", "ysrc": "lviktor:0:1f59c9" }, { "type": "scatter", "xsrc": "lviktor:0:02d2a7", "ysrc": "lviktor:0:388f1d" } ], "layout": { "template": { "data": { "bar": [ { "type": "bar", "marker": { "line": { "color": "#E5ECF6", "width": 0.5 }, "pattern": { "size": 10, "fillmode": "overlay", "solidity": 0.2 } }, "error_x": { "color": "#2a3f5f" }, "error_y": { "color": "#2a3f5f" } } ], "pie": [ { "type": "pie", "automargin": true } ], "table": [ { "type": "table", "cells": { "fill": { "color": "#EBF0F8" }, "line": { "color": "white" } }, "header": { "fill": { "color": "#C8D4E3" }, "line": { "color": "white" } } } ], "carpet": [ { "type": "carpet", "aaxis": { "gridcolor": "white", "linecolor": "white", "endlinecolor": "#2a3f5f", "minorgridcolor": "white", "startlinecolor": "#2a3f5f" }, "baxis": { "gridcolor": "white", "linecolor": "white", "endlinecolor": "#2a3f5f", "minorgridcolor": "white", "startlinecolor": "#2a3f5f" } } ], "mesh3d": [ { "type": "mesh3d", "colorbar": { "ticks": "", "outlinewidth": 0 } } ], "contour": [ { "type": "contour", "colorbar": { "ticks": "", "outlinewidth": 0 }, "colorscale": [ [ 0.0, "#0d0887" ], [ 0.1111111111111111, "#46039f" ], [ 0.2222222222222222, "#7201a8" ], [ 0.3333333333333333, "#9c179e" ], [ 0.4444444444444444, "#bd3786" ], [ 0.5555555555555556, "#d8576b" ], [ 0.6666666666666666, "#ed7953" ], [ 0.7777777777777778, "#fb9f3a" ], [ 0.8888888888888888, "#fdca26" ], [ 1.0, "#f0f921" ] ] } ], "heatmap": [ { "type": "heatmap", "colorbar": { "ticks": "", "outlinewidth": 0 }, "colorscale": [ [ 0.0, "#0d0887" ], [ 0.1111111111111111, "#46039f" ], [ 0.2222222222222222, "#7201a8" ], [ 0.3333333333333333, "#9c179e" ], [ 0.4444444444444444, "#bd3786" ], [ 0.5555555555555556, "#d8576b" ], [ 0.6666666666666666, "#ed7953" ], [ 0.7777777777777778, "#fb9f3a" ], [ 0.8888888888888888, "#fdca26" ], [ 1.0, "#f0f921" ] ] } ], "scatter": [ { "type": "scatter", "fillpattern": { "size": 10, "fillmode": "overlay", "solidity": 0.2 } } ], "surface": [ { "type": "surface", "colorbar": { "ticks": "", "outlinewidth": 0 }, "colorscale": [ [ 0.0, "#0d0887" ], [ 0.1111111111111111, "#46039f" ], [ 0.2222222222222222, "#7201a8" ], [ 0.3333333333333333, "#9c179e" ], [ 0.4444444444444444, "#bd3786" ], [ 0.5555555555555556, "#d8576b" ], [ 0.6666666666666666, "#ed7953" ], [ 0.7777777777777778, "#fb9f3a" ], [ 0.8888888888888888, "#fdca26" ], [ 1.0, "#f0f921" ] ] } ], "barpolar": [ { "type": "barpolar", "marker": { "line": { "color": "#E5ECF6", "width": 0.5 }, "pattern": { "size": 10, "fillmode": "overlay", "solidity": 0.2 } } } ], "heatmapgl": [ { "type": "heatmapgl", "colorbar": { "ticks": "", "outlinewidth": 0 }, "colorscale": [ [ 0.0, "#0d0887" ], [ 0.1111111111111111, "#46039f" ], [ 0.2222222222222222, "#7201a8" ], [ 0.3333333333333333, "#9c179e" ], [ 0.4444444444444444, "#bd3786" ], [ 0.5555555555555556, "#d8576b" ], [ 0.6666666666666666, "#ed7953" ], [ 0.7777777777777778, "#fb9f3a" ], [ 0.8888888888888888, "#fdca26" ], [ 1.0, "#f0f921" ] ] } ], "histogram": [ { "type": "histogram", "marker": { "pattern": { "size": 10, "fillmode": "overlay", "solidity": 0.2 } } } ], "parcoords": [ { "line": { "colorbar": { "ticks": "", "outlinewidth": 0 } }, "type": "parcoords" } ], "scatter3d": [ { "line": { "colorbar": { "ticks": "", "outlinewidth": 0 } }, "type": "scatter3d", "marker": { "colorbar": { "ticks": "", "outlinewidth": 0 } } } ], "scattergl": [ { "type": "scattergl", "marker": { "colorbar": { "ticks": "", "outlinewidth": 0 } } } ], "choropleth": [ { "type": "choropleth", "colorbar": { "ticks": "", "outlinewidth": 0 } } ], "scattergeo": [ { "type": "scattergeo", "marker": { "colorbar": { "ticks": "", "outlinewidth": 0 } } } ], "histogram2d": [ { "type": "histogram2d", "colorbar": { "ticks": "", "outlinewidth": 0 }, "colorscale": [ [ 0.0, "#0d0887" ], [ 0.1111111111111111, "#46039f" ], [ 0.2222222222222222, "#7201a8" ], [ 0.3333333333333333, "#9c179e" ], [ 0.4444444444444444, "#bd3786" ], [ 0.5555555555555556, "#d8576b" ], [ 0.6666666666666666, "#ed7953" ], [ 0.7777777777777778, "#fb9f3a" ], [ 0.8888888888888888, "#fdca26" ], [ 1.0, "#f0f921" ] ] } ], "scatterpolar": [ { "type": "scatterpolar", "marker": { "colorbar": { "ticks": "", "outlinewidth": 0 } } } ], "contourcarpet": [ { "type": "contourcarpet", "colorbar": { "ticks": "", "outlinewidth": 0 } } ], "scattercarpet": [ { "type": "scattercarpet", "marker": { "colorbar": { "ticks": "", "outlinewidth": 0 } } } ], "scattermapbox": [ { "type": "scattermapbox", "marker": { "colorbar": { "ticks": "", "outlinewidth": 0 } } } ], "scatterpolargl": [ { "type": "scatterpolargl", "marker": { "colorbar": { "ticks": "", "outlinewidth": 0 } } } ], "scatterternary": [ { "type": "scatterternary", "marker": { "colorbar": { "ticks": "", "outlinewidth": 0 } } } ], "histogram2dcontour": [ { "type": "histogram2dcontour", "colorbar": { "ticks": "", "outlinewidth": 0 }, "colorscale": [ [ 0.0, "#0d0887" ], [ 0.1111111111111111, "#46039f" ], [ 0.2222222222222222, "#7201a8" ], [ 0.3333333333333333, "#9c179e" ], [ 0.4444444444444444, "#bd3786" ], [ 0.5555555555555556, "#d8576b" ], [ 0.6666666666666666, "#ed7953" ], [ 0.7777777777777778, "#fb9f3a" ], [ 0.8888888888888888, "#fdca26" ], [ 1.0, "#f0f921" ] ] } ] }, "layout": { "geo": { "bgcolor": "white", "showland": true, "lakecolor": "white", "landcolor": "#E5ECF6", "showlakes": true, "subunitcolor": "white" }, "font": { "color": "#2a3f5f" }, "polar": { "bgcolor": "#E5ECF6", "radialaxis": { "ticks": "", "gridcolor": "white", "linecolor": "white" }, "angularaxis": { "ticks": "", "gridcolor": "white", "linecolor": "white" } }, "scene": { "xaxis": { "ticks": "", "gridcolor": "white", "gridwidth": 2, "linecolor": "white", "zerolinecolor": "white", "showbackground": true, "backgroundcolor": "#E5ECF6" }, "yaxis": { "ticks": "", "gridcolor": "white", "gridwidth": 2, "linecolor": "white", "zerolinecolor": "white", "showbackground": true, "backgroundcolor": "#E5ECF6" }, "zaxis": { "ticks": "", "gridcolor": "white", "gridwidth": 2, "linecolor": "white", "zerolinecolor": "white", "showbackground": true, "backgroundcolor": "#E5ECF6" } }, "title": { "x": 0.05 }, "xaxis": { "ticks": "", "title": { "standoff": 15 }, "gridcolor": "white", "linecolor": "white", "automargin": true, "zerolinecolor": "white", "zerolinewidth": 2 }, "yaxis": { "ticks": "", "title": { "standoff": 15 }, "gridcolor": "white", "linecolor": "white", "automargin": true, "zerolinecolor": "white", "zerolinewidth": 2 }, "mapbox": { "style": "light" }, "ternary": { "aaxis": { "ticks": "", "gridcolor": "white", "linecolor": "white" }, "baxis": { "ticks": "", "gridcolor": "white", "linecolor": "white" }, "caxis": { "ticks": "", "gridcolor": "white", "linecolor": "white" }, "bgcolor": "#E5ECF6" }, "colorway": [ "#636efa", "#EF553B", "#00cc96", "#ab63fa", "#FFA15A", "#19d3f3", "#FF6692", "#B6E880", "#FF97FF", "#FECB52" ], "coloraxis": { "colorbar": { "ticks": "", "outlinewidth": 0 } }, "hovermode": "closest", "colorscale": { "diverging": [ [ 0, "#8e0152" ], [ 0.1, "#c51b7d" ], [ 0.2, "#de77ae" ], [ 0.3, "#f1b6da" ], [ 0.4, "#fde0ef" ], [ 0.5, "#f7f7f7" ], [ 0.6, "#e6f5d0" ], [ 0.7, "#b8e186" ], [ 0.8, "#7fbc41" ], [ 0.9, "#4d9221" ], [ 1, "#276419" ] ], "sequential": [ [ 0.0, "#0d0887" ], [ 0.1111111111111111, "#46039f" ], [ 0.2222222222222222, "#7201a8" ], [ 0.3333333333333333, "#9c179e" ], [ 0.4444444444444444, "#bd3786" ], [ 0.5555555555555556, "#d8576b" ], [ 0.6666666666666666, "#ed7953" ], [ 0.7777777777777778, "#fb9f3a" ], [ 0.8888888888888888, "#fdca26" ], [ 1.0, "#f0f921" ] ], "sequentialminus": [ [ 0.0, "#0d0887" ], [ 0.1111111111111111, "#46039f" ], [ 0.2222222222222222, "#7201a8" ], [ 0.3333333333333333, "#9c179e" ], [ 0.4444444444444444, "#bd3786" ], [ 0.5555555555555556, "#d8576b" ], [ 0.6666666666666666, "#ed7953" ], [ 0.7777777777777778, "#fb9f3a" ], [ 0.8888888888888888, "#fdca26" ], [ 1.0, "#f0f921" ] ] }, "hoverlabel": { "align": "left" }, "plot_bgcolor": "#E5ECF6", "paper_bgcolor": "white", "shapedefaults": { "line": { "color": "#2a3f5f" } }, "autotypenumbers": "strict", "annotationdefaults": { "arrowhead": 0, "arrowcolor": "#2a3f5f", "arrowwidth": 1 } } } } }, "height": null, "width": null, "user": { "profile_url": "https://chart-studio.plotly.com/~lviktor", "avatar_url": "https://storage.googleapis.com/plotly-prod-profiles/21.jpg", "background_url": "https://storage.googleapis.com/plotly-prod-profiles/bg-3.jpg", "bio": "", "nickname": "", "website": "", "stream_tokens": null, "feature_set_id": null, "csrf_token": null, "date_joined": "2024-03-28 14:45:39", "mapbox_access_tokens": null, "has_password": null, "username": "lviktor", "email": null, "is_active": null, "readonly": null, "is_dash_creator": null, "dash_created_count": null, "is_chart_creator": null, "charts_created_count": null } }, { "creation_time": "2024-03-28T15:06:23.102421Z", "comments": { "results": [], "count": 0 }, "parented": true, "embed_url": "https://chart-studio.plotly.com/~wayneshih/1.embed", "fid": "wayneshih:1", "filename": "Plot 1", "filetype": "plot", "img_url": "https://storage.googleapis.com/plotly-prod-images/wayneshih/1/9_YIUQTHIXL5V8R5B8E8S2YMZITS7TD5.png", "image_urls": { "default": "https://storage.googleapis.com/plotly-prod-images/wayneshih/1/2_YTE9HVQ0U808CU7Y1ICRJZ2H848671.png", "block-thumb": "https://storage.googleapis.com/plotly-prod-images/wayneshih/1/8_VWACKJRGTC8DB2LLMR5CGCWPMG19QC.png", "list-thumb": "https://storage.googleapis.com/plotly-prod-images/wayneshih/1/9_YIUQTHIXL5V8R5B8E8S2YMZITS7TD5.png" }, "api_urls": { "files": "https://api.plotly.com/v2/files/wayneshih:1", "plots": "https://api.plotly.com/v2/plots/wayneshih:1", "parent": "https://api.plotly.com/v2/folders/home?user=wayneshih" }, "owner": "wayneshih", "parent": -1, "preview": "", "referencers": [], "references": [], "title": "", "views": 1, "web_url": "https://chart-studio.plotly.com/~wayneshih/1/", "world_readable": true, "date_modified": "2024-03-28T15:24:39.557Z", "stars": { "results": [], "count": 0 }, "collaborators": { "results": [], "count": 0 }, "subfolder_count": null, "refresh_interval": null, "organize_view_url": "https://chart-studio.plotly.com/~wayneshih/1/", "current_user_permission": "read", "is_theme": null, "is_template": true, "autosize": false, "caption": "", "figure": { "data": [ { "meta": { "columnNames": { "x": "A", "y": "B", "z": "C - D - E - F - G - H - I - J - K" } }, "mode": "markers", "type": "heatmap", "xsrc": "wayneshih:0:39d473", "ysrc": "wayneshih:0:dc55bd", "zsrc": "wayneshih:0:31031f,30a075,798dc9,36f02f,a4e8bd,e53180,d808c7,b0d9cc,e18cbb", "autocolorscale": true } ], "frames": [], "layout": { "width": 800, "xaxis": { "type": "category", "range": [ -0.5, 8.5 ], "autorange": true }, "yaxis": { "type": "category", "range": [ -0.5, 8.5 ], "autorange": true }, "height": 800, "autosize": false } }, "height": 800, "width": 800, "user": { "profile_url": "https://chart-studio.plotly.com/~wayneshih", "avatar_url": "https://storage.googleapis.com/plotly-prod-profiles/34.jpg", "background_url": "https://storage.googleapis.com/plotly-prod-profiles/bg-0.jpg", "bio": "", "nickname": "", "website": "", "stream_tokens": null, "feature_set_id": null, "csrf_token": null, "date_joined": "2024-03-28 15:03:04", "mapbox_access_tokens": null, "has_password": null, "username": "wayneshih", "email": null, "is_active": null, "readonly": null, "is_dash_creator": null, "dash_created_count": null, "is_chart_creator": null, "charts_created_count": null } }, { "creation_time": "2024-03-28T15:02:32.323948Z", "comments": { "results": [], "count": 0 }, "parented": true, "embed_url": "https://chart-studio.plotly.com/~ishanj30/1.embed", "fid": "ishanj30:1", "filename": "Plot 1", "filetype": "plot", "img_url": "https://storage.googleapis.com/plotly-prod-images/ishanj30/1/9_G6W7CCD0PIJURKWL2JETRMWKKK2TLU.png", "image_urls": { "default": "https://storage.googleapis.com/plotly-prod-images/ishanj30/1/2_76IA6XO0UP5K7B45U0XVZOW5IFGB1M.png", "block-thumb": "https://storage.googleapis.com/plotly-prod-images/ishanj30/1/8_JEYTMM1A36OMJHXOW0VBCD6CBPE72F.png", "list-thumb": "https://storage.googleapis.com/plotly-prod-images/ishanj30/1/9_G6W7CCD0PIJURKWL2JETRMWKKK2TLU.png" }, "api_urls": { "files": "https://api.plotly.com/v2/files/ishanj30:1", "plots": "https://api.plotly.com/v2/plots/ishanj30:1", "parent": "https://api.plotly.com/v2/folders/home?user=ishanj30" }, "owner": "ishanj30", "parent": -1, "preview": "", "referencers": [], "references": [], "title": "", "views": 1, "web_url": "https://chart-studio.plotly.com/~ishanj30/1/", "world_readable": true, "date_modified": "2024-03-28T15:02:32.335Z", "stars": { "results": [], "count": 0 }, "collaborators": { "results": [], "count": 0 }, "subfolder_count": null, "refresh_interval": null, "organize_view_url": "https://chart-studio.plotly.com/~ishanj30/1/", "current_user_permission": "read", "is_theme": null, "is_template": false, "autosize": true, "caption": "", "figure": { "data": [ { "line": { "shape": "spline" }, "meta": { "columnNames": { "x": "False Positive Rate", "y": "False Negative Rate", "text": "" } }, "mode": "markers+lines+text", "type": "scatter", "xsrc": "ishanj30:0:25dc23", "ysrc": "ishanj30:0:f51006", "marker": { "color": "#636efa", "symbol": "circle" }, "connectgaps": false } ], "frames": [], "layout": { "title": { "text": "ROC Curve" }, "xaxis": { "type": "linear", "range": [ 0.40454545244574547, 0.48636362329125404 ], "title": { "text": "False Positive Rate" }, "autorange": true, "showspikes": false }, "yaxis": { "type": "linear", "range": [ 0.49304115941338506, 0.5958477241773132 ], "title": { "text": "False Negative Rate" }, "autorange": true, "showspikes": false }, "autosize": true, "dragmode": "zoom", "template": { "data": { "bar": [ { "type": "bar", "marker": { "colorbar": { "ticks": "", "outlinewidth": 0 } } } ], "table": [ { "type": "table", "cells": { "fill": { "color": "#EBF0F8" }, "line": { "color": "white" } }, "header": { "fill": { "color": "#C8D4E3" }, "line": { "color": "white" } } } ], "carpet": [ { "type": "carpet", "aaxis": { "gridcolor": "#C8D4E3", "linecolor": "#C8D4E3", "endlinecolor": "#2a3f5f", "minorgridcolor": "#C8D4E3", "startlinecolor": "#2a3f5f" }, "baxis": { "gridcolor": "#C8D4E3", "linecolor": "#C8D4E3", "endlinecolor": "#2a3f5f", "minorgridcolor": "#C8D4E3", "startlinecolor": "#2a3f5f" } } ], "mesh3d": [ { "type": "mesh3d", "colorbar": { "ticks": "", "outlinewidth": 0 } } ], "contour": [ { "type": "contour", "colorbar": { "ticks": "", "outlinewidth": 0 }, "autocolorscale": true } ], "heatmap": [ { "type": "heatmap", "colorbar": { "ticks": "", "outlinewidth": 0 }, "autocolorscale": true } ], "scatter": [ { "type": "scatter", "marker": { "colorbar": { "ticks": "", "outlinewidth": 0 } } } ], "surface": [ { "type": "surface", "colorbar": { "ticks": "", "outlinewidth": 0 } } ], "heatmapgl": [ { "type": "heatmapgl", "colorbar": { "ticks": "", "outlinewidth": 0 } } ], "histogram": [ { "type": "histogram", "marker": { "colorbar": { "ticks": "", "outlinewidth": 0 } } } ], "parcoords": [ { "line": { "colorbar": { "ticks": "", "outlinewidth": 0 } }, "type": "parcoords" } ], "scatter3d": [ { "type": "scatter3d", "marker": { "colorbar": { "ticks": "", "outlinewidth": 0 } } } ], "scattergl": [ { "type": "scattergl", "marker": { "colorbar": { "ticks": "", "outlinewidth": 0 } } } ], "choropleth": [ { "type": "choropleth", "colorbar": { "ticks": "", "outlinewidth": 0 } } ], "scattergeo": [ { "type": "scattergeo", "marker": { "colorbar": { "ticks": "", "outlinewidth": 0 } } } ], "histogram2d": [ { "type": "histogram2d", "colorbar": { "ticks": "", "outlinewidth": 0 }, "autocolorscale": true } ], "scatterpolar": [ { "type": "scatterpolar", "marker": { "colorbar": { "ticks": "", "outlinewidth": 0 } } } ], "contourcarpet": [ { "type": "contourcarpet", "colorbar": { "ticks": "", "outlinewidth": 0 } } ], "scattercarpet": [ { "type": "scattercarpet", "marker": { "colorbar": { "ticks": "", "outlinewidth": 0 } } } ], "scattermapbox": [ { "type": "scattermapbox", "marker": { "colorbar": { "ticks": "", "outlinewidth": 0 } } } ], "scatterpolargl": [ { "type": "scatterpolargl", "marker": { "colorbar": { "ticks": "", "outlinewidth": 0 } } } ], "scatterternary": [ { "type": "scatterternary", "marker": { "colorbar": { "ticks": "", "outlinewidth": 0 } } } ], "histogram2dcontour": [ { "type": "histogram2dcontour", "colorbar": { "ticks": "", "outlinewidth": 0 }, "autocolorscale": true } ] }, "layout": { "geo": { "bgcolor": "white", "showland": true, "lakecolor": "white", "landcolor": "white", "showlakes": true, "subunitcolor": "#C8D4E3" }, "font": { "color": "#2a3f5f" }, "polar": { "bgcolor": "white", "radialaxis": { "ticks": "", "gridcolor": "#EBF0F8", "linecolor": "#EBF0F8" }, "angularaxis": { "ticks": "", "gridcolor": "#EBF0F8", "linecolor": "#EBF0F8" } }, "scene": { "xaxis": { "ticks": "", "gridcolor": "#DFE8F3", "gridwidth": 2, "linecolor": "#EBF0F8", "zerolinecolor": "#EBF0F8", "showbackground": true, "backgroundcolor": "white" }, "yaxis": { "ticks": "", "gridcolor": "#DFE8F3", "gridwidth": 2, "linecolor": "#EBF0F8", "zerolinecolor": "#EBF0F8", "showbackground": true, "backgroundcolor": "white" }, "zaxis": { "ticks": "", "gridcolor": "#DFE8F3", "gridwidth": 2, "linecolor": "#EBF0F8", "zerolinecolor": "#EBF0F8", "showbackground": true, "backgroundcolor": "white" } }, "title": { "x": 0.05 }, "xaxis": { "ticks": "", "gridcolor": "#EBF0F8", "linecolor": "#EBF0F8", "automargin": true, "zerolinecolor": "#EBF0F8", "zerolinewidth": 2 }, "yaxis": { "ticks": "", "gridcolor": "#EBF0F8", "linecolor": "#EBF0F8", "automargin": true, "zerolinecolor": "#EBF0F8", "zerolinewidth": 2 }, "ternary": { "aaxis": { "ticks": "", "gridcolor": "#DFE8F3", "linecolor": "#A2B1C6" }, "baxis": { "ticks": "", "gridcolor": "#DFE8F3", "linecolor": "#A2B1C6" }, "caxis": { "ticks": "", "gridcolor": "#DFE8F3", "linecolor": "#A2B1C6" }, "bgcolor": "white" }, "colorway": [ "#636efa", "#EF553B", "#00cc96", "#ab63fa", "#19d3f3", "#e763fa", "#fecb52", "#ffa15a", "#ff6692", "#b6e880" ], "hovermode": "closest", "colorscale": { "diverging": [ [ 0, "#8e0152" ], [ 0.1, "#c51b7d" ], [ 0.2, "#de77ae" ], [ 0.3, "#f1b6da" ], [ 0.4, "#fde0ef" ], [ 0.5, "#f7f7f7" ], [ 0.6, "#e6f5d0" ], [ 0.7, "#b8e186" ], [ 0.8, "#7fbc41" ], [ 0.9, "#4d9221" ], [ 1, "#276419" ] ], "sequential": [ [ 0, "#0508b8" ], [ 0.0893854748603352, "#1910d8" ], [ 0.1787709497206704, "#3c19f0" ], [ 0.2681564245810056, "#6b1cfb" ], [ 0.3575418994413408, "#981cfd" ], [ 0.44692737430167595, "#bf1cfd" ], [ 0.5363128491620112, "#dd2bfd" ], [ 0.6256983240223464, "#f246fe" ], [ 0.7150837988826816, "#fc67fd" ], [ 0.8044692737430168, "#fe88fc" ], [ 0.8938547486033519, "#fea5fd" ], [ 0.9832402234636871, "#febefe" ], [ 1, "#fec3fe" ] ], "sequentialminus": [ [ 0, "#0508b8" ], [ 0.0893854748603352, "#1910d8" ], [ 0.1787709497206704, "#3c19f0" ], [ 0.2681564245810056, "#6b1cfb" ], [ 0.3575418994413408, "#981cfd" ], [ 0.44692737430167595, "#bf1cfd" ], [ 0.5363128491620112, "#dd2bfd" ], [ 0.6256983240223464, "#f246fe" ], [ 0.7150837988826816, "#fc67fd" ], [ 0.8044692737430168, "#fe88fc" ], [ 0.8938547486033519, "#fea5fd" ], [ 0.9832402234636871, "#febefe" ], [ 1, "#fec3fe" ] ] }, "plot_bgcolor": "white", "paper_bgcolor": "white", "shapedefaults": { "line": { "width": 0 }, "opacity": 0.4, "fillcolor": "#506784" }, "annotationdefaults": { "arrowhead": 0, "arrowcolor": "#506784", "arrowwidth": 1 } }, "themeRef": "PLOTLY_WHITE" }, "hovermode": "closest" } }, "height": null, "width": null, "user": { "profile_url": "https://chart-studio.plotly.com/~ishanj30", "avatar_url": "https://storage.googleapis.com/plotly-prod-profiles/53.jpg", "background_url": "https://storage.googleapis.com/plotly-prod-profiles/bg-3.jpg", "bio": "", "nickname": "", "website": "", "stream_tokens": null, "feature_set_id": null, "csrf_token": null, "date_joined": "2024-03-28 15:00:56", "mapbox_access_tokens": null, "has_password": null, "username": "ishanj30", "email": null, "is_active": null, "readonly": null, "is_dash_creator": null, "dash_created_count": null, "is_chart_creator": null, "charts_created_count": null } }, { "creation_time": "2024-03-28T14:59:05.471100Z", "comments": { "results": [], "count": 0 }, "parented": true, "embed_url": "https://chart-studio.plotly.com/~poooool/2.embed", "fid": "poooool:2", "filename": "greenit_paul_mairesse_Dqdzqdzq", "filetype": "plot", "img_url": "https://storage.googleapis.com/plotly-prod-images/poooool/2/9_TL63JOSEMASAAD6S6O7KO5JPBMYPDN.png", "image_urls": { "default": "https://storage.googleapis.com/plotly-prod-images/poooool/2/2_MKBGRL7Z596U9FRLN3OME926GUS8U1.png", "block-thumb": "https://storage.googleapis.com/plotly-prod-images/poooool/2/8_2381MTY3GP5D5S622QOWP0SUO5ZIBQ.png", "list-thumb": "https://storage.googleapis.com/plotly-prod-images/poooool/2/9_TL63JOSEMASAAD6S6O7KO5JPBMYPDN.png" }, "api_urls": { "files": "https://api.plotly.com/v2/files/poooool:2", "plots": "https://api.plotly.com/v2/plots/poooool:2", "parent": "https://api.plotly.com/v2/folders/home?user=poooool" }, "owner": "poooool", "parent": -1, "preview": "", "referencers": [], "references": [], "title": "", "views": 3, "web_url": "https://chart-studio.plotly.com/~poooool/2/", "world_readable": true, "date_modified": "2024-03-28T14:59:05.481Z", "stars": { "results": [], "count": 0 }, "collaborators": { "results": [], "count": 0 }, "subfolder_count": null, "refresh_interval": null, "organize_view_url": "https://chart-studio.plotly.com/~poooool/2/", "current_user_permission": "read", "is_theme": null, "is_template": false, "autosize": true, "caption": "", "figure": { "data": [ { "meta": { "columnNames": { "x": "B", "y": "A", "text": "B", "marker": { "color": "B" } } }, "mode": "markers", "type": "bar", "xsrc": "poooool:1:37c5d7", "ysrc": "poooool:1:deaa58", "marker": { "meta": { "columnNames": { "color": "B" } }, "colorsrc": "poooool:0:d53249", "showscale": true, "colorscale": [ [ 0, "#e8f5ab" ], [ 0.09090909090909091, "#dcdb89" ], [ 0.18181818181818182, "#d1c16b" ], [ 0.2727272727272727, "#c7a853" ], [ 0.36363636363636365, "#ba8f42" ], [ 0.45454545454545453, "#aa793c" ], [ 0.5454545454545454, "#97673a" ], [ 0.6363636363636364, "#815738" ], [ 0.7272727272727273, "#684835" ], [ 0.8181818181818182, "#503b2e" ], [ 0.9090909090909091, "#392d25" ], [ 1, "#221e1b" ] ] }, "textsrc": "poooool:1:37c5d7", "orientation": "h", "textposition": "outside", "texttemplate": "", "autocolorscale": false } ], "frames": [], "layout": { "title": { "text": "<b>Carbon emission in kT</b>" }, "xaxis": { "type": "linear", "range": [ 0, 26.842105263157894 ], "ticks": "", "title": { "text": "<br>" }, "zeroline": true, "autorange": true, "ticksuffix": "kT" }, "yaxis": { "type": "category", "range": [ -0.5, 1.5 ], "autorange": true }, "bargap": 0.4, "modebar": { "orientation": "h" }, "autosize": true, "dragmode": "zoom", "template": { "data": { "bar": [ { "type": "bar", "marker": { "colorbar": { "ticks": "", "outlinewidth": 0 } } } ], "table": [ { "type": "table", "cells": { "fill": { "color": "#EBF0F8" }, "line": { "color": "white" } }, "header": { "fill": { "color": "#C8D4E3" }, "line": { "color": "white" } } } ], "carpet": [ { "type": "carpet", "aaxis": { "gridcolor": "#C8D4E3", "linecolor": "#C8D4E3", "endlinecolor": "#2a3f5f", "minorgridcolor": "#C8D4E3", "startlinecolor": "#2a3f5f" }, "baxis": { "gridcolor": "#C8D4E3", "linecolor": "#C8D4E3", "endlinecolor": "#2a3f5f", "minorgridcolor": "#C8D4E3", "startlinecolor": "#2a3f5f" } } ], "mesh3d": [ { "type": "mesh3d", "colorbar": { "ticks": "", "outlinewidth": 0 } } ], "contour": [ { "type": "contour", "colorbar": { "ticks": "", "outlinewidth": 0 }, "autocolorscale": true } ], "heatmap": [ { "type": "heatmap", "colorbar": { "ticks": "", "outlinewidth": 0 }, "autocolorscale": true } ], "scatter": [ { "type": "scatter", "marker": { "colorbar": { "ticks": "", "outlinewidth": 0 } } } ], "surface": [ { "type": "surface", "colorbar": { "ticks": "", "outlinewidth": 0 } } ], "heatmapgl": [ { "type": "heatmapgl", "colorbar": { "ticks": "", "outlinewidth": 0 } } ], "histogram": [ { "type": "histogram", "marker": { "colorbar": { "ticks": "", "outlinewidth": 0 } } } ], "parcoords": [ { "line": { "colorbar": { "ticks": "", "outlinewidth": 0 } }, "type": "parcoords" } ], "scatter3d": [ { "type": "scatter3d", "marker": { "colorbar": { "ticks": "", "outlinewidth": 0 } } } ], "scattergl": [ { "type": "scattergl", "marker": { "colorbar": { "ticks": "", "outlinewidth": 0 } } } ], "choropleth": [ { "type": "choropleth", "colorbar": { "ticks": "", "outlinewidth": 0 } } ], "scattergeo": [ { "type": "scattergeo", "marker": { "colorbar": { "ticks": "", "outlinewidth": 0 } } } ], "histogram2d": [ { "type": "histogram2d", "colorbar": { "ticks": "", "outlinewidth": 0 }, "autocolorscale": true } ], "scatterpolar": [ { "type": "scatterpolar", "marker": { "colorbar": { "ticks": "", "outlinewidth": 0 } } } ], "contourcarpet": [ { "type": "contourcarpet", "colorbar": { "ticks": "", "outlinewidth": 0 } } ], "scattercarpet": [ { "type": "scattercarpet", "marker": { "colorbar": { "ticks": "", "outlinewidth": 0 } } } ], "scattermapbox": [ { "type": "scattermapbox", "marker": { "colorbar": { "ticks": "", "outlinewidth": 0 } } } ], "scatterpolargl": [ { "type": "scatterpolargl", "marker": { "colorbar": { "ticks": "", "outlinewidth": 0 } } } ], "scatterternary": [ { "type": "scatterternary", "marker": { "colorbar": { "ticks": "", "outlinewidth": 0 } } } ], "histogram2dcontour": [ { "type": "histogram2dcontour", "colorbar": { "ticks": "", "outlinewidth": 0 }, "autocolorscale": true } ] }, "layout": { "geo": { "bgcolor": "white", "showland": true, "lakecolor": "white", "landcolor": "white", "showlakes": true, "subunitcolor": "#C8D4E3" }, "font": { "color": "#2a3f5f" }, "polar": { "bgcolor": "white", "radialaxis": { "ticks": "", "gridcolor": "#EBF0F8", "linecolor": "#EBF0F8" }, "angularaxis": { "ticks": "", "gridcolor": "#EBF0F8", "linecolor": "#EBF0F8" } }, "scene": { "xaxis": { "ticks": "", "gridcolor": "#DFE8F3", "gridwidth": 2, "linecolor": "#EBF0F8", "zerolinecolor": "#EBF0F8", "showbackground": true, "backgroundcolor": "white" }, "yaxis": { "ticks": "", "gridcolor": "#DFE8F3", "gridwidth": 2, "linecolor": "#EBF0F8", "zerolinecolor": "#EBF0F8", "showbackground": true, "backgroundcolor": "white" }, "zaxis": { "ticks": "", "gridcolor": "#DFE8F3", "gridwidth": 2, "linecolor": "#EBF0F8", "zerolinecolor": "#EBF0F8", "showbackground": true, "backgroundcolor": "white" } }, "title": { "x": 0.05 }, "xaxis": { "ticks": "", "gridcolor": "#EBF0F8", "linecolor": "#EBF0F8", "automargin": true, "zerolinecolor": "#EBF0F8", "zerolinewidth": 2 }, "yaxis": { "ticks": "", "gridcolor": "#EBF0F8", "linecolor": "#EBF0F8", "automargin": true, "zerolinecolor": "#EBF0F8", "zerolinewidth": 2 }, "ternary": { "aaxis": { "ticks": "", "gridcolor": "#DFE8F3", "linecolor": "#A2B1C6" }, "baxis": { "ticks": "", "gridcolor": "#DFE8F3", "linecolor": "#A2B1C6" }, "caxis": { "ticks": "", "gridcolor": "#DFE8F3", "linecolor": "#A2B1C6" }, "bgcolor": "white" }, "colorway": [ "#636efa", "#EF553B", "#00cc96", "#ab63fa", "#19d3f3", "#e763fa", "#fecb52", "#ffa15a", "#ff6692", "#b6e880" ], "hovermode": "closest", "colorscale": { "diverging": [ [ 0, "#8e0152" ], [ 0.1, "#c51b7d" ], [ 0.2, "#de77ae" ], [ 0.3, "#f1b6da" ], [ 0.4, "#fde0ef" ], [ 0.5, "#f7f7f7" ], [ 0.6, "#e6f5d0" ], [ 0.7, "#b8e186" ], [ 0.8, "#7fbc41" ], [ 0.9, "#4d9221" ], [ 1, "#276419" ] ], "sequential": [ [ 0, "#0508b8" ], [ 0.0893854748603352, "#1910d8" ], [ 0.1787709497206704, "#3c19f0" ], [ 0.2681564245810056, "#6b1cfb" ], [ 0.3575418994413408, "#981cfd" ], [ 0.44692737430167595, "#bf1cfd" ], [ 0.5363128491620112, "#dd2bfd" ], [ 0.6256983240223464, "#f246fe" ], [ 0.7150837988826816, "#fc67fd" ], [ 0.8044692737430168, "#fe88fc" ], [ 0.8938547486033519, "#fea5fd" ], [ 0.9832402234636871, "#febefe" ], [ 1, "#fec3fe" ] ], "sequentialminus": [ [ 0, "#0508b8" ], [ 0.0893854748603352, "#1910d8" ], [ 0.1787709497206704, "#3c19f0" ], [ 0.2681564245810056, "#6b1cfb" ], [ 0.3575418994413408, "#981cfd" ], [ 0.44692737430167595, "#bf1cfd" ], [ 0.5363128491620112, "#dd2bfd" ], [ 0.6256983240223464, "#f246fe" ], [ 0.7150837988826816, "#fc67fd" ], [ 0.8044692737430168, "#fe88fc" ], [ 0.8938547486033519, "#fea5fd" ], [ 0.9832402234636871, "#febefe" ], [ 1, "#fec3fe" ] ] }, "plot_bgcolor": "white", "paper_bgcolor": "white", "shapedefaults": { "line": { "width": 0 }, "opacity": 0.4, "fillcolor": "#506784" }, "annotationdefaults": { "arrowhead": 0, "arrowcolor": "#506784", "arrowwidth": 1 } }, "themeRef": "PLOTLY_WHITE" }, "colorscale": { "sequentialminus": [ [ 0, "#0508b8" ], [ 0.08333333333333333, "#1910d8" ], [ 0.16666666666666666, "#3c19f0" ], [ 0.25, "#6b1cfb" ], [ 0.3333333333333333, "#981cfd" ], [ 0.4166666666666667, "#bf1cfd" ], [ 0.5, "#dd2bfd" ], [ 0.5833333333333334, "#f246fe" ], [ 0.6666666666666666, "#fc67fd" ], [ 0.75, "#fe88fc" ], [ 0.8333333333333334, "#fea5fd" ], [ 0.9166666666666666, "#febefe" ], [ 1, "#fec3fe" ] ] }, "showlegend": false } }, "height": null, "width": null, "user": { "profile_url": "https://chart-studio.plotly.com/~poooool", "avatar_url": "https://storage.googleapis.com/plotly-prod-profiles/45.jpg", "background_url": "https://storage.googleapis.com/plotly-prod-profiles/bg-3.jpg", "bio": "", "nickname": "", "website": "", "stream_tokens": null, "feature_set_id": null, "csrf_token": null, "date_joined": "2024-03-25 14:25:28", "mapbox_access_tokens": null, "has_password": null, "username": "poooool", "email": null, "is_active": null, "readonly": null, "is_dash_creator": null, "dash_created_count": null, "is_chart_creator": null, "charts_created_count": null } }, { "creation_time": "2024-03-28T14:53:58.280859Z", "comments": { "results": [], "count": 0 }, "parented": true, "embed_url": "https://chart-studio.plotly.com/~diego.davila/5.embed", "fid": "diego.davila:5", "filename": "Date v Active_seats with version split", "filetype": "plot", "img_url": "https://storage.googleapis.com/plotly-prod-images/diego.davila/5/9_HJ0347Q4FVPZ5QAHLBJO09B3HOSJUK.png", "image_urls": { "default": "https://storage.googleapis.com/plotly-prod-images/diego.davila/5/2_PJYVA4GEZ3SY8UM3UGC9XQNNIE76Y2.png", "block-thumb": "https://storage.googleapis.com/plotly-prod-images/diego.davila/5/8_J3VHYREQVBRXVQLWD8YVPT39PZRSP8.png", "list-thumb": "https://storage.googleapis.com/plotly-prod-images/diego.davila/5/9_HJ0347Q4FVPZ5QAHLBJO09B3HOSJUK.png" }, "api_urls": { "files": "https://api.plotly.com/v2/files/diego.davila:5", "plots": "https://api.plotly.com/v2/plots/diego.davila:5", "parent": "https://api.plotly.com/v2/folders/home?user=diego.davila" }, "owner": "diego.davila", "parent": -1, "preview": "", "referencers": [], "references": [], "title": "", "views": 3, "web_url": "https://chart-studio.plotly.com/~diego.davila/5/", "world_readable": true, "date_modified": "2024-03-29T13:46:32.495Z", "stars": { "results": [], "count": 0 }, "collaborators": { "results": [], "count": 0 }, "subfolder_count": null, "refresh_interval": null, "organize_view_url": "https://chart-studio.plotly.com/~diego.davila/5/", "current_user_permission": "read", "is_theme": null, "is_template": false, "autosize": true, "caption": "", "figure": { "data": [ { "meta": { "columnNames": { "x": "A", "y": "B" } }, "mode": "markers", "type": "scatter", "xsrc": "diego.davila:4:3d1b9b", "ysrc": "diego.davila:4:1e4e4a", "transforms": [ { "meta": { "columnNames": { "groups": "C" } }, "type": "groupby", "styles": [ { "value": {}, "target": "version A" }, { "value": {}, "target": "version B" } ], "groupssrc": "diego.davila:4:89e2f6" }, { "meta": { "columnNames": { "groups": "A" } }, "type": "aggregate", "groupssrc": "diego.davila:4:3d1b9b", "aggregations": [ null, { "func": "sum", "target": "y", "enabled": true } ] } ] } ], "frames": [], "layout": { "xaxis": { "type": "date", "range": [ "2022-12-28 12:31:08.2987", "2023-03-04 11:28:51.7013" ], "autorange": true }, "yaxis": { "type": "linear", "range": [ 0.5153080750095673, 17.984691924990432 ], "autorange": true }, "autosize": true, "dragmode": "pan", "template": { "data": { "bar": [ { "type": "bar", "marker": { "colorbar": { "ticks": "", "outlinewidth": 0 } } } ], "table": [ { "type": "table", "cells": { "fill": { "color": "#EBF0F8" }, "line": { "color": "white" } }, "header": { "fill": { "color": "#C8D4E3" }, "line": { "color": "white" } } } ], "carpet": [ { "type": "carpet", "aaxis": { "gridcolor": "#C8D4E3", "linecolor": "#C8D4E3", "endlinecolor": "#2a3f5f", "minorgridcolor": "#C8D4E3", "startlinecolor": "#2a3f5f" }, "baxis": { "gridcolor": "#C8D4E3", "linecolor": "#C8D4E3", "endlinecolor": "#2a3f5f", "minorgridcolor": "#C8D4E3", "startlinecolor": "#2a3f5f" } } ], "mesh3d": [ { "type": "mesh3d", "colorbar": { "ticks": "", "outlinewidth": 0 } } ], "contour": [ { "type": "contour", "colorbar": { "ticks": "", "outlinewidth": 0 }, "autocolorscale": true } ], "heatmap": [ { "type": "heatmap", "colorbar": { "ticks": "", "outlinewidth": 0 }, "autocolorscale": true } ], "scatter": [ { "type": "scatter", "marker": { "colorbar": { "ticks": "", "outlinewidth": 0 } } } ], "surface": [ { "type": "surface", "colorbar": { "ticks": "", "outlinewidth": 0 } } ], "heatmapgl": [ { "type": "heatmapgl", "colorbar": { "ticks": "", "outlinewidth": 0 } } ], "histogram": [ { "type": "histogram", "marker": { "colorbar": { "ticks": "", "outlinewidth": 0 } } } ], "parcoords": [ { "line": { "colorbar": { "ticks": "", "outlinewidth": 0 } }, "type": "parcoords" } ], "scatter3d": [ { "type": "scatter3d", "marker": { "colorbar": { "ticks": "", "outlinewidth": 0 } } } ], "scattergl": [ { "type": "scattergl", "marker": { "colorbar": { "ticks": "", "outlinewidth": 0 } } } ], "choropleth": [ { "type": "choropleth", "colorbar": { "ticks": "", "outlinewidth": 0 } } ], "scattergeo": [ { "type": "scattergeo", "marker": { "colorbar": { "ticks": "", "outlinewidth": 0 } } } ], "histogram2d": [ { "type": "histogram2d", "colorbar": { "ticks": "", "outlinewidth": 0 }, "autocolorscale": true } ], "scatterpolar": [ { "type": "scatterpolar", "marker": { "colorbar": { "ticks": "", "outlinewidth": 0 } } } ], "contourcarpet": [ { "type": "contourcarpet", "colorbar": { "ticks": "", "outlinewidth": 0 } } ], "scattercarpet": [ { "type": "scattercarpet", "marker": { "colorbar": { "ticks": "", "outlinewidth": 0 } } } ], "scattermapbox": [ { "type": "scattermapbox", "marker": { "colorbar": { "ticks": "", "outlinewidth": 0 } } } ], "scatterpolargl": [ { "type": "scatterpolargl", "marker": { "colorbar": { "ticks": "", "outlinewidth": 0 } } } ], "scatterternary": [ { "type": "scatterternary", "marker": { "colorbar": { "ticks": "", "outlinewidth": 0 } } } ], "histogram2dcontour": [ { "type": "histogram2dcontour", "colorbar": { "ticks": "", "outlinewidth": 0 }, "autocolorscale": true } ] }, "layout": { "geo": { "bgcolor": "white", "showland": true, "lakecolor": "white", "landcolor": "white", "showlakes": true, "subunitcolor": "#C8D4E3" }, "font": { "color": "#2a3f5f" }, "polar": { "bgcolor": "white", "radialaxis": { "ticks": "", "gridcolor": "#EBF0F8", "linecolor": "#EBF0F8" }, "angularaxis": { "ticks": "", "gridcolor": "#EBF0F8", "linecolor": "#EBF0F8" } }, "scene": { "xaxis": { "ticks": "", "gridcolor": "#DFE8F3", "gridwidth": 2, "linecolor": "#EBF0F8", "zerolinecolor": "#EBF0F8", "showbackground": true, "backgroundcolor": "white" }, "yaxis": { "ticks": "", "gridcolor": "#DFE8F3", "gridwidth": 2, "linecolor": "#EBF0F8", "zerolinecolor": "#EBF0F8", "showbackground": true, "backgroundcolor": "white" }, "zaxis": { "ticks": "", "gridcolor": "#DFE8F3", "gridwidth": 2, "linecolor": "#EBF0F8", "zerolinecolor": "#EBF0F8", "showbackground": true, "backgroundcolor": "white" } }, "title": { "x": 0.05 }, "xaxis": { "ticks": "", "gridcolor": "#EBF0F8", "linecolor": "#EBF0F8", "automargin": true, "zerolinecolor": "#EBF0F8", "zerolinewidth": 2 }, "yaxis": { "ticks": "", "gridcolor": "#EBF0F8", "linecolor": "#EBF0F8", "automargin": true, "zerolinecolor": "#EBF0F8", "zerolinewidth": 2 }, "ternary": { "aaxis": { "ticks": "", "gridcolor": "#DFE8F3", "linecolor": "#A2B1C6" }, "baxis": { "ticks": "", "gridcolor": "#DFE8F3", "linecolor": "#A2B1C6" }, "caxis": { "ticks": "", "gridcolor": "#DFE8F3", "linecolor": "#A2B1C6" }, "bgcolor": "white" }, "colorway": [ "#636efa", "#EF553B", "#00cc96", "#ab63fa", "#19d3f3", "#e763fa", "#fecb52", "#ffa15a", "#ff6692", "#b6e880" ], "hovermode": "closest", "colorscale": { "diverging": [ [ 0, "#8e0152" ], [ 0.1, "#c51b7d" ], [ 0.2, "#de77ae" ], [ 0.3, "#f1b6da" ], [ 0.4, "#fde0ef" ], [ 0.5, "#f7f7f7" ], [ 0.6, "#e6f5d0" ], [ 0.7, "#b8e186" ], [ 0.8, "#7fbc41" ], [ 0.9, "#4d9221" ], [ 1, "#276419" ] ], "sequential": [ [ 0, "#0508b8" ], [ 0.0893854748603352, "#1910d8" ], [ 0.1787709497206704, "#3c19f0" ], [ 0.2681564245810056, "#6b1cfb" ], [ 0.3575418994413408, "#981cfd" ], [ 0.44692737430167595, "#bf1cfd" ], [ 0.5363128491620112, "#dd2bfd" ], [ 0.6256983240223464, "#f246fe" ], [ 0.7150837988826816, "#fc67fd" ], [ 0.8044692737430168, "#fe88fc" ], [ 0.8938547486033519, "#fea5fd" ], [ 0.9832402234636871, "#febefe" ], [ 1, "#fec3fe" ] ], "sequentialminus": [ [ 0, "#0508b8" ], [ 0.0893854748603352, "#1910d8" ], [ 0.1787709497206704, "#3c19f0" ], [ 0.2681564245810056, "#6b1cfb" ], [ 0.3575418994413408, "#981cfd" ], [ 0.44692737430167595, "#bf1cfd" ], [ 0.5363128491620112, "#dd2bfd" ], [ 0.6256983240223464, "#f246fe" ], [ 0.7150837988826816, "#fc67fd" ], [ 0.8044692737430168, "#fe88fc" ], [ 0.8938547486033519, "#fea5fd" ], [ 0.9832402234636871, "#febefe" ], [ 1, "#fec3fe" ] ] }, "plot_bgcolor": "white", "paper_bgcolor": "white", "shapedefaults": { "line": { "width": 0 }, "opacity": 0.4, "fillcolor": "#506784" }, "annotationdefaults": { "arrowhead": 0, "arrowcolor": "#506784", "arrowwidth": 1 } }, "themeRef": "PLOTLY_WHITE" } } }, "height": null, "width": null, "user": { "profile_url": "https://chart-studio.plotly.com/~diego.davila", "avatar_url": "https://storage.googleapis.com/plotly-prod-profiles/73.jpg", "background_url": "https://storage.googleapis.com/plotly-prod-profiles/bg-0.jpg", "bio": "", "nickname": "", "website": "", "stream_tokens": null, "feature_set_id": null, "csrf_token": null, "date_joined": "2024-03-27 08:51:31", "mapbox_access_tokens": null, "has_password": null, "username": "diego.davila", "email": null, "is_active": null, "readonly": null, "is_dash_creator": null, "dash_created_count": null, "is_chart_creator": null, "charts_created_count": null } }, { "creation_time": "2024-03-28T14:50:44.347920Z", "comments": { "results": [], "count": 0 }, "parented": true, "embed_url": "https://chart-studio.plotly.com/~varun2004/1.embed", "fid": "varun2004:1", "filename": "Plot 1", "filetype": "plot", "img_url": "https://storage.googleapis.com/plotly-prod-images/varun2004/1/9_DHFJ3VC96AOOIBNTJRK5BS1YTMIDOQ.png", "image_urls": { "default": "https://storage.googleapis.com/plotly-prod-images/varun2004/1/2_SMSASV7OVD9Y7FGIUGOUIUSMZ0MY9S.png", "block-thumb": "https://storage.googleapis.com/plotly-prod-images/varun2004/1/8_BULWJD7RC5VKGCZX43INRFHTT5Q8IM.png", "list-thumb": "https://storage.googleapis.com/plotly-prod-images/varun2004/1/9_DHFJ3VC96AOOIBNTJRK5BS1YTMIDOQ.png" }, "api_urls": { "files": "https://api.plotly.com/v2/files/varun2004:1", "plots": "https://api.plotly.com/v2/plots/varun2004:1", "parent": "https://api.plotly.com/v2/folders/home?user=varun2004" }, "owner": "varun2004", "parent": -1, "preview": "", "referencers": [], "references": [], "title": "", "views": 5, "web_url": "https://chart-studio.plotly.com/~varun2004/1/", "world_readable": true, "date_modified": "2024-03-28T15:45:56.344Z", "stars": { "results": [], "count": 0 }, "collaborators": { "results": [], "count": 0 }, "subfolder_count": null, "refresh_interval": null, "organize_view_url": "https://chart-studio.plotly.com/~varun2004/1/", "current_user_permission": "read", "is_theme": null, "is_template": false, "autosize": true, "caption": "", "figure": { "data": [ { "meta": { "columnNames": { "x": "M1", "y": "P2" } }, "mode": "lines", "type": "scatter", "xsrc": "varun2004:0:df55b9", "ysrc": "varun2004:0:abc83e" } ], "frames": [], "layout": { "title": { "text": "M1 vs Po2" }, "xaxis": { "type": "linear", "range": [ 2, 10 ], "title": { "text": "M1" }, "autorange": true }, "yaxis": { "type": "linear", "range": [ -3.5445301111111123, 74.04411211111112 ], "title": { "text": "Po2" }, "autorange": true }, "autosize": true, "dragmode": "zoom", "template": { "data": { "bar": [ { "type": "bar", "marker": { "colorbar": { "ticks": "", "outlinewidth": 0 } } } ], "table": [ { "type": "table", "cells": { "fill": { "color": "#EBF0F8" }, "line": { "color": "white" } }, "header": { "fill": { "color": "#C8D4E3" }, "line": { "color": "white" } } } ], "carpet": [ { "type": "carpet", "aaxis": { "gridcolor": "#C8D4E3", "linecolor": "#C8D4E3", "endlinecolor": "#2a3f5f", "minorgridcolor": "#C8D4E3", "startlinecolor": "#2a3f5f" }, "baxis": { "gridcolor": "#C8D4E3", "linecolor": "#C8D4E3", "endlinecolor": "#2a3f5f", "minorgridcolor": "#C8D4E3", "startlinecolor": "#2a3f5f" } } ], "mesh3d": [ { "type": "mesh3d", "colorbar": { "ticks": "", "outlinewidth": 0 } } ], "contour": [ { "type": "contour", "colorbar": { "ticks": "", "outlinewidth": 0 }, "autocolorscale": true } ], "heatmap": [ { "type": "heatmap", "colorbar": { "ticks": "", "outlinewidth": 0 }, "autocolorscale": true } ], "scatter": [ { "type": "scatter", "marker": { "colorbar": { "ticks": "", "outlinewidth": 0 } } } ], "surface": [ { "type": "surface", "colorbar": { "ticks": "", "outlinewidth": 0 } } ], "heatmapgl": [ { "type": "heatmapgl", "colorbar": { "ticks": "", "outlinewidth": 0 } } ], "histogram": [ { "type": "histogram", "marker": { "colorbar": { "ticks": "", "outlinewidth": 0 } } } ], "parcoords": [ { "line": { "colorbar": { "ticks": "", "outlinewidth": 0 } }, "type": "parcoords" } ], "scatter3d": [ { "type": "scatter3d", "marker": { "colorbar": { "ticks": "", "outlinewidth": 0 } } } ], "scattergl": [ { "type": "scattergl", "marker": { "colorbar": { "ticks": "", "outlinewidth": 0 } } } ], "choropleth": [ { "type": "choropleth", "colorbar": { "ticks": "", "outlinewidth": 0 } } ], "scattergeo": [ { "type": "scattergeo", "marker": { "colorbar": { "ticks": "", "outlinewidth": 0 } } } ], "histogram2d": [ { "type": "histogram2d", "colorbar": { "ticks": "", "outlinewidth": 0 }, "autocolorscale": true } ], "scatterpolar": [ { "type": "scatterpolar", "marker": { "colorbar": { "ticks": "", "outlinewidth": 0 } } } ], "contourcarpet": [ { "type": "contourcarpet", "colorbar": { "ticks": "", "outlinewidth": 0 } } ], "scattercarpet": [ { "type": "scattercarpet", "marker": { "colorbar": { "ticks": "", "outlinewidth": 0 } } } ], "scattermapbox": [ { "type": "scattermapbox", "marker": { "colorbar": { "ticks": "", "outlinewidth": 0 } } } ], "scatterpolargl": [ { "type": "scatterpolargl", "marker": { "colorbar": { "ticks": "", "outlinewidth": 0 } } } ], "scatterternary": [ { "type": "scatterternary", "marker": { "colorbar": { "ticks": "", "outlinewidth": 0 } } } ], "histogram2dcontour": [ { "type": "histogram2dcontour", "colorbar": { "ticks": "", "outlinewidth": 0 }, "autocolorscale": true } ] }, "layout": { "geo": { "bgcolor": "white", "showland": true, "lakecolor": "white", "landcolor": "white", "showlakes": true, "subunitcolor": "#C8D4E3" }, "font": { "color": "#2a3f5f" }, "polar": { "bgcolor": "white", "radialaxis": { "ticks": "", "gridcolor": "#EBF0F8", "linecolor": "#EBF0F8" }, "angularaxis": { "ticks": "", "gridcolor": "#EBF0F8", "linecolor": "#EBF0F8" } }, "scene": { "xaxis": { "ticks": "", "gridcolor": "#DFE8F3", "gridwidth": 2, "linecolor": "#EBF0F8", "zerolinecolor": "#EBF0F8", "showbackground": true, "backgroundcolor": "white" }, "yaxis": { "ticks": "", "gridcolor": "#DFE8F3", "gridwidth": 2, "linecolor": "#EBF0F8", "zerolinecolor": "#EBF0F8", "showbackground": true, "backgroundcolor": "white" }, "zaxis": { "ticks": "", "gridcolor": "#DFE8F3", "gridwidth": 2, "linecolor": "#EBF0F8", "zerolinecolor": "#EBF0F8", "showbackground": true, "backgroundcolor": "white" } }, "title": { "x": 0.05 }, "xaxis": { "ticks": "", "gridcolor": "#EBF0F8", "linecolor": "#EBF0F8", "automargin": true, "zerolinecolor": "#EBF0F8", "zerolinewidth": 2 }, "yaxis": { "ticks": "", "gridcolor": "#EBF0F8", "linecolor": "#EBF0F8", "automargin": true, "zerolinecolor": "#EBF0F8", "zerolinewidth": 2 }, "ternary": { "aaxis": { "ticks": "", "gridcolor": "#DFE8F3", "linecolor": "#A2B1C6" }, "baxis": { "ticks": "", "gridcolor": "#DFE8F3", "linecolor": "#A2B1C6" }, "caxis": { "ticks": "", "gridcolor": "#DFE8F3", "linecolor": "#A2B1C6" }, "bgcolor": "white" }, "colorway": [ "#636efa", "#EF553B", "#00cc96", "#ab63fa", "#19d3f3", "#e763fa", "#fecb52", "#ffa15a", "#ff6692", "#b6e880" ], "hovermode": "closest", "colorscale": { "diverging": [ [ 0, "#8e0152" ], [ 0.1, "#c51b7d" ], [ 0.2, "#de77ae" ], [ 0.3, "#f1b6da" ], [ 0.4, "#fde0ef" ], [ 0.5, "#f7f7f7" ], [ 0.6, "#e6f5d0" ], [ 0.7, "#b8e186" ], [ 0.8, "#7fbc41" ], [ 0.9, "#4d9221" ], [ 1, "#276419" ] ], "sequential": [ [ 0, "#0508b8" ], [ 0.0893854748603352, "#1910d8" ], [ 0.1787709497206704, "#3c19f0" ], [ 0.2681564245810056, "#6b1cfb" ], [ 0.3575418994413408, "#981cfd" ], [ 0.44692737430167595, "#bf1cfd" ], [ 0.5363128491620112, "#dd2bfd" ], [ 0.6256983240223464, "#f246fe" ], [ 0.7150837988826816, "#fc67fd" ], [ 0.8044692737430168, "#fe88fc" ], [ 0.8938547486033519, "#fea5fd" ], [ 0.9832402234636871, "#febefe" ], [ 1, "#fec3fe" ] ], "sequentialminus": [ [ 0, "#0508b8" ], [ 0.0893854748603352, "#1910d8" ], [ 0.1787709497206704, "#3c19f0" ], [ 0.2681564245810056, "#6b1cfb" ], [ 0.3575418994413408, "#981cfd" ], [ 0.44692737430167595, "#bf1cfd" ], [ 0.5363128491620112, "#dd2bfd" ], [ 0.6256983240223464, "#f246fe" ], [ 0.7150837988826816, "#fc67fd" ], [ 0.8044692737430168, "#fe88fc" ], [ 0.8938547486033519, "#fea5fd" ], [ 0.9832402234636871, "#febefe" ], [ 1, "#fec3fe" ] ] }, "plot_bgcolor": "white", "paper_bgcolor": "white", "shapedefaults": { "line": { "width": 0 }, "opacity": 0.4, "fillcolor": "#506784" }, "annotationdefaults": { "arrowhead": 0, "arrowcolor": "#506784", "arrowwidth": 1 } }, "themeRef": "PLOTLY_WHITE" } } }, "height": null, "width": null, "user": { "profile_url": "https://chart-studio.plotly.com/~varun2004", "avatar_url": "https://storage.googleapis.com/plotly-prod-profiles/60.jpg", "background_url": "https://storage.googleapis.com/plotly-prod-profiles/bg-12.jpg", "bio": "", "nickname": "", "website": "", "stream_tokens": null, "feature_set_id": null, "csrf_token": null, "date_joined": "2024-03-28 14:50:16", "mapbox_access_tokens": null, "has_password": null, "username": "varun2004", "email": null, "is_active": null, "readonly": null, "is_dash_creator": null, "dash_created_count": null, "is_chart_creator": null, "charts_created_count": null } }, { "creation_time": "2024-03-28T14:45:55.200636Z", "comments": { "results": [], "count": 0 }, "parented": true, "embed_url": "https://chart-studio.plotly.com/~huschked/1.embed", "fid": "huschked:1", "filename": "Plot 1", "filetype": "plot", "img_url": "https://storage.googleapis.com/plotly-prod-images/huschked/1/9_6RW4HX2CB1UAOKZN80NHLIUC1SV37X.png", "image_urls": { "default": "https://storage.googleapis.com/plotly-prod-images/huschked/1/2_1VQTUCJ3CW8F6632T7N0VASRPEAW6B.png", "block-thumb": "https://storage.googleapis.com/plotly-prod-images/huschked/1/8_66ESZF7CEEDK530XMJLMUAQNXTONE7.png", "list-thumb": "https://storage.googleapis.com/plotly-prod-images/huschked/1/9_6RW4HX2CB1UAOKZN80NHLIUC1SV37X.png" }, "api_urls": { "files": "https://api.plotly.com/v2/files/huschked:1", "plots": "https://api.plotly.com/v2/plots/huschked:1", "parent": "https://api.plotly.com/v2/folders/home?user=huschked" }, "owner": "huschked", "parent": -1, "preview": "", "referencers": [], "references": [], "title": "", "views": 3, "web_url": "https://chart-studio.plotly.com/~huschked/1/", "world_readable": true, "date_modified": "2024-03-28T15:23:56.170Z", "stars": { "results": [], "count": 0 }, "collaborators": { "results": [], "count": 0 }, "subfolder_count": null, "refresh_interval": null, "organize_view_url": "https://chart-studio.plotly.com/~huschked/1/", "current_user_permission": "read", "is_theme": null, "is_template": false, "autosize": true, "caption": "", "figure": { "data": [ { "hole": 0.5, "meta": { "columnNames": { "text": "A", "labels": "A", "values": "B" } }, "mode": "markers", "pull": 0, "sort": true, "type": "pie", "title": { "text": "" }, "marker": { "line": { "width": 2 } }, "opacity": 1, "textsrc": "huschked:0:4f947b", "rotation": 0, "textinfo": "label+percent", "direction": "counterclockwise", "hoverinfo": "value", "labelssrc": "huschked:0:4f947b", "valuessrc": "huschked:0:7bea57", "hoverlabel": { "align": "left" }, "showlegend": true, "textposition": "auto" } ], "frames": [], "layout": { "font": { "size": 15, "family": "Droid Sans" }, "xaxis": { "range": [ -1, 6 ], "autorange": true }, "yaxis": { "range": [ -1, 4 ], "autorange": true }, "legend": { "x": 0.5, "y": -0.1, "valign": "middle", "xanchor": "center", "yanchor": "middle", "traceorder": "normal", "borderwidth": 0, "orientation": "h" }, "margin": { "b": 80 }, "modebar": { "orientation": "h" }, "autosize": true, "dragmode": "zoom", "clickmode": "event", "hovermode": "closest", "hoverlabel": { "font": { "size": 25, "family": "Roboto" } }, "showlegend": true, "annotations": [], "uniformtext": { "mode": false }, "extendpiecolors": true } }, "height": null, "width": null, "user": { "profile_url": "https://chart-studio.plotly.com/~huschked", "avatar_url": "https://storage.googleapis.com/plotly-prod-profiles/45.jpg", "background_url": "https://storage.googleapis.com/plotly-prod-profiles/bg-7.jpg", "bio": "", "nickname": "", "website": "", "stream_tokens": null, "feature_set_id": null, "csrf_token": null, "date_joined": "2024-03-28 14:33:39", "mapbox_access_tokens": null, "has_password": null, "username": "huschked", "email": null, "is_active": null, "readonly": null, "is_dash_creator": null, "dash_created_count": null, "is_chart_creator": null, "charts_created_count": null } } ] }
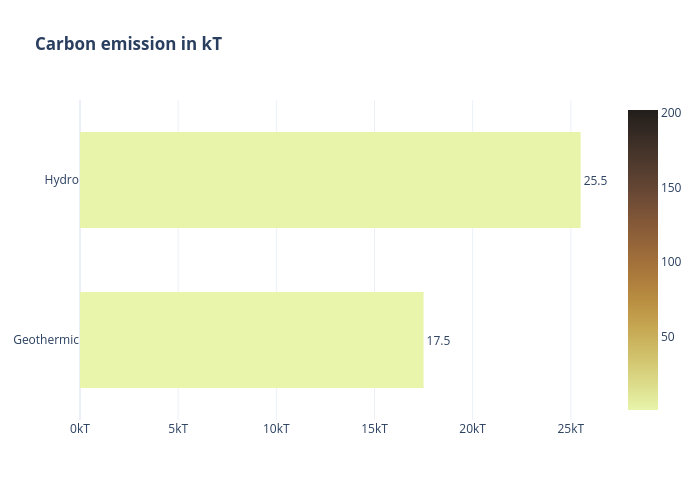