Plots List
Plots
This endpoint handles manipulation of Plotly plot files.
Reference
Authorization
Any user with or without a Plotly account may view public plots. For private plots, see authentication.
Actions
list
Listing all public plots can be done via a GET request to this endpoint.
By default, plots will be listed in order of date created. The order_by
query parameter is accepted at this endpoint. Currently, only ordering by
views is supported. It is possible to filter the plots by quality
with min_quality or max_quality as query parameter.
Example:
// GET https://api.plotly.com/v2/plots/ ---> 200

// GET https://api.plotly.com/v2/plots/?order_by=-views ---> 200

// GET https://api.plotly.com/v2/plots/?min_quality=5 ---> 200

// GET https://api.plotly.com/v2/plots/?max_quality=5 ---> 200
feed
Listing all handpicked feed plots can be done via a GET request to this endpoint. By default, plots will be listed in a random order.
Example:
// GET https://api.plotly.com/v2/plots/feed ---> 200
create
You can create new plot resources here. The only required field is 'figure'. Currently, the figure is restricted to only contain references to grid data. That is, this will fail if raw data arrays are passed in. To create and manipulate underlying grids for plots, see the grids endpoint.
Example:
// This fails because a figure field is required.
// POST https://api.plotly.com/v2/plots ---> 400 Bad Request
{}

// This fails because the figure has raw data
//POST https://api.plotly.com/v2/plots ---> 400 Bad Request
{
    "figure": {"data": [{"y": ['this', 'is', 'raw', 'data']}]}
}

// This succeeds because the figure has src keys, not raw data.
//POST https://api.plotly.com/v2/plots ---> 200 OK
{
    "figure": {"data": [{"ysrc": "sven:88:u8nd62"}]}
}
When creating a grid, you can optionally specify a source_fid to specify where a plot has come from:
- source_fid: the fid of a plot that was copied (and presumably edited) to produce this one
detail
There is a lot of meta information stored about plot files including filename, title, share_url, and content_url to name a few.
This information can only be reached with a GET to this endpoint.
Example:
// GET https://api.plotly.com/v2/plots/iheartgraphs:90
content
The contents of a plot can be downloaded via the content resource. The plot
content contains referenced grid/column data by default. If you wish to
return the raw grid/column data, the inline_data=true query must be included
in the request url. The Content-Type header will be appropriately set for the
response body.
Alternatively, you can set ?map_data=unreadable to append a mapping of
sources to data that belongs to grids which are unreadable for the
requestor. This is useful when you have read access to another users plot,
but that plot contains grid references which you don't have access to.
Examples:
// Returns referenced grid/column data
// GET https://api.plotly.com/v2/plots/iheartgraphs:90/content ---> 200 OK

// Returns full grid/column data
// GET https://api.plotly.com/v2/plots/iheartgraphs:90/content?inline_data=true ---> 200 OK

// Returns full grid/column data when requestor doesn't have permission
// to read the referenced grid.
// GET https://api.plotly.com/v2/plots/iheartgraphs:90/content?map_data=unreadable ---> 200 OK
GET /v2/plots?cursor=cD0yMDI0LTAzLTI4KzA5JTNBNDAlM0EzOC44Njc2ODclMkIwMCUzQTAw&format=api
{ "next": "https://api.plot.ly/v2/plots?cursor=cD0yMDI0LTAzLTI4KzA4JTNBMTAlM0E0Mi41MjkzNzAlMkIwMCUzQTAw&format=api", "previous": "https://api.plot.ly/v2/plots?cursor=cj0xJnA9MjAyNC0wMy0yOCswOSUzQTQwJTNBMzIuNDA1NDM0JTJCMDAlM0EwMA%3D%3D&format=api", "results": [ { "creation_time": "2024-03-28T09:40:32.405434Z", "comments": { "results": [], "count": 0 }, "parented": true, "embed_url": "https://chart-studio.plotly.com/~Esthersun/11.embed", "fid": "Esthersun:11", "filename": "MarchTopics", "filetype": "plot", "img_url": "https://storage.googleapis.com/plotly-prod-images/Esthersun/11/9_UEWF90BN9LR2B2C589FLTQAX91D5TQ.png", "image_urls": { "default": "https://storage.googleapis.com/plotly-prod-images/Esthersun/11/2_2XA2PRILOX8L9AWT0NKIQL71CNZV4D.png", "block-thumb": "https://storage.googleapis.com/plotly-prod-images/Esthersun/11/8_ZYQYDO8T9FI683ZQ6N54PAJFTEDUXD.png", "list-thumb": "https://storage.googleapis.com/plotly-prod-images/Esthersun/11/9_UEWF90BN9LR2B2C589FLTQAX91D5TQ.png" }, "api_urls": { "files": "https://api.plotly.com/v2/files/Esthersun:11", "plots": "https://api.plotly.com/v2/plots/Esthersun:11", "parent": "https://api.plotly.com/v2/folders/home?user=Esthersun" }, "owner": "Esthersun", "parent": -1, "preview": "", "referencers": [], "references": [], "title": "", "views": 19, "web_url": "https://chart-studio.plotly.com/~Esthersun/11/", "world_readable": true, "date_modified": "2024-03-28T09:40:32.415Z", "stars": { "results": [], "count": 0 }, "collaborators": { "results": [], "count": 0 }, "subfolder_count": null, "refresh_interval": null, "organize_view_url": "https://chart-studio.plotly.com/~Esthersun/11/", "current_user_permission": "read", "is_theme": null, "is_template": null, "autosize": true, "caption": "", "figure": { "data": [ { "name": "", "type": "bar", "xsrc": "Esthersun:10:51fd6d", "ysrc": "Esthersun:10:ee3b45", "xaxis": "x", "yaxis": "y", "marker": { "pattern": { "shape": "" }, "colorsrc": "Esthersun:10:fbc186", "coloraxis": "coloraxis" }, "showlegend": false, "legendgroup": "", "offsetgroup": "", "orientation": "h", "textposition": "auto", "hovertemplate": "Frequency=%{marker.color}<br>Top Words=%{y}<extra></extra>", "alignmentgroup": "True" } ], "layout": { "title": { "text": "Top 10 Topics for 2024-03" }, "xaxis": { "side": "top", "title": { "text": "Frequency" }, "anchor": "y", "domain": [ 0.0, 1.0 ] }, "yaxis": { "title": { "text": "Top Words" }, "anchor": "x", "domain": [ 0.0, 1.0 ] }, "legend": { "tracegroupgap": 0 }, "barmode": "relative", "template": { "data": { "bar": [ { "type": "bar", "marker": { "line": { "color": "#E5ECF6", "width": 0.5 }, "pattern": { "size": 10, "fillmode": "overlay", "solidity": 0.2 } }, "error_x": { "color": "#2a3f5f" }, "error_y": { "color": "#2a3f5f" } } ], "pie": [ { "type": "pie", "automargin": true } ], "table": [ { "type": "table", "cells": { "fill": { "color": "#EBF0F8" }, "line": { "color": "white" } }, "header": { "fill": { "color": "#C8D4E3" }, "line": { "color": "white" } } } ], "carpet": [ { "type": "carpet", "aaxis": { "gridcolor": "white", "linecolor": "white", "endlinecolor": "#2a3f5f", "minorgridcolor": "white", "startlinecolor": "#2a3f5f" }, "baxis": { "gridcolor": "white", "linecolor": "white", "endlinecolor": "#2a3f5f", "minorgridcolor": "white", "startlinecolor": "#2a3f5f" } } ], "mesh3d": [ { "type": "mesh3d", "colorbar": { "ticks": "", "outlinewidth": 0 } } ], "contour": [ { "type": "contour", "colorbar": { "ticks": "", "outlinewidth": 0 }, "colorscale": [ [ 0.0, "#0d0887" ], [ 0.1111111111111111, "#46039f" ], [ 0.2222222222222222, "#7201a8" ], [ 0.3333333333333333, "#9c179e" ], [ 0.4444444444444444, "#bd3786" ], [ 0.5555555555555556, "#d8576b" ], [ 0.6666666666666666, "#ed7953" ], [ 0.7777777777777778, "#fb9f3a" ], [ 0.8888888888888888, "#fdca26" ], [ 1.0, "#f0f921" ] ] } ], "heatmap": [ { "type": "heatmap", "colorbar": { "ticks": "", "outlinewidth": 0 }, "colorscale": [ [ 0.0, "#0d0887" ], [ 0.1111111111111111, "#46039f" ], [ 0.2222222222222222, "#7201a8" ], [ 0.3333333333333333, "#9c179e" ], [ 0.4444444444444444, "#bd3786" ], [ 0.5555555555555556, "#d8576b" ], [ 0.6666666666666666, "#ed7953" ], [ 0.7777777777777778, "#fb9f3a" ], [ 0.8888888888888888, "#fdca26" ], [ 1.0, "#f0f921" ] ] } ], "scatter": [ { "type": "scatter", "fillpattern": { "size": 10, "fillmode": "overlay", "solidity": 0.2 } } ], "surface": [ { "type": "surface", "colorbar": { "ticks": "", "outlinewidth": 0 }, "colorscale": [ [ 0.0, "#0d0887" ], [ 0.1111111111111111, "#46039f" ], [ 0.2222222222222222, "#7201a8" ], [ 0.3333333333333333, "#9c179e" ], [ 0.4444444444444444, "#bd3786" ], [ 0.5555555555555556, "#d8576b" ], [ 0.6666666666666666, "#ed7953" ], [ 0.7777777777777778, "#fb9f3a" ], [ 0.8888888888888888, "#fdca26" ], [ 1.0, "#f0f921" ] ] } ], "barpolar": [ { "type": "barpolar", "marker": { "line": { "color": "#E5ECF6", "width": 0.5 }, "pattern": { "size": 10, "fillmode": "overlay", "solidity": 0.2 } } } ], "heatmapgl": [ { "type": "heatmapgl", "colorbar": { "ticks": "", "outlinewidth": 0 }, "colorscale": [ [ 0.0, "#0d0887" ], [ 0.1111111111111111, "#46039f" ], [ 0.2222222222222222, "#7201a8" ], [ 0.3333333333333333, "#9c179e" ], [ 0.4444444444444444, "#bd3786" ], [ 0.5555555555555556, "#d8576b" ], [ 0.6666666666666666, "#ed7953" ], [ 0.7777777777777778, "#fb9f3a" ], [ 0.8888888888888888, "#fdca26" ], [ 1.0, "#f0f921" ] ] } ], "histogram": [ { "type": "histogram", "marker": { "pattern": { "size": 10, "fillmode": "overlay", "solidity": 0.2 } } } ], "parcoords": [ { "line": { "colorbar": { "ticks": "", "outlinewidth": 0 } }, "type": "parcoords" } ], "scatter3d": [ { "line": { "colorbar": { "ticks": "", "outlinewidth": 0 } }, "type": "scatter3d", "marker": { "colorbar": { "ticks": "", "outlinewidth": 0 } } } ], "scattergl": [ { "type": "scattergl", "marker": { "colorbar": { "ticks": "", "outlinewidth": 0 } } } ], "choropleth": [ { "type": "choropleth", "colorbar": { "ticks": "", "outlinewidth": 0 } } ], "scattergeo": [ { "type": "scattergeo", "marker": { "colorbar": { "ticks": "", "outlinewidth": 0 } } } ], "histogram2d": [ { "type": "histogram2d", "colorbar": { "ticks": "", "outlinewidth": 0 }, "colorscale": [ [ 0.0, "#0d0887" ], [ 0.1111111111111111, "#46039f" ], [ 0.2222222222222222, "#7201a8" ], [ 0.3333333333333333, "#9c179e" ], [ 0.4444444444444444, "#bd3786" ], [ 0.5555555555555556, "#d8576b" ], [ 0.6666666666666666, "#ed7953" ], [ 0.7777777777777778, "#fb9f3a" ], [ 0.8888888888888888, "#fdca26" ], [ 1.0, "#f0f921" ] ] } ], "scatterpolar": [ { "type": "scatterpolar", "marker": { "colorbar": { "ticks": "", "outlinewidth": 0 } } } ], "contourcarpet": [ { "type": "contourcarpet", "colorbar": { "ticks": "", "outlinewidth": 0 } } ], "scattercarpet": [ { "type": "scattercarpet", "marker": { "colorbar": { "ticks": "", "outlinewidth": 0 } } } ], "scattermapbox": [ { "type": "scattermapbox", "marker": { "colorbar": { "ticks": "", "outlinewidth": 0 } } } ], "scatterpolargl": [ { "type": "scatterpolargl", "marker": { "colorbar": { "ticks": "", "outlinewidth": 0 } } } ], "scatterternary": [ { "type": "scatterternary", "marker": { "colorbar": { "ticks": "", "outlinewidth": 0 } } } ], "histogram2dcontour": [ { "type": "histogram2dcontour", "colorbar": { "ticks": "", "outlinewidth": 0 }, "colorscale": [ [ 0.0, "#0d0887" ], [ 0.1111111111111111, "#46039f" ], [ 0.2222222222222222, "#7201a8" ], [ 0.3333333333333333, "#9c179e" ], [ 0.4444444444444444, "#bd3786" ], [ 0.5555555555555556, "#d8576b" ], [ 0.6666666666666666, "#ed7953" ], [ 0.7777777777777778, "#fb9f3a" ], [ 0.8888888888888888, "#fdca26" ], [ 1.0, "#f0f921" ] ] } ] }, "layout": { "geo": { "bgcolor": "white", "showland": true, "lakecolor": "white", "landcolor": "#E5ECF6", "showlakes": true, "subunitcolor": "white" }, "font": { "color": "#2a3f5f" }, "polar": { "bgcolor": "#E5ECF6", "radialaxis": { "ticks": "", "gridcolor": "white", "linecolor": "white" }, "angularaxis": { "ticks": "", "gridcolor": "white", "linecolor": "white" } }, "scene": { "xaxis": { "ticks": "", "gridcolor": "white", "gridwidth": 2, "linecolor": "white", "zerolinecolor": "white", "showbackground": true, "backgroundcolor": "#E5ECF6" }, "yaxis": { "ticks": "", "gridcolor": "white", "gridwidth": 2, "linecolor": "white", "zerolinecolor": "white", "showbackground": true, "backgroundcolor": "#E5ECF6" }, "zaxis": { "ticks": "", "gridcolor": "white", "gridwidth": 2, "linecolor": "white", "zerolinecolor": "white", "showbackground": true, "backgroundcolor": "#E5ECF6" } }, "title": { "x": 0.05 }, "xaxis": { "ticks": "", "title": { "standoff": 15 }, "gridcolor": "white", "linecolor": "white", "automargin": true, "zerolinecolor": "white", "zerolinewidth": 2 }, "yaxis": { "ticks": "", "title": { "standoff": 15 }, "gridcolor": "white", "linecolor": "white", "automargin": true, "zerolinecolor": "white", "zerolinewidth": 2 }, "mapbox": { "style": "light" }, "ternary": { "aaxis": { "ticks": "", "gridcolor": "white", "linecolor": "white" }, "baxis": { "ticks": "", "gridcolor": "white", "linecolor": "white" }, "caxis": { "ticks": "", "gridcolor": "white", "linecolor": "white" }, "bgcolor": "#E5ECF6" }, "colorway": [ "#636efa", "#EF553B", "#00cc96", "#ab63fa", "#FFA15A", "#19d3f3", "#FF6692", "#B6E880", "#FF97FF", "#FECB52" ], "coloraxis": { "colorbar": { "ticks": "", "outlinewidth": 0 } }, "hovermode": "closest", "colorscale": { "diverging": [ [ 0, "#8e0152" ], [ 0.1, "#c51b7d" ], [ 0.2, "#de77ae" ], [ 0.3, "#f1b6da" ], [ 0.4, "#fde0ef" ], [ 0.5, "#f7f7f7" ], [ 0.6, "#e6f5d0" ], [ 0.7, "#b8e186" ], [ 0.8, "#7fbc41" ], [ 0.9, "#4d9221" ], [ 1, "#276419" ] ], "sequential": [ [ 0.0, "#0d0887" ], [ 0.1111111111111111, "#46039f" ], [ 0.2222222222222222, "#7201a8" ], [ 0.3333333333333333, "#9c179e" ], [ 0.4444444444444444, "#bd3786" ], [ 0.5555555555555556, "#d8576b" ], [ 0.6666666666666666, "#ed7953" ], [ 0.7777777777777778, "#fb9f3a" ], [ 0.8888888888888888, "#fdca26" ], [ 1.0, "#f0f921" ] ], "sequentialminus": [ [ 0.0, "#0d0887" ], [ 0.1111111111111111, "#46039f" ], [ 0.2222222222222222, "#7201a8" ], [ 0.3333333333333333, "#9c179e" ], [ 0.4444444444444444, "#bd3786" ], [ 0.5555555555555556, "#d8576b" ], [ 0.6666666666666666, "#ed7953" ], [ 0.7777777777777778, "#fb9f3a" ], [ 0.8888888888888888, "#fdca26" ], [ 1.0, "#f0f921" ] ] }, "hoverlabel": { "align": "left" }, "plot_bgcolor": "#E5ECF6", "paper_bgcolor": "white", "shapedefaults": { "line": { "color": "#2a3f5f" } }, "autotypenumbers": "strict", "annotationdefaults": { "arrowhead": 0, "arrowcolor": "#2a3f5f", "arrowwidth": 1 } } }, "coloraxis": { "colorbar": { "title": { "text": "Frequency" } }, "colorscale": [ [ 0.0, "#440154" ], [ 0.1111111111111111, "#482878" ], [ 0.2222222222222222, "#3e4989" ], [ 0.3333333333333333, "#31688e" ], [ 0.4444444444444444, "#26828e" ], [ 0.5555555555555556, "#1f9e89" ], [ 0.6666666666666666, "#35b779" ], [ 0.7777777777777778, "#6ece58" ], [ 0.8888888888888888, "#b5de2b" ], [ 1.0, "#fde725" ] ] } } }, "height": null, "width": null, "user": { "profile_url": "https://chart-studio.plotly.com/~Esthersun", "avatar_url": "https://storage.googleapis.com/plotly-prod-profiles/29.jpg", "background_url": "https://storage.googleapis.com/plotly-prod-profiles/bg-3.jpg", "bio": "", "nickname": "", "website": "", "stream_tokens": null, "feature_set_id": null, "csrf_token": null, "date_joined": "2024-03-28 08:29:53", "mapbox_access_tokens": null, "has_password": null, "username": "Esthersun", "email": null, "is_active": null, "readonly": null, "is_dash_creator": null, "dash_created_count": null, "is_chart_creator": null, "charts_created_count": null } }, { "creation_time": "2024-03-28T09:39:33.586509Z", "comments": { "results": [], "count": 0 }, "parented": true, "embed_url": "https://chart-studio.plotly.com/~Esthersun/9.embed", "fid": "Esthersun:9", "filename": "FebTopics", "filetype": "plot", "img_url": "https://storage.googleapis.com/plotly-prod-images/Esthersun/9/9_6CV1PCD6H190BK097LMG4TCU7WMUF0.png", "image_urls": { "default": "https://storage.googleapis.com/plotly-prod-images/Esthersun/9/2_LYM2XDGGZQDZ0X7Q95SKKK31W0UHPZ.png", "block-thumb": "https://storage.googleapis.com/plotly-prod-images/Esthersun/9/8_KY4UXMXANOK4MTDY2SPX2AIY8YQ7E1.png", "list-thumb": "https://storage.googleapis.com/plotly-prod-images/Esthersun/9/9_6CV1PCD6H190BK097LMG4TCU7WMUF0.png" }, "api_urls": { "files": "https://api.plotly.com/v2/files/Esthersun:9", "plots": "https://api.plotly.com/v2/plots/Esthersun:9", "parent": "https://api.plotly.com/v2/folders/home?user=Esthersun" }, "owner": "Esthersun", "parent": -1, "preview": "", "referencers": [], "references": [], "title": "", "views": 20, "web_url": "https://chart-studio.plotly.com/~Esthersun/9/", "world_readable": true, "date_modified": "2024-03-28T09:39:33.597Z", "stars": { "results": [], "count": 0 }, "collaborators": { "results": [], "count": 0 }, "subfolder_count": null, "refresh_interval": null, "organize_view_url": "https://chart-studio.plotly.com/~Esthersun/9/", "current_user_permission": "read", "is_theme": null, "is_template": null, "autosize": true, "caption": "", "figure": { "data": [ { "name": "", "type": "bar", "xsrc": "Esthersun:8:cd4a6a", "ysrc": "Esthersun:8:1a1c23", "xaxis": "x", "yaxis": "y", "marker": { "pattern": { "shape": "" }, "colorsrc": "Esthersun:8:72ab94", "coloraxis": "coloraxis" }, "showlegend": false, "legendgroup": "", "offsetgroup": "", "orientation": "h", "textposition": "auto", "hovertemplate": "Frequency=%{marker.color}<br>Top Words=%{y}<extra></extra>", "alignmentgroup": "True" } ], "layout": { "title": { "text": "Top 10 Topics for 2024-02" }, "xaxis": { "side": "top", "title": { "text": "Frequency" }, "anchor": "y", "domain": [ 0.0, 1.0 ] }, "yaxis": { "title": { "text": "Top Words" }, "anchor": "x", "domain": [ 0.0, 1.0 ] }, "legend": { "tracegroupgap": 0 }, "barmode": "relative", "template": { "data": { "bar": [ { "type": "bar", "marker": { "line": { "color": "#E5ECF6", "width": 0.5 }, "pattern": { "size": 10, "fillmode": "overlay", "solidity": 0.2 } }, "error_x": { "color": "#2a3f5f" }, "error_y": { "color": "#2a3f5f" } } ], "pie": [ { "type": "pie", "automargin": true } ], "table": [ { "type": "table", "cells": { "fill": { "color": "#EBF0F8" }, "line": { "color": "white" } }, "header": { "fill": { "color": "#C8D4E3" }, "line": { "color": "white" } } } ], "carpet": [ { "type": "carpet", "aaxis": { "gridcolor": "white", "linecolor": "white", "endlinecolor": "#2a3f5f", "minorgridcolor": "white", "startlinecolor": "#2a3f5f" }, "baxis": { "gridcolor": "white", "linecolor": "white", "endlinecolor": "#2a3f5f", "minorgridcolor": "white", "startlinecolor": "#2a3f5f" } } ], "mesh3d": [ { "type": "mesh3d", "colorbar": { "ticks": "", "outlinewidth": 0 } } ], "contour": [ { "type": "contour", "colorbar": { "ticks": "", "outlinewidth": 0 }, "colorscale": [ [ 0.0, "#0d0887" ], [ 0.1111111111111111, "#46039f" ], [ 0.2222222222222222, "#7201a8" ], [ 0.3333333333333333, "#9c179e" ], [ 0.4444444444444444, "#bd3786" ], [ 0.5555555555555556, "#d8576b" ], [ 0.6666666666666666, "#ed7953" ], [ 0.7777777777777778, "#fb9f3a" ], [ 0.8888888888888888, "#fdca26" ], [ 1.0, "#f0f921" ] ] } ], "heatmap": [ { "type": "heatmap", "colorbar": { "ticks": "", "outlinewidth": 0 }, "colorscale": [ [ 0.0, "#0d0887" ], [ 0.1111111111111111, "#46039f" ], [ 0.2222222222222222, "#7201a8" ], [ 0.3333333333333333, "#9c179e" ], [ 0.4444444444444444, "#bd3786" ], [ 0.5555555555555556, "#d8576b" ], [ 0.6666666666666666, "#ed7953" ], [ 0.7777777777777778, "#fb9f3a" ], [ 0.8888888888888888, "#fdca26" ], [ 1.0, "#f0f921" ] ] } ], "scatter": [ { "type": "scatter", "fillpattern": { "size": 10, "fillmode": "overlay", "solidity": 0.2 } } ], "surface": [ { "type": "surface", "colorbar": { "ticks": "", "outlinewidth": 0 }, "colorscale": [ [ 0.0, "#0d0887" ], [ 0.1111111111111111, "#46039f" ], [ 0.2222222222222222, "#7201a8" ], [ 0.3333333333333333, "#9c179e" ], [ 0.4444444444444444, "#bd3786" ], [ 0.5555555555555556, "#d8576b" ], [ 0.6666666666666666, "#ed7953" ], [ 0.7777777777777778, "#fb9f3a" ], [ 0.8888888888888888, "#fdca26" ], [ 1.0, "#f0f921" ] ] } ], "barpolar": [ { "type": "barpolar", "marker": { "line": { "color": "#E5ECF6", "width": 0.5 }, "pattern": { "size": 10, "fillmode": "overlay", "solidity": 0.2 } } } ], "heatmapgl": [ { "type": "heatmapgl", "colorbar": { "ticks": "", "outlinewidth": 0 }, "colorscale": [ [ 0.0, "#0d0887" ], [ 0.1111111111111111, "#46039f" ], [ 0.2222222222222222, "#7201a8" ], [ 0.3333333333333333, "#9c179e" ], [ 0.4444444444444444, "#bd3786" ], [ 0.5555555555555556, "#d8576b" ], [ 0.6666666666666666, "#ed7953" ], [ 0.7777777777777778, "#fb9f3a" ], [ 0.8888888888888888, "#fdca26" ], [ 1.0, "#f0f921" ] ] } ], "histogram": [ { "type": "histogram", "marker": { "pattern": { "size": 10, "fillmode": "overlay", "solidity": 0.2 } } } ], "parcoords": [ { "line": { "colorbar": { "ticks": "", "outlinewidth": 0 } }, "type": "parcoords" } ], "scatter3d": [ { "line": { "colorbar": { "ticks": "", "outlinewidth": 0 } }, "type": "scatter3d", "marker": { "colorbar": { "ticks": "", "outlinewidth": 0 } } } ], "scattergl": [ { "type": "scattergl", "marker": { "colorbar": { "ticks": "", "outlinewidth": 0 } } } ], "choropleth": [ { "type": "choropleth", "colorbar": { "ticks": "", "outlinewidth": 0 } } ], "scattergeo": [ { "type": "scattergeo", "marker": { "colorbar": { "ticks": "", "outlinewidth": 0 } } } ], "histogram2d": [ { "type": "histogram2d", "colorbar": { "ticks": "", "outlinewidth": 0 }, "colorscale": [ [ 0.0, "#0d0887" ], [ 0.1111111111111111, "#46039f" ], [ 0.2222222222222222, "#7201a8" ], [ 0.3333333333333333, "#9c179e" ], [ 0.4444444444444444, "#bd3786" ], [ 0.5555555555555556, "#d8576b" ], [ 0.6666666666666666, "#ed7953" ], [ 0.7777777777777778, "#fb9f3a" ], [ 0.8888888888888888, "#fdca26" ], [ 1.0, "#f0f921" ] ] } ], "scatterpolar": [ { "type": "scatterpolar", "marker": { "colorbar": { "ticks": "", "outlinewidth": 0 } } } ], "contourcarpet": [ { "type": "contourcarpet", "colorbar": { "ticks": "", "outlinewidth": 0 } } ], "scattercarpet": [ { "type": "scattercarpet", "marker": { "colorbar": { "ticks": "", "outlinewidth": 0 } } } ], "scattermapbox": [ { "type": "scattermapbox", "marker": { "colorbar": { "ticks": "", "outlinewidth": 0 } } } ], "scatterpolargl": [ { "type": "scatterpolargl", "marker": { "colorbar": { "ticks": "", "outlinewidth": 0 } } } ], "scatterternary": [ { "type": "scatterternary", "marker": { "colorbar": { "ticks": "", "outlinewidth": 0 } } } ], "histogram2dcontour": [ { "type": "histogram2dcontour", "colorbar": { "ticks": "", "outlinewidth": 0 }, "colorscale": [ [ 0.0, "#0d0887" ], [ 0.1111111111111111, "#46039f" ], [ 0.2222222222222222, "#7201a8" ], [ 0.3333333333333333, "#9c179e" ], [ 0.4444444444444444, "#bd3786" ], [ 0.5555555555555556, "#d8576b" ], [ 0.6666666666666666, "#ed7953" ], [ 0.7777777777777778, "#fb9f3a" ], [ 0.8888888888888888, "#fdca26" ], [ 1.0, "#f0f921" ] ] } ] }, "layout": { "geo": { "bgcolor": "white", "showland": true, "lakecolor": "white", "landcolor": "#E5ECF6", "showlakes": true, "subunitcolor": "white" }, "font": { "color": "#2a3f5f" }, "polar": { "bgcolor": "#E5ECF6", "radialaxis": { "ticks": "", "gridcolor": "white", "linecolor": "white" }, "angularaxis": { "ticks": "", "gridcolor": "white", "linecolor": "white" } }, "scene": { "xaxis": { "ticks": "", "gridcolor": "white", "gridwidth": 2, "linecolor": "white", "zerolinecolor": "white", "showbackground": true, "backgroundcolor": "#E5ECF6" }, "yaxis": { "ticks": "", "gridcolor": "white", "gridwidth": 2, "linecolor": "white", "zerolinecolor": "white", "showbackground": true, "backgroundcolor": "#E5ECF6" }, "zaxis": { "ticks": "", "gridcolor": "white", "gridwidth": 2, "linecolor": "white", "zerolinecolor": "white", "showbackground": true, "backgroundcolor": "#E5ECF6" } }, "title": { "x": 0.05 }, "xaxis": { "ticks": "", "title": { "standoff": 15 }, "gridcolor": "white", "linecolor": "white", "automargin": true, "zerolinecolor": "white", "zerolinewidth": 2 }, "yaxis": { "ticks": "", "title": { "standoff": 15 }, "gridcolor": "white", "linecolor": "white", "automargin": true, "zerolinecolor": "white", "zerolinewidth": 2 }, "mapbox": { "style": "light" }, "ternary": { "aaxis": { "ticks": "", "gridcolor": "white", "linecolor": "white" }, "baxis": { "ticks": "", "gridcolor": "white", "linecolor": "white" }, "caxis": { "ticks": "", "gridcolor": "white", "linecolor": "white" }, "bgcolor": "#E5ECF6" }, "colorway": [ "#636efa", "#EF553B", "#00cc96", "#ab63fa", "#FFA15A", "#19d3f3", "#FF6692", "#B6E880", "#FF97FF", "#FECB52" ], "coloraxis": { "colorbar": { "ticks": "", "outlinewidth": 0 } }, "hovermode": "closest", "colorscale": { "diverging": [ [ 0, "#8e0152" ], [ 0.1, "#c51b7d" ], [ 0.2, "#de77ae" ], [ 0.3, "#f1b6da" ], [ 0.4, "#fde0ef" ], [ 0.5, "#f7f7f7" ], [ 0.6, "#e6f5d0" ], [ 0.7, "#b8e186" ], [ 0.8, "#7fbc41" ], [ 0.9, "#4d9221" ], [ 1, "#276419" ] ], "sequential": [ [ 0.0, "#0d0887" ], [ 0.1111111111111111, "#46039f" ], [ 0.2222222222222222, "#7201a8" ], [ 0.3333333333333333, "#9c179e" ], [ 0.4444444444444444, "#bd3786" ], [ 0.5555555555555556, "#d8576b" ], [ 0.6666666666666666, "#ed7953" ], [ 0.7777777777777778, "#fb9f3a" ], [ 0.8888888888888888, "#fdca26" ], [ 1.0, "#f0f921" ] ], "sequentialminus": [ [ 0.0, "#0d0887" ], [ 0.1111111111111111, "#46039f" ], [ 0.2222222222222222, "#7201a8" ], [ 0.3333333333333333, "#9c179e" ], [ 0.4444444444444444, "#bd3786" ], [ 0.5555555555555556, "#d8576b" ], [ 0.6666666666666666, "#ed7953" ], [ 0.7777777777777778, "#fb9f3a" ], [ 0.8888888888888888, "#fdca26" ], [ 1.0, "#f0f921" ] ] }, "hoverlabel": { "align": "left" }, "plot_bgcolor": "#E5ECF6", "paper_bgcolor": "white", "shapedefaults": { "line": { "color": "#2a3f5f" } }, "autotypenumbers": "strict", "annotationdefaults": { "arrowhead": 0, "arrowcolor": "#2a3f5f", "arrowwidth": 1 } } }, "coloraxis": { "colorbar": { "title": { "text": "Frequency" } }, "colorscale": [ [ 0.0, "#440154" ], [ 0.1111111111111111, "#482878" ], [ 0.2222222222222222, "#3e4989" ], [ 0.3333333333333333, "#31688e" ], [ 0.4444444444444444, "#26828e" ], [ 0.5555555555555556, "#1f9e89" ], [ 0.6666666666666666, "#35b779" ], [ 0.7777777777777778, "#6ece58" ], [ 0.8888888888888888, "#b5de2b" ], [ 1.0, "#fde725" ] ] } } }, "height": null, "width": null, "user": { "profile_url": "https://chart-studio.plotly.com/~Esthersun", "avatar_url": "https://storage.googleapis.com/plotly-prod-profiles/29.jpg", "background_url": "https://storage.googleapis.com/plotly-prod-profiles/bg-3.jpg", "bio": "", "nickname": "", "website": "", "stream_tokens": null, "feature_set_id": null, "csrf_token": null, "date_joined": "2024-03-28 08:29:53", "mapbox_access_tokens": null, "has_password": null, "username": "Esthersun", "email": null, "is_active": null, "readonly": null, "is_dash_creator": null, "dash_created_count": null, "is_chart_creator": null, "charts_created_count": null } }, { "creation_time": "2024-03-28T09:36:07.519639Z", "comments": { "results": [], "count": 0 }, "parented": true, "embed_url": "https://chart-studio.plotly.com/~asongupup/126.embed", "fid": "asongupup:126", "filename": "ad1299_10uv", "filetype": "plot", "img_url": "https://api.plotly.com/v2/files/asongupup:126/image?image_name=list-thumb", "image_urls": { "default": "https://api.plotly.com/v2/files/asongupup:126/image?image_name=default", "block-thumb": "https://api.plotly.com/v2/files/asongupup:126/image?image_name=block-thumb", "list-thumb": "https://api.plotly.com/v2/files/asongupup:126/image?image_name=list-thumb" }, "api_urls": { "files": "https://api.plotly.com/v2/files/asongupup:126", "plots": "https://api.plotly.com/v2/plots/asongupup:126", "parent": "https://api.plotly.com/v2/folders/home?user=asongupup" }, "owner": "asongupup", "parent": -1, "preview": "", "referencers": [], "references": [], "title": "Raw eeg", "views": 1, "web_url": "https://chart-studio.plotly.com/~asongupup/126/raw-eeg/", "world_readable": true, "date_modified": "2024-03-28T10:29:32.393Z", "stars": { "results": [], "count": 0 }, "collaborators": { "results": [], "count": 0 }, "subfolder_count": null, "refresh_interval": null, "organize_view_url": "https://chart-studio.plotly.com/~asongupup/126/", "current_user_permission": "read", "is_theme": null, "is_template": null, "autosize": false, "caption": "", "figure": { "data": [ { "line": { "dash": "solid", "color": "rgb(0,113.985,188.955)", "width": 0.5 }, "mode": "lines", "name": "", "type": "scatter", "xsrc": "asongupup:127:0d3ae0", "ysrc": "asongupup:127:844c68", "xaxis": "x1", "yaxis": "y1", "marker": { "line": { "width": 0.5 }, "size": 3.6, "color": "rgb(0,113.985,188.955)" }, "visible": true, "showlegend": false }, { "line": { "dash": "solid", "color": "rgb(0,113.985,188.955)", "width": 0.5 }, "mode": "lines", "name": "", "type": "scatter", "xsrc": "asongupup:127:30bc77", "ysrc": "asongupup:127:5252aa", "xaxis": "x2", "yaxis": "y2", "marker": { "line": { "width": 0.5 }, "size": 3.6, "color": "rgb(0,113.985,188.955)" }, "visible": true, "showlegend": false }, { "line": { "dash": "solid", "color": "rgb(255,0,0)", "width": 0.5 }, "mode": "lines", "name": "", "type": "scatter", "xsrc": "asongupup:127:0d3ae0", "ysrc": "asongupup:127:cbaa39", "xaxis": "x3", "yaxis": "y3", "marker": { "line": { "width": 0.5 }, "size": 3.6, "color": "rgb(255,0,0)" }, "visible": true, "showlegend": false }, { "line": { "dash": "solid", "color": "rgb(255,0,0)", "width": 0.5 }, "mode": "lines", "name": "", "type": "scatter", "xsrc": "asongupup:127:30bc77", "ysrc": "asongupup:127:06f0de", "xaxis": "x4", "yaxis": "y4", "marker": { "line": { "width": 0.5 }, "size": 3.6, "color": "rgb(255,0,0)" }, "visible": true, "showlegend": false } ], "layout": { "title": "Raw eeg", "width": 840, "height": 630, "margin": { "b": 0, "l": 0, "r": 0, "t": 0, "pad": 0 }, "scene1": { "domain": { "x": [ 0.13, 0.464659090909091 ], "y": [ 0.583837209302326, 0.925 ] } }, "scene2": { "domain": { "x": [ 0.13, 0.464659090909091 ], "y": [ 0.11, 0.451162790697674 ] } }, "scene3": { "domain": { "x": [ 0.570340909090909, 0.905 ], "y": [ 0.583837209302326, 0.925 ] } }, "scene4": { "domain": { "x": [ 0.570340909090909, 0.905 ], "y": [ 0.11, 0.451162790697674 ] } }, "xaxis1": { "side": "bottom", "type": "linear", "range": [ 0, 60 ], "ticks": "inside", "title": "Time (s)", "anchor": "y1", "domain": [ 0.13, 0.464659090909091 ], "mirror": "ticks", "ticklen": 2.81113636363636, "showgrid": false, "showline": true, "tickfont": { "size": 9, "color": "rgb(38.250000,38.250000,38.250000)", "family": "Arial, sans-serif" }, "tickmode": "array", "ticktext": [ "0", "20", "40", "60" ], "tickvals": [ 0, 20, 40, 60 ], "zeroline": false, "autorange": false, "gridcolor": "rgba(38.250000,,38.250000,38.250000,0.150000)", "linecolor": "rgb(38.250000,38.250000,38.250000)", "linewidth": 1, "tickangle": 0, "tickcolor": "rgb(38.250000,38.250000,38.250000)", "tickwidth": 1, "titlefont": { "size": 9.9, "color": "rgb(38.250000,38.250000,38.250000)", "family": "Arial, sans-serif" }, "exponentformat": "none", "showticklabels": true }, "xaxis2": { "side": "bottom", "type": "linear", "range": [ 0, 300 ], "ticks": "inside", "title": "Frequency (Hz)", "anchor": "y2", "domain": [ 0.13, 0.464659090909091 ], "mirror": "ticks", "ticklen": 2.81113636363636, "showgrid": false, "showline": true, "tickfont": { "size": 9, "color": "rgb(38.250000,38.250000,38.250000)", "family": "Arial, sans-serif" }, "tickmode": "array", "ticktext": [ "0", "100", "200", "300" ], "tickvals": [ 0, 100, 200, 300 ], "zeroline": false, "autorange": false, "gridcolor": "rgba(38.250000,,38.250000,38.250000,0.150000)", "linecolor": "rgb(38.250000,38.250000,38.250000)", "linewidth": 1, "tickangle": 0, "tickcolor": "rgb(38.250000,38.250000,38.250000)", "tickwidth": 1, "titlefont": { "size": 9.9, "color": "rgb(38.250000,38.250000,38.250000)", "family": "Arial, sans-serif" }, "exponentformat": "none", "showticklabels": true }, "xaxis3": { "side": "bottom", "type": "linear", "range": [ 0, 60 ], "ticks": "inside", "title": "Time (s)", "anchor": "y3", "domain": [ 0.570340909090909, 0.905 ], "mirror": "ticks", "ticklen": 2.81113636363636, "showgrid": false, "showline": true, "tickfont": { "size": 9, "color": "rgb(38.250000,38.250000,38.250000)", "family": "Arial, sans-serif" }, "tickmode": "array", "ticktext": [ "0", "20", "40", "60" ], "tickvals": [ 0, 20, 40, 60 ], "zeroline": false, "autorange": false, "gridcolor": "rgba(38.250000,,38.250000,38.250000,0.150000)", "linecolor": "rgb(38.250000,38.250000,38.250000)", "linewidth": 1, "tickangle": 0, "tickcolor": "rgb(38.250000,38.250000,38.250000)", "tickwidth": 1, "titlefont": { "size": 9.9, "color": "rgb(38.250000,38.250000,38.250000)", "family": "Arial, sans-serif" }, "exponentformat": "none", "showticklabels": true }, "xaxis4": { "side": "bottom", "type": "linear", "range": [ 0, 300 ], "ticks": "inside", "title": "Frequency (Hz)", "anchor": "y4", "domain": [ 0.570340909090909, 0.905 ], "mirror": "ticks", "ticklen": 2.81113636363636, "showgrid": false, "showline": true, "tickfont": { "size": 9, "color": "rgb(38.250000,38.250000,38.250000)", "family": "Arial, sans-serif" }, "tickmode": "array", "ticktext": [ "0", "100", "200", "300" ], "tickvals": [ 0, 100, 200, 300 ], "zeroline": false, "autorange": false, "gridcolor": "rgba(38.250000,,38.250000,38.250000,0.150000)", "linecolor": "rgb(38.250000,38.250000,38.250000)", "linewidth": 1, "tickangle": 0, "tickcolor": "rgb(38.250000,38.250000,38.250000)", "tickwidth": 1, "titlefont": { "size": 9.9, "color": "rgb(38.250000,38.250000,38.250000)", "family": "Arial, sans-serif" }, "exponentformat": "none", "showticklabels": true }, "yaxis1": { "side": "left", "type": "linear", "range": [ -40.2107882750974, -29.1466747697204 ], "ticks": "inside", "title": "uV", "anchor": "x1", "domain": [ 0.583837209302326, 0.925 ], "mirror": "ticks", "ticklen": 2.81113636363636, "showgrid": false, "showline": true, "tickfont": { "size": 9, "color": "rgb(38.250000,38.250000,38.250000)", "family": "Arial, sans-serif" }, "tickmode": "array", "ticktext": [ "-40", "-35", "-30" ], "tickvals": [ -40, -35, -30 ], "zeroline": false, "autorange": false, "gridcolor": "rgba(38.250000,,38.250000,38.250000,0.150000)", "linecolor": "rgb(38.250000,38.250000,38.250000)", "linewidth": 1, "tickangle": 0, "tickcolor": "rgb(38.250000,38.250000,38.250000)", "tickwidth": 1, "titlefont": { "size": 9.9, "color": "rgb(38.250000,38.250000,38.250000)", "family": "Arial, sans-serif" }, "exponentformat": "none", "showticklabels": true }, "yaxis2": { "side": "left", "type": "linear", "range": [ 0, 80 ], "ticks": "inside", "title": "Amplitude", "anchor": "x2", "domain": [ 0.11, 0.451162790697674 ], "mirror": "ticks", "ticklen": 2.81113636363636, "showgrid": false, "showline": true, "tickfont": { "size": 9, "color": "rgb(38.250000,38.250000,38.250000)", "family": "Arial, sans-serif" }, "tickmode": "array", "ticktext": [ "0", "20", "40", "60", "80" ], "tickvals": [ 0, 20, 40, 60, 80 ], "zeroline": false, "autorange": false, "gridcolor": "rgba(38.250000,,38.250000,38.250000,0.150000)", "linecolor": "rgb(38.250000,38.250000,38.250000)", "linewidth": 1, "tickangle": 0, "tickcolor": "rgb(38.250000,38.250000,38.250000)", "tickwidth": 1, "titlefont": { "size": 9.9, "color": "rgb(38.250000,38.250000,38.250000)", "family": "Arial, sans-serif" }, "exponentformat": "none", "showticklabels": true }, "yaxis3": { "side": "left", "type": "linear", "range": [ -40.2495526727218, -29.2958871037707 ], "ticks": "inside", "title": "uV", "anchor": "x3", "domain": [ 0.583837209302326, 0.925 ], "mirror": "ticks", "ticklen": 2.81113636363636, "showgrid": false, "showline": true, "tickfont": { "size": 9, "color": "rgb(38.250000,38.250000,38.250000)", "family": "Arial, sans-serif" }, "tickmode": "array", "ticktext": [ "-40", "-35", "-30" ], "tickvals": [ -40, -35, -30 ], "zeroline": false, "autorange": false, "gridcolor": "rgba(38.250000,,38.250000,38.250000,0.150000)", "linecolor": "rgb(38.250000,38.250000,38.250000)", "linewidth": 1, "tickangle": 0, "tickcolor": "rgb(38.250000,38.250000,38.250000)", "tickwidth": 1, "titlefont": { "size": 9.9, "color": "rgb(38.250000,38.250000,38.250000)", "family": "Arial, sans-serif" }, "exponentformat": "none", "showticklabels": true }, "yaxis4": { "side": "left", "type": "linear", "range": [ 0, 80 ], "ticks": "inside", "title": "Amplitude", "anchor": "x4", "domain": [ 0.11, 0.451162790697674 ], "mirror": "ticks", "ticklen": 2.81113636363636, "showgrid": false, "showline": true, "tickfont": { "size": 9, "color": "rgb(38.250000,38.250000,38.250000)", "family": "Arial, sans-serif" }, "tickmode": "array", "ticktext": [ "0", "20", "40", "60", "80" ], "tickvals": [ 0, 20, 40, 60, 80 ], "zeroline": false, "autorange": false, "gridcolor": "rgba(38.250000,,38.250000,38.250000,0.150000)", "linecolor": "rgb(38.250000,38.250000,38.250000)", "linewidth": 1, "tickangle": 0, "tickcolor": "rgb(38.250000,38.250000,38.250000)", "tickwidth": 1, "titlefont": { "size": 9.9, "color": "rgb(38.250000,38.250000,38.250000)", "family": "Arial, sans-serif" }, "exponentformat": "none", "showticklabels": true }, "autosize": false, "hovermode": "closest", "titlefont": { "color": "rgba(0,0,0,0)" }, "showlegend": false, "annotations": [ { "x": 0.297329545454545, "y": 0.935, "font": { "size": 9.9, "color": "rgb(0,0,0)", "family": "Arial, sans-serif" }, "text": "Raw eeg", "xref": "paper", "yref": "paper", "align": "center", "xanchor": "center", "yanchor": "bottom", "borderpad": 3, "showarrow": false, "textangle": 0, "bordercolor": "rgba(0,0,0,0)", "borderwidth": 0.5 }, { "x": 0.297329545454545, "y": 0.461162790697674, "font": { "size": 9.9, "color": "rgb(0,0,0)", "family": "Arial, sans-serif" }, "text": "Raw FFT", "xref": "paper", "yref": "paper", "align": "center", "xanchor": "center", "yanchor": "bottom", "borderpad": 3, "showarrow": false, "textangle": 0, "bordercolor": "rgba(0,0,0,0)", "borderwidth": 0.5 }, { "x": 0.737670454545455, "y": 0.935, "font": { "size": 9.9, "color": "rgb(0,0,0)", "family": "Arial, sans-serif" }, "text": "Filtered eeg", "xref": "paper", "yref": "paper", "align": "center", "xanchor": "center", "yanchor": "bottom", "borderpad": 3, "showarrow": false, "textangle": 0, "bordercolor": "rgba(0,0,0,0)", "borderwidth": 0.5 }, { "x": 0.737670454545455, "y": 0.461162790697674, "font": { "size": 9.9, "color": "rgb(0,0,0)", "family": "Arial, sans-serif" }, "text": "Filtered eeg", "xref": "paper", "yref": "paper", "align": "center", "xanchor": "center", "yanchor": "bottom", "borderpad": 3, "showarrow": false, "textangle": 0, "bordercolor": "rgba(0,0,0,0)", "borderwidth": 0.5 } ], "paper_bgcolor": "rgb(255,255,255)" } }, "height": 630, "width": 840, "user": { "profile_url": "https://chart-studio.plotly.com/~asongupup", "avatar_url": "https://storage.googleapis.com/plotly-prod-profiles/6.jpg", "background_url": "https://storage.googleapis.com/plotly-prod-profiles/bg-5.jpg", "bio": "", "nickname": "", "website": "", "stream_tokens": null, "feature_set_id": null, "csrf_token": null, "date_joined": "2024-02-27 02:46:05", "mapbox_access_tokens": null, "has_password": null, "username": "asongupup", "email": null, "is_active": null, "readonly": null, "is_dash_creator": null, "dash_created_count": null, "is_chart_creator": null, "charts_created_count": null } }, { "creation_time": "2024-03-28T09:33:17.938728Z", "comments": { "results": [], "count": 0 }, "parented": true, "embed_url": "https://chart-studio.plotly.com/~asongupup/124.embed", "fid": "asongupup:124", "filename": "ad1299_1mV", "filetype": "plot", "img_url": "https://storage.googleapis.com/plotly-prod-images/asongupup/124/9_UWIV79THCME5PZM6F191JDU4QUNVU4.png", "image_urls": { "default": "https://storage.googleapis.com/plotly-prod-images/asongupup/124/2_GO62D38XLUGEHIR1LW0R0M3PTSH5O5.png", "block-thumb": "https://storage.googleapis.com/plotly-prod-images/asongupup/124/8_N73FLVZ1T57819FWTXNHUIDR71JR3O.png", "list-thumb": "https://storage.googleapis.com/plotly-prod-images/asongupup/124/9_UWIV79THCME5PZM6F191JDU4QUNVU4.png" }, "api_urls": { "files": "https://api.plotly.com/v2/files/asongupup:124", "plots": "https://api.plotly.com/v2/plots/asongupup:124", "parent": "https://api.plotly.com/v2/folders/home?user=asongupup" }, "owner": "asongupup", "parent": -1, "preview": "", "referencers": [], "references": [], "title": "<b></b>", "views": 2, "web_url": "https://chart-studio.plotly.com/~asongupup/124/", "world_readable": true, "date_modified": "2024-03-28T09:34:36.406Z", "stars": { "results": [], "count": 0 }, "collaborators": { "results": [], "count": 0 }, "subfolder_count": null, "refresh_interval": null, "organize_view_url": "https://chart-studio.plotly.com/~asongupup/124/", "current_user_permission": "read", "is_theme": null, "is_template": null, "autosize": false, "caption": "", "figure": { "data": [ { "line": { "dash": "solid", "color": "rgb(0,113.985,188.955)", "width": 0.5 }, "mode": "lines", "name": "", "type": "scatter", "xsrc": "asongupup:125:1c0dea", "ysrc": "asongupup:125:6fc79c", "xaxis": "x1", "yaxis": "y1", "marker": { "line": { "width": 0.5 }, "size": 3.6, "color": "rgb(0,113.985,188.955)" }, "visible": true, "showlegend": false }, { "line": { "dash": "solid", "color": "rgb(0,113.985,188.955)", "width": 0.5 }, "mode": "lines", "name": "", "type": "scatter", "xsrc": "asongupup:125:b049c1", "ysrc": "asongupup:125:f07207", "xaxis": "x2", "yaxis": "y2", "marker": { "line": { "width": 0.5 }, "size": 3.6, "color": "rgb(0,113.985,188.955)" }, "visible": true, "showlegend": false } ], "layout": { "title": "<b></b>", "width": 840, "height": 630, "margin": { "b": 0, "l": 0, "r": 0, "t": 0, "pad": 0 }, "scene1": { "domain": { "x": [ 0.13, 0.905 ], "y": [ 0.583837209302326, 0.925 ] } }, "scene2": { "domain": { "x": [ 0.13, 0.905 ], "y": [ 0.11, 0.451162790697674 ] } }, "xaxis1": { "side": "bottom", "type": "linear", "range": [ 0, 35 ], "ticks": "inside", "title": "Time (s)", "anchor": "y1", "domain": [ 0.13, 0.905 ], "mirror": "ticks", "ticklen": 6.51, "showgrid": false, "showline": true, "tickfont": { "size": 9, "color": "rgb(38.250000,38.250000,38.250000)", "family": "Arial, sans-serif" }, "tickmode": "array", "ticktext": [ "0", "5", "10", "15", "20", "25", "30", "35" ], "tickvals": [ 0, 5, 10, 15, 20, 25, 30, 35 ], "zeroline": false, "autorange": false, "gridcolor": "rgba(38.250000,,38.250000,38.250000,0.150000)", "linecolor": "rgb(38.250000,38.250000,38.250000)", "linewidth": 1, "tickangle": 0, "tickcolor": "rgb(38.250000,38.250000,38.250000)", "tickwidth": 1, "titlefont": { "size": 9.9, "color": "rgb(38.250000,38.250000,38.250000)", "family": "Arial, sans-serif" }, "exponentformat": "none", "showticklabels": true }, "xaxis2": { "side": "bottom", "type": "linear", "range": [ 0, 250 ], "ticks": "inside", "title": "Frequency (Hz)", "anchor": "y2", "domain": [ 0.13, 0.905 ], "mirror": "ticks", "ticklen": 6.51, "showgrid": false, "showline": true, "tickfont": { "size": 9, "color": "rgb(38.250000,38.250000,38.250000)", "family": "Arial, sans-serif" }, "tickmode": "array", "ticktext": [ "0", "50", "100", "150", "200", "250" ], "tickvals": [ 0, 50, 100, 150, 200, 250 ], "zeroline": false, "autorange": false, "gridcolor": "rgba(38.250000,,38.250000,38.250000,0.150000)", "linecolor": "rgb(38.250000,38.250000,38.250000)", "linewidth": 1, "tickangle": 0, "tickcolor": "rgb(38.250000,38.250000,38.250000)", "tickwidth": 1, "titlefont": { "size": 9.9, "color": "rgb(38.250000,38.250000,38.250000)", "family": "Arial, sans-serif" }, "exponentformat": "none", "showticklabels": true }, "yaxis1": { "side": "left", "type": "linear", "range": [ -503.428340366881, 500 ], "ticks": "inside", "title": "uV", "anchor": "x1", "domain": [ 0.583837209302326, 0.925 ], "mirror": "ticks", "ticklen": 6.51, "showgrid": false, "showline": true, "tickfont": { "size": 9, "color": "rgb(38.250000,38.250000,38.250000)", "family": "Arial, sans-serif" }, "tickmode": "array", "ticktext": [ "-500", "0", "500" ], "tickvals": [ -500, 0, 500 ], "zeroline": false, "autorange": false, "gridcolor": "rgba(38.250000,,38.250000,38.250000,0.150000)", "linecolor": "rgb(38.250000,38.250000,38.250000)", "linewidth": 1, "tickangle": 0, "tickcolor": "rgb(38.250000,38.250000,38.250000)", "tickwidth": 1, "titlefont": { "size": 9.9, "color": "rgb(38.250000,38.250000,38.250000)", "family": "Arial, sans-serif" }, "exponentformat": "none", "showticklabels": true }, "yaxis2": { "side": "left", "type": "linear", "range": [ 0, 458.830624771728 ], "ticks": "inside", "title": "Amplitude", "anchor": "x2", "domain": [ 0.11, 0.451162790697674 ], "mirror": "ticks", "ticklen": 6.51, "showgrid": false, "showline": true, "tickfont": { "size": 9, "color": "rgb(38.250000,38.250000,38.250000)", "family": "Arial, sans-serif" }, "tickmode": "array", "ticktext": [ "0", "100", "200", "300", "400" ], "tickvals": [ 0, 100, 200, 300, 400 ], "zeroline": false, "autorange": false, "gridcolor": "rgba(38.250000,,38.250000,38.250000,0.150000)", "linecolor": "rgb(38.250000,38.250000,38.250000)", "linewidth": 1, "tickangle": 0, "tickcolor": "rgb(38.250000,38.250000,38.250000)", "tickwidth": 1, "titlefont": { "size": 9.9, "color": "rgb(38.250000,38.250000,38.250000)", "family": "Arial, sans-serif" }, "exponentformat": "none", "showticklabels": true }, "autosize": false, "hovermode": "closest", "titlefont": { "color": "rgba(0,0,0,0)" }, "showlegend": false, "annotations": [ { "x": 0.5175, "y": 0.935, "font": { "size": 9.9, "color": "rgb(0,0,0)", "family": "Arial, sans-serif" }, "text": "<b></b>", "xref": "paper", "yref": "paper", "align": "center", "xanchor": "center", "yanchor": "bottom", "borderpad": 3, "showarrow": false, "textangle": 0, "bordercolor": "rgba(0,0,0,0)", "borderwidth": 0.5 }, { "x": 0.5175, "y": 0.461162790697674, "font": { "size": 9.9, "color": "rgb(0,0,0)", "family": "Arial, sans-serif" }, "text": "<b></b>", "xref": "paper", "yref": "paper", "align": "center", "xanchor": "center", "yanchor": "bottom", "borderpad": 3, "showarrow": false, "textangle": 0, "bordercolor": "rgba(0,0,0,0)", "borderwidth": 0.5 } ], "paper_bgcolor": "rgb(255,255,255)" } }, "height": 630, "width": 840, "user": { "profile_url": "https://chart-studio.plotly.com/~asongupup", "avatar_url": "https://storage.googleapis.com/plotly-prod-profiles/6.jpg", "background_url": "https://storage.googleapis.com/plotly-prod-profiles/bg-5.jpg", "bio": "", "nickname": "", "website": "", "stream_tokens": null, "feature_set_id": null, "csrf_token": null, "date_joined": "2024-02-27 02:46:05", "mapbox_access_tokens": null, "has_password": null, "username": "asongupup", "email": null, "is_active": null, "readonly": null, "is_dash_creator": null, "dash_created_count": null, "is_chart_creator": null, "charts_created_count": null } }, { "creation_time": "2024-03-28T09:32:20.845417Z", "comments": { "results": [], "count": 0 }, "parented": true, "embed_url": "https://chart-studio.plotly.com/~asongupup/122.embed", "fid": "asongupup:122", "filename": "untitled", "filetype": "plot", "img_url": "https://storage.googleapis.com/plotly-prod-images/asongupup/122/9_U772LNV82KJXIITHZAN1CCOPJCIWCV.png", "image_urls": { "default": "https://storage.googleapis.com/plotly-prod-images/asongupup/122/2_S1J61U31J187S185OVR92RLK6BQ7PM.png", "block-thumb": "https://storage.googleapis.com/plotly-prod-images/asongupup/122/8_ZC655O30XLOI8GN3PEFCAAGP9B8CEI.png", "list-thumb": "https://storage.googleapis.com/plotly-prod-images/asongupup/122/9_U772LNV82KJXIITHZAN1CCOPJCIWCV.png" }, "api_urls": { "files": "https://api.plotly.com/v2/files/asongupup:122", "plots": "https://api.plotly.com/v2/plots/asongupup:122", "parent": "https://api.plotly.com/v2/folders/home?user=asongupup" }, "owner": "asongupup", "parent": -1, "preview": "", "referencers": [], "references": [], "title": "<b></b>", "views": 1, "web_url": "https://chart-studio.plotly.com/~asongupup/122/", "world_readable": true, "date_modified": "2024-03-28T09:32:21.523Z", "stars": { "results": [], "count": 0 }, "collaborators": { "results": [], "count": 0 }, "subfolder_count": null, "refresh_interval": null, "organize_view_url": "https://chart-studio.plotly.com/~asongupup/122/", "current_user_permission": "read", "is_theme": null, "is_template": null, "autosize": false, "caption": "", "figure": { "data": [ { "line": { "dash": "solid", "color": "rgb(0,113.985,188.955)", "width": 0.5 }, "mode": "lines", "name": "", "type": "scatter", "xsrc": "asongupup:123:9c12d4", "ysrc": "asongupup:123:d9c2ca", "xaxis": "x1", "yaxis": "y1", "marker": { "line": { "width": 0.5 }, "size": 3.6, "color": "rgb(0,113.985,188.955)" }, "visible": true, "showlegend": false }, { "line": { "dash": "solid", "color": "rgb(0,113.985,188.955)", "width": 0.5 }, "mode": "lines", "name": "", "type": "scatter", "xsrc": "asongupup:123:81bd6e", "ysrc": "asongupup:123:36612c", "xaxis": "x2", "yaxis": "y2", "marker": { "line": { "width": 0.5 }, "size": 3.6, "color": "rgb(0,113.985,188.955)" }, "visible": true, "showlegend": false } ], "layout": { "title": "<b></b>", "width": 840, "height": 630, "margin": { "b": 0, "l": 0, "r": 0, "t": 0, "pad": 0 }, "scene1": { "domain": { "x": [ 0.13, 0.905 ], "y": [ 0.583837209302326, 0.925 ] } }, "scene2": { "domain": { "x": [ 0.13, 0.905 ], "y": [ 0.11, 0.451162790697674 ] } }, "xaxis1": { "side": "bottom", "type": "linear", "range": [ 0, 60 ], "ticks": "inside", "title": "Time (s)", "anchor": "y1", "domain": [ 0.13, 0.905 ], "mirror": "ticks", "ticklen": 6.51, "showgrid": false, "showline": true, "tickfont": { "size": 9, "color": "rgb(38.250000,38.250000,38.250000)", "family": "Arial, sans-serif" }, "tickmode": "array", "ticktext": [ "0", "10", "20", "30", "40", "50", "60" ], "tickvals": [ 0, 10, 20, 30, 40, 50, 60 ], "zeroline": false, "autorange": false, "gridcolor": "rgba(38.250000,,38.250000,38.250000,0.150000)", "linecolor": "rgb(38.250000,38.250000,38.250000)", "linewidth": 1, "tickangle": 0, "tickcolor": "rgb(38.250000,38.250000,38.250000)", "tickwidth": 1, "titlefont": { "size": 9.9, "color": "rgb(38.250000,38.250000,38.250000)", "family": "Arial, sans-serif" }, "exponentformat": "none", "showticklabels": true }, "xaxis2": { "side": "bottom", "type": "linear", "range": [ 0, 250 ], "ticks": "inside", "title": "Frequency (Hz)", "anchor": "y2", "domain": [ 0.13, 0.905 ], "mirror": "ticks", "ticklen": 6.51, "showgrid": false, "showline": true, "tickfont": { "size": 9, "color": "rgb(38.250000,38.250000,38.250000)", "family": "Arial, sans-serif" }, "tickmode": "array", "ticktext": [ "0", "50", "100", "150", "200", "250" ], "tickvals": [ 0, 50, 100, 150, 200, 250 ], "zeroline": false, "autorange": false, "gridcolor": "rgba(38.250000,,38.250000,38.250000,0.150000)", "linecolor": "rgb(38.250000,38.250000,38.250000)", "linewidth": 1, "tickangle": 0, "tickcolor": "rgb(38.250000,38.250000,38.250000)", "tickwidth": 1, "titlefont": { "size": 9.9, "color": "rgb(38.250000,38.250000,38.250000)", "family": "Arial, sans-serif" }, "exponentformat": "none", "showticklabels": true }, "yaxis1": { "side": "left", "type": "linear", "range": [ -40.2107882750974, -29.1466747697204 ], "ticks": "inside", "title": "uV", "anchor": "x1", "domain": [ 0.583837209302326, 0.925 ], "mirror": "ticks", "ticklen": 6.51, "showgrid": false, "showline": true, "tickfont": { "size": 9, "color": "rgb(38.250000,38.250000,38.250000)", "family": "Arial, sans-serif" }, "tickmode": "array", "ticktext": [ "-40", "-35", "-30" ], "tickvals": [ -40, -35, -30 ], "zeroline": false, "autorange": false, "gridcolor": "rgba(38.250000,,38.250000,38.250000,0.150000)", "linecolor": "rgb(38.250000,38.250000,38.250000)", "linewidth": 1, "tickangle": 0, "tickcolor": "rgb(38.250000,38.250000,38.250000)", "tickwidth": 1, "titlefont": { "size": 9.9, "color": "rgb(38.250000,38.250000,38.250000)", "family": "Arial, sans-serif" }, "exponentformat": "none", "showticklabels": true }, "yaxis2": { "side": "left", "type": "linear", "range": [ 0, 80 ], "ticks": "inside", "title": "Amplitude", "anchor": "x2", "domain": [ 0.11, 0.451162790697674 ], "mirror": "ticks", "ticklen": 6.51, "showgrid": false, "showline": true, "tickfont": { "size": 9, "color": "rgb(38.250000,38.250000,38.250000)", "family": "Arial, sans-serif" }, "tickmode": "array", "ticktext": [ "0", "20", "40", "60", "80" ], "tickvals": [ 0, 20, 40, 60, 80 ], "zeroline": false, "autorange": false, "gridcolor": "rgba(38.250000,,38.250000,38.250000,0.150000)", "linecolor": "rgb(38.250000,38.250000,38.250000)", "linewidth": 1, "tickangle": 0, "tickcolor": "rgb(38.250000,38.250000,38.250000)", "tickwidth": 1, "titlefont": { "size": 9.9, "color": "rgb(38.250000,38.250000,38.250000)", "family": "Arial, sans-serif" }, "exponentformat": "none", "showticklabels": true }, "autosize": false, "hovermode": "closest", "titlefont": { "color": "rgba(0,0,0,0)" }, "showlegend": false, "annotations": [ { "x": 0.5175, "y": 0.935, "font": { "size": 9.9, "color": "rgb(0,0,0)", "family": "Arial, sans-serif" }, "text": "<b></b>", "xref": "paper", "yref": "paper", "align": "center", "xanchor": "center", "yanchor": "bottom", "borderpad": 3, "showarrow": false, "textangle": 0, "bordercolor": "rgba(0,0,0,0)", "borderwidth": 0.5 }, { "x": 0.5175, "y": 0.461162790697674, "font": { "size": 9.9, "color": "rgb(0,0,0)", "family": "Arial, sans-serif" }, "text": "<b></b>", "xref": "paper", "yref": "paper", "align": "center", "xanchor": "center", "yanchor": "bottom", "borderpad": 3, "showarrow": false, "textangle": 0, "bordercolor": "rgba(0,0,0,0)", "borderwidth": 0.5 } ], "paper_bgcolor": "rgb(255,255,255)" } }, "height": 630, "width": 840, "user": { "profile_url": "https://chart-studio.plotly.com/~asongupup", "avatar_url": "https://storage.googleapis.com/plotly-prod-profiles/6.jpg", "background_url": "https://storage.googleapis.com/plotly-prod-profiles/bg-5.jpg", "bio": "", "nickname": "", "website": "", "stream_tokens": null, "feature_set_id": null, "csrf_token": null, "date_joined": "2024-02-27 02:46:05", "mapbox_access_tokens": null, "has_password": null, "username": "asongupup", "email": null, "is_active": null, "readonly": null, "is_dash_creator": null, "dash_created_count": null, "is_chart_creator": null, "charts_created_count": null } }, { "creation_time": "2024-03-28T09:28:55.983003Z", "comments": { "results": [], "count": 0 }, "parented": true, "embed_url": "https://chart-studio.plotly.com/~YongfeiYan/8.embed", "fid": "YongfeiYan:8", "filename": "Plotly Playground 2024-03-28 17:28:50", "filetype": "plot", "img_url": "https://storage.googleapis.com/plotly-prod-images/YongfeiYan/8/9_LY8HR3FAAP8OKB5NV4HVZS495RHZL9.png", "image_urls": { "default": "https://storage.googleapis.com/plotly-prod-images/YongfeiYan/8/2_B0G00HAGGAL3FW2Y8H4CHADIG16TUT.png", "block-thumb": "https://storage.googleapis.com/plotly-prod-images/YongfeiYan/8/8_KD65C3XQ12WGRK74IPBCNFCHPFAZBH.png", "list-thumb": "https://storage.googleapis.com/plotly-prod-images/YongfeiYan/8/9_LY8HR3FAAP8OKB5NV4HVZS495RHZL9.png" }, "api_urls": { "files": "https://api.plotly.com/v2/files/YongfeiYan:8", "plots": "https://api.plotly.com/v2/plots/YongfeiYan:8", "parent": "https://api.plotly.com/v2/folders/home?user=YongfeiYan" }, "owner": "YongfeiYan", "parent": -1, "preview": "", "referencers": [], "references": [], "title": "", "views": 1, "web_url": "https://chart-studio.plotly.com/~YongfeiYan/8/", "world_readable": true, "date_modified": "2024-03-28T09:28:55.991Z", "stars": { "results": [], "count": 0 }, "collaborators": { "results": [], "count": 0 }, "subfolder_count": null, "refresh_interval": null, "organize_view_url": "https://chart-studio.plotly.com/~YongfeiYan/8/", "current_user_permission": "read", "is_theme": null, "is_template": null, "autosize": true, "caption": "", "figure": { "data": [ { "line": { "dash": "solid", "color": "rgba(0, 128, 0, 1.0)", "shape": "linear", "width": 2 }, "mode": "lines", "name": " SMA([10, 20])", "text": "", "type": "scatter", "xsrc": "YongfeiYan:7:6a626b", "ysrc": "YongfeiYan:7:116e71", "yaxis": "y2", "showlegend": true, "legendgroup": " SMA([10, 20])" }, { "line": { "dash": "solid", "color": "rgba(144, 238, 144, 1.0)", "shape": "linear", "width": 2 }, "mode": "lines", "name": " SMA(20)", "text": "", "type": "scatter", "xsrc": "YongfeiYan:7:ecfe65", "ysrc": "YongfeiYan:7:331eaa", "yaxis": "y2", "showlegend": false, "legendgroup": " SMA([10, 20])" }, { "line": { "dash": "solid", "color": "rgba(23, 190, 207, 1.0)", "shape": "linear", "width": 1.3 }, "mode": "lines", "name": "RSI(close,20)", "text": "", "type": "scatter", "xsrc": "YongfeiYan:7:01e16d", "ysrc": "YongfeiYan:7:b0d052", "yaxis": "y3", "showlegend": true, "legendgroup": "RSI(close,20)" }, { "line": { "color": "grey", "width": 1 }, "mode": "lines", "name": "", "text": "", "type": "scatter", "xsrc": "YongfeiYan:7:0c4a46", "ysrc": "YongfeiYan:7:4b6708", "yaxis": "y3", "showlegend": true, "legendgroup": "RSI(close,20)" }, { "line": { "color": "#17BECF", "width": 1 }, "mode": "lines", "name": "", "text": "", "type": "scatter", "xsrc": "YongfeiYan:7:c213a9", "ysrc": "YongfeiYan:7:dab354", "yaxis": "y3", "showlegend": true, "legendgroup": "RSI(close,20)" }, { "line": { "dash": "solid", "color": "rgba(255, 0, 255, 1.0)", "shape": "linear", "width": 1.3 }, "mode": "lines", "name": "BOLL(close,20)", "text": "", "type": "scatter", "xsrc": "YongfeiYan:7:0f3b84", "ysrc": "YongfeiYan:7:810448", "yaxis": "y2", "showlegend": true, "legendgroup": "BOLL(close,20)" }, { "line": { "dash": "solid", "color": "rgba(128, 128, 128, 1.0)", "shape": "linear", "width": 1.3 }, "mode": "lines", "name": "UPPER(close,20)", "text": "", "type": "scatter", "xsrc": "YongfeiYan:7:3cc200", "ysrc": "YongfeiYan:7:80a048", "yaxis": "y2", "showlegend": false, "legendgroup": "BOLL(close,20)" }, { "fill": "tonexty", "line": { "dash": "solid", "color": "rgba(128, 128, 128, 0.8999999999999999)", "shape": "linear", "width": 1.3 }, "mode": "lines", "name": "LOWER(close,20)", "text": "", "type": "scatter", "xsrc": "YongfeiYan:7:1e6b5f", "ysrc": "YongfeiYan:7:51798f", "yaxis": "y2", "fillcolor": "rgba(128, 128, 128, 0.1)", "showlegend": false, "legendgroup": "BOLL(close,20)" }, { "name": "volume", "text": "", "type": "bar", "xsrc": "YongfeiYan:7:b5af1f", "ysrc": "YongfeiYan:7:901f4e", "yaxis": "y4", "marker": { "line": { "width": 1, "colorsrc": "YongfeiYan:7:97ab45" }, "colorsrc": "YongfeiYan:7:116fe9" }, "opacity": 0.8, "orientation": "v" }, { "line": { "dash": "solid", "color": "rgba(55, 128, 191, 1.0)", "shape": "linear", "width": 1.3 }, "mode": "lines", "name": " MACD([12,26])", "text": "", "type": "scatter", "xsrc": "YongfeiYan:7:88c0f6", "ysrc": "YongfeiYan:7:bc7506", "yaxis": "y5" }, { "line": { "dash": "solid", "color": "rgba(219, 64, 82, 1.0)", "shape": "linear", "width": 1.3 }, "mode": "lines", "name": "MACD SIGNAL(9)", "text": "", "type": "scatter", "xsrc": "YongfeiYan:7:d919aa", "ysrc": "YongfeiYan:7:dcd79f", "yaxis": "y5" }, { "name": "GS", "type": "candlestick", "xsrc": "YongfeiYan:7:63055d", "yaxis": "y2", "lowsrc": "YongfeiYan:7:67b7de", "highsrc": "YongfeiYan:7:7e99e6", "opensrc": "YongfeiYan:7:50278f", "closesrc": "YongfeiYan:7:84414b", "decreasing": { "line": { "color": "#808080" } }, "increasing": { "line": { "color": "#17BECF" } }, "showlegend": true } ], "layout": { "title": { "font": { "color": "#4D5663" }, "text": "First Quant Figure" }, "xaxis": { "title": { "font": { "color": "#4D5663" }, "text": "" }, "anchor": "y2", "showgrid": true, "tickfont": { "color": "#4D5663" }, "gridcolor": "#E1E5ED", "rangeslider": { "visible": false }, "rangeselector": { "x": 0, "y": 0.9, "font": { "size": 13 }, "bgcolor": "rgba(150, 200, 250, 1)", "buttons": [ { "step": "month", "count": 1, "label": "1m", "stepmode": "backward" }, { "step": "year", "count": 1, "label": "1y", "stepmode": "backward" } ], "visible": false }, "zerolinecolor": "#E1E5ED" }, "yaxis": { "title": { "font": { "color": "#4D5663" }, "text": "" }, "showgrid": true, "tickfont": { "color": "#4D5663" }, "gridcolor": "#E1E5ED", "zerolinecolor": "#E1E5ED", "showticklabels": false }, "legend": { "x": 0.3, "y": 0.95, "font": { "color": "#4D5663" }, "bgcolor": "#F5F6F9", "yanchor": "bottom", "orientation": "h" }, "margin": { "b": 30, "l": 30, "r": 30, "t": 30 }, "yaxis2": { "title": { "font": { "color": "#4D5663" }, "text": "" }, "domain": [ 0.69, 0.9 ], "showgrid": true, "tickfont": { "color": "#4D5663" }, "gridcolor": "#E1E5ED", "zerolinecolor": "#E1E5ED" }, "yaxis3": { "title": { "font": { "color": "#4D5663" }, "text": "" }, "domain": [ 0.46, 0.61 ], "showgrid": true, "tickfont": { "color": "#4D5663" }, "gridcolor": "#E1E5ED", "zerolinecolor": "#E1E5ED" }, "yaxis4": { "title": { "font": { "color": "#4D5663" }, "text": "" }, "domain": [ 0.23, 0.38 ], "showgrid": true, "tickfont": { "color": "#4D5663" }, "gridcolor": "#E1E5ED", "zerolinecolor": "#E1E5ED" }, "yaxis5": { "title": { "font": { "color": "#4D5663" }, "text": "" }, "domain": [ 0.0, 0.15 ], "showgrid": true, "tickfont": { "color": "#4D5663" }, "gridcolor": "#E1E5ED", "zerolinecolor": "#E1E5ED" }, "template": { "data": { "bar": [ { "type": "bar", "marker": { "line": { "color": "#E5ECF6", "width": 0.5 }, "pattern": { "size": 10, "fillmode": "overlay", "solidity": 0.2 } }, "error_x": { "color": "#2a3f5f" }, "error_y": { "color": "#2a3f5f" } } ], "pie": [ { "type": "pie", "automargin": true } ], "table": [ { "type": "table", "cells": { "fill": { "color": "#EBF0F8" }, "line": { "color": "white" } }, "header": { "fill": { "color": "#C8D4E3" }, "line": { "color": "white" } } } ], "carpet": [ { "type": "carpet", "aaxis": { "gridcolor": "white", "linecolor": "white", "endlinecolor": "#2a3f5f", "minorgridcolor": "white", "startlinecolor": "#2a3f5f" }, "baxis": { "gridcolor": "white", "linecolor": "white", "endlinecolor": "#2a3f5f", "minorgridcolor": "white", "startlinecolor": "#2a3f5f" } } ], "mesh3d": [ { "type": "mesh3d", "colorbar": { "ticks": "", "outlinewidth": 0 } } ], "contour": [ { "type": "contour", "colorbar": { "ticks": "", "outlinewidth": 0 }, "colorscale": [ [ 0.0, "#0d0887" ], [ 0.1111111111111111, "#46039f" ], [ 0.2222222222222222, "#7201a8" ], [ 0.3333333333333333, "#9c179e" ], [ 0.4444444444444444, "#bd3786" ], [ 0.5555555555555556, "#d8576b" ], [ 0.6666666666666666, "#ed7953" ], [ 0.7777777777777778, "#fb9f3a" ], [ 0.8888888888888888, "#fdca26" ], [ 1.0, "#f0f921" ] ] } ], "heatmap": [ { "type": "heatmap", "colorbar": { "ticks": "", "outlinewidth": 0 }, "colorscale": [ [ 0.0, "#0d0887" ], [ 0.1111111111111111, "#46039f" ], [ 0.2222222222222222, "#7201a8" ], [ 0.3333333333333333, "#9c179e" ], [ 0.4444444444444444, "#bd3786" ], [ 0.5555555555555556, "#d8576b" ], [ 0.6666666666666666, "#ed7953" ], [ 0.7777777777777778, "#fb9f3a" ], [ 0.8888888888888888, "#fdca26" ], [ 1.0, "#f0f921" ] ] } ], "scatter": [ { "type": "scatter", "fillpattern": { "size": 10, "fillmode": "overlay", "solidity": 0.2 } } ], "surface": [ { "type": "surface", "colorbar": { "ticks": "", "outlinewidth": 0 }, "colorscale": [ [ 0.0, "#0d0887" ], [ 0.1111111111111111, "#46039f" ], [ 0.2222222222222222, "#7201a8" ], [ 0.3333333333333333, "#9c179e" ], [ 0.4444444444444444, "#bd3786" ], [ 0.5555555555555556, "#d8576b" ], [ 0.6666666666666666, "#ed7953" ], [ 0.7777777777777778, "#fb9f3a" ], [ 0.8888888888888888, "#fdca26" ], [ 1.0, "#f0f921" ] ] } ], "barpolar": [ { "type": "barpolar", "marker": { "line": { "color": "#E5ECF6", "width": 0.5 }, "pattern": { "size": 10, "fillmode": "overlay", "solidity": 0.2 } } } ], "heatmapgl": [ { "type": "heatmapgl", "colorbar": { "ticks": "", "outlinewidth": 0 }, "colorscale": [ [ 0.0, "#0d0887" ], [ 0.1111111111111111, "#46039f" ], [ 0.2222222222222222, "#7201a8" ], [ 0.3333333333333333, "#9c179e" ], [ 0.4444444444444444, "#bd3786" ], [ 0.5555555555555556, "#d8576b" ], [ 0.6666666666666666, "#ed7953" ], [ 0.7777777777777778, "#fb9f3a" ], [ 0.8888888888888888, "#fdca26" ], [ 1.0, "#f0f921" ] ] } ], "histogram": [ { "type": "histogram", "marker": { "pattern": { "size": 10, "fillmode": "overlay", "solidity": 0.2 } } } ], "parcoords": [ { "line": { "colorbar": { "ticks": "", "outlinewidth": 0 } }, "type": "parcoords" } ], "scatter3d": [ { "line": { "colorbar": { "ticks": "", "outlinewidth": 0 } }, "type": "scatter3d", "marker": { "colorbar": { "ticks": "", "outlinewidth": 0 } } } ], "scattergl": [ { "type": "scattergl", "marker": { "colorbar": { "ticks": "", "outlinewidth": 0 } } } ], "choropleth": [ { "type": "choropleth", "colorbar": { "ticks": "", "outlinewidth": 0 } } ], "scattergeo": [ { "type": "scattergeo", "marker": { "colorbar": { "ticks": "", "outlinewidth": 0 } } } ], "histogram2d": [ { "type": "histogram2d", "colorbar": { "ticks": "", "outlinewidth": 0 }, "colorscale": [ [ 0.0, "#0d0887" ], [ 0.1111111111111111, "#46039f" ], [ 0.2222222222222222, "#7201a8" ], [ 0.3333333333333333, "#9c179e" ], [ 0.4444444444444444, "#bd3786" ], [ 0.5555555555555556, "#d8576b" ], [ 0.6666666666666666, "#ed7953" ], [ 0.7777777777777778, "#fb9f3a" ], [ 0.8888888888888888, "#fdca26" ], [ 1.0, "#f0f921" ] ] } ], "scatterpolar": [ { "type": "scatterpolar", "marker": { "colorbar": { "ticks": "", "outlinewidth": 0 } } } ], "contourcarpet": [ { "type": "contourcarpet", "colorbar": { "ticks": "", "outlinewidth": 0 } } ], "scattercarpet": [ { "type": "scattercarpet", "marker": { "colorbar": { "ticks": "", "outlinewidth": 0 } } } ], "scattermapbox": [ { "type": "scattermapbox", "marker": { "colorbar": { "ticks": "", "outlinewidth": 0 } } } ], "scatterpolargl": [ { "type": "scatterpolargl", "marker": { "colorbar": { "ticks": "", "outlinewidth": 0 } } } ], "scatterternary": [ { "type": "scatterternary", "marker": { "colorbar": { "ticks": "", "outlinewidth": 0 } } } ], "histogram2dcontour": [ { "type": "histogram2dcontour", "colorbar": { "ticks": "", "outlinewidth": 0 }, "colorscale": [ [ 0.0, "#0d0887" ], [ 0.1111111111111111, "#46039f" ], [ 0.2222222222222222, "#7201a8" ], [ 0.3333333333333333, "#9c179e" ], [ 0.4444444444444444, "#bd3786" ], [ 0.5555555555555556, "#d8576b" ], [ 0.6666666666666666, "#ed7953" ], [ 0.7777777777777778, "#fb9f3a" ], [ 0.8888888888888888, "#fdca26" ], [ 1.0, "#f0f921" ] ] } ] }, "layout": { "geo": { "bgcolor": "white", "showland": true, "lakecolor": "white", "landcolor": "#E5ECF6", "showlakes": true, "subunitcolor": "white" }, "font": { "color": "#2a3f5f" }, "polar": { "bgcolor": "#E5ECF6", "radialaxis": { "ticks": "", "gridcolor": "white", "linecolor": "white" }, "angularaxis": { "ticks": "", "gridcolor": "white", "linecolor": "white" } }, "scene": { "xaxis": { "ticks": "", "gridcolor": "white", "gridwidth": 2, "linecolor": "white", "zerolinecolor": "white", "showbackground": true, "backgroundcolor": "#E5ECF6" }, "yaxis": { "ticks": "", "gridcolor": "white", "gridwidth": 2, "linecolor": "white", "zerolinecolor": "white", "showbackground": true, "backgroundcolor": "#E5ECF6" }, "zaxis": { "ticks": "", "gridcolor": "white", "gridwidth": 2, "linecolor": "white", "zerolinecolor": "white", "showbackground": true, "backgroundcolor": "#E5ECF6" } }, "title": { "x": 0.05 }, "xaxis": { "ticks": "", "title": { "standoff": 15 }, "gridcolor": "white", "linecolor": "white", "automargin": true, "zerolinecolor": "white", "zerolinewidth": 2 }, "yaxis": { "ticks": "", "title": { "standoff": 15 }, "gridcolor": "white", "linecolor": "white", "automargin": true, "zerolinecolor": "white", "zerolinewidth": 2 }, "mapbox": { "style": "light" }, "ternary": { "aaxis": { "ticks": "", "gridcolor": "white", "linecolor": "white" }, "baxis": { "ticks": "", "gridcolor": "white", "linecolor": "white" }, "caxis": { "ticks": "", "gridcolor": "white", "linecolor": "white" }, "bgcolor": "#E5ECF6" }, "colorway": [ "#636efa", "#EF553B", "#00cc96", "#ab63fa", "#FFA15A", "#19d3f3", "#FF6692", "#B6E880", "#FF97FF", "#FECB52" ], "coloraxis": { "colorbar": { "ticks": "", "outlinewidth": 0 } }, "hovermode": "closest", "colorscale": { "diverging": [ [ 0, "#8e0152" ], [ 0.1, "#c51b7d" ], [ 0.2, "#de77ae" ], [ 0.3, "#f1b6da" ], [ 0.4, "#fde0ef" ], [ 0.5, "#f7f7f7" ], [ 0.6, "#e6f5d0" ], [ 0.7, "#b8e186" ], [ 0.8, "#7fbc41" ], [ 0.9, "#4d9221" ], [ 1, "#276419" ] ], "sequential": [ [ 0.0, "#0d0887" ], [ 0.1111111111111111, "#46039f" ], [ 0.2222222222222222, "#7201a8" ], [ 0.3333333333333333, "#9c179e" ], [ 0.4444444444444444, "#bd3786" ], [ 0.5555555555555556, "#d8576b" ], [ 0.6666666666666666, "#ed7953" ], [ 0.7777777777777778, "#fb9f3a" ], [ 0.8888888888888888, "#fdca26" ], [ 1.0, "#f0f921" ] ], "sequentialminus": [ [ 0.0, "#0d0887" ], [ 0.1111111111111111, "#46039f" ], [ 0.2222222222222222, "#7201a8" ], [ 0.3333333333333333, "#9c179e" ], [ 0.4444444444444444, "#bd3786" ], [ 0.5555555555555556, "#d8576b" ], [ 0.6666666666666666, "#ed7953" ], [ 0.7777777777777778, "#fb9f3a" ], [ 0.8888888888888888, "#fdca26" ], [ 1.0, "#f0f921" ] ] }, "hoverlabel": { "align": "left" }, "plot_bgcolor": "#E5ECF6", "paper_bgcolor": "white", "shapedefaults": { "line": { "color": "#2a3f5f" } }, "autotypenumbers": "strict", "annotationdefaults": { "arrowhead": 0, "arrowcolor": "#2a3f5f", "arrowwidth": 1 } } }, "showlegend": true, "plot_bgcolor": "#F5F6F9", "paper_bgcolor": "#F5F6F9" } }, "height": null, "width": null, "user": { "profile_url": "https://chart-studio.plotly.com/~YongfeiYan", "avatar_url": "https://storage.googleapis.com/plotly-prod-profiles/23.jpg", "background_url": "https://storage.googleapis.com/plotly-prod-profiles/bg-14.jpg", "bio": "", "nickname": "", "website": "", "stream_tokens": null, "feature_set_id": null, "csrf_token": null, "date_joined": "2018-08-02 07:37:27", "mapbox_access_tokens": null, "has_password": null, "username": "YongfeiYan", "email": null, "is_active": null, "readonly": null, "is_dash_creator": null, "dash_created_count": null, "is_chart_creator": null, "charts_created_count": null } }, { "creation_time": "2024-03-28T09:00:59.680815Z", "comments": { "results": [], "count": 0 }, "parented": true, "embed_url": "https://chart-studio.plotly.com/~Mahadev2001/1.embed", "fid": "Mahadev2001:1", "filename": "Plot 1", "filetype": "plot", "img_url": "https://storage.googleapis.com/plotly-prod-images/Mahadev2001/1/9_64K88RD8XDB7GAC9WN13EBUTFKXLCP.png", "image_urls": { "default": "https://storage.googleapis.com/plotly-prod-images/Mahadev2001/1/2_ABD2TV5WXQUD7VVWRHTIEUAT81P739.png", "block-thumb": "https://storage.googleapis.com/plotly-prod-images/Mahadev2001/1/8_AXX4V3WZF0QZFSLEDNVYAK5ZQCDZHH.png", "list-thumb": "https://storage.googleapis.com/plotly-prod-images/Mahadev2001/1/9_64K88RD8XDB7GAC9WN13EBUTFKXLCP.png" }, "api_urls": { "files": "https://api.plotly.com/v2/files/Mahadev2001:1", "plots": "https://api.plotly.com/v2/plots/Mahadev2001:1", "parent": "https://api.plotly.com/v2/folders/home?user=Mahadev2001" }, "owner": "Mahadev2001", "parent": -1, "preview": "", "referencers": [], "references": [], "title": "", "views": 2, "web_url": "https://chart-studio.plotly.com/~Mahadev2001/1/", "world_readable": true, "date_modified": "2024-03-28T09:02:04.987Z", "stars": { "results": [], "count": 0 }, "collaborators": { "results": [], "count": 0 }, "subfolder_count": null, "refresh_interval": null, "organize_view_url": "https://chart-studio.plotly.com/~Mahadev2001/1/", "current_user_permission": "read", "is_theme": null, "is_template": false, "autosize": true, "caption": "", "figure": { "data": [ { "meta": { "columnNames": { "x": "exp data", "y": "B" } }, "mode": "markers", "name": "Experimental data", "type": "scatter", "xsrc": "Mahadev2001:0:c4a78e", "ysrc": "Mahadev2001:0:98bd2b" }, { "meta": { "columnNames": { "x": "num. data", "y": "F" } }, "mode": "lines", "name": "Numerical data", "type": "scatter", "xsrc": "Mahadev2001:0:a5bea1", "ysrc": "Mahadev2001:0:bfb85b", "stackgroup": null } ], "frames": [], "layout": { "title": { "text": "Solver Validation" }, "xaxis": { "type": "linear", "range": [ 26.124986244993426, 43.24247306500657 ], "title": { "text": "X coordinate (mm)" }, "autorange": true }, "yaxis": { "type": "linear", "range": [ 0.6825531491429303, 4.2061328462843255 ], "title": { "text": "Wall pressure with reattachment interaction" }, "autorange": true }, "legend": { "x": 1.02, "y": 0.8327137546468402 }, "autosize": true, "template": { "data": { "bar": [ { "type": "bar", "marker": { "colorbar": { "ticks": "", "outlinewidth": 0 } } } ], "table": [ { "type": "table", "cells": { "fill": { "color": "#EBF0F8" }, "line": { "color": "white" } }, "header": { "fill": { "color": "#C8D4E3" }, "line": { "color": "white" } } } ], "carpet": [ { "type": "carpet", "aaxis": { "gridcolor": "#C8D4E3", "linecolor": "#C8D4E3", "endlinecolor": "#2a3f5f", "minorgridcolor": "#C8D4E3", "startlinecolor": "#2a3f5f" }, "baxis": { "gridcolor": "#C8D4E3", "linecolor": "#C8D4E3", "endlinecolor": "#2a3f5f", "minorgridcolor": "#C8D4E3", "startlinecolor": "#2a3f5f" } } ], "mesh3d": [ { "type": "mesh3d", "colorbar": { "ticks": "", "outlinewidth": 0 } } ], "contour": [ { "type": "contour", "colorbar": { "ticks": "", "outlinewidth": 0 }, "autocolorscale": true } ], "heatmap": [ { "type": "heatmap", "colorbar": { "ticks": "", "outlinewidth": 0 }, "autocolorscale": true } ], "scatter": [ { "type": "scatter", "marker": { "colorbar": { "ticks": "", "outlinewidth": 0 } } } ], "surface": [ { "type": "surface", "colorbar": { "ticks": "", "outlinewidth": 0 } } ], "heatmapgl": [ { "type": "heatmapgl", "colorbar": { "ticks": "", "outlinewidth": 0 } } ], "histogram": [ { "type": "histogram", "marker": { "colorbar": { "ticks": "", "outlinewidth": 0 } } } ], "parcoords": [ { "line": { "colorbar": { "ticks": "", "outlinewidth": 0 } }, "type": "parcoords" } ], "scatter3d": [ { "type": "scatter3d", "marker": { "colorbar": { "ticks": "", "outlinewidth": 0 } } } ], "scattergl": [ { "type": "scattergl", "marker": { "colorbar": { "ticks": "", "outlinewidth": 0 } } } ], "choropleth": [ { "type": "choropleth", "colorbar": { "ticks": "", "outlinewidth": 0 } } ], "scattergeo": [ { "type": "scattergeo", "marker": { "colorbar": { "ticks": "", "outlinewidth": 0 } } } ], "histogram2d": [ { "type": "histogram2d", "colorbar": { "ticks": "", "outlinewidth": 0 }, "autocolorscale": true } ], "scatterpolar": [ { "type": "scatterpolar", "marker": { "colorbar": { "ticks": "", "outlinewidth": 0 } } } ], "contourcarpet": [ { "type": "contourcarpet", "colorbar": { "ticks": "", "outlinewidth": 0 } } ], "scattercarpet": [ { "type": "scattercarpet", "marker": { "colorbar": { "ticks": "", "outlinewidth": 0 } } } ], "scattermapbox": [ { "type": "scattermapbox", "marker": { "colorbar": { "ticks": "", "outlinewidth": 0 } } } ], "scatterpolargl": [ { "type": "scatterpolargl", "marker": { "colorbar": { "ticks": "", "outlinewidth": 0 } } } ], "scatterternary": [ { "type": "scatterternary", "marker": { "colorbar": { "ticks": "", "outlinewidth": 0 } } } ], "histogram2dcontour": [ { "type": "histogram2dcontour", "colorbar": { "ticks": "", "outlinewidth": 0 }, "autocolorscale": true } ] }, "layout": { "geo": { "bgcolor": "white", "showland": true, "lakecolor": "white", "landcolor": "white", "showlakes": true, "subunitcolor": "#C8D4E3" }, "font": { "color": "#2a3f5f" }, "polar": { "bgcolor": "white", "radialaxis": { "ticks": "", "gridcolor": "#EBF0F8", "linecolor": "#EBF0F8" }, "angularaxis": { "ticks": "", "gridcolor": "#EBF0F8", "linecolor": "#EBF0F8" } }, "scene": { "xaxis": { "ticks": "", "gridcolor": "#DFE8F3", "gridwidth": 2, "linecolor": "#EBF0F8", "zerolinecolor": "#EBF0F8", "showbackground": true, "backgroundcolor": "white" }, "yaxis": { "ticks": "", "gridcolor": "#DFE8F3", "gridwidth": 2, "linecolor": "#EBF0F8", "zerolinecolor": "#EBF0F8", "showbackground": true, "backgroundcolor": "white" }, "zaxis": { "ticks": "", "gridcolor": "#DFE8F3", "gridwidth": 2, "linecolor": "#EBF0F8", "zerolinecolor": "#EBF0F8", "showbackground": true, "backgroundcolor": "white" } }, "title": { "x": 0.05 }, "xaxis": { "ticks": "", "gridcolor": "#EBF0F8", "linecolor": "#EBF0F8", "automargin": true, "zerolinecolor": "#EBF0F8", "zerolinewidth": 2 }, "yaxis": { "ticks": "", "gridcolor": "#EBF0F8", "linecolor": "#EBF0F8", "automargin": true, "zerolinecolor": "#EBF0F8", "zerolinewidth": 2 }, "ternary": { "aaxis": { "ticks": "", "gridcolor": "#DFE8F3", "linecolor": "#A2B1C6" }, "baxis": { "ticks": "", "gridcolor": "#DFE8F3", "linecolor": "#A2B1C6" }, "caxis": { "ticks": "", "gridcolor": "#DFE8F3", "linecolor": "#A2B1C6" }, "bgcolor": "white" }, "colorway": [ "#636efa", "#EF553B", "#00cc96", "#ab63fa", "#19d3f3", "#e763fa", "#fecb52", "#ffa15a", "#ff6692", "#b6e880" ], "hovermode": "closest", "colorscale": { "diverging": [ [ 0, "#8e0152" ], [ 0.1, "#c51b7d" ], [ 0.2, "#de77ae" ], [ 0.3, "#f1b6da" ], [ 0.4, "#fde0ef" ], [ 0.5, "#f7f7f7" ], [ 0.6, "#e6f5d0" ], [ 0.7, "#b8e186" ], [ 0.8, "#7fbc41" ], [ 0.9, "#4d9221" ], [ 1, "#276419" ] ], "sequential": [ [ 0, "#0508b8" ], [ 0.0893854748603352, "#1910d8" ], [ 0.1787709497206704, "#3c19f0" ], [ 0.2681564245810056, "#6b1cfb" ], [ 0.3575418994413408, "#981cfd" ], [ 0.44692737430167595, "#bf1cfd" ], [ 0.5363128491620112, "#dd2bfd" ], [ 0.6256983240223464, "#f246fe" ], [ 0.7150837988826816, "#fc67fd" ], [ 0.8044692737430168, "#fe88fc" ], [ 0.8938547486033519, "#fea5fd" ], [ 0.9832402234636871, "#febefe" ], [ 1, "#fec3fe" ] ], "sequentialminus": [ [ 0, "#0508b8" ], [ 0.0893854748603352, "#1910d8" ], [ 0.1787709497206704, "#3c19f0" ], [ 0.2681564245810056, "#6b1cfb" ], [ 0.3575418994413408, "#981cfd" ], [ 0.44692737430167595, "#bf1cfd" ], [ 0.5363128491620112, "#dd2bfd" ], [ 0.6256983240223464, "#f246fe" ], [ 0.7150837988826816, "#fc67fd" ], [ 0.8044692737430168, "#fe88fc" ], [ 0.8938547486033519, "#fea5fd" ], [ 0.9832402234636871, "#febefe" ], [ 1, "#fec3fe" ] ] }, "plot_bgcolor": "white", "paper_bgcolor": "white", "shapedefaults": { "line": { "width": 0 }, "opacity": 0.4, "fillcolor": "#506784" }, "annotationdefaults": { "arrowhead": 0, "arrowcolor": "#506784", "arrowwidth": 1 } }, "themeRef": "PLOTLY_WHITE" } } }, "height": null, "width": null, "user": { "profile_url": "https://chart-studio.plotly.com/~Mahadev2001", "avatar_url": "https://storage.googleapis.com/plotly-prod-profiles/2.jpg", "background_url": "https://storage.googleapis.com/plotly-prod-profiles/bg-13.jpg", "bio": "", "nickname": "", "website": "", "stream_tokens": null, "feature_set_id": null, "csrf_token": null, "date_joined": "2024-03-28 09:00:39", "mapbox_access_tokens": null, "has_password": null, "username": "Mahadev2001", "email": null, "is_active": null, "readonly": null, "is_dash_creator": null, "dash_created_count": null, "is_chart_creator": null, "charts_created_count": null } }, { "creation_time": "2024-03-28T08:35:32.999029Z", "comments": { "results": [], "count": 0 }, "parented": true, "embed_url": "https://chart-studio.plotly.com/~Esthersun/1.embed", "fid": "Esthersun:1", "filename": "barchart_counts", "filetype": "plot", "img_url": "https://storage.googleapis.com/plotly-prod-images/Esthersun/1/9_C6GFK0GVUHWAJC7WKSCOGU4SEOQ8FW.png", "image_urls": { "default": "https://storage.googleapis.com/plotly-prod-images/Esthersun/1/2_KPXLKEPQWV9QD6TUWEJ6L109OHTUF1.png", "block-thumb": "https://storage.googleapis.com/plotly-prod-images/Esthersun/1/8_TLND1A1SM5KFXY1VA96B8ZBR5BHUDU.png", "list-thumb": "https://storage.googleapis.com/plotly-prod-images/Esthersun/1/9_C6GFK0GVUHWAJC7WKSCOGU4SEOQ8FW.png" }, "api_urls": { "files": "https://api.plotly.com/v2/files/Esthersun:1", "plots": "https://api.plotly.com/v2/plots/Esthersun:1", "parent": "https://api.plotly.com/v2/folders/home?user=Esthersun" }, "owner": "Esthersun", "parent": -1, "preview": "", "referencers": [], "references": [], "title": "", "views": 17, "web_url": "https://chart-studio.plotly.com/~Esthersun/1/", "world_readable": true, "date_modified": "2024-03-28T09:35:02.519Z", "stars": { "results": [], "count": 0 }, "collaborators": { "results": [], "count": 0 }, "subfolder_count": null, "refresh_interval": null, "organize_view_url": "https://chart-studio.plotly.com/~Esthersun/1/", "current_user_permission": "read", "is_theme": null, "is_template": null, "autosize": true, "caption": "", "figure": { "data": [ { "name": "", "type": "pie", "domain": { "x": [ 0.0, 1.0 ], "y": [ 0.0, 1.0 ] }, "labelssrc": "Esthersun:7:a36257", "valuessrc": "Esthersun:7:44da22", "showlegend": true, "legendgroup": "", "hovertemplate": "channelTitle=%{label}<br>Count=%{value}<extra></extra>" } ], "layout": { "title": { "text": "Proportion of Media Releases Mentioning 'Princess Catherine'" }, "legend": { "tracegroupgap": 0 }, "template": { "data": { "bar": [ { "type": "bar", "marker": { "line": { "color": "#E5ECF6", "width": 0.5 }, "pattern": { "size": 10, "fillmode": "overlay", "solidity": 0.2 } }, "error_x": { "color": "#2a3f5f" }, "error_y": { "color": "#2a3f5f" } } ], "pie": [ { "type": "pie", "automargin": true } ], "table": [ { "type": "table", "cells": { "fill": { "color": "#EBF0F8" }, "line": { "color": "white" } }, "header": { "fill": { "color": "#C8D4E3" }, "line": { "color": "white" } } } ], "carpet": [ { "type": "carpet", "aaxis": { "gridcolor": "white", "linecolor": "white", "endlinecolor": "#2a3f5f", "minorgridcolor": "white", "startlinecolor": "#2a3f5f" }, "baxis": { "gridcolor": "white", "linecolor": "white", "endlinecolor": "#2a3f5f", "minorgridcolor": "white", "startlinecolor": "#2a3f5f" } } ], "mesh3d": [ { "type": "mesh3d", "colorbar": { "ticks": "", "outlinewidth": 0 } } ], "contour": [ { "type": "contour", "colorbar": { "ticks": "", "outlinewidth": 0 }, "colorscale": [ [ 0.0, "#0d0887" ], [ 0.1111111111111111, "#46039f" ], [ 0.2222222222222222, "#7201a8" ], [ 0.3333333333333333, "#9c179e" ], [ 0.4444444444444444, "#bd3786" ], [ 0.5555555555555556, "#d8576b" ], [ 0.6666666666666666, "#ed7953" ], [ 0.7777777777777778, "#fb9f3a" ], [ 0.8888888888888888, "#fdca26" ], [ 1.0, "#f0f921" ] ] } ], "heatmap": [ { "type": "heatmap", "colorbar": { "ticks": "", "outlinewidth": 0 }, "colorscale": [ [ 0.0, "#0d0887" ], [ 0.1111111111111111, "#46039f" ], [ 0.2222222222222222, "#7201a8" ], [ 0.3333333333333333, "#9c179e" ], [ 0.4444444444444444, "#bd3786" ], [ 0.5555555555555556, "#d8576b" ], [ 0.6666666666666666, "#ed7953" ], [ 0.7777777777777778, "#fb9f3a" ], [ 0.8888888888888888, "#fdca26" ], [ 1.0, "#f0f921" ] ] } ], "scatter": [ { "type": "scatter", "fillpattern": { "size": 10, "fillmode": "overlay", "solidity": 0.2 } } ], "surface": [ { "type": "surface", "colorbar": { "ticks": "", "outlinewidth": 0 }, "colorscale": [ [ 0.0, "#0d0887" ], [ 0.1111111111111111, "#46039f" ], [ 0.2222222222222222, "#7201a8" ], [ 0.3333333333333333, "#9c179e" ], [ 0.4444444444444444, "#bd3786" ], [ 0.5555555555555556, "#d8576b" ], [ 0.6666666666666666, "#ed7953" ], [ 0.7777777777777778, "#fb9f3a" ], [ 0.8888888888888888, "#fdca26" ], [ 1.0, "#f0f921" ] ] } ], "barpolar": [ { "type": "barpolar", "marker": { "line": { "color": "#E5ECF6", "width": 0.5 }, "pattern": { "size": 10, "fillmode": "overlay", "solidity": 0.2 } } } ], "heatmapgl": [ { "type": "heatmapgl", "colorbar": { "ticks": "", "outlinewidth": 0 }, "colorscale": [ [ 0.0, "#0d0887" ], [ 0.1111111111111111, "#46039f" ], [ 0.2222222222222222, "#7201a8" ], [ 0.3333333333333333, "#9c179e" ], [ 0.4444444444444444, "#bd3786" ], [ 0.5555555555555556, "#d8576b" ], [ 0.6666666666666666, "#ed7953" ], [ 0.7777777777777778, "#fb9f3a" ], [ 0.8888888888888888, "#fdca26" ], [ 1.0, "#f0f921" ] ] } ], "histogram": [ { "type": "histogram", "marker": { "pattern": { "size": 10, "fillmode": "overlay", "solidity": 0.2 } } } ], "parcoords": [ { "line": { "colorbar": { "ticks": "", "outlinewidth": 0 } }, "type": "parcoords" } ], "scatter3d": [ { "line": { "colorbar": { "ticks": "", "outlinewidth": 0 } }, "type": "scatter3d", "marker": { "colorbar": { "ticks": "", "outlinewidth": 0 } } } ], "scattergl": [ { "type": "scattergl", "marker": { "colorbar": { "ticks": "", "outlinewidth": 0 } } } ], "choropleth": [ { "type": "choropleth", "colorbar": { "ticks": "", "outlinewidth": 0 } } ], "scattergeo": [ { "type": "scattergeo", "marker": { "colorbar": { "ticks": "", "outlinewidth": 0 } } } ], "histogram2d": [ { "type": "histogram2d", "colorbar": { "ticks": "", "outlinewidth": 0 }, "colorscale": [ [ 0.0, "#0d0887" ], [ 0.1111111111111111, "#46039f" ], [ 0.2222222222222222, "#7201a8" ], [ 0.3333333333333333, "#9c179e" ], [ 0.4444444444444444, "#bd3786" ], [ 0.5555555555555556, "#d8576b" ], [ 0.6666666666666666, "#ed7953" ], [ 0.7777777777777778, "#fb9f3a" ], [ 0.8888888888888888, "#fdca26" ], [ 1.0, "#f0f921" ] ] } ], "scatterpolar": [ { "type": "scatterpolar", "marker": { "colorbar": { "ticks": "", "outlinewidth": 0 } } } ], "contourcarpet": [ { "type": "contourcarpet", "colorbar": { "ticks": "", "outlinewidth": 0 } } ], "scattercarpet": [ { "type": "scattercarpet", "marker": { "colorbar": { "ticks": "", "outlinewidth": 0 } } } ], "scattermapbox": [ { "type": "scattermapbox", "marker": { "colorbar": { "ticks": "", "outlinewidth": 0 } } } ], "scatterpolargl": [ { "type": "scatterpolargl", "marker": { "colorbar": { "ticks": "", "outlinewidth": 0 } } } ], "scatterternary": [ { "type": "scatterternary", "marker": { "colorbar": { "ticks": "", "outlinewidth": 0 } } } ], "histogram2dcontour": [ { "type": "histogram2dcontour", "colorbar": { "ticks": "", "outlinewidth": 0 }, "colorscale": [ [ 0.0, "#0d0887" ], [ 0.1111111111111111, "#46039f" ], [ 0.2222222222222222, "#7201a8" ], [ 0.3333333333333333, "#9c179e" ], [ 0.4444444444444444, "#bd3786" ], [ 0.5555555555555556, "#d8576b" ], [ 0.6666666666666666, "#ed7953" ], [ 0.7777777777777778, "#fb9f3a" ], [ 0.8888888888888888, "#fdca26" ], [ 1.0, "#f0f921" ] ] } ] }, "layout": { "geo": { "bgcolor": "white", "showland": true, "lakecolor": "white", "landcolor": "#E5ECF6", "showlakes": true, "subunitcolor": "white" }, "font": { "color": "#2a3f5f" }, "polar": { "bgcolor": "#E5ECF6", "radialaxis": { "ticks": "", "gridcolor": "white", "linecolor": "white" }, "angularaxis": { "ticks": "", "gridcolor": "white", "linecolor": "white" } }, "scene": { "xaxis": { "ticks": "", "gridcolor": "white", "gridwidth": 2, "linecolor": "white", "zerolinecolor": "white", "showbackground": true, "backgroundcolor": "#E5ECF6" }, "yaxis": { "ticks": "", "gridcolor": "white", "gridwidth": 2, "linecolor": "white", "zerolinecolor": "white", "showbackground": true, "backgroundcolor": "#E5ECF6" }, "zaxis": { "ticks": "", "gridcolor": "white", "gridwidth": 2, "linecolor": "white", "zerolinecolor": "white", "showbackground": true, "backgroundcolor": "#E5ECF6" } }, "title": { "x": 0.05 }, "xaxis": { "ticks": "", "title": { "standoff": 15 }, "gridcolor": "white", "linecolor": "white", "automargin": true, "zerolinecolor": "white", "zerolinewidth": 2 }, "yaxis": { "ticks": "", "title": { "standoff": 15 }, "gridcolor": "white", "linecolor": "white", "automargin": true, "zerolinecolor": "white", "zerolinewidth": 2 }, "mapbox": { "style": "light" }, "ternary": { "aaxis": { "ticks": "", "gridcolor": "white", "linecolor": "white" }, "baxis": { "ticks": "", "gridcolor": "white", "linecolor": "white" }, "caxis": { "ticks": "", "gridcolor": "white", "linecolor": "white" }, "bgcolor": "#E5ECF6" }, "colorway": [ "#636efa", "#EF553B", "#00cc96", "#ab63fa", "#FFA15A", "#19d3f3", "#FF6692", "#B6E880", "#FF97FF", "#FECB52" ], "coloraxis": { "colorbar": { "ticks": "", "outlinewidth": 0 } }, "hovermode": "closest", "colorscale": { "diverging": [ [ 0, "#8e0152" ], [ 0.1, "#c51b7d" ], [ 0.2, "#de77ae" ], [ 0.3, "#f1b6da" ], [ 0.4, "#fde0ef" ], [ 0.5, "#f7f7f7" ], [ 0.6, "#e6f5d0" ], [ 0.7, "#b8e186" ], [ 0.8, "#7fbc41" ], [ 0.9, "#4d9221" ], [ 1, "#276419" ] ], "sequential": [ [ 0.0, "#0d0887" ], [ 0.1111111111111111, "#46039f" ], [ 0.2222222222222222, "#7201a8" ], [ 0.3333333333333333, "#9c179e" ], [ 0.4444444444444444, "#bd3786" ], [ 0.5555555555555556, "#d8576b" ], [ 0.6666666666666666, "#ed7953" ], [ 0.7777777777777778, "#fb9f3a" ], [ 0.8888888888888888, "#fdca26" ], [ 1.0, "#f0f921" ] ], "sequentialminus": [ [ 0.0, "#0d0887" ], [ 0.1111111111111111, "#46039f" ], [ 0.2222222222222222, "#7201a8" ], [ 0.3333333333333333, "#9c179e" ], [ 0.4444444444444444, "#bd3786" ], [ 0.5555555555555556, "#d8576b" ], [ 0.6666666666666666, "#ed7953" ], [ 0.7777777777777778, "#fb9f3a" ], [ 0.8888888888888888, "#fdca26" ], [ 1.0, "#f0f921" ] ] }, "hoverlabel": { "align": "left" }, "plot_bgcolor": "#E5ECF6", "paper_bgcolor": "white", "shapedefaults": { "line": { "color": "#2a3f5f" } }, "autotypenumbers": "strict", "annotationdefaults": { "arrowhead": 0, "arrowcolor": "#2a3f5f", "arrowwidth": 1 } } } } }, "height": null, "width": null, "user": { "profile_url": "https://chart-studio.plotly.com/~Esthersun", "avatar_url": "https://storage.googleapis.com/plotly-prod-profiles/29.jpg", "background_url": "https://storage.googleapis.com/plotly-prod-profiles/bg-3.jpg", "bio": "", "nickname": "", "website": "", "stream_tokens": null, "feature_set_id": null, "csrf_token": null, "date_joined": "2024-03-28 08:29:53", "mapbox_access_tokens": null, "has_password": null, "username": "Esthersun", "email": null, "is_active": null, "readonly": null, "is_dash_creator": null, "dash_created_count": null, "is_chart_creator": null, "charts_created_count": null } }, { "creation_time": "2024-03-28T08:13:09.221298Z", "comments": { "results": [], "count": 0 }, "parented": true, "embed_url": "https://chart-studio.plotly.com/~Esanta/48.embed", "fid": "Esanta:48", "filename": "plot from API (24)", "filetype": "plot", "img_url": "https://storage.googleapis.com/plotly-prod-images/Esanta/48/9_JNWUFW6JEN7OIVWAATNLOWTVNP33KN.png", "image_urls": { "default": "https://storage.googleapis.com/plotly-prod-images/Esanta/48/2_BMPPTIO5JQN43MNAOAAV5PCD658DLI.png", "block-thumb": "https://storage.googleapis.com/plotly-prod-images/Esanta/48/8_RVS37X6E8X6QRI2GISDKWBJXDABQF5.png", "list-thumb": "https://storage.googleapis.com/plotly-prod-images/Esanta/48/9_JNWUFW6JEN7OIVWAATNLOWTVNP33KN.png" }, "api_urls": { "files": "https://api.plotly.com/v2/files/Esanta:48", "plots": "https://api.plotly.com/v2/plots/Esanta:48", "parent": "https://api.plotly.com/v2/folders/home?user=Esanta" }, "owner": "Esanta", "parent": -1, "preview": "", "referencers": [], "references": [], "title": "Systolic vs Diastolic", "views": 1, "web_url": "https://chart-studio.plotly.com/~Esanta/48/systolic-vs-diastolic/", "world_readable": true, "date_modified": "2024-06-19T07:09:52.916Z", "stars": { "results": [], "count": 0 }, "collaborators": { "results": [], "count": 0 }, "subfolder_count": null, "refresh_interval": null, "organize_view_url": "https://chart-studio.plotly.com/~Esanta/48/", "current_user_permission": "read", "is_theme": null, "is_template": null, "autosize": true, "caption": "", "figure": { "data": [ { "line": { "color": "blue" }, "mode": "lines markers", "name": "Systolic", "type": "scatter", "xsrc": "Esanta:49:2a784a", "ysrc": "Esanta:49:885b01", "textsrc": "Esanta:49:62609b" }, { "line": { "color": "green" }, "mode": "lines markers", "name": "Diastolic", "type": "scatter", "xsrc": "Esanta:49:2a784a", "ysrc": "Esanta:49:db203f", "textsrc": "Esanta:49:62609b" } ], "layout": {} }, "height": null, "width": null, "user": { "profile_url": "https://chart-studio.plotly.com/~Esanta", "avatar_url": "https://storage.googleapis.com/plotly-prod-profiles/69.jpg", "background_url": "https://storage.googleapis.com/plotly-prod-profiles/bg-11.jpg", "bio": "", "nickname": "", "website": "", "stream_tokens": null, "feature_set_id": null, "csrf_token": null, "date_joined": "2024-03-27 19:43:48", "mapbox_access_tokens": null, "has_password": null, "username": "Esanta", "email": null, "is_active": null, "readonly": null, "is_dash_creator": null, "dash_created_count": null, "is_chart_creator": null, "charts_created_count": null } }, { "creation_time": "2024-03-28T08:10:42.529370Z", "comments": { "results": [], "count": 0 }, "parented": true, "embed_url": "https://chart-studio.plotly.com/~kotlas6667/1.embed", "fid": "kotlas6667:1", "filename": "Mendix graf v0.1", "filetype": "plot", "img_url": "https://storage.googleapis.com/plotly-prod-images/kotlas6667/1/9_TV9B1NPDJ51ZS4OSI5HPM65QCO3NGC.png", "image_urls": { "default": "https://storage.googleapis.com/plotly-prod-images/kotlas6667/1/2_NGSOD6RJLODVNMCAS9TBRHHO3S17DT.png", "block-thumb": "https://storage.googleapis.com/plotly-prod-images/kotlas6667/1/8_DIRY45FBM0G530HFY1G59R8Z1C2VOE.png", "list-thumb": "https://storage.googleapis.com/plotly-prod-images/kotlas6667/1/9_TV9B1NPDJ51ZS4OSI5HPM65QCO3NGC.png" }, "api_urls": { "files": "https://api.plotly.com/v2/files/kotlas6667:1", "plots": "https://api.plotly.com/v2/plots/kotlas6667:1", "parent": "https://api.plotly.com/v2/folders/home?user=kotlas6667" }, "owner": "kotlas6667", "parent": -1, "preview": "", "referencers": [], "references": [], "title": "", "views": 1, "web_url": "https://chart-studio.plotly.com/~kotlas6667/1/", "world_readable": true, "date_modified": "2024-03-28T12:36:32.415Z", "stars": { "results": [], "count": 0 }, "collaborators": { "results": [], "count": 0 }, "subfolder_count": null, "refresh_interval": null, "organize_view_url": "https://chart-studio.plotly.com/~kotlas6667/1/", "current_user_permission": "read", "is_theme": null, "is_template": false, "autosize": true, "caption": "", "figure": { "data": [ { "meta": { "columnNames": { "x": "B", "y": "A", "marker": { "color": "A" } } }, "mode": "markers", "name": "Referovane", "type": "bar", "xsrc": "kotlas6667:0:9c6fd9", "ysrc": "kotlas6667:0:e20b3f", "marker": { "line": { "color": "rgb(1, 1, 1)", "width": 1 }, "meta": { "columnNames": { "color": "A" } }, "color": "rgb(48, 127, 233)", "opacity": 1 }, "error_x": { "type": "percent", "color": "rgb(1, 1, 1)", "value": 10, "width": 4, "visible": false, "symmetric": true, "thickness": 2 }, "opacity": 1, "hoverinfo": "x+y+name", "legendgroup": "", "orientation": "h", "textposition": "auto", "texttemplate": "" }, { "meta": { "columnNames": { "x": "E", "y": "D" } }, "name": "Aktualne", "type": "bar", "xsrc": "kotlas6667:0:51f337", "ysrc": "kotlas6667:0:35985d", "xaxis": "x", "marker": { "line": { "width": 1 }, "color": "rgb(39, 231, 78)" }, "orientation": "h" } ], "frames": [], "layout": { "font": { "size": 14, "family": "Droid Serif" }, "scene": { "aspectmode": "auto", "aspectratio": { "x": 1, "y": 1, "z": 1 } }, "title": { "x": 0.06, "font": { "size": 14 }, "text": "" }, "width": 2093, "xaxis": { "side": "bottom", "type": "linear", "dtick": 1, "range": [ 0, 5.2631578947368425 ], "tick0": 0, "ticks": "outside", "title": { "font": { "size": 17 }, "text": "" }, "domain": [ 0.07, 0.75 ], "mirror": false, "nticks": 19, "ticklen": 5, "tickson": "labels", "showgrid": true, "showline": true, "tickmode": "linear", "zeroline": true, "autorange": true, "gridcolor": "rgb(242, 242, 242)", "gridwidth": 0, "linewidth": -1, "tickangle": "auto", "tickwidth": 0, "automargin": true, "showspikes": true, "tickformat": "", "ticksuffix": "", "rangeslider": { "range": [ 0, 5.2631578947368425 ], "yaxis": {}, "visible": false, "autorange": true }, "showexponent": "none", "zerolinewidth": 1, "exponentformat": "none", "spikethickness": 0, "separatethousands": false }, "yaxis": { "side": "left", "type": "category", "dtick": 1, "range": [ -0.5, 9.5 ], "tick0": 25, "ticks": "outside", "title": { "text": "" }, "anchor": "x", "domain": [ 0.25, 1 ], "mirror": false, "nticks": 0, "ticklen": 5, "tickson": "labels", "showgrid": true, "showline": true, "tickmode": "linear", "zeroline": true, "autorange": false, "gridwidth": 0, "linewidth": -1, "tickwidth": 0, "automargin": true, "fixedrange": false, "showspikes": false, "spikethickness": 0 }, "bargap": 0.5, "height": 1000, "legend": { "x": 0.8000000000000003, "y": 0.8599999999999999, "title": { "text": "<br>" }, "valign": "middle", "xanchor": "auto", "yanchor": "auto", "orientation": "v" }, "mapbox": {}, "margin": { "b": 90, "l": 120, "r": 80, "t": 5, "pad": 10 }, "barmode": "group", "barnorm": "", "modebar": { "orientation": "v" }, "autosize": true, "colorway": [ "#FD3216", "#00FE35", "#6A76FC", "#FED4C4", "#FE00CE", "#0DF9FF", "#F6F926", "#FF9616", "#479B55", "#EEA6FB", "#DC587D", "#D626FF", "#6E899C", "#00B5F7", "#B68E00", "#C9FBE5", "#FF0092", "#22FFA7", "#E3EE9E", "#86CE00", "#BC7196", "#7E7DCD", "#FC6955", "#E48F72" ], "template": { "data": { "bar": [ { "type": "bar", "marker": { "colorbar": { "len": 0.2, "ticks": "inside", "ticklen": 6, "tickcolor": "rgb(237,237,237)", "outlinewidth": 0 } } } ], "table": [ { "type": "table", "cells": { "fill": { "color": "rgb(237,237,237)" }, "line": { "color": "white" } }, "header": { "fill": { "color": "rgb(217,217,217)" }, "line": { "color": "white" } } } ], "carpet": [ { "type": "carpet", "aaxis": { "gridcolor": "white", "linecolor": "white", "endlinecolor": "rgb(51,51,51)", "minorgridcolor": "white", "startlinecolor": "rgb(51,51,51)" }, "baxis": { "gridcolor": "white", "linecolor": "white", "endlinecolor": "rgb(51,51,51)", "minorgridcolor": "white", "startlinecolor": "rgb(51,51,51)" } } ], "mesh3d": [ { "type": "mesh3d", "colorbar": { "len": 0.2, "ticks": "inside", "ticklen": 6, "tickcolor": "rgb(237,237,237)", "outlinewidth": 0 } } ], "contour": [ { "type": "contour", "colorbar": { "len": 0.2, "ticks": "inside", "ticklen": 6, "tickcolor": "rgb(237,237,237)", "outlinewidth": 0 }, "autocolorscale": true } ], "heatmap": [ { "type": "heatmap", "colorbar": { "len": 0.2, "ticks": "inside", "ticklen": 6, "tickcolor": "rgb(237,237,237)", "outlinewidth": 0 }, "autocolorscale": true } ], "scatter": [ { "type": "scatter", "marker": { "colorbar": { "len": 0.2, "ticks": "inside", "ticklen": 6, "tickcolor": "rgb(237,237,237)", "outlinewidth": 0 } } } ], "surface": [ { "type": "surface", "colorbar": { "len": 0.2, "ticks": "inside", "ticklen": 6, "tickcolor": "rgb(237,237,237)", "outlinewidth": 0 } } ], "heatmapgl": [ { "type": "heatmapgl", "colorbar": { "len": 0.2, "ticks": "inside", "ticklen": 6, "tickcolor": "rgb(237,237,237)", "outlinewidth": 0 } } ], "histogram": [ { "type": "histogram", "marker": { "colorbar": { "len": 0.2, "ticks": "inside", "ticklen": 6, "tickcolor": "rgb(237,237,237)", "outlinewidth": 0 } } } ], "parcoords": [ { "line": { "colorbar": { "len": 0.2, "ticks": "inside", "ticklen": 6, "tickcolor": "rgb(237,237,237)", "outlinewidth": 0 } }, "type": "parcoords" } ], "scatter3d": [ { "type": "scatter3d", "marker": { "colorbar": { "len": 0.2, "ticks": "inside", "ticklen": 6, "tickcolor": "rgb(237,237,237)", "outlinewidth": 0 } } } ], "scattergl": [ { "type": "scattergl", "marker": { "colorbar": { "len": 0.2, "ticks": "inside", "ticklen": 6, "tickcolor": "rgb(237,237,237)", "outlinewidth": 0 } } } ], "choropleth": [ { "type": "choropleth", "colorbar": { "len": 0.2, "ticks": "inside", "ticklen": 6, "tickcolor": "rgb(237,237,237)", "outlinewidth": 0 } } ], "scattergeo": [ { "type": "scattergeo", "marker": { "colorbar": { "len": 0.2, "ticks": "inside", "ticklen": 6, "tickcolor": "rgb(237,237,237)", "outlinewidth": 0 } } } ], "histogram2d": [ { "type": "histogram2d", "colorbar": { "len": 0.2, "ticks": "inside", "ticklen": 6, "tickcolor": "rgb(237,237,237)", "outlinewidth": 0 }, "autocolorscale": true } ], "scatterpolar": [ { "type": "scatterpolar", "marker": { "colorbar": { "len": 0.2, "ticks": "inside", "ticklen": 6, "tickcolor": "rgb(237,237,237)", "outlinewidth": 0 } } } ], "contourcarpet": [ { "type": "contourcarpet", "colorbar": { "len": 0.2, "ticks": "inside", "ticklen": 6, "tickcolor": "rgb(237,237,237)", "outlinewidth": 0 } } ], "scattercarpet": [ { "type": "scattercarpet", "marker": { "colorbar": { "len": 0.2, "ticks": "inside", "ticklen": 6, "tickcolor": "rgb(237,237,237)", "outlinewidth": 0 } } } ], "scattermapbox": [ { "type": "scattermapbox", "marker": { "colorbar": { "len": 0.2, "ticks": "inside", "ticklen": 6, "tickcolor": "rgb(237,237,237)", "outlinewidth": 0 } } } ], "scatterpolargl": [ { "type": "scatterpolargl", "marker": { "colorbar": { "len": 0.2, "ticks": "inside", "ticklen": 6, "tickcolor": "rgb(237,237,237)", "outlinewidth": 0 } } } ], "scatterternary": [ { "type": "scatterternary", "marker": { "colorbar": { "len": 0.2, "ticks": "inside", "ticklen": 6, "tickcolor": "rgb(237,237,237)", "outlinewidth": 0 } } } ], "histogram2dcontour": [ { "type": "histogram2dcontour", "colorbar": { "len": 0.2, "ticks": "inside", "ticklen": 6, "tickcolor": "rgb(237,237,237)", "outlinewidth": 0 }, "autocolorscale": true } ] }, "layout": { "geo": { "bgcolor": "white", "showland": true, "lakecolor": "white", "landcolor": "rgb(237,237,237)", "showlakes": true, "subunitcolor": "white" }, "font": { "color": "rgb(51,51,51)" }, "polar": { "bgcolor": "rgb(237,237,237)", "radialaxis": { "ticks": "outside", "showgrid": true, "gridcolor": "white", "linecolor": "white", "tickcolor": "rgb(51,51,51)" }, "angularaxis": { "ticks": "outside", "showgrid": true, "gridcolor": "white", "linecolor": "white", "tickcolor": "rgb(51,51,51)" } }, "scene": { "xaxis": { "ticks": "outside", "showgrid": true, "gridcolor": "white", "gridwidth": 2, "linecolor": "white", "tickcolor": "rgb(51,51,51)", "zerolinecolor": "white", "showbackground": true, "backgroundcolor": "rgb(237,237,237)" }, "yaxis": { "ticks": "outside", "showgrid": true, "gridcolor": "white", "gridwidth": 2, "linecolor": "white", "tickcolor": "rgb(51,51,51)", "zerolinecolor": "white", "showbackground": true, "backgroundcolor": "rgb(237,237,237)" }, "zaxis": { "ticks": "outside", "showgrid": true, "gridcolor": "white", "gridwidth": 2, "linecolor": "white", "tickcolor": "rgb(51,51,51)", "zerolinecolor": "white", "showbackground": true, "backgroundcolor": "rgb(237,237,237)" } }, "xaxis": { "ticks": "outside", "showgrid": true, "gridcolor": "white", "linecolor": "white", "tickcolor": "rgb(51,51,51)", "automargin": true, "zerolinecolor": "white" }, "yaxis": { "ticks": "outside", "showgrid": true, "gridcolor": "white", "linecolor": "white", "tickcolor": "rgb(51,51,51)", "automargin": true, "zerolinecolor": "white" }, "ternary": { "aaxis": { "ticks": "outside", "showgrid": true, "gridcolor": "white", "linecolor": "white", "tickcolor": "rgb(51,51,51)" }, "baxis": { "ticks": "outside", "showgrid": true, "gridcolor": "white", "linecolor": "white", "tickcolor": "rgb(51,51,51)" }, "caxis": { "ticks": "outside", "showgrid": true, "gridcolor": "white", "linecolor": "white", "tickcolor": "rgb(51,51,51)" }, "bgcolor": "rgb(237,237,237)" }, "colorway": [ "#F8766D", "#A3A500", "#00BF7D", "#00B0F6", "#E76BF3" ], "hovermode": "closest", "colorscale": { "diverging": [ [ 0, "#40004b" ], [ 0.1, "#762a83" ], [ 0.2, "#9970ab" ], [ 0.3, "#c2a5cf" ], [ 0.4, "#e7d4e8" ], [ 0.5, "#f7f7f7" ], [ 0.6, "#d9f0d3" ], [ 0.7, "#a6dba0" ], [ 0.8, "#5aae61" ], [ 0.9, "#1b7837" ], [ 1, "#00441b" ] ], "sequential": [ [ 0, "rgb(20,44,66)" ], [ 1, "rgb(90,179,244)" ] ], "sequentialminus": [ [ 0, "rgb(20,44,66)" ], [ 1, "rgb(90,179,244)" ] ] }, "plot_bgcolor": "rgb(237,237,237)", "paper_bgcolor": "white", "shapedefaults": { "line": { "width": 0 }, "opacity": 0.3, "fillcolor": "black" }, "annotationdefaults": { "arrowhead": 0, "arrowwidth": 1 } }, "themeRef": "GGPLOT2" }, "colorscale": { "diverging": [ [ 0, "#67001f" ], [ 0.1, "#b2182b" ], [ 0.2, "#d6604d" ], [ 0.3, "#f4a582" ], [ 0.4, "#fddbc7" ], [ 0.5, "#ffffff" ], [ 0.6, "#e0e0e0" ], [ 0.7, "#bababa" ], [ 0.8, "#878787" ], [ 0.9, "#4d4d4d" ], [ 1, "#1a1a1a" ] ], "sequential": [ [ 0, "#ffffff" ], [ 0.125, "#f0f0f0" ], [ 0.25, "#d9d9d9" ], [ 0.375, "#bdbdbd" ], [ 0.5, "#969696" ], [ 0.625, "#737373" ], [ 0.75, "#525252" ], [ 0.875, "#252525" ], [ 1, "#000000" ] ], "sequentialminus": [ [ 0, "#0d0887" ], [ 0.1111111111111111, "#46039f" ], [ 0.2222222222222222, "#7201a8" ], [ 0.3333333333333333, "#9c179e" ], [ 0.4444444444444444, "#bd3786" ], [ 0.5555555555555556, "#d8576b" ], [ 0.6666666666666666, "#ed7953" ], [ 0.7777777777777778, "#fb9f3a" ], [ 0.8888888888888888, "#fdca26" ], [ 1, "#f0f921" ] ] }, "hoverlabel": { "font": { "size": 13 } }, "separators": ", ", "showlegend": true, "bargroupgap": 0, "uniformtext": { "mode": false }, "plot_bgcolor": "rgb(241, 245, 237)", "paper_bgcolor": "rgb(245, 245, 245)" } }, "height": 1000, "width": 2093, "user": { "profile_url": "https://chart-studio.plotly.com/~kotlas6667", "avatar_url": "https://storage.googleapis.com/plotly-prod-profiles/41.jpg", "background_url": "https://storage.googleapis.com/plotly-prod-profiles/bg-8.jpg", "bio": "", "nickname": "", "website": "", "stream_tokens": null, "feature_set_id": null, "csrf_token": null, "date_joined": "2024-03-28 07:31:25", "mapbox_access_tokens": null, "has_password": null, "username": "kotlas6667", "email": null, "is_active": null, "readonly": null, "is_dash_creator": null, "dash_created_count": null, "is_chart_creator": null, "charts_created_count": null } } ] }
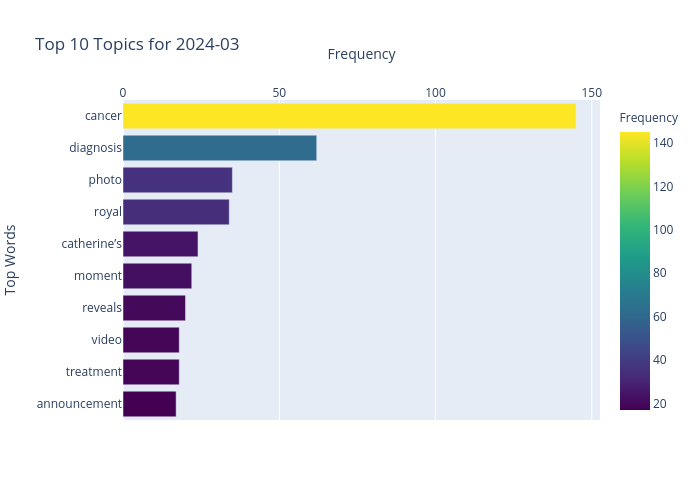