Plots List
Plots
This endpoint handles manipulation of Plotly plot files.
Reference
Authorization
Any user with or without a Plotly account may view public plots. For private plots, see authentication.
Actions
list
Listing all public plots can be done via a GET request to this endpoint.
By default, plots will be listed in order of date created. The order_by
query parameter is accepted at this endpoint. Currently, only ordering by
views is supported. It is possible to filter the plots by quality
with min_quality or max_quality as query parameter.
Example:
// GET https://api.plotly.com/v2/plots/ ---> 200

// GET https://api.plotly.com/v2/plots/?order_by=-views ---> 200

// GET https://api.plotly.com/v2/plots/?min_quality=5 ---> 200

// GET https://api.plotly.com/v2/plots/?max_quality=5 ---> 200
feed
Listing all handpicked feed plots can be done via a GET request to this endpoint. By default, plots will be listed in a random order.
Example:
// GET https://api.plotly.com/v2/plots/feed ---> 200
create
You can create new plot resources here. The only required field is 'figure'. Currently, the figure is restricted to only contain references to grid data. That is, this will fail if raw data arrays are passed in. To create and manipulate underlying grids for plots, see the grids endpoint.
Example:
// This fails because a figure field is required.
// POST https://api.plotly.com/v2/plots ---> 400 Bad Request
{}

// This fails because the figure has raw data
//POST https://api.plotly.com/v2/plots ---> 400 Bad Request
{
    "figure": {"data": [{"y": ['this', 'is', 'raw', 'data']}]}
}

// This succeeds because the figure has src keys, not raw data.
//POST https://api.plotly.com/v2/plots ---> 200 OK
{
    "figure": {"data": [{"ysrc": "sven:88:u8nd62"}]}
}
When creating a grid, you can optionally specify a source_fid to specify where a plot has come from:
- source_fid: the fid of a plot that was copied (and presumably edited) to produce this one
detail
There is a lot of meta information stored about plot files including filename, title, share_url, and content_url to name a few.
This information can only be reached with a GET to this endpoint.
Example:
// GET https://api.plotly.com/v2/plots/iheartgraphs:90
content
The contents of a plot can be downloaded via the content resource. The plot
content contains referenced grid/column data by default. If you wish to
return the raw grid/column data, the inline_data=true query must be included
in the request url. The Content-Type header will be appropriately set for the
response body.
Alternatively, you can set ?map_data=unreadable to append a mapping of
sources to data that belongs to grids which are unreadable for the
requestor. This is useful when you have read access to another users plot,
but that plot contains grid references which you don't have access to.
Examples:
// Returns referenced grid/column data
// GET https://api.plotly.com/v2/plots/iheartgraphs:90/content ---> 200 OK

// Returns full grid/column data
// GET https://api.plotly.com/v2/plots/iheartgraphs:90/content?inline_data=true ---> 200 OK

// Returns full grid/column data when requestor doesn't have permission
// to read the referenced grid.
// GET https://api.plotly.com/v2/plots/iheartgraphs:90/content?map_data=unreadable ---> 200 OK
GET /v2/plots?cursor=cD0yMDI0LTA0LTAzKzIyJTNBMTklM0E1Ni4xNTUwNzIlMkIwMCUzQTAw&format=api
{ "next": "https://api.plot.ly/v2/plots?cursor=cD0yMDI0LTA0LTAzKzIxJTNBMTUlM0EwMS45MDgyOTglMkIwMCUzQTAw&format=api", "previous": "https://api.plot.ly/v2/plots?cursor=cj0xJnA9MjAyNC0wNC0wMysyMiUzQTE3JTNBMDAuNzUwNTE5JTJCMDAlM0EwMA%3D%3D&format=api", "results": [ { "creation_time": "2024-04-03T22:17:00.750519Z", "comments": { "results": [], "count": 0 }, "parented": true, "embed_url": "https://chart-studio.plotly.com/~ahalitaj/344.embed", "fid": "ahalitaj:344", "filename": "Classification Report for CCW by WIKI test", "filetype": "plot", "img_url": "https://storage.googleapis.com/plotly-prod-images/ahalitaj/344/9_DRC39U0XX63I55TW8FMLVLJA0DHYU5.png", "image_urls": { "default": "https://storage.googleapis.com/plotly-prod-images/ahalitaj/344/2_TL18XD551RVHD28IG7UT1W90YO4C2E.png", "block-thumb": "https://storage.googleapis.com/plotly-prod-images/ahalitaj/344/8_LTOP2OUW93WH9RJSNBEDGRQMET4YF4.png", "list-thumb": "https://storage.googleapis.com/plotly-prod-images/ahalitaj/344/9_DRC39U0XX63I55TW8FMLVLJA0DHYU5.png" }, "api_urls": { "files": "https://api.plotly.com/v2/files/ahalitaj:344", "plots": "https://api.plotly.com/v2/plots/ahalitaj:344", "parent": "https://api.plotly.com/v2/folders/home?user=ahalitaj" }, "owner": "ahalitaj", "parent": -1, "preview": "", "referencers": [], "references": [], "title": "", "views": 2, "web_url": "https://chart-studio.plotly.com/~ahalitaj/344/", "world_readable": true, "date_modified": "2024-04-05T11:56:02.618Z", "stars": { "results": [], "count": 0 }, "collaborators": { "results": [], "count": 0 }, "subfolder_count": null, "refresh_interval": null, "organize_view_url": "https://chart-studio.plotly.com/~ahalitaj/344/", "current_user_permission": "read", "is_theme": null, "is_template": null, "autosize": true, "caption": "", "figure": { "data": [ { "line": { "dash": "solid", "color": "#636efa" }, "mode": "markers+lines+text", "name": "accuracy_ca", "type": "scatter", "xsrc": "ahalitaj:345:c539a3", "ysrc": "ahalitaj:345:93b13b", "xaxis": "x", "yaxis": "y", "marker": { "symbol": "circle" }, "textsrc": "ahalitaj:345:6ae6f7", "showlegend": true, "legendgroup": "ca_accuracy", "orientation": "v", "textposition": "top center", "hovertemplate": "wiki_metric=ca_accuracy<br>input_type=%{x}<br>value=%{text}<extra></extra>" }, { "line": { "dash": "dot", "color": "#EF553B" }, "mode": "markers+lines+text", "name": "accuracy_eu", "type": "scatter", "xsrc": "ahalitaj:345:2706a8", "ysrc": "ahalitaj:345:70306b", "xaxis": "x", "yaxis": "y", "marker": { "symbol": "circle" }, "textsrc": "ahalitaj:345:1d3eb9", "showlegend": true, "legendgroup": "eu_accuracy", "orientation": "v", "textposition": "top center", "hovertemplate": "wiki_metric=eu_accuracy<br>input_type=%{x}<br>value=%{text}<extra></extra>" }, { "line": { "dash": "dash", "color": "#00cc96" }, "mode": "markers+lines+text", "name": "accuracy_sq", "type": "scatter", "xsrc": "ahalitaj:345:ae4dab", "ysrc": "ahalitaj:345:11d676", "xaxis": "x", "yaxis": "y", "marker": { "symbol": "circle" }, "textsrc": "ahalitaj:345:04bcfa", "showlegend": true, "legendgroup": "sq_accuracy", "orientation": "v", "textposition": "top center", "hovertemplate": "wiki_metric=sq_accuracy<br>input_type=%{x}<br>value=%{text}<extra></extra>" }, { "line": { "dash": "solid", "color": "#ab63fa" }, "mode": "markers+lines+text", "name": "precision_ca", "type": "scatter", "xsrc": "ahalitaj:345:d13c8a", "ysrc": "ahalitaj:345:81d6f5", "xaxis": "x", "yaxis": "y", "marker": { "symbol": "square" }, "textsrc": "ahalitaj:345:fb32af", "showlegend": true, "legendgroup": "ca_precision", "orientation": "v", "textposition": "top center", "hovertemplate": "wiki_metric=ca_precision<br>input_type=%{x}<br>value=%{text}<extra></extra>" }, { "line": { "dash": "dot", "color": "#FFA15A" }, "mode": "markers+lines+text", "name": "precision_eu", "type": "scatter", "xsrc": "ahalitaj:345:f0b979", "ysrc": "ahalitaj:345:308f85", "xaxis": "x", "yaxis": "y", "marker": { "symbol": "square" }, "textsrc": "ahalitaj:345:40cf89", "showlegend": true, "legendgroup": "eu_precision", "orientation": "v", "textposition": "top center", "hovertemplate": "wiki_metric=eu_precision<br>input_type=%{x}<br>value=%{text}<extra></extra>" }, { "line": { "dash": "dash", "color": "#19d3f3" }, "mode": "markers+lines+text", "name": "precision_sq", "type": "scatter", "xsrc": "ahalitaj:345:dd62f6", "ysrc": "ahalitaj:345:483b83", "xaxis": "x", "yaxis": "y", "marker": { "symbol": "square" }, "textsrc": "ahalitaj:345:37134d", "showlegend": true, "legendgroup": "sq_precision", "orientation": "v", "textposition": "top center", "hovertemplate": "wiki_metric=sq_precision<br>input_type=%{x}<br>value=%{text}<extra></extra>" }, { "line": { "dash": "solid", "color": "#FF6692" }, "mode": "markers+lines+text", "name": "recall_ca", "type": "scatter", "xsrc": "ahalitaj:345:c74aa8", "ysrc": "ahalitaj:345:22e770", "xaxis": "x", "yaxis": "y", "marker": { "symbol": "diamond" }, "textsrc": "ahalitaj:345:72197a", "showlegend": true, "legendgroup": "ca_recall", "orientation": "v", "textposition": "top center", "hovertemplate": "wiki_metric=ca_recall<br>input_type=%{x}<br>value=%{text}<extra></extra>" }, { "line": { "dash": "dot", "color": "#B6E880" }, "mode": "markers+lines+text", "name": "recall_eu", "type": "scatter", "xsrc": "ahalitaj:345:998115", "ysrc": "ahalitaj:345:2d2e5d", "xaxis": "x", "yaxis": "y", "marker": { "symbol": "diamond" }, "textsrc": "ahalitaj:345:d0ea97", "showlegend": true, "legendgroup": "eu_recall", "orientation": "v", "textposition": "top center", "hovertemplate": "wiki_metric=eu_recall<br>input_type=%{x}<br>value=%{text}<extra></extra>" }, { "line": { "dash": "dash", "color": "#FF97FF" }, "mode": "markers+lines+text", "name": "recall_sq", "type": "scatter", "xsrc": "ahalitaj:345:f0e747", "ysrc": "ahalitaj:345:9211ea", "xaxis": "x", "yaxis": "y", "marker": { "symbol": "diamond" }, "textsrc": "ahalitaj:345:a9b67b", "showlegend": true, "legendgroup": "sq_recall", "orientation": "v", "textposition": "top center", "hovertemplate": "wiki_metric=sq_recall<br>input_type=%{x}<br>value=%{text}<extra></extra>" }, { "line": { "dash": "solid", "color": "#FECB52" }, "mode": "markers+lines+text", "name": "f1-score_ca", "type": "scatter", "xsrc": "ahalitaj:345:42852b", "ysrc": "ahalitaj:345:d68503", "xaxis": "x", "yaxis": "y", "marker": { "symbol": "cross" }, "textsrc": "ahalitaj:345:3c0a26", "showlegend": true, "legendgroup": "ca_f1-score", "orientation": "v", "textposition": "top center", "hovertemplate": "wiki_metric=ca_f1-score<br>input_type=%{x}<br>value=%{text}<extra></extra>" }, { "line": { "dash": "dot", "color": "#636efa" }, "mode": "markers+lines+text", "name": "f1-score_eu", "type": "scatter", "xsrc": "ahalitaj:345:011fbe", "ysrc": "ahalitaj:345:4b807e", "xaxis": "x", "yaxis": "y", "marker": { "symbol": "cross" }, "textsrc": "ahalitaj:345:469b5e", "showlegend": true, "legendgroup": "eu_f1-score", "orientation": "v", "textposition": "top center", "hovertemplate": "wiki_metric=eu_f1-score<br>input_type=%{x}<br>value=%{text}<extra></extra>" }, { "line": { "dash": "dash", "color": "#EF553B" }, "mode": "markers+lines+text", "name": "f1-score_sq", "type": "scatter", "xsrc": "ahalitaj:345:5541bf", "ysrc": "ahalitaj:345:00e505", "xaxis": "x", "yaxis": "y", "marker": { "symbol": "cross" }, "textsrc": "ahalitaj:345:40ccd0", "showlegend": true, "legendgroup": "sq_f1-score", "orientation": "v", "textposition": "top center", "hovertemplate": "wiki_metric=sq_f1-score<br>input_type=%{x}<br>value=%{text}<extra></extra>" } ], "layout": { "title": { "text": "Classification Report for CCW by WIKI" }, "xaxis": { "title": { "text": "Input Type" }, "anchor": "y", "domain": [ 0.0, 1.0 ] }, "yaxis": { "title": { "text": "Value" }, "anchor": "x", "domain": [ 0.0, 1.0 ] }, "legend": { "title": { "text": "<b>Wiki and Metric</b>" }, "tracegroupgap": 0 }, "margin": { "t": 60 }, "template": { "data": { "bar": [ { "type": "bar", "marker": { "line": { "color": "#E5ECF6", "width": 0.5 }, "pattern": { "size": 10, "fillmode": "overlay", "solidity": 0.2 } }, "error_x": { "color": "#2a3f5f" }, "error_y": { "color": "#2a3f5f" } } ], "pie": [ { "type": "pie", "automargin": true } ], "table": [ { "type": "table", "cells": { "fill": { "color": "#EBF0F8" }, "line": { "color": "white" } }, "header": { "fill": { "color": "#C8D4E3" }, "line": { "color": "white" } } } ], "carpet": [ { "type": "carpet", "aaxis": { "gridcolor": "white", "linecolor": "white", "endlinecolor": "#2a3f5f", "minorgridcolor": "white", "startlinecolor": "#2a3f5f" }, "baxis": { "gridcolor": "white", "linecolor": "white", "endlinecolor": "#2a3f5f", "minorgridcolor": "white", "startlinecolor": "#2a3f5f" } } ], "mesh3d": [ { "type": "mesh3d", "colorbar": { "ticks": "", "outlinewidth": 0 } } ], "contour": [ { "type": "contour", "colorbar": { "ticks": "", "outlinewidth": 0 }, "colorscale": [ [ 0.0, "#0d0887" ], [ 0.1111111111111111, "#46039f" ], [ 0.2222222222222222, "#7201a8" ], [ 0.3333333333333333, "#9c179e" ], [ 0.4444444444444444, "#bd3786" ], [ 0.5555555555555556, "#d8576b" ], [ 0.6666666666666666, "#ed7953" ], [ 0.7777777777777778, "#fb9f3a" ], [ 0.8888888888888888, "#fdca26" ], [ 1.0, "#f0f921" ] ] } ], "heatmap": [ { "type": "heatmap", "colorbar": { "ticks": "", "outlinewidth": 0 }, "colorscale": [ [ 0.0, "#0d0887" ], [ 0.1111111111111111, "#46039f" ], [ 0.2222222222222222, "#7201a8" ], [ 0.3333333333333333, "#9c179e" ], [ 0.4444444444444444, "#bd3786" ], [ 0.5555555555555556, "#d8576b" ], [ 0.6666666666666666, "#ed7953" ], [ 0.7777777777777778, "#fb9f3a" ], [ 0.8888888888888888, "#fdca26" ], [ 1.0, "#f0f921" ] ] } ], "scatter": [ { "type": "scatter", "fillpattern": { "size": 10, "fillmode": "overlay", "solidity": 0.2 } } ], "surface": [ { "type": "surface", "colorbar": { "ticks": "", "outlinewidth": 0 }, "colorscale": [ [ 0.0, "#0d0887" ], [ 0.1111111111111111, "#46039f" ], [ 0.2222222222222222, "#7201a8" ], [ 0.3333333333333333, "#9c179e" ], [ 0.4444444444444444, "#bd3786" ], [ 0.5555555555555556, "#d8576b" ], [ 0.6666666666666666, "#ed7953" ], [ 0.7777777777777778, "#fb9f3a" ], [ 0.8888888888888888, "#fdca26" ], [ 1.0, "#f0f921" ] ] } ], "barpolar": [ { "type": "barpolar", "marker": { "line": { "color": "#E5ECF6", "width": 0.5 }, "pattern": { "size": 10, "fillmode": "overlay", "solidity": 0.2 } } } ], "heatmapgl": [ { "type": "heatmapgl", "colorbar": { "ticks": "", "outlinewidth": 0 }, "colorscale": [ [ 0.0, "#0d0887" ], [ 0.1111111111111111, "#46039f" ], [ 0.2222222222222222, "#7201a8" ], [ 0.3333333333333333, "#9c179e" ], [ 0.4444444444444444, "#bd3786" ], [ 0.5555555555555556, "#d8576b" ], [ 0.6666666666666666, "#ed7953" ], [ 0.7777777777777778, "#fb9f3a" ], [ 0.8888888888888888, "#fdca26" ], [ 1.0, "#f0f921" ] ] } ], "histogram": [ { "type": "histogram", "marker": { "pattern": { "size": 10, "fillmode": "overlay", "solidity": 0.2 } } } ], "parcoords": [ { "line": { "colorbar": { "ticks": "", "outlinewidth": 0 } }, "type": "parcoords" } ], "scatter3d": [ { "line": { "colorbar": { "ticks": "", "outlinewidth": 0 } }, "type": "scatter3d", "marker": { "colorbar": { "ticks": "", "outlinewidth": 0 } } } ], "scattergl": [ { "type": "scattergl", "marker": { "colorbar": { "ticks": "", "outlinewidth": 0 } } } ], "choropleth": [ { "type": "choropleth", "colorbar": { "ticks": "", "outlinewidth": 0 } } ], "scattergeo": [ { "type": "scattergeo", "marker": { "colorbar": { "ticks": "", "outlinewidth": 0 } } } ], "histogram2d": [ { "type": "histogram2d", "colorbar": { "ticks": "", "outlinewidth": 0 }, "colorscale": [ [ 0.0, "#0d0887" ], [ 0.1111111111111111, "#46039f" ], [ 0.2222222222222222, "#7201a8" ], [ 0.3333333333333333, "#9c179e" ], [ 0.4444444444444444, "#bd3786" ], [ 0.5555555555555556, "#d8576b" ], [ 0.6666666666666666, "#ed7953" ], [ 0.7777777777777778, "#fb9f3a" ], [ 0.8888888888888888, "#fdca26" ], [ 1.0, "#f0f921" ] ] } ], "scatterpolar": [ { "type": "scatterpolar", "marker": { "colorbar": { "ticks": "", "outlinewidth": 0 } } } ], "contourcarpet": [ { "type": "contourcarpet", "colorbar": { "ticks": "", "outlinewidth": 0 } } ], "scattercarpet": [ { "type": "scattercarpet", "marker": { "colorbar": { "ticks": "", "outlinewidth": 0 } } } ], "scattermapbox": [ { "type": "scattermapbox", "marker": { "colorbar": { "ticks": "", "outlinewidth": 0 } } } ], "scatterpolargl": [ { "type": "scatterpolargl", "marker": { "colorbar": { "ticks": "", "outlinewidth": 0 } } } ], "scatterternary": [ { "type": "scatterternary", "marker": { "colorbar": { "ticks": "", "outlinewidth": 0 } } } ], "histogram2dcontour": [ { "type": "histogram2dcontour", "colorbar": { "ticks": "", "outlinewidth": 0 }, "colorscale": [ [ 0.0, "#0d0887" ], [ 0.1111111111111111, "#46039f" ], [ 0.2222222222222222, "#7201a8" ], [ 0.3333333333333333, "#9c179e" ], [ 0.4444444444444444, "#bd3786" ], [ 0.5555555555555556, "#d8576b" ], [ 0.6666666666666666, "#ed7953" ], [ 0.7777777777777778, "#fb9f3a" ], [ 0.8888888888888888, "#fdca26" ], [ 1.0, "#f0f921" ] ] } ] }, "layout": { "geo": { "bgcolor": "white", "showland": true, "lakecolor": "white", "landcolor": "#E5ECF6", "showlakes": true, "subunitcolor": "white" }, "font": { "color": "#2a3f5f" }, "polar": { "bgcolor": "#E5ECF6", "radialaxis": { "ticks": "", "gridcolor": "white", "linecolor": "white" }, "angularaxis": { "ticks": "", "gridcolor": "white", "linecolor": "white" } }, "scene": { "xaxis": { "ticks": "", "gridcolor": "white", "gridwidth": 2, "linecolor": "white", "zerolinecolor": "white", "showbackground": true, "backgroundcolor": "#E5ECF6" }, "yaxis": { "ticks": "", "gridcolor": "white", "gridwidth": 2, "linecolor": "white", "zerolinecolor": "white", "showbackground": true, "backgroundcolor": "#E5ECF6" }, "zaxis": { "ticks": "", "gridcolor": "white", "gridwidth": 2, "linecolor": "white", "zerolinecolor": "white", "showbackground": true, "backgroundcolor": "#E5ECF6" } }, "title": { "x": 0.05 }, "xaxis": { "ticks": "", "title": { "standoff": 15 }, "gridcolor": "white", "linecolor": "white", "automargin": true, "zerolinecolor": "white", "zerolinewidth": 2 }, "yaxis": { "ticks": "", "title": { "standoff": 15 }, "gridcolor": "white", "linecolor": "white", "automargin": true, "zerolinecolor": "white", "zerolinewidth": 2 }, "mapbox": { "style": "light" }, "ternary": { "aaxis": { "ticks": "", "gridcolor": "white", "linecolor": "white" }, "baxis": { "ticks": "", "gridcolor": "white", "linecolor": "white" }, "caxis": { "ticks": "", "gridcolor": "white", "linecolor": "white" }, "bgcolor": "#E5ECF6" }, "colorway": [ "#636efa", "#EF553B", "#00cc96", "#ab63fa", "#FFA15A", "#19d3f3", "#FF6692", "#B6E880", "#FF97FF", "#FECB52" ], "coloraxis": { "colorbar": { "ticks": "", "outlinewidth": 0 } }, "hovermode": "closest", "colorscale": { "diverging": [ [ 0, "#8e0152" ], [ 0.1, "#c51b7d" ], [ 0.2, "#de77ae" ], [ 0.3, "#f1b6da" ], [ 0.4, "#fde0ef" ], [ 0.5, "#f7f7f7" ], [ 0.6, "#e6f5d0" ], [ 0.7, "#b8e186" ], [ 0.8, "#7fbc41" ], [ 0.9, "#4d9221" ], [ 1, "#276419" ] ], "sequential": [ [ 0.0, "#0d0887" ], [ 0.1111111111111111, "#46039f" ], [ 0.2222222222222222, "#7201a8" ], [ 0.3333333333333333, "#9c179e" ], [ 0.4444444444444444, "#bd3786" ], [ 0.5555555555555556, "#d8576b" ], [ 0.6666666666666666, "#ed7953" ], [ 0.7777777777777778, "#fb9f3a" ], [ 0.8888888888888888, "#fdca26" ], [ 1.0, "#f0f921" ] ], "sequentialminus": [ [ 0.0, "#0d0887" ], [ 0.1111111111111111, "#46039f" ], [ 0.2222222222222222, "#7201a8" ], [ 0.3333333333333333, "#9c179e" ], [ 0.4444444444444444, "#bd3786" ], [ 0.5555555555555556, "#d8576b" ], [ 0.6666666666666666, "#ed7953" ], [ 0.7777777777777778, "#fb9f3a" ], [ 0.8888888888888888, "#fdca26" ], [ 1.0, "#f0f921" ] ] }, "hoverlabel": { "align": "left" }, "plot_bgcolor": "#E5ECF6", "paper_bgcolor": "white", "shapedefaults": { "line": { "color": "#2a3f5f" } }, "autotypenumbers": "strict", "annotationdefaults": { "arrowhead": 0, "arrowcolor": "#2a3f5f", "arrowwidth": 1 } } }, "plot_bgcolor": "white" } }, "height": null, "width": null, "user": { "profile_url": "https://chart-studio.plotly.com/~ahalitaj", "avatar_url": "https://storage.googleapis.com/plotly-prod-profiles/16.jpg", "background_url": "https://storage.googleapis.com/plotly-prod-profiles/bg-13.jpg", "bio": "", "nickname": "", "website": "", "stream_tokens": null, "feature_set_id": null, "csrf_token": null, "date_joined": "2024-02-27 16:00:12", "mapbox_access_tokens": null, "has_password": null, "username": "ahalitaj", "email": null, "is_active": null, "readonly": null, "is_dash_creator": null, "dash_created_count": null, "is_chart_creator": null, "charts_created_count": null } }, { "creation_time": "2024-04-03T22:15:56.068325Z", "comments": { "results": [], "count": 0 }, "parented": true, "embed_url": "https://chart-studio.plotly.com/~ahalitaj/342.embed", "fid": "ahalitaj:342", "filename": "Confusion Matrix for CCW by WIKI test", "filetype": "plot", "img_url": "https://storage.googleapis.com/plotly-prod-images/ahalitaj/342/9_O8MV525QMSMIIWQZGD3MRQXXL6SDOI.png", "image_urls": { "default": "https://storage.googleapis.com/plotly-prod-images/ahalitaj/342/2_GAEJH06UQR3PVPACEVUQCGKJTNUH7Y.png", "block-thumb": "https://storage.googleapis.com/plotly-prod-images/ahalitaj/342/8_68807LKBRR6E2QR581220V6GWG5WE2.png", "list-thumb": "https://storage.googleapis.com/plotly-prod-images/ahalitaj/342/9_O8MV525QMSMIIWQZGD3MRQXXL6SDOI.png" }, "api_urls": { "files": "https://api.plotly.com/v2/files/ahalitaj:342", "plots": "https://api.plotly.com/v2/plots/ahalitaj:342", "parent": "https://api.plotly.com/v2/folders/home?user=ahalitaj" }, "owner": "ahalitaj", "parent": -1, "preview": "", "referencers": [], "references": [], "title": "", "views": 2, "web_url": "https://chart-studio.plotly.com/~ahalitaj/342/", "world_readable": true, "date_modified": "2024-04-05T11:59:55.010Z", "stars": { "results": [], "count": 0 }, "collaborators": { "results": [], "count": 0 }, "subfolder_count": null, "refresh_interval": null, "organize_view_url": "https://chart-studio.plotly.com/~ahalitaj/342/", "current_user_permission": "read", "is_theme": null, "is_template": null, "autosize": true, "caption": "", "figure": { "data": [ { "line": { "dash": "solid", "color": "#636efa" }, "mode": "markers+lines+text", "name": "TN_ca", "type": "scatter", "xsrc": "ahalitaj:346:98adab", "ysrc": "ahalitaj:346:41928e", "xaxis": "x", "yaxis": "y", "marker": { "symbol": "circle" }, "textsrc": "ahalitaj:346:1dbb26", "showlegend": true, "legendgroup": "ca_TN", "orientation": "v", "textposition": "top center", "hovertemplate": "wiki_metric=ca_TN<br>input_type=%{x}<br>value=%{text}<extra></extra>" }, { "line": { "dash": "dot", "color": "#EF553B" }, "mode": "markers+lines+text", "name": "TN_eu", "type": "scatter", "xsrc": "ahalitaj:346:fdab32", "ysrc": "ahalitaj:346:34af1a", "xaxis": "x", "yaxis": "y", "marker": { "symbol": "circle" }, "textsrc": "ahalitaj:346:bec162", "showlegend": true, "legendgroup": "eu_TN", "orientation": "v", "textposition": "top center", "hovertemplate": "wiki_metric=eu_TN<br>input_type=%{x}<br>value=%{text}<extra></extra>" }, { "line": { "dash": "dash", "color": "#00cc96" }, "mode": "markers+lines+text", "name": "TN_sq", "type": "scatter", "xsrc": "ahalitaj:346:702247", "ysrc": "ahalitaj:346:ca1f55", "xaxis": "x", "yaxis": "y", "marker": { "symbol": "circle" }, "textsrc": "ahalitaj:346:f5a23c", "showlegend": true, "legendgroup": "sq_TN", "orientation": "v", "textposition": "top center", "hovertemplate": "wiki_metric=sq_TN<br>input_type=%{x}<br>value=%{text}<extra></extra>" }, { "line": { "dash": "solid", "color": "#ab63fa" }, "mode": "markers+lines+text", "name": "FP_ca", "type": "scatter", "xsrc": "ahalitaj:346:b15401", "ysrc": "ahalitaj:346:189fa1", "xaxis": "x", "yaxis": "y", "marker": { "symbol": "square" }, "textsrc": "ahalitaj:346:d33d6e", "showlegend": true, "legendgroup": "ca_FP", "orientation": "v", "textposition": "top center", "hovertemplate": "wiki_metric=ca_FP<br>input_type=%{x}<br>value=%{text}<extra></extra>" }, { "line": { "dash": "dot", "color": "#FFA15A" }, "mode": "markers+lines+text", "name": "FP_eu", "type": "scatter", "xsrc": "ahalitaj:346:5a3a58", "ysrc": "ahalitaj:346:c70527", "xaxis": "x", "yaxis": "y", "marker": { "symbol": "square" }, "textsrc": "ahalitaj:346:5833d7", "showlegend": true, "legendgroup": "eu_FP", "orientation": "v", "textposition": "top center", "hovertemplate": "wiki_metric=eu_FP<br>input_type=%{x}<br>value=%{text}<extra></extra>" }, { "line": { "dash": "dash", "color": "#19d3f3" }, "mode": "markers+lines+text", "name": "FP_sq", "type": "scatter", "xsrc": "ahalitaj:346:755e4e", "ysrc": "ahalitaj:346:98383f", "xaxis": "x", "yaxis": "y", "marker": { "symbol": "square" }, "textsrc": "ahalitaj:346:f0f2bc", "showlegend": true, "legendgroup": "sq_FP", "orientation": "v", "textposition": "top center", "hovertemplate": "wiki_metric=sq_FP<br>input_type=%{x}<br>value=%{text}<extra></extra>" }, { "line": { "dash": "solid", "color": "#FF6692" }, "mode": "markers+lines+text", "name": "FN_ca", "type": "scatter", "xsrc": "ahalitaj:346:e7ed81", "ysrc": "ahalitaj:346:c50d60", "xaxis": "x", "yaxis": "y", "marker": { "symbol": "diamond" }, "textsrc": "ahalitaj:346:a82619", "showlegend": true, "legendgroup": "ca_FN", "orientation": "v", "textposition": "top center", "hovertemplate": "wiki_metric=ca_FN<br>input_type=%{x}<br>value=%{text}<extra></extra>" }, { "line": { "dash": "dot", "color": "#B6E880" }, "mode": "markers+lines+text", "name": "FN_eu", "type": "scatter", "xsrc": "ahalitaj:346:213845", "ysrc": "ahalitaj:346:c36861", "xaxis": "x", "yaxis": "y", "marker": { "symbol": "diamond" }, "textsrc": "ahalitaj:346:8b86f6", "showlegend": true, "legendgroup": "eu_FN", "orientation": "v", "textposition": "top center", "hovertemplate": "wiki_metric=eu_FN<br>input_type=%{x}<br>value=%{text}<extra></extra>" }, { "line": { "dash": "dash", "color": "#FF97FF" }, "mode": "markers+lines+text", "name": "FN_sq", "type": "scatter", "xsrc": "ahalitaj:346:d45408", "ysrc": "ahalitaj:346:47ae63", "xaxis": "x", "yaxis": "y", "marker": { "symbol": "diamond" }, "textsrc": "ahalitaj:346:e90632", "showlegend": true, "legendgroup": "sq_FN", "orientation": "v", "textposition": "top center", "hovertemplate": "wiki_metric=sq_FN<br>input_type=%{x}<br>value=%{text}<extra></extra>" }, { "line": { "dash": "solid", "color": "#FECB52" }, "mode": "markers+lines+text", "name": "TP_ca", "type": "scatter", "xsrc": "ahalitaj:346:7fc996", "ysrc": "ahalitaj:346:beec9c", "xaxis": "x", "yaxis": "y", "marker": { "symbol": "cross" }, "textsrc": "ahalitaj:346:ddf139", "showlegend": true, "legendgroup": "ca_TP", "orientation": "v", "textposition": "top center", "hovertemplate": "wiki_metric=ca_TP<br>input_type=%{x}<br>value=%{text}<extra></extra>" }, { "line": { "dash": "dot", "color": "#636efa" }, "mode": "markers+lines+text", "name": "TP_eu", "type": "scatter", "xsrc": "ahalitaj:346:e53564", "ysrc": "ahalitaj:346:4f1a6a", "xaxis": "x", "yaxis": "y", "marker": { "symbol": "cross" }, "textsrc": "ahalitaj:346:a57cb9", "showlegend": true, "legendgroup": "eu_TP", "orientation": "v", "textposition": "top center", "hovertemplate": "wiki_metric=eu_TP<br>input_type=%{x}<br>value=%{text}<extra></extra>" }, { "line": { "dash": "dash", "color": "#EF553B" }, "mode": "markers+lines+text", "name": "TP_sq", "type": "scatter", "xsrc": "ahalitaj:346:a6457f", "ysrc": "ahalitaj:346:2593b0", "xaxis": "x", "yaxis": "y", "marker": { "symbol": "cross" }, "textsrc": "ahalitaj:346:ad6e55", "showlegend": true, "legendgroup": "sq_TP", "orientation": "v", "textposition": "top center", "hovertemplate": "wiki_metric=sq_TP<br>input_type=%{x}<br>value=%{text}<extra></extra>" } ], "layout": { "title": { "text": "Confusion Matrix for CCW by WIKI" }, "xaxis": { "title": { "text": "Input Type" }, "anchor": "y", "domain": [ 0.0, 1.0 ] }, "yaxis": { "title": { "text": "Value" }, "anchor": "x", "domain": [ 0.0, 1.0 ] }, "legend": { "title": { "text": "<b>Wiki and Metric</b>" }, "tracegroupgap": 0 }, "margin": { "t": 60 }, "template": { "data": { "bar": [ { "type": "bar", "marker": { "line": { "color": "#E5ECF6", "width": 0.5 }, "pattern": { "size": 10, "fillmode": "overlay", "solidity": 0.2 } }, "error_x": { "color": "#2a3f5f" }, "error_y": { "color": "#2a3f5f" } } ], "pie": [ { "type": "pie", "automargin": true } ], "table": [ { "type": "table", "cells": { "fill": { "color": "#EBF0F8" }, "line": { "color": "white" } }, "header": { "fill": { "color": "#C8D4E3" }, "line": { "color": "white" } } } ], "carpet": [ { "type": "carpet", "aaxis": { "gridcolor": "white", "linecolor": "white", "endlinecolor": "#2a3f5f", "minorgridcolor": "white", "startlinecolor": "#2a3f5f" }, "baxis": { "gridcolor": "white", "linecolor": "white", "endlinecolor": "#2a3f5f", "minorgridcolor": "white", "startlinecolor": "#2a3f5f" } } ], "mesh3d": [ { "type": "mesh3d", "colorbar": { "ticks": "", "outlinewidth": 0 } } ], "contour": [ { "type": "contour", "colorbar": { "ticks": "", "outlinewidth": 0 }, "colorscale": [ [ 0.0, "#0d0887" ], [ 0.1111111111111111, "#46039f" ], [ 0.2222222222222222, "#7201a8" ], [ 0.3333333333333333, "#9c179e" ], [ 0.4444444444444444, "#bd3786" ], [ 0.5555555555555556, "#d8576b" ], [ 0.6666666666666666, "#ed7953" ], [ 0.7777777777777778, "#fb9f3a" ], [ 0.8888888888888888, "#fdca26" ], [ 1.0, "#f0f921" ] ] } ], "heatmap": [ { "type": "heatmap", "colorbar": { "ticks": "", "outlinewidth": 0 }, "colorscale": [ [ 0.0, "#0d0887" ], [ 0.1111111111111111, "#46039f" ], [ 0.2222222222222222, "#7201a8" ], [ 0.3333333333333333, "#9c179e" ], [ 0.4444444444444444, "#bd3786" ], [ 0.5555555555555556, "#d8576b" ], [ 0.6666666666666666, "#ed7953" ], [ 0.7777777777777778, "#fb9f3a" ], [ 0.8888888888888888, "#fdca26" ], [ 1.0, "#f0f921" ] ] } ], "scatter": [ { "type": "scatter", "fillpattern": { "size": 10, "fillmode": "overlay", "solidity": 0.2 } } ], "surface": [ { "type": "surface", "colorbar": { "ticks": "", "outlinewidth": 0 }, "colorscale": [ [ 0.0, "#0d0887" ], [ 0.1111111111111111, "#46039f" ], [ 0.2222222222222222, "#7201a8" ], [ 0.3333333333333333, "#9c179e" ], [ 0.4444444444444444, "#bd3786" ], [ 0.5555555555555556, "#d8576b" ], [ 0.6666666666666666, "#ed7953" ], [ 0.7777777777777778, "#fb9f3a" ], [ 0.8888888888888888, "#fdca26" ], [ 1.0, "#f0f921" ] ] } ], "barpolar": [ { "type": "barpolar", "marker": { "line": { "color": "#E5ECF6", "width": 0.5 }, "pattern": { "size": 10, "fillmode": "overlay", "solidity": 0.2 } } } ], "heatmapgl": [ { "type": "heatmapgl", "colorbar": { "ticks": "", "outlinewidth": 0 }, "colorscale": [ [ 0.0, "#0d0887" ], [ 0.1111111111111111, "#46039f" ], [ 0.2222222222222222, "#7201a8" ], [ 0.3333333333333333, "#9c179e" ], [ 0.4444444444444444, "#bd3786" ], [ 0.5555555555555556, "#d8576b" ], [ 0.6666666666666666, "#ed7953" ], [ 0.7777777777777778, "#fb9f3a" ], [ 0.8888888888888888, "#fdca26" ], [ 1.0, "#f0f921" ] ] } ], "histogram": [ { "type": "histogram", "marker": { "pattern": { "size": 10, "fillmode": "overlay", "solidity": 0.2 } } } ], "parcoords": [ { "line": { "colorbar": { "ticks": "", "outlinewidth": 0 } }, "type": "parcoords" } ], "scatter3d": [ { "line": { "colorbar": { "ticks": "", "outlinewidth": 0 } }, "type": "scatter3d", "marker": { "colorbar": { "ticks": "", "outlinewidth": 0 } } } ], "scattergl": [ { "type": "scattergl", "marker": { "colorbar": { "ticks": "", "outlinewidth": 0 } } } ], "choropleth": [ { "type": "choropleth", "colorbar": { "ticks": "", "outlinewidth": 0 } } ], "scattergeo": [ { "type": "scattergeo", "marker": { "colorbar": { "ticks": "", "outlinewidth": 0 } } } ], "histogram2d": [ { "type": "histogram2d", "colorbar": { "ticks": "", "outlinewidth": 0 }, "colorscale": [ [ 0.0, "#0d0887" ], [ 0.1111111111111111, "#46039f" ], [ 0.2222222222222222, "#7201a8" ], [ 0.3333333333333333, "#9c179e" ], [ 0.4444444444444444, "#bd3786" ], [ 0.5555555555555556, "#d8576b" ], [ 0.6666666666666666, "#ed7953" ], [ 0.7777777777777778, "#fb9f3a" ], [ 0.8888888888888888, "#fdca26" ], [ 1.0, "#f0f921" ] ] } ], "scatterpolar": [ { "type": "scatterpolar", "marker": { "colorbar": { "ticks": "", "outlinewidth": 0 } } } ], "contourcarpet": [ { "type": "contourcarpet", "colorbar": { "ticks": "", "outlinewidth": 0 } } ], "scattercarpet": [ { "type": "scattercarpet", "marker": { "colorbar": { "ticks": "", "outlinewidth": 0 } } } ], "scattermapbox": [ { "type": "scattermapbox", "marker": { "colorbar": { "ticks": "", "outlinewidth": 0 } } } ], "scatterpolargl": [ { "type": "scatterpolargl", "marker": { "colorbar": { "ticks": "", "outlinewidth": 0 } } } ], "scatterternary": [ { "type": "scatterternary", "marker": { "colorbar": { "ticks": "", "outlinewidth": 0 } } } ], "histogram2dcontour": [ { "type": "histogram2dcontour", "colorbar": { "ticks": "", "outlinewidth": 0 }, "colorscale": [ [ 0.0, "#0d0887" ], [ 0.1111111111111111, "#46039f" ], [ 0.2222222222222222, "#7201a8" ], [ 0.3333333333333333, "#9c179e" ], [ 0.4444444444444444, "#bd3786" ], [ 0.5555555555555556, "#d8576b" ], [ 0.6666666666666666, "#ed7953" ], [ 0.7777777777777778, "#fb9f3a" ], [ 0.8888888888888888, "#fdca26" ], [ 1.0, "#f0f921" ] ] } ] }, "layout": { "geo": { "bgcolor": "white", "showland": true, "lakecolor": "white", "landcolor": "#E5ECF6", "showlakes": true, "subunitcolor": "white" }, "font": { "color": "#2a3f5f" }, "polar": { "bgcolor": "#E5ECF6", "radialaxis": { "ticks": "", "gridcolor": "white", "linecolor": "white" }, "angularaxis": { "ticks": "", "gridcolor": "white", "linecolor": "white" } }, "scene": { "xaxis": { "ticks": "", "gridcolor": "white", "gridwidth": 2, "linecolor": "white", "zerolinecolor": "white", "showbackground": true, "backgroundcolor": "#E5ECF6" }, "yaxis": { "ticks": "", "gridcolor": "white", "gridwidth": 2, "linecolor": "white", "zerolinecolor": "white", "showbackground": true, "backgroundcolor": "#E5ECF6" }, "zaxis": { "ticks": "", "gridcolor": "white", "gridwidth": 2, "linecolor": "white", "zerolinecolor": "white", "showbackground": true, "backgroundcolor": "#E5ECF6" } }, "title": { "x": 0.05 }, "xaxis": { "ticks": "", "title": { "standoff": 15 }, "gridcolor": "white", "linecolor": "white", "automargin": true, "zerolinecolor": "white", "zerolinewidth": 2 }, "yaxis": { "ticks": "", "title": { "standoff": 15 }, "gridcolor": "white", "linecolor": "white", "automargin": true, "zerolinecolor": "white", "zerolinewidth": 2 }, "mapbox": { "style": "light" }, "ternary": { "aaxis": { "ticks": "", "gridcolor": "white", "linecolor": "white" }, "baxis": { "ticks": "", "gridcolor": "white", "linecolor": "white" }, "caxis": { "ticks": "", "gridcolor": "white", "linecolor": "white" }, "bgcolor": "#E5ECF6" }, "colorway": [ "#636efa", "#EF553B", "#00cc96", "#ab63fa", "#FFA15A", "#19d3f3", "#FF6692", "#B6E880", "#FF97FF", "#FECB52" ], "coloraxis": { "colorbar": { "ticks": "", "outlinewidth": 0 } }, "hovermode": "closest", "colorscale": { "diverging": [ [ 0, "#8e0152" ], [ 0.1, "#c51b7d" ], [ 0.2, "#de77ae" ], [ 0.3, "#f1b6da" ], [ 0.4, "#fde0ef" ], [ 0.5, "#f7f7f7" ], [ 0.6, "#e6f5d0" ], [ 0.7, "#b8e186" ], [ 0.8, "#7fbc41" ], [ 0.9, "#4d9221" ], [ 1, "#276419" ] ], "sequential": [ [ 0.0, "#0d0887" ], [ 0.1111111111111111, "#46039f" ], [ 0.2222222222222222, "#7201a8" ], [ 0.3333333333333333, "#9c179e" ], [ 0.4444444444444444, "#bd3786" ], [ 0.5555555555555556, "#d8576b" ], [ 0.6666666666666666, "#ed7953" ], [ 0.7777777777777778, "#fb9f3a" ], [ 0.8888888888888888, "#fdca26" ], [ 1.0, "#f0f921" ] ], "sequentialminus": [ [ 0.0, "#0d0887" ], [ 0.1111111111111111, "#46039f" ], [ 0.2222222222222222, "#7201a8" ], [ 0.3333333333333333, "#9c179e" ], [ 0.4444444444444444, "#bd3786" ], [ 0.5555555555555556, "#d8576b" ], [ 0.6666666666666666, "#ed7953" ], [ 0.7777777777777778, "#fb9f3a" ], [ 0.8888888888888888, "#fdca26" ], [ 1.0, "#f0f921" ] ] }, "hoverlabel": { "align": "left" }, "plot_bgcolor": "#E5ECF6", "paper_bgcolor": "white", "shapedefaults": { "line": { "color": "#2a3f5f" } }, "autotypenumbers": "strict", "annotationdefaults": { "arrowhead": 0, "arrowcolor": "#2a3f5f", "arrowwidth": 1 } } }, "plot_bgcolor": "white" } }, "height": null, "width": null, "user": { "profile_url": "https://chart-studio.plotly.com/~ahalitaj", "avatar_url": "https://storage.googleapis.com/plotly-prod-profiles/16.jpg", "background_url": "https://storage.googleapis.com/plotly-prod-profiles/bg-13.jpg", "bio": "", "nickname": "", "website": "", "stream_tokens": null, "feature_set_id": null, "csrf_token": null, "date_joined": "2024-02-27 16:00:12", "mapbox_access_tokens": null, "has_password": null, "username": "ahalitaj", "email": null, "is_active": null, "readonly": null, "is_dash_creator": null, "dash_created_count": null, "is_chart_creator": null, "charts_created_count": null } }, { "creation_time": "2024-04-03T21:55:07.508364Z", "comments": { "results": [], "count": 0 }, "parented": true, "embed_url": "https://chart-studio.plotly.com/~yuricalil/65.embed", "fid": "yuricalil:65", "filename": "domestic use mills cotton", "filetype": "plot", "img_url": "https://storage.googleapis.com/plotly-prod-images/yuricalil/65/9_HQX19JSIEYMXA0QUO9MKAHQMJISCLS.png", "image_urls": { "default": "https://storage.googleapis.com/plotly-prod-images/yuricalil/65/2_5CU361QNFLKZE0DTSKSK64ARR1XLLQ.png", "block-thumb": "https://storage.googleapis.com/plotly-prod-images/yuricalil/65/8_PHHEN7XU11YIMBL876823VF372LUOX.png", "list-thumb": "https://storage.googleapis.com/plotly-prod-images/yuricalil/65/9_HQX19JSIEYMXA0QUO9MKAHQMJISCLS.png" }, "api_urls": { "files": "https://api.plotly.com/v2/files/yuricalil:65", "plots": "https://api.plotly.com/v2/plots/yuricalil:65", "parent": "https://api.plotly.com/v2/folders/home?user=yuricalil" }, "owner": "yuricalil", "parent": -1, "preview": "", "referencers": [], "references": [], "title": "", "views": 1, "web_url": "https://chart-studio.plotly.com/~yuricalil/65/", "world_readable": true, "date_modified": "2024-08-23T21:36:46.527Z", "stars": { "results": [], "count": 0 }, "collaborators": { "results": [], "count": 0 }, "subfolder_count": null, "refresh_interval": null, "organize_view_url": "https://chart-studio.plotly.com/~yuricalil/65/", "current_user_permission": "read", "is_theme": null, "is_template": false, "autosize": true, "caption": "", "figure": { "data": [ { "line": { "color": "rgb(10, 49, 97)", "width": 8 }, "meta": { "columnNames": { "x": "Year", "y": "Domestic Use US" } }, "mode": "lines", "name": "U.S.", "type": "scatter", "xsrc": "yuricalil:64:cc9a42", "ysrc": "yuricalil:64:7009bb" }, { "line": { "color": "rgb(0, 151, 57)", "width": 8 }, "meta": { "columnNames": { "x": "Year", "y": "Domestic Use BR" } }, "mode": "lines", "name": "Brazil", "type": "scatter", "xsrc": "yuricalil:64:cc9a42", "ysrc": "yuricalil:64:3c864c", "stackgroup": null } ], "frames": [], "layout": { "font": { "size": 26 }, "title": { "font": { "size": 16 } }, "xaxis": { "type": "linear", "range": [ 1990, 2024 ], "title": { "font": { "size": 25, "color": "rgb(0, 0, 0)" } }, "nticks": 34, "showline": false, "tickfont": { "size": 25, "color": "rgb(0, 0, 0)" }, "autorange": true, "gridwidth": 1 }, "yaxis": { "type": "linear", "dtick": 12, "range": [ -168.8235294117647, 13192.35294117647 ], "tick0": 12, "title": { "font": { "size": 25, "color": "rgb(0, 0, 0)" }, "text": "1,000 480 lb. Bales" }, "nticks": 13, "tickfont": { "size": 25, "color": "rgb(0, 0, 0)" }, "tickmode": "auto", "autorange": true }, "images": [], "legend": { "x": 0.8186873458137615, "y": 1.1271235931195585, "font": { "size": 24, "color": "rgb(0, 0, 0)" }, "title": { "font": { "size": 18 }, "text": "<br>" } }, "shapes": [ { "x0": 1995, "x1": 1995, "y0": 0, "y1": 13000, "line": { "color": "rgb(0, 0, 0)", "width": 7 }, "type": "line", "opacity": 1, "fillcolor": "#7f7f7f" } ], "autosize": true, "template": { "data": { "bar": [ { "type": "bar", "marker": { "colorbar": { "ticks": "", "outlinewidth": 0 } } } ], "table": [ { "type": "table", "cells": { "fill": { "color": "#EBF0F8" }, "line": { "color": "white" } }, "header": { "fill": { "color": "#C8D4E3" }, "line": { "color": "white" } } } ], "carpet": [ { "type": "carpet", "aaxis": { "gridcolor": "#C8D4E3", "linecolor": "#C8D4E3", "endlinecolor": "#2a3f5f", "minorgridcolor": "#C8D4E3", "startlinecolor": "#2a3f5f" }, "baxis": { "gridcolor": "#C8D4E3", "linecolor": "#C8D4E3", "endlinecolor": "#2a3f5f", "minorgridcolor": "#C8D4E3", "startlinecolor": "#2a3f5f" } } ], "mesh3d": [ { "type": "mesh3d", "colorbar": { "ticks": "", "outlinewidth": 0 } } ], "contour": [ { "type": "contour", "colorbar": { "ticks": "", "outlinewidth": 0 }, "autocolorscale": true } ], "heatmap": [ { "type": "heatmap", "colorbar": { "ticks": "", "outlinewidth": 0 }, "autocolorscale": true } ], "scatter": [ { "type": "scatter", "marker": { "colorbar": { "ticks": "", "outlinewidth": 0 } } } ], "surface": [ { "type": "surface", "colorbar": { "ticks": "", "outlinewidth": 0 } } ], "heatmapgl": [ { "type": "heatmapgl", "colorbar": { "ticks": "", "outlinewidth": 0 } } ], "histogram": [ { "type": "histogram", "marker": { "colorbar": { "ticks": "", "outlinewidth": 0 } } } ], "parcoords": [ { "line": { "colorbar": { "ticks": "", "outlinewidth": 0 } }, "type": "parcoords" } ], "scatter3d": [ { "type": "scatter3d", "marker": { "colorbar": { "ticks": "", "outlinewidth": 0 } } } ], "scattergl": [ { "type": "scattergl", "marker": { "colorbar": { "ticks": "", "outlinewidth": 0 } } } ], "choropleth": [ { "type": "choropleth", "colorbar": { "ticks": "", "outlinewidth": 0 } } ], "scattergeo": [ { "type": "scattergeo", "marker": { "colorbar": { "ticks": "", "outlinewidth": 0 } } } ], "histogram2d": [ { "type": "histogram2d", "colorbar": { "ticks": "", "outlinewidth": 0 }, "autocolorscale": true } ], "scatterpolar": [ { "type": "scatterpolar", "marker": { "colorbar": { "ticks": "", "outlinewidth": 0 } } } ], "contourcarpet": [ { "type": "contourcarpet", "colorbar": { "ticks": "", "outlinewidth": 0 } } ], "scattercarpet": [ { "type": "scattercarpet", "marker": { "colorbar": { "ticks": "", "outlinewidth": 0 } } } ], "scattermapbox": [ { "type": "scattermapbox", "marker": { "colorbar": { "ticks": "", "outlinewidth": 0 } } } ], "scatterpolargl": [ { "type": "scatterpolargl", "marker": { "colorbar": { "ticks": "", "outlinewidth": 0 } } } ], "scatterternary": [ { "type": "scatterternary", "marker": { "colorbar": { "ticks": "", "outlinewidth": 0 } } } ], "histogram2dcontour": [ { "type": "histogram2dcontour", "colorbar": { "ticks": "", "outlinewidth": 0 }, "autocolorscale": true } ] }, "layout": { "geo": { "bgcolor": "white", "showland": true, "lakecolor": "white", "landcolor": "white", "showlakes": true, "subunitcolor": "#C8D4E3" }, "font": { "color": "#2a3f5f" }, "polar": { "bgcolor": "white", "radialaxis": { "ticks": "", "gridcolor": "#EBF0F8", "linecolor": "#EBF0F8" }, "angularaxis": { "ticks": "", "gridcolor": "#EBF0F8", "linecolor": "#EBF0F8" } }, "scene": { "xaxis": { "ticks": "", "gridcolor": "#DFE8F3", "gridwidth": 2, "linecolor": "#EBF0F8", "zerolinecolor": "#EBF0F8", "showbackground": true, "backgroundcolor": "white" }, "yaxis": { "ticks": "", "gridcolor": "#DFE8F3", "gridwidth": 2, "linecolor": "#EBF0F8", "zerolinecolor": "#EBF0F8", "showbackground": true, "backgroundcolor": "white" }, "zaxis": { "ticks": "", "gridcolor": "#DFE8F3", "gridwidth": 2, "linecolor": "#EBF0F8", "zerolinecolor": "#EBF0F8", "showbackground": true, "backgroundcolor": "white" } }, "title": { "x": 0.05 }, "xaxis": { "ticks": "", "gridcolor": "#EBF0F8", "linecolor": "#EBF0F8", "automargin": true, "zerolinecolor": "#EBF0F8", "zerolinewidth": 2 }, "yaxis": { "ticks": "", "gridcolor": "#EBF0F8", "linecolor": "#EBF0F8", "automargin": true, "zerolinecolor": "#EBF0F8", "zerolinewidth": 2 }, "ternary": { "aaxis": { "ticks": "", "gridcolor": "#DFE8F3", "linecolor": "#A2B1C6" }, "baxis": { "ticks": "", "gridcolor": "#DFE8F3", "linecolor": "#A2B1C6" }, "caxis": { "ticks": "", "gridcolor": "#DFE8F3", "linecolor": "#A2B1C6" }, "bgcolor": "white" }, "colorway": [ "#636efa", "#EF553B", "#00cc96", "#ab63fa", "#19d3f3", "#e763fa", "#fecb52", "#ffa15a", "#ff6692", "#b6e880" ], "hovermode": "closest", "colorscale": { "diverging": [ [ 0, "#8e0152" ], [ 0.1, "#c51b7d" ], [ 0.2, "#de77ae" ], [ 0.3, "#f1b6da" ], [ 0.4, "#fde0ef" ], [ 0.5, "#f7f7f7" ], [ 0.6, "#e6f5d0" ], [ 0.7, "#b8e186" ], [ 0.8, "#7fbc41" ], [ 0.9, "#4d9221" ], [ 1, "#276419" ] ], "sequential": [ [ 0, "#0508b8" ], [ 0.0893854748603352, "#1910d8" ], [ 0.1787709497206704, "#3c19f0" ], [ 0.2681564245810056, "#6b1cfb" ], [ 0.3575418994413408, "#981cfd" ], [ 0.44692737430167595, "#bf1cfd" ], [ 0.5363128491620112, "#dd2bfd" ], [ 0.6256983240223464, "#f246fe" ], [ 0.7150837988826816, "#fc67fd" ], [ 0.8044692737430168, "#fe88fc" ], [ 0.8938547486033519, "#fea5fd" ], [ 0.9832402234636871, "#febefe" ], [ 1, "#fec3fe" ] ], "sequentialminus": [ [ 0, "#0508b8" ], [ 0.0893854748603352, "#1910d8" ], [ 0.1787709497206704, "#3c19f0" ], [ 0.2681564245810056, "#6b1cfb" ], [ 0.3575418994413408, "#981cfd" ], [ 0.44692737430167595, "#bf1cfd" ], [ 0.5363128491620112, "#dd2bfd" ], [ 0.6256983240223464, "#f246fe" ], [ 0.7150837988826816, "#fc67fd" ], [ 0.8044692737430168, "#fe88fc" ], [ 0.8938547486033519, "#fea5fd" ], [ 0.9832402234636871, "#febefe" ], [ 1, "#fec3fe" ] ] }, "plot_bgcolor": "white", "paper_bgcolor": "white", "shapedefaults": { "line": { "width": 0 }, "opacity": 0.4, "fillcolor": "#506784" }, "annotationdefaults": { "arrowhead": 0, "arrowcolor": "#506784", "arrowwidth": 1 } }, "themeRef": "PLOTLY_WHITE" }, "showlegend": true, "annotations": [ { "x": 1996, "y": 12300, "font": { "size": 24, "color": "rgb(0, 0, 0)" }, "text": "ATC", "showarrow": false } ] } }, "height": null, "width": null, "user": { "profile_url": "https://chart-studio.plotly.com/~yuricalil", "avatar_url": "https://storage.googleapis.com/plotly-prod-profiles/68.jpg", "background_url": "https://storage.googleapis.com/plotly-prod-profiles/bg-10.jpg", "bio": "", "nickname": "", "website": "", "stream_tokens": null, "feature_set_id": null, "csrf_token": null, "date_joined": "2023-07-18 20:55:07", "mapbox_access_tokens": null, "has_password": null, "username": "yuricalil", "email": null, "is_active": null, "readonly": null, "is_dash_creator": null, "dash_created_count": null, "is_chart_creator": null, "charts_created_count": null } }, { "creation_time": "2024-04-03T21:46:11.337112Z", "comments": { "results": [], "count": 0 }, "parented": true, "embed_url": "https://chart-studio.plotly.com/~ef4taq/19.embed", "fid": "ef4taq:19", "filename": "367448265 | S44 | 2021 | 120s | OP", "filetype": "plot", "img_url": "https://storage.googleapis.com/plotly-prod-images/ef4taq/19/9_33ZOUDV1H217NHVX2SCXAIPSMBWP5V.png", "image_urls": { "default": "https://storage.googleapis.com/plotly-prod-images/ef4taq/19/2_1L19TSTYYDM2DD67TU2B0GCSH5KVQ2.png", "block-thumb": "https://storage.googleapis.com/plotly-prod-images/ef4taq/19/8_5PW7T684JPOBBJJKF4KG2U2FY356W0.png", "list-thumb": "https://storage.googleapis.com/plotly-prod-images/ef4taq/19/9_33ZOUDV1H217NHVX2SCXAIPSMBWP5V.png" }, "api_urls": { "files": "https://api.plotly.com/v2/files/ef4taq:19", "plots": "https://api.plotly.com/v2/plots/ef4taq:19", "parent": "https://api.plotly.com/v2/folders/home?user=ef4taq" }, "owner": "ef4taq", "parent": -1, "preview": "", "referencers": [], "references": [], "title": "", "views": 1, "web_url": "https://chart-studio.plotly.com/~ef4taq/19/", "world_readable": true, "date_modified": "2024-04-03T21:46:11.348Z", "stars": { "results": [], "count": 0 }, "collaborators": { "results": [], "count": 0 }, "subfolder_count": null, "refresh_interval": null, "organize_view_url": "https://chart-studio.plotly.com/~ef4taq/19/", "current_user_permission": "read", "is_theme": null, "is_template": false, "autosize": true, "caption": "", "figure": { "data": [ { "meta": { "columnNames": { "x": "A", "y": "B", "error_y": { "array": "C" } } }, "mode": "markers", "name": "Bα Subsys", "type": "scatter", "xsrc": "ef4taq:18:a530fe", "ysrc": "ef4taq:18:12775a", "error_y": { "meta": { "columnNames": { "array": "C" } }, "type": "data", "visible": true, "arraysrc": "ef4taq:18:64521f", "symmetric": true } }, { "meta": { "columnNames": { "x": "H", "y": "I", "error_y": { "array": "J" } } }, "mode": "markers", "name": "Bβ Subsys<br>", "type": "scatter", "xsrc": "ef4taq:18:097b34", "ysrc": "ef4taq:18:0eabd7", "error_y": { "meta": { "columnNames": { "array": "J" } }, "type": "data", "visible": true, "arraysrc": "ef4taq:18:6f11c9", "symmetric": true }, "stackgroup": null } ], "frames": [], "layout": { "title": { "text": "TIC 367448265 | TESS Sector 44 | 2021 | SPOC | 120s | O-P" }, "xaxis": { "type": "linear", "range": [ -0.811827153378863, 25.283901116678866 ], "title": { "text": "t_midpoint [-2500; D]" }, "autorange": true }, "yaxis": { "type": "linear", "range": [ -1.8670556421316666, 0.2961448405016667 ], "title": { "text": "O-P [min]" }, "autorange": true }, "autosize": true, "template": { "data": { "bar": [ { "type": "bar", "marker": { "colorbar": { "ticks": "", "outlinewidth": 0 } } } ], "table": [ { "type": "table", "cells": { "fill": { "color": "#EBF0F8" }, "line": { "color": "white" } }, "header": { "fill": { "color": "#C8D4E3" }, "line": { "color": "white" } } } ], "carpet": [ { "type": "carpet", "aaxis": { "gridcolor": "#C8D4E3", "linecolor": "#C8D4E3", "endlinecolor": "#2a3f5f", "minorgridcolor": "#C8D4E3", "startlinecolor": "#2a3f5f" }, "baxis": { "gridcolor": "#C8D4E3", "linecolor": "#C8D4E3", "endlinecolor": "#2a3f5f", "minorgridcolor": "#C8D4E3", "startlinecolor": "#2a3f5f" } } ], "mesh3d": [ { "type": "mesh3d", "colorbar": { "ticks": "", "outlinewidth": 0 } } ], "contour": [ { "type": "contour", "colorbar": { "ticks": "", "outlinewidth": 0 }, "autocolorscale": true } ], "heatmap": [ { "type": "heatmap", "colorbar": { "ticks": "", "outlinewidth": 0 }, "autocolorscale": true } ], "scatter": [ { "type": "scatter", "marker": { "colorbar": { "ticks": "", "outlinewidth": 0 } } } ], "surface": [ { "type": "surface", "colorbar": { "ticks": "", "outlinewidth": 0 } } ], "heatmapgl": [ { "type": "heatmapgl", "colorbar": { "ticks": "", "outlinewidth": 0 } } ], "histogram": [ { "type": "histogram", "marker": { "colorbar": { "ticks": "", "outlinewidth": 0 } } } ], "parcoords": [ { "line": { "colorbar": { "ticks": "", "outlinewidth": 0 } }, "type": "parcoords" } ], "scatter3d": [ { "type": "scatter3d", "marker": { "colorbar": { "ticks": "", "outlinewidth": 0 } } } ], "scattergl": [ { "type": "scattergl", "marker": { "colorbar": { "ticks": "", "outlinewidth": 0 } } } ], "choropleth": [ { "type": "choropleth", "colorbar": { "ticks": "", "outlinewidth": 0 } } ], "scattergeo": [ { "type": "scattergeo", "marker": { "colorbar": { "ticks": "", "outlinewidth": 0 } } } ], "histogram2d": [ { "type": "histogram2d", "colorbar": { "ticks": "", "outlinewidth": 0 }, "autocolorscale": true } ], "scatterpolar": [ { "type": "scatterpolar", "marker": { "colorbar": { "ticks": "", "outlinewidth": 0 } } } ], "contourcarpet": [ { "type": "contourcarpet", "colorbar": { "ticks": "", "outlinewidth": 0 } } ], "scattercarpet": [ { "type": "scattercarpet", "marker": { "colorbar": { "ticks": "", "outlinewidth": 0 } } } ], "scattermapbox": [ { "type": "scattermapbox", "marker": { "colorbar": { "ticks": "", "outlinewidth": 0 } } } ], "scatterpolargl": [ { "type": "scatterpolargl", "marker": { "colorbar": { "ticks": "", "outlinewidth": 0 } } } ], "scatterternary": [ { "type": "scatterternary", "marker": { "colorbar": { "ticks": "", "outlinewidth": 0 } } } ], "histogram2dcontour": [ { "type": "histogram2dcontour", "colorbar": { "ticks": "", "outlinewidth": 0 }, "autocolorscale": true } ] }, "layout": { "geo": { "bgcolor": "white", "showland": true, "lakecolor": "white", "landcolor": "white", "showlakes": true, "subunitcolor": "#C8D4E3" }, "font": { "color": "#2a3f5f" }, "polar": { "bgcolor": "white", "radialaxis": { "ticks": "", "gridcolor": "#EBF0F8", "linecolor": "#EBF0F8" }, "angularaxis": { "ticks": "", "gridcolor": "#EBF0F8", "linecolor": "#EBF0F8" } }, "scene": { "xaxis": { "ticks": "", "gridcolor": "#DFE8F3", "gridwidth": 2, "linecolor": "#EBF0F8", "zerolinecolor": "#EBF0F8", "showbackground": true, "backgroundcolor": "white" }, "yaxis": { "ticks": "", "gridcolor": "#DFE8F3", "gridwidth": 2, "linecolor": "#EBF0F8", "zerolinecolor": "#EBF0F8", "showbackground": true, "backgroundcolor": "white" }, "zaxis": { "ticks": "", "gridcolor": "#DFE8F3", "gridwidth": 2, "linecolor": "#EBF0F8", "zerolinecolor": "#EBF0F8", "showbackground": true, "backgroundcolor": "white" } }, "title": { "x": 0.05 }, "xaxis": { "ticks": "", "gridcolor": "#EBF0F8", "linecolor": "#EBF0F8", "automargin": true, "zerolinecolor": "#EBF0F8", "zerolinewidth": 2 }, "yaxis": { "ticks": "", "gridcolor": "#EBF0F8", "linecolor": "#EBF0F8", "automargin": true, "zerolinecolor": "#EBF0F8", "zerolinewidth": 2 }, "ternary": { "aaxis": { "ticks": "", "gridcolor": "#DFE8F3", "linecolor": "#A2B1C6" }, "baxis": { "ticks": "", "gridcolor": "#DFE8F3", "linecolor": "#A2B1C6" }, "caxis": { "ticks": "", "gridcolor": "#DFE8F3", "linecolor": "#A2B1C6" }, "bgcolor": "white" }, "colorway": [ "#636efa", "#EF553B", "#00cc96", "#ab63fa", "#19d3f3", "#e763fa", "#fecb52", "#ffa15a", "#ff6692", "#b6e880" ], "hovermode": "closest", "colorscale": { "diverging": [ [ 0, "#8e0152" ], [ 0.1, "#c51b7d" ], [ 0.2, "#de77ae" ], [ 0.3, "#f1b6da" ], [ 0.4, "#fde0ef" ], [ 0.5, "#f7f7f7" ], [ 0.6, "#e6f5d0" ], [ 0.7, "#b8e186" ], [ 0.8, "#7fbc41" ], [ 0.9, "#4d9221" ], [ 1, "#276419" ] ], "sequential": [ [ 0, "#0508b8" ], [ 0.0893854748603352, "#1910d8" ], [ 0.1787709497206704, "#3c19f0" ], [ 0.2681564245810056, "#6b1cfb" ], [ 0.3575418994413408, "#981cfd" ], [ 0.44692737430167595, "#bf1cfd" ], [ 0.5363128491620112, "#dd2bfd" ], [ 0.6256983240223464, "#f246fe" ], [ 0.7150837988826816, "#fc67fd" ], [ 0.8044692737430168, "#fe88fc" ], [ 0.8938547486033519, "#fea5fd" ], [ 0.9832402234636871, "#febefe" ], [ 1, "#fec3fe" ] ], "sequentialminus": [ [ 0, "#0508b8" ], [ 0.0893854748603352, "#1910d8" ], [ 0.1787709497206704, "#3c19f0" ], [ 0.2681564245810056, "#6b1cfb" ], [ 0.3575418994413408, "#981cfd" ], [ 0.44692737430167595, "#bf1cfd" ], [ 0.5363128491620112, "#dd2bfd" ], [ 0.6256983240223464, "#f246fe" ], [ 0.7150837988826816, "#fc67fd" ], [ 0.8044692737430168, "#fe88fc" ], [ 0.8938547486033519, "#fea5fd" ], [ 0.9832402234636871, "#febefe" ], [ 1, "#fec3fe" ] ] }, "plot_bgcolor": "white", "paper_bgcolor": "white", "shapedefaults": { "line": { "width": 0 }, "opacity": 0.4, "fillcolor": "#506784" }, "annotationdefaults": { "arrowhead": 0, "arrowcolor": "#506784", "arrowwidth": 1 } }, "themeRef": "PLOTLY_WHITE" } } }, "height": null, "width": null, "user": { "profile_url": "https://chart-studio.plotly.com/~ef4taq", "avatar_url": "https://storage.googleapis.com/plotly-prod-profiles/7.jpg", "background_url": "https://storage.googleapis.com/plotly-prod-profiles/bg-5.jpg", "bio": "", "nickname": "", "website": "", "stream_tokens": null, "feature_set_id": null, "csrf_token": null, "date_joined": "2022-03-18 00:01:14", "mapbox_access_tokens": null, "has_password": null, "username": "ef4taq", "email": null, "is_active": null, "readonly": null, "is_dash_creator": null, "dash_created_count": null, "is_chart_creator": null, "charts_created_count": null } }, { "creation_time": "2024-04-03T21:41:19.740125Z", "comments": { "results": [], "count": 0 }, "parented": true, "embed_url": "https://chart-studio.plotly.com/~ef4taq/17.embed", "fid": "ef4taq:17", "filename": "367448265 | S19 | 2019 | 120s | OP", "filetype": "plot", "img_url": "https://storage.googleapis.com/plotly-prod-images/ef4taq/17/9_Y3EE6GKT899ABD20Z6VEE5AWC50SN3.png", "image_urls": { "default": "https://storage.googleapis.com/plotly-prod-images/ef4taq/17/2_0UWGPEFUJ1IG1KK65HNDMJRY0ZL9LF.png", "block-thumb": "https://storage.googleapis.com/plotly-prod-images/ef4taq/17/8_ULB9ABKZZMTNV172IHAB3D0RRMETV3.png", "list-thumb": "https://storage.googleapis.com/plotly-prod-images/ef4taq/17/9_Y3EE6GKT899ABD20Z6VEE5AWC50SN3.png" }, "api_urls": { "files": "https://api.plotly.com/v2/files/ef4taq:17", "plots": "https://api.plotly.com/v2/plots/ef4taq:17", "parent": "https://api.plotly.com/v2/folders/home?user=ef4taq" }, "owner": "ef4taq", "parent": -1, "preview": "", "referencers": [], "references": [], "title": "", "views": 1, "web_url": "https://chart-studio.plotly.com/~ef4taq/17/", "world_readable": true, "date_modified": "2024-04-03T21:41:19.752Z", "stars": { "results": [], "count": 0 }, "collaborators": { "results": [], "count": 0 }, "subfolder_count": null, "refresh_interval": null, "organize_view_url": "https://chart-studio.plotly.com/~ef4taq/17/", "current_user_permission": "read", "is_theme": null, "is_template": false, "autosize": true, "caption": "", "figure": { "data": [ { "meta": { "columnNames": { "x": "A", "y": "B", "error_y": { "array": "C" } } }, "mode": "markers", "name": "Bα Subsys", "type": "scatter", "xsrc": "ef4taq:16:bb2421", "ysrc": "ef4taq:16:6338fd", "error_y": { "meta": { "columnNames": { "array": "C" } }, "type": "data", "visible": true, "arraysrc": "ef4taq:16:33719d", "symmetric": true } }, { "meta": { "columnNames": { "x": "H", "y": "I", "error_y": { "array": "J" } } }, "mode": "markers", "name": "Bβ Subsys<br>", "type": "scatter", "xsrc": "ef4taq:16:323ef1", "ysrc": "ef4taq:16:dfd74c", "error_y": { "meta": { "columnNames": { "array": "J" } }, "type": "data", "visible": true, "arraysrc": "ef4taq:16:4fd6c1", "symmetric": true }, "stackgroup": null } ], "frames": [], "layout": { "title": { "text": "TIC 367448265 | TESS Sector 19 | 2019 | SPOC | 120s | OP" }, "xaxis": { "type": "linear", "range": [ -0.5256341987236074, 25.570767128623608 ], "title": { "text": "t_midpoint [-1816; D]" }, "autorange": true }, "yaxis": { "type": "linear", "range": [ -0.7723658458888888, 1.953590671888889 ], "title": { "text": "O-P [min]" }, "autorange": true }, "autosize": true, "template": { "data": { "bar": [ { "type": "bar", "marker": { "colorbar": { "ticks": "", "outlinewidth": 0 } } } ], "table": [ { "type": "table", "cells": { "fill": { "color": "#EBF0F8" }, "line": { "color": "white" } }, "header": { "fill": { "color": "#C8D4E3" }, "line": { "color": "white" } } } ], "carpet": [ { "type": "carpet", "aaxis": { "gridcolor": "#C8D4E3", "linecolor": "#C8D4E3", "endlinecolor": "#2a3f5f", "minorgridcolor": "#C8D4E3", "startlinecolor": "#2a3f5f" }, "baxis": { "gridcolor": "#C8D4E3", "linecolor": "#C8D4E3", "endlinecolor": "#2a3f5f", "minorgridcolor": "#C8D4E3", "startlinecolor": "#2a3f5f" } } ], "mesh3d": [ { "type": "mesh3d", "colorbar": { "ticks": "", "outlinewidth": 0 } } ], "contour": [ { "type": "contour", "colorbar": { "ticks": "", "outlinewidth": 0 }, "autocolorscale": true } ], "heatmap": [ { "type": "heatmap", "colorbar": { "ticks": "", "outlinewidth": 0 }, "autocolorscale": true } ], "scatter": [ { "type": "scatter", "marker": { "colorbar": { "ticks": "", "outlinewidth": 0 } } } ], "surface": [ { "type": "surface", "colorbar": { "ticks": "", "outlinewidth": 0 } } ], "heatmapgl": [ { "type": "heatmapgl", "colorbar": { "ticks": "", "outlinewidth": 0 } } ], "histogram": [ { "type": "histogram", "marker": { "colorbar": { "ticks": "", "outlinewidth": 0 } } } ], "parcoords": [ { "line": { "colorbar": { "ticks": "", "outlinewidth": 0 } }, "type": "parcoords" } ], "scatter3d": [ { "type": "scatter3d", "marker": { "colorbar": { "ticks": "", "outlinewidth": 0 } } } ], "scattergl": [ { "type": "scattergl", "marker": { "colorbar": { "ticks": "", "outlinewidth": 0 } } } ], "choropleth": [ { "type": "choropleth", "colorbar": { "ticks": "", "outlinewidth": 0 } } ], "scattergeo": [ { "type": "scattergeo", "marker": { "colorbar": { "ticks": "", "outlinewidth": 0 } } } ], "histogram2d": [ { "type": "histogram2d", "colorbar": { "ticks": "", "outlinewidth": 0 }, "autocolorscale": true } ], "scatterpolar": [ { "type": "scatterpolar", "marker": { "colorbar": { "ticks": "", "outlinewidth": 0 } } } ], "contourcarpet": [ { "type": "contourcarpet", "colorbar": { "ticks": "", "outlinewidth": 0 } } ], "scattercarpet": [ { "type": "scattercarpet", "marker": { "colorbar": { "ticks": "", "outlinewidth": 0 } } } ], "scattermapbox": [ { "type": "scattermapbox", "marker": { "colorbar": { "ticks": "", "outlinewidth": 0 } } } ], "scatterpolargl": [ { "type": "scatterpolargl", "marker": { "colorbar": { "ticks": "", "outlinewidth": 0 } } } ], "scatterternary": [ { "type": "scatterternary", "marker": { "colorbar": { "ticks": "", "outlinewidth": 0 } } } ], "histogram2dcontour": [ { "type": "histogram2dcontour", "colorbar": { "ticks": "", "outlinewidth": 0 }, "autocolorscale": true } ] }, "layout": { "geo": { "bgcolor": "white", "showland": true, "lakecolor": "white", "landcolor": "white", "showlakes": true, "subunitcolor": "#C8D4E3" }, "font": { "color": "#2a3f5f" }, "polar": { "bgcolor": "white", "radialaxis": { "ticks": "", "gridcolor": "#EBF0F8", "linecolor": "#EBF0F8" }, "angularaxis": { "ticks": "", "gridcolor": "#EBF0F8", "linecolor": "#EBF0F8" } }, "scene": { "xaxis": { "ticks": "", "gridcolor": "#DFE8F3", "gridwidth": 2, "linecolor": "#EBF0F8", "zerolinecolor": "#EBF0F8", "showbackground": true, "backgroundcolor": "white" }, "yaxis": { "ticks": "", "gridcolor": "#DFE8F3", "gridwidth": 2, "linecolor": "#EBF0F8", "zerolinecolor": "#EBF0F8", "showbackground": true, "backgroundcolor": "white" }, "zaxis": { "ticks": "", "gridcolor": "#DFE8F3", "gridwidth": 2, "linecolor": "#EBF0F8", "zerolinecolor": "#EBF0F8", "showbackground": true, "backgroundcolor": "white" } }, "title": { "x": 0.05 }, "xaxis": { "ticks": "", "gridcolor": "#EBF0F8", "linecolor": "#EBF0F8", "automargin": true, "zerolinecolor": "#EBF0F8", "zerolinewidth": 2 }, "yaxis": { "ticks": "", "gridcolor": "#EBF0F8", "linecolor": "#EBF0F8", "automargin": true, "zerolinecolor": "#EBF0F8", "zerolinewidth": 2 }, "ternary": { "aaxis": { "ticks": "", "gridcolor": "#DFE8F3", "linecolor": "#A2B1C6" }, "baxis": { "ticks": "", "gridcolor": "#DFE8F3", "linecolor": "#A2B1C6" }, "caxis": { "ticks": "", "gridcolor": "#DFE8F3", "linecolor": "#A2B1C6" }, "bgcolor": "white" }, "colorway": [ "#636efa", "#EF553B", "#00cc96", "#ab63fa", "#19d3f3", "#e763fa", "#fecb52", "#ffa15a", "#ff6692", "#b6e880" ], "hovermode": "closest", "colorscale": { "diverging": [ [ 0, "#8e0152" ], [ 0.1, "#c51b7d" ], [ 0.2, "#de77ae" ], [ 0.3, "#f1b6da" ], [ 0.4, "#fde0ef" ], [ 0.5, "#f7f7f7" ], [ 0.6, "#e6f5d0" ], [ 0.7, "#b8e186" ], [ 0.8, "#7fbc41" ], [ 0.9, "#4d9221" ], [ 1, "#276419" ] ], "sequential": [ [ 0, "#0508b8" ], [ 0.0893854748603352, "#1910d8" ], [ 0.1787709497206704, "#3c19f0" ], [ 0.2681564245810056, "#6b1cfb" ], [ 0.3575418994413408, "#981cfd" ], [ 0.44692737430167595, "#bf1cfd" ], [ 0.5363128491620112, "#dd2bfd" ], [ 0.6256983240223464, "#f246fe" ], [ 0.7150837988826816, "#fc67fd" ], [ 0.8044692737430168, "#fe88fc" ], [ 0.8938547486033519, "#fea5fd" ], [ 0.9832402234636871, "#febefe" ], [ 1, "#fec3fe" ] ], "sequentialminus": [ [ 0, "#0508b8" ], [ 0.0893854748603352, "#1910d8" ], [ 0.1787709497206704, "#3c19f0" ], [ 0.2681564245810056, "#6b1cfb" ], [ 0.3575418994413408, "#981cfd" ], [ 0.44692737430167595, "#bf1cfd" ], [ 0.5363128491620112, "#dd2bfd" ], [ 0.6256983240223464, "#f246fe" ], [ 0.7150837988826816, "#fc67fd" ], [ 0.8044692737430168, "#fe88fc" ], [ 0.8938547486033519, "#fea5fd" ], [ 0.9832402234636871, "#febefe" ], [ 1, "#fec3fe" ] ] }, "plot_bgcolor": "white", "paper_bgcolor": "white", "shapedefaults": { "line": { "width": 0 }, "opacity": 0.4, "fillcolor": "#506784" }, "annotationdefaults": { "arrowhead": 0, "arrowcolor": "#506784", "arrowwidth": 1 } }, "themeRef": "PLOTLY_WHITE" } } }, "height": null, "width": null, "user": { "profile_url": "https://chart-studio.plotly.com/~ef4taq", "avatar_url": "https://storage.googleapis.com/plotly-prod-profiles/7.jpg", "background_url": "https://storage.googleapis.com/plotly-prod-profiles/bg-5.jpg", "bio": "", "nickname": "", "website": "", "stream_tokens": null, "feature_set_id": null, "csrf_token": null, "date_joined": "2022-03-18 00:01:14", "mapbox_access_tokens": null, "has_password": null, "username": "ef4taq", "email": null, "is_active": null, "readonly": null, "is_dash_creator": null, "dash_created_count": null, "is_chart_creator": null, "charts_created_count": null } }, { "creation_time": "2024-04-03T21:38:03.558607Z", "comments": { "results": [], "count": 0 }, "parented": true, "embed_url": "https://chart-studio.plotly.com/~ef4taq/15.embed", "fid": "ef4taq:15", "filename": "367448265 | S73 | 2023 | 120s | PT", "filetype": "plot", "img_url": "https://storage.googleapis.com/plotly-prod-images/ef4taq/15/9_D0WGIMJ8LHO96AODV416MBBR4HW8UF.png", "image_urls": { "default": "https://storage.googleapis.com/plotly-prod-images/ef4taq/15/2_R5NIPS0QZP5D9D89QOT6JBYAIJ8BQ4.png", "block-thumb": "https://storage.googleapis.com/plotly-prod-images/ef4taq/15/8_LDXWWU4KGE2HC8SVXZUZOI93AW9Q1R.png", "list-thumb": "https://storage.googleapis.com/plotly-prod-images/ef4taq/15/9_D0WGIMJ8LHO96AODV416MBBR4HW8UF.png" }, "api_urls": { "files": "https://api.plotly.com/v2/files/ef4taq:15", "plots": "https://api.plotly.com/v2/plots/ef4taq:15", "parent": "https://api.plotly.com/v2/folders/home?user=ef4taq" }, "owner": "ef4taq", "parent": -1, "preview": "", "referencers": [], "references": [], "title": "", "views": 1, "web_url": "https://chart-studio.plotly.com/~ef4taq/15/", "world_readable": true, "date_modified": "2024-04-03T21:38:03.570Z", "stars": { "results": [], "count": 0 }, "collaborators": { "results": [], "count": 0 }, "subfolder_count": null, "refresh_interval": null, "organize_view_url": "https://chart-studio.plotly.com/~ef4taq/15/", "current_user_permission": "read", "is_theme": null, "is_template": false, "autosize": true, "caption": "", "figure": { "data": [ { "meta": { "columnNames": { "x": "A", "y": "B", "error_y": { "array": "C" } } }, "mode": "markers", "name": "Bα Subsys", "type": "scatter", "xsrc": "ef4taq:14:f028df", "ysrc": "ef4taq:14:0b7e2f", "error_y": { "meta": { "columnNames": { "array": "C" } }, "type": "data", "visible": true, "arraysrc": "ef4taq:14:62e88d", "symmetric": true } }, { "meta": { "columnNames": { "x": "H", "y": "I", "error_y": { "array": "J" } } }, "mode": "markers", "name": "Bβ Subsys<br>", "type": "scatter", "xsrc": "ef4taq:14:b57d1a", "ysrc": "ef4taq:14:fec7d7", "error_y": { "meta": { "columnNames": { "array": "J" } }, "type": "data", "visible": true, "arraysrc": "ef4taq:14:aae8df", "symmetric": true }, "stackgroup": null } ], "frames": [], "layout": { "title": { "text": "TIC 367448265 | TESS Sector 73 | 2023 | SPOC | 120s" }, "xaxis": { "type": "linear", "range": [ -0.6387032789611333, 24.412079407961134 ], "title": { "text": "t_midpoint [-3289; D]" }, "autorange": true }, "yaxis": { "type": "linear", "range": [ -1.9834487680611113, 0.26860633316111115 ], "title": { "text": "P-T [min]" }, "autorange": true }, "autosize": true, "template": { "data": { "bar": [ { "type": "bar", "marker": { "colorbar": { "ticks": "", "outlinewidth": 0 } } } ], "table": [ { "type": "table", "cells": { "fill": { "color": "#EBF0F8" }, "line": { "color": "white" } }, "header": { "fill": { "color": "#C8D4E3" }, "line": { "color": "white" } } } ], "carpet": [ { "type": "carpet", "aaxis": { "gridcolor": "#C8D4E3", "linecolor": "#C8D4E3", "endlinecolor": "#2a3f5f", "minorgridcolor": "#C8D4E3", "startlinecolor": "#2a3f5f" }, "baxis": { "gridcolor": "#C8D4E3", "linecolor": "#C8D4E3", "endlinecolor": "#2a3f5f", "minorgridcolor": "#C8D4E3", "startlinecolor": "#2a3f5f" } } ], "mesh3d": [ { "type": "mesh3d", "colorbar": { "ticks": "", "outlinewidth": 0 } } ], "contour": [ { "type": "contour", "colorbar": { "ticks": "", "outlinewidth": 0 }, "autocolorscale": true } ], "heatmap": [ { "type": "heatmap", "colorbar": { "ticks": "", "outlinewidth": 0 }, "autocolorscale": true } ], "scatter": [ { "type": "scatter", "marker": { "colorbar": { "ticks": "", "outlinewidth": 0 } } } ], "surface": [ { "type": "surface", "colorbar": { "ticks": "", "outlinewidth": 0 } } ], "heatmapgl": [ { "type": "heatmapgl", "colorbar": { "ticks": "", "outlinewidth": 0 } } ], "histogram": [ { "type": "histogram", "marker": { "colorbar": { "ticks": "", "outlinewidth": 0 } } } ], "parcoords": [ { "line": { "colorbar": { "ticks": "", "outlinewidth": 0 } }, "type": "parcoords" } ], "scatter3d": [ { "type": "scatter3d", "marker": { "colorbar": { "ticks": "", "outlinewidth": 0 } } } ], "scattergl": [ { "type": "scattergl", "marker": { "colorbar": { "ticks": "", "outlinewidth": 0 } } } ], "choropleth": [ { "type": "choropleth", "colorbar": { "ticks": "", "outlinewidth": 0 } } ], "scattergeo": [ { "type": "scattergeo", "marker": { "colorbar": { "ticks": "", "outlinewidth": 0 } } } ], "histogram2d": [ { "type": "histogram2d", "colorbar": { "ticks": "", "outlinewidth": 0 }, "autocolorscale": true } ], "scatterpolar": [ { "type": "scatterpolar", "marker": { "colorbar": { "ticks": "", "outlinewidth": 0 } } } ], "contourcarpet": [ { "type": "contourcarpet", "colorbar": { "ticks": "", "outlinewidth": 0 } } ], "scattercarpet": [ { "type": "scattercarpet", "marker": { "colorbar": { "ticks": "", "outlinewidth": 0 } } } ], "scattermapbox": [ { "type": "scattermapbox", "marker": { "colorbar": { "ticks": "", "outlinewidth": 0 } } } ], "scatterpolargl": [ { "type": "scatterpolargl", "marker": { "colorbar": { "ticks": "", "outlinewidth": 0 } } } ], "scatterternary": [ { "type": "scatterternary", "marker": { "colorbar": { "ticks": "", "outlinewidth": 0 } } } ], "histogram2dcontour": [ { "type": "histogram2dcontour", "colorbar": { "ticks": "", "outlinewidth": 0 }, "autocolorscale": true } ] }, "layout": { "geo": { "bgcolor": "white", "showland": true, "lakecolor": "white", "landcolor": "white", "showlakes": true, "subunitcolor": "#C8D4E3" }, "font": { "color": "#2a3f5f" }, "polar": { "bgcolor": "white", "radialaxis": { "ticks": "", "gridcolor": "#EBF0F8", "linecolor": "#EBF0F8" }, "angularaxis": { "ticks": "", "gridcolor": "#EBF0F8", "linecolor": "#EBF0F8" } }, "scene": { "xaxis": { "ticks": "", "gridcolor": "#DFE8F3", "gridwidth": 2, "linecolor": "#EBF0F8", "zerolinecolor": "#EBF0F8", "showbackground": true, "backgroundcolor": "white" }, "yaxis": { "ticks": "", "gridcolor": "#DFE8F3", "gridwidth": 2, "linecolor": "#EBF0F8", "zerolinecolor": "#EBF0F8", "showbackground": true, "backgroundcolor": "white" }, "zaxis": { "ticks": "", "gridcolor": "#DFE8F3", "gridwidth": 2, "linecolor": "#EBF0F8", "zerolinecolor": "#EBF0F8", "showbackground": true, "backgroundcolor": "white" } }, "title": { "x": 0.05 }, "xaxis": { "ticks": "", "gridcolor": "#EBF0F8", "linecolor": "#EBF0F8", "automargin": true, "zerolinecolor": "#EBF0F8", "zerolinewidth": 2 }, "yaxis": { "ticks": "", "gridcolor": "#EBF0F8", "linecolor": "#EBF0F8", "automargin": true, "zerolinecolor": "#EBF0F8", "zerolinewidth": 2 }, "ternary": { "aaxis": { "ticks": "", "gridcolor": "#DFE8F3", "linecolor": "#A2B1C6" }, "baxis": { "ticks": "", "gridcolor": "#DFE8F3", "linecolor": "#A2B1C6" }, "caxis": { "ticks": "", "gridcolor": "#DFE8F3", "linecolor": "#A2B1C6" }, "bgcolor": "white" }, "colorway": [ "#636efa", "#EF553B", "#00cc96", "#ab63fa", "#19d3f3", "#e763fa", "#fecb52", "#ffa15a", "#ff6692", "#b6e880" ], "hovermode": "closest", "colorscale": { "diverging": [ [ 0, "#8e0152" ], [ 0.1, "#c51b7d" ], [ 0.2, "#de77ae" ], [ 0.3, "#f1b6da" ], [ 0.4, "#fde0ef" ], [ 0.5, "#f7f7f7" ], [ 0.6, "#e6f5d0" ], [ 0.7, "#b8e186" ], [ 0.8, "#7fbc41" ], [ 0.9, "#4d9221" ], [ 1, "#276419" ] ], "sequential": [ [ 0, "#0508b8" ], [ 0.0893854748603352, "#1910d8" ], [ 0.1787709497206704, "#3c19f0" ], [ 0.2681564245810056, "#6b1cfb" ], [ 0.3575418994413408, "#981cfd" ], [ 0.44692737430167595, "#bf1cfd" ], [ 0.5363128491620112, "#dd2bfd" ], [ 0.6256983240223464, "#f246fe" ], [ 0.7150837988826816, "#fc67fd" ], [ 0.8044692737430168, "#fe88fc" ], [ 0.8938547486033519, "#fea5fd" ], [ 0.9832402234636871, "#febefe" ], [ 1, "#fec3fe" ] ], "sequentialminus": [ [ 0, "#0508b8" ], [ 0.0893854748603352, "#1910d8" ], [ 0.1787709497206704, "#3c19f0" ], [ 0.2681564245810056, "#6b1cfb" ], [ 0.3575418994413408, "#981cfd" ], [ 0.44692737430167595, "#bf1cfd" ], [ 0.5363128491620112, "#dd2bfd" ], [ 0.6256983240223464, "#f246fe" ], [ 0.7150837988826816, "#fc67fd" ], [ 0.8044692737430168, "#fe88fc" ], [ 0.8938547486033519, "#fea5fd" ], [ 0.9832402234636871, "#febefe" ], [ 1, "#fec3fe" ] ] }, "plot_bgcolor": "white", "paper_bgcolor": "white", "shapedefaults": { "line": { "width": 0 }, "opacity": 0.4, "fillcolor": "#506784" }, "annotationdefaults": { "arrowhead": 0, "arrowcolor": "#506784", "arrowwidth": 1 } }, "themeRef": "PLOTLY_WHITE" } } }, "height": null, "width": null, "user": { "profile_url": "https://chart-studio.plotly.com/~ef4taq", "avatar_url": "https://storage.googleapis.com/plotly-prod-profiles/7.jpg", "background_url": "https://storage.googleapis.com/plotly-prod-profiles/bg-5.jpg", "bio": "", "nickname": "", "website": "", "stream_tokens": null, "feature_set_id": null, "csrf_token": null, "date_joined": "2022-03-18 00:01:14", "mapbox_access_tokens": null, "has_password": null, "username": "ef4taq", "email": null, "is_active": null, "readonly": null, "is_dash_creator": null, "dash_created_count": null, "is_chart_creator": null, "charts_created_count": null } }, { "creation_time": "2024-04-03T21:32:45.426618Z", "comments": { "results": [], "count": 0 }, "parented": true, "embed_url": "https://chart-studio.plotly.com/~ef4taq/13.embed", "fid": "ef4taq:13", "filename": "367448265 | S59 | 2022 | 200s | P-T", "filetype": "plot", "img_url": "https://storage.googleapis.com/plotly-prod-images/ef4taq/13/9_2OONZ1YULEYHVWOPB8WKWH6MYAKQA9.png", "image_urls": { "default": "https://storage.googleapis.com/plotly-prod-images/ef4taq/13/2_LZI70XKGD3OTXW510GZ06UX3NCHCEB.png", "block-thumb": "https://storage.googleapis.com/plotly-prod-images/ef4taq/13/8_18T4TP0XPKRIW1B3GUABMWPAXWNQX2.png", "list-thumb": "https://storage.googleapis.com/plotly-prod-images/ef4taq/13/9_2OONZ1YULEYHVWOPB8WKWH6MYAKQA9.png" }, "api_urls": { "files": "https://api.plotly.com/v2/files/ef4taq:13", "plots": "https://api.plotly.com/v2/plots/ef4taq:13", "parent": "https://api.plotly.com/v2/folders/home?user=ef4taq" }, "owner": "ef4taq", "parent": -1, "preview": "", "referencers": [], "references": [], "title": "", "views": 1, "web_url": "https://chart-studio.plotly.com/~ef4taq/13/", "world_readable": true, "date_modified": "2024-04-03T21:36:44.105Z", "stars": { "results": [], "count": 0 }, "collaborators": { "results": [], "count": 0 }, "subfolder_count": null, "refresh_interval": null, "organize_view_url": "https://chart-studio.plotly.com/~ef4taq/13/", "current_user_permission": "read", "is_theme": null, "is_template": false, "autosize": true, "caption": "", "figure": { "data": [ { "meta": { "columnNames": { "x": "A", "y": "B", "error_y": { "array": "C" } } }, "mode": "markers", "name": "Bα Subsys", "type": "scatter", "xsrc": "ef4taq:12:c16af4", "ysrc": "ef4taq:12:2e8289", "error_y": { "meta": { "columnNames": { "array": "C" } }, "type": "data", "visible": true, "arraysrc": "ef4taq:12:f68b05", "symmetric": true } }, { "meta": { "columnNames": { "x": "H", "y": "I", "error_y": { "array": "J" } } }, "mode": "markers", "name": "Bβ Subsys<br>", "type": "scatter", "xsrc": "ef4taq:12:31fd69", "ysrc": "ef4taq:12:6927d8", "error_y": { "meta": { "columnNames": { "array": "J" } }, "type": "data", "visible": true, "arraysrc": "ef4taq:12:c3bde5", "symmetric": true }, "stackgroup": null } ], "frames": [], "layout": { "title": { "text": "TIC 367448265 | TESS Sector 59 | 2022 | TESS-SPOC | 200s | T - P" }, "xaxis": { "type": "linear", "range": [ -0.5198809124731766, 26.620606896373175 ], "title": { "text": "t_midpoint [-2911; D]" }, "autorange": true }, "yaxis": { "type": "linear", "range": [ -1.04879906705, 1.06821328595 ], "title": { "text": "theor-pred [min]" }, "autorange": true }, "autosize": true, "template": { "data": { "bar": [ { "type": "bar", "marker": { "colorbar": { "ticks": "", "outlinewidth": 0 } } } ], "table": [ { "type": "table", "cells": { "fill": { "color": "#EBF0F8" }, "line": { "color": "white" } }, "header": { "fill": { "color": "#C8D4E3" }, "line": { "color": "white" } } } ], "carpet": [ { "type": "carpet", "aaxis": { "gridcolor": "#C8D4E3", "linecolor": "#C8D4E3", "endlinecolor": "#2a3f5f", "minorgridcolor": "#C8D4E3", "startlinecolor": "#2a3f5f" }, "baxis": { "gridcolor": "#C8D4E3", "linecolor": "#C8D4E3", "endlinecolor": "#2a3f5f", "minorgridcolor": "#C8D4E3", "startlinecolor": "#2a3f5f" } } ], "mesh3d": [ { "type": "mesh3d", "colorbar": { "ticks": "", "outlinewidth": 0 } } ], "contour": [ { "type": "contour", "colorbar": { "ticks": "", "outlinewidth": 0 }, "autocolorscale": true } ], "heatmap": [ { "type": "heatmap", "colorbar": { "ticks": "", "outlinewidth": 0 }, "autocolorscale": true } ], "scatter": [ { "type": "scatter", "marker": { "colorbar": { "ticks": "", "outlinewidth": 0 } } } ], "surface": [ { "type": "surface", "colorbar": { "ticks": "", "outlinewidth": 0 } } ], "heatmapgl": [ { "type": "heatmapgl", "colorbar": { "ticks": "", "outlinewidth": 0 } } ], "histogram": [ { "type": "histogram", "marker": { "colorbar": { "ticks": "", "outlinewidth": 0 } } } ], "parcoords": [ { "line": { "colorbar": { "ticks": "", "outlinewidth": 0 } }, "type": "parcoords" } ], "scatter3d": [ { "type": "scatter3d", "marker": { "colorbar": { "ticks": "", "outlinewidth": 0 } } } ], "scattergl": [ { "type": "scattergl", "marker": { "colorbar": { "ticks": "", "outlinewidth": 0 } } } ], "choropleth": [ { "type": "choropleth", "colorbar": { "ticks": "", "outlinewidth": 0 } } ], "scattergeo": [ { "type": "scattergeo", "marker": { "colorbar": { "ticks": "", "outlinewidth": 0 } } } ], "histogram2d": [ { "type": "histogram2d", "colorbar": { "ticks": "", "outlinewidth": 0 }, "autocolorscale": true } ], "scatterpolar": [ { "type": "scatterpolar", "marker": { "colorbar": { "ticks": "", "outlinewidth": 0 } } } ], "contourcarpet": [ { "type": "contourcarpet", "colorbar": { "ticks": "", "outlinewidth": 0 } } ], "scattercarpet": [ { "type": "scattercarpet", "marker": { "colorbar": { "ticks": "", "outlinewidth": 0 } } } ], "scattermapbox": [ { "type": "scattermapbox", "marker": { "colorbar": { "ticks": "", "outlinewidth": 0 } } } ], "scatterpolargl": [ { "type": "scatterpolargl", "marker": { "colorbar": { "ticks": "", "outlinewidth": 0 } } } ], "scatterternary": [ { "type": "scatterternary", "marker": { "colorbar": { "ticks": "", "outlinewidth": 0 } } } ], "histogram2dcontour": [ { "type": "histogram2dcontour", "colorbar": { "ticks": "", "outlinewidth": 0 }, "autocolorscale": true } ] }, "layout": { "geo": { "bgcolor": "white", "showland": true, "lakecolor": "white", "landcolor": "white", "showlakes": true, "subunitcolor": "#C8D4E3" }, "font": { "color": "#2a3f5f" }, "polar": { "bgcolor": "white", "radialaxis": { "ticks": "", "gridcolor": "#EBF0F8", "linecolor": "#EBF0F8" }, "angularaxis": { "ticks": "", "gridcolor": "#EBF0F8", "linecolor": "#EBF0F8" } }, "scene": { "xaxis": { "ticks": "", "gridcolor": "#DFE8F3", "gridwidth": 2, "linecolor": "#EBF0F8", "zerolinecolor": "#EBF0F8", "showbackground": true, "backgroundcolor": "white" }, "yaxis": { "ticks": "", "gridcolor": "#DFE8F3", "gridwidth": 2, "linecolor": "#EBF0F8", "zerolinecolor": "#EBF0F8", "showbackground": true, "backgroundcolor": "white" }, "zaxis": { "ticks": "", "gridcolor": "#DFE8F3", "gridwidth": 2, "linecolor": "#EBF0F8", "zerolinecolor": "#EBF0F8", "showbackground": true, "backgroundcolor": "white" } }, "title": { "x": 0.05 }, "xaxis": { "ticks": "", "gridcolor": "#EBF0F8", "linecolor": "#EBF0F8", "automargin": true, "zerolinecolor": "#EBF0F8", "zerolinewidth": 2 }, "yaxis": { "ticks": "", "gridcolor": "#EBF0F8", "linecolor": "#EBF0F8", "automargin": true, "zerolinecolor": "#EBF0F8", "zerolinewidth": 2 }, "ternary": { "aaxis": { "ticks": "", "gridcolor": "#DFE8F3", "linecolor": "#A2B1C6" }, "baxis": { "ticks": "", "gridcolor": "#DFE8F3", "linecolor": "#A2B1C6" }, "caxis": { "ticks": "", "gridcolor": "#DFE8F3", "linecolor": "#A2B1C6" }, "bgcolor": "white" }, "colorway": [ "#636efa", "#EF553B", "#00cc96", "#ab63fa", "#19d3f3", "#e763fa", "#fecb52", "#ffa15a", "#ff6692", "#b6e880" ], "hovermode": "closest", "colorscale": { "diverging": [ [ 0, "#8e0152" ], [ 0.1, "#c51b7d" ], [ 0.2, "#de77ae" ], [ 0.3, "#f1b6da" ], [ 0.4, "#fde0ef" ], [ 0.5, "#f7f7f7" ], [ 0.6, "#e6f5d0" ], [ 0.7, "#b8e186" ], [ 0.8, "#7fbc41" ], [ 0.9, "#4d9221" ], [ 1, "#276419" ] ], "sequential": [ [ 0, "#0508b8" ], [ 0.0893854748603352, "#1910d8" ], [ 0.1787709497206704, "#3c19f0" ], [ 0.2681564245810056, "#6b1cfb" ], [ 0.3575418994413408, "#981cfd" ], [ 0.44692737430167595, "#bf1cfd" ], [ 0.5363128491620112, "#dd2bfd" ], [ 0.6256983240223464, "#f246fe" ], [ 0.7150837988826816, "#fc67fd" ], [ 0.8044692737430168, "#fe88fc" ], [ 0.8938547486033519, "#fea5fd" ], [ 0.9832402234636871, "#febefe" ], [ 1, "#fec3fe" ] ], "sequentialminus": [ [ 0, "#0508b8" ], [ 0.0893854748603352, "#1910d8" ], [ 0.1787709497206704, "#3c19f0" ], [ 0.2681564245810056, "#6b1cfb" ], [ 0.3575418994413408, "#981cfd" ], [ 0.44692737430167595, "#bf1cfd" ], [ 0.5363128491620112, "#dd2bfd" ], [ 0.6256983240223464, "#f246fe" ], [ 0.7150837988826816, "#fc67fd" ], [ 0.8044692737430168, "#fe88fc" ], [ 0.8938547486033519, "#fea5fd" ], [ 0.9832402234636871, "#febefe" ], [ 1, "#fec3fe" ] ] }, "plot_bgcolor": "white", "paper_bgcolor": "white", "shapedefaults": { "line": { "width": 0 }, "opacity": 0.4, "fillcolor": "#506784" }, "annotationdefaults": { "arrowhead": 0, "arrowcolor": "#506784", "arrowwidth": 1 } }, "themeRef": "PLOTLY_WHITE" } } }, "height": null, "width": null, "user": { "profile_url": "https://chart-studio.plotly.com/~ef4taq", "avatar_url": "https://storage.googleapis.com/plotly-prod-profiles/7.jpg", "background_url": "https://storage.googleapis.com/plotly-prod-profiles/bg-5.jpg", "bio": "", "nickname": "", "website": "", "stream_tokens": null, "feature_set_id": null, "csrf_token": null, "date_joined": "2022-03-18 00:01:14", "mapbox_access_tokens": null, "has_password": null, "username": "ef4taq", "email": null, "is_active": null, "readonly": null, "is_dash_creator": null, "dash_created_count": null, "is_chart_creator": null, "charts_created_count": null } }, { "creation_time": "2024-04-03T21:21:37.632445Z", "comments": { "results": [], "count": 0 }, "parented": true, "embed_url": "https://chart-studio.plotly.com/~dolsonaw/3.embed", "fid": "dolsonaw:3", "filename": "dps_report_all_pitchers", "filetype": "plot", "img_url": "https://storage.googleapis.com/plotly-prod-images/dolsonaw/3/9_3NG5PA0XMHWCI4Q1O062O6OCGLG7TI.png", "image_urls": { "default": "https://storage.googleapis.com/plotly-prod-images/dolsonaw/3/2_ROF73YE14IHR7JVYT1WQIAGYH6640Y.png", "block-thumb": "https://storage.googleapis.com/plotly-prod-images/dolsonaw/3/8_6DTH3TICWTHRB4MLMRM1KR0530IMSP.png", "list-thumb": "https://storage.googleapis.com/plotly-prod-images/dolsonaw/3/9_3NG5PA0XMHWCI4Q1O062O6OCGLG7TI.png" }, "api_urls": { "files": "https://api.plotly.com/v2/files/dolsonaw:3", "plots": "https://api.plotly.com/v2/plots/dolsonaw:3", "parent": "https://api.plotly.com/v2/folders/home?user=dolsonaw" }, "owner": "dolsonaw", "parent": -1, "preview": "", "referencers": [], "references": [], "title": "", "views": 1, "web_url": "https://chart-studio.plotly.com/~dolsonaw/3/", "world_readable": true, "date_modified": "2024-04-03T21:21:37.640Z", "stars": { "results": [], "count": 0 }, "collaborators": { "results": [], "count": 0 }, "subfolder_count": null, "refresh_interval": null, "organize_view_url": "https://chart-studio.plotly.com/~dolsonaw/3/", "current_user_permission": "read", "is_theme": null, "is_template": null, "autosize": true, "caption": "", "figure": { "data": [ { "mode": "markers", "name": "Sinker", "type": "scatter", "xsrc": "dolsonaw:2:439e12", "ysrc": "dolsonaw:2:c58507", "xaxis": "x", "yaxis": "y", "marker": { "size": 7, "color": "#ab63fa", "symbol": "circle", "opacity": 0.8, "sizeref": 0.23853827500000002, "sizemode": "area" }, "showlegend": true, "legendgroup": "Sinker", "orientation": "v", "customdatasrc": "dolsonaw:2:f925eb", "hovertemplate": "AutoPitchType=%{customdata[1]}<br>Horizontal Break=%{x}<br>Induced Vertical Break=%{y}<br>RelSpeed=%{customdata[0]}<extra></extra>" }, { "mode": "markers", "name": "Curveball", "type": "scatter", "xsrc": "dolsonaw:2:c4e420", "ysrc": "dolsonaw:2:d0c671", "xaxis": "x", "yaxis": "y", "marker": { "size": 7, "color": "violet", "symbol": "circle", "opacity": 0.8, "sizeref": 0.23853827500000002, "sizemode": "area" }, "showlegend": true, "legendgroup": "Curveball", "orientation": "v", "customdatasrc": "dolsonaw:2:1fc936", "hovertemplate": "AutoPitchType=%{customdata[1]}<br>Horizontal Break=%{x}<br>Induced Vertical Break=%{y}<br>RelSpeed=%{customdata[0]}<extra></extra>" }, { "mode": "markers", "name": "Changeup", "type": "scatter", "xsrc": "dolsonaw:2:57fc05", "ysrc": "dolsonaw:2:21898e", "xaxis": "x", "yaxis": "y", "marker": { "size": 7, "color": "orange", "symbol": "circle", "opacity": 0.8, "sizeref": 0.23853827500000002, "sizemode": "area" }, "showlegend": true, "legendgroup": "Changeup", "orientation": "v", "customdatasrc": "dolsonaw:2:f13419", "hovertemplate": "AutoPitchType=%{customdata[1]}<br>Horizontal Break=%{x}<br>Induced Vertical Break=%{y}<br>RelSpeed=%{customdata[0]}<extra></extra>" }, { "mode": "markers", "name": "Four-Seam", "type": "scatter", "xsrc": "dolsonaw:2:1548df", "ysrc": "dolsonaw:2:38e969", "xaxis": "x", "yaxis": "y", "marker": { "size": 7, "color": "teal", "symbol": "circle", "opacity": 0.8, "sizeref": 0.23853827500000002, "sizemode": "area" }, "showlegend": true, "legendgroup": "Four-Seam", "orientation": "v", "customdatasrc": "dolsonaw:2:298db3", "hovertemplate": "AutoPitchType=%{customdata[1]}<br>Horizontal Break=%{x}<br>Induced Vertical Break=%{y}<br>RelSpeed=%{customdata[0]}<extra></extra>" }, { "mode": "markers", "name": "Slider", "type": "scatter", "xsrc": "dolsonaw:2:ea977d", "ysrc": "dolsonaw:2:07abef", "xaxis": "x", "yaxis": "y", "marker": { "size": 7, "color": "#FFA15A", "symbol": "circle", "opacity": 0.8, "sizeref": 0.23853827500000002, "sizemode": "area" }, "showlegend": true, "legendgroup": "Slider", "orientation": "v", "customdatasrc": "dolsonaw:2:361cba", "hovertemplate": "AutoPitchType=%{customdata[1]}<br>Horizontal Break=%{x}<br>Induced Vertical Break=%{y}<br>RelSpeed=%{customdata[0]}<extra></extra>" }, { "mode": "markers", "name": "Cutter", "type": "scatter", "xsrc": "dolsonaw:2:224e4a", "ysrc": "dolsonaw:2:b109bb", "xaxis": "x", "yaxis": "y", "marker": { "size": 7, "color": "#19d3f3", "symbol": "circle", "opacity": 0.8, "sizeref": 0.23853827500000002, "sizemode": "area" }, "showlegend": true, "legendgroup": "Cutter", "orientation": "v", "customdatasrc": "dolsonaw:2:d41cdf", "hovertemplate": "AutoPitchType=%{customdata[1]}<br>Horizontal Break=%{x}<br>Induced Vertical Break=%{y}<br>RelSpeed=%{customdata[0]}<extra></extra>" } ], "layout": { "title": { "x": 0.5, "y": 0.95, "font": { "size": 24, "family": "Exo 2" }, "text": "DPS Report", "xanchor": "center", "yanchor": "top" }, "xaxis": { "range": [ -25, 25 ], "ticks": "outside", "title": { "text": "Horizontal Break" }, "anchor": "y", "domain": [ 0.0, 1.0 ], "showline": true, "tickfont": { "size": 12, "family": "Exo 2" }, "gridcolor": "lightgray", "linecolor": "black", "linewidth": 1, "tickcolor": "black", "tickwidth": 1 }, "yaxis": { "range": [ -25, 25 ], "ticks": "outside", "title": { "text": "Induced Vertical Break" }, "anchor": "x", "domain": [ 0.0, 1.0 ], "showline": true, "tickfont": { "size": 12, "family": "Exo 2" }, "gridcolor": "lightgray", "linecolor": "black", "linewidth": 1, "tickcolor": "black", "tickwidth": 1 }, "legend": { "title": { "text": "AutoPitchType" }, "itemsizing": "constant", "tracegroupgap": 0 }, "shapes": [ { "x0": 0, "x1": 0, "y0": -25, "y1": 25, "line": { "color": "black", "width": 1 }, "type": "line", "xref": "x", "yref": "y" }, { "x0": -25, "x1": 25, "y0": 0, "y1": 0, "line": { "color": "black", "width": 1 }, "type": "line", "xref": "x", "yref": "y" }, { "x0": 7.395748000000001, "x1": 13.395748000000001, "y0": 1.3602980000000002, "y1": 7.360298, "line": { "color": "rgba(0,0,0,0)", "width": 1 }, "type": "circle", "opacity": 0.3, "fillcolor": "orange" }, { "x0": -12.871183076923076, "x1": -6.871183076923076, "y0": -7.084245, "y1": -1.0842450000000001, "line": { "color": "rgba(0,0,0,0)", "width": 1 }, "type": "circle", "opacity": 0.3, "fillcolor": "violet" }, { "x0": -1.891984, "x1": 4.108016, "y0": 8.236176666666667, "y1": 14.236176666666667, "line": { "color": "rgba(0,0,0,0)", "width": 1 }, "type": "circle", "opacity": 0.3, "fillcolor": "gray" }, { "x0": -3.543726515151515, "x1": 2.456273484848485, "y0": 10.573217878787878, "y1": 16.57321787878788, "line": { "color": "rgba(0,0,0,0)", "width": 1 }, "type": "circle", "opacity": 0.3, "fillcolor": "teal" }, { "x0": 1.0064065217391303, "x1": 7.00640652173913, "y0": 2.609126086956522, "y1": 8.609126086956522, "line": { "color": "rgba(0,0,0,0)", "width": 1 }, "type": "circle", "opacity": 0.3, "fillcolor": "gray" }, { "x0": -9.173001282051281, "x1": -3.173001282051282, "y0": -2.3056871794871796, "y1": 3.6943128205128204, "line": { "color": "rgba(0,0,0,0)", "width": 1 }, "type": "circle", "opacity": 0.3, "fillcolor": "gray" } ], "template": { "data": { "bar": [ { "type": "bar", "marker": { "line": { "color": "#E5ECF6", "width": 0.5 }, "pattern": { "size": 10, "fillmode": "overlay", "solidity": 0.2 } }, "error_x": { "color": "#2a3f5f" }, "error_y": { "color": "#2a3f5f" } } ], "pie": [ { "type": "pie", "automargin": true } ], "table": [ { "type": "table", "cells": { "fill": { "color": "#EBF0F8" }, "line": { "color": "white" } }, "header": { "fill": { "color": "#C8D4E3" }, "line": { "color": "white" } } } ], "carpet": [ { "type": "carpet", "aaxis": { "gridcolor": "white", "linecolor": "white", "endlinecolor": "#2a3f5f", "minorgridcolor": "white", "startlinecolor": "#2a3f5f" }, "baxis": { "gridcolor": "white", "linecolor": "white", "endlinecolor": "#2a3f5f", "minorgridcolor": "white", "startlinecolor": "#2a3f5f" } } ], "mesh3d": [ { "type": "mesh3d", "colorbar": { "ticks": "", "outlinewidth": 0 } } ], "contour": [ { "type": "contour", "colorbar": { "ticks": "", "outlinewidth": 0 }, "colorscale": [ [ 0.0, "#0d0887" ], [ 0.1111111111111111, "#46039f" ], [ 0.2222222222222222, "#7201a8" ], [ 0.3333333333333333, "#9c179e" ], [ 0.4444444444444444, "#bd3786" ], [ 0.5555555555555556, "#d8576b" ], [ 0.6666666666666666, "#ed7953" ], [ 0.7777777777777778, "#fb9f3a" ], [ 0.8888888888888888, "#fdca26" ], [ 1.0, "#f0f921" ] ] } ], "heatmap": [ { "type": "heatmap", "colorbar": { "ticks": "", "outlinewidth": 0 }, "colorscale": [ [ 0.0, "#0d0887" ], [ 0.1111111111111111, "#46039f" ], [ 0.2222222222222222, "#7201a8" ], [ 0.3333333333333333, "#9c179e" ], [ 0.4444444444444444, "#bd3786" ], [ 0.5555555555555556, "#d8576b" ], [ 0.6666666666666666, "#ed7953" ], [ 0.7777777777777778, "#fb9f3a" ], [ 0.8888888888888888, "#fdca26" ], [ 1.0, "#f0f921" ] ] } ], "scatter": [ { "type": "scatter", "fillpattern": { "size": 10, "fillmode": "overlay", "solidity": 0.2 } } ], "surface": [ { "type": "surface", "colorbar": { "ticks": "", "outlinewidth": 0 }, "colorscale": [ [ 0.0, "#0d0887" ], [ 0.1111111111111111, "#46039f" ], [ 0.2222222222222222, "#7201a8" ], [ 0.3333333333333333, "#9c179e" ], [ 0.4444444444444444, "#bd3786" ], [ 0.5555555555555556, "#d8576b" ], [ 0.6666666666666666, "#ed7953" ], [ 0.7777777777777778, "#fb9f3a" ], [ 0.8888888888888888, "#fdca26" ], [ 1.0, "#f0f921" ] ] } ], "barpolar": [ { "type": "barpolar", "marker": { "line": { "color": "#E5ECF6", "width": 0.5 }, "pattern": { "size": 10, "fillmode": "overlay", "solidity": 0.2 } } } ], "heatmapgl": [ { "type": "heatmapgl", "colorbar": { "ticks": "", "outlinewidth": 0 }, "colorscale": [ [ 0.0, "#0d0887" ], [ 0.1111111111111111, "#46039f" ], [ 0.2222222222222222, "#7201a8" ], [ 0.3333333333333333, "#9c179e" ], [ 0.4444444444444444, "#bd3786" ], [ 0.5555555555555556, "#d8576b" ], [ 0.6666666666666666, "#ed7953" ], [ 0.7777777777777778, "#fb9f3a" ], [ 0.8888888888888888, "#fdca26" ], [ 1.0, "#f0f921" ] ] } ], "histogram": [ { "type": "histogram", "marker": { "pattern": { "size": 10, "fillmode": "overlay", "solidity": 0.2 } } } ], "parcoords": [ { "line": { "colorbar": { "ticks": "", "outlinewidth": 0 } }, "type": "parcoords" } ], "scatter3d": [ { "line": { "colorbar": { "ticks": "", "outlinewidth": 0 } }, "type": "scatter3d", "marker": { "colorbar": { "ticks": "", "outlinewidth": 0 } } } ], "scattergl": [ { "type": "scattergl", "marker": { "colorbar": { "ticks": "", "outlinewidth": 0 } } } ], "choropleth": [ { "type": "choropleth", "colorbar": { "ticks": "", "outlinewidth": 0 } } ], "scattergeo": [ { "type": "scattergeo", "marker": { "colorbar": { "ticks": "", "outlinewidth": 0 } } } ], "histogram2d": [ { "type": "histogram2d", "colorbar": { "ticks": "", "outlinewidth": 0 }, "colorscale": [ [ 0.0, "#0d0887" ], [ 0.1111111111111111, "#46039f" ], [ 0.2222222222222222, "#7201a8" ], [ 0.3333333333333333, "#9c179e" ], [ 0.4444444444444444, "#bd3786" ], [ 0.5555555555555556, "#d8576b" ], [ 0.6666666666666666, "#ed7953" ], [ 0.7777777777777778, "#fb9f3a" ], [ 0.8888888888888888, "#fdca26" ], [ 1.0, "#f0f921" ] ] } ], "scatterpolar": [ { "type": "scatterpolar", "marker": { "colorbar": { "ticks": "", "outlinewidth": 0 } } } ], "contourcarpet": [ { "type": "contourcarpet", "colorbar": { "ticks": "", "outlinewidth": 0 } } ], "scattercarpet": [ { "type": "scattercarpet", "marker": { "colorbar": { "ticks": "", "outlinewidth": 0 } } } ], "scattermapbox": [ { "type": "scattermapbox", "marker": { "colorbar": { "ticks": "", "outlinewidth": 0 } } } ], "scatterpolargl": [ { "type": "scatterpolargl", "marker": { "colorbar": { "ticks": "", "outlinewidth": 0 } } } ], "scatterternary": [ { "type": "scatterternary", "marker": { "colorbar": { "ticks": "", "outlinewidth": 0 } } } ], "histogram2dcontour": [ { "type": "histogram2dcontour", "colorbar": { "ticks": "", "outlinewidth": 0 }, "colorscale": [ [ 0.0, "#0d0887" ], [ 0.1111111111111111, "#46039f" ], [ 0.2222222222222222, "#7201a8" ], [ 0.3333333333333333, "#9c179e" ], [ 0.4444444444444444, "#bd3786" ], [ 0.5555555555555556, "#d8576b" ], [ 0.6666666666666666, "#ed7953" ], [ 0.7777777777777778, "#fb9f3a" ], [ 0.8888888888888888, "#fdca26" ], [ 1.0, "#f0f921" ] ] } ] }, "layout": { "geo": { "bgcolor": "white", "showland": true, "lakecolor": "white", "landcolor": "#E5ECF6", "showlakes": true, "subunitcolor": "white" }, "font": { "color": "#2a3f5f" }, "polar": { "bgcolor": "#E5ECF6", "radialaxis": { "ticks": "", "gridcolor": "white", "linecolor": "white" }, "angularaxis": { "ticks": "", "gridcolor": "white", "linecolor": "white" } }, "scene": { "xaxis": { "ticks": "", "gridcolor": "white", "gridwidth": 2, "linecolor": "white", "zerolinecolor": "white", "showbackground": true, "backgroundcolor": "#E5ECF6" }, "yaxis": { "ticks": "", "gridcolor": "white", "gridwidth": 2, "linecolor": "white", "zerolinecolor": "white", "showbackground": true, "backgroundcolor": "#E5ECF6" }, "zaxis": { "ticks": "", "gridcolor": "white", "gridwidth": 2, "linecolor": "white", "zerolinecolor": "white", "showbackground": true, "backgroundcolor": "#E5ECF6" } }, "title": { "x": 0.05 }, "xaxis": { "ticks": "", "title": { "standoff": 15 }, "gridcolor": "white", "linecolor": "white", "automargin": true, "zerolinecolor": "white", "zerolinewidth": 2 }, "yaxis": { "ticks": "", "title": { "standoff": 15 }, "gridcolor": "white", "linecolor": "white", "automargin": true, "zerolinecolor": "white", "zerolinewidth": 2 }, "mapbox": { "style": "light" }, "ternary": { "aaxis": { "ticks": "", "gridcolor": "white", "linecolor": "white" }, "baxis": { "ticks": "", "gridcolor": "white", "linecolor": "white" }, "caxis": { "ticks": "", "gridcolor": "white", "linecolor": "white" }, "bgcolor": "#E5ECF6" }, "colorway": [ "#636efa", "#EF553B", "#00cc96", "#ab63fa", "#FFA15A", "#19d3f3", "#FF6692", "#B6E880", "#FF97FF", "#FECB52" ], "coloraxis": { "colorbar": { "ticks": "", "outlinewidth": 0 } }, "hovermode": "closest", "colorscale": { "diverging": [ [ 0, "#8e0152" ], [ 0.1, "#c51b7d" ], [ 0.2, "#de77ae" ], [ 0.3, "#f1b6da" ], [ 0.4, "#fde0ef" ], [ 0.5, "#f7f7f7" ], [ 0.6, "#e6f5d0" ], [ 0.7, "#b8e186" ], [ 0.8, "#7fbc41" ], [ 0.9, "#4d9221" ], [ 1, "#276419" ] ], "sequential": [ [ 0.0, "#0d0887" ], [ 0.1111111111111111, "#46039f" ], [ 0.2222222222222222, "#7201a8" ], [ 0.3333333333333333, "#9c179e" ], [ 0.4444444444444444, "#bd3786" ], [ 0.5555555555555556, "#d8576b" ], [ 0.6666666666666666, "#ed7953" ], [ 0.7777777777777778, "#fb9f3a" ], [ 0.8888888888888888, "#fdca26" ], [ 1.0, "#f0f921" ] ], "sequentialminus": [ [ 0.0, "#0d0887" ], [ 0.1111111111111111, "#46039f" ], [ 0.2222222222222222, "#7201a8" ], [ 0.3333333333333333, "#9c179e" ], [ 0.4444444444444444, "#bd3786" ], [ 0.5555555555555556, "#d8576b" ], [ 0.6666666666666666, "#ed7953" ], [ 0.7777777777777778, "#fb9f3a" ], [ 0.8888888888888888, "#fdca26" ], [ 1.0, "#f0f921" ] ] }, "hoverlabel": { "align": "left" }, "plot_bgcolor": "#E5ECF6", "paper_bgcolor": "white", "shapedefaults": { "line": { "color": "#2a3f5f" } }, "autotypenumbers": "strict", "annotationdefaults": { "arrowhead": 0, "arrowcolor": "#2a3f5f", "arrowwidth": 1 } } }, "showlegend": false, "plot_bgcolor": "white" } }, "height": null, "width": null, "user": { "profile_url": "https://chart-studio.plotly.com/~dolsonaw", "avatar_url": "https://storage.googleapis.com/plotly-prod-profiles/9.jpg", "background_url": "https://storage.googleapis.com/plotly-prod-profiles/bg-0.jpg", "bio": "", "nickname": "", "website": "", "stream_tokens": null, "feature_set_id": null, "csrf_token": null, "date_joined": "2024-04-03 21:12:06", "mapbox_access_tokens": null, "has_password": null, "username": "dolsonaw", "email": null, "is_active": null, "readonly": null, "is_dash_creator": null, "dash_created_count": null, "is_chart_creator": null, "charts_created_count": null } }, { "creation_time": "2024-04-03T21:15:25.129815Z", "comments": { "results": [], "count": 0 }, "parented": true, "embed_url": "https://chart-studio.plotly.com/~dolsonaw/1.embed", "fid": "dolsonaw:1", "filename": "dps_report_Yan, Ricardo", "filetype": "plot", "img_url": "https://storage.googleapis.com/plotly-prod-images/dolsonaw/1/9_JSFPFAO4TKSOC382W4BRJCU7AODPS8.png", "image_urls": { "default": "https://storage.googleapis.com/plotly-prod-images/dolsonaw/1/2_E32U1QK1NZF20HMTQGMPCQ53PJUIYP.png", "block-thumb": "https://storage.googleapis.com/plotly-prod-images/dolsonaw/1/8_EE0V0GYVFFU9G67FRPCBULEL30WHET.png", "list-thumb": "https://storage.googleapis.com/plotly-prod-images/dolsonaw/1/9_JSFPFAO4TKSOC382W4BRJCU7AODPS8.png" }, "api_urls": { "files": "https://api.plotly.com/v2/files/dolsonaw:1", "plots": "https://api.plotly.com/v2/plots/dolsonaw:1", "parent": "https://api.plotly.com/v2/folders/home?user=dolsonaw" }, "owner": "dolsonaw", "parent": -1, "preview": "", "referencers": [], "references": [], "title": "", "views": 1, "web_url": "https://chart-studio.plotly.com/~dolsonaw/1/", "world_readable": true, "date_modified": "2024-04-03T21:15:25.140Z", "stars": { "results": [], "count": 0 }, "collaborators": { "results": [], "count": 0 }, "subfolder_count": null, "refresh_interval": null, "organize_view_url": "https://chart-studio.plotly.com/~dolsonaw/1/", "current_user_permission": "read", "is_theme": null, "is_template": null, "autosize": true, "caption": "", "figure": { "data": [ { "mode": "markers", "name": "Sinker", "type": "scatter", "xsrc": "dolsonaw:0:39c330", "ysrc": "dolsonaw:0:6d5fce", "xaxis": "x", "yaxis": "y", "marker": { "size": 7, "color": "red", "symbol": "circle", "opacity": 0.8, "sizeref": 0.229486625, "sizemode": "area" }, "showlegend": true, "legendgroup": "Sinker", "orientation": "v", "customdatasrc": "dolsonaw:0:c0547d", "hovertemplate": "AutoPitchType=%{customdata[1]}<br>Horizontal Break=%{x}<br>Induced Vertical Break=%{y}<br>RelSpeed=%{customdata[0]}<extra></extra>" }, { "mode": "markers", "name": "Curveball", "type": "scatter", "xsrc": "dolsonaw:0:8537fd", "ysrc": "dolsonaw:0:053d6f", "xaxis": "x", "yaxis": "y", "marker": { "size": 7, "color": "violet", "symbol": "circle", "opacity": 0.8, "sizeref": 0.229486625, "sizemode": "area" }, "showlegend": true, "legendgroup": "Curveball", "orientation": "v", "customdatasrc": "dolsonaw:0:9cdbd3", "hovertemplate": "AutoPitchType=%{customdata[1]}<br>Horizontal Break=%{x}<br>Induced Vertical Break=%{y}<br>RelSpeed=%{customdata[0]}<extra></extra>" }, { "mode": "markers", "name": "Changeup", "type": "scatter", "xsrc": "dolsonaw:0:506b25", "ysrc": "dolsonaw:0:23b07c", "xaxis": "x", "yaxis": "y", "marker": { "size": 7, "color": "orange", "symbol": "circle", "opacity": 0.8, "sizeref": 0.229486625, "sizemode": "area" }, "showlegend": true, "legendgroup": "Changeup", "orientation": "v", "customdatasrc": "dolsonaw:0:e7cc1f", "hovertemplate": "AutoPitchType=%{customdata[1]}<br>Horizontal Break=%{x}<br>Induced Vertical Break=%{y}<br>RelSpeed=%{customdata[0]}<extra></extra>" } ], "layout": { "title": { "x": 0.5, "y": 0.95, "font": { "size": 24, "family": "Exo 2" }, "text": "DPS Report - Yan, Ricardo", "xanchor": "center", "yanchor": "top" }, "xaxis": { "range": [ -25, 25 ], "ticks": "outside", "title": { "text": "Horizontal Break" }, "anchor": "y", "domain": [ 0.0, 1.0 ], "showline": true, "tickfont": { "size": 12, "family": "Exo 2" }, "gridcolor": "lightgray", "linecolor": "black", "linewidth": 1, "tickcolor": "black", "tickwidth": 1 }, "yaxis": { "range": [ -25, 25 ], "ticks": "outside", "title": { "text": "Induced Vertical Break" }, "anchor": "x", "domain": [ 0.0, 1.0 ], "showline": true, "tickfont": { "size": 12, "family": "Exo 2" }, "gridcolor": "lightgray", "linecolor": "black", "linewidth": 1, "tickcolor": "black", "tickwidth": 1 }, "legend": { "title": { "text": "AutoPitchType" }, "itemsizing": "constant", "tracegroupgap": 0 }, "shapes": [ { "x0": 0, "x1": 0, "y0": -25, "y1": 25, "line": { "color": "black", "width": 1 }, "type": "line", "xref": "x", "yref": "y" }, { "x0": -25, "x1": 25, "y0": 0, "y1": 0, "line": { "color": "black", "width": 1 }, "type": "line", "xref": "x", "yref": "y" }, { "x0": 10.98968181818182, "x1": 16.989681818181822, "y0": -1.792400909090909, "y1": 4.207599090909091, "line": { "color": "rgba(0,0,0,0)", "width": 1 }, "type": "circle", "opacity": 0.3, "fillcolor": "orange" }, { "x0": -22.371600833333336, "x1": -16.371600833333336, "y0": -4.0135233333333336, "y1": 1.9864766666666667, "line": { "color": "rgba(0,0,0,0)", "width": 1 }, "type": "circle", "opacity": 0.3, "fillcolor": "violet" }, { "x0": 11.942465897435897, "x1": 17.942465897435895, "y0": -1.0876341025641028, "y1": 4.9123658974358975, "line": { "color": "rgba(0,0,0,0)", "width": 1 }, "type": "circle", "opacity": 0.3, "fillcolor": "red" } ], "template": { "data": { "bar": [ { "type": "bar", "marker": { "line": { "color": "#E5ECF6", "width": 0.5 }, "pattern": { "size": 10, "fillmode": "overlay", "solidity": 0.2 } }, "error_x": { "color": "#2a3f5f" }, "error_y": { "color": "#2a3f5f" } } ], "pie": [ { "type": "pie", "automargin": true } ], "table": [ { "type": "table", "cells": { "fill": { "color": "#EBF0F8" }, "line": { "color": "white" } }, "header": { "fill": { "color": "#C8D4E3" }, "line": { "color": "white" } } } ], "carpet": [ { "type": "carpet", "aaxis": { "gridcolor": "white", "linecolor": "white", "endlinecolor": "#2a3f5f", "minorgridcolor": "white", "startlinecolor": "#2a3f5f" }, "baxis": { "gridcolor": "white", "linecolor": "white", "endlinecolor": "#2a3f5f", "minorgridcolor": "white", "startlinecolor": "#2a3f5f" } } ], "mesh3d": [ { "type": "mesh3d", "colorbar": { "ticks": "", "outlinewidth": 0 } } ], "contour": [ { "type": "contour", "colorbar": { "ticks": "", "outlinewidth": 0 }, "colorscale": [ [ 0.0, "#0d0887" ], [ 0.1111111111111111, "#46039f" ], [ 0.2222222222222222, "#7201a8" ], [ 0.3333333333333333, "#9c179e" ], [ 0.4444444444444444, "#bd3786" ], [ 0.5555555555555556, "#d8576b" ], [ 0.6666666666666666, "#ed7953" ], [ 0.7777777777777778, "#fb9f3a" ], [ 0.8888888888888888, "#fdca26" ], [ 1.0, "#f0f921" ] ] } ], "heatmap": [ { "type": "heatmap", "colorbar": { "ticks": "", "outlinewidth": 0 }, "colorscale": [ [ 0.0, "#0d0887" ], [ 0.1111111111111111, "#46039f" ], [ 0.2222222222222222, "#7201a8" ], [ 0.3333333333333333, "#9c179e" ], [ 0.4444444444444444, "#bd3786" ], [ 0.5555555555555556, "#d8576b" ], [ 0.6666666666666666, "#ed7953" ], [ 0.7777777777777778, "#fb9f3a" ], [ 0.8888888888888888, "#fdca26" ], [ 1.0, "#f0f921" ] ] } ], "scatter": [ { "type": "scatter", "fillpattern": { "size": 10, "fillmode": "overlay", "solidity": 0.2 } } ], "surface": [ { "type": "surface", "colorbar": { "ticks": "", "outlinewidth": 0 }, "colorscale": [ [ 0.0, "#0d0887" ], [ 0.1111111111111111, "#46039f" ], [ 0.2222222222222222, "#7201a8" ], [ 0.3333333333333333, "#9c179e" ], [ 0.4444444444444444, "#bd3786" ], [ 0.5555555555555556, "#d8576b" ], [ 0.6666666666666666, "#ed7953" ], [ 0.7777777777777778, "#fb9f3a" ], [ 0.8888888888888888, "#fdca26" ], [ 1.0, "#f0f921" ] ] } ], "barpolar": [ { "type": "barpolar", "marker": { "line": { "color": "#E5ECF6", "width": 0.5 }, "pattern": { "size": 10, "fillmode": "overlay", "solidity": 0.2 } } } ], "heatmapgl": [ { "type": "heatmapgl", "colorbar": { "ticks": "", "outlinewidth": 0 }, "colorscale": [ [ 0.0, "#0d0887" ], [ 0.1111111111111111, "#46039f" ], [ 0.2222222222222222, "#7201a8" ], [ 0.3333333333333333, "#9c179e" ], [ 0.4444444444444444, "#bd3786" ], [ 0.5555555555555556, "#d8576b" ], [ 0.6666666666666666, "#ed7953" ], [ 0.7777777777777778, "#fb9f3a" ], [ 0.8888888888888888, "#fdca26" ], [ 1.0, "#f0f921" ] ] } ], "histogram": [ { "type": "histogram", "marker": { "pattern": { "size": 10, "fillmode": "overlay", "solidity": 0.2 } } } ], "parcoords": [ { "line": { "colorbar": { "ticks": "", "outlinewidth": 0 } }, "type": "parcoords" } ], "scatter3d": [ { "line": { "colorbar": { "ticks": "", "outlinewidth": 0 } }, "type": "scatter3d", "marker": { "colorbar": { "ticks": "", "outlinewidth": 0 } } } ], "scattergl": [ { "type": "scattergl", "marker": { "colorbar": { "ticks": "", "outlinewidth": 0 } } } ], "choropleth": [ { "type": "choropleth", "colorbar": { "ticks": "", "outlinewidth": 0 } } ], "scattergeo": [ { "type": "scattergeo", "marker": { "colorbar": { "ticks": "", "outlinewidth": 0 } } } ], "histogram2d": [ { "type": "histogram2d", "colorbar": { "ticks": "", "outlinewidth": 0 }, "colorscale": [ [ 0.0, "#0d0887" ], [ 0.1111111111111111, "#46039f" ], [ 0.2222222222222222, "#7201a8" ], [ 0.3333333333333333, "#9c179e" ], [ 0.4444444444444444, "#bd3786" ], [ 0.5555555555555556, "#d8576b" ], [ 0.6666666666666666, "#ed7953" ], [ 0.7777777777777778, "#fb9f3a" ], [ 0.8888888888888888, "#fdca26" ], [ 1.0, "#f0f921" ] ] } ], "scatterpolar": [ { "type": "scatterpolar", "marker": { "colorbar": { "ticks": "", "outlinewidth": 0 } } } ], "contourcarpet": [ { "type": "contourcarpet", "colorbar": { "ticks": "", "outlinewidth": 0 } } ], "scattercarpet": [ { "type": "scattercarpet", "marker": { "colorbar": { "ticks": "", "outlinewidth": 0 } } } ], "scattermapbox": [ { "type": "scattermapbox", "marker": { "colorbar": { "ticks": "", "outlinewidth": 0 } } } ], "scatterpolargl": [ { "type": "scatterpolargl", "marker": { "colorbar": { "ticks": "", "outlinewidth": 0 } } } ], "scatterternary": [ { "type": "scatterternary", "marker": { "colorbar": { "ticks": "", "outlinewidth": 0 } } } ], "histogram2dcontour": [ { "type": "histogram2dcontour", "colorbar": { "ticks": "", "outlinewidth": 0 }, "colorscale": [ [ 0.0, "#0d0887" ], [ 0.1111111111111111, "#46039f" ], [ 0.2222222222222222, "#7201a8" ], [ 0.3333333333333333, "#9c179e" ], [ 0.4444444444444444, "#bd3786" ], [ 0.5555555555555556, "#d8576b" ], [ 0.6666666666666666, "#ed7953" ], [ 0.7777777777777778, "#fb9f3a" ], [ 0.8888888888888888, "#fdca26" ], [ 1.0, "#f0f921" ] ] } ] }, "layout": { "geo": { "bgcolor": "white", "showland": true, "lakecolor": "white", "landcolor": "#E5ECF6", "showlakes": true, "subunitcolor": "white" }, "font": { "color": "#2a3f5f" }, "polar": { "bgcolor": "#E5ECF6", "radialaxis": { "ticks": "", "gridcolor": "white", "linecolor": "white" }, "angularaxis": { "ticks": "", "gridcolor": "white", "linecolor": "white" } }, "scene": { "xaxis": { "ticks": "", "gridcolor": "white", "gridwidth": 2, "linecolor": "white", "zerolinecolor": "white", "showbackground": true, "backgroundcolor": "#E5ECF6" }, "yaxis": { "ticks": "", "gridcolor": "white", "gridwidth": 2, "linecolor": "white", "zerolinecolor": "white", "showbackground": true, "backgroundcolor": "#E5ECF6" }, "zaxis": { "ticks": "", "gridcolor": "white", "gridwidth": 2, "linecolor": "white", "zerolinecolor": "white", "showbackground": true, "backgroundcolor": "#E5ECF6" } }, "title": { "x": 0.05 }, "xaxis": { "ticks": "", "title": { "standoff": 15 }, "gridcolor": "white", "linecolor": "white", "automargin": true, "zerolinecolor": "white", "zerolinewidth": 2 }, "yaxis": { "ticks": "", "title": { "standoff": 15 }, "gridcolor": "white", "linecolor": "white", "automargin": true, "zerolinecolor": "white", "zerolinewidth": 2 }, "mapbox": { "style": "light" }, "ternary": { "aaxis": { "ticks": "", "gridcolor": "white", "linecolor": "white" }, "baxis": { "ticks": "", "gridcolor": "white", "linecolor": "white" }, "caxis": { "ticks": "", "gridcolor": "white", "linecolor": "white" }, "bgcolor": "#E5ECF6" }, "colorway": [ "#636efa", "#EF553B", "#00cc96", "#ab63fa", "#FFA15A", "#19d3f3", "#FF6692", "#B6E880", "#FF97FF", "#FECB52" ], "coloraxis": { "colorbar": { "ticks": "", "outlinewidth": 0 } }, "hovermode": "closest", "colorscale": { "diverging": [ [ 0, "#8e0152" ], [ 0.1, "#c51b7d" ], [ 0.2, "#de77ae" ], [ 0.3, "#f1b6da" ], [ 0.4, "#fde0ef" ], [ 0.5, "#f7f7f7" ], [ 0.6, "#e6f5d0" ], [ 0.7, "#b8e186" ], [ 0.8, "#7fbc41" ], [ 0.9, "#4d9221" ], [ 1, "#276419" ] ], "sequential": [ [ 0.0, "#0d0887" ], [ 0.1111111111111111, "#46039f" ], [ 0.2222222222222222, "#7201a8" ], [ 0.3333333333333333, "#9c179e" ], [ 0.4444444444444444, "#bd3786" ], [ 0.5555555555555556, "#d8576b" ], [ 0.6666666666666666, "#ed7953" ], [ 0.7777777777777778, "#fb9f3a" ], [ 0.8888888888888888, "#fdca26" ], [ 1.0, "#f0f921" ] ], "sequentialminus": [ [ 0.0, "#0d0887" ], [ 0.1111111111111111, "#46039f" ], [ 0.2222222222222222, "#7201a8" ], [ 0.3333333333333333, "#9c179e" ], [ 0.4444444444444444, "#bd3786" ], [ 0.5555555555555556, "#d8576b" ], [ 0.6666666666666666, "#ed7953" ], [ 0.7777777777777778, "#fb9f3a" ], [ 0.8888888888888888, "#fdca26" ], [ 1.0, "#f0f921" ] ] }, "hoverlabel": { "align": "left" }, "plot_bgcolor": "#E5ECF6", "paper_bgcolor": "white", "shapedefaults": { "line": { "color": "#2a3f5f" } }, "autotypenumbers": "strict", "annotationdefaults": { "arrowhead": 0, "arrowcolor": "#2a3f5f", "arrowwidth": 1 } } }, "showlegend": false, "plot_bgcolor": "white" } }, "height": null, "width": null, "user": { "profile_url": "https://chart-studio.plotly.com/~dolsonaw", "avatar_url": "https://storage.googleapis.com/plotly-prod-profiles/9.jpg", "background_url": "https://storage.googleapis.com/plotly-prod-profiles/bg-0.jpg", "bio": "", "nickname": "", "website": "", "stream_tokens": null, "feature_set_id": null, "csrf_token": null, "date_joined": "2024-04-03 21:12:06", "mapbox_access_tokens": null, "has_password": null, "username": "dolsonaw", "email": null, "is_active": null, "readonly": null, "is_dash_creator": null, "dash_created_count": null, "is_chart_creator": null, "charts_created_count": null } }, { "creation_time": "2024-04-03T21:15:01.908298Z", "comments": { "results": [], "count": 0 }, "parented": true, "embed_url": "https://chart-studio.plotly.com/~al6170/45.embed", "fid": "al6170:45", "filename": "Plot 45", "filetype": "plot", "img_url": "https://storage.googleapis.com/plotly-prod-images/al6170/45/9_PUD60FLOAASKWB9GTI5EJUWYAYWGNJ.png", "image_urls": { "default": "https://storage.googleapis.com/plotly-prod-images/al6170/45/2_2Y517T4CEIHA1L5T1M8BB4CBC89D5F.png", "block-thumb": "https://storage.googleapis.com/plotly-prod-images/al6170/45/8_IPVSXRVXK15QC8Q8CPWMINXERJAYOV.png", "list-thumb": "https://storage.googleapis.com/plotly-prod-images/al6170/45/9_PUD60FLOAASKWB9GTI5EJUWYAYWGNJ.png" }, "api_urls": { "files": "https://api.plotly.com/v2/files/al6170:45", "plots": "https://api.plotly.com/v2/plots/al6170:45", "parent": "https://api.plotly.com/v2/folders/home?user=al6170" }, "owner": "al6170", "parent": -1, "preview": "", "referencers": [], "references": [], "title": "", "views": 1, "web_url": "https://chart-studio.plotly.com/~al6170/45/", "world_readable": true, "date_modified": "2024-04-03T21:15:01.918Z", "stars": { "results": [], "count": 0 }, "collaborators": { "results": [], "count": 0 }, "subfolder_count": null, "refresh_interval": null, "organize_view_url": "https://chart-studio.plotly.com/~al6170/45/", "current_user_permission": "read", "is_theme": null, "is_template": false, "autosize": true, "caption": "", "figure": { "data": [ { "meta": { "columnNames": { "x": "Frequency (Hz)", "y": "Level (dB)" } }, "mode": "lines", "name": "Original", "type": "scatter", "xsrc": "al6170:41:d46904", "ysrc": "al6170:42:52898e" }, { "meta": { "columnNames": { "x": "Frequency (Hz)", "y": "Level (dB)" } }, "mode": "lines", "name": "Stimulus", "type": "scatter", "xsrc": "al6170:41:d46904", "ysrc": "al6170:41:cf0514", "stackgroup": null }, { "meta": { "columnNames": { "x": "Frequency (Hz)", "y": "Variance" } }, "mode": "lines", "name": "Non-Visual", "type": "scatter", "xsrc": "al6170:41:d46904", "ysrc": "al6170:43:bb8343", "yaxis": "y2", "stackgroup": null }, { "meta": { "columnNames": { "x": "Frequency (Hz)", "y": "Variance" } }, "mode": "lines", "name": "Visual", "type": "scatter", "xsrc": "al6170:41:d46904", "ysrc": "al6170:44:1475d4", "yaxis": "y2", "stackgroup": null } ], "frames": [], "layout": { "title": { "text": "Variance Compared to Visual & Non-Visual Frequency Response Stimulus 1" }, "xaxis": { "type": "log", "range": [ 1.3331086346429708, 4.342984270878669 ], "title": { "text": "Frequency (Hz)" }, "autorange": true }, "yaxis": { "type": "linear", "range": [ -120, 60 ], "title": { "text": "Level (dBFS)" }, "autorange": false }, "yaxis2": { "side": "right", "type": "linear", "range": [ -120, 60 ], "title": { "text": "Variance" }, "autorange": false, "overlaying": "y" }, "autosize": true, "template": { "data": { "bar": [ { "type": "bar", "marker": { "colorbar": { "ticks": "", "outlinewidth": 0 } } } ], "table": [ { "type": "table", "cells": { "fill": { "color": "#EBF0F8" }, "line": { "color": "white" } }, "header": { "fill": { "color": "#C8D4E3" }, "line": { "color": "white" } } } ], "carpet": [ { "type": "carpet", "aaxis": { "gridcolor": "#C8D4E3", "linecolor": "#C8D4E3", "endlinecolor": "#2a3f5f", "minorgridcolor": "#C8D4E3", "startlinecolor": "#2a3f5f" }, "baxis": { "gridcolor": "#C8D4E3", "linecolor": "#C8D4E3", "endlinecolor": "#2a3f5f", "minorgridcolor": "#C8D4E3", "startlinecolor": "#2a3f5f" } } ], "mesh3d": [ { "type": "mesh3d", "colorbar": { "ticks": "", "outlinewidth": 0 } } ], "contour": [ { "type": "contour", "colorbar": { "ticks": "", "outlinewidth": 0 }, "autocolorscale": true } ], "heatmap": [ { "type": "heatmap", "colorbar": { "ticks": "", "outlinewidth": 0 }, "autocolorscale": true } ], "scatter": [ { "type": "scatter", "marker": { "colorbar": { "ticks": "", "outlinewidth": 0 } } } ], "surface": [ { "type": "surface", "colorbar": { "ticks": "", "outlinewidth": 0 } } ], "heatmapgl": [ { "type": "heatmapgl", "colorbar": { "ticks": "", "outlinewidth": 0 } } ], "histogram": [ { "type": "histogram", "marker": { "colorbar": { "ticks": "", "outlinewidth": 0 } } } ], "parcoords": [ { "line": { "colorbar": { "ticks": "", "outlinewidth": 0 } }, "type": "parcoords" } ], "scatter3d": [ { "type": "scatter3d", "marker": { "colorbar": { "ticks": "", "outlinewidth": 0 } } } ], "scattergl": [ { "type": "scattergl", "marker": { "colorbar": { "ticks": "", "outlinewidth": 0 } } } ], "choropleth": [ { "type": "choropleth", "colorbar": { "ticks": "", "outlinewidth": 0 } } ], "scattergeo": [ { "type": "scattergeo", "marker": { "colorbar": { "ticks": "", "outlinewidth": 0 } } } ], "histogram2d": [ { "type": "histogram2d", "colorbar": { "ticks": "", "outlinewidth": 0 }, "autocolorscale": true } ], "scatterpolar": [ { "type": "scatterpolar", "marker": { "colorbar": { "ticks": "", "outlinewidth": 0 } } } ], "contourcarpet": [ { "type": "contourcarpet", "colorbar": { "ticks": "", "outlinewidth": 0 } } ], "scattercarpet": [ { "type": "scattercarpet", "marker": { "colorbar": { "ticks": "", "outlinewidth": 0 } } } ], "scattermapbox": [ { "type": "scattermapbox", "marker": { "colorbar": { "ticks": "", "outlinewidth": 0 } } } ], "scatterpolargl": [ { "type": "scatterpolargl", "marker": { "colorbar": { "ticks": "", "outlinewidth": 0 } } } ], "scatterternary": [ { "type": "scatterternary", "marker": { "colorbar": { "ticks": "", "outlinewidth": 0 } } } ], "histogram2dcontour": [ { "type": "histogram2dcontour", "colorbar": { "ticks": "", "outlinewidth": 0 }, "autocolorscale": true } ] }, "layout": { "geo": { "bgcolor": "white", "showland": true, "lakecolor": "white", "landcolor": "white", "showlakes": true, "subunitcolor": "#C8D4E3" }, "font": { "color": "#2a3f5f" }, "polar": { "bgcolor": "white", "radialaxis": { "ticks": "", "gridcolor": "#EBF0F8", "linecolor": "#EBF0F8" }, "angularaxis": { "ticks": "", "gridcolor": "#EBF0F8", "linecolor": "#EBF0F8" } }, "scene": { "xaxis": { "ticks": "", "gridcolor": "#DFE8F3", "gridwidth": 2, "linecolor": "#EBF0F8", "zerolinecolor": "#EBF0F8", "showbackground": true, "backgroundcolor": "white" }, "yaxis": { "ticks": "", "gridcolor": "#DFE8F3", "gridwidth": 2, "linecolor": "#EBF0F8", "zerolinecolor": "#EBF0F8", "showbackground": true, "backgroundcolor": "white" }, "zaxis": { "ticks": "", "gridcolor": "#DFE8F3", "gridwidth": 2, "linecolor": "#EBF0F8", "zerolinecolor": "#EBF0F8", "showbackground": true, "backgroundcolor": "white" } }, "title": { "x": 0.05 }, "xaxis": { "ticks": "", "gridcolor": "#EBF0F8", "linecolor": "#EBF0F8", "automargin": true, "zerolinecolor": "#EBF0F8", "zerolinewidth": 2 }, "yaxis": { "ticks": "", "gridcolor": "#EBF0F8", "linecolor": "#EBF0F8", "automargin": true, "zerolinecolor": "#EBF0F8", "zerolinewidth": 2 }, "ternary": { "aaxis": { "ticks": "", "gridcolor": "#DFE8F3", "linecolor": "#A2B1C6" }, "baxis": { "ticks": "", "gridcolor": "#DFE8F3", "linecolor": "#A2B1C6" }, "caxis": { "ticks": "", "gridcolor": "#DFE8F3", "linecolor": "#A2B1C6" }, "bgcolor": "white" }, "colorway": [ "#636efa", "#EF553B", "#00cc96", "#ab63fa", "#19d3f3", "#e763fa", "#fecb52", "#ffa15a", "#ff6692", "#b6e880" ], "hovermode": "closest", "colorscale": { "diverging": [ [ 0, "#8e0152" ], [ 0.1, "#c51b7d" ], [ 0.2, "#de77ae" ], [ 0.3, "#f1b6da" ], [ 0.4, "#fde0ef" ], [ 0.5, "#f7f7f7" ], [ 0.6, "#e6f5d0" ], [ 0.7, "#b8e186" ], [ 0.8, "#7fbc41" ], [ 0.9, "#4d9221" ], [ 1, "#276419" ] ], "sequential": [ [ 0, "#0508b8" ], [ 0.0893854748603352, "#1910d8" ], [ 0.1787709497206704, "#3c19f0" ], [ 0.2681564245810056, "#6b1cfb" ], [ 0.3575418994413408, "#981cfd" ], [ 0.44692737430167595, "#bf1cfd" ], [ 0.5363128491620112, "#dd2bfd" ], [ 0.6256983240223464, "#f246fe" ], [ 0.7150837988826816, "#fc67fd" ], [ 0.8044692737430168, "#fe88fc" ], [ 0.8938547486033519, "#fea5fd" ], [ 0.9832402234636871, "#febefe" ], [ 1, "#fec3fe" ] ], "sequentialminus": [ [ 0, "#0508b8" ], [ 0.0893854748603352, "#1910d8" ], [ 0.1787709497206704, "#3c19f0" ], [ 0.2681564245810056, "#6b1cfb" ], [ 0.3575418994413408, "#981cfd" ], [ 0.44692737430167595, "#bf1cfd" ], [ 0.5363128491620112, "#dd2bfd" ], [ 0.6256983240223464, "#f246fe" ], [ 0.7150837988826816, "#fc67fd" ], [ 0.8044692737430168, "#fe88fc" ], [ 0.8938547486033519, "#fea5fd" ], [ 0.9832402234636871, "#febefe" ], [ 1, "#fec3fe" ] ] }, "plot_bgcolor": "white", "paper_bgcolor": "white", "shapedefaults": { "line": { "width": 0 }, "opacity": 0.4, "fillcolor": "#506784" }, "annotationdefaults": { "arrowhead": 0, "arrowcolor": "#506784", "arrowwidth": 1 } }, "themeRef": "PLOTLY_WHITE" } } }, "height": null, "width": null, "user": { "profile_url": "https://chart-studio.plotly.com/~al6170", "avatar_url": "https://storage.googleapis.com/plotly-prod-profiles/69.jpg", "background_url": "https://storage.googleapis.com/plotly-prod-profiles/bg-6.jpg", "bio": "", "nickname": "", "website": "", "stream_tokens": null, "feature_set_id": null, "csrf_token": null, "date_joined": "2024-02-12 13:03:15", "mapbox_access_tokens": null, "has_password": null, "username": "al6170", "email": null, "is_active": null, "readonly": null, "is_dash_creator": null, "dash_created_count": null, "is_chart_creator": null, "charts_created_count": null } } ] }
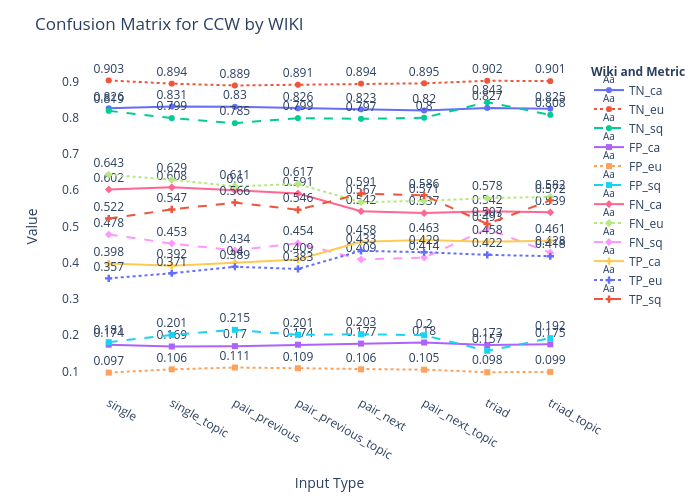
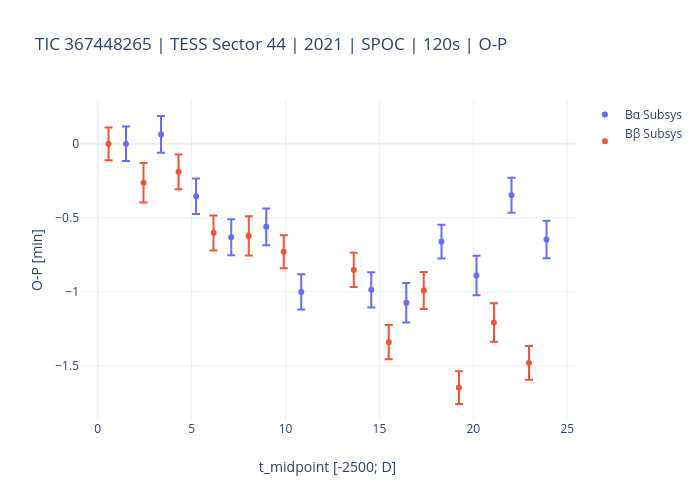