Plots List
Plots
This endpoint handles manipulation of Plotly plot files.
Reference
Authorization
Any user with or without a Plotly account may view public plots. For private plots, see authentication.
Actions
list
Listing all public plots can be done via a GET request to this endpoint.
By default, plots will be listed in order of date created. The order_by
query parameter is accepted at this endpoint. Currently, only ordering by
views is supported. It is possible to filter the plots by quality
with min_quality or max_quality as query parameter.
Example:
// GET https://api.plotly.com/v2/plots/ ---> 200

// GET https://api.plotly.com/v2/plots/?order_by=-views ---> 200

// GET https://api.plotly.com/v2/plots/?min_quality=5 ---> 200

// GET https://api.plotly.com/v2/plots/?max_quality=5 ---> 200
feed
Listing all handpicked feed plots can be done via a GET request to this endpoint. By default, plots will be listed in a random order.
Example:
// GET https://api.plotly.com/v2/plots/feed ---> 200
create
You can create new plot resources here. The only required field is 'figure'. Currently, the figure is restricted to only contain references to grid data. That is, this will fail if raw data arrays are passed in. To create and manipulate underlying grids for plots, see the grids endpoint.
Example:
// This fails because a figure field is required.
// POST https://api.plotly.com/v2/plots ---> 400 Bad Request
{}

// This fails because the figure has raw data
//POST https://api.plotly.com/v2/plots ---> 400 Bad Request
{
    "figure": {"data": [{"y": ['this', 'is', 'raw', 'data']}]}
}

// This succeeds because the figure has src keys, not raw data.
//POST https://api.plotly.com/v2/plots ---> 200 OK
{
    "figure": {"data": [{"ysrc": "sven:88:u8nd62"}]}
}
When creating a grid, you can optionally specify a source_fid to specify where a plot has come from:
- source_fid: the fid of a plot that was copied (and presumably edited) to produce this one
detail
There is a lot of meta information stored about plot files including filename, title, share_url, and content_url to name a few.
This information can only be reached with a GET to this endpoint.
Example:
// GET https://api.plotly.com/v2/plots/iheartgraphs:90
content
The contents of a plot can be downloaded via the content resource. The plot
content contains referenced grid/column data by default. If you wish to
return the raw grid/column data, the inline_data=true query must be included
in the request url. The Content-Type header will be appropriately set for the
response body.
Alternatively, you can set ?map_data=unreadable to append a mapping of
sources to data that belongs to grids which are unreadable for the
requestor. This is useful when you have read access to another users plot,
but that plot contains grid references which you don't have access to.
Examples:
// Returns referenced grid/column data
// GET https://api.plotly.com/v2/plots/iheartgraphs:90/content ---> 200 OK

// Returns full grid/column data
// GET https://api.plotly.com/v2/plots/iheartgraphs:90/content?inline_data=true ---> 200 OK

// Returns full grid/column data when requestor doesn't have permission
// to read the referenced grid.
// GET https://api.plotly.com/v2/plots/iheartgraphs:90/content?map_data=unreadable ---> 200 OK
GET /v2/plots?cursor=cD0yMDI0LTA0LTAyKzIxJTNBMzklM0EwMi45ODA2NjUlMkIwMCUzQTAw&format=api
{ "next": "https://api.plot.ly/v2/plots?cursor=cD0yMDI0LTA0LTAyKzIwJTNBNTUlM0EzOS44NDE3NzAlMkIwMCUzQTAw&format=api", "previous": "https://api.plot.ly/v2/plots?cursor=cj0xJnA9MjAyNC0wNC0wMisyMSUzQTM2JTNBMjMuOTAwMjAwJTJCMDAlM0EwMA%3D%3D&format=api", "results": [ { "creation_time": "2024-04-02T21:36:23.900200Z", "comments": { "results": [], "count": 0 }, "parented": true, "embed_url": "https://chart-studio.plotly.com/~joreilly86/1.embed", "fid": "joreilly86:1", "filename": "Riprap-Ishbash Curve-Digitized", "filetype": "plot", "img_url": "https://storage.googleapis.com/plotly-prod-images/joreilly86/1/9_J6LCEA3P2YPZWH4EEHXBP2KJQOGWAY.png", "image_urls": { "default": "https://storage.googleapis.com/plotly-prod-images/joreilly86/1/2_JXWW1IMVARBVOOHKFYCCWYM1WBHM9N.png", "block-thumb": "https://storage.googleapis.com/plotly-prod-images/joreilly86/1/8_CI5BPCWJZ27OVCP32IAITHUIVZ1QDA.png", "list-thumb": "https://storage.googleapis.com/plotly-prod-images/joreilly86/1/9_J6LCEA3P2YPZWH4EEHXBP2KJQOGWAY.png" }, "api_urls": { "files": "https://api.plotly.com/v2/files/joreilly86:1", "plots": "https://api.plotly.com/v2/plots/joreilly86:1", "parent": "https://api.plotly.com/v2/folders/home?user=joreilly86" }, "owner": "joreilly86", "parent": -1, "preview": "", "referencers": [], "references": [], "title": "", "views": 1, "web_url": "https://chart-studio.plotly.com/~joreilly86/1/", "world_readable": true, "date_modified": "2024-04-02T21:37:05.109Z", "stars": { "results": [], "count": 0 }, "collaborators": { "results": [], "count": 0 }, "subfolder_count": null, "refresh_interval": null, "organize_view_url": "https://chart-studio.plotly.com/~joreilly86/1/", "current_user_permission": "read", "is_theme": null, "is_template": false, "autosize": true, "caption": "", "figure": { "data": [ { "meta": { "columnNames": { "x": "A", "y": "B" } }, "mode": "lines", "type": "scatter", "xsrc": "joreilly86:0:c3f6fc", "ysrc": "joreilly86:0:611e0e" } ], "frames": [], "layout": { "title": { "text": "Rock Size Based on Ishbash Curve" }, "xaxis": { "type": "linear", "range": [ 1.6764, 19.669 ], "title": { "text": "Velocity (ft/s)" }, "autorange": true }, "yaxis": { "type": "linear", "range": [ -3.7327566666666665, 59.74277666666667 ], "title": { "text": "Diameter of Stone (in)" }, "autorange": true }, "autosize": true, "template": { "data": { "bar": [ { "type": "bar", "marker": { "colorbar": { "ticks": "", "outlinewidth": 0 } } } ], "table": [ { "type": "table", "cells": { "fill": { "color": "#506784" }, "line": { "color": "rgb(17,17,17)" } }, "header": { "fill": { "color": "#2a3f5f" }, "line": { "color": "rgb(17,17,17)" } } } ], "carpet": [ { "type": "carpet", "aaxis": { "gridcolor": "#506784", "linecolor": "#506784", "endlinecolor": "#A2B1C6", "minorgridcolor": "#506784", "startlinecolor": "#A2B1C6" }, "baxis": { "gridcolor": "#506784", "linecolor": "#506784", "endlinecolor": "#A2B1C6", "minorgridcolor": "#506784", "startlinecolor": "#A2B1C6" } } ], "mesh3d": [ { "type": "mesh3d", "colorbar": { "ticks": "", "outlinewidth": 0 } } ], "contour": [ { "type": "contour", "colorbar": { "ticks": "", "outlinewidth": 0 }, "autocolorscale": true } ], "heatmap": [ { "type": "heatmap", "colorbar": { "ticks": "", "outlinewidth": 0 }, "autocolorscale": true } ], "scatter": [ { "type": "scatter", "marker": { "colorbar": { "ticks": "", "outlinewidth": 0 } } } ], "surface": [ { "type": "surface", "colorbar": { "ticks": "", "outlinewidth": 0 } } ], "heatmapgl": [ { "type": "heatmapgl", "colorbar": { "ticks": "", "outlinewidth": 0 } } ], "histogram": [ { "type": "histogram", "marker": { "colorbar": { "ticks": "", "outlinewidth": 0 } } } ], "parcoords": [ { "line": { "colorbar": { "ticks": "", "outlinewidth": 0 } }, "type": "parcoords" } ], "scatter3d": [ { "type": "scatter3d", "marker": { "colorbar": { "ticks": "", "outlinewidth": 0 } } } ], "scattergl": [ { "type": "scattergl", "marker": { "colorbar": { "ticks": "", "outlinewidth": 0 } } } ], "choropleth": [ { "type": "choropleth", "colorbar": { "ticks": "", "outlinewidth": 0 } } ], "scattergeo": [ { "type": "scattergeo", "marker": { "colorbar": { "ticks": "", "outlinewidth": 0 } } } ], "histogram2d": [ { "type": "histogram2d", "colorbar": { "ticks": "", "outlinewidth": 0 }, "autocolorscale": true } ], "scatterpolar": [ { "type": "scatterpolar", "marker": { "colorbar": { "ticks": "", "outlinewidth": 0 } } } ], "contourcarpet": [ { "type": "contourcarpet", "colorbar": { "ticks": "", "outlinewidth": 0 } } ], "scattercarpet": [ { "type": "scattercarpet", "marker": { "colorbar": { "ticks": "", "outlinewidth": 0 } } } ], "scattermapbox": [ { "type": "scattermapbox", "marker": { "colorbar": { "ticks": "", "outlinewidth": 0 } } } ], "scatterpolargl": [ { "type": "scatterpolargl", "marker": { "colorbar": { "ticks": "", "outlinewidth": 0 } } } ], "scatterternary": [ { "type": "scatterternary", "marker": { "colorbar": { "ticks": "", "outlinewidth": 0 } } } ], "histogram2dcontour": [ { "type": "histogram2dcontour", "colorbar": { "ticks": "", "outlinewidth": 0 }, "autocolorscale": true } ] }, "layout": { "geo": { "bgcolor": "rgb(17,17,17)", "showland": true, "lakecolor": "rgb(17,17,17)", "landcolor": "rgb(17,17,17)", "showlakes": true, "subunitcolor": "#506784" }, "font": { "color": "#f2f5fa" }, "polar": { "bgcolor": "rgb(17,17,17)", "radialaxis": { "ticks": "", "gridcolor": "#506784", "linecolor": "#506784" }, "angularaxis": { "ticks": "", "gridcolor": "#506784", "linecolor": "#506784" } }, "scene": { "xaxis": { "ticks": "", "gridcolor": "#506784", "gridwidth": 2, "linecolor": "#506784", "zerolinecolor": "#C8D4E3", "showbackground": true, "backgroundcolor": "rgb(17,17,17)" }, "yaxis": { "ticks": "", "gridcolor": "#506784", "gridwidth": 2, "linecolor": "#506784", "zerolinecolor": "#C8D4E3", "showbackground": true, "backgroundcolor": "rgb(17,17,17)" }, "zaxis": { "ticks": "", "gridcolor": "#506784", "gridwidth": 2, "linecolor": "#506784", "zerolinecolor": "#C8D4E3", "showbackground": true, "backgroundcolor": "rgb(17,17,17)" } }, "title": { "x": 0.05 }, "xaxis": { "ticks": "", "gridcolor": "#283442", "linecolor": "#506784", "automargin": true, "zerolinecolor": "#283442", "zerolinewidth": 2 }, "yaxis": { "ticks": "", "gridcolor": "#283442", "linecolor": "#506784", "automargin": true, "zerolinecolor": "#283442", "zerolinewidth": 2 }, "ternary": { "aaxis": { "ticks": "", "gridcolor": "#506784", "linecolor": "#506784" }, "baxis": { "ticks": "", "gridcolor": "#506784", "linecolor": "#506784" }, "caxis": { "ticks": "", "gridcolor": "#506784", "linecolor": "#506784" }, "bgcolor": "rgb(17,17,17)" }, "colorway": [ "#636efa", "#EF553B", "#00cc96", "#ab63fa", "#19d3f3", "#e763fa", "#fecb52", "#ffa15a", "#ff6692", "#b6e880" ], "hovermode": "closest", "colorscale": { "diverging": [ [ 0, "#8e0152" ], [ 0.1, "#c51b7d" ], [ 0.2, "#de77ae" ], [ 0.3, "#f1b6da" ], [ 0.4, "#fde0ef" ], [ 0.5, "#f7f7f7" ], [ 0.6, "#e6f5d0" ], [ 0.7, "#b8e186" ], [ 0.8, "#7fbc41" ], [ 0.9, "#4d9221" ], [ 1, "#276419" ] ], "sequential": [ [ 0, "#0508b8" ], [ 0.0893854748603352, "#1910d8" ], [ 0.1787709497206704, "#3c19f0" ], [ 0.2681564245810056, "#6b1cfb" ], [ 0.3575418994413408, "#981cfd" ], [ 0.44692737430167595, "#bf1cfd" ], [ 0.5363128491620112, "#dd2bfd" ], [ 0.6256983240223464, "#f246fe" ], [ 0.7150837988826816, "#fc67fd" ], [ 0.8044692737430168, "#fe88fc" ], [ 0.8938547486033519, "#fea5fd" ], [ 0.9832402234636871, "#febefe" ], [ 1, "#fec3fe" ] ], "sequentialminus": [ [ 0, "#0508b8" ], [ 0.0893854748603352, "#1910d8" ], [ 0.1787709497206704, "#3c19f0" ], [ 0.2681564245810056, "#6b1cfb" ], [ 0.3575418994413408, "#981cfd" ], [ 0.44692737430167595, "#bf1cfd" ], [ 0.5363128491620112, "#dd2bfd" ], [ 0.6256983240223464, "#f246fe" ], [ 0.7150837988826816, "#fc67fd" ], [ 0.8044692737430168, "#fe88fc" ], [ 0.8938547486033519, "#fea5fd" ], [ 0.9832402234636871, "#febefe" ], [ 1, "#fec3fe" ] ] }, "plot_bgcolor": "rgb(17,17,17)", "paper_bgcolor": "rgb(17,17,17)", "shapedefaults": { "line": { "width": 0 }, "opacity": 0.4, "fillcolor": "#f2f5fa" }, "sliderdefaults": { "bgcolor": "#C8D4E3", "tickwidth": 0, "bordercolor": "rgb(17,17,17)", "borderwidth": 1 }, "annotationdefaults": { "arrowhead": 0, "arrowcolor": "#f2f5fa", "arrowwidth": 1 }, "updatemenudefaults": { "bgcolor": "#506784", "borderwidth": 0 } }, "themeRef": "PLOTLY_DARK" } } }, "height": null, "width": null, "user": { "profile_url": "https://chart-studio.plotly.com/~joreilly86", "avatar_url": "https://storage.googleapis.com/plotly-prod-profiles/69.jpg", "background_url": "https://storage.googleapis.com/plotly-prod-profiles/bg-10.jpg", "bio": "Structural Engineer using Python.", "nickname": "James", "website": "flocode.dev", "stream_tokens": null, "feature_set_id": null, "csrf_token": null, "date_joined": "2024-04-02 21:29:30", "mapbox_access_tokens": null, "has_password": null, "username": "joreilly86", "email": null, "is_active": null, "readonly": null, "is_dash_creator": null, "dash_created_count": null, "is_chart_creator": null, "charts_created_count": null } }, { "creation_time": "2024-04-02T21:31:48.203799Z", "comments": { "results": [], "count": 0 }, "parented": true, "embed_url": "https://chart-studio.plotly.com/~technordstrom/1.embed", "fid": "technordstrom:1", "filename": "LM-GA comparison", "filetype": "plot", "img_url": "https://storage.googleapis.com/plotly-prod-images/technordstrom/1/9_UWULH31RRYD2RB6GEBF8WN3G3GEBQ6.png", "image_urls": { "default": "https://storage.googleapis.com/plotly-prod-images/technordstrom/1/2_OYH3N4ARICS8T4EKZIBB9YG1PO39ZF.png", "block-thumb": "https://storage.googleapis.com/plotly-prod-images/technordstrom/1/8_EOGTJ2FC7PV5MF091U4SOIJ3MM6PEI.png", "list-thumb": "https://storage.googleapis.com/plotly-prod-images/technordstrom/1/9_UWULH31RRYD2RB6GEBF8WN3G3GEBQ6.png" }, "api_urls": { "files": "https://api.plotly.com/v2/files/technordstrom:1", "plots": "https://api.plotly.com/v2/plots/technordstrom:1", "parent": "https://api.plotly.com/v2/folders/home?user=technordstrom" }, "owner": "technordstrom", "parent": -1, "preview": "", "referencers": [], "references": [], "title": "", "views": 1, "web_url": "https://chart-studio.plotly.com/~technordstrom/1/", "world_readable": true, "date_modified": "2024-04-02T21:31:48.215Z", "stars": { "results": [], "count": 0 }, "collaborators": { "results": [], "count": 0 }, "subfolder_count": null, "refresh_interval": null, "organize_view_url": "https://chart-studio.plotly.com/~technordstrom/1/", "current_user_permission": "read", "is_theme": null, "is_template": false, "autosize": true, "caption": "", "figure": { "data": [ { "uid": "fc23dd", "meta": { "columnNames": { "x": "time (s)", "y": "L-M" } }, "mode": "markers", "name": "L-M", "type": "scatter", "xsrc": "technordstrom:0:65d8be", "ysrc": "technordstrom:0:d2d542", "marker": { "line": { "color": "rgb(102, 102, 153)" }, "size": 30, "color": "rgb(255, 204, 153)", "symbol": "star-triangle-up" } }, { "uid": "eb6fa0", "meta": { "columnNames": { "x": "time (s)", "y": "GA" } }, "mode": "markers", "name": "GA", "type": "scatter", "xsrc": "technordstrom:0:65d8be", "ysrc": "technordstrom:0:890667", "marker": { "line": { "color": "rgb(102, 102, 153)" }, "size": 30, "color": "rgb(255, 119, 0)", "symbol": "star-triangle-down" }, "stackgroup": null } ], "frames": [], "layout": { "font": { "size": 30, "color": "rgb(255, 153, 0)", "family": "PT Sans Narrow" }, "title": { "x": 0.485, "text": "Algorithm Precision" }, "xaxis": { "type": "log", "range": [ -0.20440137656221696, 3.2044013765622164 ], "title": { "font": { "color": "rgb(102, 102, 153)" }, "text": "Timetrace Length (s)" }, "tickmode": "linear", "autorange": true, "showspikes": true, "tickformat": "s", "showexponent": "all", "exponentformat": "none" }, "yaxis": { "type": "linear", "range": [ -1.6013508260447034, 19.881350826044702 ], "title": { "font": { "color": "rgb(102, 102, 153)" }, "text": "Precision" }, "autorange": true, "showspikes": true }, "modebar": { "orientation": "v" }, "autosize": true, "template": { "data": { "bar": [ { "type": "bar", "marker": { "colorbar": { "ticks": "", "outlinewidth": 0 } } } ], "table": [ { "type": "table", "cells": { "fill": { "color": "#506784" }, "line": { "color": "rgb(17,17,17)" } }, "header": { "fill": { "color": "#2a3f5f" }, "line": { "color": "rgb(17,17,17)" } } } ], "carpet": [ { "type": "carpet", "aaxis": { "gridcolor": "#506784", "linecolor": "#506784", "endlinecolor": "#A2B1C6", "minorgridcolor": "#506784", "startlinecolor": "#A2B1C6" }, "baxis": { "gridcolor": "#506784", "linecolor": "#506784", "endlinecolor": "#A2B1C6", "minorgridcolor": "#506784", "startlinecolor": "#A2B1C6" } } ], "mesh3d": [ { "type": "mesh3d", "colorbar": { "ticks": "", "outlinewidth": 0 } } ], "contour": [ { "type": "contour", "colorbar": { "ticks": "", "outlinewidth": 0 }, "autocolorscale": true } ], "heatmap": [ { "type": "heatmap", "colorbar": { "ticks": "", "outlinewidth": 0 }, "autocolorscale": true } ], "scatter": [ { "type": "scatter", "marker": { "colorbar": { "ticks": "", "outlinewidth": 0 } } } ], "surface": [ { "type": "surface", "colorbar": { "ticks": "", "outlinewidth": 0 } } ], "heatmapgl": [ { "type": "heatmapgl", "colorbar": { "ticks": "", "outlinewidth": 0 } } ], "histogram": [ { "type": "histogram", "marker": { "colorbar": { "ticks": "", "outlinewidth": 0 } } } ], "parcoords": [ { "line": { "colorbar": { "ticks": "", "outlinewidth": 0 } }, "type": "parcoords" } ], "scatter3d": [ { "type": "scatter3d", "marker": { "colorbar": { "ticks": "", "outlinewidth": 0 } } } ], "scattergl": [ { "type": "scattergl", "marker": { "colorbar": { "ticks": "", "outlinewidth": 0 } } } ], "choropleth": [ { "type": "choropleth", "colorbar": { "ticks": "", "outlinewidth": 0 } } ], "scattergeo": [ { "type": "scattergeo", "marker": { "colorbar": { "ticks": "", "outlinewidth": 0 } } } ], "histogram2d": [ { "type": "histogram2d", "colorbar": { "ticks": "", "outlinewidth": 0 }, "autocolorscale": true } ], "scatterpolar": [ { "type": "scatterpolar", "marker": { "colorbar": { "ticks": "", "outlinewidth": 0 } } } ], "contourcarpet": [ { "type": "contourcarpet", "colorbar": { "ticks": "", "outlinewidth": 0 } } ], "scattercarpet": [ { "type": "scattercarpet", "marker": { "colorbar": { "ticks": "", "outlinewidth": 0 } } } ], "scattermapbox": [ { "type": "scattermapbox", "marker": { "colorbar": { "ticks": "", "outlinewidth": 0 } } } ], "scatterpolargl": [ { "type": "scatterpolargl", "marker": { "colorbar": { "ticks": "", "outlinewidth": 0 } } } ], "scatterternary": [ { "type": "scatterternary", "marker": { "colorbar": { "ticks": "", "outlinewidth": 0 } } } ], "histogram2dcontour": [ { "type": "histogram2dcontour", "colorbar": { "ticks": "", "outlinewidth": 0 }, "autocolorscale": true } ] }, "layout": { "geo": { "bgcolor": "rgb(17,17,17)", "showland": true, "lakecolor": "rgb(17,17,17)", "landcolor": "rgb(17,17,17)", "showlakes": true, "subunitcolor": "#506784" }, "font": { "color": "#f2f5fa" }, "polar": { "bgcolor": "rgb(17,17,17)", "radialaxis": { "ticks": "", "gridcolor": "#506784", "linecolor": "#506784" }, "angularaxis": { "ticks": "", "gridcolor": "#506784", "linecolor": "#506784" } }, "scene": { "xaxis": { "ticks": "", "gridcolor": "#506784", "gridwidth": 2, "linecolor": "#506784", "zerolinecolor": "#C8D4E3", "showbackground": true, "backgroundcolor": "rgb(17,17,17)" }, "yaxis": { "ticks": "", "gridcolor": "#506784", "gridwidth": 2, "linecolor": "#506784", "zerolinecolor": "#C8D4E3", "showbackground": true, "backgroundcolor": "rgb(17,17,17)" }, "zaxis": { "ticks": "", "gridcolor": "#506784", "gridwidth": 2, "linecolor": "#506784", "zerolinecolor": "#C8D4E3", "showbackground": true, "backgroundcolor": "rgb(17,17,17)" } }, "title": { "x": 0.05 }, "xaxis": { "ticks": "", "gridcolor": "#283442", "linecolor": "#506784", "automargin": true, "zerolinecolor": "#283442", "zerolinewidth": 2 }, "yaxis": { "ticks": "", "gridcolor": "#283442", "linecolor": "#506784", "automargin": true, "zerolinecolor": "#283442", "zerolinewidth": 2 }, "ternary": { "aaxis": { "ticks": "", "gridcolor": "#506784", "linecolor": "#506784" }, "baxis": { "ticks": "", "gridcolor": "#506784", "linecolor": "#506784" }, "caxis": { "ticks": "", "gridcolor": "#506784", "linecolor": "#506784" }, "bgcolor": "rgb(17,17,17)" }, "colorway": [ "#636efa", "#EF553B", "#00cc96", "#ab63fa", "#19d3f3", "#e763fa", "#fecb52", "#ffa15a", "#ff6692", "#b6e880" ], "hovermode": "closest", "colorscale": { "diverging": [ [ 0, "#8e0152" ], [ 0.1, "#c51b7d" ], [ 0.2, "#de77ae" ], [ 0.3, "#f1b6da" ], [ 0.4, "#fde0ef" ], [ 0.5, "#f7f7f7" ], [ 0.6, "#e6f5d0" ], [ 0.7, "#b8e186" ], [ 0.8, "#7fbc41" ], [ 0.9, "#4d9221" ], [ 1, "#276419" ] ], "sequential": [ [ 0, "#0508b8" ], [ 0.0893854748603352, "#1910d8" ], [ 0.1787709497206704, "#3c19f0" ], [ 0.2681564245810056, "#6b1cfb" ], [ 0.3575418994413408, "#981cfd" ], [ 0.44692737430167595, "#bf1cfd" ], [ 0.5363128491620112, "#dd2bfd" ], [ 0.6256983240223464, "#f246fe" ], [ 0.7150837988826816, "#fc67fd" ], [ 0.8044692737430168, "#fe88fc" ], [ 0.8938547486033519, "#fea5fd" ], [ 0.9832402234636871, "#febefe" ], [ 1, "#fec3fe" ] ], "sequentialminus": [ [ 0, "#0508b8" ], [ 0.0893854748603352, "#1910d8" ], [ 0.1787709497206704, "#3c19f0" ], [ 0.2681564245810056, "#6b1cfb" ], [ 0.3575418994413408, "#981cfd" ], [ 0.44692737430167595, "#bf1cfd" ], [ 0.5363128491620112, "#dd2bfd" ], [ 0.6256983240223464, "#f246fe" ], [ 0.7150837988826816, "#fc67fd" ], [ 0.8044692737430168, "#fe88fc" ], [ 0.8938547486033519, "#fea5fd" ], [ 0.9832402234636871, "#febefe" ], [ 1, "#fec3fe" ] ] }, "plot_bgcolor": "rgb(17,17,17)", "paper_bgcolor": "rgb(17,17,17)", "shapedefaults": { "line": { "width": 0 }, "opacity": 0.4, "fillcolor": "#f2f5fa" }, "sliderdefaults": { "bgcolor": "#C8D4E3", "tickwidth": 0, "bordercolor": "rgb(17,17,17)", "borderwidth": 1 }, "annotationdefaults": { "arrowhead": 0, "arrowcolor": "#f2f5fa", "arrowwidth": 1 }, "updatemenudefaults": { "bgcolor": "#506784", "borderwidth": 0 } }, "themeRef": "PLOTLY_DARK" }, "clickmode": "none", "uniformtext": { "mode": "show", "minsize": 1 }, "plot_bgcolor": "rgb(102, 102, 153)", "paper_bgcolor": "rgb(0, 0, 0)" } }, "height": null, "width": null, "user": { "profile_url": "https://chart-studio.plotly.com/~technordstrom", "avatar_url": "https://storage.googleapis.com/plotly-prod-profiles/76.jpg", "background_url": "https://storage.googleapis.com/plotly-prod-profiles/bg-5.jpg", "bio": "", "nickname": "", "website": "", "stream_tokens": null, "feature_set_id": null, "csrf_token": null, "date_joined": "2024-04-02 21:31:02", "mapbox_access_tokens": null, "has_password": null, "username": "technordstrom", "email": null, "is_active": null, "readonly": null, "is_dash_creator": null, "dash_created_count": null, "is_chart_creator": null, "charts_created_count": null } }, { "creation_time": "2024-04-02T21:28:33.362523Z", "comments": { "results": [], "count": 0 }, "parented": true, "embed_url": "https://chart-studio.plotly.com/~JunyuWoo/3.embed", "fid": "JunyuWoo:3", "filename": "violin plot", "filetype": "plot", "img_url": "https://storage.googleapis.com/plotly-prod-images/JunyuWoo/3/9_6EDA3BFOEJDINRGXZN236LNIOKLJN4.png", "image_urls": { "default": "https://storage.googleapis.com/plotly-prod-images/JunyuWoo/3/2_15MOPUFWF8FONDFMQRUC6G650JR0JW.png", "block-thumb": "https://storage.googleapis.com/plotly-prod-images/JunyuWoo/3/8_ZFAZF6RA0VSGENHIDKNFP0OCTKH4IQ.png", "list-thumb": "https://storage.googleapis.com/plotly-prod-images/JunyuWoo/3/9_6EDA3BFOEJDINRGXZN236LNIOKLJN4.png" }, "api_urls": { "files": "https://api.plotly.com/v2/files/JunyuWoo:3", "plots": "https://api.plotly.com/v2/plots/JunyuWoo:3", "parent": "https://api.plotly.com/v2/folders/home?user=JunyuWoo" }, "owner": "JunyuWoo", "parent": -1, "preview": "", "referencers": [], "references": [], "title": "", "views": 1, "web_url": "https://chart-studio.plotly.com/~JunyuWoo/3/", "world_readable": true, "date_modified": "2024-04-02T21:30:18.835Z", "stars": { "results": [], "count": 0 }, "collaborators": { "results": [], "count": 0 }, "subfolder_count": null, "refresh_interval": null, "organize_view_url": "https://chart-studio.plotly.com/~JunyuWoo/3/", "current_user_permission": "read", "is_theme": null, "is_template": false, "autosize": true, "caption": "", "figure": { "data": [ { "box": { "line": { "color": "rgb(24, 25, 26)" }, "visible": true }, "meta": { "columnNames": { "y": "A" } }, "mode": "markers", "name": "Chinese", "type": "violin", "ysrc": "JunyuWoo:2:5be6ca", "marker": { "color": "rgb(99, 188, 250)" }, "points": "all", "meanline": { "color": "rgb(21, 21, 22)", "visible": true }, "pointpos": -1.2999999999999998, "bandwidth": 0 }, { "box": { "line": { "color": "rgb(27, 26, 26)" }, "visible": true }, "meta": { "columnNames": { "y": "B" } }, "name": "English", "type": "violin", "ysrc": "JunyuWoo:2:5c0170", "points": "all", "meanline": { "color": "rgb(36, 34, 34)", "visible": true }, "pointpos": -1.4, "bandwidth": 0 }, { "box": { "line": { "color": "rgb(29, 28, 28)" }, "visible": true }, "meta": { "columnNames": { "y": "C" } }, "name": "Japanese", "type": "violin", "ysrc": "JunyuWoo:2:79ee8f", "points": "all", "meanline": { "color": "rgb(24, 25, 25)", "visible": true }, "pointpos": -1.4, "bandwidth": 0 } ], "frames": [], "layout": { "title": { "text": "Japanese pitch accent-final" }, "xaxis": { "type": "category", "range": [ -0.5096774193548387, 2.5 ], "domain": [ 0.125, 0.875 ], "autorange": true }, "yaxis": { "type": "linear", "range": [ 12.77794702608232, 42.247284903119656 ], "domain": [ 0, 1 ], "autorange": true }, "autosize": true, "template": { "data": { "bar": [ { "type": "bar", "marker": { "colorbar": { "ticks": "", "outlinewidth": 0 } } } ], "table": [ { "type": "table", "cells": { "fill": { "color": "#EBF0F8" }, "line": { "color": "white" } }, "header": { "fill": { "color": "#C8D4E3" }, "line": { "color": "white" } } } ], "carpet": [ { "type": "carpet", "aaxis": { "gridcolor": "#C8D4E3", "linecolor": "#C8D4E3", "endlinecolor": "#2a3f5f", "minorgridcolor": "#C8D4E3", "startlinecolor": "#2a3f5f" }, "baxis": { "gridcolor": "#C8D4E3", "linecolor": "#C8D4E3", "endlinecolor": "#2a3f5f", "minorgridcolor": "#C8D4E3", "startlinecolor": "#2a3f5f" } } ], "mesh3d": [ { "type": "mesh3d", "colorbar": { "ticks": "", "outlinewidth": 0 } } ], "contour": [ { "type": "contour", "colorbar": { "ticks": "", "outlinewidth": 0 }, "autocolorscale": true } ], "heatmap": [ { "type": "heatmap", "colorbar": { "ticks": "", "outlinewidth": 0 }, "autocolorscale": true } ], "scatter": [ { "type": "scatter", "marker": { "colorbar": { "ticks": "", "outlinewidth": 0 } } } ], "surface": [ { "type": "surface", "colorbar": { "ticks": "", "outlinewidth": 0 } } ], "heatmapgl": [ { "type": "heatmapgl", "colorbar": { "ticks": "", "outlinewidth": 0 } } ], "histogram": [ { "type": "histogram", "marker": { "colorbar": { "ticks": "", "outlinewidth": 0 } } } ], "parcoords": [ { "line": { "colorbar": { "ticks": "", "outlinewidth": 0 } }, "type": "parcoords" } ], "scatter3d": [ { "type": "scatter3d", "marker": { "colorbar": { "ticks": "", "outlinewidth": 0 } } } ], "scattergl": [ { "type": "scattergl", "marker": { "colorbar": { "ticks": "", "outlinewidth": 0 } } } ], "choropleth": [ { "type": "choropleth", "colorbar": { "ticks": "", "outlinewidth": 0 } } ], "scattergeo": [ { "type": "scattergeo", "marker": { "colorbar": { "ticks": "", "outlinewidth": 0 } } } ], "histogram2d": [ { "type": "histogram2d", "colorbar": { "ticks": "", "outlinewidth": 0 }, "autocolorscale": true } ], "scatterpolar": [ { "type": "scatterpolar", "marker": { "colorbar": { "ticks": "", "outlinewidth": 0 } } } ], "contourcarpet": [ { "type": "contourcarpet", "colorbar": { "ticks": "", "outlinewidth": 0 } } ], "scattercarpet": [ { "type": "scattercarpet", "marker": { "colorbar": { "ticks": "", "outlinewidth": 0 } } } ], "scattermapbox": [ { "type": "scattermapbox", "marker": { "colorbar": { "ticks": "", "outlinewidth": 0 } } } ], "scatterpolargl": [ { "type": "scatterpolargl", "marker": { "colorbar": { "ticks": "", "outlinewidth": 0 } } } ], "scatterternary": [ { "type": "scatterternary", "marker": { "colorbar": { "ticks": "", "outlinewidth": 0 } } } ], "histogram2dcontour": [ { "type": "histogram2dcontour", "colorbar": { "ticks": "", "outlinewidth": 0 }, "autocolorscale": true } ] }, "layout": { "geo": { "bgcolor": "white", "showland": true, "lakecolor": "white", "landcolor": "white", "showlakes": true, "subunitcolor": "#C8D4E3" }, "font": { "color": "#2a3f5f" }, "polar": { "bgcolor": "white", "radialaxis": { "ticks": "", "gridcolor": "#EBF0F8", "linecolor": "#EBF0F8" }, "angularaxis": { "ticks": "", "gridcolor": "#EBF0F8", "linecolor": "#EBF0F8" } }, "scene": { "xaxis": { "ticks": "", "gridcolor": "#DFE8F3", "gridwidth": 2, "linecolor": "#EBF0F8", "zerolinecolor": "#EBF0F8", "showbackground": true, "backgroundcolor": "white" }, "yaxis": { "ticks": "", "gridcolor": "#DFE8F3", "gridwidth": 2, "linecolor": "#EBF0F8", "zerolinecolor": "#EBF0F8", "showbackground": true, "backgroundcolor": "white" }, "zaxis": { "ticks": "", "gridcolor": "#DFE8F3", "gridwidth": 2, "linecolor": "#EBF0F8", "zerolinecolor": "#EBF0F8", "showbackground": true, "backgroundcolor": "white" } }, "title": { "x": 0.05 }, "xaxis": { "ticks": "", "gridcolor": "#EBF0F8", "linecolor": "#EBF0F8", "automargin": true, "zerolinecolor": "#EBF0F8", "zerolinewidth": 2 }, "yaxis": { "ticks": "", "gridcolor": "#EBF0F8", "linecolor": "#EBF0F8", "automargin": true, "zerolinecolor": "#EBF0F8", "zerolinewidth": 2 }, "ternary": { "aaxis": { "ticks": "", "gridcolor": "#DFE8F3", "linecolor": "#A2B1C6" }, "baxis": { "ticks": "", "gridcolor": "#DFE8F3", "linecolor": "#A2B1C6" }, "caxis": { "ticks": "", "gridcolor": "#DFE8F3", "linecolor": "#A2B1C6" }, "bgcolor": "white" }, "colorway": [ "#636efa", "#EF553B", "#00cc96", "#ab63fa", "#19d3f3", "#e763fa", "#fecb52", "#ffa15a", "#ff6692", "#b6e880" ], "hovermode": "closest", "colorscale": { "diverging": [ [ 0, "#8e0152" ], [ 0.1, "#c51b7d" ], [ 0.2, "#de77ae" ], [ 0.3, "#f1b6da" ], [ 0.4, "#fde0ef" ], [ 0.5, "#f7f7f7" ], [ 0.6, "#e6f5d0" ], [ 0.7, "#b8e186" ], [ 0.8, "#7fbc41" ], [ 0.9, "#4d9221" ], [ 1, "#276419" ] ], "sequential": [ [ 0, "#0508b8" ], [ 0.0893854748603352, "#1910d8" ], [ 0.1787709497206704, "#3c19f0" ], [ 0.2681564245810056, "#6b1cfb" ], [ 0.3575418994413408, "#981cfd" ], [ 0.44692737430167595, "#bf1cfd" ], [ 0.5363128491620112, "#dd2bfd" ], [ 0.6256983240223464, "#f246fe" ], [ 0.7150837988826816, "#fc67fd" ], [ 0.8044692737430168, "#fe88fc" ], [ 0.8938547486033519, "#fea5fd" ], [ 0.9832402234636871, "#febefe" ], [ 1, "#fec3fe" ] ], "sequentialminus": [ [ 0, "#0508b8" ], [ 0.0893854748603352, "#1910d8" ], [ 0.1787709497206704, "#3c19f0" ], [ 0.2681564245810056, "#6b1cfb" ], [ 0.3575418994413408, "#981cfd" ], [ 0.44692737430167595, "#bf1cfd" ], [ 0.5363128491620112, "#dd2bfd" ], [ 0.6256983240223464, "#f246fe" ], [ 0.7150837988826816, "#fc67fd" ], [ 0.8044692737430168, "#fe88fc" ], [ 0.8938547486033519, "#fea5fd" ], [ 0.9832402234636871, "#febefe" ], [ 1, "#fec3fe" ] ] }, "plot_bgcolor": "white", "paper_bgcolor": "white", "shapedefaults": { "line": { "width": 0 }, "opacity": 0.4, "fillcolor": "#506784" }, "annotationdefaults": { "arrowhead": 0, "arrowcolor": "#506784", "arrowwidth": 1 } }, "themeRef": "PLOTLY_WHITE" } } }, "height": null, "width": null, "user": { "profile_url": "https://chart-studio.plotly.com/~JunyuWoo", "avatar_url": "https://storage.googleapis.com/plotly-prod-profiles/61.jpg", "background_url": "https://storage.googleapis.com/plotly-prod-profiles/bg-7.jpg", "bio": "", "nickname": "", "website": "", "stream_tokens": null, "feature_set_id": null, "csrf_token": null, "date_joined": "2024-04-02 18:42:07", "mapbox_access_tokens": null, "has_password": null, "username": "JunyuWoo", "email": null, "is_active": null, "readonly": null, "is_dash_creator": null, "dash_created_count": null, "is_chart_creator": null, "charts_created_count": null } }, { "creation_time": "2024-04-02T21:07:33.340711Z", "comments": { "results": [], "count": 0 }, "parented": true, "embed_url": "https://chart-studio.plotly.com/~JULIANLB/260.embed", "fid": "JULIANLB:260", "filename": "32_plot", "filetype": "plot", "img_url": "https://storage.googleapis.com/plotly-prod-images/JULIANLB/260/9_5OB5CLYM2T6VP2XZVUJWX2EK0YIX20.png", "image_urls": { "default": "https://storage.googleapis.com/plotly-prod-images/JULIANLB/260/2_P5FYKYK15PRXCJAF4PRGTDE14D4Z7Z.png", "block-thumb": "https://storage.googleapis.com/plotly-prod-images/JULIANLB/260/8_YPWJQEHECXV3O2CK9XKCZHU0RVKQDX.png", "list-thumb": "https://storage.googleapis.com/plotly-prod-images/JULIANLB/260/9_5OB5CLYM2T6VP2XZVUJWX2EK0YIX20.png" }, "api_urls": { "files": "https://api.plotly.com/v2/files/JULIANLB:260", "plots": "https://api.plotly.com/v2/plots/JULIANLB:260", "parent": "https://api.plotly.com/v2/folders/home?user=JULIANLB" }, "owner": "JULIANLB", "parent": -1, "preview": "", "referencers": [], "references": [], "title": "", "views": 1, "web_url": "https://chart-studio.plotly.com/~JULIANLB/260/", "world_readable": true, "date_modified": "2024-04-02T22:12:10.442Z", "stars": { "results": [], "count": 0 }, "collaborators": { "results": [], "count": 0 }, "subfolder_count": null, "refresh_interval": null, "organize_view_url": "https://chart-studio.plotly.com/~JULIANLB/260/", "current_user_permission": "read", "is_theme": null, "is_template": null, "autosize": true, "caption": "", "figure": { "data": [ { "mode": "lines", "name": "32 - precision", "type": "scatter", "xsrc": "JULIANLB:283:e506b2", "ysrc": "JULIANLB:283:fab20e" }, { "mode": "lines", "name": "32 - recall", "type": "scatter", "xsrc": "JULIANLB:283:e1a07e", "ysrc": "JULIANLB:283:6816e3" }, { "mode": "lines", "name": "32 - accuracy", "type": "scatter", "xsrc": "JULIANLB:283:b9e4f4", "ysrc": "JULIANLB:283:e78b0a" }, { "mode": "lines", "name": "32 - f1", "type": "scatter", "xsrc": "JULIANLB:283:dd985c", "ysrc": "JULIANLB:283:f5b464" }, { "mode": "lines", "name": "33 - precision", "type": "scatter", "xsrc": "JULIANLB:283:cf8e0f", "ysrc": "JULIANLB:283:2cc70f" }, { "mode": "lines", "name": "33 - recall", "type": "scatter", "xsrc": "JULIANLB:283:9b95ee", "ysrc": "JULIANLB:283:2cea74" }, { "mode": "lines", "name": "33 - accuracy", "type": "scatter", "xsrc": "JULIANLB:283:cb80c6", "ysrc": "JULIANLB:283:afb7ec" }, { "mode": "lines", "name": "33 - f1", "type": "scatter", "xsrc": "JULIANLB:283:c3b3ed", "ysrc": "JULIANLB:283:3e7bb4" }, { "mode": "lines", "name": "34 - precision", "type": "scatter", "xsrc": "JULIANLB:283:679e1a", "ysrc": "JULIANLB:283:b9b040" }, { "mode": "lines", "name": "34 - recall", "type": "scatter", "xsrc": "JULIANLB:283:f1545b", "ysrc": "JULIANLB:283:e4f0b7" }, { "mode": "lines", "name": "34 - accuracy", "type": "scatter", "xsrc": "JULIANLB:283:8e0402", "ysrc": "JULIANLB:283:842332" }, { "mode": "lines", "name": "34 - f1", "type": "scatter", "xsrc": "JULIANLB:283:cdff5b", "ysrc": "JULIANLB:283:6b8e39" }, { "mode": "lines", "name": "12 - precision", "type": "scatter", "xsrc": "JULIANLB:283:2778f4", "ysrc": "JULIANLB:283:835214" }, { "mode": "lines", "name": "12 - recall", "type": "scatter", "xsrc": "JULIANLB:283:bb7541", "ysrc": "JULIANLB:283:a4dac8" }, { "mode": "lines", "name": "12 - accuracy", "type": "scatter", "xsrc": "JULIANLB:283:b64a1b", "ysrc": "JULIANLB:283:f992ee" }, { "mode": "lines", "name": "12 - f1", "type": "scatter", "xsrc": "JULIANLB:283:879dda", "ysrc": "JULIANLB:283:b03c1c" }, { "mode": "lines", "name": "5 - precision", "type": "scatter", "xsrc": "JULIANLB:283:3e897a", "ysrc": "JULIANLB:283:671794" }, { "mode": "lines", "name": "5 - recall", "type": "scatter", "xsrc": "JULIANLB:283:b1ef2c", "ysrc": "JULIANLB:283:02688e" }, { "mode": "lines", "name": "5 - accuracy", "type": "scatter", "xsrc": "JULIANLB:283:ed70a6", "ysrc": "JULIANLB:283:68074a" }, { "mode": "lines", "name": "5 - f1", "type": "scatter", "xsrc": "JULIANLB:283:00a2e3", "ysrc": "JULIANLB:283:560d7c" }, { "mode": "lines", "name": "11 - precision", "type": "scatter", "xsrc": "JULIANLB:283:60e80e", "ysrc": "JULIANLB:283:d90ace" }, { "mode": "lines", "name": "11 - recall", "type": "scatter", "xsrc": "JULIANLB:283:3d5d8e", "ysrc": "JULIANLB:283:7ff3de" }, { "mode": "lines", "name": "11 - accuracy", "type": "scatter", "xsrc": "JULIANLB:283:acbf7d", "ysrc": "JULIANLB:283:99ad8e" }, { "mode": "lines", "name": "11 - f1", "type": "scatter", "xsrc": "JULIANLB:283:5a0842", "ysrc": "JULIANLB:283:176be6" }, { "mode": "lines", "name": "19 - precision", "type": "scatter", "xsrc": "JULIANLB:283:c3b754", "ysrc": "JULIANLB:283:83bf21" }, { "mode": "lines", "name": "19 - recall", "type": "scatter", "xsrc": "JULIANLB:283:2a8db5", "ysrc": "JULIANLB:283:35f3bc" }, { "mode": "lines", "name": "19 - accuracy", "type": "scatter", "xsrc": "JULIANLB:283:0e1a32", "ysrc": "JULIANLB:283:396e16" }, { "mode": "lines", "name": "19 - f1", "type": "scatter", "xsrc": "JULIANLB:283:44575a", "ysrc": "JULIANLB:283:52970a" } ], "layout": { "width": 1000, "xaxis": { "title": { "text": "Threshold level" }, "anchor": "y", "domain": [ 0.0, 0.45 ] }, "yaxis": { "title": { "text": "Metric value" }, "anchor": "x", "domain": [ 0.625, 1.0 ] }, "height": 800, "xaxis2": { "anchor": "y2", "domain": [ 0.55, 1.0 ] }, "xaxis3": { "title": { "text": "Threshold level" }, "anchor": "y3", "domain": [ 0.0, 0.45 ] }, "xaxis4": { "title": { "text": "Threshold level" }, "anchor": "y4", "domain": [ 0.55, 1.0 ] }, "yaxis2": { "anchor": "x2", "domain": [ 0.625, 1.0 ] }, "yaxis3": { "title": { "text": "Metric value" }, "anchor": "x3", "domain": [ 0.0, 0.375 ] }, "yaxis4": { "anchor": "x4", "domain": [ 0.0, 0.375 ] }, "template": { "data": { "bar": [ { "type": "bar", "marker": { "line": { "color": "#E5ECF6", "width": 0.5 }, "pattern": { "size": 10, "fillmode": "overlay", "solidity": 0.2 } }, "error_x": { "color": "#2a3f5f" }, "error_y": { "color": "#2a3f5f" } } ], "pie": [ { "type": "pie", "automargin": true } ], "table": [ { "type": "table", "cells": { "fill": { "color": "#EBF0F8" }, "line": { "color": "white" } }, "header": { "fill": { "color": "#C8D4E3" }, "line": { "color": "white" } } } ], "carpet": [ { "type": "carpet", "aaxis": { "gridcolor": "white", "linecolor": "white", "endlinecolor": "#2a3f5f", "minorgridcolor": "white", "startlinecolor": "#2a3f5f" }, "baxis": { "gridcolor": "white", "linecolor": "white", "endlinecolor": "#2a3f5f", "minorgridcolor": "white", "startlinecolor": "#2a3f5f" } } ], "mesh3d": [ { "type": "mesh3d", "colorbar": { "ticks": "", "outlinewidth": 0 } } ], "contour": [ { "type": "contour", "colorbar": { "ticks": "", "outlinewidth": 0 }, "colorscale": [ [ 0.0, "#0d0887" ], [ 0.1111111111111111, "#46039f" ], [ 0.2222222222222222, "#7201a8" ], [ 0.3333333333333333, "#9c179e" ], [ 0.4444444444444444, "#bd3786" ], [ 0.5555555555555556, "#d8576b" ], [ 0.6666666666666666, "#ed7953" ], [ 0.7777777777777778, "#fb9f3a" ], [ 0.8888888888888888, "#fdca26" ], [ 1.0, "#f0f921" ] ] } ], "heatmap": [ { "type": "heatmap", "colorbar": { "ticks": "", "outlinewidth": 0 }, "colorscale": [ [ 0.0, "#0d0887" ], [ 0.1111111111111111, "#46039f" ], [ 0.2222222222222222, "#7201a8" ], [ 0.3333333333333333, "#9c179e" ], [ 0.4444444444444444, "#bd3786" ], [ 0.5555555555555556, "#d8576b" ], [ 0.6666666666666666, "#ed7953" ], [ 0.7777777777777778, "#fb9f3a" ], [ 0.8888888888888888, "#fdca26" ], [ 1.0, "#f0f921" ] ] } ], "scatter": [ { "type": "scatter", "fillpattern": { "size": 10, "fillmode": "overlay", "solidity": 0.2 } } ], "surface": [ { "type": "surface", "colorbar": { "ticks": "", "outlinewidth": 0 }, "colorscale": [ [ 0.0, "#0d0887" ], [ 0.1111111111111111, "#46039f" ], [ 0.2222222222222222, "#7201a8" ], [ 0.3333333333333333, "#9c179e" ], [ 0.4444444444444444, "#bd3786" ], [ 0.5555555555555556, "#d8576b" ], [ 0.6666666666666666, "#ed7953" ], [ 0.7777777777777778, "#fb9f3a" ], [ 0.8888888888888888, "#fdca26" ], [ 1.0, "#f0f921" ] ] } ], "barpolar": [ { "type": "barpolar", "marker": { "line": { "color": "#E5ECF6", "width": 0.5 }, "pattern": { "size": 10, "fillmode": "overlay", "solidity": 0.2 } } } ], "heatmapgl": [ { "type": "heatmapgl", "colorbar": { "ticks": "", "outlinewidth": 0 }, "colorscale": [ [ 0.0, "#0d0887" ], [ 0.1111111111111111, "#46039f" ], [ 0.2222222222222222, "#7201a8" ], [ 0.3333333333333333, "#9c179e" ], [ 0.4444444444444444, "#bd3786" ], [ 0.5555555555555556, "#d8576b" ], [ 0.6666666666666666, "#ed7953" ], [ 0.7777777777777778, "#fb9f3a" ], [ 0.8888888888888888, "#fdca26" ], [ 1.0, "#f0f921" ] ] } ], "histogram": [ { "type": "histogram", "marker": { "pattern": { "size": 10, "fillmode": "overlay", "solidity": 0.2 } } } ], "parcoords": [ { "line": { "colorbar": { "ticks": "", "outlinewidth": 0 } }, "type": "parcoords" } ], "scatter3d": [ { "line": { "colorbar": { "ticks": "", "outlinewidth": 0 } }, "type": "scatter3d", "marker": { "colorbar": { "ticks": "", "outlinewidth": 0 } } } ], "scattergl": [ { "type": "scattergl", "marker": { "colorbar": { "ticks": "", "outlinewidth": 0 } } } ], "choropleth": [ { "type": "choropleth", "colorbar": { "ticks": "", "outlinewidth": 0 } } ], "scattergeo": [ { "type": "scattergeo", "marker": { "colorbar": { "ticks": "", "outlinewidth": 0 } } } ], "histogram2d": [ { "type": "histogram2d", "colorbar": { "ticks": "", "outlinewidth": 0 }, "colorscale": [ [ 0.0, "#0d0887" ], [ 0.1111111111111111, "#46039f" ], [ 0.2222222222222222, "#7201a8" ], [ 0.3333333333333333, "#9c179e" ], [ 0.4444444444444444, "#bd3786" ], [ 0.5555555555555556, "#d8576b" ], [ 0.6666666666666666, "#ed7953" ], [ 0.7777777777777778, "#fb9f3a" ], [ 0.8888888888888888, "#fdca26" ], [ 1.0, "#f0f921" ] ] } ], "scatterpolar": [ { "type": "scatterpolar", "marker": { "colorbar": { "ticks": "", "outlinewidth": 0 } } } ], "contourcarpet": [ { "type": "contourcarpet", "colorbar": { "ticks": "", "outlinewidth": 0 } } ], "scattercarpet": [ { "type": "scattercarpet", "marker": { "colorbar": { "ticks": "", "outlinewidth": 0 } } } ], "scattermapbox": [ { "type": "scattermapbox", "marker": { "colorbar": { "ticks": "", "outlinewidth": 0 } } } ], "scatterpolargl": [ { "type": "scatterpolargl", "marker": { "colorbar": { "ticks": "", "outlinewidth": 0 } } } ], "scatterternary": [ { "type": "scatterternary", "marker": { "colorbar": { "ticks": "", "outlinewidth": 0 } } } ], "histogram2dcontour": [ { "type": "histogram2dcontour", "colorbar": { "ticks": "", "outlinewidth": 0 }, "colorscale": [ [ 0.0, "#0d0887" ], [ 0.1111111111111111, "#46039f" ], [ 0.2222222222222222, "#7201a8" ], [ 0.3333333333333333, "#9c179e" ], [ 0.4444444444444444, "#bd3786" ], [ 0.5555555555555556, "#d8576b" ], [ 0.6666666666666666, "#ed7953" ], [ 0.7777777777777778, "#fb9f3a" ], [ 0.8888888888888888, "#fdca26" ], [ 1.0, "#f0f921" ] ] } ] }, "layout": { "geo": { "bgcolor": "white", "showland": true, "lakecolor": "white", "landcolor": "#E5ECF6", "showlakes": true, "subunitcolor": "white" }, "font": { "color": "#2a3f5f" }, "polar": { "bgcolor": "#E5ECF6", "radialaxis": { "ticks": "", "gridcolor": "white", "linecolor": "white" }, "angularaxis": { "ticks": "", "gridcolor": "white", "linecolor": "white" } }, "scene": { "xaxis": { "ticks": "", "gridcolor": "white", "gridwidth": 2, "linecolor": "white", "zerolinecolor": "white", "showbackground": true, "backgroundcolor": "#E5ECF6" }, "yaxis": { "ticks": "", "gridcolor": "white", "gridwidth": 2, "linecolor": "white", "zerolinecolor": "white", "showbackground": true, "backgroundcolor": "#E5ECF6" }, "zaxis": { "ticks": "", "gridcolor": "white", "gridwidth": 2, "linecolor": "white", "zerolinecolor": "white", "showbackground": true, "backgroundcolor": "#E5ECF6" } }, "title": { "x": 0.05 }, "xaxis": { "ticks": "", "title": { "standoff": 15 }, "gridcolor": "white", "linecolor": "white", "automargin": true, "zerolinecolor": "white", "zerolinewidth": 2 }, "yaxis": { "ticks": "", "title": { "standoff": 15 }, "gridcolor": "white", "linecolor": "white", "automargin": true, "zerolinecolor": "white", "zerolinewidth": 2 }, "mapbox": { "style": "light" }, "ternary": { "aaxis": { "ticks": "", "gridcolor": "white", "linecolor": "white" }, "baxis": { "ticks": "", "gridcolor": "white", "linecolor": "white" }, "caxis": { "ticks": "", "gridcolor": "white", "linecolor": "white" }, "bgcolor": "#E5ECF6" }, "colorway": [ "#636efa", "#EF553B", "#00cc96", "#ab63fa", "#FFA15A", "#19d3f3", "#FF6692", "#B6E880", "#FF97FF", "#FECB52" ], "coloraxis": { "colorbar": { "ticks": "", "outlinewidth": 0 } }, "hovermode": "closest", "colorscale": { "diverging": [ [ 0, "#8e0152" ], [ 0.1, "#c51b7d" ], [ 0.2, "#de77ae" ], [ 0.3, "#f1b6da" ], [ 0.4, "#fde0ef" ], [ 0.5, "#f7f7f7" ], [ 0.6, "#e6f5d0" ], [ 0.7, "#b8e186" ], [ 0.8, "#7fbc41" ], [ 0.9, "#4d9221" ], [ 1, "#276419" ] ], "sequential": [ [ 0.0, "#0d0887" ], [ 0.1111111111111111, "#46039f" ], [ 0.2222222222222222, "#7201a8" ], [ 0.3333333333333333, "#9c179e" ], [ 0.4444444444444444, "#bd3786" ], [ 0.5555555555555556, "#d8576b" ], [ 0.6666666666666666, "#ed7953" ], [ 0.7777777777777778, "#fb9f3a" ], [ 0.8888888888888888, "#fdca26" ], [ 1.0, "#f0f921" ] ], "sequentialminus": [ [ 0.0, "#0d0887" ], [ 0.1111111111111111, "#46039f" ], [ 0.2222222222222222, "#7201a8" ], [ 0.3333333333333333, "#9c179e" ], [ 0.4444444444444444, "#bd3786" ], [ 0.5555555555555556, "#d8576b" ], [ 0.6666666666666666, "#ed7953" ], [ 0.7777777777777778, "#fb9f3a" ], [ 0.8888888888888888, "#fdca26" ], [ 1.0, "#f0f921" ] ] }, "hoverlabel": { "align": "left" }, "plot_bgcolor": "#E5ECF6", "paper_bgcolor": "white", "shapedefaults": { "line": { "color": "#2a3f5f" } }, "autotypenumbers": "strict", "annotationdefaults": { "arrowhead": 0, "arrowcolor": "#2a3f5f", "arrowwidth": 1 } } }, "showlegend": true, "annotations": [ { "x": 0.225, "y": 1.0, "font": { "size": 16 }, "text": "Precision", "xref": "paper", "yref": "paper", "xanchor": "center", "yanchor": "bottom", "showarrow": false }, { "x": 0.775, "y": 1.0, "font": { "size": 16 }, "text": "Recall", "xref": "paper", "yref": "paper", "xanchor": "center", "yanchor": "bottom", "showarrow": false }, { "x": 0.225, "y": 0.375, "font": { "size": 16 }, "text": "Accuracy", "xref": "paper", "yref": "paper", "xanchor": "center", "yanchor": "bottom", "showarrow": false }, { "x": 0.775, "y": 0.375, "font": { "size": 16 }, "text": "F1", "xref": "paper", "yref": "paper", "xanchor": "center", "yanchor": "bottom", "showarrow": false } ], "updatemenus": [ { "active": 0, "buttons": [ { "args": [ { "title": 32, "visible": [ true, false, false, false, false, false, false ] } ], "label": "32", "method": "update" } ], "direction": "down" }, { "active": 0, "buttons": [ { "args": [ { "title": 33, "visible": [ false, true, false, false, false, false, false ] } ], "label": "33", "method": "update" } ], "direction": "down" }, { "active": 0, "buttons": [ { "args": [ { "title": 34, "visible": [ false, false, true, false, false, false, false ] } ], "label": "34", "method": "update" } ], "direction": "down" }, { "active": 0, "buttons": [ { "args": [ { "title": 12, "visible": [ false, false, false, true, false, false, false ] } ], "label": "12", "method": "update" } ], "direction": "down" }, { "active": 0, "buttons": [ { "args": [ { "title": 5, "visible": [ false, false, false, false, true, false, false ] } ], "label": "5", "method": "update" } ], "direction": "down" }, { "active": 0, "buttons": [ { "args": [ { "title": 11, "visible": [ false, false, false, false, false, true, false ] } ], "label": "11", "method": "update" } ], "direction": "down" }, { "active": 0, "buttons": [ { "args": [ { "title": 19, "visible": [ false, false, false, false, false, false, true ] } ], "label": "19", "method": "update" } ], "direction": "down" } ] } }, "height": 800, "width": 1000, "user": { "profile_url": "https://chart-studio.plotly.com/~JULIANLB", "avatar_url": "https://storage.googleapis.com/plotly-prod-profiles/79.jpg", "background_url": "https://storage.googleapis.com/plotly-prod-profiles/bg-7.jpg", "bio": "", "nickname": "", "website": "", "stream_tokens": null, "feature_set_id": null, "csrf_token": null, "date_joined": "2020-05-29 23:47:37", "mapbox_access_tokens": null, "has_password": null, "username": "JULIANLB", "email": null, "is_active": null, "readonly": null, "is_dash_creator": null, "dash_created_count": null, "is_chart_creator": null, "charts_created_count": null } }, { "creation_time": "2024-04-02T21:06:44.885809Z", "comments": { "results": [], "count": 0 }, "parented": true, "embed_url": "https://chart-studio.plotly.com/~jkuntz/110.embed", "fid": "jkuntz:110", "filename": "summary_metrics_for_each_query_20240402205539 copy", "filetype": "plot", "img_url": "https://storage.googleapis.com/plotly-prod-images/jkuntz/110/9_9YZJ4X8UTXTX10167DZM204MLSP4UP.png", "image_urls": { "default": "https://storage.googleapis.com/plotly-prod-images/jkuntz/110/2_47HHKOPMFNP98C0M8Y6YAI2FBZE6PA.png", "block-thumb": "https://storage.googleapis.com/plotly-prod-images/jkuntz/110/8_21288ZHQ6TULQ1T4MB5WO85QX1G23P.png", "list-thumb": "https://storage.googleapis.com/plotly-prod-images/jkuntz/110/9_9YZJ4X8UTXTX10167DZM204MLSP4UP.png" }, "api_urls": { "files": "https://api.plotly.com/v2/files/jkuntz:110", "plots": "https://api.plotly.com/v2/plots/jkuntz:110", "parent": "https://api.plotly.com/v2/folders/home?user=jkuntz" }, "owner": "jkuntz", "parent": -1, "preview": "", "referencers": [], "references": [], "title": "", "views": 1, "web_url": "https://chart-studio.plotly.com/~jkuntz/110/", "world_readable": true, "date_modified": "2024-04-02T21:06:45.233Z", "stars": { "results": [], "count": 0 }, "collaborators": { "results": [], "count": 0 }, "subfolder_count": null, "refresh_interval": null, "organize_view_url": "https://chart-studio.plotly.com/~jkuntz/110/", "current_user_permission": "read", "is_theme": null, "is_template": null, "autosize": true, "caption": "", "figure": { "data": [ { "name": "Average", "type": "bar", "xsrc": "jkuntz:109:89d1dd", "ysrc": "jkuntz:109:73b902" }, { "name": "95th Percentile", "type": "bar", "xsrc": "jkuntz:109:308232", "ysrc": "jkuntz:109:cc8cb4" }, { "name": "99th Percentile", "type": "bar", "xsrc": "jkuntz:109:c05803", "ysrc": "jkuntz:109:8add5a" } ], "layout": { "title": { "text": "Summary Metrics for Each Query" }, "xaxis": { "title": { "text": "Query" } }, "yaxis": { "title": { "text": "Response Time" } }, "height": 500, "barmode": "group", "template": { "data": { "bar": [ { "type": "bar", "marker": { "line": { "color": "white", "width": 0.5 }, "pattern": { "size": 10, "fillmode": "overlay", "solidity": 0.2 } }, "error_x": { "color": "#2a3f5f" }, "error_y": { "color": "#2a3f5f" } } ], "pie": [ { "type": "pie", "automargin": true } ], "table": [ { "type": "table", "cells": { "fill": { "color": "#EBF0F8" }, "line": { "color": "white" } }, "header": { "fill": { "color": "#C8D4E3" }, "line": { "color": "white" } } } ], "carpet": [ { "type": "carpet", "aaxis": { "gridcolor": "#C8D4E3", "linecolor": "#C8D4E3", "endlinecolor": "#2a3f5f", "minorgridcolor": "#C8D4E3", "startlinecolor": "#2a3f5f" }, "baxis": { "gridcolor": "#C8D4E3", "linecolor": "#C8D4E3", "endlinecolor": "#2a3f5f", "minorgridcolor": "#C8D4E3", "startlinecolor": "#2a3f5f" } } ], "mesh3d": [ { "type": "mesh3d", "colorbar": { "ticks": "", "outlinewidth": 0 } } ], "contour": [ { "type": "contour", "colorbar": { "ticks": "", "outlinewidth": 0 }, "colorscale": [ [ 0.0, "#0d0887" ], [ 0.1111111111111111, "#46039f" ], [ 0.2222222222222222, "#7201a8" ], [ 0.3333333333333333, "#9c179e" ], [ 0.4444444444444444, "#bd3786" ], [ 0.5555555555555556, "#d8576b" ], [ 0.6666666666666666, "#ed7953" ], [ 0.7777777777777778, "#fb9f3a" ], [ 0.8888888888888888, "#fdca26" ], [ 1.0, "#f0f921" ] ] } ], "heatmap": [ { "type": "heatmap", "colorbar": { "ticks": "", "outlinewidth": 0 }, "colorscale": [ [ 0.0, "#0d0887" ], [ 0.1111111111111111, "#46039f" ], [ 0.2222222222222222, "#7201a8" ], [ 0.3333333333333333, "#9c179e" ], [ 0.4444444444444444, "#bd3786" ], [ 0.5555555555555556, "#d8576b" ], [ 0.6666666666666666, "#ed7953" ], [ 0.7777777777777778, "#fb9f3a" ], [ 0.8888888888888888, "#fdca26" ], [ 1.0, "#f0f921" ] ] } ], "scatter": [ { "type": "scatter", "fillpattern": { "size": 10, "fillmode": "overlay", "solidity": 0.2 } } ], "surface": [ { "type": "surface", "colorbar": { "ticks": "", "outlinewidth": 0 }, "colorscale": [ [ 0.0, "#0d0887" ], [ 0.1111111111111111, "#46039f" ], [ 0.2222222222222222, "#7201a8" ], [ 0.3333333333333333, "#9c179e" ], [ 0.4444444444444444, "#bd3786" ], [ 0.5555555555555556, "#d8576b" ], [ 0.6666666666666666, "#ed7953" ], [ 0.7777777777777778, "#fb9f3a" ], [ 0.8888888888888888, "#fdca26" ], [ 1.0, "#f0f921" ] ] } ], "barpolar": [ { "type": "barpolar", "marker": { "line": { "color": "white", "width": 0.5 }, "pattern": { "size": 10, "fillmode": "overlay", "solidity": 0.2 } } } ], "heatmapgl": [ { "type": "heatmapgl", "colorbar": { "ticks": "", "outlinewidth": 0 }, "colorscale": [ [ 0.0, "#0d0887" ], [ 0.1111111111111111, "#46039f" ], [ 0.2222222222222222, "#7201a8" ], [ 0.3333333333333333, "#9c179e" ], [ 0.4444444444444444, "#bd3786" ], [ 0.5555555555555556, "#d8576b" ], [ 0.6666666666666666, "#ed7953" ], [ 0.7777777777777778, "#fb9f3a" ], [ 0.8888888888888888, "#fdca26" ], [ 1.0, "#f0f921" ] ] } ], "histogram": [ { "type": "histogram", "marker": { "pattern": { "size": 10, "fillmode": "overlay", "solidity": 0.2 } } } ], "parcoords": [ { "line": { "colorbar": { "ticks": "", "outlinewidth": 0 } }, "type": "parcoords" } ], "scatter3d": [ { "line": { "colorbar": { "ticks": "", "outlinewidth": 0 } }, "type": "scatter3d", "marker": { "colorbar": { "ticks": "", "outlinewidth": 0 } } } ], "scattergl": [ { "type": "scattergl", "marker": { "colorbar": { "ticks": "", "outlinewidth": 0 } } } ], "choropleth": [ { "type": "choropleth", "colorbar": { "ticks": "", "outlinewidth": 0 } } ], "scattergeo": [ { "type": "scattergeo", "marker": { "colorbar": { "ticks": "", "outlinewidth": 0 } } } ], "histogram2d": [ { "type": "histogram2d", "colorbar": { "ticks": "", "outlinewidth": 0 }, "colorscale": [ [ 0.0, "#0d0887" ], [ 0.1111111111111111, "#46039f" ], [ 0.2222222222222222, "#7201a8" ], [ 0.3333333333333333, "#9c179e" ], [ 0.4444444444444444, "#bd3786" ], [ 0.5555555555555556, "#d8576b" ], [ 0.6666666666666666, "#ed7953" ], [ 0.7777777777777778, "#fb9f3a" ], [ 0.8888888888888888, "#fdca26" ], [ 1.0, "#f0f921" ] ] } ], "scatterpolar": [ { "type": "scatterpolar", "marker": { "colorbar": { "ticks": "", "outlinewidth": 0 } } } ], "contourcarpet": [ { "type": "contourcarpet", "colorbar": { "ticks": "", "outlinewidth": 0 } } ], "scattercarpet": [ { "type": "scattercarpet", "marker": { "colorbar": { "ticks": "", "outlinewidth": 0 } } } ], "scattermapbox": [ { "type": "scattermapbox", "marker": { "colorbar": { "ticks": "", "outlinewidth": 0 } } } ], "scatterpolargl": [ { "type": "scatterpolargl", "marker": { "colorbar": { "ticks": "", "outlinewidth": 0 } } } ], "scatterternary": [ { "type": "scatterternary", "marker": { "colorbar": { "ticks": "", "outlinewidth": 0 } } } ], "histogram2dcontour": [ { "type": "histogram2dcontour", "colorbar": { "ticks": "", "outlinewidth": 0 }, "colorscale": [ [ 0.0, "#0d0887" ], [ 0.1111111111111111, "#46039f" ], [ 0.2222222222222222, "#7201a8" ], [ 0.3333333333333333, "#9c179e" ], [ 0.4444444444444444, "#bd3786" ], [ 0.5555555555555556, "#d8576b" ], [ 0.6666666666666666, "#ed7953" ], [ 0.7777777777777778, "#fb9f3a" ], [ 0.8888888888888888, "#fdca26" ], [ 1.0, "#f0f921" ] ] } ] }, "layout": { "geo": { "bgcolor": "white", "showland": true, "lakecolor": "white", "landcolor": "white", "showlakes": true, "subunitcolor": "#C8D4E3" }, "font": { "color": "#2a3f5f" }, "polar": { "bgcolor": "white", "radialaxis": { "ticks": "", "gridcolor": "#EBF0F8", "linecolor": "#EBF0F8" }, "angularaxis": { "ticks": "", "gridcolor": "#EBF0F8", "linecolor": "#EBF0F8" } }, "scene": { "xaxis": { "ticks": "", "gridcolor": "#DFE8F3", "gridwidth": 2, "linecolor": "#EBF0F8", "zerolinecolor": "#EBF0F8", "showbackground": true, "backgroundcolor": "white" }, "yaxis": { "ticks": "", "gridcolor": "#DFE8F3", "gridwidth": 2, "linecolor": "#EBF0F8", "zerolinecolor": "#EBF0F8", "showbackground": true, "backgroundcolor": "white" }, "zaxis": { "ticks": "", "gridcolor": "#DFE8F3", "gridwidth": 2, "linecolor": "#EBF0F8", "zerolinecolor": "#EBF0F8", "showbackground": true, "backgroundcolor": "white" } }, "title": { "x": 0.05 }, "xaxis": { "ticks": "", "title": { "standoff": 15 }, "gridcolor": "#EBF0F8", "linecolor": "#EBF0F8", "automargin": true, "zerolinecolor": "#EBF0F8", "zerolinewidth": 2 }, "yaxis": { "ticks": "", "title": { "standoff": 15 }, "gridcolor": "#EBF0F8", "linecolor": "#EBF0F8", "automargin": true, "zerolinecolor": "#EBF0F8", "zerolinewidth": 2 }, "mapbox": { "style": "light" }, "ternary": { "aaxis": { "ticks": "", "gridcolor": "#DFE8F3", "linecolor": "#A2B1C6" }, "baxis": { "ticks": "", "gridcolor": "#DFE8F3", "linecolor": "#A2B1C6" }, "caxis": { "ticks": "", "gridcolor": "#DFE8F3", "linecolor": "#A2B1C6" }, "bgcolor": "white" }, "colorway": [ "#636efa", "#EF553B", "#00cc96", "#ab63fa", "#FFA15A", "#19d3f3", "#FF6692", "#B6E880", "#FF97FF", "#FECB52" ], "coloraxis": { "colorbar": { "ticks": "", "outlinewidth": 0 } }, "hovermode": "closest", "colorscale": { "diverging": [ [ 0, "#8e0152" ], [ 0.1, "#c51b7d" ], [ 0.2, "#de77ae" ], [ 0.3, "#f1b6da" ], [ 0.4, "#fde0ef" ], [ 0.5, "#f7f7f7" ], [ 0.6, "#e6f5d0" ], [ 0.7, "#b8e186" ], [ 0.8, "#7fbc41" ], [ 0.9, "#4d9221" ], [ 1, "#276419" ] ], "sequential": [ [ 0.0, "#0d0887" ], [ 0.1111111111111111, "#46039f" ], [ 0.2222222222222222, "#7201a8" ], [ 0.3333333333333333, "#9c179e" ], [ 0.4444444444444444, "#bd3786" ], [ 0.5555555555555556, "#d8576b" ], [ 0.6666666666666666, "#ed7953" ], [ 0.7777777777777778, "#fb9f3a" ], [ 0.8888888888888888, "#fdca26" ], [ 1.0, "#f0f921" ] ], "sequentialminus": [ [ 0.0, "#0d0887" ], [ 0.1111111111111111, "#46039f" ], [ 0.2222222222222222, "#7201a8" ], [ 0.3333333333333333, "#9c179e" ], [ 0.4444444444444444, "#bd3786" ], [ 0.5555555555555556, "#d8576b" ], [ 0.6666666666666666, "#ed7953" ], [ 0.7777777777777778, "#fb9f3a" ], [ 0.8888888888888888, "#fdca26" ], [ 1.0, "#f0f921" ] ] }, "hoverlabel": { "align": "left" }, "plot_bgcolor": "white", "paper_bgcolor": "white", "shapedefaults": { "line": { "color": "#2a3f5f" } }, "autotypenumbers": "strict", "annotationdefaults": { "arrowhead": 0, "arrowcolor": "#2a3f5f", "arrowwidth": 1 } } } } }, "height": 500, "width": null, "user": { "profile_url": "https://chart-studio.plotly.com/~jkuntz", "avatar_url": "https://storage.googleapis.com/plotly-prod-profiles/34.jpg", "background_url": "https://storage.googleapis.com/plotly-prod-profiles/bg-11.jpg", "bio": "", "nickname": "", "website": "", "stream_tokens": null, "feature_set_id": null, "csrf_token": null, "date_joined": "2024-04-02 20:04:41", "mapbox_access_tokens": null, "has_password": null, "username": "jkuntz", "email": null, "is_active": null, "readonly": null, "is_dash_creator": null, "dash_created_count": null, "is_chart_creator": null, "charts_created_count": null } }, { "creation_time": "2024-04-02T21:01:49.023749Z", "comments": { "results": [], "count": 0 }, "parented": true, "embed_url": "https://chart-studio.plotly.com/~jkuntz/108.embed", "fid": "jkuntz:108", "filename": "query_execution_times_by_query_20240402205542 copy", "filetype": "plot", "img_url": "https://storage.googleapis.com/plotly-prod-images/jkuntz/108/9_N2E48GJIV3ZSKJFPF4IH5UIZYHJ5VO.png", "image_urls": { "default": "https://storage.googleapis.com/plotly-prod-images/jkuntz/108/2_HRHEW2JHRVOORTTJ56VW0GANM3LTDB.png", "block-thumb": "https://storage.googleapis.com/plotly-prod-images/jkuntz/108/8_8SEVLS4D2O88O0BK41P7XUNHFAE031.png", "list-thumb": "https://storage.googleapis.com/plotly-prod-images/jkuntz/108/9_N2E48GJIV3ZSKJFPF4IH5UIZYHJ5VO.png" }, "api_urls": { "files": "https://api.plotly.com/v2/files/jkuntz:108", "plots": "https://api.plotly.com/v2/plots/jkuntz:108", "parent": "https://api.plotly.com/v2/folders/home?user=jkuntz" }, "owner": "jkuntz", "parent": -1, "preview": "", "referencers": [], "references": [], "title": "", "views": 2, "web_url": "https://chart-studio.plotly.com/~jkuntz/108/", "world_readable": true, "date_modified": "2024-04-02T21:01:49.383Z", "stars": { "results": [], "count": 0 }, "collaborators": { "results": [], "count": 0 }, "subfolder_count": null, "refresh_interval": null, "organize_view_url": "https://chart-studio.plotly.com/~jkuntz/108/", "current_user_permission": "read", "is_theme": null, "is_template": null, "autosize": true, "caption": "", "figure": { "data": [ { "mode": "lines", "name": "fuzzyMatch Response Time", "type": "scatter", "ysrc": "jkuntz:107:0d097f", "xaxis": "x", "yaxis": "y" }, { "line": { "dash": "dash" }, "mode": "lines", "name": "Average", "type": "scatter", "ysrc": "jkuntz:107:92b7d1", "xaxis": "x", "yaxis": "y" }, { "line": { "dash": "dash" }, "mode": "lines", "name": "95th Percentile", "type": "scatter", "ysrc": "jkuntz:107:a5acd5", "xaxis": "x", "yaxis": "y" }, { "line": { "dash": "dash" }, "mode": "lines", "name": "99th Percentile", "type": "scatter", "ysrc": "jkuntz:107:b0348a", "xaxis": "x", "yaxis": "y" }, { "mode": "lines", "name": "ArnTxTotal Response Time", "type": "scatter", "ysrc": "jkuntz:107:0c1ede", "xaxis": "x2", "yaxis": "y2" }, { "line": { "dash": "dash" }, "mode": "lines", "name": "Average", "type": "scatter", "ysrc": "jkuntz:107:15d0ce", "xaxis": "x2", "yaxis": "y2" }, { "line": { "dash": "dash" }, "mode": "lines", "name": "95th Percentile", "type": "scatter", "ysrc": "jkuntz:107:ebccff", "xaxis": "x2", "yaxis": "y2" }, { "line": { "dash": "dash" }, "mode": "lines", "name": "99th Percentile", "type": "scatter", "ysrc": "jkuntz:107:d44388", "xaxis": "x2", "yaxis": "y2" }, { "mode": "lines", "name": "merchantTxTotal Response Time", "type": "scatter", "ysrc": "jkuntz:107:7959f0", "xaxis": "x3", "yaxis": "y3" }, { "line": { "dash": "dash" }, "mode": "lines", "name": "Average", "type": "scatter", "ysrc": "jkuntz:107:87139e", "xaxis": "x3", "yaxis": "y3" }, { "line": { "dash": "dash" }, "mode": "lines", "name": "95th Percentile", "type": "scatter", "ysrc": "jkuntz:107:25589e", "xaxis": "x3", "yaxis": "y3" }, { "line": { "dash": "dash" }, "mode": "lines", "name": "99th Percentile", "type": "scatter", "ysrc": "jkuntz:107:3c7ce2", "xaxis": "x3", "yaxis": "y3" }, { "mode": "lines", "name": "Q4 Response Time", "type": "scatter", "ysrc": "jkuntz:107:66a906", "xaxis": "x4", "yaxis": "y4" }, { "line": { "dash": "dash" }, "mode": "lines", "name": "Average", "type": "scatter", "ysrc": "jkuntz:107:ac52d1", "xaxis": "x4", "yaxis": "y4" }, { "line": { "dash": "dash" }, "mode": "lines", "name": "95th Percentile", "type": "scatter", "ysrc": "jkuntz:107:88e0e4", "xaxis": "x4", "yaxis": "y4" }, { "line": { "dash": "dash" }, "mode": "lines", "name": "99th Percentile", "type": "scatter", "ysrc": "jkuntz:107:388ae1", "xaxis": "x4", "yaxis": "y4" }, { "mode": "lines", "name": "Q5 Response Time", "type": "scatter", "ysrc": "jkuntz:107:c36a32", "xaxis": "x5", "yaxis": "y5" }, { "line": { "dash": "dash" }, "mode": "lines", "name": "Average", "type": "scatter", "ysrc": "jkuntz:107:c0ccd0", "xaxis": "x5", "yaxis": "y5" }, { "line": { "dash": "dash" }, "mode": "lines", "name": "95th Percentile", "type": "scatter", "ysrc": "jkuntz:107:179591", "xaxis": "x5", "yaxis": "y5" }, { "line": { "dash": "dash" }, "mode": "lines", "name": "99th Percentile", "type": "scatter", "ysrc": "jkuntz:107:a0d56e", "xaxis": "x5", "yaxis": "y5" }, { "mode": "lines", "name": "Q6 Response Time", "type": "scatter", "ysrc": "jkuntz:107:204fdb", "xaxis": "x6", "yaxis": "y6" }, { "line": { "dash": "dash" }, "mode": "lines", "name": "Average", "type": "scatter", "ysrc": "jkuntz:107:0b6581", "xaxis": "x6", "yaxis": "y6" }, { "line": { "dash": "dash" }, "mode": "lines", "name": "95th Percentile", "type": "scatter", "ysrc": "jkuntz:107:7d5a05", "xaxis": "x6", "yaxis": "y6" }, { "line": { "dash": "dash" }, "mode": "lines", "name": "99th Percentile", "type": "scatter", "ysrc": "jkuntz:107:2b80f3", "xaxis": "x6", "yaxis": "y6" }, { "mode": "lines", "name": "Q7 Response Time", "type": "scatter", "ysrc": "jkuntz:107:369977", "xaxis": "x7", "yaxis": "y7" }, { "line": { "dash": "dash" }, "mode": "lines", "name": "Average", "type": "scatter", "ysrc": "jkuntz:107:c7c033", "xaxis": "x7", "yaxis": "y7" }, { "line": { "dash": "dash" }, "mode": "lines", "name": "95th Percentile", "type": "scatter", "ysrc": "jkuntz:107:ebb367", "xaxis": "x7", "yaxis": "y7" }, { "line": { "dash": "dash" }, "mode": "lines", "name": "99th Percentile", "type": "scatter", "ysrc": "jkuntz:107:389b0e", "xaxis": "x7", "yaxis": "y7" }, { "mode": "lines", "name": "Q8 Response Time", "type": "scatter", "ysrc": "jkuntz:107:3ba74c", "xaxis": "x8", "yaxis": "y8" }, { "line": { "dash": "dash" }, "mode": "lines", "name": "Average", "type": "scatter", "ysrc": "jkuntz:107:db5a24", "xaxis": "x8", "yaxis": "y8" }, { "line": { "dash": "dash" }, "mode": "lines", "name": "95th Percentile", "type": "scatter", "ysrc": "jkuntz:107:201d76", "xaxis": "x8", "yaxis": "y8" }, { "line": { "dash": "dash" }, "mode": "lines", "name": "99th Percentile", "type": "scatter", "ysrc": "jkuntz:107:1ea349", "xaxis": "x8", "yaxis": "y8" }, { "mode": "lines", "name": "Q9 Response Time", "type": "scatter", "ysrc": "jkuntz:107:b1273c", "xaxis": "x9", "yaxis": "y9" }, { "line": { "dash": "dash" }, "mode": "lines", "name": "Average", "type": "scatter", "ysrc": "jkuntz:107:a5a7f1", "xaxis": "x9", "yaxis": "y9" }, { "line": { "dash": "dash" }, "mode": "lines", "name": "95th Percentile", "type": "scatter", "ysrc": "jkuntz:107:8f6e8d", "xaxis": "x9", "yaxis": "y9" }, { "line": { "dash": "dash" }, "mode": "lines", "name": "99th Percentile", "type": "scatter", "ysrc": "jkuntz:107:84bca7", "xaxis": "x9", "yaxis": "y9" }, { "mode": "lines", "name": "Q10 Response Time", "type": "scatter", "ysrc": "jkuntz:107:5f700f", "xaxis": "x10", "yaxis": "y10" }, { "line": { "dash": "dash" }, "mode": "lines", "name": "Average", "type": "scatter", "ysrc": "jkuntz:107:a9e3f4", "xaxis": "x10", "yaxis": "y10" }, { "line": { "dash": "dash" }, "mode": "lines", "name": "95th Percentile", "type": "scatter", "ysrc": "jkuntz:107:0b9b8f", "xaxis": "x10", "yaxis": "y10" }, { "line": { "dash": "dash" }, "mode": "lines", "name": "99th Percentile", "type": "scatter", "ysrc": "jkuntz:107:4fdbf4", "xaxis": "x10", "yaxis": "y10" }, { "mode": "lines", "name": "Q11 Response Time", "type": "scatter", "ysrc": "jkuntz:107:d500a1", "xaxis": "x11", "yaxis": "y11" }, { "line": { "dash": "dash" }, "mode": "lines", "name": "Average", "type": "scatter", "ysrc": "jkuntz:107:5f0f97", "xaxis": "x11", "yaxis": "y11" }, { "line": { "dash": "dash" }, "mode": "lines", "name": "95th Percentile", "type": "scatter", "ysrc": "jkuntz:107:9a3704", "xaxis": "x11", "yaxis": "y11" }, { "line": { "dash": "dash" }, "mode": "lines", "name": "99th Percentile", "type": "scatter", "ysrc": "jkuntz:107:966611", "xaxis": "x11", "yaxis": "y11" } ], "layout": { "title": { "text": "Query Execution Times by Query" }, "xaxis": { "anchor": "y", "domain": [ 0.0, 0.2888888888888889 ] }, "yaxis": { "anchor": "x", "domain": [ 0.84375, 1.0 ] }, "height": 850, "xaxis2": { "anchor": "y2", "domain": [ 0.35555555555555557, 0.6444444444444445 ] }, "xaxis3": { "anchor": "y3", "domain": [ 0.7111111111111111, 1.0 ] }, "xaxis4": { "anchor": "y4", "domain": [ 0.0, 0.2888888888888889 ] }, "xaxis5": { "anchor": "y5", "domain": [ 0.35555555555555557, 0.6444444444444445 ] }, "xaxis6": { "anchor": "y6", "domain": [ 0.7111111111111111, 1.0 ] }, "xaxis7": { "anchor": "y7", "domain": [ 0.0, 0.2888888888888889 ] }, "xaxis8": { "anchor": "y8", "domain": [ 0.35555555555555557, 0.6444444444444445 ] }, "xaxis9": { "anchor": "y9", "domain": [ 0.7111111111111111, 1.0 ] }, "yaxis2": { "anchor": "x2", "domain": [ 0.84375, 1.0 ] }, "yaxis3": { "anchor": "x3", "domain": [ 0.84375, 1.0 ] }, "yaxis4": { "anchor": "x4", "domain": [ 0.5625, 0.71875 ] }, "yaxis5": { "anchor": "x5", "domain": [ 0.5625, 0.71875 ] }, "yaxis6": { "anchor": "x6", "domain": [ 0.5625, 0.71875 ] }, "yaxis7": { "anchor": "x7", "domain": [ 0.28125, 0.4375 ] }, "yaxis8": { "anchor": "x8", "domain": [ 0.28125, 0.4375 ] }, "yaxis9": { "anchor": "x9", "domain": [ 0.28125, 0.4375 ] }, "xaxis10": { "anchor": "y10", "domain": [ 0.0, 0.2888888888888889 ] }, "xaxis11": { "anchor": "y11", "domain": [ 0.35555555555555557, 0.6444444444444445 ] }, "xaxis12": { "anchor": "y12", "domain": [ 0.7111111111111111, 1.0 ] }, "yaxis10": { "anchor": "x10", "domain": [ 0.0, 0.15625 ] }, "yaxis11": { "anchor": "x11", "domain": [ 0.0, 0.15625 ] }, "yaxis12": { "anchor": "x12", "domain": [ 0.0, 0.15625 ] }, "template": { "data": { "bar": [ { "type": "bar", "marker": { "line": { "color": "white", "width": 0.5 }, "pattern": { "size": 10, "fillmode": "overlay", "solidity": 0.2 } }, "error_x": { "color": "#2a3f5f" }, "error_y": { "color": "#2a3f5f" } } ], "pie": [ { "type": "pie", "automargin": true } ], "table": [ { "type": "table", "cells": { "fill": { "color": "#EBF0F8" }, "line": { "color": "white" } }, "header": { "fill": { "color": "#C8D4E3" }, "line": { "color": "white" } } } ], "carpet": [ { "type": "carpet", "aaxis": { "gridcolor": "#C8D4E3", "linecolor": "#C8D4E3", "endlinecolor": "#2a3f5f", "minorgridcolor": "#C8D4E3", "startlinecolor": "#2a3f5f" }, "baxis": { "gridcolor": "#C8D4E3", "linecolor": "#C8D4E3", "endlinecolor": "#2a3f5f", "minorgridcolor": "#C8D4E3", "startlinecolor": "#2a3f5f" } } ], "mesh3d": [ { "type": "mesh3d", "colorbar": { "ticks": "", "outlinewidth": 0 } } ], "contour": [ { "type": "contour", "colorbar": { "ticks": "", "outlinewidth": 0 }, "colorscale": [ [ 0.0, "#0d0887" ], [ 0.1111111111111111, "#46039f" ], [ 0.2222222222222222, "#7201a8" ], [ 0.3333333333333333, "#9c179e" ], [ 0.4444444444444444, "#bd3786" ], [ 0.5555555555555556, "#d8576b" ], [ 0.6666666666666666, "#ed7953" ], [ 0.7777777777777778, "#fb9f3a" ], [ 0.8888888888888888, "#fdca26" ], [ 1.0, "#f0f921" ] ] } ], "heatmap": [ { "type": "heatmap", "colorbar": { "ticks": "", "outlinewidth": 0 }, "colorscale": [ [ 0.0, "#0d0887" ], [ 0.1111111111111111, "#46039f" ], [ 0.2222222222222222, "#7201a8" ], [ 0.3333333333333333, "#9c179e" ], [ 0.4444444444444444, "#bd3786" ], [ 0.5555555555555556, "#d8576b" ], [ 0.6666666666666666, "#ed7953" ], [ 0.7777777777777778, "#fb9f3a" ], [ 0.8888888888888888, "#fdca26" ], [ 1.0, "#f0f921" ] ] } ], "scatter": [ { "type": "scatter", "fillpattern": { "size": 10, "fillmode": "overlay", "solidity": 0.2 } } ], "surface": [ { "type": "surface", "colorbar": { "ticks": "", "outlinewidth": 0 }, "colorscale": [ [ 0.0, "#0d0887" ], [ 0.1111111111111111, "#46039f" ], [ 0.2222222222222222, "#7201a8" ], [ 0.3333333333333333, "#9c179e" ], [ 0.4444444444444444, "#bd3786" ], [ 0.5555555555555556, "#d8576b" ], [ 0.6666666666666666, "#ed7953" ], [ 0.7777777777777778, "#fb9f3a" ], [ 0.8888888888888888, "#fdca26" ], [ 1.0, "#f0f921" ] ] } ], "barpolar": [ { "type": "barpolar", "marker": { "line": { "color": "white", "width": 0.5 }, "pattern": { "size": 10, "fillmode": "overlay", "solidity": 0.2 } } } ], "heatmapgl": [ { "type": "heatmapgl", "colorbar": { "ticks": "", "outlinewidth": 0 }, "colorscale": [ [ 0.0, "#0d0887" ], [ 0.1111111111111111, "#46039f" ], [ 0.2222222222222222, "#7201a8" ], [ 0.3333333333333333, "#9c179e" ], [ 0.4444444444444444, "#bd3786" ], [ 0.5555555555555556, "#d8576b" ], [ 0.6666666666666666, "#ed7953" ], [ 0.7777777777777778, "#fb9f3a" ], [ 0.8888888888888888, "#fdca26" ], [ 1.0, "#f0f921" ] ] } ], "histogram": [ { "type": "histogram", "marker": { "pattern": { "size": 10, "fillmode": "overlay", "solidity": 0.2 } } } ], "parcoords": [ { "line": { "colorbar": { "ticks": "", "outlinewidth": 0 } }, "type": "parcoords" } ], "scatter3d": [ { "line": { "colorbar": { "ticks": "", "outlinewidth": 0 } }, "type": "scatter3d", "marker": { "colorbar": { "ticks": "", "outlinewidth": 0 } } } ], "scattergl": [ { "type": "scattergl", "marker": { "colorbar": { "ticks": "", "outlinewidth": 0 } } } ], "choropleth": [ { "type": "choropleth", "colorbar": { "ticks": "", "outlinewidth": 0 } } ], "scattergeo": [ { "type": "scattergeo", "marker": { "colorbar": { "ticks": "", "outlinewidth": 0 } } } ], "histogram2d": [ { "type": "histogram2d", "colorbar": { "ticks": "", "outlinewidth": 0 }, "colorscale": [ [ 0.0, "#0d0887" ], [ 0.1111111111111111, "#46039f" ], [ 0.2222222222222222, "#7201a8" ], [ 0.3333333333333333, "#9c179e" ], [ 0.4444444444444444, "#bd3786" ], [ 0.5555555555555556, "#d8576b" ], [ 0.6666666666666666, "#ed7953" ], [ 0.7777777777777778, "#fb9f3a" ], [ 0.8888888888888888, "#fdca26" ], [ 1.0, "#f0f921" ] ] } ], "scatterpolar": [ { "type": "scatterpolar", "marker": { "colorbar": { "ticks": "", "outlinewidth": 0 } } } ], "contourcarpet": [ { "type": "contourcarpet", "colorbar": { "ticks": "", "outlinewidth": 0 } } ], "scattercarpet": [ { "type": "scattercarpet", "marker": { "colorbar": { "ticks": "", "outlinewidth": 0 } } } ], "scattermapbox": [ { "type": "scattermapbox", "marker": { "colorbar": { "ticks": "", "outlinewidth": 0 } } } ], "scatterpolargl": [ { "type": "scatterpolargl", "marker": { "colorbar": { "ticks": "", "outlinewidth": 0 } } } ], "scatterternary": [ { "type": "scatterternary", "marker": { "colorbar": { "ticks": "", "outlinewidth": 0 } } } ], "histogram2dcontour": [ { "type": "histogram2dcontour", "colorbar": { "ticks": "", "outlinewidth": 0 }, "colorscale": [ [ 0.0, "#0d0887" ], [ 0.1111111111111111, "#46039f" ], [ 0.2222222222222222, "#7201a8" ], [ 0.3333333333333333, "#9c179e" ], [ 0.4444444444444444, "#bd3786" ], [ 0.5555555555555556, "#d8576b" ], [ 0.6666666666666666, "#ed7953" ], [ 0.7777777777777778, "#fb9f3a" ], [ 0.8888888888888888, "#fdca26" ], [ 1.0, "#f0f921" ] ] } ] }, "layout": { "geo": { "bgcolor": "white", "showland": true, "lakecolor": "white", "landcolor": "white", "showlakes": true, "subunitcolor": "#C8D4E3" }, "font": { "color": "#2a3f5f" }, "polar": { "bgcolor": "white", "radialaxis": { "ticks": "", "gridcolor": "#EBF0F8", "linecolor": "#EBF0F8" }, "angularaxis": { "ticks": "", "gridcolor": "#EBF0F8", "linecolor": "#EBF0F8" } }, "scene": { "xaxis": { "ticks": "", "gridcolor": "#DFE8F3", "gridwidth": 2, "linecolor": "#EBF0F8", "zerolinecolor": "#EBF0F8", "showbackground": true, "backgroundcolor": "white" }, "yaxis": { "ticks": "", "gridcolor": "#DFE8F3", "gridwidth": 2, "linecolor": "#EBF0F8", "zerolinecolor": "#EBF0F8", "showbackground": true, "backgroundcolor": "white" }, "zaxis": { "ticks": "", "gridcolor": "#DFE8F3", "gridwidth": 2, "linecolor": "#EBF0F8", "zerolinecolor": "#EBF0F8", "showbackground": true, "backgroundcolor": "white" } }, "title": { "x": 0.05 }, "xaxis": { "ticks": "", "title": { "standoff": 15 }, "gridcolor": "#EBF0F8", "linecolor": "#EBF0F8", "automargin": true, "zerolinecolor": "#EBF0F8", "zerolinewidth": 2 }, "yaxis": { "ticks": "", "title": { "standoff": 15 }, "gridcolor": "#EBF0F8", "linecolor": "#EBF0F8", "automargin": true, "zerolinecolor": "#EBF0F8", "zerolinewidth": 2 }, "mapbox": { "style": "light" }, "ternary": { "aaxis": { "ticks": "", "gridcolor": "#DFE8F3", "linecolor": "#A2B1C6" }, "baxis": { "ticks": "", "gridcolor": "#DFE8F3", "linecolor": "#A2B1C6" }, "caxis": { "ticks": "", "gridcolor": "#DFE8F3", "linecolor": "#A2B1C6" }, "bgcolor": "white" }, "colorway": [ "#636efa", "#EF553B", "#00cc96", "#ab63fa", "#FFA15A", "#19d3f3", "#FF6692", "#B6E880", "#FF97FF", "#FECB52" ], "coloraxis": { "colorbar": { "ticks": "", "outlinewidth": 0 } }, "hovermode": "closest", "colorscale": { "diverging": [ [ 0, "#8e0152" ], [ 0.1, "#c51b7d" ], [ 0.2, "#de77ae" ], [ 0.3, "#f1b6da" ], [ 0.4, "#fde0ef" ], [ 0.5, "#f7f7f7" ], [ 0.6, "#e6f5d0" ], [ 0.7, "#b8e186" ], [ 0.8, "#7fbc41" ], [ 0.9, "#4d9221" ], [ 1, "#276419" ] ], "sequential": [ [ 0.0, "#0d0887" ], [ 0.1111111111111111, "#46039f" ], [ 0.2222222222222222, "#7201a8" ], [ 0.3333333333333333, "#9c179e" ], [ 0.4444444444444444, "#bd3786" ], [ 0.5555555555555556, "#d8576b" ], [ 0.6666666666666666, "#ed7953" ], [ 0.7777777777777778, "#fb9f3a" ], [ 0.8888888888888888, "#fdca26" ], [ 1.0, "#f0f921" ] ], "sequentialminus": [ [ 0.0, "#0d0887" ], [ 0.1111111111111111, "#46039f" ], [ 0.2222222222222222, "#7201a8" ], [ 0.3333333333333333, "#9c179e" ], [ 0.4444444444444444, "#bd3786" ], [ 0.5555555555555556, "#d8576b" ], [ 0.6666666666666666, "#ed7953" ], [ 0.7777777777777778, "#fb9f3a" ], [ 0.8888888888888888, "#fdca26" ], [ 1.0, "#f0f921" ] ] }, "hoverlabel": { "align": "left" }, "plot_bgcolor": "white", "paper_bgcolor": "white", "shapedefaults": { "line": { "color": "#2a3f5f" } }, "autotypenumbers": "strict", "annotationdefaults": { "arrowhead": 0, "arrowcolor": "#2a3f5f", "arrowwidth": 1 } } }, "annotations": [ { "x": 0.14444444444444446, "y": 1.0, "font": { "size": 16 }, "text": "fuzzyMatch", "xref": "paper", "yref": "paper", "xanchor": "center", "yanchor": "bottom", "showarrow": false }, { "x": 0.5, "y": 1.0, "font": { "size": 16 }, "text": "ArnTxTotal", "xref": "paper", "yref": "paper", "xanchor": "center", "yanchor": "bottom", "showarrow": false }, { "x": 0.8555555555555556, "y": 1.0, "font": { "size": 16 }, "text": "merchantTxTotal", "xref": "paper", "yref": "paper", "xanchor": "center", "yanchor": "bottom", "showarrow": false }, { "x": 0.14444444444444446, "y": 0.71875, "font": { "size": 16 }, "text": "Q4", "xref": "paper", "yref": "paper", "xanchor": "center", "yanchor": "bottom", "showarrow": false }, { "x": 0.5, "y": 0.71875, "font": { "size": 16 }, "text": "Q5", "xref": "paper", "yref": "paper", "xanchor": "center", "yanchor": "bottom", "showarrow": false }, { "x": 0.8555555555555556, "y": 0.71875, "font": { "size": 16 }, "text": "Q6", "xref": "paper", "yref": "paper", "xanchor": "center", "yanchor": "bottom", "showarrow": false }, { "x": 0.14444444444444446, "y": 0.4375, "font": { "size": 16 }, "text": "Q7", "xref": "paper", "yref": "paper", "xanchor": "center", "yanchor": "bottom", "showarrow": false }, { "x": 0.5, "y": 0.4375, "font": { "size": 16 }, "text": "Q8", "xref": "paper", "yref": "paper", "xanchor": "center", "yanchor": "bottom", "showarrow": false }, { "x": 0.8555555555555556, "y": 0.4375, "font": { "size": 16 }, "text": "Q9", "xref": "paper", "yref": "paper", "xanchor": "center", "yanchor": "bottom", "showarrow": false }, { "x": 0.14444444444444446, "y": 0.15625, "font": { "size": 16 }, "text": "Q10", "xref": "paper", "yref": "paper", "xanchor": "center", "yanchor": "bottom", "showarrow": false }, { "x": 0.5, "y": 0.15625, "font": { "size": 16 }, "text": "Q11", "xref": "paper", "yref": "paper", "xanchor": "center", "yanchor": "bottom", "showarrow": false } ] } }, "height": 850, "width": null, "user": { "profile_url": "https://chart-studio.plotly.com/~jkuntz", "avatar_url": "https://storage.googleapis.com/plotly-prod-profiles/34.jpg", "background_url": "https://storage.googleapis.com/plotly-prod-profiles/bg-11.jpg", "bio": "", "nickname": "", "website": "", "stream_tokens": null, "feature_set_id": null, "csrf_token": null, "date_joined": "2024-04-02 20:04:41", "mapbox_access_tokens": null, "has_password": null, "username": "jkuntz", "email": null, "is_active": null, "readonly": null, "is_dash_creator": null, "dash_created_count": null, "is_chart_creator": null, "charts_created_count": null } }, { "creation_time": "2024-04-02T20:59:11.021998Z", "comments": { "results": [], "count": 0 }, "parented": true, "embed_url": "https://chart-studio.plotly.com/~josh.allen14/5.embed", "fid": "josh.allen14:5", "filename": "Plot 5", "filetype": "plot", "img_url": "https://storage.googleapis.com/plotly-prod-images/josh.allen14/5/9_4H44PM32OHIZPEVFRG820X1ACBT9OP.png", "image_urls": { "default": "https://storage.googleapis.com/plotly-prod-images/josh.allen14/5/2_DEJA7NPQ1XCFADYSNK8R6P4PFMZPH4.png", "block-thumb": "https://storage.googleapis.com/plotly-prod-images/josh.allen14/5/8_PH9S0JZ9A9IFTC8U5D7Y5SXOP45636.png", "list-thumb": "https://storage.googleapis.com/plotly-prod-images/josh.allen14/5/9_4H44PM32OHIZPEVFRG820X1ACBT9OP.png" }, "api_urls": { "files": "https://api.plotly.com/v2/files/josh.allen14:5", "plots": "https://api.plotly.com/v2/plots/josh.allen14:5", "parent": "https://api.plotly.com/v2/folders/home?user=josh.allen14" }, "owner": "josh.allen14", "parent": -1, "preview": "", "referencers": [], "references": [], "title": "", "views": 2, "web_url": "https://chart-studio.plotly.com/~josh.allen14/5/", "world_readable": true, "date_modified": "2024-04-02T20:59:11.031Z", "stars": { "results": [], "count": 0 }, "collaborators": { "results": [], "count": 0 }, "subfolder_count": null, "refresh_interval": null, "organize_view_url": "https://chart-studio.plotly.com/~josh.allen14/5/", "current_user_permission": "read", "is_theme": null, "is_template": false, "autosize": true, "caption": "", "figure": { "data": [ { "meta": { "columnNames": { "x": "B", "y": "A" } }, "mode": "lines", "type": "scatter", "xsrc": "josh.allen14:3:1be872", "ysrc": "josh.allen14:3:7de1fb" }, { "meta": { "columnNames": { "x": "B", "y": "A" } }, "mode": "lines", "type": "scatter", "xsrc": "josh.allen14:4:f21115", "ysrc": "josh.allen14:4:2e7a97", "stackgroup": null } ], "frames": [], "layout": { "title": { "text": "Catalyzed Reaction" }, "xaxis": { "type": "linear", "range": [ 0.00318, 0.0035 ], "title": { "text": "1/T" }, "autorange": true }, "yaxis": { "type": "linear", "range": [ -8.401111111111112, -4.778888888888889 ], "title": { "text": "Ln (k)" }, "autorange": true }, "autosize": true, "template": { "data": { "bar": [ { "type": "bar", "marker": { "colorbar": { "ticks": "", "outlinewidth": 0 } } } ], "table": [ { "type": "table", "cells": { "fill": { "color": "#EBF0F8" }, "line": { "color": "white" } }, "header": { "fill": { "color": "#C8D4E3" }, "line": { "color": "white" } } } ], "carpet": [ { "type": "carpet", "aaxis": { "gridcolor": "#C8D4E3", "linecolor": "#C8D4E3", "endlinecolor": "#2a3f5f", "minorgridcolor": "#C8D4E3", "startlinecolor": "#2a3f5f" }, "baxis": { "gridcolor": "#C8D4E3", "linecolor": "#C8D4E3", "endlinecolor": "#2a3f5f", "minorgridcolor": "#C8D4E3", "startlinecolor": "#2a3f5f" } } ], "mesh3d": [ { "type": "mesh3d", "colorbar": { "ticks": "", "outlinewidth": 0 } } ], "contour": [ { "type": "contour", "colorbar": { "ticks": "", "outlinewidth": 0 }, "autocolorscale": true } ], "heatmap": [ { "type": "heatmap", "colorbar": { "ticks": "", "outlinewidth": 0 }, "autocolorscale": true } ], "scatter": [ { "type": "scatter", "marker": { "colorbar": { "ticks": "", "outlinewidth": 0 } } } ], "surface": [ { "type": "surface", "colorbar": { "ticks": "", "outlinewidth": 0 } } ], "heatmapgl": [ { "type": "heatmapgl", "colorbar": { "ticks": "", "outlinewidth": 0 } } ], "histogram": [ { "type": "histogram", "marker": { "colorbar": { "ticks": "", "outlinewidth": 0 } } } ], "parcoords": [ { "line": { "colorbar": { "ticks": "", "outlinewidth": 0 } }, "type": "parcoords" } ], "scatter3d": [ { "type": "scatter3d", "marker": { "colorbar": { "ticks": "", "outlinewidth": 0 } } } ], "scattergl": [ { "type": "scattergl", "marker": { "colorbar": { "ticks": "", "outlinewidth": 0 } } } ], "choropleth": [ { "type": "choropleth", "colorbar": { "ticks": "", "outlinewidth": 0 } } ], "scattergeo": [ { "type": "scattergeo", "marker": { "colorbar": { "ticks": "", "outlinewidth": 0 } } } ], "histogram2d": [ { "type": "histogram2d", "colorbar": { "ticks": "", "outlinewidth": 0 }, "autocolorscale": true } ], "scatterpolar": [ { "type": "scatterpolar", "marker": { "colorbar": { "ticks": "", "outlinewidth": 0 } } } ], "contourcarpet": [ { "type": "contourcarpet", "colorbar": { "ticks": "", "outlinewidth": 0 } } ], "scattercarpet": [ { "type": "scattercarpet", "marker": { "colorbar": { "ticks": "", "outlinewidth": 0 } } } ], "scattermapbox": [ { "type": "scattermapbox", "marker": { "colorbar": { "ticks": "", "outlinewidth": 0 } } } ], "scatterpolargl": [ { "type": "scatterpolargl", "marker": { "colorbar": { "ticks": "", "outlinewidth": 0 } } } ], "scatterternary": [ { "type": "scatterternary", "marker": { "colorbar": { "ticks": "", "outlinewidth": 0 } } } ], "histogram2dcontour": [ { "type": "histogram2dcontour", "colorbar": { "ticks": "", "outlinewidth": 0 }, "autocolorscale": true } ] }, "layout": { "geo": { "bgcolor": "white", "showland": true, "lakecolor": "white", "landcolor": "white", "showlakes": true, "subunitcolor": "#C8D4E3" }, "font": { "color": "#2a3f5f" }, "polar": { "bgcolor": "white", "radialaxis": { "ticks": "", "gridcolor": "#EBF0F8", "linecolor": "#EBF0F8" }, "angularaxis": { "ticks": "", "gridcolor": "#EBF0F8", "linecolor": "#EBF0F8" } }, "scene": { "xaxis": { "ticks": "", "gridcolor": "#DFE8F3", "gridwidth": 2, "linecolor": "#EBF0F8", "zerolinecolor": "#EBF0F8", "showbackground": true, "backgroundcolor": "white" }, "yaxis": { "ticks": "", "gridcolor": "#DFE8F3", "gridwidth": 2, "linecolor": "#EBF0F8", "zerolinecolor": "#EBF0F8", "showbackground": true, "backgroundcolor": "white" }, "zaxis": { "ticks": "", "gridcolor": "#DFE8F3", "gridwidth": 2, "linecolor": "#EBF0F8", "zerolinecolor": "#EBF0F8", "showbackground": true, "backgroundcolor": "white" } }, "title": { "x": 0.05 }, "xaxis": { "ticks": "", "gridcolor": "#EBF0F8", "linecolor": "#EBF0F8", "automargin": true, "zerolinecolor": "#EBF0F8", "zerolinewidth": 2 }, "yaxis": { "ticks": "", "gridcolor": "#EBF0F8", "linecolor": "#EBF0F8", "automargin": true, "zerolinecolor": "#EBF0F8", "zerolinewidth": 2 }, "ternary": { "aaxis": { "ticks": "", "gridcolor": "#DFE8F3", "linecolor": "#A2B1C6" }, "baxis": { "ticks": "", "gridcolor": "#DFE8F3", "linecolor": "#A2B1C6" }, "caxis": { "ticks": "", "gridcolor": "#DFE8F3", "linecolor": "#A2B1C6" }, "bgcolor": "white" }, "colorway": [ "#636efa", "#EF553B", "#00cc96", "#ab63fa", "#19d3f3", "#e763fa", "#fecb52", "#ffa15a", "#ff6692", "#b6e880" ], "hovermode": "closest", "colorscale": { "diverging": [ [ 0, "#8e0152" ], [ 0.1, "#c51b7d" ], [ 0.2, "#de77ae" ], [ 0.3, "#f1b6da" ], [ 0.4, "#fde0ef" ], [ 0.5, "#f7f7f7" ], [ 0.6, "#e6f5d0" ], [ 0.7, "#b8e186" ], [ 0.8, "#7fbc41" ], [ 0.9, "#4d9221" ], [ 1, "#276419" ] ], "sequential": [ [ 0, "#0508b8" ], [ 0.0893854748603352, "#1910d8" ], [ 0.1787709497206704, "#3c19f0" ], [ 0.2681564245810056, "#6b1cfb" ], [ 0.3575418994413408, "#981cfd" ], [ 0.44692737430167595, "#bf1cfd" ], [ 0.5363128491620112, "#dd2bfd" ], [ 0.6256983240223464, "#f246fe" ], [ 0.7150837988826816, "#fc67fd" ], [ 0.8044692737430168, "#fe88fc" ], [ 0.8938547486033519, "#fea5fd" ], [ 0.9832402234636871, "#febefe" ], [ 1, "#fec3fe" ] ], "sequentialminus": [ [ 0, "#0508b8" ], [ 0.0893854748603352, "#1910d8" ], [ 0.1787709497206704, "#3c19f0" ], [ 0.2681564245810056, "#6b1cfb" ], [ 0.3575418994413408, "#981cfd" ], [ 0.44692737430167595, "#bf1cfd" ], [ 0.5363128491620112, "#dd2bfd" ], [ 0.6256983240223464, "#f246fe" ], [ 0.7150837988826816, "#fc67fd" ], [ 0.8044692737430168, "#fe88fc" ], [ 0.8938547486033519, "#fea5fd" ], [ 0.9832402234636871, "#febefe" ], [ 1, "#fec3fe" ] ] }, "plot_bgcolor": "white", "paper_bgcolor": "white", "shapedefaults": { "line": { "width": 0 }, "opacity": 0.4, "fillcolor": "#506784" }, "annotationdefaults": { "arrowhead": 0, "arrowcolor": "#506784", "arrowwidth": 1 } }, "themeRef": "PLOTLY_WHITE" } } }, "height": null, "width": null, "user": { "profile_url": "https://chart-studio.plotly.com/~josh.allen14", "avatar_url": "https://storage.googleapis.com/plotly-prod-profiles/96.jpg", "background_url": "https://storage.googleapis.com/plotly-prod-profiles/bg-6.jpg", "bio": "", "nickname": "", "website": "", "stream_tokens": null, "feature_set_id": null, "csrf_token": null, "date_joined": "2024-04-02 20:31:44", "mapbox_access_tokens": null, "has_password": null, "username": "josh.allen14", "email": null, "is_active": null, "readonly": null, "is_dash_creator": null, "dash_created_count": null, "is_chart_creator": null, "charts_created_count": null } }, { "creation_time": "2024-04-02T20:55:46.061381Z", "comments": { "results": [], "count": 0 }, "parented": true, "embed_url": "https://chart-studio.plotly.com/~jkuntz/105.embed", "fid": "jkuntz:105", "filename": "query_execution_times_by_query_20240402205542", "filetype": "plot", "img_url": "https://storage.googleapis.com/plotly-prod-images/jkuntz/105/9_E6UWWNZB393GQSHUSGO61L9BPJYCSW.png", "image_urls": { "default": "https://storage.googleapis.com/plotly-prod-images/jkuntz/105/2_XTVPHZZLSKLS2FOUIN0HQBD9K2UTIU.png", "block-thumb": "https://storage.googleapis.com/plotly-prod-images/jkuntz/105/8_U0X76TOUQH0L6T8D7OBYI3QIU3UJO0.png", "list-thumb": "https://storage.googleapis.com/plotly-prod-images/jkuntz/105/9_E6UWWNZB393GQSHUSGO61L9BPJYCSW.png" }, "api_urls": { "files": "https://api.plotly.com/v2/files/jkuntz:105", "plots": "https://api.plotly.com/v2/plots/jkuntz:105", "parent": "https://api.plotly.com/v2/folders/home?user=jkuntz" }, "owner": "jkuntz", "parent": -1, "preview": "", "referencers": [], "references": [], "title": "", "views": 1, "web_url": "https://chart-studio.plotly.com/~jkuntz/105/", "world_readable": true, "date_modified": "2024-04-02T20:55:46.073Z", "stars": { "results": [], "count": 0 }, "collaborators": { "results": [], "count": 0 }, "subfolder_count": null, "refresh_interval": null, "organize_view_url": "https://chart-studio.plotly.com/~jkuntz/105/", "current_user_permission": "read", "is_theme": null, "is_template": null, "autosize": true, "caption": "", "figure": { "data": [ { "mode": "lines", "name": "fuzzyMatch Response Time", "type": "scatter", "ysrc": "jkuntz:104:0d097f", "xaxis": "x", "yaxis": "y" }, { "line": { "dash": "dash" }, "mode": "lines", "name": "Average", "type": "scatter", "ysrc": "jkuntz:104:92b7d1", "xaxis": "x", "yaxis": "y" }, { "line": { "dash": "dash" }, "mode": "lines", "name": "95th Percentile", "type": "scatter", "ysrc": "jkuntz:104:a5acd5", "xaxis": "x", "yaxis": "y" }, { "line": { "dash": "dash" }, "mode": "lines", "name": "99th Percentile", "type": "scatter", "ysrc": "jkuntz:104:b0348a", "xaxis": "x", "yaxis": "y" }, { "mode": "lines", "name": "ArnTxTotal Response Time", "type": "scatter", "ysrc": "jkuntz:104:0c1ede", "xaxis": "x2", "yaxis": "y2" }, { "line": { "dash": "dash" }, "mode": "lines", "name": "Average", "type": "scatter", "ysrc": "jkuntz:104:15d0ce", "xaxis": "x2", "yaxis": "y2" }, { "line": { "dash": "dash" }, "mode": "lines", "name": "95th Percentile", "type": "scatter", "ysrc": "jkuntz:104:ebccff", "xaxis": "x2", "yaxis": "y2" }, { "line": { "dash": "dash" }, "mode": "lines", "name": "99th Percentile", "type": "scatter", "ysrc": "jkuntz:104:d44388", "xaxis": "x2", "yaxis": "y2" }, { "mode": "lines", "name": "merchantTxTotal Response Time", "type": "scatter", "ysrc": "jkuntz:104:7959f0", "xaxis": "x3", "yaxis": "y3" }, { "line": { "dash": "dash" }, "mode": "lines", "name": "Average", "type": "scatter", "ysrc": "jkuntz:104:87139e", "xaxis": "x3", "yaxis": "y3" }, { "line": { "dash": "dash" }, "mode": "lines", "name": "95th Percentile", "type": "scatter", "ysrc": "jkuntz:104:25589e", "xaxis": "x3", "yaxis": "y3" }, { "line": { "dash": "dash" }, "mode": "lines", "name": "99th Percentile", "type": "scatter", "ysrc": "jkuntz:104:3c7ce2", "xaxis": "x3", "yaxis": "y3" }, { "mode": "lines", "name": "Q4 Response Time", "type": "scatter", "ysrc": "jkuntz:104:66a906", "xaxis": "x4", "yaxis": "y4" }, { "line": { "dash": "dash" }, "mode": "lines", "name": "Average", "type": "scatter", "ysrc": "jkuntz:104:ac52d1", "xaxis": "x4", "yaxis": "y4" }, { "line": { "dash": "dash" }, "mode": "lines", "name": "95th Percentile", "type": "scatter", "ysrc": "jkuntz:104:88e0e4", "xaxis": "x4", "yaxis": "y4" }, { "line": { "dash": "dash" }, "mode": "lines", "name": "99th Percentile", "type": "scatter", "ysrc": "jkuntz:104:388ae1", "xaxis": "x4", "yaxis": "y4" }, { "mode": "lines", "name": "Q5 Response Time", "type": "scatter", "ysrc": "jkuntz:104:c36a32", "xaxis": "x5", "yaxis": "y5" }, { "line": { "dash": "dash" }, "mode": "lines", "name": "Average", "type": "scatter", "ysrc": "jkuntz:104:c0ccd0", "xaxis": "x5", "yaxis": "y5" }, { "line": { "dash": "dash" }, "mode": "lines", "name": "95th Percentile", "type": "scatter", "ysrc": "jkuntz:104:179591", "xaxis": "x5", "yaxis": "y5" }, { "line": { "dash": "dash" }, "mode": "lines", "name": "99th Percentile", "type": "scatter", "ysrc": "jkuntz:104:a0d56e", "xaxis": "x5", "yaxis": "y5" }, { "mode": "lines", "name": "Q6 Response Time", "type": "scatter", "ysrc": "jkuntz:104:204fdb", "xaxis": "x6", "yaxis": "y6" }, { "line": { "dash": "dash" }, "mode": "lines", "name": "Average", "type": "scatter", "ysrc": "jkuntz:104:0b6581", "xaxis": "x6", "yaxis": "y6" }, { "line": { "dash": "dash" }, "mode": "lines", "name": "95th Percentile", "type": "scatter", "ysrc": "jkuntz:104:7d5a05", "xaxis": "x6", "yaxis": "y6" }, { "line": { "dash": "dash" }, "mode": "lines", "name": "99th Percentile", "type": "scatter", "ysrc": "jkuntz:104:2b80f3", "xaxis": "x6", "yaxis": "y6" }, { "mode": "lines", "name": "Q7 Response Time", "type": "scatter", "ysrc": "jkuntz:104:369977", "xaxis": "x7", "yaxis": "y7" }, { "line": { "dash": "dash" }, "mode": "lines", "name": "Average", "type": "scatter", "ysrc": "jkuntz:104:c7c033", "xaxis": "x7", "yaxis": "y7" }, { "line": { "dash": "dash" }, "mode": "lines", "name": "95th Percentile", "type": "scatter", "ysrc": "jkuntz:104:ebb367", "xaxis": "x7", "yaxis": "y7" }, { "line": { "dash": "dash" }, "mode": "lines", "name": "99th Percentile", "type": "scatter", "ysrc": "jkuntz:104:389b0e", "xaxis": "x7", "yaxis": "y7" }, { "mode": "lines", "name": "Q8 Response Time", "type": "scatter", "ysrc": "jkuntz:104:3ba74c", "xaxis": "x8", "yaxis": "y8" }, { "line": { "dash": "dash" }, "mode": "lines", "name": "Average", "type": "scatter", "ysrc": "jkuntz:104:db5a24", "xaxis": "x8", "yaxis": "y8" }, { "line": { "dash": "dash" }, "mode": "lines", "name": "95th Percentile", "type": "scatter", "ysrc": "jkuntz:104:201d76", "xaxis": "x8", "yaxis": "y8" }, { "line": { "dash": "dash" }, "mode": "lines", "name": "99th Percentile", "type": "scatter", "ysrc": "jkuntz:104:1ea349", "xaxis": "x8", "yaxis": "y8" }, { "mode": "lines", "name": "Q9 Response Time", "type": "scatter", "ysrc": "jkuntz:104:b1273c", "xaxis": "x9", "yaxis": "y9" }, { "line": { "dash": "dash" }, "mode": "lines", "name": "Average", "type": "scatter", "ysrc": "jkuntz:104:a5a7f1", "xaxis": "x9", "yaxis": "y9" }, { "line": { "dash": "dash" }, "mode": "lines", "name": "95th Percentile", "type": "scatter", "ysrc": "jkuntz:104:8f6e8d", "xaxis": "x9", "yaxis": "y9" }, { "line": { "dash": "dash" }, "mode": "lines", "name": "99th Percentile", "type": "scatter", "ysrc": "jkuntz:104:84bca7", "xaxis": "x9", "yaxis": "y9" }, { "mode": "lines", "name": "Q10 Response Time", "type": "scatter", "ysrc": "jkuntz:104:5f700f", "xaxis": "x10", "yaxis": "y10" }, { "line": { "dash": "dash" }, "mode": "lines", "name": "Average", "type": "scatter", "ysrc": "jkuntz:104:a9e3f4", "xaxis": "x10", "yaxis": "y10" }, { "line": { "dash": "dash" }, "mode": "lines", "name": "95th Percentile", "type": "scatter", "ysrc": "jkuntz:104:0b9b8f", "xaxis": "x10", "yaxis": "y10" }, { "line": { "dash": "dash" }, "mode": "lines", "name": "99th Percentile", "type": "scatter", "ysrc": "jkuntz:104:4fdbf4", "xaxis": "x10", "yaxis": "y10" }, { "mode": "lines", "name": "Q11 Response Time", "type": "scatter", "ysrc": "jkuntz:104:d500a1", "xaxis": "x11", "yaxis": "y11" }, { "line": { "dash": "dash" }, "mode": "lines", "name": "Average", "type": "scatter", "ysrc": "jkuntz:104:5f0f97", "xaxis": "x11", "yaxis": "y11" }, { "line": { "dash": "dash" }, "mode": "lines", "name": "95th Percentile", "type": "scatter", "ysrc": "jkuntz:104:9a3704", "xaxis": "x11", "yaxis": "y11" }, { "line": { "dash": "dash" }, "mode": "lines", "name": "99th Percentile", "type": "scatter", "ysrc": "jkuntz:104:966611", "xaxis": "x11", "yaxis": "y11" } ], "layout": { "title": { "text": "Query Execution Times by Query" }, "xaxis": { "anchor": "y", "domain": [ 0.0, 0.2888888888888889 ] }, "yaxis": { "anchor": "x", "domain": [ 0.84375, 1.0 ] }, "height": 850, "xaxis2": { "anchor": "y2", "domain": [ 0.35555555555555557, 0.6444444444444445 ] }, "xaxis3": { "anchor": "y3", "domain": [ 0.7111111111111111, 1.0 ] }, "xaxis4": { "anchor": "y4", "domain": [ 0.0, 0.2888888888888889 ] }, "xaxis5": { "anchor": "y5", "domain": [ 0.35555555555555557, 0.6444444444444445 ] }, "xaxis6": { "anchor": "y6", "domain": [ 0.7111111111111111, 1.0 ] }, "xaxis7": { "anchor": "y7", "domain": [ 0.0, 0.2888888888888889 ] }, "xaxis8": { "anchor": "y8", "domain": [ 0.35555555555555557, 0.6444444444444445 ] }, "xaxis9": { "anchor": "y9", "domain": [ 0.7111111111111111, 1.0 ] }, "yaxis2": { "anchor": "x2", "domain": [ 0.84375, 1.0 ] }, "yaxis3": { "anchor": "x3", "domain": [ 0.84375, 1.0 ] }, "yaxis4": { "anchor": "x4", "domain": [ 0.5625, 0.71875 ] }, "yaxis5": { "anchor": "x5", "domain": [ 0.5625, 0.71875 ] }, "yaxis6": { "anchor": "x6", "domain": [ 0.5625, 0.71875 ] }, "yaxis7": { "anchor": "x7", "domain": [ 0.28125, 0.4375 ] }, "yaxis8": { "anchor": "x8", "domain": [ 0.28125, 0.4375 ] }, "yaxis9": { "anchor": "x9", "domain": [ 0.28125, 0.4375 ] }, "xaxis10": { "anchor": "y10", "domain": [ 0.0, 0.2888888888888889 ] }, "xaxis11": { "anchor": "y11", "domain": [ 0.35555555555555557, 0.6444444444444445 ] }, "xaxis12": { "anchor": "y12", "domain": [ 0.7111111111111111, 1.0 ] }, "yaxis10": { "anchor": "x10", "domain": [ 0.0, 0.15625 ] }, "yaxis11": { "anchor": "x11", "domain": [ 0.0, 0.15625 ] }, "yaxis12": { "anchor": "x12", "domain": [ 0.0, 0.15625 ] }, "template": { "data": { "bar": [ { "type": "bar", "marker": { "line": { "color": "white", "width": 0.5 }, "pattern": { "size": 10, "fillmode": "overlay", "solidity": 0.2 } }, "error_x": { "color": "#2a3f5f" }, "error_y": { "color": "#2a3f5f" } } ], "pie": [ { "type": "pie", "automargin": true } ], "table": [ { "type": "table", "cells": { "fill": { "color": "#EBF0F8" }, "line": { "color": "white" } }, "header": { "fill": { "color": "#C8D4E3" }, "line": { "color": "white" } } } ], "carpet": [ { "type": "carpet", "aaxis": { "gridcolor": "#C8D4E3", "linecolor": "#C8D4E3", "endlinecolor": "#2a3f5f", "minorgridcolor": "#C8D4E3", "startlinecolor": "#2a3f5f" }, "baxis": { "gridcolor": "#C8D4E3", "linecolor": "#C8D4E3", "endlinecolor": "#2a3f5f", "minorgridcolor": "#C8D4E3", "startlinecolor": "#2a3f5f" } } ], "mesh3d": [ { "type": "mesh3d", "colorbar": { "ticks": "", "outlinewidth": 0 } } ], "contour": [ { "type": "contour", "colorbar": { "ticks": "", "outlinewidth": 0 }, "colorscale": [ [ 0.0, "#0d0887" ], [ 0.1111111111111111, "#46039f" ], [ 0.2222222222222222, "#7201a8" ], [ 0.3333333333333333, "#9c179e" ], [ 0.4444444444444444, "#bd3786" ], [ 0.5555555555555556, "#d8576b" ], [ 0.6666666666666666, "#ed7953" ], [ 0.7777777777777778, "#fb9f3a" ], [ 0.8888888888888888, "#fdca26" ], [ 1.0, "#f0f921" ] ] } ], "heatmap": [ { "type": "heatmap", "colorbar": { "ticks": "", "outlinewidth": 0 }, "colorscale": [ [ 0.0, "#0d0887" ], [ 0.1111111111111111, "#46039f" ], [ 0.2222222222222222, "#7201a8" ], [ 0.3333333333333333, "#9c179e" ], [ 0.4444444444444444, "#bd3786" ], [ 0.5555555555555556, "#d8576b" ], [ 0.6666666666666666, "#ed7953" ], [ 0.7777777777777778, "#fb9f3a" ], [ 0.8888888888888888, "#fdca26" ], [ 1.0, "#f0f921" ] ] } ], "scatter": [ { "type": "scatter", "fillpattern": { "size": 10, "fillmode": "overlay", "solidity": 0.2 } } ], "surface": [ { "type": "surface", "colorbar": { "ticks": "", "outlinewidth": 0 }, "colorscale": [ [ 0.0, "#0d0887" ], [ 0.1111111111111111, "#46039f" ], [ 0.2222222222222222, "#7201a8" ], [ 0.3333333333333333, "#9c179e" ], [ 0.4444444444444444, "#bd3786" ], [ 0.5555555555555556, "#d8576b" ], [ 0.6666666666666666, "#ed7953" ], [ 0.7777777777777778, "#fb9f3a" ], [ 0.8888888888888888, "#fdca26" ], [ 1.0, "#f0f921" ] ] } ], "barpolar": [ { "type": "barpolar", "marker": { "line": { "color": "white", "width": 0.5 }, "pattern": { "size": 10, "fillmode": "overlay", "solidity": 0.2 } } } ], "heatmapgl": [ { "type": "heatmapgl", "colorbar": { "ticks": "", "outlinewidth": 0 }, "colorscale": [ [ 0.0, "#0d0887" ], [ 0.1111111111111111, "#46039f" ], [ 0.2222222222222222, "#7201a8" ], [ 0.3333333333333333, "#9c179e" ], [ 0.4444444444444444, "#bd3786" ], [ 0.5555555555555556, "#d8576b" ], [ 0.6666666666666666, "#ed7953" ], [ 0.7777777777777778, "#fb9f3a" ], [ 0.8888888888888888, "#fdca26" ], [ 1.0, "#f0f921" ] ] } ], "histogram": [ { "type": "histogram", "marker": { "pattern": { "size": 10, "fillmode": "overlay", "solidity": 0.2 } } } ], "parcoords": [ { "line": { "colorbar": { "ticks": "", "outlinewidth": 0 } }, "type": "parcoords" } ], "scatter3d": [ { "line": { "colorbar": { "ticks": "", "outlinewidth": 0 } }, "type": "scatter3d", "marker": { "colorbar": { "ticks": "", "outlinewidth": 0 } } } ], "scattergl": [ { "type": "scattergl", "marker": { "colorbar": { "ticks": "", "outlinewidth": 0 } } } ], "choropleth": [ { "type": "choropleth", "colorbar": { "ticks": "", "outlinewidth": 0 } } ], "scattergeo": [ { "type": "scattergeo", "marker": { "colorbar": { "ticks": "", "outlinewidth": 0 } } } ], "histogram2d": [ { "type": "histogram2d", "colorbar": { "ticks": "", "outlinewidth": 0 }, "colorscale": [ [ 0.0, "#0d0887" ], [ 0.1111111111111111, "#46039f" ], [ 0.2222222222222222, "#7201a8" ], [ 0.3333333333333333, "#9c179e" ], [ 0.4444444444444444, "#bd3786" ], [ 0.5555555555555556, "#d8576b" ], [ 0.6666666666666666, "#ed7953" ], [ 0.7777777777777778, "#fb9f3a" ], [ 0.8888888888888888, "#fdca26" ], [ 1.0, "#f0f921" ] ] } ], "scatterpolar": [ { "type": "scatterpolar", "marker": { "colorbar": { "ticks": "", "outlinewidth": 0 } } } ], "contourcarpet": [ { "type": "contourcarpet", "colorbar": { "ticks": "", "outlinewidth": 0 } } ], "scattercarpet": [ { "type": "scattercarpet", "marker": { "colorbar": { "ticks": "", "outlinewidth": 0 } } } ], "scattermapbox": [ { "type": "scattermapbox", "marker": { "colorbar": { "ticks": "", "outlinewidth": 0 } } } ], "scatterpolargl": [ { "type": "scatterpolargl", "marker": { "colorbar": { "ticks": "", "outlinewidth": 0 } } } ], "scatterternary": [ { "type": "scatterternary", "marker": { "colorbar": { "ticks": "", "outlinewidth": 0 } } } ], "histogram2dcontour": [ { "type": "histogram2dcontour", "colorbar": { "ticks": "", "outlinewidth": 0 }, "colorscale": [ [ 0.0, "#0d0887" ], [ 0.1111111111111111, "#46039f" ], [ 0.2222222222222222, "#7201a8" ], [ 0.3333333333333333, "#9c179e" ], [ 0.4444444444444444, "#bd3786" ], [ 0.5555555555555556, "#d8576b" ], [ 0.6666666666666666, "#ed7953" ], [ 0.7777777777777778, "#fb9f3a" ], [ 0.8888888888888888, "#fdca26" ], [ 1.0, "#f0f921" ] ] } ] }, "layout": { "geo": { "bgcolor": "white", "showland": true, "lakecolor": "white", "landcolor": "white", "showlakes": true, "subunitcolor": "#C8D4E3" }, "font": { "color": "#2a3f5f" }, "polar": { "bgcolor": "white", "radialaxis": { "ticks": "", "gridcolor": "#EBF0F8", "linecolor": "#EBF0F8" }, "angularaxis": { "ticks": "", "gridcolor": "#EBF0F8", "linecolor": "#EBF0F8" } }, "scene": { "xaxis": { "ticks": "", "gridcolor": "#DFE8F3", "gridwidth": 2, "linecolor": "#EBF0F8", "zerolinecolor": "#EBF0F8", "showbackground": true, "backgroundcolor": "white" }, "yaxis": { "ticks": "", "gridcolor": "#DFE8F3", "gridwidth": 2, "linecolor": "#EBF0F8", "zerolinecolor": "#EBF0F8", "showbackground": true, "backgroundcolor": "white" }, "zaxis": { "ticks": "", "gridcolor": "#DFE8F3", "gridwidth": 2, "linecolor": "#EBF0F8", "zerolinecolor": "#EBF0F8", "showbackground": true, "backgroundcolor": "white" } }, "title": { "x": 0.05 }, "xaxis": { "ticks": "", "title": { "standoff": 15 }, "gridcolor": "#EBF0F8", "linecolor": "#EBF0F8", "automargin": true, "zerolinecolor": "#EBF0F8", "zerolinewidth": 2 }, "yaxis": { "ticks": "", "title": { "standoff": 15 }, "gridcolor": "#EBF0F8", "linecolor": "#EBF0F8", "automargin": true, "zerolinecolor": "#EBF0F8", "zerolinewidth": 2 }, "mapbox": { "style": "light" }, "ternary": { "aaxis": { "ticks": "", "gridcolor": "#DFE8F3", "linecolor": "#A2B1C6" }, "baxis": { "ticks": "", "gridcolor": "#DFE8F3", "linecolor": "#A2B1C6" }, "caxis": { "ticks": "", "gridcolor": "#DFE8F3", "linecolor": "#A2B1C6" }, "bgcolor": "white" }, "colorway": [ "#636efa", "#EF553B", "#00cc96", "#ab63fa", "#FFA15A", "#19d3f3", "#FF6692", "#B6E880", "#FF97FF", "#FECB52" ], "coloraxis": { "colorbar": { "ticks": "", "outlinewidth": 0 } }, "hovermode": "closest", "colorscale": { "diverging": [ [ 0, "#8e0152" ], [ 0.1, "#c51b7d" ], [ 0.2, "#de77ae" ], [ 0.3, "#f1b6da" ], [ 0.4, "#fde0ef" ], [ 0.5, "#f7f7f7" ], [ 0.6, "#e6f5d0" ], [ 0.7, "#b8e186" ], [ 0.8, "#7fbc41" ], [ 0.9, "#4d9221" ], [ 1, "#276419" ] ], "sequential": [ [ 0.0, "#0d0887" ], [ 0.1111111111111111, "#46039f" ], [ 0.2222222222222222, "#7201a8" ], [ 0.3333333333333333, "#9c179e" ], [ 0.4444444444444444, "#bd3786" ], [ 0.5555555555555556, "#d8576b" ], [ 0.6666666666666666, "#ed7953" ], [ 0.7777777777777778, "#fb9f3a" ], [ 0.8888888888888888, "#fdca26" ], [ 1.0, "#f0f921" ] ], "sequentialminus": [ [ 0.0, "#0d0887" ], [ 0.1111111111111111, "#46039f" ], [ 0.2222222222222222, "#7201a8" ], [ 0.3333333333333333, "#9c179e" ], [ 0.4444444444444444, "#bd3786" ], [ 0.5555555555555556, "#d8576b" ], [ 0.6666666666666666, "#ed7953" ], [ 0.7777777777777778, "#fb9f3a" ], [ 0.8888888888888888, "#fdca26" ], [ 1.0, "#f0f921" ] ] }, "hoverlabel": { "align": "left" }, "plot_bgcolor": "white", "paper_bgcolor": "white", "shapedefaults": { "line": { "color": "#2a3f5f" } }, "autotypenumbers": "strict", "annotationdefaults": { "arrowhead": 0, "arrowcolor": "#2a3f5f", "arrowwidth": 1 } } }, "annotations": [ { "x": 0.14444444444444446, "y": 1.0, "font": { "size": 16 }, "text": "fuzzyMatch", "xref": "paper", "yref": "paper", "xanchor": "center", "yanchor": "bottom", "showarrow": false }, { "x": 0.5, "y": 1.0, "font": { "size": 16 }, "text": "ArnTxTotal", "xref": "paper", "yref": "paper", "xanchor": "center", "yanchor": "bottom", "showarrow": false }, { "x": 0.8555555555555556, "y": 1.0, "font": { "size": 16 }, "text": "merchantTxTotal", "xref": "paper", "yref": "paper", "xanchor": "center", "yanchor": "bottom", "showarrow": false }, { "x": 0.14444444444444446, "y": 0.71875, "font": { "size": 16 }, "text": "Q4", "xref": "paper", "yref": "paper", "xanchor": "center", "yanchor": "bottom", "showarrow": false }, { "x": 0.5, "y": 0.71875, "font": { "size": 16 }, "text": "Q5", "xref": "paper", "yref": "paper", "xanchor": "center", "yanchor": "bottom", "showarrow": false }, { "x": 0.8555555555555556, "y": 0.71875, "font": { "size": 16 }, "text": "Q6", "xref": "paper", "yref": "paper", "xanchor": "center", "yanchor": "bottom", "showarrow": false }, { "x": 0.14444444444444446, "y": 0.4375, "font": { "size": 16 }, "text": "Q7", "xref": "paper", "yref": "paper", "xanchor": "center", "yanchor": "bottom", "showarrow": false }, { "x": 0.5, "y": 0.4375, "font": { "size": 16 }, "text": "Q8", "xref": "paper", "yref": "paper", "xanchor": "center", "yanchor": "bottom", "showarrow": false }, { "x": 0.8555555555555556, "y": 0.4375, "font": { "size": 16 }, "text": "Q9", "xref": "paper", "yref": "paper", "xanchor": "center", "yanchor": "bottom", "showarrow": false }, { "x": 0.14444444444444446, "y": 0.15625, "font": { "size": 16 }, "text": "Q10", "xref": "paper", "yref": "paper", "xanchor": "center", "yanchor": "bottom", "showarrow": false }, { "x": 0.5, "y": 0.15625, "font": { "size": 16 }, "text": "Q11", "xref": "paper", "yref": "paper", "xanchor": "center", "yanchor": "bottom", "showarrow": false } ] } }, "height": 850, "width": null, "user": { "profile_url": "https://chart-studio.plotly.com/~jkuntz", "avatar_url": "https://storage.googleapis.com/plotly-prod-profiles/34.jpg", "background_url": "https://storage.googleapis.com/plotly-prod-profiles/bg-11.jpg", "bio": "", "nickname": "", "website": "", "stream_tokens": null, "feature_set_id": null, "csrf_token": null, "date_joined": "2024-04-02 20:04:41", "mapbox_access_tokens": null, "has_password": null, "username": "jkuntz", "email": null, "is_active": null, "readonly": null, "is_dash_creator": null, "dash_created_count": null, "is_chart_creator": null, "charts_created_count": null } }, { "creation_time": "2024-04-02T20:55:42.812321Z", "comments": { "results": [], "count": 0 }, "parented": true, "embed_url": "https://chart-studio.plotly.com/~jkuntz/103.embed", "fid": "jkuntz:103", "filename": "summary_metrics_for_each_query_20240402205539", "filetype": "plot", "img_url": "https://storage.googleapis.com/plotly-prod-images/jkuntz/103/9_IES83FF7X1AKZWQ83GS89Q11FUVPLJ.png", "image_urls": { "default": "https://storage.googleapis.com/plotly-prod-images/jkuntz/103/2_L5BHVKJKFF0M4UPUBCINF2YWEDGISH.png", "block-thumb": "https://storage.googleapis.com/plotly-prod-images/jkuntz/103/8_QI0ZVN19AVZ6E5ZUV4FUHS15AUQ4U9.png", "list-thumb": "https://storage.googleapis.com/plotly-prod-images/jkuntz/103/9_IES83FF7X1AKZWQ83GS89Q11FUVPLJ.png" }, "api_urls": { "files": "https://api.plotly.com/v2/files/jkuntz:103", "plots": "https://api.plotly.com/v2/plots/jkuntz:103", "parent": "https://api.plotly.com/v2/folders/home?user=jkuntz" }, "owner": "jkuntz", "parent": -1, "preview": "", "referencers": [], "references": [], "title": "", "views": 1, "web_url": "https://chart-studio.plotly.com/~jkuntz/103/", "world_readable": true, "date_modified": "2024-04-02T20:55:42.821Z", "stars": { "results": [], "count": 0 }, "collaborators": { "results": [], "count": 0 }, "subfolder_count": null, "refresh_interval": null, "organize_view_url": "https://chart-studio.plotly.com/~jkuntz/103/", "current_user_permission": "read", "is_theme": null, "is_template": null, "autosize": true, "caption": "", "figure": { "data": [ { "name": "Average", "type": "bar", "xsrc": "jkuntz:102:89d1dd", "ysrc": "jkuntz:102:73b902" }, { "name": "95th Percentile", "type": "bar", "xsrc": "jkuntz:102:308232", "ysrc": "jkuntz:102:cc8cb4" }, { "name": "99th Percentile", "type": "bar", "xsrc": "jkuntz:102:c05803", "ysrc": "jkuntz:102:8add5a" } ], "layout": { "title": { "text": "Summary Metrics for Each Query" }, "xaxis": { "title": { "text": "Query" } }, "yaxis": { "title": { "text": "Response Time" } }, "height": 500, "barmode": "group", "template": { "data": { "bar": [ { "type": "bar", "marker": { "line": { "color": "white", "width": 0.5 }, "pattern": { "size": 10, "fillmode": "overlay", "solidity": 0.2 } }, "error_x": { "color": "#2a3f5f" }, "error_y": { "color": "#2a3f5f" } } ], "pie": [ { "type": "pie", "automargin": true } ], "table": [ { "type": "table", "cells": { "fill": { "color": "#EBF0F8" }, "line": { "color": "white" } }, "header": { "fill": { "color": "#C8D4E3" }, "line": { "color": "white" } } } ], "carpet": [ { "type": "carpet", "aaxis": { "gridcolor": "#C8D4E3", "linecolor": "#C8D4E3", "endlinecolor": "#2a3f5f", "minorgridcolor": "#C8D4E3", "startlinecolor": "#2a3f5f" }, "baxis": { "gridcolor": "#C8D4E3", "linecolor": "#C8D4E3", "endlinecolor": "#2a3f5f", "minorgridcolor": "#C8D4E3", "startlinecolor": "#2a3f5f" } } ], "mesh3d": [ { "type": "mesh3d", "colorbar": { "ticks": "", "outlinewidth": 0 } } ], "contour": [ { "type": "contour", "colorbar": { "ticks": "", "outlinewidth": 0 }, "colorscale": [ [ 0.0, "#0d0887" ], [ 0.1111111111111111, "#46039f" ], [ 0.2222222222222222, "#7201a8" ], [ 0.3333333333333333, "#9c179e" ], [ 0.4444444444444444, "#bd3786" ], [ 0.5555555555555556, "#d8576b" ], [ 0.6666666666666666, "#ed7953" ], [ 0.7777777777777778, "#fb9f3a" ], [ 0.8888888888888888, "#fdca26" ], [ 1.0, "#f0f921" ] ] } ], "heatmap": [ { "type": "heatmap", "colorbar": { "ticks": "", "outlinewidth": 0 }, "colorscale": [ [ 0.0, "#0d0887" ], [ 0.1111111111111111, "#46039f" ], [ 0.2222222222222222, "#7201a8" ], [ 0.3333333333333333, "#9c179e" ], [ 0.4444444444444444, "#bd3786" ], [ 0.5555555555555556, "#d8576b" ], [ 0.6666666666666666, "#ed7953" ], [ 0.7777777777777778, "#fb9f3a" ], [ 0.8888888888888888, "#fdca26" ], [ 1.0, "#f0f921" ] ] } ], "scatter": [ { "type": "scatter", "fillpattern": { "size": 10, "fillmode": "overlay", "solidity": 0.2 } } ], "surface": [ { "type": "surface", "colorbar": { "ticks": "", "outlinewidth": 0 }, "colorscale": [ [ 0.0, "#0d0887" ], [ 0.1111111111111111, "#46039f" ], [ 0.2222222222222222, "#7201a8" ], [ 0.3333333333333333, "#9c179e" ], [ 0.4444444444444444, "#bd3786" ], [ 0.5555555555555556, "#d8576b" ], [ 0.6666666666666666, "#ed7953" ], [ 0.7777777777777778, "#fb9f3a" ], [ 0.8888888888888888, "#fdca26" ], [ 1.0, "#f0f921" ] ] } ], "barpolar": [ { "type": "barpolar", "marker": { "line": { "color": "white", "width": 0.5 }, "pattern": { "size": 10, "fillmode": "overlay", "solidity": 0.2 } } } ], "heatmapgl": [ { "type": "heatmapgl", "colorbar": { "ticks": "", "outlinewidth": 0 }, "colorscale": [ [ 0.0, "#0d0887" ], [ 0.1111111111111111, "#46039f" ], [ 0.2222222222222222, "#7201a8" ], [ 0.3333333333333333, "#9c179e" ], [ 0.4444444444444444, "#bd3786" ], [ 0.5555555555555556, "#d8576b" ], [ 0.6666666666666666, "#ed7953" ], [ 0.7777777777777778, "#fb9f3a" ], [ 0.8888888888888888, "#fdca26" ], [ 1.0, "#f0f921" ] ] } ], "histogram": [ { "type": "histogram", "marker": { "pattern": { "size": 10, "fillmode": "overlay", "solidity": 0.2 } } } ], "parcoords": [ { "line": { "colorbar": { "ticks": "", "outlinewidth": 0 } }, "type": "parcoords" } ], "scatter3d": [ { "line": { "colorbar": { "ticks": "", "outlinewidth": 0 } }, "type": "scatter3d", "marker": { "colorbar": { "ticks": "", "outlinewidth": 0 } } } ], "scattergl": [ { "type": "scattergl", "marker": { "colorbar": { "ticks": "", "outlinewidth": 0 } } } ], "choropleth": [ { "type": "choropleth", "colorbar": { "ticks": "", "outlinewidth": 0 } } ], "scattergeo": [ { "type": "scattergeo", "marker": { "colorbar": { "ticks": "", "outlinewidth": 0 } } } ], "histogram2d": [ { "type": "histogram2d", "colorbar": { "ticks": "", "outlinewidth": 0 }, "colorscale": [ [ 0.0, "#0d0887" ], [ 0.1111111111111111, "#46039f" ], [ 0.2222222222222222, "#7201a8" ], [ 0.3333333333333333, "#9c179e" ], [ 0.4444444444444444, "#bd3786" ], [ 0.5555555555555556, "#d8576b" ], [ 0.6666666666666666, "#ed7953" ], [ 0.7777777777777778, "#fb9f3a" ], [ 0.8888888888888888, "#fdca26" ], [ 1.0, "#f0f921" ] ] } ], "scatterpolar": [ { "type": "scatterpolar", "marker": { "colorbar": { "ticks": "", "outlinewidth": 0 } } } ], "contourcarpet": [ { "type": "contourcarpet", "colorbar": { "ticks": "", "outlinewidth": 0 } } ], "scattercarpet": [ { "type": "scattercarpet", "marker": { "colorbar": { "ticks": "", "outlinewidth": 0 } } } ], "scattermapbox": [ { "type": "scattermapbox", "marker": { "colorbar": { "ticks": "", "outlinewidth": 0 } } } ], "scatterpolargl": [ { "type": "scatterpolargl", "marker": { "colorbar": { "ticks": "", "outlinewidth": 0 } } } ], "scatterternary": [ { "type": "scatterternary", "marker": { "colorbar": { "ticks": "", "outlinewidth": 0 } } } ], "histogram2dcontour": [ { "type": "histogram2dcontour", "colorbar": { "ticks": "", "outlinewidth": 0 }, "colorscale": [ [ 0.0, "#0d0887" ], [ 0.1111111111111111, "#46039f" ], [ 0.2222222222222222, "#7201a8" ], [ 0.3333333333333333, "#9c179e" ], [ 0.4444444444444444, "#bd3786" ], [ 0.5555555555555556, "#d8576b" ], [ 0.6666666666666666, "#ed7953" ], [ 0.7777777777777778, "#fb9f3a" ], [ 0.8888888888888888, "#fdca26" ], [ 1.0, "#f0f921" ] ] } ] }, "layout": { "geo": { "bgcolor": "white", "showland": true, "lakecolor": "white", "landcolor": "white", "showlakes": true, "subunitcolor": "#C8D4E3" }, "font": { "color": "#2a3f5f" }, "polar": { "bgcolor": "white", "radialaxis": { "ticks": "", "gridcolor": "#EBF0F8", "linecolor": "#EBF0F8" }, "angularaxis": { "ticks": "", "gridcolor": "#EBF0F8", "linecolor": "#EBF0F8" } }, "scene": { "xaxis": { "ticks": "", "gridcolor": "#DFE8F3", "gridwidth": 2, "linecolor": "#EBF0F8", "zerolinecolor": "#EBF0F8", "showbackground": true, "backgroundcolor": "white" }, "yaxis": { "ticks": "", "gridcolor": "#DFE8F3", "gridwidth": 2, "linecolor": "#EBF0F8", "zerolinecolor": "#EBF0F8", "showbackground": true, "backgroundcolor": "white" }, "zaxis": { "ticks": "", "gridcolor": "#DFE8F3", "gridwidth": 2, "linecolor": "#EBF0F8", "zerolinecolor": "#EBF0F8", "showbackground": true, "backgroundcolor": "white" } }, "title": { "x": 0.05 }, "xaxis": { "ticks": "", "title": { "standoff": 15 }, "gridcolor": "#EBF0F8", "linecolor": "#EBF0F8", "automargin": true, "zerolinecolor": "#EBF0F8", "zerolinewidth": 2 }, "yaxis": { "ticks": "", "title": { "standoff": 15 }, "gridcolor": "#EBF0F8", "linecolor": "#EBF0F8", "automargin": true, "zerolinecolor": "#EBF0F8", "zerolinewidth": 2 }, "mapbox": { "style": "light" }, "ternary": { "aaxis": { "ticks": "", "gridcolor": "#DFE8F3", "linecolor": "#A2B1C6" }, "baxis": { "ticks": "", "gridcolor": "#DFE8F3", "linecolor": "#A2B1C6" }, "caxis": { "ticks": "", "gridcolor": "#DFE8F3", "linecolor": "#A2B1C6" }, "bgcolor": "white" }, "colorway": [ "#636efa", "#EF553B", "#00cc96", "#ab63fa", "#FFA15A", "#19d3f3", "#FF6692", "#B6E880", "#FF97FF", "#FECB52" ], "coloraxis": { "colorbar": { "ticks": "", "outlinewidth": 0 } }, "hovermode": "closest", "colorscale": { "diverging": [ [ 0, "#8e0152" ], [ 0.1, "#c51b7d" ], [ 0.2, "#de77ae" ], [ 0.3, "#f1b6da" ], [ 0.4, "#fde0ef" ], [ 0.5, "#f7f7f7" ], [ 0.6, "#e6f5d0" ], [ 0.7, "#b8e186" ], [ 0.8, "#7fbc41" ], [ 0.9, "#4d9221" ], [ 1, "#276419" ] ], "sequential": [ [ 0.0, "#0d0887" ], [ 0.1111111111111111, "#46039f" ], [ 0.2222222222222222, "#7201a8" ], [ 0.3333333333333333, "#9c179e" ], [ 0.4444444444444444, "#bd3786" ], [ 0.5555555555555556, "#d8576b" ], [ 0.6666666666666666, "#ed7953" ], [ 0.7777777777777778, "#fb9f3a" ], [ 0.8888888888888888, "#fdca26" ], [ 1.0, "#f0f921" ] ], "sequentialminus": [ [ 0.0, "#0d0887" ], [ 0.1111111111111111, "#46039f" ], [ 0.2222222222222222, "#7201a8" ], [ 0.3333333333333333, "#9c179e" ], [ 0.4444444444444444, "#bd3786" ], [ 0.5555555555555556, "#d8576b" ], [ 0.6666666666666666, "#ed7953" ], [ 0.7777777777777778, "#fb9f3a" ], [ 0.8888888888888888, "#fdca26" ], [ 1.0, "#f0f921" ] ] }, "hoverlabel": { "align": "left" }, "plot_bgcolor": "white", "paper_bgcolor": "white", "shapedefaults": { "line": { "color": "#2a3f5f" } }, "autotypenumbers": "strict", "annotationdefaults": { "arrowhead": 0, "arrowcolor": "#2a3f5f", "arrowwidth": 1 } } } } }, "height": 500, "width": null, "user": { "profile_url": "https://chart-studio.plotly.com/~jkuntz", "avatar_url": "https://storage.googleapis.com/plotly-prod-profiles/34.jpg", "background_url": "https://storage.googleapis.com/plotly-prod-profiles/bg-11.jpg", "bio": "", "nickname": "", "website": "", "stream_tokens": null, "feature_set_id": null, "csrf_token": null, "date_joined": "2024-04-02 20:04:41", "mapbox_access_tokens": null, "has_password": null, "username": "jkuntz", "email": null, "is_active": null, "readonly": null, "is_dash_creator": null, "dash_created_count": null, "is_chart_creator": null, "charts_created_count": null } }, { "creation_time": "2024-04-02T20:55:39.841770Z", "comments": { "results": [], "count": 0 }, "parented": true, "embed_url": "https://chart-studio.plotly.com/~jkuntz/101.embed", "fid": "jkuntz:101", "filename": "write_operation_execution_times_by_query_20240402205536", "filetype": "plot", "img_url": "https://storage.googleapis.com/plotly-prod-images/jkuntz/101/9_L8X4D3Q6DG0W1EJABBC8YEK92K2NJF.png", "image_urls": { "default": "https://storage.googleapis.com/plotly-prod-images/jkuntz/101/2_6S8SZT5GMK3YSQEFGZ7FDM8BOU812K.png", "block-thumb": "https://storage.googleapis.com/plotly-prod-images/jkuntz/101/8_0F7G07106A018V3Q14VWIK8TVUMVSD.png", "list-thumb": "https://storage.googleapis.com/plotly-prod-images/jkuntz/101/9_L8X4D3Q6DG0W1EJABBC8YEK92K2NJF.png" }, "api_urls": { "files": "https://api.plotly.com/v2/files/jkuntz:101", "plots": "https://api.plotly.com/v2/plots/jkuntz:101", "parent": "https://api.plotly.com/v2/folders/home?user=jkuntz" }, "owner": "jkuntz", "parent": -1, "preview": "", "referencers": [], "references": [], "title": "", "views": 1, "web_url": "https://chart-studio.plotly.com/~jkuntz/101/", "world_readable": true, "date_modified": "2024-04-02T20:55:39.850Z", "stars": { "results": [], "count": 0 }, "collaborators": { "results": [], "count": 0 }, "subfolder_count": null, "refresh_interval": null, "organize_view_url": "https://chart-studio.plotly.com/~jkuntz/101/", "current_user_permission": "read", "is_theme": null, "is_template": null, "autosize": true, "caption": "", "figure": { "data": [ { "mode": "lines", "name": "CDCardPosted Write Time", "type": "scatter", "ysrc": "jkuntz:100:5075a1", "xaxis": "x", "yaxis": "y" }, { "mode": "lines", "name": "CDCardAuth Write Time", "type": "scatter", "ysrc": "jkuntz:100:f811e0", "xaxis": "x2", "yaxis": "y2" }, { "mode": "lines", "name": "CDEnrich Write Time", "type": "scatter", "ysrc": "jkuntz:100:35cf45", "xaxis": "x3", "yaxis": "y3" } ], "layout": { "title": { "text": "Write Operation Execution Times by Query" }, "xaxis": { "anchor": "y", "domain": [ 0.0, 0.2888888888888889 ] }, "yaxis": { "anchor": "x", "domain": [ 0.0, 1.0 ] }, "height": 400, "xaxis2": { "anchor": "y2", "domain": [ 0.35555555555555557, 0.6444444444444445 ] }, "xaxis3": { "anchor": "y3", "domain": [ 0.7111111111111111, 1.0 ] }, "yaxis2": { "anchor": "x2", "domain": [ 0.0, 1.0 ] }, "yaxis3": { "anchor": "x3", "domain": [ 0.0, 1.0 ] }, "template": { "data": { "bar": [ { "type": "bar", "marker": { "line": { "color": "white", "width": 0.5 }, "pattern": { "size": 10, "fillmode": "overlay", "solidity": 0.2 } }, "error_x": { "color": "#2a3f5f" }, "error_y": { "color": "#2a3f5f" } } ], "pie": [ { "type": "pie", "automargin": true } ], "table": [ { "type": "table", "cells": { "fill": { "color": "#EBF0F8" }, "line": { "color": "white" } }, "header": { "fill": { "color": "#C8D4E3" }, "line": { "color": "white" } } } ], "carpet": [ { "type": "carpet", "aaxis": { "gridcolor": "#C8D4E3", "linecolor": "#C8D4E3", "endlinecolor": "#2a3f5f", "minorgridcolor": "#C8D4E3", "startlinecolor": "#2a3f5f" }, "baxis": { "gridcolor": "#C8D4E3", "linecolor": "#C8D4E3", "endlinecolor": "#2a3f5f", "minorgridcolor": "#C8D4E3", "startlinecolor": "#2a3f5f" } } ], "mesh3d": [ { "type": "mesh3d", "colorbar": { "ticks": "", "outlinewidth": 0 } } ], "contour": [ { "type": "contour", "colorbar": { "ticks": "", "outlinewidth": 0 }, "colorscale": [ [ 0.0, "#0d0887" ], [ 0.1111111111111111, "#46039f" ], [ 0.2222222222222222, "#7201a8" ], [ 0.3333333333333333, "#9c179e" ], [ 0.4444444444444444, "#bd3786" ], [ 0.5555555555555556, "#d8576b" ], [ 0.6666666666666666, "#ed7953" ], [ 0.7777777777777778, "#fb9f3a" ], [ 0.8888888888888888, "#fdca26" ], [ 1.0, "#f0f921" ] ] } ], "heatmap": [ { "type": "heatmap", "colorbar": { "ticks": "", "outlinewidth": 0 }, "colorscale": [ [ 0.0, "#0d0887" ], [ 0.1111111111111111, "#46039f" ], [ 0.2222222222222222, "#7201a8" ], [ 0.3333333333333333, "#9c179e" ], [ 0.4444444444444444, "#bd3786" ], [ 0.5555555555555556, "#d8576b" ], [ 0.6666666666666666, "#ed7953" ], [ 0.7777777777777778, "#fb9f3a" ], [ 0.8888888888888888, "#fdca26" ], [ 1.0, "#f0f921" ] ] } ], "scatter": [ { "type": "scatter", "fillpattern": { "size": 10, "fillmode": "overlay", "solidity": 0.2 } } ], "surface": [ { "type": "surface", "colorbar": { "ticks": "", "outlinewidth": 0 }, "colorscale": [ [ 0.0, "#0d0887" ], [ 0.1111111111111111, "#46039f" ], [ 0.2222222222222222, "#7201a8" ], [ 0.3333333333333333, "#9c179e" ], [ 0.4444444444444444, "#bd3786" ], [ 0.5555555555555556, "#d8576b" ], [ 0.6666666666666666, "#ed7953" ], [ 0.7777777777777778, "#fb9f3a" ], [ 0.8888888888888888, "#fdca26" ], [ 1.0, "#f0f921" ] ] } ], "barpolar": [ { "type": "barpolar", "marker": { "line": { "color": "white", "width": 0.5 }, "pattern": { "size": 10, "fillmode": "overlay", "solidity": 0.2 } } } ], "heatmapgl": [ { "type": "heatmapgl", "colorbar": { "ticks": "", "outlinewidth": 0 }, "colorscale": [ [ 0.0, "#0d0887" ], [ 0.1111111111111111, "#46039f" ], [ 0.2222222222222222, "#7201a8" ], [ 0.3333333333333333, "#9c179e" ], [ 0.4444444444444444, "#bd3786" ], [ 0.5555555555555556, "#d8576b" ], [ 0.6666666666666666, "#ed7953" ], [ 0.7777777777777778, "#fb9f3a" ], [ 0.8888888888888888, "#fdca26" ], [ 1.0, "#f0f921" ] ] } ], "histogram": [ { "type": "histogram", "marker": { "pattern": { "size": 10, "fillmode": "overlay", "solidity": 0.2 } } } ], "parcoords": [ { "line": { "colorbar": { "ticks": "", "outlinewidth": 0 } }, "type": "parcoords" } ], "scatter3d": [ { "line": { "colorbar": { "ticks": "", "outlinewidth": 0 } }, "type": "scatter3d", "marker": { "colorbar": { "ticks": "", "outlinewidth": 0 } } } ], "scattergl": [ { "type": "scattergl", "marker": { "colorbar": { "ticks": "", "outlinewidth": 0 } } } ], "choropleth": [ { "type": "choropleth", "colorbar": { "ticks": "", "outlinewidth": 0 } } ], "scattergeo": [ { "type": "scattergeo", "marker": { "colorbar": { "ticks": "", "outlinewidth": 0 } } } ], "histogram2d": [ { "type": "histogram2d", "colorbar": { "ticks": "", "outlinewidth": 0 }, "colorscale": [ [ 0.0, "#0d0887" ], [ 0.1111111111111111, "#46039f" ], [ 0.2222222222222222, "#7201a8" ], [ 0.3333333333333333, "#9c179e" ], [ 0.4444444444444444, "#bd3786" ], [ 0.5555555555555556, "#d8576b" ], [ 0.6666666666666666, "#ed7953" ], [ 0.7777777777777778, "#fb9f3a" ], [ 0.8888888888888888, "#fdca26" ], [ 1.0, "#f0f921" ] ] } ], "scatterpolar": [ { "type": "scatterpolar", "marker": { "colorbar": { "ticks": "", "outlinewidth": 0 } } } ], "contourcarpet": [ { "type": "contourcarpet", "colorbar": { "ticks": "", "outlinewidth": 0 } } ], "scattercarpet": [ { "type": "scattercarpet", "marker": { "colorbar": { "ticks": "", "outlinewidth": 0 } } } ], "scattermapbox": [ { "type": "scattermapbox", "marker": { "colorbar": { "ticks": "", "outlinewidth": 0 } } } ], "scatterpolargl": [ { "type": "scatterpolargl", "marker": { "colorbar": { "ticks": "", "outlinewidth": 0 } } } ], "scatterternary": [ { "type": "scatterternary", "marker": { "colorbar": { "ticks": "", "outlinewidth": 0 } } } ], "histogram2dcontour": [ { "type": "histogram2dcontour", "colorbar": { "ticks": "", "outlinewidth": 0 }, "colorscale": [ [ 0.0, "#0d0887" ], [ 0.1111111111111111, "#46039f" ], [ 0.2222222222222222, "#7201a8" ], [ 0.3333333333333333, "#9c179e" ], [ 0.4444444444444444, "#bd3786" ], [ 0.5555555555555556, "#d8576b" ], [ 0.6666666666666666, "#ed7953" ], [ 0.7777777777777778, "#fb9f3a" ], [ 0.8888888888888888, "#fdca26" ], [ 1.0, "#f0f921" ] ] } ] }, "layout": { "geo": { "bgcolor": "white", "showland": true, "lakecolor": "white", "landcolor": "white", "showlakes": true, "subunitcolor": "#C8D4E3" }, "font": { "color": "#2a3f5f" }, "polar": { "bgcolor": "white", "radialaxis": { "ticks": "", "gridcolor": "#EBF0F8", "linecolor": "#EBF0F8" }, "angularaxis": { "ticks": "", "gridcolor": "#EBF0F8", "linecolor": "#EBF0F8" } }, "scene": { "xaxis": { "ticks": "", "gridcolor": "#DFE8F3", "gridwidth": 2, "linecolor": "#EBF0F8", "zerolinecolor": "#EBF0F8", "showbackground": true, "backgroundcolor": "white" }, "yaxis": { "ticks": "", "gridcolor": "#DFE8F3", "gridwidth": 2, "linecolor": "#EBF0F8", "zerolinecolor": "#EBF0F8", "showbackground": true, "backgroundcolor": "white" }, "zaxis": { "ticks": "", "gridcolor": "#DFE8F3", "gridwidth": 2, "linecolor": "#EBF0F8", "zerolinecolor": "#EBF0F8", "showbackground": true, "backgroundcolor": "white" } }, "title": { "x": 0.05 }, "xaxis": { "ticks": "", "title": { "standoff": 15 }, "gridcolor": "#EBF0F8", "linecolor": "#EBF0F8", "automargin": true, "zerolinecolor": "#EBF0F8", "zerolinewidth": 2 }, "yaxis": { "ticks": "", "title": { "standoff": 15 }, "gridcolor": "#EBF0F8", "linecolor": "#EBF0F8", "automargin": true, "zerolinecolor": "#EBF0F8", "zerolinewidth": 2 }, "mapbox": { "style": "light" }, "ternary": { "aaxis": { "ticks": "", "gridcolor": "#DFE8F3", "linecolor": "#A2B1C6" }, "baxis": { "ticks": "", "gridcolor": "#DFE8F3", "linecolor": "#A2B1C6" }, "caxis": { "ticks": "", "gridcolor": "#DFE8F3", "linecolor": "#A2B1C6" }, "bgcolor": "white" }, "colorway": [ "#636efa", "#EF553B", "#00cc96", "#ab63fa", "#FFA15A", "#19d3f3", "#FF6692", "#B6E880", "#FF97FF", "#FECB52" ], "coloraxis": { "colorbar": { "ticks": "", "outlinewidth": 0 } }, "hovermode": "closest", "colorscale": { "diverging": [ [ 0, "#8e0152" ], [ 0.1, "#c51b7d" ], [ 0.2, "#de77ae" ], [ 0.3, "#f1b6da" ], [ 0.4, "#fde0ef" ], [ 0.5, "#f7f7f7" ], [ 0.6, "#e6f5d0" ], [ 0.7, "#b8e186" ], [ 0.8, "#7fbc41" ], [ 0.9, "#4d9221" ], [ 1, "#276419" ] ], "sequential": [ [ 0.0, "#0d0887" ], [ 0.1111111111111111, "#46039f" ], [ 0.2222222222222222, "#7201a8" ], [ 0.3333333333333333, "#9c179e" ], [ 0.4444444444444444, "#bd3786" ], [ 0.5555555555555556, "#d8576b" ], [ 0.6666666666666666, "#ed7953" ], [ 0.7777777777777778, "#fb9f3a" ], [ 0.8888888888888888, "#fdca26" ], [ 1.0, "#f0f921" ] ], "sequentialminus": [ [ 0.0, "#0d0887" ], [ 0.1111111111111111, "#46039f" ], [ 0.2222222222222222, "#7201a8" ], [ 0.3333333333333333, "#9c179e" ], [ 0.4444444444444444, "#bd3786" ], [ 0.5555555555555556, "#d8576b" ], [ 0.6666666666666666, "#ed7953" ], [ 0.7777777777777778, "#fb9f3a" ], [ 0.8888888888888888, "#fdca26" ], [ 1.0, "#f0f921" ] ] }, "hoverlabel": { "align": "left" }, "plot_bgcolor": "white", "paper_bgcolor": "white", "shapedefaults": { "line": { "color": "#2a3f5f" } }, "autotypenumbers": "strict", "annotationdefaults": { "arrowhead": 0, "arrowcolor": "#2a3f5f", "arrowwidth": 1 } } }, "annotations": [ { "x": 0.14444444444444446, "y": 1.0, "font": { "size": 16 }, "text": "CDCardPosted", "xref": "paper", "yref": "paper", "xanchor": "center", "yanchor": "bottom", "showarrow": false }, { "x": 0.5, "y": 1.0, "font": { "size": 16 }, "text": "CDCardAuth", "xref": "paper", "yref": "paper", "xanchor": "center", "yanchor": "bottom", "showarrow": false }, { "x": 0.8555555555555556, "y": 1.0, "font": { "size": 16 }, "text": "CDEnrich", "xref": "paper", "yref": "paper", "xanchor": "center", "yanchor": "bottom", "showarrow": false } ] } }, "height": 400, "width": null, "user": { "profile_url": "https://chart-studio.plotly.com/~jkuntz", "avatar_url": "https://storage.googleapis.com/plotly-prod-profiles/34.jpg", "background_url": "https://storage.googleapis.com/plotly-prod-profiles/bg-11.jpg", "bio": "", "nickname": "", "website": "", "stream_tokens": null, "feature_set_id": null, "csrf_token": null, "date_joined": "2024-04-02 20:04:41", "mapbox_access_tokens": null, "has_password": null, "username": "jkuntz", "email": null, "is_active": null, "readonly": null, "is_dash_creator": null, "dash_created_count": null, "is_chart_creator": null, "charts_created_count": null } } ] }
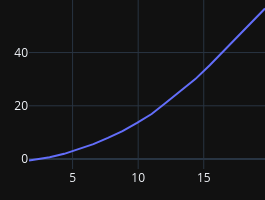
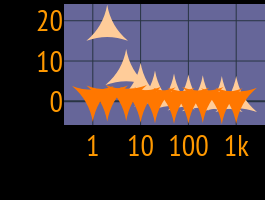
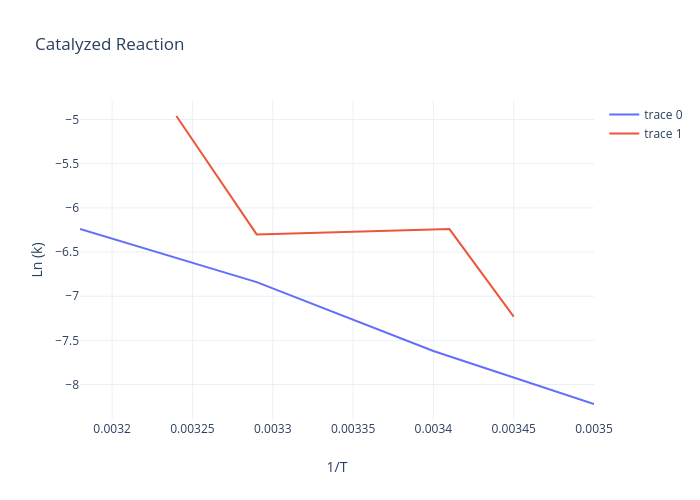