Plots List
Plots
This endpoint handles manipulation of Plotly plot files.
Reference
Authorization
Any user with or without a Plotly account may view public plots. For private plots, see authentication.
Actions
list
Listing all public plots can be done via a GET request to this endpoint.
By default, plots will be listed in order of date created. The order_by
query parameter is accepted at this endpoint. Currently, only ordering by
views is supported. It is possible to filter the plots by quality
with min_quality or max_quality as query parameter.
Example:
// GET https://api.plotly.com/v2/plots/ ---> 200

// GET https://api.plotly.com/v2/plots/?order_by=-views ---> 200

// GET https://api.plotly.com/v2/plots/?min_quality=5 ---> 200

// GET https://api.plotly.com/v2/plots/?max_quality=5 ---> 200
feed
Listing all handpicked feed plots can be done via a GET request to this endpoint. By default, plots will be listed in a random order.
Example:
// GET https://api.plotly.com/v2/plots/feed ---> 200
create
You can create new plot resources here. The only required field is 'figure'. Currently, the figure is restricted to only contain references to grid data. That is, this will fail if raw data arrays are passed in. To create and manipulate underlying grids for plots, see the grids endpoint.
Example:
// This fails because a figure field is required.
// POST https://api.plotly.com/v2/plots ---> 400 Bad Request
{}

// This fails because the figure has raw data
//POST https://api.plotly.com/v2/plots ---> 400 Bad Request
{
    "figure": {"data": [{"y": ['this', 'is', 'raw', 'data']}]}
}

// This succeeds because the figure has src keys, not raw data.
//POST https://api.plotly.com/v2/plots ---> 200 OK
{
    "figure": {"data": [{"ysrc": "sven:88:u8nd62"}]}
}
When creating a grid, you can optionally specify a source_fid to specify where a plot has come from:
- source_fid: the fid of a plot that was copied (and presumably edited) to produce this one
detail
There is a lot of meta information stored about plot files including filename, title, share_url, and content_url to name a few.
This information can only be reached with a GET to this endpoint.
Example:
// GET https://api.plotly.com/v2/plots/iheartgraphs:90
content
The contents of a plot can be downloaded via the content resource. The plot
content contains referenced grid/column data by default. If you wish to
return the raw grid/column data, the inline_data=true query must be included
in the request url. The Content-Type header will be appropriately set for the
response body.
Alternatively, you can set ?map_data=unreadable to append a mapping of
sources to data that belongs to grids which are unreadable for the
requestor. This is useful when you have read access to another users plot,
but that plot contains grid references which you don't have access to.
Examples:
// Returns referenced grid/column data
// GET https://api.plotly.com/v2/plots/iheartgraphs:90/content ---> 200 OK

// Returns full grid/column data
// GET https://api.plotly.com/v2/plots/iheartgraphs:90/content?inline_data=true ---> 200 OK

// Returns full grid/column data when requestor doesn't have permission
// to read the referenced grid.
// GET https://api.plotly.com/v2/plots/iheartgraphs:90/content?map_data=unreadable ---> 200 OK
GET /v2/plots?cursor=cD0yMDI0LTA0LTA5KzEzJTNBNTIlM0EwMi40OTg4NTglMkIwMCUzQTAw&format=api
{ "next": "https://api.plot.ly/v2/plots?cursor=cD0yMDI0LTA0LTA5KzEyJTNBMjMlM0EyNi44MDMzMjUlMkIwMCUzQTAw&format=api", "previous": "https://api.plot.ly/v2/plots?cursor=cj0xJnA9MjAyNC0wNC0wOSsxMyUzQTUwJTNBMjIuNDM0ODYxJTJCMDAlM0EwMA%3D%3D&format=api", "results": [ { "creation_time": "2024-04-09T13:50:22.434861Z", "comments": { "results": [], "count": 0 }, "parented": true, "embed_url": "https://chart-studio.plotly.com/~isabellebrigaud/232.embed", "fid": "isabellebrigaud:232", "filename": "Plot 232", "filetype": "plot", "img_url": "https://storage.googleapis.com/plotly-prod-images/isabellebrigaud/232/9_T09SMADXNQR391VE53KSNDVNYLE62Q.png", "image_urls": { "default": "https://storage.googleapis.com/plotly-prod-images/isabellebrigaud/232/2_I7QIPJ2DMDZJY18PCMWUTQLFSAZ07F.png", "block-thumb": "https://storage.googleapis.com/plotly-prod-images/isabellebrigaud/232/8_Q1P1DSPU201WME5K60ED9CH444W5UH.png", "list-thumb": "https://storage.googleapis.com/plotly-prod-images/isabellebrigaud/232/9_T09SMADXNQR391VE53KSNDVNYLE62Q.png" }, "api_urls": { "files": "https://api.plotly.com/v2/files/isabellebrigaud:232", "plots": "https://api.plotly.com/v2/plots/isabellebrigaud:232", "parent": "https://api.plotly.com/v2/folders/home?user=isabellebrigaud" }, "owner": "isabellebrigaud", "parent": -1, "preview": "", "referencers": [], "references": [], "title": "", "views": 1, "web_url": "https://chart-studio.plotly.com/~isabellebrigaud/232/", "world_readable": true, "date_modified": "2024-04-09T14:05:24.292Z", "stars": { "results": [], "count": 0 }, "collaborators": { "results": [], "count": 0 }, "subfolder_count": null, "refresh_interval": null, "organize_view_url": "https://chart-studio.plotly.com/~isabellebrigaud/232/", "current_user_permission": "read", "is_theme": null, "is_template": false, "autosize": true, "caption": "", "figure": { "data": [ { "meta": { "columnNames": { "x": "B", "y": "A", "text": "B", "textposition": "" } }, "mode": "markers", "name": "upregulated", "type": "bar", "xsrc": "isabellebrigaud:231:6608d5", "ysrc": "isabellebrigaud:231:61e414", "marker": { "color": "rgb(35, 36, 37)" }, "textsrc": "isabellebrigaud:231:6608d5", "hoverinfo": "x+y+text+name", "textangle": 0, "hoverlabel": { "align": "auto", "namelength": 15 }, "orientation": "h", "textposition": "inside", "texttemplate": "", "constraintext": "inside" }, { "meta": { "columnNames": { "x": "C", "y": "A", "text": "C" } }, "name": "downregulated", "type": "bar", "xsrc": "isabellebrigaud:231:945ef8", "ysrc": "isabellebrigaud:231:61e414", "marker": { "color": "rgb(218, 227, 232)" }, "textsrc": "isabellebrigaud:231:945ef8", "orientation": "h", "textposition": "inside" } ], "frames": [], "layout": { "title": { "x": 0 }, "xaxis": { "type": "linear", "range": [ 0, 2214.7368421052633 ], "nticks": 8, "showgrid": true, "showline": true, "zeroline": true, "autorange": true, "gridwidth": 2, "linecolor": "rgb(19, 19, 20)", "linewidth": 2, "zerolinecolor": "rgb(32, 33, 34)", "zerolinewidth": 2 }, "yaxis": { "type": "category", "range": [ -0.5, 3.5 ], "nticks": 8, "showgrid": true, "showline": true, "zeroline": true, "autorange": true, "gridwidth": 2, "linecolor": "rgb(19, 19, 20)", "linewidth": 2, "zerolinecolor": "rgb(32, 33, 34)", "zerolinewidth": 2 }, "barmode": "relative", "modebar": { "orientation": "h" }, "autosize": true, "template": { "data": { "bar": [ { "type": "bar", "marker": { "colorbar": { "ticks": "", "outlinewidth": 0 } } } ], "table": [ { "type": "table", "cells": { "fill": { "color": "#EBF0F8" }, "line": { "color": "white" } }, "header": { "fill": { "color": "#C8D4E3" }, "line": { "color": "white" } } } ], "carpet": [ { "type": "carpet", "aaxis": { "gridcolor": "#C8D4E3", "linecolor": "#C8D4E3", "endlinecolor": "#2a3f5f", "minorgridcolor": "#C8D4E3", "startlinecolor": "#2a3f5f" }, "baxis": { "gridcolor": "#C8D4E3", "linecolor": "#C8D4E3", "endlinecolor": "#2a3f5f", "minorgridcolor": "#C8D4E3", "startlinecolor": "#2a3f5f" } } ], "mesh3d": [ { "type": "mesh3d", "colorbar": { "ticks": "", "outlinewidth": 0 } } ], "contour": [ { "type": "contour", "colorbar": { "ticks": "", "outlinewidth": 0 }, "autocolorscale": true } ], "heatmap": [ { "type": "heatmap", "colorbar": { "ticks": "", "outlinewidth": 0 }, "autocolorscale": true } ], "scatter": [ { "type": "scatter", "marker": { "colorbar": { "ticks": "", "outlinewidth": 0 } } } ], "surface": [ { "type": "surface", "colorbar": { "ticks": "", "outlinewidth": 0 } } ], "heatmapgl": [ { "type": "heatmapgl", "colorbar": { "ticks": "", "outlinewidth": 0 } } ], "histogram": [ { "type": "histogram", "marker": { "colorbar": { "ticks": "", "outlinewidth": 0 } } } ], "parcoords": [ { "line": { "colorbar": { "ticks": "", "outlinewidth": 0 } }, "type": "parcoords" } ], "scatter3d": [ { "type": "scatter3d", "marker": { "colorbar": { "ticks": "", "outlinewidth": 0 } } } ], "scattergl": [ { "type": "scattergl", "marker": { "colorbar": { "ticks": "", "outlinewidth": 0 } } } ], "choropleth": [ { "type": "choropleth", "colorbar": { "ticks": "", "outlinewidth": 0 } } ], "scattergeo": [ { "type": "scattergeo", "marker": { "colorbar": { "ticks": "", "outlinewidth": 0 } } } ], "histogram2d": [ { "type": "histogram2d", "colorbar": { "ticks": "", "outlinewidth": 0 }, "autocolorscale": true } ], "scatterpolar": [ { "type": "scatterpolar", "marker": { "colorbar": { "ticks": "", "outlinewidth": 0 } } } ], "contourcarpet": [ { "type": "contourcarpet", "colorbar": { "ticks": "", "outlinewidth": 0 } } ], "scattercarpet": [ { "type": "scattercarpet", "marker": { "colorbar": { "ticks": "", "outlinewidth": 0 } } } ], "scattermapbox": [ { "type": "scattermapbox", "marker": { "colorbar": { "ticks": "", "outlinewidth": 0 } } } ], "scatterpolargl": [ { "type": "scatterpolargl", "marker": { "colorbar": { "ticks": "", "outlinewidth": 0 } } } ], "scatterternary": [ { "type": "scatterternary", "marker": { "colorbar": { "ticks": "", "outlinewidth": 0 } } } ], "histogram2dcontour": [ { "type": "histogram2dcontour", "colorbar": { "ticks": "", "outlinewidth": 0 }, "autocolorscale": true } ] }, "layout": { "geo": { "bgcolor": "white", "showland": true, "lakecolor": "white", "landcolor": "white", "showlakes": true, "subunitcolor": "#C8D4E3" }, "font": { "color": "#2a3f5f" }, "polar": { "bgcolor": "white", "radialaxis": { "ticks": "", "gridcolor": "#EBF0F8", "linecolor": "#EBF0F8" }, "angularaxis": { "ticks": "", "gridcolor": "#EBF0F8", "linecolor": "#EBF0F8" } }, "scene": { "xaxis": { "ticks": "", "gridcolor": "#DFE8F3", "gridwidth": 2, "linecolor": "#EBF0F8", "zerolinecolor": "#EBF0F8", "showbackground": true, "backgroundcolor": "white" }, "yaxis": { "ticks": "", "gridcolor": "#DFE8F3", "gridwidth": 2, "linecolor": "#EBF0F8", "zerolinecolor": "#EBF0F8", "showbackground": true, "backgroundcolor": "white" }, "zaxis": { "ticks": "", "gridcolor": "#DFE8F3", "gridwidth": 2, "linecolor": "#EBF0F8", "zerolinecolor": "#EBF0F8", "showbackground": true, "backgroundcolor": "white" } }, "title": { "x": 0.05 }, "xaxis": { "ticks": "", "gridcolor": "#EBF0F8", "linecolor": "#EBF0F8", "automargin": true, "zerolinecolor": "#EBF0F8", "zerolinewidth": 2 }, "yaxis": { "ticks": "", "gridcolor": "#EBF0F8", "linecolor": "#EBF0F8", "automargin": true, "zerolinecolor": "#EBF0F8", "zerolinewidth": 2 }, "ternary": { "aaxis": { "ticks": "", "gridcolor": "#DFE8F3", "linecolor": "#A2B1C6" }, "baxis": { "ticks": "", "gridcolor": "#DFE8F3", "linecolor": "#A2B1C6" }, "caxis": { "ticks": "", "gridcolor": "#DFE8F3", "linecolor": "#A2B1C6" }, "bgcolor": "white" }, "colorway": [ "#636efa", "#EF553B", "#00cc96", "#ab63fa", "#19d3f3", "#e763fa", "#fecb52", "#ffa15a", "#ff6692", "#b6e880" ], "hovermode": "closest", "colorscale": { "diverging": [ [ 0, "#8e0152" ], [ 0.1, "#c51b7d" ], [ 0.2, "#de77ae" ], [ 0.3, "#f1b6da" ], [ 0.4, "#fde0ef" ], [ 0.5, "#f7f7f7" ], [ 0.6, "#e6f5d0" ], [ 0.7, "#b8e186" ], [ 0.8, "#7fbc41" ], [ 0.9, "#4d9221" ], [ 1, "#276419" ] ], "sequential": [ [ 0, "#0508b8" ], [ 0.0893854748603352, "#1910d8" ], [ 0.1787709497206704, "#3c19f0" ], [ 0.2681564245810056, "#6b1cfb" ], [ 0.3575418994413408, "#981cfd" ], [ 0.44692737430167595, "#bf1cfd" ], [ 0.5363128491620112, "#dd2bfd" ], [ 0.6256983240223464, "#f246fe" ], [ 0.7150837988826816, "#fc67fd" ], [ 0.8044692737430168, "#fe88fc" ], [ 0.8938547486033519, "#fea5fd" ], [ 0.9832402234636871, "#febefe" ], [ 1, "#fec3fe" ] ], "sequentialminus": [ [ 0, "#0508b8" ], [ 0.0893854748603352, "#1910d8" ], [ 0.1787709497206704, "#3c19f0" ], [ 0.2681564245810056, "#6b1cfb" ], [ 0.3575418994413408, "#981cfd" ], [ 0.44692737430167595, "#bf1cfd" ], [ 0.5363128491620112, "#dd2bfd" ], [ 0.6256983240223464, "#f246fe" ], [ 0.7150837988826816, "#fc67fd" ], [ 0.8044692737430168, "#fe88fc" ], [ 0.8938547486033519, "#fea5fd" ], [ 0.9832402234636871, "#febefe" ], [ 1, "#fec3fe" ] ] }, "plot_bgcolor": "white", "paper_bgcolor": "white", "shapedefaults": { "line": { "width": 0 }, "opacity": 0.4, "fillcolor": "#506784" }, "annotationdefaults": { "arrowhead": 0, "arrowcolor": "#506784", "arrowwidth": 1 } }, "themeRef": "PLOTLY_WHITE" }, "colorscale": { "sequential": [ [ 0, "#440154" ], [ 0.1111111111111111, "#482878" ], [ 0.2222222222222222, "#3e4989" ], [ 0.3333333333333333, "#31688e" ], [ 0.4444444444444444, "#26828e" ], [ 0.5555555555555556, "#1f9e89" ], [ 0.6666666666666666, "#35b779" ], [ 0.7777777777777778, "#6ece58" ], [ 0.8888888888888888, "#b5de2b" ], [ 1, "#fde725" ] ], "sequentialminus": [ [ 0, "#0508b8" ], [ 0.08333333333333333, "#1910d8" ], [ 0.16666666666666666, "#3c19f0" ], [ 0.25, "#6b1cfb" ], [ 0.3333333333333333, "#981cfd" ], [ 0.4166666666666667, "#bf1cfd" ], [ 0.5, "#dd2bfd" ], [ 0.5833333333333334, "#f246fe" ], [ 0.6666666666666666, "#fc67fd" ], [ 0.75, "#fe88fc" ], [ 0.8333333333333334, "#fea5fd" ], [ 0.9166666666666666, "#febefe" ], [ 1, "#fec3fe" ] ] } } }, "height": null, "width": null, "user": { "profile_url": "https://chart-studio.plotly.com/~isabellebrigaud", "avatar_url": "https://storage.googleapis.com/plotly-prod-profiles/82.jpg", "background_url": "https://storage.googleapis.com/plotly-prod-profiles/bg-2.jpg", "bio": "", "nickname": "", "website": "", "stream_tokens": null, "feature_set_id": null, "csrf_token": null, "date_joined": "2018-09-11 14:10:24", "mapbox_access_tokens": null, "has_password": null, "username": "isabellebrigaud", "email": null, "is_active": null, "readonly": null, "is_dash_creator": null, "dash_created_count": null, "is_chart_creator": null, "charts_created_count": null } }, { "creation_time": "2024-04-09T13:39:20.853579Z", "comments": { "results": [], "count": 0 }, "parented": true, "embed_url": "https://chart-studio.plotly.com/~denghuiying/190.embed", "fid": "denghuiying:190", "filename": "Plot 190", "filetype": "plot", "img_url": "https://storage.googleapis.com/plotly-prod-images/denghuiying/190/9_PTF4QIWZYGN7XOH0ZE0JSN8C2P6J06.png", "image_urls": { "default": "https://storage.googleapis.com/plotly-prod-images/denghuiying/190/2_215XJXJJNWGJ7B7QYZ4ACQKICDZ1MJ.png", "block-thumb": "https://storage.googleapis.com/plotly-prod-images/denghuiying/190/8_ATCONHQX9AT7O22FPCALAER5MB5DYQ.png", "list-thumb": "https://storage.googleapis.com/plotly-prod-images/denghuiying/190/9_PTF4QIWZYGN7XOH0ZE0JSN8C2P6J06.png" }, "api_urls": { "files": "https://api.plotly.com/v2/files/denghuiying:190", "plots": "https://api.plotly.com/v2/plots/denghuiying:190", "parent": "https://api.plotly.com/v2/folders/home?user=denghuiying" }, "owner": "denghuiying", "parent": -1, "preview": "", "referencers": [], "references": [], "title": "", "views": 8, "web_url": "https://chart-studio.plotly.com/~denghuiying/190/", "world_readable": true, "date_modified": "2024-04-09T13:39:20.869Z", "stars": { "results": [], "count": 0 }, "collaborators": { "results": [], "count": 0 }, "subfolder_count": null, "refresh_interval": null, "organize_view_url": "https://chart-studio.plotly.com/~denghuiying/190/", "current_user_permission": "read", "is_theme": null, "is_template": null, "autosize": true, "caption": "", "figure": { "data": [ { "asrc": "denghuiying:189:f07496", "bsrc": "denghuiying:189:a95bb1", "csrc": "denghuiying:189:403274", "fill": "toself", "line": { "shape": "spline", "width": 0 }, "mode": "lines", "name": "nan", "type": "scatterternary", "textsrc": "denghuiying:189:ab175e" }, { "asrc": "denghuiying:189:445846", "bsrc": "denghuiying:189:7f4a9d", "csrc": "denghuiying:189:b5169d", "fill": "toself", "line": { "shape": "spline", "width": 0 }, "mode": "lines", "name": "αFe", "type": "scatterternary", "textsrc": "denghuiying:189:f90f4f" }, { "asrc": "denghuiying:189:fda499", "bsrc": "denghuiying:189:a8c407", "csrc": "denghuiying:189:edf40d", "fill": "toself", "line": { "shape": "spline", "width": 0 }, "mode": "lines", "name": "Fe2Ti", "type": "scatterternary", "textsrc": "denghuiying:189:95d764" }, { "asrc": "denghuiying:189:1981f5", "bsrc": "denghuiying:189:30a845", "csrc": "denghuiying:189:cb110d", "fill": "toself", "line": { "shape": "spline", "width": 0 }, "mode": "lines", "name": "FeTi ", "type": "scatterternary", "textsrc": "denghuiying:189:531675" }, { "asrc": "denghuiying:189:c05489", "bsrc": "denghuiying:189:77fde7", "csrc": "denghuiying:189:b4a1e7", "fill": "toself", "line": { "shape": "spline", "width": 0 }, "mode": "lines", "name": "βTi ", "type": "scatterternary", "textsrc": "denghuiying:189:46f32e" }, { "asrc": "denghuiying:189:ed2480", "bsrc": "denghuiying:189:6adb80", "csrc": "denghuiying:189:4e11b4", "fill": "toself", "line": { "shape": "spline", "width": 0 }, "mode": "lines", "name": "βTi", "type": "scatterternary", "textsrc": "denghuiying:189:aa693f" }, { "asrc": "denghuiying:189:6fc2ac", "bsrc": "denghuiying:189:153369", "csrc": "denghuiying:189:a33c4e", "fill": "toself", "line": { "shape": "spline", "width": 0 }, "mode": "lines", "name": "αTi", "type": "scatterternary", "textsrc": "denghuiying:189:ee5659" }, { "asrc": "denghuiying:189:a735e5", "bsrc": "denghuiying:189:092de1", "csrc": "denghuiying:189:ad759a", "fill": "toself", "line": { "shape": "spline", "width": 0 }, "mode": "lines", "name": "TiAl", "type": "scatterternary", "textsrc": "denghuiying:189:88ece4" }, { "asrc": "denghuiying:189:b9f013", "bsrc": "denghuiying:189:33538f", "csrc": "denghuiying:189:b0f574", "fill": "toself", "line": { "shape": "spline", "width": 0 }, "mode": "lines", "name": "TiAl2", "type": "scatterternary", "textsrc": "denghuiying:189:cff2d6" }, { "asrc": "denghuiying:189:cafcd3", "bsrc": "denghuiying:189:d453c7", "csrc": "denghuiying:189:a0447c", "fill": "toself", "line": { "shape": "spline", "width": 0 }, "mode": "lines", "name": "TiAl3", "type": "scatterternary", "textsrc": "denghuiying:189:983e6f" }, { "asrc": "denghuiying:189:2c22c3", "bsrc": "denghuiying:189:cdb66b", "csrc": "denghuiying:189:ee9975", "fill": "toself", "line": { "shape": "spline", "width": 0 }, "mode": "lines", "name": "FeAl", "type": "scatterternary", "textsrc": "denghuiying:189:34a119" }, { "asrc": "denghuiying:189:7f678b", "bsrc": "denghuiying:189:36cbbf", "csrc": "denghuiying:189:78b74d", "fill": "toself", "line": { "shape": "spline", "width": 0 }, "mode": "lines", "name": "ε", "type": "scatterternary", "textsrc": "denghuiying:189:419123" }, { "asrc": "denghuiying:189:05bd9c", "bsrc": "denghuiying:189:dec79b", "csrc": "denghuiying:189:ace499", "fill": "toself", "line": { "shape": "spline", "width": 0 }, "mode": "lines", "name": "Fe2Al5", "type": "scatterternary", "textsrc": "denghuiying:189:0f9fa5" }, { "asrc": "denghuiying:189:ce67b5", "bsrc": "denghuiying:189:774099", "csrc": "denghuiying:189:a7708c", "fill": "toself", "line": { "shape": "spline", "width": 0 }, "mode": "lines", "name": "FeAl3", "type": "scatterternary", "textsrc": "denghuiying:189:71b69a" }, { "asrc": "denghuiying:189:adf4b8", "bsrc": "denghuiying:189:93e3b3", "csrc": "denghuiying:189:42ff2c", "fill": "toself", "line": { "shape": "spline", "width": 0 }, "mode": "lines", "name": "(Al)", "type": "scatterternary", "textsrc": "denghuiying:189:be28db" }, { "asrc": "denghuiying:189:dad9a1", "bsrc": "denghuiying:189:2b8cbf", "csrc": "denghuiying:189:c8047a", "fill": "toself", "line": { "shape": "spline", "width": 0 }, "mode": "lines", "name": "τ2(Al2FeTi)", "type": "scatterternary", "textsrc": "denghuiying:189:f5b5fe" }, { "asrc": "denghuiying:189:eb2e4f", "bsrc": "denghuiying:189:435c4e", "csrc": "denghuiying:189:7cf9f4", "fill": "toself", "line": { "shape": "spline", "width": 0 }, "mode": "lines", "name": "τ2*", "type": "scatterternary", "textsrc": "denghuiying:189:f3df47" }, { "asrc": "denghuiying:189:3b2fea", "bsrc": "denghuiying:189:f82f13", "csrc": "denghuiying:189:bd1fcc", "fill": "toself", "line": { "shape": "spline", "width": 0 }, "mode": "lines", "name": "τ3(Al8FeTi3)", "type": "scatterternary", "textsrc": "denghuiying:189:6f137b" }, { "asrc": "denghuiying:189:104647", "bsrc": "denghuiying:189:3cd10d", "csrc": "denghuiying:189:df9113", "fill": "toself", "line": { "shape": "spline", "width": 0 }, "mode": "lines", "name": "FeAl3+τ2*+Fe2Al5", "type": "scatterternary", "textsrc": "denghuiying:189:e4486b" }, { "asrc": "denghuiying:189:1813c9", "bsrc": "denghuiying:189:cca535", "csrc": "denghuiying:189:ce230d", "fill": "toself", "line": { "shape": "spline", "width": 0 }, "mode": "lines", "name": "TiAl+TiAl3+τ3", "type": "scatterternary", "textsrc": "denghuiying:189:217ac2" }, { "asrc": "denghuiying:189:7476c5", "bsrc": "denghuiying:189:d731c8", "csrc": "denghuiying:189:230554", "fill": "toself", "line": { "shape": "spline", "width": 0 }, "mode": "lines", "name": "τ3+Fe2Ti+τ2*", "type": "scatterternary", "textsrc": "denghuiying:189:71db7e" }, { "asrc": "denghuiying:189:53c1ff", "bsrc": "denghuiying:189:0b1c12", "csrc": "denghuiying:189:67b262", "fill": "toself", "line": { "shape": "spline", "width": 0 }, "mode": "lines", "name": "τ3+τ2*+FeAl3", "type": "scatterternary", "textsrc": "denghuiying:189:646493" }, { "asrc": "denghuiying:189:a61280", "bsrc": "denghuiying:189:8b8f67", "csrc": "denghuiying:189:dce43b", "fill": "toself", "line": { "shape": "spline", "width": 0 }, "mode": "lines", "name": "αTi+βTi +TiAl", "type": "scatterternary", "textsrc": "denghuiying:189:b046cb" }, { "asrc": "denghuiying:189:633c76", "bsrc": "denghuiying:189:2d0b1a", "csrc": "denghuiying:189:024725", "fill": "toself", "line": { "shape": "spline", "width": 0 }, "mode": "lines", "name": "τ3+TiAl+Fe2Ti", "type": "scatterternary", "textsrc": "denghuiying:189:60dd7e" }, { "asrc": "denghuiying:189:f00e97", "bsrc": "denghuiying:189:001642", "csrc": "denghuiying:189:272d90", "fill": "toself", "line": { "shape": "spline", "width": 0 }, "mode": "lines", "name": "TiAl+βTi+Fe2Ti", "type": "scatterternary", "textsrc": "denghuiying:189:c902c2" }, { "asrc": "denghuiying:189:56911f", "bsrc": "denghuiying:189:d04332", "csrc": "denghuiying:189:1deaca", "fill": "toself", "line": { "shape": "spline", "width": 0 }, "mode": "lines", "name": "Fe2Ti+βTi +FeTi", "type": "scatterternary", "textsrc": "denghuiying:189:5c04b0" }, { "asrc": "denghuiying:189:7fa930", "bsrc": "denghuiying:189:8fedb1", "csrc": "denghuiying:189:d27596", "fill": "toself", "line": { "shape": "spline", "width": 0 }, "mode": "lines", "name": "Fe2Ti+αFe +τ2*", "type": "scatterternary", "textsrc": "denghuiying:189:6a368b" }, { "asrc": "denghuiying:189:cebdc2", "bsrc": "denghuiying:189:9961f2", "csrc": "denghuiying:189:946012", "fill": "toself", "line": { "shape": "spline", "width": 0 }, "mode": "lines", "name": "αFe +τ2*+ε", "type": "scatterternary", "textsrc": "denghuiying:189:b23378" }, { "asrc": "denghuiying:189:e26b03", "bsrc": "denghuiying:189:f3266e", "csrc": "denghuiying:189:856107", "fill": "toself", "line": { "shape": "spline", "width": 0 }, "mode": "lines", "name": "τ2*+ε+Fe2Al5", "type": "scatterternary", "textsrc": "denghuiying:189:c7f95c" }, { "asrc": "denghuiying:189:d8eb38", "bsrc": "denghuiying:189:c31880", "csrc": "denghuiying:189:eb329a", "fill": "toself", "line": { "shape": "spline", "width": 0 }, "mode": "lines", "name": "τ3+TiAl3+FeAl3", "type": "scatterternary", "textsrc": "denghuiying:189:4dbeed" }, { "asrc": "denghuiying:189:461525", "bsrc": "denghuiying:189:f4f53a", "csrc": "denghuiying:189:f45a5b", "fill": "toself", "line": { "shape": "spline", "width": 0 }, "mode": "lines", "name": "TiAl3+Al+FeAl3", "type": "scatterternary", "textsrc": "denghuiying:189:4b2449" }, { "asrc": "denghuiying:189:af96d7", "bsrc": "denghuiying:189:719eb3", "csrc": "denghuiying:189:5a5fe9", "mode": "markers", "name": "phases #1", "text": "phases #1", "type": "scatterternary", "marker": { "symbol": "triangle-up" } }, { "asrc": "denghuiying:189:a4b80c", "bsrc": "denghuiying:189:ec8fca", "csrc": "denghuiying:189:78b9a5", "mode": "markers", "name": "phases #2", "text": "phases #2", "type": "scatterternary", "marker": { "symbol": "triangle-up" } }, { "asrc": "denghuiying:189:98f07c", "bsrc": "denghuiying:189:d7134d", "csrc": "denghuiying:189:1c5385", "mode": "markers", "name": "phases #3", "text": "phases #3", "type": "scatterternary", "marker": { "symbol": "triangle-up" } }, { "asrc": "denghuiying:189:ab6a43", "bsrc": "denghuiying:189:12b855", "csrc": "denghuiying:189:013e75", "mode": "markers", "name": "phases #4", "text": "phases #4", "type": "scatterternary", "marker": { "symbol": "triangle-up" } }, { "asrc": "denghuiying:189:6b717d", "bsrc": "denghuiying:189:75b3b8", "csrc": "denghuiying:189:30befd", "mode": "markers", "name": "phases #5", "text": "phases #5", "type": "scatterternary", "marker": { "symbol": "triangle-up" } }, { "asrc": "denghuiying:189:8d6852", "bsrc": "denghuiying:189:fab7e5", "csrc": "denghuiying:189:f4f68b", "line": { "color": "red", "width": 2 }, "mode": "lines", "type": "scatterternary" }, { "asrc": "denghuiying:189:0c0a3f", "bsrc": "denghuiying:189:f550b2", "csrc": "denghuiying:189:18218a", "line": { "color": "red", "width": 2 }, "mode": "lines", "type": "scatterternary" }, { "asrc": "denghuiying:189:45b1ad", "bsrc": "denghuiying:189:d98220", "csrc": "denghuiying:189:1a4b96", "line": { "color": "red", "width": 2 }, "mode": "lines", "type": "scatterternary" }, { "asrc": "denghuiying:189:439743", "bsrc": "denghuiying:189:5e0177", "csrc": "denghuiying:189:e8d9bf", "line": { "color": "red", "width": 2 }, "mode": "lines", "type": "scatterternary" }, { "asrc": "denghuiying:189:857ad5", "bsrc": "denghuiying:189:57f3fb", "csrc": "denghuiying:189:484009", "line": { "color": "red", "width": 2 }, "mode": "lines", "type": "scatterternary" }, { "asrc": "denghuiying:189:91874a", "bsrc": "denghuiying:189:d5f185", "csrc": "denghuiying:189:c27d00", "line": { "color": "red", "width": 2 }, "mode": "lines", "type": "scatterternary" }, { "asrc": "denghuiying:189:3c293d", "bsrc": "denghuiying:189:b9d8bf", "csrc": "denghuiying:189:be66c7", "line": { "color": "red", "width": 2 }, "mode": "lines", "type": "scatterternary" }, { "asrc": "denghuiying:189:631a0f", "bsrc": "denghuiying:189:b28545", "csrc": "denghuiying:189:3ad2a2", "line": { "color": "red", "width": 2 }, "mode": "lines", "type": "scatterternary" }, { "asrc": "denghuiying:189:42b1a2", "bsrc": "denghuiying:189:ba88f0", "csrc": "denghuiying:189:19c91c", "line": { "color": "red", "width": 2 }, "mode": "lines", "type": "scatterternary" }, { "asrc": "denghuiying:189:a46bca", "bsrc": "denghuiying:189:889960", "csrc": "denghuiying:189:941322", "line": { "color": "red", "width": 2 }, "mode": "lines", "type": "scatterternary" }, { "asrc": "denghuiying:189:cf42c5", "bsrc": "denghuiying:189:575eab", "csrc": "denghuiying:189:56477e", "line": { "color": "red", "width": 2 }, "mode": "lines", "type": "scatterternary" }, { "asrc": "denghuiying:189:6a1029", "bsrc": "denghuiying:189:8e2b2d", "csrc": "denghuiying:189:591511", "line": { "color": "red", "width": 2 }, "mode": "lines", "type": "scatterternary" }, { "asrc": "denghuiying:189:9265f0", "bsrc": "denghuiying:189:123802", "csrc": "denghuiying:189:90187b", "line": { "color": "red", "width": 2 }, "mode": "lines", "type": "scatterternary" }, { "asrc": "denghuiying:189:b3e2a4", "bsrc": "denghuiying:189:4b9203", "csrc": "denghuiying:189:a1a8a7", "line": { "color": "red", "width": 2 }, "mode": "lines", "type": "scatterternary" }, { "asrc": "denghuiying:189:afb14b", "bsrc": "denghuiying:189:5d759e", "csrc": "denghuiying:189:d97261", "line": { "color": "red", "width": 2 }, "mode": "lines", "type": "scatterternary" }, { "asrc": "denghuiying:189:be07c5", "bsrc": "denghuiying:189:5a523c", "csrc": "denghuiying:189:35c334", "line": { "color": "red", "width": 2 }, "mode": "lines", "type": "scatterternary" }, { "asrc": "denghuiying:189:ff825c", "bsrc": "denghuiying:189:3404fe", "csrc": "denghuiying:189:11566c", "line": { "color": "red", "width": 2 }, "mode": "lines", "type": "scatterternary" }, { "asrc": "denghuiying:189:f37960", "bsrc": "denghuiying:189:7715fe", "csrc": "denghuiying:189:2033eb", "line": { "color": "red", "width": 2 }, "mode": "lines", "type": "scatterternary" }, { "asrc": "denghuiying:189:d479f4", "bsrc": "denghuiying:189:bfa3c7", "csrc": "denghuiying:189:4a6f94", "line": { "color": "red", "width": 2 }, "mode": "lines", "type": "scatterternary" }, { "asrc": "denghuiying:189:f694d3", "bsrc": "denghuiying:189:a6ee37", "csrc": "denghuiying:189:dabae8", "line": { "color": "red", "width": 2 }, "mode": "lines", "type": "scatterternary" }, { "asrc": "denghuiying:189:5e8cf1", "bsrc": "denghuiying:189:de9f5d", "csrc": "denghuiying:189:8152e2", "line": { "color": "red", "width": 2 }, "mode": "lines", "type": "scatterternary" }, { "asrc": "denghuiying:189:cf40a8", "bsrc": "denghuiying:189:d27c29", "csrc": "denghuiying:189:dc1f5a", "line": { "color": "red", "width": 2 }, "mode": "lines", "type": "scatterternary" }, { "asrc": "denghuiying:189:4b079a", "bsrc": "denghuiying:189:4f6f49", "csrc": "denghuiying:189:6d3a0b", "line": { "color": "red", "width": 2 }, "mode": "lines", "type": "scatterternary" }, { "asrc": "denghuiying:189:ba9142", "bsrc": "denghuiying:189:99097d", "csrc": "denghuiying:189:60b54a", "line": { "color": "red", "width": 2 }, "mode": "lines", "type": "scatterternary" }, { "asrc": "denghuiying:189:a7f25b", "bsrc": "denghuiying:189:172721", "csrc": "denghuiying:189:37bf4c", "line": { "color": "red", "width": 2 }, "mode": "lines", "type": "scatterternary" }, { "asrc": "denghuiying:189:e0afba", "bsrc": "denghuiying:189:318d7f", "csrc": "denghuiying:189:235d7b", "mode": "markers", "name": "reactions", "type": "scatterternary", "marker": { "color": "blue", "symbol": "circle" }, "textsrc": "denghuiying:189:e784ce" }, { "asrc": "denghuiying:189:95d8f9", "bsrc": "denghuiying:189:92ffbd", "csrc": "denghuiying:189:431074", "mode": "markers", "type": "scatterternary", "marker": { "color": "green", "symbol": "circle" }, "textsrc": "denghuiying:189:57f56c" }, { "asrc": "denghuiying:189:15a9f2", "bsrc": "denghuiying:189:502cb8", "csrc": "denghuiying:189:094a98", "fill": "toself", "line": { "color": "blue", "width": 0 }, "mode": "lines", "name": "nan", "type": "scatterternary", "textsrc": "denghuiying:189:c4c593" }, { "asrc": "denghuiying:189:9dd12c", "bsrc": "denghuiying:189:2cf57e", "csrc": "denghuiying:189:2f99fa", "fill": "toself", "line": { "color": "blue", "width": 0 }, "mode": "lines", "name": "Triangle 1", "type": "scatterternary", "textsrc": "denghuiying:189:73ae1b" }, { "asrc": "denghuiying:189:d8e803", "bsrc": "denghuiying:189:b73813", "csrc": "denghuiying:189:0bee67", "fill": "toself", "line": { "color": "blue", "width": 0 }, "mode": "lines", "name": "Triangle 2", "type": "scatterternary", "textsrc": "denghuiying:189:4d54e8" }, { "asrc": "denghuiying:189:87b4f3", "bsrc": "denghuiying:189:629eb0", "csrc": "denghuiying:189:6c6dfa", "fill": "toself", "line": { "color": "blue", "width": 0 }, "mode": "lines", "name": "Triangle 3", "type": "scatterternary", "textsrc": "denghuiying:189:aaacf1" }, { "asrc": "denghuiying:189:6dc1b1", "bsrc": "denghuiying:189:09db07", "csrc": "denghuiying:189:517c1d", "fill": "toself", "line": { "color": "blue", "width": 0 }, "mode": "lines", "name": "Triangle 4", "type": "scatterternary", "textsrc": "denghuiying:189:d99456" }, { "asrc": "denghuiying:189:cfd2d2", "bsrc": "denghuiying:189:7e7a99", "csrc": "denghuiying:189:29e017", "fill": "toself", "line": { "color": "blue", "width": 0 }, "mode": "lines", "name": "Triangle 5", "type": "scatterternary", "textsrc": "denghuiying:189:eeab26" }, { "asrc": "denghuiying:189:0fee2a", "bsrc": "denghuiying:189:fbb0fe", "csrc": "denghuiying:189:c804d6", "fill": "toself", "line": { "color": "blue", "width": 0 }, "mode": "lines", "name": "Triangle 6", "type": "scatterternary", "textsrc": "denghuiying:189:be9452" } ], "layout": { "ternary": { "sum": 100, "aaxis": { "dtick": 10, "title": { "font": { "size": 20 }, "text": "Fe" }, "ticklen": 10, "showgrid": true, "showline": true, "tickfont": { "size": 15 }, "gridcolor": "rgba(0,0,0,0.3)", "linecolor": "rgba(0,0,0,0.3)", "tickangle": 0, "tickcolor": "black" }, "baxis": { "dtick": 10, "title": { "font": { "size": 20 }, "text": "<br>Al" }, "ticklen": 10, "showgrid": true, "showline": true, "tickfont": { "size": 15 }, "gridcolor": "rgba(0,0,0,0.3)", "linecolor": "rgba(0,0,0,0.3)", "tickangle": 45, "tickcolor": "black" }, "caxis": { "dtick": 10, "title": { "font": { "size": 20 }, "text": "<br>Ti" }, "ticklen": 10, "showgrid": true, "showline": true, "tickfont": { "size": 15 }, "gridcolor": "rgba(0,0,0,0.3)", "linecolor": "rgba(0,0,0,0.3)", "tickangle": -45, "tickcolor": "black" }, "bgcolor": "white" }, "template": { "data": { "bar": [ { "type": "bar", "marker": { "line": { "color": "#E5ECF6", "width": 0.5 }, "pattern": { "size": 10, "fillmode": "overlay", "solidity": 0.2 } }, "error_x": { "color": "#2a3f5f" }, "error_y": { "color": "#2a3f5f" } } ], "pie": [ { "type": "pie", "automargin": true } ], "table": [ { "type": "table", "cells": { "fill": { "color": "#EBF0F8" }, "line": { "color": "white" } }, "header": { "fill": { "color": "#C8D4E3" }, "line": { "color": "white" } } } ], "carpet": [ { "type": "carpet", "aaxis": { "gridcolor": "white", "linecolor": "white", "endlinecolor": "#2a3f5f", "minorgridcolor": "white", "startlinecolor": "#2a3f5f" }, "baxis": { "gridcolor": "white", "linecolor": "white", "endlinecolor": "#2a3f5f", "minorgridcolor": "white", "startlinecolor": "#2a3f5f" } } ], "mesh3d": [ { "type": "mesh3d", "colorbar": { "ticks": "", "outlinewidth": 0 } } ], "contour": [ { "type": "contour", "colorbar": { "ticks": "", "outlinewidth": 0 }, "colorscale": [ [ 0.0, "#0d0887" ], [ 0.1111111111111111, "#46039f" ], [ 0.2222222222222222, "#7201a8" ], [ 0.3333333333333333, "#9c179e" ], [ 0.4444444444444444, "#bd3786" ], [ 0.5555555555555556, "#d8576b" ], [ 0.6666666666666666, "#ed7953" ], [ 0.7777777777777778, "#fb9f3a" ], [ 0.8888888888888888, "#fdca26" ], [ 1.0, "#f0f921" ] ] } ], "heatmap": [ { "type": "heatmap", "colorbar": { "ticks": "", "outlinewidth": 0 }, "colorscale": [ [ 0.0, "#0d0887" ], [ 0.1111111111111111, "#46039f" ], [ 0.2222222222222222, "#7201a8" ], [ 0.3333333333333333, "#9c179e" ], [ 0.4444444444444444, "#bd3786" ], [ 0.5555555555555556, "#d8576b" ], [ 0.6666666666666666, "#ed7953" ], [ 0.7777777777777778, "#fb9f3a" ], [ 0.8888888888888888, "#fdca26" ], [ 1.0, "#f0f921" ] ] } ], "scatter": [ { "type": "scatter", "fillpattern": { "size": 10, "fillmode": "overlay", "solidity": 0.2 } } ], "surface": [ { "type": "surface", "colorbar": { "ticks": "", "outlinewidth": 0 }, "colorscale": [ [ 0.0, "#0d0887" ], [ 0.1111111111111111, "#46039f" ], [ 0.2222222222222222, "#7201a8" ], [ 0.3333333333333333, "#9c179e" ], [ 0.4444444444444444, "#bd3786" ], [ 0.5555555555555556, "#d8576b" ], [ 0.6666666666666666, "#ed7953" ], [ 0.7777777777777778, "#fb9f3a" ], [ 0.8888888888888888, "#fdca26" ], [ 1.0, "#f0f921" ] ] } ], "barpolar": [ { "type": "barpolar", "marker": { "line": { "color": "#E5ECF6", "width": 0.5 }, "pattern": { "size": 10, "fillmode": "overlay", "solidity": 0.2 } } } ], "heatmapgl": [ { "type": "heatmapgl", "colorbar": { "ticks": "", "outlinewidth": 0 }, "colorscale": [ [ 0.0, "#0d0887" ], [ 0.1111111111111111, "#46039f" ], [ 0.2222222222222222, "#7201a8" ], [ 0.3333333333333333, "#9c179e" ], [ 0.4444444444444444, "#bd3786" ], [ 0.5555555555555556, "#d8576b" ], [ 0.6666666666666666, "#ed7953" ], [ 0.7777777777777778, "#fb9f3a" ], [ 0.8888888888888888, "#fdca26" ], [ 1.0, "#f0f921" ] ] } ], "histogram": [ { "type": "histogram", "marker": { "pattern": { "size": 10, "fillmode": "overlay", "solidity": 0.2 } } } ], "parcoords": [ { "line": { "colorbar": { "ticks": "", "outlinewidth": 0 } }, "type": "parcoords" } ], "scatter3d": [ { "line": { "colorbar": { "ticks": "", "outlinewidth": 0 } }, "type": "scatter3d", "marker": { "colorbar": { "ticks": "", "outlinewidth": 0 } } } ], "scattergl": [ { "type": "scattergl", "marker": { "colorbar": { "ticks": "", "outlinewidth": 0 } } } ], "choropleth": [ { "type": "choropleth", "colorbar": { "ticks": "", "outlinewidth": 0 } } ], "scattergeo": [ { "type": "scattergeo", "marker": { "colorbar": { "ticks": "", "outlinewidth": 0 } } } ], "histogram2d": [ { "type": "histogram2d", "colorbar": { "ticks": "", "outlinewidth": 0 }, "colorscale": [ [ 0.0, "#0d0887" ], [ 0.1111111111111111, "#46039f" ], [ 0.2222222222222222, "#7201a8" ], [ 0.3333333333333333, "#9c179e" ], [ 0.4444444444444444, "#bd3786" ], [ 0.5555555555555556, "#d8576b" ], [ 0.6666666666666666, "#ed7953" ], [ 0.7777777777777778, "#fb9f3a" ], [ 0.8888888888888888, "#fdca26" ], [ 1.0, "#f0f921" ] ] } ], "scatterpolar": [ { "type": "scatterpolar", "marker": { "colorbar": { "ticks": "", "outlinewidth": 0 } } } ], "contourcarpet": [ { "type": "contourcarpet", "colorbar": { "ticks": "", "outlinewidth": 0 } } ], "scattercarpet": [ { "type": "scattercarpet", "marker": { "colorbar": { "ticks": "", "outlinewidth": 0 } } } ], "scattermapbox": [ { "type": "scattermapbox", "marker": { "colorbar": { "ticks": "", "outlinewidth": 0 } } } ], "scatterpolargl": [ { "type": "scatterpolargl", "marker": { "colorbar": { "ticks": "", "outlinewidth": 0 } } } ], "scatterternary": [ { "type": "scatterternary", "marker": { "colorbar": { "ticks": "", "outlinewidth": 0 } } } ], "histogram2dcontour": [ { "type": "histogram2dcontour", "colorbar": { "ticks": "", "outlinewidth": 0 }, "colorscale": [ [ 0.0, "#0d0887" ], [ 0.1111111111111111, "#46039f" ], [ 0.2222222222222222, "#7201a8" ], [ 0.3333333333333333, "#9c179e" ], [ 0.4444444444444444, "#bd3786" ], [ 0.5555555555555556, "#d8576b" ], [ 0.6666666666666666, "#ed7953" ], [ 0.7777777777777778, "#fb9f3a" ], [ 0.8888888888888888, "#fdca26" ], [ 1.0, "#f0f921" ] ] } ] }, "layout": { "geo": { "bgcolor": "white", "showland": true, "lakecolor": "white", "landcolor": "#E5ECF6", "showlakes": true, "subunitcolor": "white" }, "font": { "color": "#2a3f5f" }, "polar": { "bgcolor": "#E5ECF6", "radialaxis": { "ticks": "", "gridcolor": "white", "linecolor": "white" }, "angularaxis": { "ticks": "", "gridcolor": "white", "linecolor": "white" } }, "scene": { "xaxis": { "ticks": "", "gridcolor": "white", "gridwidth": 2, "linecolor": "white", "zerolinecolor": "white", "showbackground": true, "backgroundcolor": "#E5ECF6" }, "yaxis": { "ticks": "", "gridcolor": "white", "gridwidth": 2, "linecolor": "white", "zerolinecolor": "white", "showbackground": true, "backgroundcolor": "#E5ECF6" }, "zaxis": { "ticks": "", "gridcolor": "white", "gridwidth": 2, "linecolor": "white", "zerolinecolor": "white", "showbackground": true, "backgroundcolor": "#E5ECF6" } }, "title": { "x": 0.05 }, "xaxis": { "ticks": "", "title": { "standoff": 15 }, "gridcolor": "white", "linecolor": "white", "automargin": true, "zerolinecolor": "white", "zerolinewidth": 2 }, "yaxis": { "ticks": "", "title": { "standoff": 15 }, "gridcolor": "white", "linecolor": "white", "automargin": true, "zerolinecolor": "white", "zerolinewidth": 2 }, "mapbox": { "style": "light" }, "ternary": { "aaxis": { "ticks": "", "gridcolor": "white", "linecolor": "white" }, "baxis": { "ticks": "", "gridcolor": "white", "linecolor": "white" }, "caxis": { "ticks": "", "gridcolor": "white", "linecolor": "white" }, "bgcolor": "#E5ECF6" }, "colorway": [ "#636efa", "#EF553B", "#00cc96", "#ab63fa", "#FFA15A", "#19d3f3", "#FF6692", "#B6E880", "#FF97FF", "#FECB52" ], "coloraxis": { "colorbar": { "ticks": "", "outlinewidth": 0 } }, "hovermode": "closest", "colorscale": { "diverging": [ [ 0, "#8e0152" ], [ 0.1, "#c51b7d" ], [ 0.2, "#de77ae" ], [ 0.3, "#f1b6da" ], [ 0.4, "#fde0ef" ], [ 0.5, "#f7f7f7" ], [ 0.6, "#e6f5d0" ], [ 0.7, "#b8e186" ], [ 0.8, "#7fbc41" ], [ 0.9, "#4d9221" ], [ 1, "#276419" ] ], "sequential": [ [ 0.0, "#0d0887" ], [ 0.1111111111111111, "#46039f" ], [ 0.2222222222222222, "#7201a8" ], [ 0.3333333333333333, "#9c179e" ], [ 0.4444444444444444, "#bd3786" ], [ 0.5555555555555556, "#d8576b" ], [ 0.6666666666666666, "#ed7953" ], [ 0.7777777777777778, "#fb9f3a" ], [ 0.8888888888888888, "#fdca26" ], [ 1.0, "#f0f921" ] ], "sequentialminus": [ [ 0.0, "#0d0887" ], [ 0.1111111111111111, "#46039f" ], [ 0.2222222222222222, "#7201a8" ], [ 0.3333333333333333, "#9c179e" ], [ 0.4444444444444444, "#bd3786" ], [ 0.5555555555555556, "#d8576b" ], [ 0.6666666666666666, "#ed7953" ], [ 0.7777777777777778, "#fb9f3a" ], [ 0.8888888888888888, "#fdca26" ], [ 1.0, "#f0f921" ] ] }, "hoverlabel": { "align": "left" }, "plot_bgcolor": "#E5ECF6", "paper_bgcolor": "white", "shapedefaults": { "line": { "color": "#2a3f5f" } }, "autotypenumbers": "strict", "annotationdefaults": { "arrowhead": 0, "arrowcolor": "#2a3f5f", "arrowwidth": 1 } } } } }, "height": null, "width": null, "user": { "profile_url": "https://chart-studio.plotly.com/~denghuiying", "avatar_url": "https://storage.googleapis.com/plotly-prod-profiles/47.jpg", "background_url": "https://storage.googleapis.com/plotly-prod-profiles/bg-6.jpg", "bio": "", "nickname": "", "website": "", "stream_tokens": null, "feature_set_id": null, "csrf_token": null, "date_joined": "2024-02-28 14:32:56", "mapbox_access_tokens": null, "has_password": null, "username": "denghuiying", "email": null, "is_active": null, "readonly": null, "is_dash_creator": null, "dash_created_count": null, "is_chart_creator": null, "charts_created_count": null } }, { "creation_time": "2024-04-09T13:37:28.050264Z", "comments": { "results": [], "count": 0 }, "parented": true, "embed_url": "https://chart-studio.plotly.com/~denghuiying/188.embed", "fid": "denghuiying:188", "filename": "Plot 188", "filetype": "plot", "img_url": "https://storage.googleapis.com/plotly-prod-images/denghuiying/188/9_ITY615OIYF0JM9WT1YTZD0KK5KXREI.png", "image_urls": { "default": "https://storage.googleapis.com/plotly-prod-images/denghuiying/188/2_7L9A99737ED3XPVDZGOL32JBTRQHYA.png", "block-thumb": "https://storage.googleapis.com/plotly-prod-images/denghuiying/188/8_WFMSRGYE4KY0T7ZKQL8XI7HKV1KXY6.png", "list-thumb": "https://storage.googleapis.com/plotly-prod-images/denghuiying/188/9_ITY615OIYF0JM9WT1YTZD0KK5KXREI.png" }, "api_urls": { "files": "https://api.plotly.com/v2/files/denghuiying:188", "plots": "https://api.plotly.com/v2/plots/denghuiying:188", "parent": "https://api.plotly.com/v2/folders/home?user=denghuiying" }, "owner": "denghuiying", "parent": -1, "preview": "", "referencers": [], "references": [], "title": "", "views": 5, "web_url": "https://chart-studio.plotly.com/~denghuiying/188/", "world_readable": true, "date_modified": "2024-04-09T13:37:28.061Z", "stars": { "results": [], "count": 0 }, "collaborators": { "results": [], "count": 0 }, "subfolder_count": null, "refresh_interval": null, "organize_view_url": "https://chart-studio.plotly.com/~denghuiying/188/", "current_user_permission": "read", "is_theme": null, "is_template": null, "autosize": true, "caption": "", "figure": { "data": [ { "asrc": "denghuiying:187:6f9101", "bsrc": "denghuiying:187:fbcbdb", "csrc": "denghuiying:187:d552ad", "fill": "toself", "line": { "shape": "spline", "width": 0 }, "mode": "lines", "name": "nan", "type": "scatterternary", "textsrc": "denghuiying:187:155bbd" }, { "asrc": "denghuiying:187:18ba1b", "bsrc": "denghuiying:187:75e909", "csrc": "denghuiying:187:ef3f38", "fill": "toself", "line": { "shape": "spline", "width": 0 }, "mode": "lines", "name": "δFe", "type": "scatterternary", "textsrc": "denghuiying:187:945437" }, { "asrc": "denghuiying:187:761d37", "bsrc": "denghuiying:187:4f02ac", "csrc": "denghuiying:187:96cd18", "fill": "toself", "line": { "shape": "spline", "width": 0 }, "mode": "lines", "name": "εNbFe2", "type": "scatterternary", "textsrc": "denghuiying:187:2a140c" }, { "asrc": "denghuiying:187:a7d6af", "bsrc": "denghuiying:187:74b974", "csrc": "denghuiying:187:17f15b", "fill": "toself", "line": { "shape": "spline", "width": 0 }, "mode": "lines", "name": "μFeNb", "type": "scatterternary", "textsrc": "denghuiying:187:38763e" }, { "asrc": "denghuiying:187:c40867", "bsrc": "denghuiying:187:db4c20", "csrc": "denghuiying:187:2eccd3", "fill": "toself", "line": { "shape": "spline", "width": 0 }, "mode": "lines", "name": "Nb", "type": "scatterternary", "textsrc": "denghuiying:187:3dfb60" }, { "asrc": "denghuiying:187:1dd7c3", "bsrc": "denghuiying:187:01d4cb", "csrc": "denghuiying:187:ac7582", "fill": "toself", "line": { "shape": "spline", "width": 0 }, "mode": "lines", "name": "Nb3Si", "type": "scatterternary", "textsrc": "denghuiying:187:99f32e" }, { "asrc": "denghuiying:187:dad716", "bsrc": "denghuiying:187:24d14b", "csrc": "denghuiying:187:6077ec", "fill": "toself", "line": { "shape": "spline", "width": 0 }, "mode": "lines", "name": "βNb5Si3", "type": "scatterternary", "textsrc": "denghuiying:187:8933c4" }, { "asrc": "denghuiying:187:9c10a5", "bsrc": "denghuiying:187:23cf31", "csrc": "denghuiying:187:9146c0", "fill": "toself", "line": { "shape": "spline", "width": 0 }, "mode": "lines", "name": "NbSi2", "type": "scatterternary", "textsrc": "denghuiying:187:1ee244" }, { "asrc": "denghuiying:187:b29e33", "bsrc": "denghuiying:187:5c95b7", "csrc": "denghuiying:187:09ddd9", "fill": "toself", "line": { "shape": "spline", "width": 0 }, "mode": "lines", "name": "Si", "type": "scatterternary", "textsrc": "denghuiying:187:edae34" }, { "asrc": "denghuiying:187:7e36f3", "bsrc": "denghuiying:187:fe7198", "csrc": "denghuiying:187:add102", "fill": "toself", "line": { "shape": "spline", "width": 0 }, "mode": "lines", "name": "Fe3Si7", "type": "scatterternary", "textsrc": "denghuiying:187:cde9b5" }, { "asrc": "denghuiying:187:0153de", "bsrc": "denghuiying:187:9fc2e6", "csrc": "denghuiying:187:c3af36", "fill": "toself", "line": { "shape": "spline", "width": 0 }, "mode": "lines", "name": "FeSi", "type": "scatterternary", "textsrc": "denghuiying:187:fd6c0a" }, { "asrc": "denghuiying:187:a58826", "bsrc": "denghuiying:187:dfc2e9", "csrc": "denghuiying:187:fed07e", "fill": "toself", "line": { "shape": "spline", "width": 0 }, "mode": "lines", "name": "Fe2Si", "type": "scatterternary", "textsrc": "denghuiying:187:5de54c" }, { "asrc": "denghuiying:187:84303e", "bsrc": "denghuiying:187:44dd75", "csrc": "denghuiying:187:5ed7a9", "fill": "toself", "line": { "shape": "spline", "width": 0 }, "mode": "lines", "name": "BCC_B2(Fe)", "type": "scatterternary", "textsrc": "denghuiying:187:02b335" }, { "asrc": "denghuiying:187:6a3cff", "bsrc": "denghuiying:187:9eeeac", "csrc": "denghuiying:187:f55aaf", "fill": "toself", "line": { "shape": "spline", "width": 0 }, "mode": "lines", "name": "t1(NbFeSi2)", "type": "scatterternary", "textsrc": "denghuiying:187:fcdfde" }, { "asrc": "denghuiying:187:40ffa6", "bsrc": "denghuiying:187:b107c3", "csrc": "denghuiying:187:0cca49", "fill": "toself", "line": { "shape": "spline", "width": 0 }, "mode": "lines", "name": "t2(Nb2FeSi2)", "type": "scatterternary", "textsrc": "denghuiying:187:b5cc04" }, { "asrc": "denghuiying:187:e3f3df", "bsrc": "denghuiying:187:184b63", "csrc": "denghuiying:187:1240e6", "fill": "toself", "line": { "shape": "spline", "width": 0 }, "mode": "lines", "name": "t3(Nb4Fe3Si5)", "type": "scatterternary", "textsrc": "denghuiying:187:736d3e" }, { "asrc": "denghuiying:187:c03ea2", "bsrc": "denghuiying:187:d94d2e", "csrc": "denghuiying:187:a798e5", "fill": "toself", "line": { "shape": "spline", "width": 0 }, "mode": "lines", "name": "t4(Nb4FeSi)", "type": "scatterternary", "textsrc": "denghuiying:187:a3e6ae" }, { "asrc": "denghuiying:187:56997d", "bsrc": "denghuiying:187:da4db2", "csrc": "denghuiying:187:c0ca9d", "fill": "toself", "line": { "shape": "spline", "width": 0 }, "mode": "lines", "name": "t5(Nb4Fe4Si7)", "type": "scatterternary", "textsrc": "denghuiying:187:1cf5f3" }, { "asrc": "denghuiying:187:3d9a1a", "bsrc": "denghuiying:187:99f2c1", "csrc": "denghuiying:187:15ade9", "fill": "toself", "line": { "shape": "spline", "width": 0 }, "mode": "lines", "name": "t6(NbFeSi)", "type": "scatterternary", "textsrc": "denghuiying:187:5d4499" }, { "asrc": "denghuiying:187:67777d", "bsrc": "denghuiying:187:091ecc", "csrc": "denghuiying:187:0eb954", "fill": "toself", "line": { "shape": "spline", "width": 0 }, "mode": "lines", "name": "εNbFe2+Nb4FeSi+αNb5Si3", "type": "scatterternary", "textsrc": "denghuiying:187:d2674c" }, { "asrc": "denghuiying:187:4c6599", "bsrc": "denghuiying:187:65ea3f", "csrc": "denghuiying:187:5f497d", "fill": "toself", "line": { "shape": "spline", "width": 0 }, "mode": "lines", "name": "Nb4FeSi+BCC_A2+Nb3Si", "type": "scatterternary", "textsrc": "denghuiying:187:266108" }, { "asrc": "denghuiying:187:8441a2", "bsrc": "denghuiying:187:c2662c", "csrc": "denghuiying:187:226e01", "fill": "toself", "line": { "shape": "spline", "width": 0 }, "mode": "lines", "name": "NbSi2+t2+βNb5Si3", "type": "scatterternary", "textsrc": "denghuiying:187:d685e4" }, { "asrc": "denghuiying:187:577989", "bsrc": "denghuiying:187:b05975", "csrc": "denghuiying:187:b629b8", "fill": "toself", "line": { "shape": "spline", "width": 0 }, "mode": "lines", "name": "NbSi2+(Si)+Fe3Si7", "type": "scatterternary", "textsrc": "denghuiying:187:6b68d7" }, { "asrc": "denghuiying:187:dc39aa", "bsrc": "denghuiying:187:8a8e30", "csrc": "denghuiying:187:ff0ac8", "fill": "toself", "line": { "shape": "spline", "width": 0 }, "mode": "lines", "name": "FeSi+NbSi2+Fe3Si7", "type": "scatterternary", "textsrc": "denghuiying:187:5b4e8c" }, { "asrc": "denghuiying:187:5ae8c5", "bsrc": "denghuiying:187:2623a9", "csrc": "denghuiying:187:127347", "fill": "toself", "line": { "shape": "spline", "width": 0 }, "mode": "lines", "name": "FeSi+t6+Fe2Si", "type": "scatterternary", "textsrc": "denghuiying:187:5b2c26" }, { "asrc": "denghuiying:187:cc8b9c", "bsrc": "denghuiying:187:e7ef60", "csrc": "denghuiying:187:d261dd", "fill": "toself", "line": { "shape": "spline", "width": 0 }, "mode": "lines", "name": "εNbFe2+βNb5Si3+t2", "type": "scatterternary", "textsrc": "denghuiying:187:73f11f" }, { "asrc": "denghuiying:187:fd3d3f", "bsrc": "denghuiying:187:f66c48", "csrc": "denghuiying:187:ab6dd1", "fill": "toself", "line": { "shape": "spline", "width": 0 }, "mode": "lines", "name": "t2+εNbFe2+t6", "type": "scatterternary", "textsrc": "denghuiying:187:9ea09a" }, { "asrc": "denghuiying:187:a699ca", "bsrc": "denghuiying:187:d2d135", "csrc": "denghuiying:187:e12ef1", "fill": "toself", "line": { "shape": "spline", "width": 0 }, "mode": "lines", "name": "εNbFe2+μFeNb+t4", "type": "scatterternary", "textsrc": "denghuiying:187:29419e" }, { "asrc": "denghuiying:187:2fddd2", "bsrc": "denghuiying:187:b0706a", "csrc": "denghuiying:187:1d766f", "fill": "toself", "line": { "shape": "spline", "width": 0 }, "mode": "lines", "name": "t3+NbSi2+t5", "type": "scatterternary", "textsrc": "denghuiying:187:b7e424" }, { "asrc": "denghuiying:187:3a3e48", "bsrc": "denghuiying:187:0e99ca", "csrc": "denghuiying:187:b93d27", "fill": "toself", "line": { "shape": "spline", "width": 0 }, "mode": "lines", "name": "t5+NbSi2+t2", "type": "scatterternary", "textsrc": "denghuiying:187:31317a" }, { "asrc": "denghuiying:187:6208b0", "bsrc": "denghuiying:187:7270a2", "csrc": "denghuiying:187:04a6c6", "fill": "toself", "line": { "shape": "spline", "width": 0 }, "mode": "lines", "name": "εNbFe2+βNb5Si3+αNb5Si3", "type": "scatterternary", "textsrc": "denghuiying:187:f3a0a3" }, { "asrc": "denghuiying:187:fc2849", "bsrc": "denghuiying:187:1be9a9", "csrc": "denghuiying:187:490f07", "fill": "toself", "line": { "shape": "spline", "width": 0 }, "mode": "lines", "name": "βNb5Si3+αNb5Si3+Nb3Si", "type": "scatterternary", "textsrc": "denghuiying:187:2e5fb7" }, { "asrc": "denghuiying:187:a6b54b", "bsrc": "denghuiying:187:f6f1da", "csrc": "denghuiying:187:12e9e4", "fill": "toself", "line": { "shape": "spline", "width": 0 }, "mode": "lines", "name": "αNb5Si3+Nb3Si+t4", "type": "scatterternary", "textsrc": "denghuiying:187:52ff60" }, { "asrc": "denghuiying:187:8257ce", "bsrc": "denghuiying:187:f15789", "csrc": "denghuiying:187:05754a", "fill": "toself", "line": { "shape": "spline", "width": 0 }, "mode": "lines", "name": "t2+NbSi2+t3", "type": "scatterternary", "textsrc": "denghuiying:187:c8b2f9" }, { "asrc": "denghuiying:187:c9d361", "bsrc": "denghuiying:187:6409e7", "csrc": "denghuiying:187:a887bd", "fill": "toself", "line": { "shape": "spline", "width": 0 }, "mode": "lines", "name": "t2+t6+t3", "type": "scatterternary", "textsrc": "denghuiying:187:e68045" }, { "asrc": "denghuiying:187:0d27b0", "bsrc": "denghuiying:187:bc70c8", "csrc": "denghuiying:187:d9be55", "fill": "toself", "line": { "shape": "spline", "width": 0 }, "mode": "lines", "name": "t4+Bcc_A2+μFeNb", "type": "scatterternary", "textsrc": "denghuiying:187:a5c331" }, { "asrc": "denghuiying:187:bee2d1", "bsrc": "denghuiying:187:b5a6de", "csrc": "denghuiying:187:56b1c0", "fill": "toself", "line": { "shape": "spline", "width": 0 }, "mode": "lines", "name": "t3+t6+t5", "type": "scatterternary", "textsrc": "denghuiying:187:238735" }, { "asrc": "denghuiying:187:378eb5", "bsrc": "denghuiying:187:a3b7f4", "csrc": "denghuiying:187:28ac22", "fill": "toself", "line": { "shape": "spline", "width": 0 }, "mode": "lines", "name": "t1+FeSi+NbSi2", "type": "scatterternary", "textsrc": "denghuiying:187:e4574a" }, { "asrc": "denghuiying:187:b23e01", "bsrc": "denghuiying:187:01ad00", "csrc": "denghuiying:187:b742b7", "fill": "toself", "line": { "shape": "spline", "width": 0 }, "mode": "lines", "name": "t1+FeSi+t5", "type": "scatterternary", "textsrc": "denghuiying:187:fa4d6a" }, { "asrc": "denghuiying:187:dff0b7", "bsrc": "denghuiying:187:68cba6", "csrc": "denghuiying:187:3ede37", "fill": "toself", "line": { "shape": "spline", "width": 0 }, "mode": "lines", "name": "t5+FeSi+t6", "type": "scatterternary", "textsrc": "denghuiying:187:a0b389" }, { "asrc": "denghuiying:187:50f16a", "bsrc": "denghuiying:187:bd7335", "csrc": "denghuiying:187:8d3f39", "fill": "toself", "line": { "shape": "spline", "width": 0 }, "mode": "lines", "name": "εNbFe2+Fe2Si+t6", "type": "scatterternary", "textsrc": "denghuiying:187:681261" }, { "asrc": "denghuiying:187:e1c460", "bsrc": "denghuiying:187:14c741", "csrc": "denghuiying:187:c96908", "mode": "markers", "name": "phases #1", "text": "phases #1", "type": "scatterternary", "marker": { "symbol": "triangle-up" } }, { "asrc": "denghuiying:187:c6e61e", "bsrc": "denghuiying:187:0cb09b", "csrc": "denghuiying:187:24bb97", "mode": "markers", "name": "phases #2", "text": "phases #2", "type": "scatterternary", "marker": { "symbol": "triangle-up" } }, { "asrc": "denghuiying:187:9377ab", "bsrc": "denghuiying:187:7b0412", "csrc": "denghuiying:187:b6ce5d", "mode": "markers", "name": "phases #3", "text": "phases #3", "type": "scatterternary", "marker": { "symbol": "triangle-up" } }, { "asrc": "denghuiying:187:f13d60", "bsrc": "denghuiying:187:25a4f8", "csrc": "denghuiying:187:ade353", "mode": "markers", "name": "phases #4", "text": "phases #4", "type": "scatterternary", "marker": { "symbol": "triangle-up" } }, { "asrc": "denghuiying:187:14582a", "bsrc": "denghuiying:187:8a018f", "csrc": "denghuiying:187:56a38c", "mode": "markers", "name": "phases #5", "text": "phases #5", "type": "scatterternary", "marker": { "symbol": "triangle-up" } }, { "asrc": "denghuiying:187:514449", "bsrc": "denghuiying:187:58d4f4", "csrc": "denghuiying:187:dc782b", "line": { "color": "red", "width": 2 }, "mode": "lines", "type": "scatterternary" }, { "asrc": "denghuiying:187:f15767", "bsrc": "denghuiying:187:e83d03", "csrc": "denghuiying:187:c387b9", "line": { "color": "red", "width": 2 }, "mode": "lines", "type": "scatterternary" }, { "asrc": "denghuiying:187:6d92ea", "bsrc": "denghuiying:187:5c02f4", "csrc": "denghuiying:187:1eacc6", "line": { "color": "red", "width": 2 }, "mode": "lines", "type": "scatterternary" }, { "asrc": "denghuiying:187:f0e18a", "bsrc": "denghuiying:187:728d58", "csrc": "denghuiying:187:4c4f99", "line": { "color": "red", "width": 2 }, "mode": "lines", "type": "scatterternary" }, { "asrc": "denghuiying:187:c60838", "bsrc": "denghuiying:187:08e0a6", "csrc": "denghuiying:187:d3ba38", "line": { "color": "red", "width": 2 }, "mode": "lines", "type": "scatterternary" }, { "asrc": "denghuiying:187:a82595", "bsrc": "denghuiying:187:379880", "csrc": "denghuiying:187:0d8f8b", "line": { "color": "red", "width": 2 }, "mode": "lines", "type": "scatterternary" }, { "asrc": "denghuiying:187:512f08", "bsrc": "denghuiying:187:0f7725", "csrc": "denghuiying:187:460ebd", "line": { "color": "red", "width": 2 }, "mode": "lines", "type": "scatterternary" }, { "asrc": "denghuiying:187:63f7bb", "bsrc": "denghuiying:187:fe0e06", "csrc": "denghuiying:187:0097e6", "line": { "color": "red", "width": 2 }, "mode": "lines", "type": "scatterternary" }, { "asrc": "denghuiying:187:ee4ad4", "bsrc": "denghuiying:187:4dd4b9", "csrc": "denghuiying:187:a57ca5", "line": { "color": "red", "width": 2 }, "mode": "lines", "type": "scatterternary" }, { "asrc": "denghuiying:187:2f1fe0", "bsrc": "denghuiying:187:985d23", "csrc": "denghuiying:187:2f336d", "line": { "color": "red", "width": 2 }, "mode": "lines", "type": "scatterternary" }, { "asrc": "denghuiying:187:d4e66c", "bsrc": "denghuiying:187:5ccc18", "csrc": "denghuiying:187:c38402", "line": { "color": "red", "width": 2 }, "mode": "lines", "type": "scatterternary" }, { "asrc": "denghuiying:187:9cacee", "bsrc": "denghuiying:187:323176", "csrc": "denghuiying:187:91d401", "line": { "color": "red", "width": 2 }, "mode": "lines", "type": "scatterternary" }, { "asrc": "denghuiying:187:0bea07", "bsrc": "denghuiying:187:988c3f", "csrc": "denghuiying:187:d3bc3c", "line": { "color": "red", "width": 2 }, "mode": "lines", "type": "scatterternary" }, { "asrc": "denghuiying:187:845095", "bsrc": "denghuiying:187:e1af70", "csrc": "denghuiying:187:5601d6", "line": { "color": "red", "width": 2 }, "mode": "lines", "type": "scatterternary" }, { "asrc": "denghuiying:187:639347", "bsrc": "denghuiying:187:ec56bb", "csrc": "denghuiying:187:937811", "line": { "color": "red", "width": 2 }, "mode": "lines", "type": "scatterternary" }, { "asrc": "denghuiying:187:901857", "bsrc": "denghuiying:187:5fe05d", "csrc": "denghuiying:187:833cca", "line": { "color": "red", "width": 2 }, "mode": "lines", "type": "scatterternary" }, { "asrc": "denghuiying:187:4528f3", "bsrc": "denghuiying:187:bfcbf0", "csrc": "denghuiying:187:2d4230", "line": { "color": "red", "width": 2 }, "mode": "lines", "type": "scatterternary" }, { "asrc": "denghuiying:187:6ca0ea", "bsrc": "denghuiying:187:3893ac", "csrc": "denghuiying:187:15b69d", "line": { "color": "red", "width": 2 }, "mode": "lines", "type": "scatterternary" }, { "asrc": "denghuiying:187:5a1513", "bsrc": "denghuiying:187:326930", "csrc": "denghuiying:187:50de34", "line": { "color": "red", "width": 2 }, "mode": "lines", "type": "scatterternary" }, { "asrc": "denghuiying:187:4e5eaa", "bsrc": "denghuiying:187:d4ad9e", "csrc": "denghuiying:187:3220a0", "line": { "color": "red", "width": 2 }, "mode": "lines", "type": "scatterternary" }, { "asrc": "denghuiying:187:fa8d80", "bsrc": "denghuiying:187:a2b75d", "csrc": "denghuiying:187:5c9473", "line": { "color": "red", "width": 2 }, "mode": "lines", "type": "scatterternary" }, { "asrc": "denghuiying:187:e8985f", "bsrc": "denghuiying:187:c6381e", "csrc": "denghuiying:187:a27365", "line": { "color": "red", "width": 2 }, "mode": "lines", "type": "scatterternary" }, { "asrc": "denghuiying:187:bfe889", "bsrc": "denghuiying:187:f85b38", "csrc": "denghuiying:187:013bad", "line": { "color": "red", "width": 2 }, "mode": "lines", "type": "scatterternary" }, { "asrc": "denghuiying:187:187d53", "bsrc": "denghuiying:187:a58af1", "csrc": "denghuiying:187:4959f0", "line": { "color": "red", "width": 2 }, "mode": "lines", "type": "scatterternary" }, { "asrc": "denghuiying:187:4bc2e3", "bsrc": "denghuiying:187:5898e5", "csrc": "denghuiying:187:619b7b", "line": { "color": "red", "width": 2 }, "mode": "lines", "type": "scatterternary" }, { "asrc": "denghuiying:187:b91bfc", "bsrc": "denghuiying:187:89c2e8", "csrc": "denghuiying:187:0a0fc6", "line": { "color": "red", "width": 2 }, "mode": "lines", "type": "scatterternary" }, { "asrc": "denghuiying:187:2fd490", "bsrc": "denghuiying:187:1e380a", "csrc": "denghuiying:187:d97d18", "line": { "color": "red", "width": 2 }, "mode": "lines", "type": "scatterternary" }, { "asrc": "denghuiying:187:1ee5b2", "bsrc": "denghuiying:187:5a5a89", "csrc": "denghuiying:187:cf3685", "line": { "color": "red", "width": 2 }, "mode": "lines", "type": "scatterternary" }, { "asrc": "denghuiying:187:b65712", "bsrc": "denghuiying:187:31a82d", "csrc": "denghuiying:187:3a35ee", "line": { "color": "red", "width": 2 }, "mode": "lines", "type": "scatterternary" }, { "asrc": "denghuiying:187:340bd3", "bsrc": "denghuiying:187:6d32da", "csrc": "denghuiying:187:b6335f", "line": { "color": "red", "width": 2 }, "mode": "lines", "type": "scatterternary" }, { "asrc": "denghuiying:187:4dfb62", "bsrc": "denghuiying:187:2aa614", "csrc": "denghuiying:187:31931e", "line": { "color": "red", "width": 2 }, "mode": "lines", "type": "scatterternary" }, { "asrc": "denghuiying:187:a1090f", "bsrc": "denghuiying:187:e9f893", "csrc": "denghuiying:187:ae76a8", "line": { "color": "red", "width": 2 }, "mode": "lines", "type": "scatterternary" }, { "asrc": "denghuiying:187:75598d", "bsrc": "denghuiying:187:19dd8a", "csrc": "denghuiying:187:8f4ce5", "line": { "color": "red", "width": 2 }, "mode": "lines", "type": "scatterternary" }, { "asrc": "denghuiying:187:f13070", "bsrc": "denghuiying:187:a9a041", "csrc": "denghuiying:187:737393", "line": { "color": "red", "width": 2 }, "mode": "lines", "type": "scatterternary" }, { "asrc": "denghuiying:187:43fb32", "bsrc": "denghuiying:187:3edabb", "csrc": "denghuiying:187:a26732", "mode": "markers", "name": "reactions", "type": "scatterternary", "marker": { "color": "blue", "symbol": "circle" }, "textsrc": "denghuiying:187:ecff66" }, { "asrc": "denghuiying:187:0823a7", "bsrc": "denghuiying:187:561aa5", "csrc": "denghuiying:187:76f05d", "mode": "markers", "type": "scatterternary", "marker": { "color": "green", "symbol": "circle" }, "textsrc": "denghuiying:187:f7ddd2" }, { "asrc": "denghuiying:187:0266e9", "bsrc": "denghuiying:187:f78718", "csrc": "denghuiying:187:367345", "fill": "toself", "line": { "color": "blue", "width": 0 }, "mode": "lines", "name": "nan", "type": "scatterternary", "textsrc": "denghuiying:187:ce8b8d" }, { "asrc": "denghuiying:187:df810d", "bsrc": "denghuiying:187:e50e61", "csrc": "denghuiying:187:ed7923", "fill": "toself", "line": { "color": "blue", "width": 0 }, "mode": "lines", "name": "triangle 1", "type": "scatterternary", "textsrc": "denghuiying:187:7dcf45" }, { "asrc": "denghuiying:187:af0a54", "bsrc": "denghuiying:187:2440de", "csrc": "denghuiying:187:da3417", "fill": "toself", "line": { "color": "blue", "width": 0 }, "mode": "lines", "name": "triangle 2", "type": "scatterternary", "textsrc": "denghuiying:187:bf6cdb" }, { "asrc": "denghuiying:187:57b9fb", "bsrc": "denghuiying:187:98b0cb", "csrc": "denghuiying:187:f95e16", "fill": "toself", "line": { "color": "blue", "width": 0 }, "mode": "lines", "name": "triangle 3", "type": "scatterternary", "textsrc": "denghuiying:187:26f003" }, { "asrc": "denghuiying:187:ec2188", "bsrc": "denghuiying:187:e9f9d4", "csrc": "denghuiying:187:fd81bd", "fill": "toself", "line": { "color": "blue", "width": 0 }, "mode": "lines", "name": "triangle 4", "type": "scatterternary", "textsrc": "denghuiying:187:9017c0" }, { "asrc": "denghuiying:187:f6ef48", "bsrc": "denghuiying:187:14269a", "csrc": "denghuiying:187:f8bbf4", "fill": "toself", "line": { "color": "blue", "width": 0 }, "mode": "lines", "name": "triangle 5", "type": "scatterternary", "textsrc": "denghuiying:187:cbfb5a" }, { "asrc": "denghuiying:187:699706", "bsrc": "denghuiying:187:3e7797", "csrc": "denghuiying:187:4d7a14", "fill": "toself", "line": { "color": "blue", "width": 0 }, "mode": "lines", "name": "triangle 6", "type": "scatterternary", "textsrc": "denghuiying:187:948c27" } ], "layout": { "ternary": { "sum": 100, "aaxis": { "dtick": 10, "title": { "font": { "size": 20 }, "text": "Si" }, "ticklen": 10, "showgrid": true, "showline": true, "tickfont": { "size": 15 }, "gridcolor": "rgba(0,0,0,0.3)", "linecolor": "rgba(0,0,0,0.3)", "tickangle": 0, "tickcolor": "black" }, "baxis": { "dtick": 10, "title": { "font": { "size": 20 }, "text": "<br>Fe" }, "ticklen": 10, "showgrid": true, "showline": true, "tickfont": { "size": 15 }, "gridcolor": "rgba(0,0,0,0.3)", "linecolor": "rgba(0,0,0,0.3)", "tickangle": 45, "tickcolor": "black" }, "caxis": { "dtick": 10, "title": { "font": { "size": 20 }, "text": "<br>Nb" }, "ticklen": 10, "showgrid": true, "showline": true, "tickfont": { "size": 15 }, "gridcolor": "rgba(0,0,0,0.3)", "linecolor": "rgba(0,0,0,0.3)", "tickangle": -45, "tickcolor": "black" }, "bgcolor": "white" }, "template": { "data": { "bar": [ { "type": "bar", "marker": { "line": { "color": "#E5ECF6", "width": 0.5 }, "pattern": { "size": 10, "fillmode": "overlay", "solidity": 0.2 } }, "error_x": { "color": "#2a3f5f" }, "error_y": { "color": "#2a3f5f" } } ], "pie": [ { "type": "pie", "automargin": true } ], "table": [ { "type": "table", "cells": { "fill": { "color": "#EBF0F8" }, "line": { "color": "white" } }, "header": { "fill": { "color": "#C8D4E3" }, "line": { "color": "white" } } } ], "carpet": [ { "type": "carpet", "aaxis": { "gridcolor": "white", "linecolor": "white", "endlinecolor": "#2a3f5f", "minorgridcolor": "white", "startlinecolor": "#2a3f5f" }, "baxis": { "gridcolor": "white", "linecolor": "white", "endlinecolor": "#2a3f5f", "minorgridcolor": "white", "startlinecolor": "#2a3f5f" } } ], "mesh3d": [ { "type": "mesh3d", "colorbar": { "ticks": "", "outlinewidth": 0 } } ], "contour": [ { "type": "contour", "colorbar": { "ticks": "", "outlinewidth": 0 }, "colorscale": [ [ 0.0, "#0d0887" ], [ 0.1111111111111111, "#46039f" ], [ 0.2222222222222222, "#7201a8" ], [ 0.3333333333333333, "#9c179e" ], [ 0.4444444444444444, "#bd3786" ], [ 0.5555555555555556, "#d8576b" ], [ 0.6666666666666666, "#ed7953" ], [ 0.7777777777777778, "#fb9f3a" ], [ 0.8888888888888888, "#fdca26" ], [ 1.0, "#f0f921" ] ] } ], "heatmap": [ { "type": "heatmap", "colorbar": { "ticks": "", "outlinewidth": 0 }, "colorscale": [ [ 0.0, "#0d0887" ], [ 0.1111111111111111, "#46039f" ], [ 0.2222222222222222, "#7201a8" ], [ 0.3333333333333333, "#9c179e" ], [ 0.4444444444444444, "#bd3786" ], [ 0.5555555555555556, "#d8576b" ], [ 0.6666666666666666, "#ed7953" ], [ 0.7777777777777778, "#fb9f3a" ], [ 0.8888888888888888, "#fdca26" ], [ 1.0, "#f0f921" ] ] } ], "scatter": [ { "type": "scatter", "fillpattern": { "size": 10, "fillmode": "overlay", "solidity": 0.2 } } ], "surface": [ { "type": "surface", "colorbar": { "ticks": "", "outlinewidth": 0 }, "colorscale": [ [ 0.0, "#0d0887" ], [ 0.1111111111111111, "#46039f" ], [ 0.2222222222222222, "#7201a8" ], [ 0.3333333333333333, "#9c179e" ], [ 0.4444444444444444, "#bd3786" ], [ 0.5555555555555556, "#d8576b" ], [ 0.6666666666666666, "#ed7953" ], [ 0.7777777777777778, "#fb9f3a" ], [ 0.8888888888888888, "#fdca26" ], [ 1.0, "#f0f921" ] ] } ], "barpolar": [ { "type": "barpolar", "marker": { "line": { "color": "#E5ECF6", "width": 0.5 }, "pattern": { "size": 10, "fillmode": "overlay", "solidity": 0.2 } } } ], "heatmapgl": [ { "type": "heatmapgl", "colorbar": { "ticks": "", "outlinewidth": 0 }, "colorscale": [ [ 0.0, "#0d0887" ], [ 0.1111111111111111, "#46039f" ], [ 0.2222222222222222, "#7201a8" ], [ 0.3333333333333333, "#9c179e" ], [ 0.4444444444444444, "#bd3786" ], [ 0.5555555555555556, "#d8576b" ], [ 0.6666666666666666, "#ed7953" ], [ 0.7777777777777778, "#fb9f3a" ], [ 0.8888888888888888, "#fdca26" ], [ 1.0, "#f0f921" ] ] } ], "histogram": [ { "type": "histogram", "marker": { "pattern": { "size": 10, "fillmode": "overlay", "solidity": 0.2 } } } ], "parcoords": [ { "line": { "colorbar": { "ticks": "", "outlinewidth": 0 } }, "type": "parcoords" } ], "scatter3d": [ { "line": { "colorbar": { "ticks": "", "outlinewidth": 0 } }, "type": "scatter3d", "marker": { "colorbar": { "ticks": "", "outlinewidth": 0 } } } ], "scattergl": [ { "type": "scattergl", "marker": { "colorbar": { "ticks": "", "outlinewidth": 0 } } } ], "choropleth": [ { "type": "choropleth", "colorbar": { "ticks": "", "outlinewidth": 0 } } ], "scattergeo": [ { "type": "scattergeo", "marker": { "colorbar": { "ticks": "", "outlinewidth": 0 } } } ], "histogram2d": [ { "type": "histogram2d", "colorbar": { "ticks": "", "outlinewidth": 0 }, "colorscale": [ [ 0.0, "#0d0887" ], [ 0.1111111111111111, "#46039f" ], [ 0.2222222222222222, "#7201a8" ], [ 0.3333333333333333, "#9c179e" ], [ 0.4444444444444444, "#bd3786" ], [ 0.5555555555555556, "#d8576b" ], [ 0.6666666666666666, "#ed7953" ], [ 0.7777777777777778, "#fb9f3a" ], [ 0.8888888888888888, "#fdca26" ], [ 1.0, "#f0f921" ] ] } ], "scatterpolar": [ { "type": "scatterpolar", "marker": { "colorbar": { "ticks": "", "outlinewidth": 0 } } } ], "contourcarpet": [ { "type": "contourcarpet", "colorbar": { "ticks": "", "outlinewidth": 0 } } ], "scattercarpet": [ { "type": "scattercarpet", "marker": { "colorbar": { "ticks": "", "outlinewidth": 0 } } } ], "scattermapbox": [ { "type": "scattermapbox", "marker": { "colorbar": { "ticks": "", "outlinewidth": 0 } } } ], "scatterpolargl": [ { "type": "scatterpolargl", "marker": { "colorbar": { "ticks": "", "outlinewidth": 0 } } } ], "scatterternary": [ { "type": "scatterternary", "marker": { "colorbar": { "ticks": "", "outlinewidth": 0 } } } ], "histogram2dcontour": [ { "type": "histogram2dcontour", "colorbar": { "ticks": "", "outlinewidth": 0 }, "colorscale": [ [ 0.0, "#0d0887" ], [ 0.1111111111111111, "#46039f" ], [ 0.2222222222222222, "#7201a8" ], [ 0.3333333333333333, "#9c179e" ], [ 0.4444444444444444, "#bd3786" ], [ 0.5555555555555556, "#d8576b" ], [ 0.6666666666666666, "#ed7953" ], [ 0.7777777777777778, "#fb9f3a" ], [ 0.8888888888888888, "#fdca26" ], [ 1.0, "#f0f921" ] ] } ] }, "layout": { "geo": { "bgcolor": "white", "showland": true, "lakecolor": "white", "landcolor": "#E5ECF6", "showlakes": true, "subunitcolor": "white" }, "font": { "color": "#2a3f5f" }, "polar": { "bgcolor": "#E5ECF6", "radialaxis": { "ticks": "", "gridcolor": "white", "linecolor": "white" }, "angularaxis": { "ticks": "", "gridcolor": "white", "linecolor": "white" } }, "scene": { "xaxis": { "ticks": "", "gridcolor": "white", "gridwidth": 2, "linecolor": "white", "zerolinecolor": "white", "showbackground": true, "backgroundcolor": "#E5ECF6" }, "yaxis": { "ticks": "", "gridcolor": "white", "gridwidth": 2, "linecolor": "white", "zerolinecolor": "white", "showbackground": true, "backgroundcolor": "#E5ECF6" }, "zaxis": { "ticks": "", "gridcolor": "white", "gridwidth": 2, "linecolor": "white", "zerolinecolor": "white", "showbackground": true, "backgroundcolor": "#E5ECF6" } }, "title": { "x": 0.05 }, "xaxis": { "ticks": "", "title": { "standoff": 15 }, "gridcolor": "white", "linecolor": "white", "automargin": true, "zerolinecolor": "white", "zerolinewidth": 2 }, "yaxis": { "ticks": "", "title": { "standoff": 15 }, "gridcolor": "white", "linecolor": "white", "automargin": true, "zerolinecolor": "white", "zerolinewidth": 2 }, "mapbox": { "style": "light" }, "ternary": { "aaxis": { "ticks": "", "gridcolor": "white", "linecolor": "white" }, "baxis": { "ticks": "", "gridcolor": "white", "linecolor": "white" }, "caxis": { "ticks": "", "gridcolor": "white", "linecolor": "white" }, "bgcolor": "#E5ECF6" }, "colorway": [ "#636efa", "#EF553B", "#00cc96", "#ab63fa", "#FFA15A", "#19d3f3", "#FF6692", "#B6E880", "#FF97FF", "#FECB52" ], "coloraxis": { "colorbar": { "ticks": "", "outlinewidth": 0 } }, "hovermode": "closest", "colorscale": { "diverging": [ [ 0, "#8e0152" ], [ 0.1, "#c51b7d" ], [ 0.2, "#de77ae" ], [ 0.3, "#f1b6da" ], [ 0.4, "#fde0ef" ], [ 0.5, "#f7f7f7" ], [ 0.6, "#e6f5d0" ], [ 0.7, "#b8e186" ], [ 0.8, "#7fbc41" ], [ 0.9, "#4d9221" ], [ 1, "#276419" ] ], "sequential": [ [ 0.0, "#0d0887" ], [ 0.1111111111111111, "#46039f" ], [ 0.2222222222222222, "#7201a8" ], [ 0.3333333333333333, "#9c179e" ], [ 0.4444444444444444, "#bd3786" ], [ 0.5555555555555556, "#d8576b" ], [ 0.6666666666666666, "#ed7953" ], [ 0.7777777777777778, "#fb9f3a" ], [ 0.8888888888888888, "#fdca26" ], [ 1.0, "#f0f921" ] ], "sequentialminus": [ [ 0.0, "#0d0887" ], [ 0.1111111111111111, "#46039f" ], [ 0.2222222222222222, "#7201a8" ], [ 0.3333333333333333, "#9c179e" ], [ 0.4444444444444444, "#bd3786" ], [ 0.5555555555555556, "#d8576b" ], [ 0.6666666666666666, "#ed7953" ], [ 0.7777777777777778, "#fb9f3a" ], [ 0.8888888888888888, "#fdca26" ], [ 1.0, "#f0f921" ] ] }, "hoverlabel": { "align": "left" }, "plot_bgcolor": "#E5ECF6", "paper_bgcolor": "white", "shapedefaults": { "line": { "color": "#2a3f5f" } }, "autotypenumbers": "strict", "annotationdefaults": { "arrowhead": 0, "arrowcolor": "#2a3f5f", "arrowwidth": 1 } } } } }, "height": null, "width": null, "user": { "profile_url": "https://chart-studio.plotly.com/~denghuiying", "avatar_url": "https://storage.googleapis.com/plotly-prod-profiles/47.jpg", "background_url": "https://storage.googleapis.com/plotly-prod-profiles/bg-6.jpg", "bio": "", "nickname": "", "website": "", "stream_tokens": null, "feature_set_id": null, "csrf_token": null, "date_joined": "2024-02-28 14:32:56", "mapbox_access_tokens": null, "has_password": null, "username": "denghuiying", "email": null, "is_active": null, "readonly": null, "is_dash_creator": null, "dash_created_count": null, "is_chart_creator": null, "charts_created_count": null } }, { "creation_time": "2024-04-09T12:57:14.540326Z", "comments": { "results": [], "count": 0 }, "parented": true, "embed_url": "https://chart-studio.plotly.com/~15HammondW/3.embed", "fid": "15HammondW:3", "filename": "Plot 3", "filetype": "plot", "img_url": "https://storage.googleapis.com/plotly-prod-images/15HammondW/3/9_62LS42POUW94LZ11NJVFWHMY5NW6L0.png", "image_urls": { "default": "https://storage.googleapis.com/plotly-prod-images/15HammondW/3/2_T6T80FCLRFD1QSYVWMAORYW02H2GED.png", "block-thumb": "https://storage.googleapis.com/plotly-prod-images/15HammondW/3/8_WFY1C2HRQ5KMMBFFQLUHCQM9CKB50P.png", "list-thumb": "https://storage.googleapis.com/plotly-prod-images/15HammondW/3/9_62LS42POUW94LZ11NJVFWHMY5NW6L0.png" }, "api_urls": { "files": "https://api.plotly.com/v2/files/15HammondW:3", "plots": "https://api.plotly.com/v2/plots/15HammondW:3", "parent": "https://api.plotly.com/v2/folders/home?user=15HammondW" }, "owner": "15HammondW", "parent": -1, "preview": "", "referencers": [], "references": [], "title": "", "views": 2, "web_url": "https://chart-studio.plotly.com/~15HammondW/3/", "world_readable": true, "date_modified": "2024-04-09T13:36:56.812Z", "stars": { "results": [], "count": 0 }, "collaborators": { "results": [], "count": 0 }, "subfolder_count": null, "refresh_interval": null, "organize_view_url": "https://chart-studio.plotly.com/~15HammondW/3/", "current_user_permission": "read", "is_theme": null, "is_template": false, "autosize": true, "caption": "", "figure": { "data": [ { "meta": { "columnNames": { "x": "A", "y": "B" } }, "mode": "markers+lines", "type": "scatter", "xsrc": "15HammondW:4:6b95dc", "ysrc": "15HammondW:4:4416e1", "marker": { "size": 6, "color": "#636efa" }, "connectgaps": false } ], "frames": [], "layout": { "title": { "text": "Simulation Runtime Vs Maximum Timestep" }, "xaxis": { "type": "category", "range": [ -0.3133538251366121, 5.313353825136612 ], "title": { "text": "Maximum Timestep" }, "autorange": true }, "yaxis": { "type": "linear", "range": [ -0.003817805383022777, 0.2778178053830228 ], "title": { "text": "Runtime (sec)" }, "autorange": true }, "autosize": true, "template": { "data": { "bar": [ { "type": "bar", "marker": { "colorbar": { "ticks": "", "outlinewidth": 0 } } } ], "table": [ { "type": "table", "cells": { "fill": { "color": "#EBF0F8" }, "line": { "color": "white" } }, "header": { "fill": { "color": "#C8D4E3" }, "line": { "color": "white" } } } ], "carpet": [ { "type": "carpet", "aaxis": { "gridcolor": "#C8D4E3", "linecolor": "#C8D4E3", "endlinecolor": "#2a3f5f", "minorgridcolor": "#C8D4E3", "startlinecolor": "#2a3f5f" }, "baxis": { "gridcolor": "#C8D4E3", "linecolor": "#C8D4E3", "endlinecolor": "#2a3f5f", "minorgridcolor": "#C8D4E3", "startlinecolor": "#2a3f5f" } } ], "mesh3d": [ { "type": "mesh3d", "colorbar": { "ticks": "", "outlinewidth": 0 } } ], "contour": [ { "type": "contour", "colorbar": { "ticks": "", "outlinewidth": 0 }, "autocolorscale": true } ], "heatmap": [ { "type": "heatmap", "colorbar": { "ticks": "", "outlinewidth": 0 }, "autocolorscale": true } ], "scatter": [ { "type": "scatter", "marker": { "colorbar": { "ticks": "", "outlinewidth": 0 } } } ], "surface": [ { "type": "surface", "colorbar": { "ticks": "", "outlinewidth": 0 } } ], "heatmapgl": [ { "type": "heatmapgl", "colorbar": { "ticks": "", "outlinewidth": 0 } } ], "histogram": [ { "type": "histogram", "marker": { "colorbar": { "ticks": "", "outlinewidth": 0 } } } ], "parcoords": [ { "line": { "colorbar": { "ticks": "", "outlinewidth": 0 } }, "type": "parcoords" } ], "scatter3d": [ { "type": "scatter3d", "marker": { "colorbar": { "ticks": "", "outlinewidth": 0 } } } ], "scattergl": [ { "type": "scattergl", "marker": { "colorbar": { "ticks": "", "outlinewidth": 0 } } } ], "choropleth": [ { "type": "choropleth", "colorbar": { "ticks": "", "outlinewidth": 0 } } ], "scattergeo": [ { "type": "scattergeo", "marker": { "colorbar": { "ticks": "", "outlinewidth": 0 } } } ], "histogram2d": [ { "type": "histogram2d", "colorbar": { "ticks": "", "outlinewidth": 0 }, "autocolorscale": true } ], "scatterpolar": [ { "type": "scatterpolar", "marker": { "colorbar": { "ticks": "", "outlinewidth": 0 } } } ], "contourcarpet": [ { "type": "contourcarpet", "colorbar": { "ticks": "", "outlinewidth": 0 } } ], "scattercarpet": [ { "type": "scattercarpet", "marker": { "colorbar": { "ticks": "", "outlinewidth": 0 } } } ], "scattermapbox": [ { "type": "scattermapbox", "marker": { "colorbar": { "ticks": "", "outlinewidth": 0 } } } ], "scatterpolargl": [ { "type": "scatterpolargl", "marker": { "colorbar": { "ticks": "", "outlinewidth": 0 } } } ], "scatterternary": [ { "type": "scatterternary", "marker": { "colorbar": { "ticks": "", "outlinewidth": 0 } } } ], "histogram2dcontour": [ { "type": "histogram2dcontour", "colorbar": { "ticks": "", "outlinewidth": 0 }, "autocolorscale": true } ] }, "layout": { "geo": { "bgcolor": "white", "showland": true, "lakecolor": "white", "landcolor": "white", "showlakes": true, "subunitcolor": "#C8D4E3" }, "font": { "color": "#2a3f5f" }, "polar": { "bgcolor": "white", "radialaxis": { "ticks": "", "gridcolor": "#EBF0F8", "linecolor": "#EBF0F8" }, "angularaxis": { "ticks": "", "gridcolor": "#EBF0F8", "linecolor": "#EBF0F8" } }, "scene": { "xaxis": { "ticks": "", "gridcolor": "#DFE8F3", "gridwidth": 2, "linecolor": "#EBF0F8", "zerolinecolor": "#EBF0F8", "showbackground": true, "backgroundcolor": "white" }, "yaxis": { "ticks": "", "gridcolor": "#DFE8F3", "gridwidth": 2, "linecolor": "#EBF0F8", "zerolinecolor": "#EBF0F8", "showbackground": true, "backgroundcolor": "white" }, "zaxis": { "ticks": "", "gridcolor": "#DFE8F3", "gridwidth": 2, "linecolor": "#EBF0F8", "zerolinecolor": "#EBF0F8", "showbackground": true, "backgroundcolor": "white" } }, "title": { "x": 0.05 }, "xaxis": { "ticks": "", "gridcolor": "#EBF0F8", "linecolor": "#EBF0F8", "automargin": true, "zerolinecolor": "#EBF0F8", "zerolinewidth": 2 }, "yaxis": { "ticks": "", "gridcolor": "#EBF0F8", "linecolor": "#EBF0F8", "automargin": true, "zerolinecolor": "#EBF0F8", "zerolinewidth": 2 }, "ternary": { "aaxis": { "ticks": "", "gridcolor": "#DFE8F3", "linecolor": "#A2B1C6" }, "baxis": { "ticks": "", "gridcolor": "#DFE8F3", "linecolor": "#A2B1C6" }, "caxis": { "ticks": "", "gridcolor": "#DFE8F3", "linecolor": "#A2B1C6" }, "bgcolor": "white" }, "colorway": [ "#636efa", "#EF553B", "#00cc96", "#ab63fa", "#19d3f3", "#e763fa", "#fecb52", "#ffa15a", "#ff6692", "#b6e880" ], "hovermode": "closest", "colorscale": { "diverging": [ [ 0, "#8e0152" ], [ 0.1, "#c51b7d" ], [ 0.2, "#de77ae" ], [ 0.3, "#f1b6da" ], [ 0.4, "#fde0ef" ], [ 0.5, "#f7f7f7" ], [ 0.6, "#e6f5d0" ], [ 0.7, "#b8e186" ], [ 0.8, "#7fbc41" ], [ 0.9, "#4d9221" ], [ 1, "#276419" ] ], "sequential": [ [ 0, "#0508b8" ], [ 0.0893854748603352, "#1910d8" ], [ 0.1787709497206704, "#3c19f0" ], [ 0.2681564245810056, "#6b1cfb" ], [ 0.3575418994413408, "#981cfd" ], [ 0.44692737430167595, "#bf1cfd" ], [ 0.5363128491620112, "#dd2bfd" ], [ 0.6256983240223464, "#f246fe" ], [ 0.7150837988826816, "#fc67fd" ], [ 0.8044692737430168, "#fe88fc" ], [ 0.8938547486033519, "#fea5fd" ], [ 0.9832402234636871, "#febefe" ], [ 1, "#fec3fe" ] ], "sequentialminus": [ [ 0, "#0508b8" ], [ 0.0893854748603352, "#1910d8" ], [ 0.1787709497206704, "#3c19f0" ], [ 0.2681564245810056, "#6b1cfb" ], [ 0.3575418994413408, "#981cfd" ], [ 0.44692737430167595, "#bf1cfd" ], [ 0.5363128491620112, "#dd2bfd" ], [ 0.6256983240223464, "#f246fe" ], [ 0.7150837988826816, "#fc67fd" ], [ 0.8044692737430168, "#fe88fc" ], [ 0.8938547486033519, "#fea5fd" ], [ 0.9832402234636871, "#febefe" ], [ 1, "#fec3fe" ] ] }, "plot_bgcolor": "white", "paper_bgcolor": "white", "shapedefaults": { "line": { "width": 0 }, "opacity": 0.4, "fillcolor": "#506784" }, "annotationdefaults": { "arrowhead": 0, "arrowcolor": "#506784", "arrowwidth": 1 } }, "themeRef": "PLOTLY_WHITE" } } }, "height": null, "width": null, "user": { "profile_url": "https://chart-studio.plotly.com/~15HammondW", "avatar_url": "https://storage.googleapis.com/plotly-prod-profiles/51.jpg", "background_url": "https://storage.googleapis.com/plotly-prod-profiles/bg-12.jpg", "bio": "", "nickname": "", "website": "", "stream_tokens": null, "feature_set_id": null, "csrf_token": null, "date_joined": "2024-04-04 21:45:46", "mapbox_access_tokens": null, "has_password": null, "username": "15HammondW", "email": null, "is_active": null, "readonly": null, "is_dash_creator": null, "dash_created_count": null, "is_chart_creator": null, "charts_created_count": null } }, { "creation_time": "2024-04-09T12:36:15.782228Z", "comments": { "results": [], "count": 0 }, "parented": true, "embed_url": "https://chart-studio.plotly.com/~mgoldman21/2.embed", "fid": "mgoldman21:2", "filename": "Plot 2", "filetype": "plot", "img_url": "https://storage.googleapis.com/plotly-prod-images/mgoldman21/2/9_W3O7A533FBP7M6JS3H6O56O44NKXXF.png", "image_urls": { "default": "https://storage.googleapis.com/plotly-prod-images/mgoldman21/2/2_KISXSUVWPFANLQUWUYZ31R5GC2G25Y.png", "block-thumb": "https://storage.googleapis.com/plotly-prod-images/mgoldman21/2/8_CN68OA8F1GGH47K8NZLFMPCJ1D0O4L.png", "list-thumb": "https://storage.googleapis.com/plotly-prod-images/mgoldman21/2/9_W3O7A533FBP7M6JS3H6O56O44NKXXF.png" }, "api_urls": { "files": "https://api.plotly.com/v2/files/mgoldman21:2", "plots": "https://api.plotly.com/v2/plots/mgoldman21:2", "parent": "https://api.plotly.com/v2/folders/home?user=mgoldman21" }, "owner": "mgoldman21", "parent": -1, "preview": "", "referencers": [], "references": [], "title": "", "views": 1, "web_url": "https://chart-studio.plotly.com/~mgoldman21/2/", "world_readable": true, "date_modified": "2024-04-09T13:10:01.563Z", "stars": { "results": [], "count": 0 }, "collaborators": { "results": [], "count": 0 }, "subfolder_count": null, "refresh_interval": null, "organize_view_url": "https://chart-studio.plotly.com/~mgoldman21/2/", "current_user_permission": "read", "is_theme": null, "is_template": false, "autosize": true, "caption": "", "figure": { "data": [ { "meta": { "columnNames": { "x": "Temperature", "y": "Moisture", "z": "Green Strength" } }, "mode": "markers", "type": "scatter3d", "xsrc": "mgoldman21:4:f7d639", "ysrc": "mgoldman21:4:7567b7", "zsrc": "mgoldman21:4:07f2cb" } ], "frames": [], "layout": { "scene": { "camera": { "up": { "x": 0, "y": 0, "z": 1 }, "eye": { "x": 1.313809946819295, "y": 1.3815403095878231, "z": 0.3537707733677361 }, "center": { "x": -0.05029880045517718, "y": 0.1097583295658668, "z": -0.216857297050258 }, "projection": { "type": "perspective" } }, "aspectmode": "auto", "aspectratio": { "x": 1, "y": 1, "z": 1 } }, "title": { "text": "Temperature vs Moisture vs Green Strength" }, "xaxis": { "range": [ 1.8621902452894399, 1.8706122635389468 ], "autorange": false }, "yaxis": { "range": [ 2.9405157562103525, 3.497920082333481 ], "autorange": false }, "autosize": true } }, "height": null, "width": null, "user": { "profile_url": "https://chart-studio.plotly.com/~mgoldman21", "avatar_url": "https://storage.googleapis.com/plotly-prod-profiles/2.jpg", "background_url": "https://storage.googleapis.com/plotly-prod-profiles/bg-1.jpg", "bio": "", "nickname": "", "website": "", "stream_tokens": null, "feature_set_id": null, "csrf_token": null, "date_joined": "2024-04-09 11:09:45", "mapbox_access_tokens": null, "has_password": null, "username": "mgoldman21", "email": null, "is_active": null, "readonly": null, "is_dash_creator": null, "dash_created_count": null, "is_chart_creator": null, "charts_created_count": null } }, { "creation_time": "2024-04-09T12:29:40.067345Z", "comments": { "results": [], "count": 0 }, "parented": true, "embed_url": "https://chart-studio.plotly.com/~dcsaszar/98.embed", "fid": "dcsaszar:98", "filename": "21plot", "filetype": "plot", "img_url": "https://storage.googleapis.com/plotly-prod-images/dcsaszar/98/9_U5VR3JML0A4I9N0PDSOGBA8AEAX5QG.png", "image_urls": { "default": "https://storage.googleapis.com/plotly-prod-images/dcsaszar/98/2_EXRR7Z5YSKDJZ95SOVOIWFXRMDVUCH.png", "block-thumb": "https://storage.googleapis.com/plotly-prod-images/dcsaszar/98/8_4RF3K942HF1SEXRMZEAZ9H27MZ159G.png", "list-thumb": "https://storage.googleapis.com/plotly-prod-images/dcsaszar/98/9_U5VR3JML0A4I9N0PDSOGBA8AEAX5QG.png" }, "api_urls": { "files": "https://api.plotly.com/v2/files/dcsaszar:98", "plots": "https://api.plotly.com/v2/plots/dcsaszar:98", "parent": "https://api.plotly.com/v2/folders/home?user=dcsaszar" }, "owner": "dcsaszar", "parent": -1, "preview": "", "referencers": [], "references": [], "title": "", "views": 1, "web_url": "https://chart-studio.plotly.com/~dcsaszar/98/", "world_readable": true, "date_modified": "2024-10-03T07:59:35.280Z", "stars": { "results": [], "count": 0 }, "collaborators": { "results": [], "count": 0 }, "subfolder_count": null, "refresh_interval": null, "organize_view_url": "https://chart-studio.plotly.com/~dcsaszar/98/", "current_user_permission": "read", "is_theme": null, "is_template": false, "autosize": true, "caption": "", "figure": { "data": [ { "meta": { "columnNames": { "x": "A", "y": "SBTC#" } }, "mode": "lines", "name": "SBTC", "type": "scatter", "xsrc": "dcsaszar:97:68ee65", "ysrc": "dcsaszar:97:64c55d", "orientation": "v" }, { "meta": { "columnNames": { "x": "A", "y": "ABTC#" } }, "mode": "lines", "name": "ABTC", "type": "scatter", "xsrc": "dcsaszar:97:68ee65", "ysrc": "dcsaszar:97:0fd750", "yaxis": "y", "orientation": "v" } ], "frames": [], "layout": { "xaxis": { "type": "date", "range": [ "2024-04-10", "2024-10-03" ], "autorange": true }, "yaxis": { "type": "linear", "range": [ 14029722.222222222, 33535277.777777776 ], "autorange": true }, "autosize": true, "template": { "data": { "bar": [ { "type": "bar", "marker": { "colorbar": { "ticks": "", "outlinewidth": 0 } } } ], "table": [ { "type": "table", "cells": { "fill": { "color": "#EBF0F8" }, "line": { "color": "white" } }, "header": { "fill": { "color": "#C8D4E3" }, "line": { "color": "white" } } } ], "carpet": [ { "type": "carpet", "aaxis": { "gridcolor": "#C8D4E3", "linecolor": "#C8D4E3", "endlinecolor": "#2a3f5f", "minorgridcolor": "#C8D4E3", "startlinecolor": "#2a3f5f" }, "baxis": { "gridcolor": "#C8D4E3", "linecolor": "#C8D4E3", "endlinecolor": "#2a3f5f", "minorgridcolor": "#C8D4E3", "startlinecolor": "#2a3f5f" } } ], "mesh3d": [ { "type": "mesh3d", "colorbar": { "ticks": "", "outlinewidth": 0 } } ], "contour": [ { "type": "contour", "colorbar": { "ticks": "", "outlinewidth": 0 }, "autocolorscale": true } ], "heatmap": [ { "type": "heatmap", "colorbar": { "ticks": "", "outlinewidth": 0 }, "autocolorscale": true } ], "scatter": [ { "type": "scatter", "marker": { "colorbar": { "ticks": "", "outlinewidth": 0 } } } ], "surface": [ { "type": "surface", "colorbar": { "ticks": "", "outlinewidth": 0 } } ], "heatmapgl": [ { "type": "heatmapgl", "colorbar": { "ticks": "", "outlinewidth": 0 } } ], "histogram": [ { "type": "histogram", "marker": { "colorbar": { "ticks": "", "outlinewidth": 0 } } } ], "parcoords": [ { "line": { "colorbar": { "ticks": "", "outlinewidth": 0 } }, "type": "parcoords" } ], "scatter3d": [ { "type": "scatter3d", "marker": { "colorbar": { "ticks": "", "outlinewidth": 0 } } } ], "scattergl": [ { "type": "scattergl", "marker": { "colorbar": { "ticks": "", "outlinewidth": 0 } } } ], "choropleth": [ { "type": "choropleth", "colorbar": { "ticks": "", "outlinewidth": 0 } } ], "scattergeo": [ { "type": "scattergeo", "marker": { "colorbar": { "ticks": "", "outlinewidth": 0 } } } ], "histogram2d": [ { "type": "histogram2d", "colorbar": { "ticks": "", "outlinewidth": 0 }, "autocolorscale": true } ], "scatterpolar": [ { "type": "scatterpolar", "marker": { "colorbar": { "ticks": "", "outlinewidth": 0 } } } ], "contourcarpet": [ { "type": "contourcarpet", "colorbar": { "ticks": "", "outlinewidth": 0 } } ], "scattercarpet": [ { "type": "scattercarpet", "marker": { "colorbar": { "ticks": "", "outlinewidth": 0 } } } ], "scattermapbox": [ { "type": "scattermapbox", "marker": { "colorbar": { "ticks": "", "outlinewidth": 0 } } } ], "scatterpolargl": [ { "type": "scatterpolargl", "marker": { "colorbar": { "ticks": "", "outlinewidth": 0 } } } ], "scatterternary": [ { "type": "scatterternary", "marker": { "colorbar": { "ticks": "", "outlinewidth": 0 } } } ], "histogram2dcontour": [ { "type": "histogram2dcontour", "colorbar": { "ticks": "", "outlinewidth": 0 }, "autocolorscale": true } ] }, "layout": { "geo": { "bgcolor": "white", "showland": true, "lakecolor": "white", "landcolor": "white", "showlakes": true, "subunitcolor": "#C8D4E3" }, "font": { "color": "#2a3f5f" }, "polar": { "bgcolor": "white", "radialaxis": { "ticks": "", "gridcolor": "#EBF0F8", "linecolor": "#EBF0F8" }, "angularaxis": { "ticks": "", "gridcolor": "#EBF0F8", "linecolor": "#EBF0F8" } }, "scene": { "xaxis": { "ticks": "", "gridcolor": "#DFE8F3", "gridwidth": 2, "linecolor": "#EBF0F8", "zerolinecolor": "#EBF0F8", "showbackground": true, "backgroundcolor": "white" }, "yaxis": { "ticks": "", "gridcolor": "#DFE8F3", "gridwidth": 2, "linecolor": "#EBF0F8", "zerolinecolor": "#EBF0F8", "showbackground": true, "backgroundcolor": "white" }, "zaxis": { "ticks": "", "gridcolor": "#DFE8F3", "gridwidth": 2, "linecolor": "#EBF0F8", "zerolinecolor": "#EBF0F8", "showbackground": true, "backgroundcolor": "white" } }, "title": { "x": 0.05 }, "xaxis": { "ticks": "", "gridcolor": "#EBF0F8", "linecolor": "#EBF0F8", "automargin": true, "zerolinecolor": "#EBF0F8", "zerolinewidth": 2 }, "yaxis": { "ticks": "", "gridcolor": "#EBF0F8", "linecolor": "#EBF0F8", "automargin": true, "zerolinecolor": "#EBF0F8", "zerolinewidth": 2 }, "ternary": { "aaxis": { "ticks": "", "gridcolor": "#DFE8F3", "linecolor": "#A2B1C6" }, "baxis": { "ticks": "", "gridcolor": "#DFE8F3", "linecolor": "#A2B1C6" }, "caxis": { "ticks": "", "gridcolor": "#DFE8F3", "linecolor": "#A2B1C6" }, "bgcolor": "white" }, "colorway": [ "#636efa", "#EF553B", "#00cc96", "#ab63fa", "#19d3f3", "#e763fa", "#fecb52", "#ffa15a", "#ff6692", "#b6e880" ], "hovermode": "closest", "colorscale": { "diverging": [ [ 0, "#8e0152" ], [ 0.1, "#c51b7d" ], [ 0.2, "#de77ae" ], [ 0.3, "#f1b6da" ], [ 0.4, "#fde0ef" ], [ 0.5, "#f7f7f7" ], [ 0.6, "#e6f5d0" ], [ 0.7, "#b8e186" ], [ 0.8, "#7fbc41" ], [ 0.9, "#4d9221" ], [ 1, "#276419" ] ], "sequential": [ [ 0, "#0508b8" ], [ 0.0893854748603352, "#1910d8" ], [ 0.1787709497206704, "#3c19f0" ], [ 0.2681564245810056, "#6b1cfb" ], [ 0.3575418994413408, "#981cfd" ], [ 0.44692737430167595, "#bf1cfd" ], [ 0.5363128491620112, "#dd2bfd" ], [ 0.6256983240223464, "#f246fe" ], [ 0.7150837988826816, "#fc67fd" ], [ 0.8044692737430168, "#fe88fc" ], [ 0.8938547486033519, "#fea5fd" ], [ 0.9832402234636871, "#febefe" ], [ 1, "#fec3fe" ] ], "sequentialminus": [ [ 0, "#0508b8" ], [ 0.0893854748603352, "#1910d8" ], [ 0.1787709497206704, "#3c19f0" ], [ 0.2681564245810056, "#6b1cfb" ], [ 0.3575418994413408, "#981cfd" ], [ 0.44692737430167595, "#bf1cfd" ], [ 0.5363128491620112, "#dd2bfd" ], [ 0.6256983240223464, "#f246fe" ], [ 0.7150837988826816, "#fc67fd" ], [ 0.8044692737430168, "#fe88fc" ], [ 0.8938547486033519, "#fea5fd" ], [ 0.9832402234636871, "#febefe" ], [ 1, "#fec3fe" ] ] }, "plot_bgcolor": "white", "paper_bgcolor": "white", "shapedefaults": { "line": { "width": 0 }, "opacity": 0.4, "fillcolor": "#506784" }, "annotationdefaults": { "arrowhead": 0, "arrowcolor": "#506784", "arrowwidth": 1 } }, "themeRef": "PLOTLY_WHITE" } } }, "height": null, "width": null, "user": { "profile_url": "https://chart-studio.plotly.com/~dcsaszar", "avatar_url": "https://storage.googleapis.com/plotly-prod-profiles/6.jpg", "background_url": "https://storage.googleapis.com/plotly-prod-profiles/bg-9.jpg", "bio": "", "nickname": "", "website": "", "stream_tokens": null, "feature_set_id": null, "csrf_token": null, "date_joined": "2018-12-23 11:14:44", "mapbox_access_tokens": null, "has_password": null, "username": "dcsaszar", "email": null, "is_active": null, "readonly": null, "is_dash_creator": null, "dash_created_count": null, "is_chart_creator": null, "charts_created_count": null } }, { "creation_time": "2024-04-09T12:26:12.452965Z", "comments": { "results": [], "count": 0 }, "parented": true, "embed_url": "https://chart-studio.plotly.com/~bald_power/8.embed", "fid": "bald_power:8", "filename": "Half Marathon stats", "filetype": "plot", "img_url": "https://storage.googleapis.com/plotly-prod-images/bald_power/8/9_0B0OMQ10EHH7MHM5MQX67WXD6956H9.png", "image_urls": { "default": "https://storage.googleapis.com/plotly-prod-images/bald_power/8/2_HTWKDN3T2MMZQB6WHJKTUNTER4ETZX.png", "block-thumb": "https://storage.googleapis.com/plotly-prod-images/bald_power/8/8_K9ODRUXG0I4YH9A3XXUYRH2EFW1GC2.png", "list-thumb": "https://storage.googleapis.com/plotly-prod-images/bald_power/8/9_0B0OMQ10EHH7MHM5MQX67WXD6956H9.png" }, "api_urls": { "files": "https://api.plotly.com/v2/files/bald_power:8", "plots": "https://api.plotly.com/v2/plots/bald_power:8", "parent": "https://api.plotly.com/v2/folders/home?user=bald_power" }, "owner": "bald_power", "parent": -1, "preview": "", "referencers": [], "references": [], "title": "", "views": 47, "web_url": "https://chart-studio.plotly.com/~bald_power/8/", "world_readable": true, "date_modified": "2025-08-04T14:03:40.552Z", "stars": { "results": [], "count": 0 }, "collaborators": { "results": [], "count": 0 }, "subfolder_count": null, "refresh_interval": null, "organize_view_url": "https://chart-studio.plotly.com/~bald_power/8/", "current_user_permission": "read", "is_theme": null, "is_template": null, "autosize": true, "caption": "", "figure": { "data": [ { "mode": "markers", "name": "Half Marathon", "type": "scatter", "xsrc": "bald_power:33:40a2f0", "ysrc": "bald_power:33:88cf7e", "xaxis": "x", "yaxis": "y", "marker": { "color": "#636efa", "symbol": "circle" }, "showlegend": true, "legendgroup": "Half Marathon", "orientation": "v", "customdatasrc": "bald_power:33:e96a1f", "hovertemplate": "Date=%{x}<br>Race name=%{customdata[0]}<br>Shoes=%{customdata[1]}<br>Time at finish (netto)=%{customdata[2]}<br>Avg speed m/s=%{customdata[4]}<extra></extra>" }, { "mode": "lines", "name": "Half Marathon", "type": "scatter", "xsrc": "bald_power:33:6531a5", "ysrc": "bald_power:33:4e82a5", "xaxis": "x", "yaxis": "y", "marker": { "color": "#636efa", "symbol": "circle" }, "showlegend": false, "legendgroup": "Half Marathon", "hovertemplate": "<b>OLS trendline</b><br>Chiptime Seconds = -6.55648e-06 * Date + 16377.9<br>R<sup>2</sup>=0.553645<br><br>Date=%{x}<extra></extra>" }, { "mode": "markers", "type": "scatter", "xsrc": "bald_power:33:b32cda", "ysrc": "bald_power:33:6a413b", "marker": { "size": 15, "color": "orange", "symbol": "star" } } ], "layout": { "title": { "text": "Race Times for Half Marathon" }, "width": 1000, "xaxis": { "title": { "text": "Date" }, "anchor": "y", "domain": [ 0.0, 1.0 ] }, "yaxis": { "title": { "text": "Chiptime (netto)" }, "anchor": "x", "domain": [ 0.0, 1.0 ], "ticktext": [ "00:00:00", "00:07:00", "00:14:00", "00:21:00", "00:28:00", "00:35:00", "00:42:00", "00:49:00", "00:56:00", "01:03:00", "01:10:00", "01:17:00", "01:24:00", "01:31:00", "01:38:00", "01:45:00", "01:52:00", "01:59:00" ], "tickvals": [ 0, 420, 840, 1260, 1680, 2100, 2520, 2940, 3360, 3780, 4200, 4620, 5040, 5460, 5880, 6300, 6720, 7140 ], "autorange": "reversed" }, "height": 500, "legend": { "title": { "text": "Distance" }, "tracegroupgap": 0 }, "template": { "data": { "bar": [ { "type": "bar", "marker": { "line": { "color": "#E5ECF6", "width": 0.5 }, "pattern": { "size": 10, "fillmode": "overlay", "solidity": 0.2 } }, "error_x": { "color": "#2a3f5f" }, "error_y": { "color": "#2a3f5f" } } ], "pie": [ { "type": "pie", "automargin": true } ], "table": [ { "type": "table", "cells": { "fill": { "color": "#EBF0F8" }, "line": { "color": "white" } }, "header": { "fill": { "color": "#C8D4E3" }, "line": { "color": "white" } } } ], "carpet": [ { "type": "carpet", "aaxis": { "gridcolor": "white", "linecolor": "white", "endlinecolor": "#2a3f5f", "minorgridcolor": "white", "startlinecolor": "#2a3f5f" }, "baxis": { "gridcolor": "white", "linecolor": "white", "endlinecolor": "#2a3f5f", "minorgridcolor": "white", "startlinecolor": "#2a3f5f" } } ], "mesh3d": [ { "type": "mesh3d", "colorbar": { "ticks": "", "outlinewidth": 0 } } ], "contour": [ { "type": "contour", "colorbar": { "ticks": "", "outlinewidth": 0 }, "colorscale": [ [ 0.0, "#0d0887" ], [ 0.1111111111111111, "#46039f" ], [ 0.2222222222222222, "#7201a8" ], [ 0.3333333333333333, "#9c179e" ], [ 0.4444444444444444, "#bd3786" ], [ 0.5555555555555556, "#d8576b" ], [ 0.6666666666666666, "#ed7953" ], [ 0.7777777777777778, "#fb9f3a" ], [ 0.8888888888888888, "#fdca26" ], [ 1.0, "#f0f921" ] ] } ], "heatmap": [ { "type": "heatmap", "colorbar": { "ticks": "", "outlinewidth": 0 }, "colorscale": [ [ 0.0, "#0d0887" ], [ 0.1111111111111111, "#46039f" ], [ 0.2222222222222222, "#7201a8" ], [ 0.3333333333333333, "#9c179e" ], [ 0.4444444444444444, "#bd3786" ], [ 0.5555555555555556, "#d8576b" ], [ 0.6666666666666666, "#ed7953" ], [ 0.7777777777777778, "#fb9f3a" ], [ 0.8888888888888888, "#fdca26" ], [ 1.0, "#f0f921" ] ] } ], "scatter": [ { "type": "scatter", "fillpattern": { "size": 10, "fillmode": "overlay", "solidity": 0.2 } } ], "surface": [ { "type": "surface", "colorbar": { "ticks": "", "outlinewidth": 0 }, "colorscale": [ [ 0.0, "#0d0887" ], [ 0.1111111111111111, "#46039f" ], [ 0.2222222222222222, "#7201a8" ], [ 0.3333333333333333, "#9c179e" ], [ 0.4444444444444444, "#bd3786" ], [ 0.5555555555555556, "#d8576b" ], [ 0.6666666666666666, "#ed7953" ], [ 0.7777777777777778, "#fb9f3a" ], [ 0.8888888888888888, "#fdca26" ], [ 1.0, "#f0f921" ] ] } ], "barpolar": [ { "type": "barpolar", "marker": { "line": { "color": "#E5ECF6", "width": 0.5 }, "pattern": { "size": 10, "fillmode": "overlay", "solidity": 0.2 } } } ], "heatmapgl": [ { "type": "heatmapgl", "colorbar": { "ticks": "", "outlinewidth": 0 }, "colorscale": [ [ 0.0, "#0d0887" ], [ 0.1111111111111111, "#46039f" ], [ 0.2222222222222222, "#7201a8" ], [ 0.3333333333333333, "#9c179e" ], [ 0.4444444444444444, "#bd3786" ], [ 0.5555555555555556, "#d8576b" ], [ 0.6666666666666666, "#ed7953" ], [ 0.7777777777777778, "#fb9f3a" ], [ 0.8888888888888888, "#fdca26" ], [ 1.0, "#f0f921" ] ] } ], "histogram": [ { "type": "histogram", "marker": { "pattern": { "size": 10, "fillmode": "overlay", "solidity": 0.2 } } } ], "parcoords": [ { "line": { "colorbar": { "ticks": "", "outlinewidth": 0 } }, "type": "parcoords" } ], "scatter3d": [ { "line": { "colorbar": { "ticks": "", "outlinewidth": 0 } }, "type": "scatter3d", "marker": { "colorbar": { "ticks": "", "outlinewidth": 0 } } } ], "scattergl": [ { "type": "scattergl", "marker": { "colorbar": { "ticks": "", "outlinewidth": 0 } } } ], "choropleth": [ { "type": "choropleth", "colorbar": { "ticks": "", "outlinewidth": 0 } } ], "scattergeo": [ { "type": "scattergeo", "marker": { "colorbar": { "ticks": "", "outlinewidth": 0 } } } ], "histogram2d": [ { "type": "histogram2d", "colorbar": { "ticks": "", "outlinewidth": 0 }, "colorscale": [ [ 0.0, "#0d0887" ], [ 0.1111111111111111, "#46039f" ], [ 0.2222222222222222, "#7201a8" ], [ 0.3333333333333333, "#9c179e" ], [ 0.4444444444444444, "#bd3786" ], [ 0.5555555555555556, "#d8576b" ], [ 0.6666666666666666, "#ed7953" ], [ 0.7777777777777778, "#fb9f3a" ], [ 0.8888888888888888, "#fdca26" ], [ 1.0, "#f0f921" ] ] } ], "scatterpolar": [ { "type": "scatterpolar", "marker": { "colorbar": { "ticks": "", "outlinewidth": 0 } } } ], "contourcarpet": [ { "type": "contourcarpet", "colorbar": { "ticks": "", "outlinewidth": 0 } } ], "scattercarpet": [ { "type": "scattercarpet", "marker": { "colorbar": { "ticks": "", "outlinewidth": 0 } } } ], "scattermapbox": [ { "type": "scattermapbox", "marker": { "colorbar": { "ticks": "", "outlinewidth": 0 } } } ], "scatterpolargl": [ { "type": "scatterpolargl", "marker": { "colorbar": { "ticks": "", "outlinewidth": 0 } } } ], "scatterternary": [ { "type": "scatterternary", "marker": { "colorbar": { "ticks": "", "outlinewidth": 0 } } } ], "histogram2dcontour": [ { "type": "histogram2dcontour", "colorbar": { "ticks": "", "outlinewidth": 0 }, "colorscale": [ [ 0.0, "#0d0887" ], [ 0.1111111111111111, "#46039f" ], [ 0.2222222222222222, "#7201a8" ], [ 0.3333333333333333, "#9c179e" ], [ 0.4444444444444444, "#bd3786" ], [ 0.5555555555555556, "#d8576b" ], [ 0.6666666666666666, "#ed7953" ], [ 0.7777777777777778, "#fb9f3a" ], [ 0.8888888888888888, "#fdca26" ], [ 1.0, "#f0f921" ] ] } ] }, "layout": { "geo": { "bgcolor": "white", "showland": true, "lakecolor": "white", "landcolor": "#E5ECF6", "showlakes": true, "subunitcolor": "white" }, "font": { "color": "#2a3f5f" }, "polar": { "bgcolor": "#E5ECF6", "radialaxis": { "ticks": "", "gridcolor": "white", "linecolor": "white" }, "angularaxis": { "ticks": "", "gridcolor": "white", "linecolor": "white" } }, "scene": { "xaxis": { "ticks": "", "gridcolor": "white", "gridwidth": 2, "linecolor": "white", "zerolinecolor": "white", "showbackground": true, "backgroundcolor": "#E5ECF6" }, "yaxis": { "ticks": "", "gridcolor": "white", "gridwidth": 2, "linecolor": "white", "zerolinecolor": "white", "showbackground": true, "backgroundcolor": "#E5ECF6" }, "zaxis": { "ticks": "", "gridcolor": "white", "gridwidth": 2, "linecolor": "white", "zerolinecolor": "white", "showbackground": true, "backgroundcolor": "#E5ECF6" } }, "title": { "x": 0.05 }, "xaxis": { "ticks": "", "title": { "standoff": 15 }, "gridcolor": "white", "linecolor": "white", "automargin": true, "zerolinecolor": "white", "zerolinewidth": 2 }, "yaxis": { "ticks": "", "title": { "standoff": 15 }, "gridcolor": "white", "linecolor": "white", "automargin": true, "zerolinecolor": "white", "zerolinewidth": 2 }, "mapbox": { "style": "light" }, "ternary": { "aaxis": { "ticks": "", "gridcolor": "white", "linecolor": "white" }, "baxis": { "ticks": "", "gridcolor": "white", "linecolor": "white" }, "caxis": { "ticks": "", "gridcolor": "white", "linecolor": "white" }, "bgcolor": "#E5ECF6" }, "colorway": [ "#636efa", "#EF553B", "#00cc96", "#ab63fa", "#FFA15A", "#19d3f3", "#FF6692", "#B6E880", "#FF97FF", "#FECB52" ], "coloraxis": { "colorbar": { "ticks": "", "outlinewidth": 0 } }, "hovermode": "closest", "colorscale": { "diverging": [ [ 0, "#8e0152" ], [ 0.1, "#c51b7d" ], [ 0.2, "#de77ae" ], [ 0.3, "#f1b6da" ], [ 0.4, "#fde0ef" ], [ 0.5, "#f7f7f7" ], [ 0.6, "#e6f5d0" ], [ 0.7, "#b8e186" ], [ 0.8, "#7fbc41" ], [ 0.9, "#4d9221" ], [ 1, "#276419" ] ], "sequential": [ [ 0.0, "#0d0887" ], [ 0.1111111111111111, "#46039f" ], [ 0.2222222222222222, "#7201a8" ], [ 0.3333333333333333, "#9c179e" ], [ 0.4444444444444444, "#bd3786" ], [ 0.5555555555555556, "#d8576b" ], [ 0.6666666666666666, "#ed7953" ], [ 0.7777777777777778, "#fb9f3a" ], [ 0.8888888888888888, "#fdca26" ], [ 1.0, "#f0f921" ] ], "sequentialminus": [ [ 0.0, "#0d0887" ], [ 0.1111111111111111, "#46039f" ], [ 0.2222222222222222, "#7201a8" ], [ 0.3333333333333333, "#9c179e" ], [ 0.4444444444444444, "#bd3786" ], [ 0.5555555555555556, "#d8576b" ], [ 0.6666666666666666, "#ed7953" ], [ 0.7777777777777778, "#fb9f3a" ], [ 0.8888888888888888, "#fdca26" ], [ 1.0, "#f0f921" ] ] }, "hoverlabel": { "align": "left" }, "plot_bgcolor": "#E5ECF6", "paper_bgcolor": "white", "shapedefaults": { "line": { "color": "#2a3f5f" } }, "autotypenumbers": "strict", "annotationdefaults": { "arrowhead": 0, "arrowcolor": "#2a3f5f", "arrowwidth": 1 } } }, "showlegend": false } }, "height": 500, "width": 1000, "user": { "profile_url": "https://chart-studio.plotly.com/~bald_power", "avatar_url": "https://storage.googleapis.com/plotly-prod-profiles/26.jpg", "background_url": "https://storage.googleapis.com/plotly-prod-profiles/bg-5.jpg", "bio": "", "nickname": "", "website": "", "stream_tokens": null, "feature_set_id": null, "csrf_token": null, "date_joined": "2024-04-09 11:55:25", "mapbox_access_tokens": null, "has_password": null, "username": "bald_power", "email": null, "is_active": null, "readonly": null, "is_dash_creator": null, "dash_created_count": null, "is_chart_creator": null, "charts_created_count": null } }, { "creation_time": "2024-04-09T12:26:01.739932Z", "comments": { "results": [], "count": 0 }, "parented": true, "embed_url": "https://chart-studio.plotly.com/~bald_power/6.embed", "fid": "bald_power:6", "filename": "10K stats", "filetype": "plot", "img_url": "https://storage.googleapis.com/plotly-prod-images/bald_power/6/9_4GVTXC9GISGSKOZ7RH88WUUPMMF50U.png", "image_urls": { "default": "https://storage.googleapis.com/plotly-prod-images/bald_power/6/2_M1NVKCDPC85D6R3809Y1165LC2V3EZ.png", "block-thumb": "https://storage.googleapis.com/plotly-prod-images/bald_power/6/8_FTHV1JUNAX3TVED0G44VNDSHJCV5IN.png", "list-thumb": "https://storage.googleapis.com/plotly-prod-images/bald_power/6/9_4GVTXC9GISGSKOZ7RH88WUUPMMF50U.png" }, "api_urls": { "files": "https://api.plotly.com/v2/files/bald_power:6", "plots": "https://api.plotly.com/v2/plots/bald_power:6", "parent": "https://api.plotly.com/v2/folders/home?user=bald_power" }, "owner": "bald_power", "parent": -1, "preview": "", "referencers": [], "references": [], "title": "", "views": 66, "web_url": "https://chart-studio.plotly.com/~bald_power/6/", "world_readable": true, "date_modified": "2025-08-04T14:03:34.687Z", "stars": { "results": [], "count": 0 }, "collaborators": { "results": [], "count": 0 }, "subfolder_count": null, "refresh_interval": null, "organize_view_url": "https://chart-studio.plotly.com/~bald_power/6/", "current_user_permission": "read", "is_theme": null, "is_template": null, "autosize": true, "caption": "", "figure": { "data": [ { "mode": "markers", "name": "10K", "type": "scatter", "xsrc": "bald_power:32:ebaa49", "ysrc": "bald_power:32:450a1c", "xaxis": "x", "yaxis": "y", "marker": { "color": "#636efa", "symbol": "circle" }, "showlegend": true, "legendgroup": "10K", "orientation": "v", "customdatasrc": "bald_power:32:38e024", "hovertemplate": "Date=%{x}<br>Race name=%{customdata[0]}<br>Shoes=%{customdata[1]}<br>Time at finish (netto)=%{customdata[2]}<br>Avg speed m/s=%{customdata[4]}<extra></extra>" }, { "mode": "lines", "name": "10K", "type": "scatter", "xsrc": "bald_power:32:0603dd", "ysrc": "bald_power:32:1da304", "xaxis": "x", "yaxis": "y", "marker": { "color": "#636efa", "symbol": "circle" }, "showlegend": false, "legendgroup": "10K", "hovertemplate": "<b>OLS trendline</b><br>Chiptime Seconds = -3.96195e-06 * Date + 9113.34<br>R<sup>2</sup>=0.607722<br><br>Date=%{x}<extra></extra>" }, { "mode": "markers", "type": "scatter", "xsrc": "bald_power:32:3cc2ae", "ysrc": "bald_power:32:d83bb4", "marker": { "size": 15, "color": "orange", "symbol": "star" } } ], "layout": { "title": { "text": "Race Times for 10K" }, "width": 1000, "xaxis": { "title": { "text": "Date" }, "anchor": "y", "domain": [ 0.0, 1.0 ] }, "yaxis": { "title": { "text": "Chiptime (netto)" }, "anchor": "x", "domain": [ 0.0, 1.0 ], "ticktext": [ "00:00:00", "00:05:00", "00:10:00", "00:15:00", "00:20:00", "00:25:00", "00:30:00", "00:35:00", "00:40:00", "00:45:00", "00:50:00", "00:55:00", "01:00:00", "01:05:00" ], "tickvals": [ 0, 300, 600, 900, 1200, 1500, 1800, 2100, 2400, 2700, 3000, 3300, 3600, 3900 ], "autorange": "reversed" }, "height": 500, "legend": { "title": { "text": "Distance" }, "tracegroupgap": 0 }, "template": { "data": { "bar": [ { "type": "bar", "marker": { "line": { "color": "#E5ECF6", "width": 0.5 }, "pattern": { "size": 10, "fillmode": "overlay", "solidity": 0.2 } }, "error_x": { "color": "#2a3f5f" }, "error_y": { "color": "#2a3f5f" } } ], "pie": [ { "type": "pie", "automargin": true } ], "table": [ { "type": "table", "cells": { "fill": { "color": "#EBF0F8" }, "line": { "color": "white" } }, "header": { "fill": { "color": "#C8D4E3" }, "line": { "color": "white" } } } ], "carpet": [ { "type": "carpet", "aaxis": { "gridcolor": "white", "linecolor": "white", "endlinecolor": "#2a3f5f", "minorgridcolor": "white", "startlinecolor": "#2a3f5f" }, "baxis": { "gridcolor": "white", "linecolor": "white", "endlinecolor": "#2a3f5f", "minorgridcolor": "white", "startlinecolor": "#2a3f5f" } } ], "mesh3d": [ { "type": "mesh3d", "colorbar": { "ticks": "", "outlinewidth": 0 } } ], "contour": [ { "type": "contour", "colorbar": { "ticks": "", "outlinewidth": 0 }, "colorscale": [ [ 0.0, "#0d0887" ], [ 0.1111111111111111, "#46039f" ], [ 0.2222222222222222, "#7201a8" ], [ 0.3333333333333333, "#9c179e" ], [ 0.4444444444444444, "#bd3786" ], [ 0.5555555555555556, "#d8576b" ], [ 0.6666666666666666, "#ed7953" ], [ 0.7777777777777778, "#fb9f3a" ], [ 0.8888888888888888, "#fdca26" ], [ 1.0, "#f0f921" ] ] } ], "heatmap": [ { "type": "heatmap", "colorbar": { "ticks": "", "outlinewidth": 0 }, "colorscale": [ [ 0.0, "#0d0887" ], [ 0.1111111111111111, "#46039f" ], [ 0.2222222222222222, "#7201a8" ], [ 0.3333333333333333, "#9c179e" ], [ 0.4444444444444444, "#bd3786" ], [ 0.5555555555555556, "#d8576b" ], [ 0.6666666666666666, "#ed7953" ], [ 0.7777777777777778, "#fb9f3a" ], [ 0.8888888888888888, "#fdca26" ], [ 1.0, "#f0f921" ] ] } ], "scatter": [ { "type": "scatter", "fillpattern": { "size": 10, "fillmode": "overlay", "solidity": 0.2 } } ], "surface": [ { "type": "surface", "colorbar": { "ticks": "", "outlinewidth": 0 }, "colorscale": [ [ 0.0, "#0d0887" ], [ 0.1111111111111111, "#46039f" ], [ 0.2222222222222222, "#7201a8" ], [ 0.3333333333333333, "#9c179e" ], [ 0.4444444444444444, "#bd3786" ], [ 0.5555555555555556, "#d8576b" ], [ 0.6666666666666666, "#ed7953" ], [ 0.7777777777777778, "#fb9f3a" ], [ 0.8888888888888888, "#fdca26" ], [ 1.0, "#f0f921" ] ] } ], "barpolar": [ { "type": "barpolar", "marker": { "line": { "color": "#E5ECF6", "width": 0.5 }, "pattern": { "size": 10, "fillmode": "overlay", "solidity": 0.2 } } } ], "heatmapgl": [ { "type": "heatmapgl", "colorbar": { "ticks": "", "outlinewidth": 0 }, "colorscale": [ [ 0.0, "#0d0887" ], [ 0.1111111111111111, "#46039f" ], [ 0.2222222222222222, "#7201a8" ], [ 0.3333333333333333, "#9c179e" ], [ 0.4444444444444444, "#bd3786" ], [ 0.5555555555555556, "#d8576b" ], [ 0.6666666666666666, "#ed7953" ], [ 0.7777777777777778, "#fb9f3a" ], [ 0.8888888888888888, "#fdca26" ], [ 1.0, "#f0f921" ] ] } ], "histogram": [ { "type": "histogram", "marker": { "pattern": { "size": 10, "fillmode": "overlay", "solidity": 0.2 } } } ], "parcoords": [ { "line": { "colorbar": { "ticks": "", "outlinewidth": 0 } }, "type": "parcoords" } ], "scatter3d": [ { "line": { "colorbar": { "ticks": "", "outlinewidth": 0 } }, "type": "scatter3d", "marker": { "colorbar": { "ticks": "", "outlinewidth": 0 } } } ], "scattergl": [ { "type": "scattergl", "marker": { "colorbar": { "ticks": "", "outlinewidth": 0 } } } ], "choropleth": [ { "type": "choropleth", "colorbar": { "ticks": "", "outlinewidth": 0 } } ], "scattergeo": [ { "type": "scattergeo", "marker": { "colorbar": { "ticks": "", "outlinewidth": 0 } } } ], "histogram2d": [ { "type": "histogram2d", "colorbar": { "ticks": "", "outlinewidth": 0 }, "colorscale": [ [ 0.0, "#0d0887" ], [ 0.1111111111111111, "#46039f" ], [ 0.2222222222222222, "#7201a8" ], [ 0.3333333333333333, "#9c179e" ], [ 0.4444444444444444, "#bd3786" ], [ 0.5555555555555556, "#d8576b" ], [ 0.6666666666666666, "#ed7953" ], [ 0.7777777777777778, "#fb9f3a" ], [ 0.8888888888888888, "#fdca26" ], [ 1.0, "#f0f921" ] ] } ], "scatterpolar": [ { "type": "scatterpolar", "marker": { "colorbar": { "ticks": "", "outlinewidth": 0 } } } ], "contourcarpet": [ { "type": "contourcarpet", "colorbar": { "ticks": "", "outlinewidth": 0 } } ], "scattercarpet": [ { "type": "scattercarpet", "marker": { "colorbar": { "ticks": "", "outlinewidth": 0 } } } ], "scattermapbox": [ { "type": "scattermapbox", "marker": { "colorbar": { "ticks": "", "outlinewidth": 0 } } } ], "scatterpolargl": [ { "type": "scatterpolargl", "marker": { "colorbar": { "ticks": "", "outlinewidth": 0 } } } ], "scatterternary": [ { "type": "scatterternary", "marker": { "colorbar": { "ticks": "", "outlinewidth": 0 } } } ], "histogram2dcontour": [ { "type": "histogram2dcontour", "colorbar": { "ticks": "", "outlinewidth": 0 }, "colorscale": [ [ 0.0, "#0d0887" ], [ 0.1111111111111111, "#46039f" ], [ 0.2222222222222222, "#7201a8" ], [ 0.3333333333333333, "#9c179e" ], [ 0.4444444444444444, "#bd3786" ], [ 0.5555555555555556, "#d8576b" ], [ 0.6666666666666666, "#ed7953" ], [ 0.7777777777777778, "#fb9f3a" ], [ 0.8888888888888888, "#fdca26" ], [ 1.0, "#f0f921" ] ] } ] }, "layout": { "geo": { "bgcolor": "white", "showland": true, "lakecolor": "white", "landcolor": "#E5ECF6", "showlakes": true, "subunitcolor": "white" }, "font": { "color": "#2a3f5f" }, "polar": { "bgcolor": "#E5ECF6", "radialaxis": { "ticks": "", "gridcolor": "white", "linecolor": "white" }, "angularaxis": { "ticks": "", "gridcolor": "white", "linecolor": "white" } }, "scene": { "xaxis": { "ticks": "", "gridcolor": "white", "gridwidth": 2, "linecolor": "white", "zerolinecolor": "white", "showbackground": true, "backgroundcolor": "#E5ECF6" }, "yaxis": { "ticks": "", "gridcolor": "white", "gridwidth": 2, "linecolor": "white", "zerolinecolor": "white", "showbackground": true, "backgroundcolor": "#E5ECF6" }, "zaxis": { "ticks": "", "gridcolor": "white", "gridwidth": 2, "linecolor": "white", "zerolinecolor": "white", "showbackground": true, "backgroundcolor": "#E5ECF6" } }, "title": { "x": 0.05 }, "xaxis": { "ticks": "", "title": { "standoff": 15 }, "gridcolor": "white", "linecolor": "white", "automargin": true, "zerolinecolor": "white", "zerolinewidth": 2 }, "yaxis": { "ticks": "", "title": { "standoff": 15 }, "gridcolor": "white", "linecolor": "white", "automargin": true, "zerolinecolor": "white", "zerolinewidth": 2 }, "mapbox": { "style": "light" }, "ternary": { "aaxis": { "ticks": "", "gridcolor": "white", "linecolor": "white" }, "baxis": { "ticks": "", "gridcolor": "white", "linecolor": "white" }, "caxis": { "ticks": "", "gridcolor": "white", "linecolor": "white" }, "bgcolor": "#E5ECF6" }, "colorway": [ "#636efa", "#EF553B", "#00cc96", "#ab63fa", "#FFA15A", "#19d3f3", "#FF6692", "#B6E880", "#FF97FF", "#FECB52" ], "coloraxis": { "colorbar": { "ticks": "", "outlinewidth": 0 } }, "hovermode": "closest", "colorscale": { "diverging": [ [ 0, "#8e0152" ], [ 0.1, "#c51b7d" ], [ 0.2, "#de77ae" ], [ 0.3, "#f1b6da" ], [ 0.4, "#fde0ef" ], [ 0.5, "#f7f7f7" ], [ 0.6, "#e6f5d0" ], [ 0.7, "#b8e186" ], [ 0.8, "#7fbc41" ], [ 0.9, "#4d9221" ], [ 1, "#276419" ] ], "sequential": [ [ 0.0, "#0d0887" ], [ 0.1111111111111111, "#46039f" ], [ 0.2222222222222222, "#7201a8" ], [ 0.3333333333333333, "#9c179e" ], [ 0.4444444444444444, "#bd3786" ], [ 0.5555555555555556, "#d8576b" ], [ 0.6666666666666666, "#ed7953" ], [ 0.7777777777777778, "#fb9f3a" ], [ 0.8888888888888888, "#fdca26" ], [ 1.0, "#f0f921" ] ], "sequentialminus": [ [ 0.0, "#0d0887" ], [ 0.1111111111111111, "#46039f" ], [ 0.2222222222222222, "#7201a8" ], [ 0.3333333333333333, "#9c179e" ], [ 0.4444444444444444, "#bd3786" ], [ 0.5555555555555556, "#d8576b" ], [ 0.6666666666666666, "#ed7953" ], [ 0.7777777777777778, "#fb9f3a" ], [ 0.8888888888888888, "#fdca26" ], [ 1.0, "#f0f921" ] ] }, "hoverlabel": { "align": "left" }, "plot_bgcolor": "#E5ECF6", "paper_bgcolor": "white", "shapedefaults": { "line": { "color": "#2a3f5f" } }, "autotypenumbers": "strict", "annotationdefaults": { "arrowhead": 0, "arrowcolor": "#2a3f5f", "arrowwidth": 1 } } }, "showlegend": false } }, "height": 500, "width": 1000, "user": { "profile_url": "https://chart-studio.plotly.com/~bald_power", "avatar_url": "https://storage.googleapis.com/plotly-prod-profiles/26.jpg", "background_url": "https://storage.googleapis.com/plotly-prod-profiles/bg-5.jpg", "bio": "", "nickname": "", "website": "", "stream_tokens": null, "feature_set_id": null, "csrf_token": null, "date_joined": "2024-04-09 11:55:25", "mapbox_access_tokens": null, "has_password": null, "username": "bald_power", "email": null, "is_active": null, "readonly": null, "is_dash_creator": null, "dash_created_count": null, "is_chart_creator": null, "charts_created_count": null } }, { "creation_time": "2024-04-09T12:25:51.542702Z", "comments": { "results": [], "count": 0 }, "parented": true, "embed_url": "https://chart-studio.plotly.com/~bald_power/4.embed", "fid": "bald_power:4", "filename": "5K stats", "filetype": "plot", "img_url": "https://storage.googleapis.com/plotly-prod-images/bald_power/4/9_ASJ8EXH47FCCJJ3QCO0UZTK5XTMKSW.png", "image_urls": { "default": "https://storage.googleapis.com/plotly-prod-images/bald_power/4/2_UL93OPWBKPKF8GAVJZRMDRKUATDFON.png", "block-thumb": "https://storage.googleapis.com/plotly-prod-images/bald_power/4/8_YS7Z4K5VJG1NXZGOB9U58Y5BWJ0V3J.png", "list-thumb": "https://storage.googleapis.com/plotly-prod-images/bald_power/4/9_ASJ8EXH47FCCJJ3QCO0UZTK5XTMKSW.png" }, "api_urls": { "files": "https://api.plotly.com/v2/files/bald_power:4", "plots": "https://api.plotly.com/v2/plots/bald_power:4", "parent": "https://api.plotly.com/v2/folders/home?user=bald_power" }, "owner": "bald_power", "parent": -1, "preview": "", "referencers": [], "references": [], "title": "", "views": 50, "web_url": "https://chart-studio.plotly.com/~bald_power/4/", "world_readable": true, "date_modified": "2025-08-04T14:03:20.748Z", "stars": { "results": [], "count": 0 }, "collaborators": { "results": [], "count": 0 }, "subfolder_count": null, "refresh_interval": null, "organize_view_url": "https://chart-studio.plotly.com/~bald_power/4/", "current_user_permission": "read", "is_theme": null, "is_template": null, "autosize": true, "caption": "", "figure": { "data": [ { "mode": "markers", "name": "5K", "type": "scatter", "xsrc": "bald_power:31:84426e", "ysrc": "bald_power:31:24bc9f", "xaxis": "x", "yaxis": "y", "marker": { "color": "#636efa", "symbol": "circle" }, "showlegend": true, "legendgroup": "5K", "orientation": "v", "customdatasrc": "bald_power:31:74def8", "hovertemplate": "Date=%{x}<br>Race name=%{customdata[0]}<br>Shoes=%{customdata[1]}<br>Time at finish (netto)=%{customdata[2]}<br>Avg speed m/s=%{customdata[4]}<extra></extra>" }, { "mode": "lines", "name": "5K", "type": "scatter", "xsrc": "bald_power:31:449e93", "ysrc": "bald_power:31:bfe484", "xaxis": "x", "yaxis": "y", "marker": { "color": "#636efa", "symbol": "circle" }, "showlegend": false, "legendgroup": "5K", "hovertemplate": "<b>OLS trendline</b><br>Chiptime Seconds = -9.07571e-07 * Date + 2650.15<br>R<sup>2</sup>=0.884562<br><br>Date=%{x}<extra></extra>" }, { "mode": "markers", "type": "scatter", "xsrc": "bald_power:31:09439b", "ysrc": "bald_power:31:3c08c0", "marker": { "size": 15, "color": "orange", "symbol": "star" } } ], "layout": { "title": { "text": "Race Times for 5K" }, "width": 1000, "xaxis": { "title": { "text": "Date" }, "anchor": "y", "domain": [ 0.0, 1.0 ] }, "yaxis": { "title": { "text": "Chiptime (netto)" }, "anchor": "x", "domain": [ 0.0, 1.0 ], "ticktext": [ "00:00:00", "00:00:10", "00:00:20", "00:00:30", "00:00:40", "00:00:50", "00:01:00", "00:01:10", "00:01:20", "00:01:30", "00:01:40", "00:01:50", "00:02:00", "00:02:10", "00:02:20", "00:02:30", "00:02:40", "00:02:50", "00:03:00", "00:03:10", "00:03:20", "00:03:30", "00:03:40", "00:03:50", "00:04:00", "00:04:10", "00:04:20", "00:04:30", "00:04:40", "00:04:50", "00:05:00", "00:05:10", "00:05:20", "00:05:30", "00:05:40", "00:05:50", "00:06:00", "00:06:10", "00:06:20", "00:06:30", "00:06:40", "00:06:50", "00:07:00", "00:07:10", "00:07:20", "00:07:30", "00:07:40", "00:07:50", "00:08:00", "00:08:10", "00:08:20", "00:08:30", "00:08:40", "00:08:50", "00:09:00", "00:09:10", "00:09:20", "00:09:30", "00:09:40", "00:09:50", "00:10:00", "00:10:10", "00:10:20", "00:10:30", "00:10:40", "00:10:50", "00:11:00", "00:11:10", "00:11:20", "00:11:30", "00:11:40", "00:11:50", "00:12:00", "00:12:10", "00:12:20", "00:12:30", "00:12:40", "00:12:50", "00:13:00", "00:13:10", "00:13:20", "00:13:30", "00:13:40", "00:13:50", "00:14:00", "00:14:10", "00:14:20", "00:14:30", "00:14:40", "00:14:50", "00:15:00", "00:15:10", "00:15:20", "00:15:30", "00:15:40", "00:15:50", "00:16:00", "00:16:10", "00:16:20", "00:16:30", "00:16:40", "00:16:50", "00:17:00", "00:17:10", "00:17:20", "00:17:30", "00:17:40", "00:17:50", "00:18:00", "00:18:10", "00:18:20", "00:18:30", "00:18:40", "00:18:50", "00:19:00", "00:19:10", "00:19:20" ], "tickvals": [ 0, 10, 20, 30, 40, 50, 60, 70, 80, 90, 100, 110, 120, 130, 140, 150, 160, 170, 180, 190, 200, 210, 220, 230, 240, 250, 260, 270, 280, 290, 300, 310, 320, 330, 340, 350, 360, 370, 380, 390, 400, 410, 420, 430, 440, 450, 460, 470, 480, 490, 500, 510, 520, 530, 540, 550, 560, 570, 580, 590, 600, 610, 620, 630, 640, 650, 660, 670, 680, 690, 700, 710, 720, 730, 740, 750, 760, 770, 780, 790, 800, 810, 820, 830, 840, 850, 860, 870, 880, 890, 900, 910, 920, 930, 940, 950, 960, 970, 980, 990, 1000, 1010, 1020, 1030, 1040, 1050, 1060, 1070, 1080, 1090, 1100, 1110, 1120, 1130, 1140, 1150, 1160 ], "autorange": "reversed" }, "height": 500, "legend": { "title": { "text": "Distance" }, "tracegroupgap": 0 }, "template": { "data": { "bar": [ { "type": "bar", "marker": { "line": { "color": "#E5ECF6", "width": 0.5 }, "pattern": { "size": 10, "fillmode": "overlay", "solidity": 0.2 } }, "error_x": { "color": "#2a3f5f" }, "error_y": { "color": "#2a3f5f" } } ], "pie": [ { "type": "pie", "automargin": true } ], "table": [ { "type": "table", "cells": { "fill": { "color": "#EBF0F8" }, "line": { "color": "white" } }, "header": { "fill": { "color": "#C8D4E3" }, "line": { "color": "white" } } } ], "carpet": [ { "type": "carpet", "aaxis": { "gridcolor": "white", "linecolor": "white", "endlinecolor": "#2a3f5f", "minorgridcolor": "white", "startlinecolor": "#2a3f5f" }, "baxis": { "gridcolor": "white", "linecolor": "white", "endlinecolor": "#2a3f5f", "minorgridcolor": "white", "startlinecolor": "#2a3f5f" } } ], "mesh3d": [ { "type": "mesh3d", "colorbar": { "ticks": "", "outlinewidth": 0 } } ], "contour": [ { "type": "contour", "colorbar": { "ticks": "", "outlinewidth": 0 }, "colorscale": [ [ 0.0, "#0d0887" ], [ 0.1111111111111111, "#46039f" ], [ 0.2222222222222222, "#7201a8" ], [ 0.3333333333333333, "#9c179e" ], [ 0.4444444444444444, "#bd3786" ], [ 0.5555555555555556, "#d8576b" ], [ 0.6666666666666666, "#ed7953" ], [ 0.7777777777777778, "#fb9f3a" ], [ 0.8888888888888888, "#fdca26" ], [ 1.0, "#f0f921" ] ] } ], "heatmap": [ { "type": "heatmap", "colorbar": { "ticks": "", "outlinewidth": 0 }, "colorscale": [ [ 0.0, "#0d0887" ], [ 0.1111111111111111, "#46039f" ], [ 0.2222222222222222, "#7201a8" ], [ 0.3333333333333333, "#9c179e" ], [ 0.4444444444444444, "#bd3786" ], [ 0.5555555555555556, "#d8576b" ], [ 0.6666666666666666, "#ed7953" ], [ 0.7777777777777778, "#fb9f3a" ], [ 0.8888888888888888, "#fdca26" ], [ 1.0, "#f0f921" ] ] } ], "scatter": [ { "type": "scatter", "fillpattern": { "size": 10, "fillmode": "overlay", "solidity": 0.2 } } ], "surface": [ { "type": "surface", "colorbar": { "ticks": "", "outlinewidth": 0 }, "colorscale": [ [ 0.0, "#0d0887" ], [ 0.1111111111111111, "#46039f" ], [ 0.2222222222222222, "#7201a8" ], [ 0.3333333333333333, "#9c179e" ], [ 0.4444444444444444, "#bd3786" ], [ 0.5555555555555556, "#d8576b" ], [ 0.6666666666666666, "#ed7953" ], [ 0.7777777777777778, "#fb9f3a" ], [ 0.8888888888888888, "#fdca26" ], [ 1.0, "#f0f921" ] ] } ], "barpolar": [ { "type": "barpolar", "marker": { "line": { "color": "#E5ECF6", "width": 0.5 }, "pattern": { "size": 10, "fillmode": "overlay", "solidity": 0.2 } } } ], "heatmapgl": [ { "type": "heatmapgl", "colorbar": { "ticks": "", "outlinewidth": 0 }, "colorscale": [ [ 0.0, "#0d0887" ], [ 0.1111111111111111, "#46039f" ], [ 0.2222222222222222, "#7201a8" ], [ 0.3333333333333333, "#9c179e" ], [ 0.4444444444444444, "#bd3786" ], [ 0.5555555555555556, "#d8576b" ], [ 0.6666666666666666, "#ed7953" ], [ 0.7777777777777778, "#fb9f3a" ], [ 0.8888888888888888, "#fdca26" ], [ 1.0, "#f0f921" ] ] } ], "histogram": [ { "type": "histogram", "marker": { "pattern": { "size": 10, "fillmode": "overlay", "solidity": 0.2 } } } ], "parcoords": [ { "line": { "colorbar": { "ticks": "", "outlinewidth": 0 } }, "type": "parcoords" } ], "scatter3d": [ { "line": { "colorbar": { "ticks": "", "outlinewidth": 0 } }, "type": "scatter3d", "marker": { "colorbar": { "ticks": "", "outlinewidth": 0 } } } ], "scattergl": [ { "type": "scattergl", "marker": { "colorbar": { "ticks": "", "outlinewidth": 0 } } } ], "choropleth": [ { "type": "choropleth", "colorbar": { "ticks": "", "outlinewidth": 0 } } ], "scattergeo": [ { "type": "scattergeo", "marker": { "colorbar": { "ticks": "", "outlinewidth": 0 } } } ], "histogram2d": [ { "type": "histogram2d", "colorbar": { "ticks": "", "outlinewidth": 0 }, "colorscale": [ [ 0.0, "#0d0887" ], [ 0.1111111111111111, "#46039f" ], [ 0.2222222222222222, "#7201a8" ], [ 0.3333333333333333, "#9c179e" ], [ 0.4444444444444444, "#bd3786" ], [ 0.5555555555555556, "#d8576b" ], [ 0.6666666666666666, "#ed7953" ], [ 0.7777777777777778, "#fb9f3a" ], [ 0.8888888888888888, "#fdca26" ], [ 1.0, "#f0f921" ] ] } ], "scatterpolar": [ { "type": "scatterpolar", "marker": { "colorbar": { "ticks": "", "outlinewidth": 0 } } } ], "contourcarpet": [ { "type": "contourcarpet", "colorbar": { "ticks": "", "outlinewidth": 0 } } ], "scattercarpet": [ { "type": "scattercarpet", "marker": { "colorbar": { "ticks": "", "outlinewidth": 0 } } } ], "scattermapbox": [ { "type": "scattermapbox", "marker": { "colorbar": { "ticks": "", "outlinewidth": 0 } } } ], "scatterpolargl": [ { "type": "scatterpolargl", "marker": { "colorbar": { "ticks": "", "outlinewidth": 0 } } } ], "scatterternary": [ { "type": "scatterternary", "marker": { "colorbar": { "ticks": "", "outlinewidth": 0 } } } ], "histogram2dcontour": [ { "type": "histogram2dcontour", "colorbar": { "ticks": "", "outlinewidth": 0 }, "colorscale": [ [ 0.0, "#0d0887" ], [ 0.1111111111111111, "#46039f" ], [ 0.2222222222222222, "#7201a8" ], [ 0.3333333333333333, "#9c179e" ], [ 0.4444444444444444, "#bd3786" ], [ 0.5555555555555556, "#d8576b" ], [ 0.6666666666666666, "#ed7953" ], [ 0.7777777777777778, "#fb9f3a" ], [ 0.8888888888888888, "#fdca26" ], [ 1.0, "#f0f921" ] ] } ] }, "layout": { "geo": { "bgcolor": "white", "showland": true, "lakecolor": "white", "landcolor": "#E5ECF6", "showlakes": true, "subunitcolor": "white" }, "font": { "color": "#2a3f5f" }, "polar": { "bgcolor": "#E5ECF6", "radialaxis": { "ticks": "", "gridcolor": "white", "linecolor": "white" }, "angularaxis": { "ticks": "", "gridcolor": "white", "linecolor": "white" } }, "scene": { "xaxis": { "ticks": "", "gridcolor": "white", "gridwidth": 2, "linecolor": "white", "zerolinecolor": "white", "showbackground": true, "backgroundcolor": "#E5ECF6" }, "yaxis": { "ticks": "", "gridcolor": "white", "gridwidth": 2, "linecolor": "white", "zerolinecolor": "white", "showbackground": true, "backgroundcolor": "#E5ECF6" }, "zaxis": { "ticks": "", "gridcolor": "white", "gridwidth": 2, "linecolor": "white", "zerolinecolor": "white", "showbackground": true, "backgroundcolor": "#E5ECF6" } }, "title": { "x": 0.05 }, "xaxis": { "ticks": "", "title": { "standoff": 15 }, "gridcolor": "white", "linecolor": "white", "automargin": true, "zerolinecolor": "white", "zerolinewidth": 2 }, "yaxis": { "ticks": "", "title": { "standoff": 15 }, "gridcolor": "white", "linecolor": "white", "automargin": true, "zerolinecolor": "white", "zerolinewidth": 2 }, "mapbox": { "style": "light" }, "ternary": { "aaxis": { "ticks": "", "gridcolor": "white", "linecolor": "white" }, "baxis": { "ticks": "", "gridcolor": "white", "linecolor": "white" }, "caxis": { "ticks": "", "gridcolor": "white", "linecolor": "white" }, "bgcolor": "#E5ECF6" }, "colorway": [ "#636efa", "#EF553B", "#00cc96", "#ab63fa", "#FFA15A", "#19d3f3", "#FF6692", "#B6E880", "#FF97FF", "#FECB52" ], "coloraxis": { "colorbar": { "ticks": "", "outlinewidth": 0 } }, "hovermode": "closest", "colorscale": { "diverging": [ [ 0, "#8e0152" ], [ 0.1, "#c51b7d" ], [ 0.2, "#de77ae" ], [ 0.3, "#f1b6da" ], [ 0.4, "#fde0ef" ], [ 0.5, "#f7f7f7" ], [ 0.6, "#e6f5d0" ], [ 0.7, "#b8e186" ], [ 0.8, "#7fbc41" ], [ 0.9, "#4d9221" ], [ 1, "#276419" ] ], "sequential": [ [ 0.0, "#0d0887" ], [ 0.1111111111111111, "#46039f" ], [ 0.2222222222222222, "#7201a8" ], [ 0.3333333333333333, "#9c179e" ], [ 0.4444444444444444, "#bd3786" ], [ 0.5555555555555556, "#d8576b" ], [ 0.6666666666666666, "#ed7953" ], [ 0.7777777777777778, "#fb9f3a" ], [ 0.8888888888888888, "#fdca26" ], [ 1.0, "#f0f921" ] ], "sequentialminus": [ [ 0.0, "#0d0887" ], [ 0.1111111111111111, "#46039f" ], [ 0.2222222222222222, "#7201a8" ], [ 0.3333333333333333, "#9c179e" ], [ 0.4444444444444444, "#bd3786" ], [ 0.5555555555555556, "#d8576b" ], [ 0.6666666666666666, "#ed7953" ], [ 0.7777777777777778, "#fb9f3a" ], [ 0.8888888888888888, "#fdca26" ], [ 1.0, "#f0f921" ] ] }, "hoverlabel": { "align": "left" }, "plot_bgcolor": "#E5ECF6", "paper_bgcolor": "white", "shapedefaults": { "line": { "color": "#2a3f5f" } }, "autotypenumbers": "strict", "annotationdefaults": { "arrowhead": 0, "arrowcolor": "#2a3f5f", "arrowwidth": 1 } } }, "showlegend": false } }, "height": 500, "width": 1000, "user": { "profile_url": "https://chart-studio.plotly.com/~bald_power", "avatar_url": "https://storage.googleapis.com/plotly-prod-profiles/26.jpg", "background_url": "https://storage.googleapis.com/plotly-prod-profiles/bg-5.jpg", "bio": "", "nickname": "", "website": "", "stream_tokens": null, "feature_set_id": null, "csrf_token": null, "date_joined": "2024-04-09 11:55:25", "mapbox_access_tokens": null, "has_password": null, "username": "bald_power", "email": null, "is_active": null, "readonly": null, "is_dash_creator": null, "dash_created_count": null, "is_chart_creator": null, "charts_created_count": null } }, { "creation_time": "2024-04-09T12:23:26.803325Z", "comments": { "results": [], "count": 0 }, "parented": true, "embed_url": "https://chart-studio.plotly.com/~devorah97/17.embed", "fid": "devorah97:17", "filename": "geranium absorbance", "filetype": "plot", "img_url": "https://storage.googleapis.com/plotly-prod-images/devorah97/17/9_LSX5A2R5IZM6HM1J0UZ8AK26OEHTNH.png", "image_urls": { "default": "https://storage.googleapis.com/plotly-prod-images/devorah97/17/2_M7KX463PB7BR9LFJ45Y8D5QN6ESMWC.png", "block-thumb": "https://storage.googleapis.com/plotly-prod-images/devorah97/17/8_HVTLAGJJHLQE6PA1WZ9GAS6NAHEENY.png", "list-thumb": "https://storage.googleapis.com/plotly-prod-images/devorah97/17/9_LSX5A2R5IZM6HM1J0UZ8AK26OEHTNH.png" }, "api_urls": { "files": "https://api.plotly.com/v2/files/devorah97:17", "plots": "https://api.plotly.com/v2/plots/devorah97:17", "parent": "https://api.plotly.com/v2/folders/home?user=devorah97" }, "owner": "devorah97", "parent": -1, "preview": "", "referencers": [], "references": [], "title": "", "views": 1, "web_url": "https://chart-studio.plotly.com/~devorah97/17/", "world_readable": true, "date_modified": "2024-04-09T12:29:17.389Z", "stars": { "results": [], "count": 0 }, "collaborators": { "results": [], "count": 0 }, "subfolder_count": null, "refresh_interval": null, "organize_view_url": "https://chart-studio.plotly.com/~devorah97/17/", "current_user_permission": "read", "is_theme": null, "is_template": false, "autosize": true, "caption": "", "figure": { "data": [ { "uid": "54742b", "meta": { "columnNames": { "x": "wavelength", "y": "Geranium: Absorbance" } }, "mode": "lines", "name": "geranium ", "type": "scatter", "xsrc": "devorah97:16:325b83", "ysrc": "devorah97:16:9c6423" } ], "frames": [], "layout": { "title": { "text": "Geranium: Absorbance" }, "xaxis": { "type": "linear", "range": [ 400, 808.7815785322725 ], "title": { "text": "wavelength nm" }, "autorange": true }, "yaxis": { "type": "linear", "range": [ -42.90063800411129, 107.5210862107427 ], "title": { "text": "absorbance of geranium extract" }, "autorange": true }, "autosize": true, "template": { "data": { "bar": [ { "type": "bar", "marker": { "colorbar": { "ticks": "", "outlinewidth": 0 } } } ], "table": [ { "type": "table", "cells": { "fill": { "color": "#EBF0F8" }, "line": { "color": "white" } }, "header": { "fill": { "color": "#C8D4E3" }, "line": { "color": "white" } } } ], "carpet": [ { "type": "carpet", "aaxis": { "gridcolor": "#C8D4E3", "linecolor": "#C8D4E3", "endlinecolor": "#2a3f5f", "minorgridcolor": "#C8D4E3", "startlinecolor": "#2a3f5f" }, "baxis": { "gridcolor": "#C8D4E3", "linecolor": "#C8D4E3", "endlinecolor": "#2a3f5f", "minorgridcolor": "#C8D4E3", "startlinecolor": "#2a3f5f" } } ], "mesh3d": [ { "type": "mesh3d", "colorbar": { "ticks": "", "outlinewidth": 0 } } ], "contour": [ { "type": "contour", "colorbar": { "ticks": "", "outlinewidth": 0 }, "autocolorscale": true } ], "heatmap": [ { "type": "heatmap", "colorbar": { "ticks": "", "outlinewidth": 0 }, "autocolorscale": true } ], "scatter": [ { "type": "scatter", "marker": { "colorbar": { "ticks": "", "outlinewidth": 0 } } } ], "surface": [ { "type": "surface", "colorbar": { "ticks": "", "outlinewidth": 0 } } ], "heatmapgl": [ { "type": "heatmapgl", "colorbar": { "ticks": "", "outlinewidth": 0 } } ], "histogram": [ { "type": "histogram", "marker": { "colorbar": { "ticks": "", "outlinewidth": 0 } } } ], "parcoords": [ { "line": { "colorbar": { "ticks": "", "outlinewidth": 0 } }, "type": "parcoords" } ], "scatter3d": [ { "type": "scatter3d", "marker": { "colorbar": { "ticks": "", "outlinewidth": 0 } } } ], "scattergl": [ { "type": "scattergl", "marker": { "colorbar": { "ticks": "", "outlinewidth": 0 } } } ], "choropleth": [ { "type": "choropleth", "colorbar": { "ticks": "", "outlinewidth": 0 } } ], "scattergeo": [ { "type": "scattergeo", "marker": { "colorbar": { "ticks": "", "outlinewidth": 0 } } } ], "histogram2d": [ { "type": "histogram2d", "colorbar": { "ticks": "", "outlinewidth": 0 }, "autocolorscale": true } ], "scatterpolar": [ { "type": "scatterpolar", "marker": { "colorbar": { "ticks": "", "outlinewidth": 0 } } } ], "contourcarpet": [ { "type": "contourcarpet", "colorbar": { "ticks": "", "outlinewidth": 0 } } ], "scattercarpet": [ { "type": "scattercarpet", "marker": { "colorbar": { "ticks": "", "outlinewidth": 0 } } } ], "scattermapbox": [ { "type": "scattermapbox", "marker": { "colorbar": { "ticks": "", "outlinewidth": 0 } } } ], "scatterpolargl": [ { "type": "scatterpolargl", "marker": { "colorbar": { "ticks": "", "outlinewidth": 0 } } } ], "scatterternary": [ { "type": "scatterternary", "marker": { "colorbar": { "ticks": "", "outlinewidth": 0 } } } ], "histogram2dcontour": [ { "type": "histogram2dcontour", "colorbar": { "ticks": "", "outlinewidth": 0 }, "autocolorscale": true } ] }, "layout": { "geo": { "bgcolor": "white", "showland": true, "lakecolor": "white", "landcolor": "white", "showlakes": true, "subunitcolor": "#C8D4E3" }, "font": { "color": "#2a3f5f" }, "polar": { "bgcolor": "white", "radialaxis": { "ticks": "", "gridcolor": "#EBF0F8", "linecolor": "#EBF0F8" }, "angularaxis": { "ticks": "", "gridcolor": "#EBF0F8", "linecolor": "#EBF0F8" } }, "scene": { "xaxis": { "ticks": "", "gridcolor": "#DFE8F3", "gridwidth": 2, "linecolor": "#EBF0F8", "zerolinecolor": "#EBF0F8", "showbackground": true, "backgroundcolor": "white" }, "yaxis": { "ticks": "", "gridcolor": "#DFE8F3", "gridwidth": 2, "linecolor": "#EBF0F8", "zerolinecolor": "#EBF0F8", "showbackground": true, "backgroundcolor": "white" }, "zaxis": { "ticks": "", "gridcolor": "#DFE8F3", "gridwidth": 2, "linecolor": "#EBF0F8", "zerolinecolor": "#EBF0F8", "showbackground": true, "backgroundcolor": "white" } }, "title": { "x": 0.05 }, "xaxis": { "ticks": "", "gridcolor": "#EBF0F8", "linecolor": "#EBF0F8", "automargin": true, "zerolinecolor": "#EBF0F8", "zerolinewidth": 2 }, "yaxis": { "ticks": "", "gridcolor": "#EBF0F8", "linecolor": "#EBF0F8", "automargin": true, "zerolinecolor": "#EBF0F8", "zerolinewidth": 2 }, "ternary": { "aaxis": { "ticks": "", "gridcolor": "#DFE8F3", "linecolor": "#A2B1C6" }, "baxis": { "ticks": "", "gridcolor": "#DFE8F3", "linecolor": "#A2B1C6" }, "caxis": { "ticks": "", "gridcolor": "#DFE8F3", "linecolor": "#A2B1C6" }, "bgcolor": "white" }, "colorway": [ "#636efa", "#EF553B", "#00cc96", "#ab63fa", "#19d3f3", "#e763fa", "#fecb52", "#ffa15a", "#ff6692", "#b6e880" ], "hovermode": "closest", "colorscale": { "diverging": [ [ 0, "#8e0152" ], [ 0.1, "#c51b7d" ], [ 0.2, "#de77ae" ], [ 0.3, "#f1b6da" ], [ 0.4, "#fde0ef" ], [ 0.5, "#f7f7f7" ], [ 0.6, "#e6f5d0" ], [ 0.7, "#b8e186" ], [ 0.8, "#7fbc41" ], [ 0.9, "#4d9221" ], [ 1, "#276419" ] ], "sequential": [ [ 0, "#0508b8" ], [ 0.0893854748603352, "#1910d8" ], [ 0.1787709497206704, "#3c19f0" ], [ 0.2681564245810056, "#6b1cfb" ], [ 0.3575418994413408, "#981cfd" ], [ 0.44692737430167595, "#bf1cfd" ], [ 0.5363128491620112, "#dd2bfd" ], [ 0.6256983240223464, "#f246fe" ], [ 0.7150837988826816, "#fc67fd" ], [ 0.8044692737430168, "#fe88fc" ], [ 0.8938547486033519, "#fea5fd" ], [ 0.9832402234636871, "#febefe" ], [ 1, "#fec3fe" ] ], "sequentialminus": [ [ 0, "#0508b8" ], [ 0.0893854748603352, "#1910d8" ], [ 0.1787709497206704, "#3c19f0" ], [ 0.2681564245810056, "#6b1cfb" ], [ 0.3575418994413408, "#981cfd" ], [ 0.44692737430167595, "#bf1cfd" ], [ 0.5363128491620112, "#dd2bfd" ], [ 0.6256983240223464, "#f246fe" ], [ 0.7150837988826816, "#fc67fd" ], [ 0.8044692737430168, "#fe88fc" ], [ 0.8938547486033519, "#fea5fd" ], [ 0.9832402234636871, "#febefe" ], [ 1, "#fec3fe" ] ] }, "plot_bgcolor": "white", "paper_bgcolor": "white", "shapedefaults": { "line": { "width": 0 }, "opacity": 0.4, "fillcolor": "#506784" }, "annotationdefaults": { "arrowhead": 0, "arrowcolor": "#506784", "arrowwidth": 1 } }, "themeRef": "PLOTLY_WHITE" }, "annotations": [ { "x": 807.6523476523491, "y": -40.132140012426866, "ax": -18, "ay": -44, "text": "<br>" } ] } }, "height": null, "width": null, "user": { "profile_url": "https://chart-studio.plotly.com/~devorah97", "avatar_url": "https://storage.googleapis.com/plotly-prod-profiles/25.jpg", "background_url": "https://storage.googleapis.com/plotly-prod-profiles/bg-0.jpg", "bio": "", "nickname": "", "website": "", "stream_tokens": null, "feature_set_id": null, "csrf_token": null, "date_joined": "2024-02-15 21:24:00", "mapbox_access_tokens": null, "has_password": null, "username": "devorah97", "email": null, "is_active": null, "readonly": null, "is_dash_creator": null, "dash_created_count": null, "is_chart_creator": null, "charts_created_count": null } } ] }
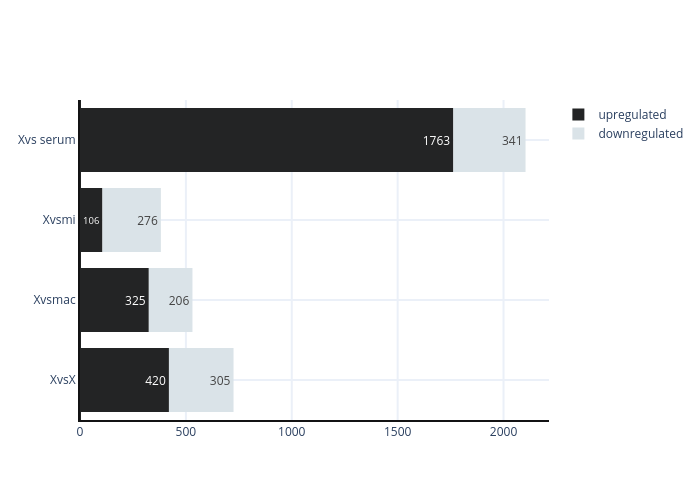