Plots List
Plots
This endpoint handles manipulation of Plotly plot files.
Reference
Authorization
Any user with or without a Plotly account may view public plots. For private plots, see authentication.
Actions
list
Listing all public plots can be done via a GET request to this endpoint.
By default, plots will be listed in order of date created. The order_by
query parameter is accepted at this endpoint. Currently, only ordering by
views is supported. It is possible to filter the plots by quality
with min_quality or max_quality as query parameter.
Example:
// GET https://api.plotly.com/v2/plots/ ---> 200

// GET https://api.plotly.com/v2/plots/?order_by=-views ---> 200

// GET https://api.plotly.com/v2/plots/?min_quality=5 ---> 200

// GET https://api.plotly.com/v2/plots/?max_quality=5 ---> 200
feed
Listing all handpicked feed plots can be done via a GET request to this endpoint. By default, plots will be listed in a random order.
Example:
// GET https://api.plotly.com/v2/plots/feed ---> 200
create
You can create new plot resources here. The only required field is 'figure'. Currently, the figure is restricted to only contain references to grid data. That is, this will fail if raw data arrays are passed in. To create and manipulate underlying grids for plots, see the grids endpoint.
Example:
// This fails because a figure field is required.
// POST https://api.plotly.com/v2/plots ---> 400 Bad Request
{}

// This fails because the figure has raw data
//POST https://api.plotly.com/v2/plots ---> 400 Bad Request
{
    "figure": {"data": [{"y": ['this', 'is', 'raw', 'data']}]}
}

// This succeeds because the figure has src keys, not raw data.
//POST https://api.plotly.com/v2/plots ---> 200 OK
{
    "figure": {"data": [{"ysrc": "sven:88:u8nd62"}]}
}
When creating a grid, you can optionally specify a source_fid to specify where a plot has come from:
- source_fid: the fid of a plot that was copied (and presumably edited) to produce this one
detail
There is a lot of meta information stored about plot files including filename, title, share_url, and content_url to name a few.
This information can only be reached with a GET to this endpoint.
Example:
// GET https://api.plotly.com/v2/plots/iheartgraphs:90
content
The contents of a plot can be downloaded via the content resource. The plot
content contains referenced grid/column data by default. If you wish to
return the raw grid/column data, the inline_data=true query must be included
in the request url. The Content-Type header will be appropriately set for the
response body.
Alternatively, you can set ?map_data=unreadable to append a mapping of
sources to data that belongs to grids which are unreadable for the
requestor. This is useful when you have read access to another users plot,
but that plot contains grid references which you don't have access to.
Examples:
// Returns referenced grid/column data
// GET https://api.plotly.com/v2/plots/iheartgraphs:90/content ---> 200 OK

// Returns full grid/column data
// GET https://api.plotly.com/v2/plots/iheartgraphs:90/content?inline_data=true ---> 200 OK

// Returns full grid/column data when requestor doesn't have permission
// to read the referenced grid.
// GET https://api.plotly.com/v2/plots/iheartgraphs:90/content?map_data=unreadable ---> 200 OK
GET /v2/plots?cursor=cD0yMDI0LTA0LTA1KzE0JTNBMTUlM0EyOS42MDU5NDUlMkIwMCUzQTAw&format=api
{ "next": "https://api.plot.ly/v2/plots?cursor=cD0yMDI0LTA0LTA1KzEzJTNBMzYlM0E0Ni43MDk0MjMlMkIwMCUzQTAw&format=api", "previous": "https://api.plot.ly/v2/plots?cursor=cj0xJnA9MjAyNC0wNC0wNSsxNCUzQTA4JTNBMzMuMzMwMjk4JTJCMDAlM0EwMA%3D%3D&format=api", "results": [ { "creation_time": "2024-04-05T14:08:33.330298Z", "comments": { "results": [], "count": 0 }, "parented": true, "embed_url": "https://chart-studio.plotly.com/~alejorojas2/73.embed", "fid": "alejorojas2:73", "filename": "Plot 73", "filetype": "plot", "img_url": "https://storage.googleapis.com/plotly-prod-images/alejorojas2/73/9_POLV16CXHSVCP58T69RLE3Z3KVNO2K.png", "image_urls": { "default": "https://storage.googleapis.com/plotly-prod-images/alejorojas2/73/2_ZM6YM82ZJYFLEBZ0XT8OZ0ONC5XTU9.png", "block-thumb": "https://storage.googleapis.com/plotly-prod-images/alejorojas2/73/8_HO7QUH9EEJYC3XR28E8ZRSF2PI1VAN.png", "list-thumb": "https://storage.googleapis.com/plotly-prod-images/alejorojas2/73/9_POLV16CXHSVCP58T69RLE3Z3KVNO2K.png" }, "api_urls": { "files": "https://api.plotly.com/v2/files/alejorojas2:73", "plots": "https://api.plotly.com/v2/plots/alejorojas2:73", "parent": "https://api.plotly.com/v2/folders/home?user=alejorojas2" }, "owner": "alejorojas2", "parent": -1, "preview": "", "referencers": [], "references": [], "title": "", "views": 1, "web_url": "https://chart-studio.plotly.com/~alejorojas2/73/", "world_readable": true, "date_modified": "2024-04-05T14:08:33.342Z", "stars": { "results": [], "count": 0 }, "collaborators": { "results": [ { "type": "email", "email": "maraujoalves@outlook.com", "readonly": false } ], "count": 1 }, "subfolder_count": null, "refresh_interval": null, "organize_view_url": "https://chart-studio.plotly.com/~alejorojas2/73/", "current_user_permission": "read", "is_theme": null, "is_template": false, "autosize": true, "caption": "", "figure": { "data": [ { "line": { "width": 6 }, "meta": { "columnNames": { "x": "Date", "y": " DD60 (°F)" } }, "mode": "markers+lines", "name": "<b>DD60s</b>", "type": "scatter", "xsrc": "alejorojas2:72:f8cb33", "ysrc": "alejorojas2:72:9a9e64", "marker": { "size": 11 } }, { "line": { "color": "rgb(10, 129, 13)", "width": 6 }, "meta": { "columnNames": { "x": "Date", "y": "DD60_acum" } }, "mode": "markers+lines", "name": "<b>Accumulative DD60s</b>", "type": "scatter", "xsrc": "alejorojas2:72:f8cb33", "ysrc": "alejorojas2:72:b7d3cc", "yaxis": "y2", "marker": { "size": 13 }, "stackgroup": null } ], "frames": [], "layout": { "xaxis": { "type": "category", "range": [ -2.98949367979175, 52.98949367979175 ], "title": { "font": { "size": 20 }, "text": "<b>Date</b>" }, "tickfont": { "size": 18 }, "zeroline": true, "autorange": true, "zerolinecolor": "rgb(34, 32, 32)", "zerolinewidth": 3 }, "yaxis": { "type": "linear", "range": [ -6.575245579567779, 28.17524557956778 ], "title": { "font": { "size": 20 }, "text": "<b>DD60s Heat Unit per day</b>" }, "tickfont": { "size": 18 }, "autorange": true }, "legend": { "x": 0.20000000000000026, "y": 0.936318407960199, "font": { "size": 18 }, "title": { "font": { "size": 1 }, "text": "<br>" }, "xanchor": "right" }, "shapes": [ { "x0": 13.5, "x1": 41.5, "y0": -2.7555555555555546, "y1": -1.6444444444444457, "line": { "color": "#444444", "width": 6 }, "type": "rect", "opacity": 0.3, "fillcolor": "rgb(0, 0, 0)" } ], "yaxis2": { "side": "right", "type": "linear", "range": [ -33.85522094005066, 855.4552209400506 ], "title": { "font": { "size": 21 }, "text": "<b>Cumulative DD60s</b>" }, "tickfont": { "size": 18 }, "autorange": true, "overlaying": "y" }, "autosize": true, "template": { "data": { "bar": [ { "type": "bar", "marker": { "colorbar": { "len": 0.2, "ticks": "inside", "ticklen": 6, "tickcolor": "rgb(237,237,237)", "outlinewidth": 0 } } } ], "table": [ { "type": "table", "cells": { "fill": { "color": "rgb(237,237,237)" }, "line": { "color": "white" } }, "header": { "fill": { "color": "rgb(217,217,217)" }, "line": { "color": "white" } } } ], "carpet": [ { "type": "carpet", "aaxis": { "gridcolor": "white", "linecolor": "white", "endlinecolor": "rgb(51,51,51)", "minorgridcolor": "white", "startlinecolor": "rgb(51,51,51)" }, "baxis": { "gridcolor": "white", "linecolor": "white", "endlinecolor": "rgb(51,51,51)", "minorgridcolor": "white", "startlinecolor": "rgb(51,51,51)" } } ], "mesh3d": [ { "type": "mesh3d", "colorbar": { "len": 0.2, "ticks": "inside", "ticklen": 6, "tickcolor": "rgb(237,237,237)", "outlinewidth": 0 } } ], "contour": [ { "type": "contour", "colorbar": { "len": 0.2, "ticks": "inside", "ticklen": 6, "tickcolor": "rgb(237,237,237)", "outlinewidth": 0 }, "autocolorscale": true } ], "heatmap": [ { "type": "heatmap", "colorbar": { "len": 0.2, "ticks": "inside", "ticklen": 6, "tickcolor": "rgb(237,237,237)", "outlinewidth": 0 }, "autocolorscale": true } ], "scatter": [ { "type": "scatter", "marker": { "colorbar": { "len": 0.2, "ticks": "inside", "ticklen": 6, "tickcolor": "rgb(237,237,237)", "outlinewidth": 0 } } } ], "surface": [ { "type": "surface", "colorbar": { "len": 0.2, "ticks": "inside", "ticklen": 6, "tickcolor": "rgb(237,237,237)", "outlinewidth": 0 } } ], "heatmapgl": [ { "type": "heatmapgl", "colorbar": { "len": 0.2, "ticks": "inside", "ticklen": 6, "tickcolor": "rgb(237,237,237)", "outlinewidth": 0 } } ], "histogram": [ { "type": "histogram", "marker": { "colorbar": { "len": 0.2, "ticks": "inside", "ticklen": 6, "tickcolor": "rgb(237,237,237)", "outlinewidth": 0 } } } ], "parcoords": [ { "line": { "colorbar": { "len": 0.2, "ticks": "inside", "ticklen": 6, "tickcolor": "rgb(237,237,237)", "outlinewidth": 0 } }, "type": "parcoords" } ], "scatter3d": [ { "type": "scatter3d", "marker": { "colorbar": { "len": 0.2, "ticks": "inside", "ticklen": 6, "tickcolor": "rgb(237,237,237)", "outlinewidth": 0 } } } ], "scattergl": [ { "type": "scattergl", "marker": { "colorbar": { "len": 0.2, "ticks": "inside", "ticklen": 6, "tickcolor": "rgb(237,237,237)", "outlinewidth": 0 } } } ], "choropleth": [ { "type": "choropleth", "colorbar": { "len": 0.2, "ticks": "inside", "ticklen": 6, "tickcolor": "rgb(237,237,237)", "outlinewidth": 0 } } ], "scattergeo": [ { "type": "scattergeo", "marker": { "colorbar": { "len": 0.2, "ticks": "inside", "ticklen": 6, "tickcolor": "rgb(237,237,237)", "outlinewidth": 0 } } } ], "histogram2d": [ { "type": "histogram2d", "colorbar": { "len": 0.2, "ticks": "inside", "ticklen": 6, "tickcolor": "rgb(237,237,237)", "outlinewidth": 0 }, "autocolorscale": true } ], "scatterpolar": [ { "type": "scatterpolar", "marker": { "colorbar": { "len": 0.2, "ticks": "inside", "ticklen": 6, "tickcolor": "rgb(237,237,237)", "outlinewidth": 0 } } } ], "contourcarpet": [ { "type": "contourcarpet", "colorbar": { "len": 0.2, "ticks": "inside", "ticklen": 6, "tickcolor": "rgb(237,237,237)", "outlinewidth": 0 } } ], "scattercarpet": [ { "type": "scattercarpet", "marker": { "colorbar": { "len": 0.2, "ticks": "inside", "ticklen": 6, "tickcolor": "rgb(237,237,237)", "outlinewidth": 0 } } } ], "scattermapbox": [ { "type": "scattermapbox", "marker": { "colorbar": { "len": 0.2, "ticks": "inside", "ticklen": 6, "tickcolor": "rgb(237,237,237)", "outlinewidth": 0 } } } ], "scatterpolargl": [ { "type": "scatterpolargl", "marker": { "colorbar": { "len": 0.2, "ticks": "inside", "ticklen": 6, "tickcolor": "rgb(237,237,237)", "outlinewidth": 0 } } } ], "scatterternary": [ { "type": "scatterternary", "marker": { "colorbar": { "len": 0.2, "ticks": "inside", "ticklen": 6, "tickcolor": "rgb(237,237,237)", "outlinewidth": 0 } } } ], "histogram2dcontour": [ { "type": "histogram2dcontour", "colorbar": { "len": 0.2, "ticks": "inside", "ticklen": 6, "tickcolor": "rgb(237,237,237)", "outlinewidth": 0 }, "autocolorscale": true } ] }, "layout": { "geo": { "bgcolor": "white", "showland": true, "lakecolor": "white", "landcolor": "rgb(237,237,237)", "showlakes": true, "subunitcolor": "white" }, "font": { "color": "rgb(51,51,51)" }, "polar": { "bgcolor": "rgb(237,237,237)", "radialaxis": { "ticks": "outside", "showgrid": true, "gridcolor": "white", "linecolor": "white", "tickcolor": "rgb(51,51,51)" }, "angularaxis": { "ticks": "outside", "showgrid": true, "gridcolor": "white", "linecolor": "white", "tickcolor": "rgb(51,51,51)" } }, "scene": { "xaxis": { "ticks": "outside", "showgrid": true, "gridcolor": "white", "gridwidth": 2, "linecolor": "white", "tickcolor": "rgb(51,51,51)", "zerolinecolor": "white", "showbackground": true, "backgroundcolor": "rgb(237,237,237)" }, "yaxis": { "ticks": "outside", "showgrid": true, "gridcolor": "white", "gridwidth": 2, "linecolor": "white", "tickcolor": "rgb(51,51,51)", "zerolinecolor": "white", "showbackground": true, "backgroundcolor": "rgb(237,237,237)" }, "zaxis": { "ticks": "outside", "showgrid": true, "gridcolor": "white", "gridwidth": 2, "linecolor": "white", "tickcolor": "rgb(51,51,51)", "zerolinecolor": "white", "showbackground": true, "backgroundcolor": "rgb(237,237,237)" } }, "xaxis": { "ticks": "outside", "showgrid": true, "gridcolor": "white", "linecolor": "white", "tickcolor": "rgb(51,51,51)", "automargin": true, "zerolinecolor": "white" }, "yaxis": { "ticks": "outside", "showgrid": true, "gridcolor": "white", "linecolor": "white", "tickcolor": "rgb(51,51,51)", "automargin": true, "zerolinecolor": "white" }, "ternary": { "aaxis": { "ticks": "outside", "showgrid": true, "gridcolor": "white", "linecolor": "white", "tickcolor": "rgb(51,51,51)" }, "baxis": { "ticks": "outside", "showgrid": true, "gridcolor": "white", "linecolor": "white", "tickcolor": "rgb(51,51,51)" }, "caxis": { "ticks": "outside", "showgrid": true, "gridcolor": "white", "linecolor": "white", "tickcolor": "rgb(51,51,51)" }, "bgcolor": "rgb(237,237,237)" }, "colorway": [ "#F8766D", "#A3A500", "#00BF7D", "#00B0F6", "#E76BF3" ], "hovermode": "closest", "colorscale": { "diverging": [ [ 0, "#40004b" ], [ 0.1, "#762a83" ], [ 0.2, "#9970ab" ], [ 0.3, "#c2a5cf" ], [ 0.4, "#e7d4e8" ], [ 0.5, "#f7f7f7" ], [ 0.6, "#d9f0d3" ], [ 0.7, "#a6dba0" ], [ 0.8, "#5aae61" ], [ 0.9, "#1b7837" ], [ 1, "#00441b" ] ], "sequential": [ [ 0, "rgb(20,44,66)" ], [ 1, "rgb(90,179,244)" ] ], "sequentialminus": [ [ 0, "rgb(20,44,66)" ], [ 1, "rgb(90,179,244)" ] ] }, "plot_bgcolor": "rgb(237,237,237)", "paper_bgcolor": "white", "shapedefaults": { "line": { "width": 0 }, "opacity": 0.3, "fillcolor": "black" }, "annotationdefaults": { "arrowhead": 0, "arrowwidth": 1 } }, "themeRef": "GGPLOT2" } } }, "height": null, "width": null, "user": { "profile_url": "https://chart-studio.plotly.com/~alejorojas2", "avatar_url": "https://storage.googleapis.com/plotly-prod-profiles/16.jpg", "background_url": "https://storage.googleapis.com/plotly-prod-profiles/bg-12.jpg", "bio": "", "nickname": "", "website": "", "stream_tokens": null, "feature_set_id": null, "csrf_token": null, "date_joined": "2014-08-04 15:04:00", "mapbox_access_tokens": null, "has_password": null, "username": "alejorojas2", "email": null, "is_active": null, "readonly": null, "is_dash_creator": null, "dash_created_count": null, "is_chart_creator": null, "charts_created_count": null } }, { "creation_time": "2024-04-05T14:03:56.503245Z", "comments": { "results": [], "count": 0 }, "parented": true, "embed_url": "https://chart-studio.plotly.com/~pahep49490/27.embed", "fid": "pahep49490:27", "filename": "Plot 27", "filetype": "plot", "img_url": "https://storage.googleapis.com/plotly-prod-images/pahep49490/27/9_5Z55LF5EBUTH02C43C67DWUZ9ZHADG.png", "image_urls": { "default": "https://storage.googleapis.com/plotly-prod-images/pahep49490/27/2_CH2RSBSJ8BQ36SEH3PD5M95T118OLO.png", "block-thumb": "https://storage.googleapis.com/plotly-prod-images/pahep49490/27/8_RQCWGDINSL2TP83LMU8A2XOM49FJCC.png", "list-thumb": "https://storage.googleapis.com/plotly-prod-images/pahep49490/27/9_5Z55LF5EBUTH02C43C67DWUZ9ZHADG.png" }, "api_urls": { "files": "https://api.plotly.com/v2/files/pahep49490:27", "plots": "https://api.plotly.com/v2/plots/pahep49490:27", "parent": "https://api.plotly.com/v2/folders/home?user=pahep49490" }, "owner": "pahep49490", "parent": -1, "preview": "", "referencers": [], "references": [], "title": "", "views": 1, "web_url": "https://chart-studio.plotly.com/~pahep49490/27/", "world_readable": true, "date_modified": "2024-04-05T14:03:56.517Z", "stars": { "results": [], "count": 0 }, "collaborators": { "results": [], "count": 0 }, "subfolder_count": null, "refresh_interval": null, "organize_view_url": "https://chart-studio.plotly.com/~pahep49490/27/", "current_user_permission": "read", "is_theme": null, "is_template": false, "autosize": true, "caption": "", "figure": { "data": [ { "meta": { "columnNames": { "x": "A", "y": "B" } }, "mode": "markers", "name": "Ida1", "type": "scatter", "xsrc": "pahep49490:25:e4b728", "ysrc": "pahep49490:25:8455fd", "marker": { "line": { "width": 0 } }, "error_x": { "type": "constant", "value": 0.3, "width": 5, "visible": true, "symmetric": true }, "error_y": { "type": "constant", "value": 0.3, "width": 5, "visible": true, "symmetric": true } }, { "meta": { "columnNames": { "x": "A", "y": "B" } }, "mode": "markers", "name": "volta1", "type": "scatter", "xsrc": "pahep49490:26:25c9a3", "ysrc": "pahep49490:26:7e5b53", "error_x": { "type": "constant", "value": 0.3, "width": 5, "visible": true, "symmetric": true }, "error_y": { "type": "constant", "value": 0.3, "width": 5, "visible": true, "symmetric": true } }, { "meta": { "columnNames": { "x": "A", "y": "B" } }, "mode": "markers", "name": "ida2", "type": "scatter", "xsrc": "pahep49490:23:aeeb3d", "ysrc": "pahep49490:23:d2209c", "error_x": { "type": "constant", "value": 0.3, "width": 5, "visible": true, "symmetric": true }, "error_y": { "type": "constant", "value": 0.3, "width": 5, "visible": true, "symmetric": true }, "stackgroup": null }, { "meta": { "columnNames": { "x": "A", "y": "B" } }, "mode": "markers", "name": "volta2", "type": "scatter", "xsrc": "pahep49490:24:9f04a2", "ysrc": "pahep49490:24:b559d8", "xaxis": "x", "error_x": { "type": "constant", "value": 0.3, "width": 5, "visible": true, "symmetric": true }, "error_y": { "type": "constant", "value": 0.3, "width": 5, "visible": true, "symmetric": true }, "stackgroup": null } ], "frames": [], "layout": { "title": { "text": "Análise" }, "xaxis": { "side": "bottom", "type": "linear", "range": [ 16.740367273323496, 544.2596327266765 ], "title": { "text": "Massa (g)" }, "domain": [ 0, 1 ], "autorange": true }, "yaxis": { "type": "linear", "range": [ 9.34933697347894, 41.50066302652106 ], "title": { "text": "Distensão (cm)" }, "domain": [ 0, 1 ], "autorange": true }, "legend": { "x": 0.9880978762696215, "y": 1.16, "title": { "text": "<br>" } }, "margin": { "r": 80, "t": 90 }, "autosize": true, "dragmode": "select", "template": { "data": { "bar": [ { "type": "bar", "marker": { "colorbar": { "ticks": "", "outlinewidth": 0 } } } ], "table": [ { "type": "table", "cells": { "fill": { "color": "#EBF0F8" }, "line": { "color": "white" } }, "header": { "fill": { "color": "#C8D4E3" }, "line": { "color": "white" } } } ], "carpet": [ { "type": "carpet", "aaxis": { "gridcolor": "#C8D4E3", "linecolor": "#C8D4E3", "endlinecolor": "#2a3f5f", "minorgridcolor": "#C8D4E3", "startlinecolor": "#2a3f5f" }, "baxis": { "gridcolor": "#C8D4E3", "linecolor": "#C8D4E3", "endlinecolor": "#2a3f5f", "minorgridcolor": "#C8D4E3", "startlinecolor": "#2a3f5f" } } ], "mesh3d": [ { "type": "mesh3d", "colorbar": { "ticks": "", "outlinewidth": 0 } } ], "contour": [ { "type": "contour", "colorbar": { "ticks": "", "outlinewidth": 0 }, "autocolorscale": true } ], "heatmap": [ { "type": "heatmap", "colorbar": { "ticks": "", "outlinewidth": 0 }, "autocolorscale": true } ], "scatter": [ { "type": "scatter", "marker": { "colorbar": { "ticks": "", "outlinewidth": 0 } } } ], "surface": [ { "type": "surface", "colorbar": { "ticks": "", "outlinewidth": 0 } } ], "heatmapgl": [ { "type": "heatmapgl", "colorbar": { "ticks": "", "outlinewidth": 0 } } ], "histogram": [ { "type": "histogram", "marker": { "colorbar": { "ticks": "", "outlinewidth": 0 } } } ], "parcoords": [ { "line": { "colorbar": { "ticks": "", "outlinewidth": 0 } }, "type": "parcoords" } ], "scatter3d": [ { "type": "scatter3d", "marker": { "colorbar": { "ticks": "", "outlinewidth": 0 } } } ], "scattergl": [ { "type": "scattergl", "marker": { "colorbar": { "ticks": "", "outlinewidth": 0 } } } ], "choropleth": [ { "type": "choropleth", "colorbar": { "ticks": "", "outlinewidth": 0 } } ], "scattergeo": [ { "type": "scattergeo", "marker": { "colorbar": { "ticks": "", "outlinewidth": 0 } } } ], "histogram2d": [ { "type": "histogram2d", "colorbar": { "ticks": "", "outlinewidth": 0 }, "autocolorscale": true } ], "scatterpolar": [ { "type": "scatterpolar", "marker": { "colorbar": { "ticks": "", "outlinewidth": 0 } } } ], "contourcarpet": [ { "type": "contourcarpet", "colorbar": { "ticks": "", "outlinewidth": 0 } } ], "scattercarpet": [ { "type": "scattercarpet", "marker": { "colorbar": { "ticks": "", "outlinewidth": 0 } } } ], "scattermapbox": [ { "type": "scattermapbox", "marker": { "colorbar": { "ticks": "", "outlinewidth": 0 } } } ], "scatterpolargl": [ { "type": "scatterpolargl", "marker": { "colorbar": { "ticks": "", "outlinewidth": 0 } } } ], "scatterternary": [ { "type": "scatterternary", "marker": { "colorbar": { "ticks": "", "outlinewidth": 0 } } } ], "histogram2dcontour": [ { "type": "histogram2dcontour", "colorbar": { "ticks": "", "outlinewidth": 0 }, "autocolorscale": true } ] }, "layout": { "geo": { "bgcolor": "white", "showland": true, "lakecolor": "white", "landcolor": "white", "showlakes": true, "subunitcolor": "#C8D4E3" }, "font": { "color": "#2a3f5f" }, "polar": { "bgcolor": "white", "radialaxis": { "ticks": "", "gridcolor": "#EBF0F8", "linecolor": "#EBF0F8" }, "angularaxis": { "ticks": "", "gridcolor": "#EBF0F8", "linecolor": "#EBF0F8" } }, "scene": { "xaxis": { "ticks": "", "gridcolor": "#DFE8F3", "gridwidth": 2, "linecolor": "#EBF0F8", "zerolinecolor": "#EBF0F8", "showbackground": true, "backgroundcolor": "white" }, "yaxis": { "ticks": "", "gridcolor": "#DFE8F3", "gridwidth": 2, "linecolor": "#EBF0F8", "zerolinecolor": "#EBF0F8", "showbackground": true, "backgroundcolor": "white" }, "zaxis": { "ticks": "", "gridcolor": "#DFE8F3", "gridwidth": 2, "linecolor": "#EBF0F8", "zerolinecolor": "#EBF0F8", "showbackground": true, "backgroundcolor": "white" } }, "title": { "x": 0.05 }, "xaxis": { "ticks": "", "gridcolor": "#EBF0F8", "linecolor": "#EBF0F8", "automargin": true, "zerolinecolor": "#EBF0F8", "zerolinewidth": 2 }, "yaxis": { "ticks": "", "gridcolor": "#EBF0F8", "linecolor": "#EBF0F8", "automargin": true, "zerolinecolor": "#EBF0F8", "zerolinewidth": 2 }, "ternary": { "aaxis": { "ticks": "", "gridcolor": "#DFE8F3", "linecolor": "#A2B1C6" }, "baxis": { "ticks": "", "gridcolor": "#DFE8F3", "linecolor": "#A2B1C6" }, "caxis": { "ticks": "", "gridcolor": "#DFE8F3", "linecolor": "#A2B1C6" }, "bgcolor": "white" }, "colorway": [ "#636efa", "#EF553B", "#00cc96", "#ab63fa", "#19d3f3", "#e763fa", "#fecb52", "#ffa15a", "#ff6692", "#b6e880" ], "hovermode": "closest", "colorscale": { "diverging": [ [ 0, "#8e0152" ], [ 0.1, "#c51b7d" ], [ 0.2, "#de77ae" ], [ 0.3, "#f1b6da" ], [ 0.4, "#fde0ef" ], [ 0.5, "#f7f7f7" ], [ 0.6, "#e6f5d0" ], [ 0.7, "#b8e186" ], [ 0.8, "#7fbc41" ], [ 0.9, "#4d9221" ], [ 1, "#276419" ] ], "sequential": [ [ 0, "#0508b8" ], [ 0.0893854748603352, "#1910d8" ], [ 0.1787709497206704, "#3c19f0" ], [ 0.2681564245810056, "#6b1cfb" ], [ 0.3575418994413408, "#981cfd" ], [ 0.44692737430167595, "#bf1cfd" ], [ 0.5363128491620112, "#dd2bfd" ], [ 0.6256983240223464, "#f246fe" ], [ 0.7150837988826816, "#fc67fd" ], [ 0.8044692737430168, "#fe88fc" ], [ 0.8938547486033519, "#fea5fd" ], [ 0.9832402234636871, "#febefe" ], [ 1, "#fec3fe" ] ], "sequentialminus": [ [ 0, "#0508b8" ], [ 0.0893854748603352, "#1910d8" ], [ 0.1787709497206704, "#3c19f0" ], [ 0.2681564245810056, "#6b1cfb" ], [ 0.3575418994413408, "#981cfd" ], [ 0.44692737430167595, "#bf1cfd" ], [ 0.5363128491620112, "#dd2bfd" ], [ 0.6256983240223464, "#f246fe" ], [ 0.7150837988826816, "#fc67fd" ], [ 0.8044692737430168, "#fe88fc" ], [ 0.8938547486033519, "#fea5fd" ], [ 0.9832402234636871, "#febefe" ], [ 1, "#fec3fe" ] ] }, "plot_bgcolor": "white", "paper_bgcolor": "white", "shapedefaults": { "line": { "width": 0 }, "opacity": 0.4, "fillcolor": "#506784" }, "annotationdefaults": { "arrowhead": 0, "arrowcolor": "#506784", "arrowwidth": 1 } }, "themeRef": "PLOTLY_WHITE" }, "hovermode": "closest", "showlegend": true, "annotations": [] } }, "height": null, "width": null, "user": { "profile_url": "https://chart-studio.plotly.com/~pahep49490", "avatar_url": "https://storage.googleapis.com/plotly-prod-profiles/70.jpg", "background_url": "https://storage.googleapis.com/plotly-prod-profiles/bg-5.jpg", "bio": "", "nickname": "", "website": "", "stream_tokens": null, "feature_set_id": null, "csrf_token": null, "date_joined": "2024-04-05 01:58:14", "mapbox_access_tokens": null, "has_password": null, "username": "pahep49490", "email": null, "is_active": null, "readonly": null, "is_dash_creator": null, "dash_created_count": null, "is_chart_creator": null, "charts_created_count": null } }, { "creation_time": "2024-04-05T13:56:23.396249Z", "comments": { "results": [], "count": 0 }, "parented": true, "embed_url": "https://chart-studio.plotly.com/~pahep49490/22.embed", "fid": "pahep49490:22", "filename": "elastico2", "filetype": "plot", "img_url": "https://storage.googleapis.com/plotly-prod-images/pahep49490/22/9_G0B70DLP2OXNIJT6BSFJZBLLF61VMH.png", "image_urls": { "default": "https://storage.googleapis.com/plotly-prod-images/pahep49490/22/2_DFV6HL30T6N5XPUF1ZDHB9ZCHYDA48.png", "block-thumb": "https://storage.googleapis.com/plotly-prod-images/pahep49490/22/8_3CZMGCSCHU7N8QZM0ZGTQKXPHLR8QD.png", "list-thumb": "https://storage.googleapis.com/plotly-prod-images/pahep49490/22/9_G0B70DLP2OXNIJT6BSFJZBLLF61VMH.png" }, "api_urls": { "files": "https://api.plotly.com/v2/files/pahep49490:22", "plots": "https://api.plotly.com/v2/plots/pahep49490:22", "parent": "https://api.plotly.com/v2/folders/home?user=pahep49490" }, "owner": "pahep49490", "parent": -1, "preview": "", "referencers": [], "references": [], "title": "", "views": 1, "web_url": "https://chart-studio.plotly.com/~pahep49490/22/", "world_readable": true, "date_modified": "2024-04-05T13:56:48.046Z", "stars": { "results": [], "count": 0 }, "collaborators": { "results": [], "count": 0 }, "subfolder_count": null, "refresh_interval": null, "organize_view_url": "https://chart-studio.plotly.com/~pahep49490/22/", "current_user_permission": "read", "is_theme": null, "is_template": true, "autosize": true, "caption": "", "figure": { "data": [ { "meta": { "columnNames": { "x": "A", "y": "B" } }, "mode": "markers", "name": "Ida1", "type": "scatter", "xsrc": "pahep49490:18:badd0c", "ysrc": "pahep49490:18:01fc03", "marker": { "line": { "width": 0 } }, "error_x": { "type": "constant", "value": 0.3, "width": 5, "visible": true, "symmetric": true }, "error_y": { "type": "constant", "value": 0.3, "width": 5, "visible": true, "symmetric": true } }, { "meta": { "columnNames": { "x": "A", "y": "B" } }, "mode": "markers", "name": "volta1", "type": "scatter", "xsrc": "pahep49490:19:4ed48b", "ysrc": "pahep49490:19:15f249", "error_x": { "type": "constant", "value": 0.3, "width": 5, "visible": true, "symmetric": true }, "error_y": { "type": "constant", "value": 0.3, "width": 5, "visible": true, "symmetric": true } }, { "meta": { "columnNames": { "x": "A", "y": "B" } }, "mode": "markers", "name": "ida2", "type": "scatter", "xsrc": "pahep49490:20:b15c50", "ysrc": "pahep49490:20:8e8550", "error_x": { "type": "constant", "value": 0.3, "width": 5, "visible": true, "symmetric": true }, "error_y": { "type": "constant", "value": 0.3, "width": 5, "visible": true, "symmetric": true }, "stackgroup": null }, { "meta": { "columnNames": { "x": "A", "y": "B" } }, "mode": "markers", "name": "volta2", "type": "scatter", "xsrc": "pahep49490:21:536202", "ysrc": "pahep49490:21:260024", "xaxis": "x", "error_x": { "type": "constant", "value": 0.3, "width": 5, "visible": true, "symmetric": true }, "error_y": { "type": "constant", "value": 0.3, "width": 5, "visible": true, "symmetric": true }, "stackgroup": null } ], "frames": [], "layout": { "title": { "text": "Análise" }, "xaxis": { "side": "bottom", "type": "linear", "range": [ 16.740367273323496, 544.2596327266765 ], "title": { "text": "Massa (g)" }, "domain": [ 0, 1 ], "autorange": true }, "yaxis": { "type": "linear", "range": [ 6.468252730109203, 39.8317472698908 ], "title": { "text": "Distensão (cm)" }, "domain": [ 0, 1 ], "autorange": true }, "legend": { "x": 0.9880978762696215, "y": 1.16, "title": { "text": "<br>" } }, "margin": { "r": 80, "t": 90 }, "autosize": true, "dragmode": "select", "template": { "data": { "bar": [ { "type": "bar", "marker": { "colorbar": { "ticks": "", "outlinewidth": 0 } } } ], "table": [ { "type": "table", "cells": { "fill": { "color": "#EBF0F8" }, "line": { "color": "white" } }, "header": { "fill": { "color": "#C8D4E3" }, "line": { "color": "white" } } } ], "carpet": [ { "type": "carpet", "aaxis": { "gridcolor": "#C8D4E3", "linecolor": "#C8D4E3", "endlinecolor": "#2a3f5f", "minorgridcolor": "#C8D4E3", "startlinecolor": "#2a3f5f" }, "baxis": { "gridcolor": "#C8D4E3", "linecolor": "#C8D4E3", "endlinecolor": "#2a3f5f", "minorgridcolor": "#C8D4E3", "startlinecolor": "#2a3f5f" } } ], "mesh3d": [ { "type": "mesh3d", "colorbar": { "ticks": "", "outlinewidth": 0 } } ], "contour": [ { "type": "contour", "colorbar": { "ticks": "", "outlinewidth": 0 }, "autocolorscale": true } ], "heatmap": [ { "type": "heatmap", "colorbar": { "ticks": "", "outlinewidth": 0 }, "autocolorscale": true } ], "scatter": [ { "type": "scatter", "marker": { "colorbar": { "ticks": "", "outlinewidth": 0 } } } ], "surface": [ { "type": "surface", "colorbar": { "ticks": "", "outlinewidth": 0 } } ], "heatmapgl": [ { "type": "heatmapgl", "colorbar": { "ticks": "", "outlinewidth": 0 } } ], "histogram": [ { "type": "histogram", "marker": { "colorbar": { "ticks": "", "outlinewidth": 0 } } } ], "parcoords": [ { "line": { "colorbar": { "ticks": "", "outlinewidth": 0 } }, "type": "parcoords" } ], "scatter3d": [ { "type": "scatter3d", "marker": { "colorbar": { "ticks": "", "outlinewidth": 0 } } } ], "scattergl": [ { "type": "scattergl", "marker": { "colorbar": { "ticks": "", "outlinewidth": 0 } } } ], "choropleth": [ { "type": "choropleth", "colorbar": { "ticks": "", "outlinewidth": 0 } } ], "scattergeo": [ { "type": "scattergeo", "marker": { "colorbar": { "ticks": "", "outlinewidth": 0 } } } ], "histogram2d": [ { "type": "histogram2d", "colorbar": { "ticks": "", "outlinewidth": 0 }, "autocolorscale": true } ], "scatterpolar": [ { "type": "scatterpolar", "marker": { "colorbar": { "ticks": "", "outlinewidth": 0 } } } ], "contourcarpet": [ { "type": "contourcarpet", "colorbar": { "ticks": "", "outlinewidth": 0 } } ], "scattercarpet": [ { "type": "scattercarpet", "marker": { "colorbar": { "ticks": "", "outlinewidth": 0 } } } ], "scattermapbox": [ { "type": "scattermapbox", "marker": { "colorbar": { "ticks": "", "outlinewidth": 0 } } } ], "scatterpolargl": [ { "type": "scatterpolargl", "marker": { "colorbar": { "ticks": "", "outlinewidth": 0 } } } ], "scatterternary": [ { "type": "scatterternary", "marker": { "colorbar": { "ticks": "", "outlinewidth": 0 } } } ], "histogram2dcontour": [ { "type": "histogram2dcontour", "colorbar": { "ticks": "", "outlinewidth": 0 }, "autocolorscale": true } ] }, "layout": { "geo": { "bgcolor": "white", "showland": true, "lakecolor": "white", "landcolor": "white", "showlakes": true, "subunitcolor": "#C8D4E3" }, "font": { "color": "#2a3f5f" }, "polar": { "bgcolor": "white", "radialaxis": { "ticks": "", "gridcolor": "#EBF0F8", "linecolor": "#EBF0F8" }, "angularaxis": { "ticks": "", "gridcolor": "#EBF0F8", "linecolor": "#EBF0F8" } }, "scene": { "xaxis": { "ticks": "", "gridcolor": "#DFE8F3", "gridwidth": 2, "linecolor": "#EBF0F8", "zerolinecolor": "#EBF0F8", "showbackground": true, "backgroundcolor": "white" }, "yaxis": { "ticks": "", "gridcolor": "#DFE8F3", "gridwidth": 2, "linecolor": "#EBF0F8", "zerolinecolor": "#EBF0F8", "showbackground": true, "backgroundcolor": "white" }, "zaxis": { "ticks": "", "gridcolor": "#DFE8F3", "gridwidth": 2, "linecolor": "#EBF0F8", "zerolinecolor": "#EBF0F8", "showbackground": true, "backgroundcolor": "white" } }, "title": { "x": 0.05 }, "xaxis": { "ticks": "", "gridcolor": "#EBF0F8", "linecolor": "#EBF0F8", "automargin": true, "zerolinecolor": "#EBF0F8", "zerolinewidth": 2 }, "yaxis": { "ticks": "", "gridcolor": "#EBF0F8", "linecolor": "#EBF0F8", "automargin": true, "zerolinecolor": "#EBF0F8", "zerolinewidth": 2 }, "ternary": { "aaxis": { "ticks": "", "gridcolor": "#DFE8F3", "linecolor": "#A2B1C6" }, "baxis": { "ticks": "", "gridcolor": "#DFE8F3", "linecolor": "#A2B1C6" }, "caxis": { "ticks": "", "gridcolor": "#DFE8F3", "linecolor": "#A2B1C6" }, "bgcolor": "white" }, "colorway": [ "#636efa", "#EF553B", "#00cc96", "#ab63fa", "#19d3f3", "#e763fa", "#fecb52", "#ffa15a", "#ff6692", "#b6e880" ], "hovermode": "closest", "colorscale": { "diverging": [ [ 0, "#8e0152" ], [ 0.1, "#c51b7d" ], [ 0.2, "#de77ae" ], [ 0.3, "#f1b6da" ], [ 0.4, "#fde0ef" ], [ 0.5, "#f7f7f7" ], [ 0.6, "#e6f5d0" ], [ 0.7, "#b8e186" ], [ 0.8, "#7fbc41" ], [ 0.9, "#4d9221" ], [ 1, "#276419" ] ], "sequential": [ [ 0, "#0508b8" ], [ 0.0893854748603352, "#1910d8" ], [ 0.1787709497206704, "#3c19f0" ], [ 0.2681564245810056, "#6b1cfb" ], [ 0.3575418994413408, "#981cfd" ], [ 0.44692737430167595, "#bf1cfd" ], [ 0.5363128491620112, "#dd2bfd" ], [ 0.6256983240223464, "#f246fe" ], [ 0.7150837988826816, "#fc67fd" ], [ 0.8044692737430168, "#fe88fc" ], [ 0.8938547486033519, "#fea5fd" ], [ 0.9832402234636871, "#febefe" ], [ 1, "#fec3fe" ] ], "sequentialminus": [ [ 0, "#0508b8" ], [ 0.0893854748603352, "#1910d8" ], [ 0.1787709497206704, "#3c19f0" ], [ 0.2681564245810056, "#6b1cfb" ], [ 0.3575418994413408, "#981cfd" ], [ 0.44692737430167595, "#bf1cfd" ], [ 0.5363128491620112, "#dd2bfd" ], [ 0.6256983240223464, "#f246fe" ], [ 0.7150837988826816, "#fc67fd" ], [ 0.8044692737430168, "#fe88fc" ], [ 0.8938547486033519, "#fea5fd" ], [ 0.9832402234636871, "#febefe" ], [ 1, "#fec3fe" ] ] }, "plot_bgcolor": "white", "paper_bgcolor": "white", "shapedefaults": { "line": { "width": 0 }, "opacity": 0.4, "fillcolor": "#506784" }, "annotationdefaults": { "arrowhead": 0, "arrowcolor": "#506784", "arrowwidth": 1 } }, "themeRef": "PLOTLY_WHITE" }, "hovermode": "closest", "showlegend": true, "annotations": [] } }, "height": null, "width": null, "user": { "profile_url": "https://chart-studio.plotly.com/~pahep49490", "avatar_url": "https://storage.googleapis.com/plotly-prod-profiles/70.jpg", "background_url": "https://storage.googleapis.com/plotly-prod-profiles/bg-5.jpg", "bio": "", "nickname": "", "website": "", "stream_tokens": null, "feature_set_id": null, "csrf_token": null, "date_joined": "2024-04-05 01:58:14", "mapbox_access_tokens": null, "has_password": null, "username": "pahep49490", "email": null, "is_active": null, "readonly": null, "is_dash_creator": null, "dash_created_count": null, "is_chart_creator": null, "charts_created_count": null } }, { "creation_time": "2024-04-05T13:55:17.392768Z", "comments": { "results": [], "count": 0 }, "parented": true, "embed_url": "https://chart-studio.plotly.com/~al3xsandro/4.embed", "fid": "al3xsandro:4", "filename": "Plot 4", "filetype": "plot", "img_url": "https://api.plotly.com/v2/files/al3xsandro:4/image?image_name=list-thumb", "image_urls": { "default": "https://api.plotly.com/v2/files/al3xsandro:4/image?image_name=default", "block-thumb": "https://storage.googleapis.com/plotly-prod-images/al3xsandro/4/8_D092TXX5NPC7IG3PFUEAJT2YX0CAOV.png", "list-thumb": "https://api.plotly.com/v2/files/al3xsandro:4/image?image_name=list-thumb" }, "api_urls": { "files": "https://api.plotly.com/v2/files/al3xsandro:4", "plots": "https://api.plotly.com/v2/plots/al3xsandro:4", "parent": "https://api.plotly.com/v2/folders/home?user=al3xsandro" }, "owner": "al3xsandro", "parent": -1, "preview": "", "referencers": [], "references": [], "title": "", "views": 1, "web_url": "https://chart-studio.plotly.com/~al3xsandro/4/", "world_readable": true, "date_modified": "2024-04-28T12:27:10.267Z", "stars": { "results": [], "count": 0 }, "collaborators": { "results": [], "count": 0 }, "subfolder_count": null, "refresh_interval": null, "organize_view_url": "https://chart-studio.plotly.com/~al3xsandro/4/", "current_user_permission": "read", "is_theme": null, "is_template": false, "autosize": true, "caption": "", "figure": { "data": [ { "meta": { "columnNames": { "x": "A", "y": "B" } }, "mode": "markers", "name": "", "type": "scatter", "xsrc": "al3xsandro:3:d24f1c", "ysrc": "al3xsandro:3:bb0d90", "xaxis": "x", "error_x": { "type": "constant", "color": "#636efa", "value": 0.3, "width": 5, "visible": false, "symmetric": true, "thickness": 2 }, "error_y": { "type": "constant", "color": "#636efa", "value": 0, "width": 0, "visible": false, "symmetric": true, "thickness": 0 }, "stackgroup": null, "selectedpoints": [ 0, 1, 2, 3, 4, 5, 6, 7, 8, 9 ] } ], "frames": [], "layout": { "title": { "text": "Análise" }, "xaxis": { "side": "bottom", "type": "linear", "range": [ 0.5303969957081545, 6.749603004291846 ], "title": { "text": "Tensão (V)" }, "domain": [ 0, 1 ], "autorange": true }, "yaxis": { "type": "linear", "range": [ 2.075730110775428, 30.724269889224573 ], "title": { "text": "Corrente (Ma)" }, "domain": [ 0, 1 ], "autorange": true }, "legend": { "x": 0.9880978762696215, "y": 1.16, "title": { "text": "<br>" } }, "margin": { "r": 80, "t": 90 }, "autosize": true, "dragmode": "select", "template": { "data": { "bar": [ { "type": "bar", "marker": { "colorbar": { "ticks": "", "outlinewidth": 0 } } } ], "table": [ { "type": "table", "cells": { "fill": { "color": "#EBF0F8" }, "line": { "color": "white" } }, "header": { "fill": { "color": "#C8D4E3" }, "line": { "color": "white" } } } ], "carpet": [ { "type": "carpet", "aaxis": { "gridcolor": "#C8D4E3", "linecolor": "#C8D4E3", "endlinecolor": "#2a3f5f", "minorgridcolor": "#C8D4E3", "startlinecolor": "#2a3f5f" }, "baxis": { "gridcolor": "#C8D4E3", "linecolor": "#C8D4E3", "endlinecolor": "#2a3f5f", "minorgridcolor": "#C8D4E3", "startlinecolor": "#2a3f5f" } } ], "mesh3d": [ { "type": "mesh3d", "colorbar": { "ticks": "", "outlinewidth": 0 } } ], "contour": [ { "type": "contour", "colorbar": { "ticks": "", "outlinewidth": 0 }, "autocolorscale": true } ], "heatmap": [ { "type": "heatmap", "colorbar": { "ticks": "", "outlinewidth": 0 }, "autocolorscale": true } ], "scatter": [ { "type": "scatter", "marker": { "colorbar": { "ticks": "", "outlinewidth": 0 } } } ], "surface": [ { "type": "surface", "colorbar": { "ticks": "", "outlinewidth": 0 } } ], "heatmapgl": [ { "type": "heatmapgl", "colorbar": { "ticks": "", "outlinewidth": 0 } } ], "histogram": [ { "type": "histogram", "marker": { "colorbar": { "ticks": "", "outlinewidth": 0 } } } ], "parcoords": [ { "line": { "colorbar": { "ticks": "", "outlinewidth": 0 } }, "type": "parcoords" } ], "scatter3d": [ { "type": "scatter3d", "marker": { "colorbar": { "ticks": "", "outlinewidth": 0 } } } ], "scattergl": [ { "type": "scattergl", "marker": { "colorbar": { "ticks": "", "outlinewidth": 0 } } } ], "choropleth": [ { "type": "choropleth", "colorbar": { "ticks": "", "outlinewidth": 0 } } ], "scattergeo": [ { "type": "scattergeo", "marker": { "colorbar": { "ticks": "", "outlinewidth": 0 } } } ], "histogram2d": [ { "type": "histogram2d", "colorbar": { "ticks": "", "outlinewidth": 0 }, "autocolorscale": true } ], "scatterpolar": [ { "type": "scatterpolar", "marker": { "colorbar": { "ticks": "", "outlinewidth": 0 } } } ], "contourcarpet": [ { "type": "contourcarpet", "colorbar": { "ticks": "", "outlinewidth": 0 } } ], "scattercarpet": [ { "type": "scattercarpet", "marker": { "colorbar": { "ticks": "", "outlinewidth": 0 } } } ], "scattermapbox": [ { "type": "scattermapbox", "marker": { "colorbar": { "ticks": "", "outlinewidth": 0 } } } ], "scatterpolargl": [ { "type": "scatterpolargl", "marker": { "colorbar": { "ticks": "", "outlinewidth": 0 } } } ], "scatterternary": [ { "type": "scatterternary", "marker": { "colorbar": { "ticks": "", "outlinewidth": 0 } } } ], "histogram2dcontour": [ { "type": "histogram2dcontour", "colorbar": { "ticks": "", "outlinewidth": 0 }, "autocolorscale": true } ] }, "layout": { "geo": { "bgcolor": "white", "showland": true, "lakecolor": "white", "landcolor": "white", "showlakes": true, "subunitcolor": "#C8D4E3" }, "font": { "color": "#2a3f5f" }, "polar": { "bgcolor": "white", "radialaxis": { "ticks": "", "gridcolor": "#EBF0F8", "linecolor": "#EBF0F8" }, "angularaxis": { "ticks": "", "gridcolor": "#EBF0F8", "linecolor": "#EBF0F8" } }, "scene": { "xaxis": { "ticks": "", "gridcolor": "#DFE8F3", "gridwidth": 2, "linecolor": "#EBF0F8", "zerolinecolor": "#EBF0F8", "showbackground": true, "backgroundcolor": "white" }, "yaxis": { "ticks": "", "gridcolor": "#DFE8F3", "gridwidth": 2, "linecolor": "#EBF0F8", "zerolinecolor": "#EBF0F8", "showbackground": true, "backgroundcolor": "white" }, "zaxis": { "ticks": "", "gridcolor": "#DFE8F3", "gridwidth": 2, "linecolor": "#EBF0F8", "zerolinecolor": "#EBF0F8", "showbackground": true, "backgroundcolor": "white" } }, "title": { "x": 0.05 }, "xaxis": { "ticks": "", "gridcolor": "#EBF0F8", "linecolor": "#EBF0F8", "automargin": true, "zerolinecolor": "#EBF0F8", "zerolinewidth": 2 }, "yaxis": { "ticks": "", "gridcolor": "#EBF0F8", "linecolor": "#EBF0F8", "automargin": true, "zerolinecolor": "#EBF0F8", "zerolinewidth": 2 }, "ternary": { "aaxis": { "ticks": "", "gridcolor": "#DFE8F3", "linecolor": "#A2B1C6" }, "baxis": { "ticks": "", "gridcolor": "#DFE8F3", "linecolor": "#A2B1C6" }, "caxis": { "ticks": "", "gridcolor": "#DFE8F3", "linecolor": "#A2B1C6" }, "bgcolor": "white" }, "colorway": [ "#636efa", "#EF553B", "#00cc96", "#ab63fa", "#19d3f3", "#e763fa", "#fecb52", "#ffa15a", "#ff6692", "#b6e880" ], "hovermode": "closest", "colorscale": { "diverging": [ [ 0, "#8e0152" ], [ 0.1, "#c51b7d" ], [ 0.2, "#de77ae" ], [ 0.3, "#f1b6da" ], [ 0.4, "#fde0ef" ], [ 0.5, "#f7f7f7" ], [ 0.6, "#e6f5d0" ], [ 0.7, "#b8e186" ], [ 0.8, "#7fbc41" ], [ 0.9, "#4d9221" ], [ 1, "#276419" ] ], "sequential": [ [ 0, "#0508b8" ], [ 0.0893854748603352, "#1910d8" ], [ 0.1787709497206704, "#3c19f0" ], [ 0.2681564245810056, "#6b1cfb" ], [ 0.3575418994413408, "#981cfd" ], [ 0.44692737430167595, "#bf1cfd" ], [ 0.5363128491620112, "#dd2bfd" ], [ 0.6256983240223464, "#f246fe" ], [ 0.7150837988826816, "#fc67fd" ], [ 0.8044692737430168, "#fe88fc" ], [ 0.8938547486033519, "#fea5fd" ], [ 0.9832402234636871, "#febefe" ], [ 1, "#fec3fe" ] ], "sequentialminus": [ [ 0, "#0508b8" ], [ 0.0893854748603352, "#1910d8" ], [ 0.1787709497206704, "#3c19f0" ], [ 0.2681564245810056, "#6b1cfb" ], [ 0.3575418994413408, "#981cfd" ], [ 0.44692737430167595, "#bf1cfd" ], [ 0.5363128491620112, "#dd2bfd" ], [ 0.6256983240223464, "#f246fe" ], [ 0.7150837988826816, "#fc67fd" ], [ 0.8044692737430168, "#fe88fc" ], [ 0.8938547486033519, "#fea5fd" ], [ 0.9832402234636871, "#febefe" ], [ 1, "#fec3fe" ] ] }, "plot_bgcolor": "white", "paper_bgcolor": "white", "shapedefaults": { "line": { "width": 0 }, "opacity": 0.4, "fillcolor": "#506784" }, "annotationdefaults": { "arrowhead": 0, "arrowcolor": "#506784", "arrowwidth": 1 } }, "themeRef": "PLOTLY_WHITE" }, "hovermode": "closest", "showlegend": true, "annotations": [] } }, "height": null, "width": null, "user": { "profile_url": "https://chart-studio.plotly.com/~al3xsandro", "avatar_url": "https://storage.googleapis.com/plotly-prod-profiles/35.jpg", "background_url": "https://storage.googleapis.com/plotly-prod-profiles/bg-0.jpg", "bio": "", "nickname": "", "website": "", "stream_tokens": null, "feature_set_id": null, "csrf_token": null, "date_joined": "2024-04-05 13:54:58", "mapbox_access_tokens": null, "has_password": null, "username": "al3xsandro", "email": null, "is_active": null, "readonly": null, "is_dash_creator": null, "dash_created_count": null, "is_chart_creator": null, "charts_created_count": null } }, { "creation_time": "2024-04-05T13:48:25.078130Z", "comments": { "results": [], "count": 0 }, "parented": true, "embed_url": "https://chart-studio.plotly.com/~mwren15/13.embed", "fid": "mwren15:13", "filename": "Plot 13", "filetype": "plot", "img_url": "https://storage.googleapis.com/plotly-prod-images/mwren15/13/9_9GG5XV14NXQKD15ZY70F9DK1FARH8P.png", "image_urls": { "default": "https://storage.googleapis.com/plotly-prod-images/mwren15/13/2_C6AKQYGF5G3S2AAUHX5AX2GC19IZX8.png", "block-thumb": "https://storage.googleapis.com/plotly-prod-images/mwren15/13/8_RXAISD04JFGXUQX9DYL37HKUNSQHWX.png", "list-thumb": "https://storage.googleapis.com/plotly-prod-images/mwren15/13/9_9GG5XV14NXQKD15ZY70F9DK1FARH8P.png" }, "api_urls": { "files": "https://api.plotly.com/v2/files/mwren15:13", "plots": "https://api.plotly.com/v2/plots/mwren15:13", "parent": "https://api.plotly.com/v2/folders/home?user=mwren15" }, "owner": "mwren15", "parent": -1, "preview": "", "referencers": [], "references": [], "title": "", "views": 139, "web_url": "https://chart-studio.plotly.com/~mwren15/13/", "world_readable": true, "date_modified": "2024-04-05T13:48:25.090Z", "stars": { "results": [], "count": 0 }, "collaborators": { "results": [], "count": 0 }, "subfolder_count": null, "refresh_interval": null, "organize_view_url": "https://chart-studio.plotly.com/~mwren15/13/", "current_user_permission": "read", "is_theme": null, "is_template": false, "autosize": true, "caption": "", "figure": { "data": [ { "line": { "dash": "solid", "color": "rgba(255, 153, 51, 1.0)", "shape": "linear", "width": 1.3 }, "meta": { "columnNames": { "x": "HCM Capital, x; TSX-Rebased, x", "y": "HCM Capital, y" } }, "mode": "lines", "name": "HCM Capital", "text": "", "type": "scatter", "xsrc": "mwren15:12:bf32c7", "ysrc": "mwren15:12:ca915f" }, { "line": { "dash": "solid", "color": "rgba(55, 128, 191, 1.0)", "shape": "linear", "width": 1.3 }, "meta": { "columnNames": { "x": "HCM Capital, x; TSX-Rebased, x", "y": "TSX-Rebased, y" } }, "mode": "lines", "name": "TSX-Rebased", "text": "", "type": "scatter", "xsrc": "mwren15:12:bf32c7", "ysrc": "mwren15:12:b8351e" } ], "frames": [], "layout": { "title": { "font": { "color": "#4D5663" }, "text": " HoldCo Markets (HCM) Private Capital Re-Based Performance % Since 2013 Inception" }, "xaxis": { "type": "date", "range": [ "2013-01-02", "2024-04-03" ], "title": { "font": { "color": "#4D5663" }, "text": "" }, "showgrid": true, "tickfont": { "color": "#4D5663" }, "autorange": true, "gridcolor": "#E1E5ED", "zerolinecolor": "#E1E5ED" }, "yaxis": { "type": "linear", "range": [ -21.245067510920776, 194.37016242442473 ], "title": { "font": { "color": "#4D5663" }, "text": "" }, "showgrid": true, "tickfont": { "color": "#4D5663" }, "autorange": true, "gridcolor": "#E1E5ED", "zerolinecolor": "#E1E5ED" }, "legend": { "font": { "color": "#4D5663" }, "bgcolor": "#F5F6F9" }, "autosize": true, "template": { "data": { "bar": [ { "type": "bar", "marker": { "line": { "color": "#E5ECF6", "width": 0.5 }, "pattern": { "size": 10, "fillmode": "overlay", "solidity": 0.2 } }, "error_x": { "color": "#2a3f5f" }, "error_y": { "color": "#2a3f5f" } } ], "pie": [ { "type": "pie", "automargin": true } ], "table": [ { "type": "table", "cells": { "fill": { "color": "#EBF0F8" }, "line": { "color": "white" } }, "header": { "fill": { "color": "#C8D4E3" }, "line": { "color": "white" } } } ], "carpet": [ { "type": "carpet", "aaxis": { "gridcolor": "white", "linecolor": "white", "endlinecolor": "#2a3f5f", "minorgridcolor": "white", "startlinecolor": "#2a3f5f" }, "baxis": { "gridcolor": "white", "linecolor": "white", "endlinecolor": "#2a3f5f", "minorgridcolor": "white", "startlinecolor": "#2a3f5f" } } ], "mesh3d": [ { "type": "mesh3d", "colorbar": { "ticks": "", "outlinewidth": 0 } } ], "contour": [ { "type": "contour", "colorbar": { "ticks": "", "outlinewidth": 0 }, "colorscale": [ [ 0, "#0d0887" ], [ 0.1111111111111111, "#46039f" ], [ 0.2222222222222222, "#7201a8" ], [ 0.3333333333333333, "#9c179e" ], [ 0.4444444444444444, "#bd3786" ], [ 0.5555555555555556, "#d8576b" ], [ 0.6666666666666666, "#ed7953" ], [ 0.7777777777777778, "#fb9f3a" ], [ 0.8888888888888888, "#fdca26" ], [ 1, "#f0f921" ] ] } ], "heatmap": [ { "type": "heatmap", "colorbar": { "ticks": "", "outlinewidth": 0 }, "colorscale": [ [ 0, "#0d0887" ], [ 0.1111111111111111, "#46039f" ], [ 0.2222222222222222, "#7201a8" ], [ 0.3333333333333333, "#9c179e" ], [ 0.4444444444444444, "#bd3786" ], [ 0.5555555555555556, "#d8576b" ], [ 0.6666666666666666, "#ed7953" ], [ 0.7777777777777778, "#fb9f3a" ], [ 0.8888888888888888, "#fdca26" ], [ 1, "#f0f921" ] ] } ], "scatter": [ { "type": "scatter", "marker": { "colorbar": { "ticks": "", "outlinewidth": 0 } } } ], "surface": [ { "type": "surface", "colorbar": { "ticks": "", "outlinewidth": 0 }, "colorscale": [ [ 0, "#0d0887" ], [ 0.1111111111111111, "#46039f" ], [ 0.2222222222222222, "#7201a8" ], [ 0.3333333333333333, "#9c179e" ], [ 0.4444444444444444, "#bd3786" ], [ 0.5555555555555556, "#d8576b" ], [ 0.6666666666666666, "#ed7953" ], [ 0.7777777777777778, "#fb9f3a" ], [ 0.8888888888888888, "#fdca26" ], [ 1, "#f0f921" ] ] } ], "barpolar": [ { "type": "barpolar", "marker": { "line": { "color": "#E5ECF6", "width": 0.5 }, "pattern": { "size": 10, "fillmode": "overlay", "solidity": 0.2 } } } ], "heatmapgl": [ { "type": "heatmapgl", "colorbar": { "ticks": "", "outlinewidth": 0 }, "colorscale": [ [ 0, "#0d0887" ], [ 0.1111111111111111, "#46039f" ], [ 0.2222222222222222, "#7201a8" ], [ 0.3333333333333333, "#9c179e" ], [ 0.4444444444444444, "#bd3786" ], [ 0.5555555555555556, "#d8576b" ], [ 0.6666666666666666, "#ed7953" ], [ 0.7777777777777778, "#fb9f3a" ], [ 0.8888888888888888, "#fdca26" ], [ 1, "#f0f921" ] ] } ], "histogram": [ { "type": "histogram", "marker": { "pattern": { "size": 10, "fillmode": "overlay", "solidity": 0.2 } } } ], "parcoords": [ { "line": { "colorbar": { "ticks": "", "outlinewidth": 0 } }, "type": "parcoords" } ], "scatter3d": [ { "line": { "colorbar": { "ticks": "", "outlinewidth": 0 } }, "type": "scatter3d", "marker": { "colorbar": { "ticks": "", "outlinewidth": 0 } } } ], "scattergl": [ { "type": "scattergl", "marker": { "colorbar": { "ticks": "", "outlinewidth": 0 } } } ], "choropleth": [ { "type": "choropleth", "colorbar": { "ticks": "", "outlinewidth": 0 } } ], "scattergeo": [ { "type": "scattergeo", "marker": { "colorbar": { "ticks": "", "outlinewidth": 0 } } } ], "histogram2d": [ { "type": "histogram2d", "colorbar": { "ticks": "", "outlinewidth": 0 }, "colorscale": [ [ 0, "#0d0887" ], [ 0.1111111111111111, "#46039f" ], [ 0.2222222222222222, "#7201a8" ], [ 0.3333333333333333, "#9c179e" ], [ 0.4444444444444444, "#bd3786" ], [ 0.5555555555555556, "#d8576b" ], [ 0.6666666666666666, "#ed7953" ], [ 0.7777777777777778, "#fb9f3a" ], [ 0.8888888888888888, "#fdca26" ], [ 1, "#f0f921" ] ] } ], "scatterpolar": [ { "type": "scatterpolar", "marker": { "colorbar": { "ticks": "", "outlinewidth": 0 } } } ], "contourcarpet": [ { "type": "contourcarpet", "colorbar": { "ticks": "", "outlinewidth": 0 } } ], "scattercarpet": [ { "type": "scattercarpet", "marker": { "colorbar": { "ticks": "", "outlinewidth": 0 } } } ], "scattermapbox": [ { "type": "scattermapbox", "marker": { "colorbar": { "ticks": "", "outlinewidth": 0 } } } ], "scatterpolargl": [ { "type": "scatterpolargl", "marker": { "colorbar": { "ticks": "", "outlinewidth": 0 } } } ], "scatterternary": [ { "type": "scatterternary", "marker": { "colorbar": { "ticks": "", "outlinewidth": 0 } } } ], "histogram2dcontour": [ { "type": "histogram2dcontour", "colorbar": { "ticks": "", "outlinewidth": 0 }, "colorscale": [ [ 0, "#0d0887" ], [ 0.1111111111111111, "#46039f" ], [ 0.2222222222222222, "#7201a8" ], [ 0.3333333333333333, "#9c179e" ], [ 0.4444444444444444, "#bd3786" ], [ 0.5555555555555556, "#d8576b" ], [ 0.6666666666666666, "#ed7953" ], [ 0.7777777777777778, "#fb9f3a" ], [ 0.8888888888888888, "#fdca26" ], [ 1, "#f0f921" ] ] } ] }, "layout": { "geo": { "bgcolor": "white", "showland": true, "lakecolor": "white", "landcolor": "#E5ECF6", "showlakes": true, "subunitcolor": "white" }, "font": { "color": "#2a3f5f" }, "polar": { "bgcolor": "#E5ECF6", "radialaxis": { "ticks": "", "gridcolor": "white", "linecolor": "white" }, "angularaxis": { "ticks": "", "gridcolor": "white", "linecolor": "white" } }, "scene": { "xaxis": { "ticks": "", "gridcolor": "white", "gridwidth": 2, "linecolor": "white", "zerolinecolor": "white", "showbackground": true, "backgroundcolor": "#E5ECF6" }, "yaxis": { "ticks": "", "gridcolor": "white", "gridwidth": 2, "linecolor": "white", "zerolinecolor": "white", "showbackground": true, "backgroundcolor": "#E5ECF6" }, "zaxis": { "ticks": "", "gridcolor": "white", "gridwidth": 2, "linecolor": "white", "zerolinecolor": "white", "showbackground": true, "backgroundcolor": "#E5ECF6" } }, "title": { "x": 0.05 }, "xaxis": { "ticks": "", "title": { "standoff": 15 }, "gridcolor": "white", "linecolor": "white", "automargin": true, "zerolinecolor": "white", "zerolinewidth": 2 }, "yaxis": { "ticks": "", "title": { "standoff": 15 }, "gridcolor": "white", "linecolor": "white", "automargin": true, "zerolinecolor": "white", "zerolinewidth": 2 }, "mapbox": { "style": "light" }, "ternary": { "aaxis": { "ticks": "", "gridcolor": "white", "linecolor": "white" }, "baxis": { "ticks": "", "gridcolor": "white", "linecolor": "white" }, "caxis": { "ticks": "", "gridcolor": "white", "linecolor": "white" }, "bgcolor": "#E5ECF6" }, "colorway": [ "#636efa", "#EF553B", "#00cc96", "#ab63fa", "#FFA15A", "#19d3f3", "#FF6692", "#B6E880", "#FF97FF", "#FECB52" ], "coloraxis": { "colorbar": { "ticks": "", "outlinewidth": 0 } }, "hovermode": "closest", "colorscale": { "diverging": [ [ 0, "#8e0152" ], [ 0.1, "#c51b7d" ], [ 0.2, "#de77ae" ], [ 0.3, "#f1b6da" ], [ 0.4, "#fde0ef" ], [ 0.5, "#f7f7f7" ], [ 0.6, "#e6f5d0" ], [ 0.7, "#b8e186" ], [ 0.8, "#7fbc41" ], [ 0.9, "#4d9221" ], [ 1, "#276419" ] ], "sequential": [ [ 0, "#0d0887" ], [ 0.1111111111111111, "#46039f" ], [ 0.2222222222222222, "#7201a8" ], [ 0.3333333333333333, "#9c179e" ], [ 0.4444444444444444, "#bd3786" ], [ 0.5555555555555556, "#d8576b" ], [ 0.6666666666666666, "#ed7953" ], [ 0.7777777777777778, "#fb9f3a" ], [ 0.8888888888888888, "#fdca26" ], [ 1, "#f0f921" ] ], "sequentialminus": [ [ 0, "#0d0887" ], [ 0.1111111111111111, "#46039f" ], [ 0.2222222222222222, "#7201a8" ], [ 0.3333333333333333, "#9c179e" ], [ 0.4444444444444444, "#bd3786" ], [ 0.5555555555555556, "#d8576b" ], [ 0.6666666666666666, "#ed7953" ], [ 0.7777777777777778, "#fb9f3a" ], [ 0.8888888888888888, "#fdca26" ], [ 1, "#f0f921" ] ] }, "hoverlabel": { "align": "left" }, "plot_bgcolor": "#E5ECF6", "paper_bgcolor": "white", "shapedefaults": { "line": { "color": "#2a3f5f" } }, "autotypenumbers": "strict", "annotationdefaults": { "arrowhead": 0, "arrowcolor": "#2a3f5f", "arrowwidth": 1 } } }, "plot_bgcolor": "#F5F6F9", "paper_bgcolor": "#F5F6F9" } }, "height": null, "width": null, "user": { "profile_url": "https://chart-studio.plotly.com/~mwren15", "avatar_url": "https://storage.googleapis.com/plotly-prod-profiles/94.jpg", "background_url": "https://storage.googleapis.com/plotly-prod-profiles/bg-12.jpg", "bio": "", "nickname": "", "website": "", "stream_tokens": null, "feature_set_id": null, "csrf_token": null, "date_joined": "2023-12-11 01:54:14", "mapbox_access_tokens": null, "has_password": null, "username": "mwren15", "email": null, "is_active": null, "readonly": null, "is_dash_creator": null, "dash_created_count": null, "is_chart_creator": null, "charts_created_count": null } }, { "creation_time": "2024-04-05T13:45:31.003720Z", "comments": { "results": [], "count": 0 }, "parented": true, "embed_url": "https://chart-studio.plotly.com/~dionchu/94.embed", "fid": "dionchu:94", "filename": "20240405_basis", "filetype": "plot", "img_url": "https://storage.googleapis.com/plotly-prod-images/dionchu/94/9_2ZA15PBLNITFH2TTKTLIQ2OLK3YGAE.png", "image_urls": { "default": "https://storage.googleapis.com/plotly-prod-images/dionchu/94/2_F1DTZI8F8GSQDNCD0JMCNYXJCH8X3Z.png", "block-thumb": "https://storage.googleapis.com/plotly-prod-images/dionchu/94/8_NAUTOMCDZ8KUG8T1SGWNDPBQ7AH4QV.png", "list-thumb": "https://storage.googleapis.com/plotly-prod-images/dionchu/94/9_2ZA15PBLNITFH2TTKTLIQ2OLK3YGAE.png" }, "api_urls": { "files": "https://api.plotly.com/v2/files/dionchu:94", "plots": "https://api.plotly.com/v2/plots/dionchu:94", "parent": "https://api.plotly.com/v2/folders/home?user=dionchu" }, "owner": "dionchu", "parent": -1, "preview": "", "referencers": [], "references": [], "title": "", "views": 1, "web_url": "https://chart-studio.plotly.com/~dionchu/94/", "world_readable": true, "date_modified": "2024-04-05T13:45:31.015Z", "stars": { "results": [], "count": 0 }, "collaborators": { "results": [], "count": 0 }, "subfolder_count": null, "refresh_interval": null, "organize_view_url": "https://chart-studio.plotly.com/~dionchu/94/", "current_user_permission": "read", "is_theme": null, "is_template": false, "autosize": true, "caption": "", "figure": { "data": [ { "line": { "color": "rgb(167, 91, 162)" }, "meta": { "columnNames": { "x": "A", "y": "B" } }, "mode": "lines", "name": "<b>Aave Borrow</b><br>correlation 100.00%", "type": "scatter", "xsrc": "dionchu:93:f08ae4", "ysrc": "dionchu:93:c62cd0" }, { "line": { "color": "rgb(68, 170, 192)" }, "meta": { "columnNames": { "x": "A", "y": "C" } }, "mode": "lines", "name": "<b>3mo Basis (ETH)</b><br>correlation 91.80%", "type": "scatter", "xsrc": "dionchu:93:f08ae4", "ysrc": "dionchu:93:219008", "stackgroup": null }, { "line": { "color": "rgb(132, 137, 137)" }, "meta": { "columnNames": { "x": "A", "y": "D" } }, "mode": "lines", "name": "<b>Perp Funding</b><br>correlation 89.74%", "type": "scatter", "xsrc": "dionchu:93:f08ae4", "ysrc": "dionchu:93:6458d2", "stackgroup": null } ], "frames": [], "layout": { "title": { "text": "DeFi money markets vs. ETH derivatives funding rates" }, "xaxis": { "type": "category", "range": [ 0, 281 ], "autorange": true }, "yaxis": { "range": [ 0.977222222222222, 31.63277777777778 ], "autorange": true }, "autosize": true, "template": { "data": { "bar": [ { "type": "bar", "marker": { "colorbar": { "ticks": "", "outlinewidth": 0 } } } ], "table": [ { "type": "table", "cells": { "fill": { "color": "#EBF0F8" }, "line": { "color": "white" } }, "header": { "fill": { "color": "#C8D4E3" }, "line": { "color": "white" } } } ], "carpet": [ { "type": "carpet", "aaxis": { "gridcolor": "#C8D4E3", "linecolor": "#C8D4E3", "endlinecolor": "#2a3f5f", "minorgridcolor": "#C8D4E3", "startlinecolor": "#2a3f5f" }, "baxis": { "gridcolor": "#C8D4E3", "linecolor": "#C8D4E3", "endlinecolor": "#2a3f5f", "minorgridcolor": "#C8D4E3", "startlinecolor": "#2a3f5f" } } ], "mesh3d": [ { "type": "mesh3d", "colorbar": { "ticks": "", "outlinewidth": 0 } } ], "contour": [ { "type": "contour", "colorbar": { "ticks": "", "outlinewidth": 0 }, "autocolorscale": true } ], "heatmap": [ { "type": "heatmap", "colorbar": { "ticks": "", "outlinewidth": 0 }, "autocolorscale": true } ], "scatter": [ { "type": "scatter", "marker": { "colorbar": { "ticks": "", "outlinewidth": 0 } } } ], "surface": [ { "type": "surface", "colorbar": { "ticks": "", "outlinewidth": 0 } } ], "heatmapgl": [ { "type": "heatmapgl", "colorbar": { "ticks": "", "outlinewidth": 0 } } ], "histogram": [ { "type": "histogram", "marker": { "colorbar": { "ticks": "", "outlinewidth": 0 } } } ], "parcoords": [ { "line": { "colorbar": { "ticks": "", "outlinewidth": 0 } }, "type": "parcoords" } ], "scatter3d": [ { "type": "scatter3d", "marker": { "colorbar": { "ticks": "", "outlinewidth": 0 } } } ], "scattergl": [ { "type": "scattergl", "marker": { "colorbar": { "ticks": "", "outlinewidth": 0 } } } ], "choropleth": [ { "type": "choropleth", "colorbar": { "ticks": "", "outlinewidth": 0 } } ], "scattergeo": [ { "type": "scattergeo", "marker": { "colorbar": { "ticks": "", "outlinewidth": 0 } } } ], "histogram2d": [ { "type": "histogram2d", "colorbar": { "ticks": "", "outlinewidth": 0 }, "autocolorscale": true } ], "scatterpolar": [ { "type": "scatterpolar", "marker": { "colorbar": { "ticks": "", "outlinewidth": 0 } } } ], "contourcarpet": [ { "type": "contourcarpet", "colorbar": { "ticks": "", "outlinewidth": 0 } } ], "scattercarpet": [ { "type": "scattercarpet", "marker": { "colorbar": { "ticks": "", "outlinewidth": 0 } } } ], "scattermapbox": [ { "type": "scattermapbox", "marker": { "colorbar": { "ticks": "", "outlinewidth": 0 } } } ], "scatterpolargl": [ { "type": "scatterpolargl", "marker": { "colorbar": { "ticks": "", "outlinewidth": 0 } } } ], "scatterternary": [ { "type": "scatterternary", "marker": { "colorbar": { "ticks": "", "outlinewidth": 0 } } } ], "histogram2dcontour": [ { "type": "histogram2dcontour", "colorbar": { "ticks": "", "outlinewidth": 0 }, "autocolorscale": true } ] }, "layout": { "geo": { "bgcolor": "white", "showland": true, "lakecolor": "white", "landcolor": "white", "showlakes": true, "subunitcolor": "#C8D4E3" }, "font": { "color": "#2a3f5f" }, "polar": { "bgcolor": "white", "radialaxis": { "ticks": "", "gridcolor": "#EBF0F8", "linecolor": "#EBF0F8" }, "angularaxis": { "ticks": "", "gridcolor": "#EBF0F8", "linecolor": "#EBF0F8" } }, "scene": { "xaxis": { "ticks": "", "gridcolor": "#DFE8F3", "gridwidth": 2, "linecolor": "#EBF0F8", "zerolinecolor": "#EBF0F8", "showbackground": true, "backgroundcolor": "white" }, "yaxis": { "ticks": "", "gridcolor": "#DFE8F3", "gridwidth": 2, "linecolor": "#EBF0F8", "zerolinecolor": "#EBF0F8", "showbackground": true, "backgroundcolor": "white" }, "zaxis": { "ticks": "", "gridcolor": "#DFE8F3", "gridwidth": 2, "linecolor": "#EBF0F8", "zerolinecolor": "#EBF0F8", "showbackground": true, "backgroundcolor": "white" } }, "title": { "x": 0.05 }, "xaxis": { "ticks": "", "gridcolor": "#EBF0F8", "linecolor": "#EBF0F8", "automargin": true, "zerolinecolor": "#EBF0F8", "zerolinewidth": 2 }, "yaxis": { "ticks": "", "gridcolor": "#EBF0F8", "linecolor": "#EBF0F8", "automargin": true, "zerolinecolor": "#EBF0F8", "zerolinewidth": 2 }, "ternary": { "aaxis": { "ticks": "", "gridcolor": "#DFE8F3", "linecolor": "#A2B1C6" }, "baxis": { "ticks": "", "gridcolor": "#DFE8F3", "linecolor": "#A2B1C6" }, "caxis": { "ticks": "", "gridcolor": "#DFE8F3", "linecolor": "#A2B1C6" }, "bgcolor": "white" }, "colorway": [ "#636efa", "#EF553B", "#00cc96", "#ab63fa", "#19d3f3", "#e763fa", "#fecb52", "#ffa15a", "#ff6692", "#b6e880" ], "hovermode": "closest", "colorscale": { "diverging": [ [ 0, "#8e0152" ], [ 0.1, "#c51b7d" ], [ 0.2, "#de77ae" ], [ 0.3, "#f1b6da" ], [ 0.4, "#fde0ef" ], [ 0.5, "#f7f7f7" ], [ 0.6, "#e6f5d0" ], [ 0.7, "#b8e186" ], [ 0.8, "#7fbc41" ], [ 0.9, "#4d9221" ], [ 1, "#276419" ] ], "sequential": [ [ 0, "#0508b8" ], [ 0.0893854748603352, "#1910d8" ], [ 0.1787709497206704, "#3c19f0" ], [ 0.2681564245810056, "#6b1cfb" ], [ 0.3575418994413408, "#981cfd" ], [ 0.44692737430167595, "#bf1cfd" ], [ 0.5363128491620112, "#dd2bfd" ], [ 0.6256983240223464, "#f246fe" ], [ 0.7150837988826816, "#fc67fd" ], [ 0.8044692737430168, "#fe88fc" ], [ 0.8938547486033519, "#fea5fd" ], [ 0.9832402234636871, "#febefe" ], [ 1, "#fec3fe" ] ], "sequentialminus": [ [ 0, "#0508b8" ], [ 0.0893854748603352, "#1910d8" ], [ 0.1787709497206704, "#3c19f0" ], [ 0.2681564245810056, "#6b1cfb" ], [ 0.3575418994413408, "#981cfd" ], [ 0.44692737430167595, "#bf1cfd" ], [ 0.5363128491620112, "#dd2bfd" ], [ 0.6256983240223464, "#f246fe" ], [ 0.7150837988826816, "#fc67fd" ], [ 0.8044692737430168, "#fe88fc" ], [ 0.8938547486033519, "#fea5fd" ], [ 0.9832402234636871, "#febefe" ], [ 1, "#fec3fe" ] ] }, "plot_bgcolor": "white", "paper_bgcolor": "white", "shapedefaults": { "line": { "width": 0 }, "opacity": 0.4, "fillcolor": "#506784" }, "annotationdefaults": { "arrowhead": 0, "arrowcolor": "#506784", "arrowwidth": 1 } }, "themeRef": "PLOTLY_WHITE" } } }, "height": null, "width": null, "user": { "profile_url": "https://chart-studio.plotly.com/~dionchu", "avatar_url": "https://storage.googleapis.com/plotly-prod-profiles/17.jpg", "background_url": "https://storage.googleapis.com/plotly-prod-profiles/bg-5.jpg", "bio": "", "nickname": "", "website": "", "stream_tokens": null, "feature_set_id": null, "csrf_token": null, "date_joined": "2023-10-20 19:36:55", "mapbox_access_tokens": null, "has_password": null, "username": "dionchu", "email": null, "is_active": null, "readonly": null, "is_dash_creator": null, "dash_created_count": null, "is_chart_creator": null, "charts_created_count": null } }, { "creation_time": "2024-04-05T13:42:45.613832Z", "comments": { "results": [], "count": 0 }, "parented": true, "embed_url": "https://chart-studio.plotly.com/~dionchu/92.embed", "fid": "dionchu:92", "filename": "20240405", "filetype": "plot", "img_url": "https://storage.googleapis.com/plotly-prod-images/dionchu/92/9_BXYBTID7KSCKA5ZD5B6A6YOH02ND2C.png", "image_urls": { "default": "https://storage.googleapis.com/plotly-prod-images/dionchu/92/2_MNB6BL5GLF3E7RCCHU5JQ3PBY9PQ3I.png", "block-thumb": "https://storage.googleapis.com/plotly-prod-images/dionchu/92/8_66PUDV62B8AXNKF78I23J7U9X9FFIL.png", "list-thumb": "https://storage.googleapis.com/plotly-prod-images/dionchu/92/9_BXYBTID7KSCKA5ZD5B6A6YOH02ND2C.png" }, "api_urls": { "files": "https://api.plotly.com/v2/files/dionchu:92", "plots": "https://api.plotly.com/v2/plots/dionchu:92", "parent": "https://api.plotly.com/v2/folders/home?user=dionchu" }, "owner": "dionchu", "parent": -1, "preview": "", "referencers": [], "references": [], "title": "", "views": 1, "web_url": "https://chart-studio.plotly.com/~dionchu/92/", "world_readable": true, "date_modified": "2024-04-05T13:42:45.623Z", "stars": { "results": [], "count": 0 }, "collaborators": { "results": [], "count": 0 }, "subfolder_count": null, "refresh_interval": null, "organize_view_url": "https://chart-studio.plotly.com/~dionchu/92/", "current_user_permission": "read", "is_theme": null, "is_template": false, "autosize": true, "caption": "", "figure": { "data": [ { "uid": "e5f816", "meta": { "columnNames": { "x": "C", "y": "B" } }, "mode": "lines", "name": "Clearing Volume - wETH/wstETH", "type": "bar", "xsrc": "dionchu:91:e1d79c", "ysrc": "dionchu:91:ab26c9", "xaxis": "x", "yaxis": "y2", "marker": { "color": "rgb(92, 58, 214)", "opacity": 1 }, "opacity": 0.5, "stackgroup": null, "orientation": "v" }, { "uid": "fc1e4a", "line": { "color": "rgb(92, 58, 214)" }, "meta": { "columnNames": { "x": "C", "y": "A" } }, "mode": "markers+lines", "name": "Clearing Rate - wETH/wstETH<br>", "type": "scatter", "xsrc": "dionchu:91:e1d79c", "ysrc": "dionchu:91:e0e429", "opacity": 1 }, { "uid": "a767bc", "line": { "color": "rgb(92, 58, 214)", "width": 2 }, "meta": { "columnNames": { "x": "C", "y": "D" } }, "mode": "markers+lines", "name": "Clearing Rate - USDC/sDAI", "type": "scatter", "xsrc": "dionchu:91:e1d79c", "ysrc": "dionchu:91:c46ebf", "xaxis": "x2", "yaxis": "y3", "stackgroup": null, "connectgaps": false }, { "uid": "7f8dba", "meta": { "columnNames": { "x": "C", "y": "E" } }, "mode": "lines", "name": "Clearing Volume - USDC/sDAI", "type": "bar", "xsrc": "dionchu:91:e1d79c", "ysrc": "dionchu:91:2bf8f7", "xaxis": "x2", "yaxis": "y4", "marker": { "color": "rgb(92, 58, 214)", "opacity": 1 }, "opacity": 0.5, "stackgroup": null, "orientation": "v" }, { "uid": "d1c0cf", "meta": { "columnNames": { "x": "C", "y": "F" } }, "name": "Clearing Volume - USDC/wstETH", "type": "bar", "xsrc": "dionchu:91:e1d79c", "ysrc": "dionchu:91:943962", "xaxis": "x2", "yaxis": "y4", "marker": { "color": "rgb(99, 209, 207)", "opacity": 0.75 }, "visible": true, "orientation": "v" }, { "uid": "e60dcb", "meta": { "columnNames": { "x": "C", "y": "G" } }, "mode": "markers+lines", "name": "Clearing Rate - USDC/wstETH", "type": "scatter", "xsrc": "dionchu:91:e1d79c", "ysrc": "dionchu:91:b386f8", "xaxis": "x2", "yaxis": "y3", "marker": { "color": "rgb(99, 209, 207)" }, "orientation": "v" }, { "uid": "c172a0", "line": { "color": "rgb(99, 209, 207)" }, "meta": { "columnNames": { "x": "C", "y": "I" } }, "mode": "markers+lines", "name": "Clearing Rate - wETH/wstETH (12wk)", "type": "scatter", "xsrc": "dionchu:91:e1d79c", "ysrc": "dionchu:91:e5eacd", "xaxis": "x", "yaxis": "y", "connectgaps": true }, { "uid": "778fcb", "meta": { "columnNames": { "x": "C", "y": "H" } }, "mode": "lines", "name": "Clearing Volume - wETH/wstETH (12wk)", "type": "bar", "xsrc": "dionchu:91:e1d79c", "ysrc": "dionchu:91:720742", "yaxis": "y2", "marker": { "color": "rgb(99, 209, 207)", "opacity": 0.75 }, "stackgroup": null, "orientation": "v" }, { "meta": { "columnNames": { "x": "C", "y": "J" } }, "name": "Clearing Volume - USDC/wSTBT", "type": "bar", "xsrc": "dionchu:91:e1d79c", "ysrc": "dionchu:91:65cf69", "xaxis": "x2", "yaxis": "y4", "marker": { "color": "rgb(99, 209, 207)", "opacity": 0.5 }, "orientation": "v" }, { "meta": { "columnNames": { "x": "C", "y": "P" } }, "name": "Clearing Volume - wETH/weETH 5mo", "type": "bar", "xsrc": "dionchu:91:e1d79c", "ysrc": "dionchu:91:84b9cf", "xaxis": "x", "yaxis": "y2", "marker": { "color": "rgb(44, 188, 252)", "opacity": 0.5 }, "orientation": "v" }, { "meta": { "columnNames": { "x": "C", "y": "R" } }, "name": "<b>Clearing Volume - wETH/weETH</b>", "type": "bar", "xsrc": "dionchu:91:e1d79c", "ysrc": "dionchu:91:301a78", "yaxis": "y2", "marker": { "color": "rgb(180, 92, 252)", "opacity": 0.5 }, "orientation": "v" }, { "meta": { "columnNames": { "x": "C", "y": "Q" } }, "mode": "markers+lines", "name": "<b>Clearing Rate - wETH/weETH 5mo</b>", "type": "scatter", "xsrc": "dionchu:91:e1d79c", "ysrc": "dionchu:91:5aa917", "yaxis": "y", "marker": { "color": "rgb(44, 188, 252)" }, "orientation": "v" }, { "line": { "width": 2 }, "meta": { "columnNames": { "x": "C", "y": "S" } }, "mode": "markers+lines", "name": "<b>Clearing Rate - wETH/weETH</b>", "type": "scatter", "xsrc": "dionchu:91:e1d79c", "ysrc": "dionchu:91:cfb4da", "marker": { "color": "rgb(180, 92, 252)" }, "opacity": 1, "stackgroup": null }, { "line": { "color": "rgb(4, 156, 244)" }, "meta": { "columnNames": { "x": "C", "y": "M" } }, "mode": "markers+lines", "name": "Clearing Rate - USDC/wstETH High LTV", "type": "scatter", "xsrc": "dionchu:91:e1d79c", "ysrc": "dionchu:91:88eae9", "xaxis": "x2", "yaxis": "y3", "connectgaps": true, "orientation": "v" }, { "line": { "color": "rgb(244, 148, 68)" }, "meta": { "columnNames": { "x": "C", "y": "O" } }, "mode": "markers+lines", "name": "<b>Clearing Rate - USDC/wBTC</b>", "type": "scatter", "xsrc": "dionchu:91:e1d79c", "ysrc": "dionchu:91:1fa22b", "xaxis": "x2", "yaxis": "y3", "stackgroup": null, "connectgaps": true }, { "meta": { "columnNames": { "x": "C", "y": "L" } }, "mode": "markers", "name": "Clearing Volume - USDC/wstETH High LTV", "type": "bar", "xsrc": "dionchu:91:e1d79c", "ysrc": "dionchu:91:39cde5", "xaxis": "x2", "yaxis": "y4", "marker": { "color": "rgb(4, 156, 244)", "opacity": 0.5 }, "stackgroup": null, "orientation": "v" }, { "meta": { "columnNames": { "x": "C", "y": "N" } }, "mode": "markers+lines", "name": "Clearing Volume - USDC/wBTC", "type": "bar", "xsrc": "dionchu:91:e1d79c", "ysrc": "dionchu:91:2d2666", "xaxis": "x2", "yaxis": "y4", "marker": { "color": "rgb(244, 148, 68)" }, "opacity": 0.5, "orientation": "v" } ], "frames": [], "layout": { "title": { "text": "<br>" }, "xaxis": { "side": "bottom", "type": "category", "range": [ 3.255142750704574, 34 ], "ticks": "", "title": { "text": "<br>" }, "anchor": "free", "domain": [ 0.55, 1 ], "showline": false, "autorange": false, "overlaying": false, "showspikes": true, "rangeslider": { "range": [ -0.6703160504028094, 10.670316050402809 ], "yaxis": {}, "yaxis2": {}, "visible": false, "autorange": true } }, "yaxis": { "type": "linear", "range": [ 0.10971069182389953, 16.26103144654088 ], "title": { "text": "<br>" }, "domain": [ 0, 1 ], "showgrid": true, "showline": false, "tickmode": "linear", "autorange": false, "gridcolor": "rgb(238, 238, 238)", "gridwidth": 1, "overlaying": false, "tickformat": "" }, "images": [ { "x": 0.5, "y": 0.5, "layer": "above", "sizex": 1, "sizey": 1, "source": "data:image/png;base64,iVBORw0KGgoAAAANSUhEUgAABdwAAAXcCAYAAAA4NUxkAAAACXBIWXMAAC4jAAAuIwF4pT92AAA1LklEQVR4nOzdPYildxmH4WfCRHSXJbu4EASVhYUQU2hhikQEbZZgtLOZQkSL+LGlFkL6BTttkiKNIBZbiRammT5K0FbQbZLWxtZuLE5ACIr7cc/5n/fsdcGpBub9TTNw7nmYc3JxcTEAAAAAAMCTeWb1AAAAAAAAOAaCOwAAAAAABAR3AAAAAAAICO4AAAAAABAQ3AEAAAAAICC4AwAAAABAQHAHAAAAAICA4A4AAAAAAAHBHQAAAAAAAoI7AAAAAAAEBHcAAAAAAAgI7gAAAAAAEBDcAQAAAAAgILgDAAAAAEBAcAcAAAAAgIDgDgAAAAAAAcEdAAAAAAACgjsAAAAAAAQEdwAAAAAACAjuAAAAAAAQENwBAAAAACAguAMAAAAAQEBwBwAAAACAgOAOAAAAAAABwR0AAAAAAAKCOwAAAAAABAR3AAAAAAAICO4AAAAAABAQ3AEAAAAAICC4AwAAAABAQHAHAAAAAICA4A4AAAAAAAHBHQAAAAAAAoI7AAAAAAAEBHcAAAAAAAgI7gAAAAAAEBDcAQAAAAAgILgDAAAAAEBAcAcAAAAAgIDgDgAAAAAAAcEdAAAAAAACgjsAAAAAAAQEdwAAAAAACAjuAAAAAAAQENwBAAAAACAguAMAAAAAQEBwBwAAAACAgOAOAAAAAAABwR0AAAAAAAKCOwAAAAAABAR3AAAAAAAInK4e8LBOzs4v+xG3ZubVmXlpZl746PX8zFyfmU9d9sMBAAAAAA7cv2bmnzPzj5n528z8fWb+OjN/nJkPLvPBF/fvXOa3z2wmuF+Ck5l5ZWa+MzOvzy64AwAAAADw331yZj7z0etLH/vaBzPz7sz8Zmb+NDMXe112IJ7GfylzY2benJkHM/PezNwdsR0AAAAA4Encml1rfW927fXN2bXYp8rTFNxvzszPZ+bDmbk3M7fXzgEAAAAAOEq3Z9dgP5xdk725ds7+PA3B/ZnZ/WXlwcz8bGaurZ0DAAAAAPBUuDa7Jvtgdo326Hv0sf+AL87M+zPz1uw+/BQAAAAAgP26PrtG+/7smu3ROubg/r2Z+cvMfHnxDgAAAAAAdq32z7Nrt0fpGIP7szPzzsz8amauLN4CAAAAAMB/XJ1du31ndi33qBxbcL8yM7+bmTcW7wAAAAAA4H97Y2Z+P0d2NH1Mwf3KzLw7M6+vHgIAAAAAwP/1jZn5wxxRdD+W4P7szPx2Zr62eggAAAAAAA/t67Nru59YvCNxLMH9lzPz2uoRAAAAAAA8stdm5herRxSOIbh/d2burh4BAAAAAMBjuzu71rtpWw/uX5iZt1ePAAAAAADgib09u+a7WVsO7s/MzK9n5urqIQAAAAAAPLGrs2u+m+3Wmx0+Mz+cmZdXjwAAAAAAIPPy7NrvJm01uN+cmXurRwAAAAAAkLs3M59ePeJxbDW4/2RmbqweAQAAAABA7sbM/HT1iMexxeB+fXafWAsAAAAAwHG6O7sWvClbDO4/mpnnVo8AAAAAAODSPDczP1494lFtMbh/f/UAAAAAAAAu3Q9mYw17U2Nn5pWZeWH1CAAAAAAALt2tmfnq6hGPYmvB/Wz1AAAAAAAA9ubbqwc8iq0F92+tHgAAAAAAwN58c/WAR7Gl4P65mbm9egQAAAAAAHtze2Y+u3rEw9pScH919QAAAAAAAPbuK6sHPKwtBfcvrh4AAAAAAMDebaYNbym4v7h6AAAAAAAAe/fS6gEPa0vB/dbqAQAAAAAA7N3nVw94WFsK7s+vHgAAAAAAwN5tpg1vKbhfWz0AAAAAAIC920wb3lJwv7p6AAAAAAAAe7eZNryl4H66egAAAAAAAHu3mTa8peAOAAAAAAAHS3AHAAAAAICA4A4AAAAAAAHBHQAAAAAAAoI7AAAAAAAEBHcAAAAAAAgI7gAAAAAAEBDcAQAAAAAgILgDAAAAAEBAcAcAAAAAgIDgDgAAAAAAAcEdAAAAAAACgjsAAAAAAAQEdwAAAAAACAjuAAAAAAAQENwBAAAAACAguAMAAAAAQEBwBwAAAACAgOAOAAAAAAABwR0AAAAAAAKCOwAAAAAABAR3AAAAAAAICO4AAAAAABAQ3AEAAAAAICC4AwAAAABAQHAHAAAAAICA4A4AAAAAAAHBHQAAAAAAAoI7AAAAAAAEBHcAAAAAAAgI7gAAAAAAEBDcAQAAAAAgILgDAAAAAEBAcAcAAAAAgIDgDgAAAAAAAcEdAAAAAAACgjsAAAAAAAQEdwAAAAAACAjuAAAAAAAQENwBAAAAACAguAMAAAAAQEBwBwAAAACAgOAOAAAAAAABwR0AAAAAAAKCOwAAAAAABAR3AAAAAAAICO4AAAAAABAQ3AEAAAAAICC4AwAAAABAQHAHAAAAAICA4A4AAAAAAAHBHQAAAAAAAoI7AAAAAAAEBHcAAAAAAAgI7gAAAAAAEBDcAQAAAAAgILgDAAAAAEBAcAcAAAAAgIDgDgAAAAAAAcEdAAAAAAACgjsAAAAAAAQEdwAAAAAACAjuAAAAAAAQENwBAAAAACAguAMAAAAAQEBwBwAAAACAgOAOAAAAAAABwR0AAAAAAAKCOwAAAAAABAR3AAAAAAAICO4AAAAAABAQ3AEAAAAAICC4AwAAAABAQHAHAAAAAICA4A4AAAAAAAHBHQAAAAAAAoI7AAAAAAAEBHcAAAAAAAgI7gAAAAAAEBDcAQAAAAAgILgDAAAAAEBAcAcAAAAAgIDgDgAAAAAAAcEdAAAAAAACgjsAAAAAAAQEdwAAAAAACAjuAAAAAAAQENwBAAAAACAguAMAAAAAQEBwBwAAAACAgOAOAAAAAAABwR0AAAAAAAKCOwAAAAAABAR3AAAAAAAICO4AAAAAABAQ3AEAAAAAICC4AwAAAABAQHAHAAAAAICA4A4AAAAAAAHBHQAAAAAAAoI7AAAAAAAEBHcAAAAAAAgI7gAAAAAAEBDcAQAAAAAgILgDAAAAAEBAcAcAAAAAgIDgDgAAAAAAAcEdAAAAAAACgjsAAAAAAAQEdwAAAAAACAjuAAAAAAAQENwBAAAAACAguAMAAAAAQOB09QDYoov7d1ZPAACA5U7OzldPWMr7AuCYPe2/4+FxuXAHAAAAAICA4A4AAAAAAAHBHQAAAAAAAoI7AAAAAAAEBHcAAAAAAAgI7gAAAAAAEBDcAQAAAAAgILgDAAAAAEBAcAcAAAAAgIDgDgAAAAAAAcEdAAAAAAACgjsAAAAAAAQEdwAAAAAACAjuAAAAAAAQENwBAAAAACAguAMAAAAAQEBwBwAAAACAgOAOAAAAAAABwR0AAAAAAAKCOwAAAAAABAR3AAAAAAAICO4AAAAAABAQ3AEAAAAAICC4AwAAAABAQHAHAAAAAICA4A4AAAAAAAHBHQAAAAAAAoI7AAAAAAAEBHcAAAAAAAgI7gAAAAAAEBDcAQAAAAAgILgDAAAAAEBAcAcAAAAAgIDgDgAAAAAAAcEdAAAAAAACgjsAAAAAAAQEdwAAAAAACAjuAAAAAAAQENwBAAAAACAguAMAAAAAQEBwBwAAAACAgOAOAAAAAAABwR0AAAAAAAKCOwAAAAAABAR3AAAAAAAICO4AAAAAABAQ3AEAAAAAICC4AwAAAABAQHAHAAAAAICA4A4AAAAAAAHBHQAAAAAAAoI7AAAAAAAEBHcAAAAAAAgI7gAAAAAAEBDcAQAAAAAgILgDAAAAAEBAcAcAAAAAgIDgDgAAAAAAAcEdAAAAAAACgjsAAAAAAAQEdwAAAAAACAjuAAAAAAAQENwBAAAAACAguAMAAAAAQEBwBwAAAACAgOAOAAAAAAABwR0AAAAAAAKCOwAAAAAABAR3AAAAAAAICO4AAAAAABAQ3AEAAAAAICC4AwAAAABAQHAHAAAAAICA4A4AAAAAAAHBHQAAAAAAAoI7AAAAAAAEBHcAAAAAAAgI7gAAAAAAEBDcAQAAAAAgILgDAAAAAEBAcAcAAAAAgIDgDgAAAAAAAcEdAAAAAAACgjsAAAAAAAQEdwAAAAAACAjuAAAAAAAQENwBAAAAACAguAMAAAAAQEBwBwAAAACAgOAOAAAAAAABwR0AAAAAAAKCOwAAAAAABAR3AAAAAAAICO4AAAAAABAQ3AEAAAAAICC4AwAAAABAQHAHAAAAAICA4A4AAAAAAAHBHQAAAAAAAoI7AAAAAAAEBHcAAAAAAAgI7gAAAAAAEBDcAQAAAAAgILgDAAAAAEBAcAcAAAAAgIDgDgAAAAAAAcEdAAAAAAACgjsAAAAAAAQEdwAAAAAACAjuAAAAAAAQENwBAAAAACAguAMAAAAAQEBwBwAAAACAgOAOAAAAAAABwR0AAAAAAAKCOwAAAAAABAR3AAAAAAAICO4AAAAAABAQ3AEAAAAAICC4AwAAAABAQHAHAAAAAICA4A4AAAAAAAHBHQAAAAAAAoI7AAAAAAAEBHcAAAAAAAgI7gAAAAAAEBDcAQAAAAAgILgDAAAAAEBAcAcAAAAAgIDgDgAAAAAAAcEdAAAAAAACgjsAAAAAAAQEdwAAAAAACAjuAAAAAAAQENwBAAAAACAguAMAAAAAQEBwBwAAAACAgOAOAAAAAAABwR0AAAAAAAKCOwAAAAAABAR3AAAAAAAICO4AAAAAABAQ3AEAAAAAICC4AwAAAABAQHAHAAAAAICA4A4AAAAAAAHBHQAAAAAAAoI7AAAAAAAEBHcAAAAAAAgI7gAAAAAAEBDcAQAAAAAgILgDAAAAAEBAcAcAAAAAgIDgDgAAAAAAAcEdAAAAAAACgjsAAAAAAAQEdwAAAAAACAjuAAAAAAAQENwBAAAAACAguAMAAAAAQEBwBwAAAACAgOAOAAAAAAABwR0AAAAAAAKCOwAAAAAABAR3AAAAAAAICO4AAAAAABAQ3AEAAAAAICC4AwAAAABAQHAHAAAAAICA4A4AAAAAAAHBHQAAAAAAAoI7AAAAAAAEBHcAAAAAAAgI7gAAAAAAEBDcAQAAAAAgILgDAAAAAEBAcAcAAAAAgIDgDgAAAAAAAcEdAAAAAAACgjsAAAAAAAQEdwAAAAAACJyuHgBbdHJ2vnoCAACwmPcFAMDHuXAHAAAAAICA4A4AAAAAAAHBHQAAAAAAAoI7AAAAAAAEBHcAAAAAAAgI7gAAAAAAEBDcAQAAAAAgILgDAAAAAEBAcAcAAAAAgIDgDgAAAAAAAcEdAAAAAAACgjsAAAAAAAQEdwAAAAAACAjuAAAAAAAQENwBAAAAACAguAMAAAAAQEBwBwAAAACAgOAOAAAAAAABwR0AAAAAAAKCOwAAAAAABAR3AAAAAAAICO4AAAAAABAQ3AEAAAAAICC4AwAAAABAQHAHAAAAAICA4A4AAAAAAAHBHQAAAAAAAoI7AAAAAAAEBHcAAAAAAAgI7gAAAAAAEBDcAQAAAAAgILgDAAAAAEBAcAcAAAAAgIDgDgAAAAAAAcEdAAAAAAACgjsAAAAAAAQEdwAAAAAACAjuAAAAAAAQENwBAAAAACAguAMAAAAAQEBwBwAAAACAgOAOAAAAAAABwR0AAAAAAAKCOwAAAAAABAR3AAAAAAAICO4AAAAAABAQ3AEAAAAAICC4AwAAAABAQHAHAAAAAICA4A4AAAAAAAHBHQAAAAAAAoI7AAAAAAAEBHcAAAAAAAgI7gAAAAAAEBDcAQAAAAAgILgDAAAAAEBAcAcAAAAAgIDgDgAAAAAAAcEdAAAAAAACgjsAAAAAAAQEdwAAAAAACAjuAAAAAAAQENwBAAAAACAguAMAAAAAQEBwBwAAAACAgOAOAAAAAAABwR0AAAAAAAKCOwAAAAAABAR3AAAAAAAICO4AAAAAABAQ3AEAAAAAICC4AwAAAABAQHAHAAAAAICA4A4AAAAAAAHBHQAAAAAAAoI7AAAAAAAEBHcAAAAAAAgI7gAAAAAAEBDcAQAAAAAgILgDAAAAAEBAcAcAAAAAgIDgDgAAAAAAAcEdAAAAAAACgjsAAAAAAAQEdwAAAAAACAjuAAAAAAAQENwBAAAAACAguAMAAAAAQEBwBwAAAACAgOAOAAAAAAABwR0AAAAAAAKCOwAAAAAABAR3AAAAAAAICO4AAAAAABAQ3AEAAAAAICC4AwAAAABAQHAHAAAAAICA4A4AAAAAAAHBHQAAAAAAAoI7AAAAAAAEBHcAAAAAAAgI7gAAAAAAEBDcAQAAAAAgILgDAAAAAEBAcAcAAAAAgIDgDgAAAAAAAcEdAAAAAAACgjsAAAAAAAQEdwAAAAAACAjuAAAAAAAQENwBAAAAACAguAMAAAAAQEBwBwAAAACAgOAOAAAAAAABwR0AAAAAAAKCOwAAAAAABAR3AAAAAAAICO4AAAAAABAQ3AEAAAAAICC4AwAAAABAQHAHAAAAAICA4A4AAAAAAAHBHQAAAAAAAoI7AAAAAAAEBHcAAAAAAAicrh4AAHDoLu7fWT0B4CCdnJ2vngAAcFBcuAMAAAAAQEBwBwAAAACAgOAOAAAAAAABwR0AAAAAAAKCOwAAAAAABAR3AAAAAAAICO4AAAAAABAQ3AEAAAAAICC4AwAAAABAQHAHAAAAAICA4A4AAAAAAAHBHQAAAAAAAoI7AAAAAAAEBHcAAAAAAAgI7gAAAAAAEBDcAQAAAAAgILgDAAAAAEBAcAcAAAAAgIDgDgAAAAAAAcEdAAAAAAACgjsAAAAAAAQEdwAAAAAACAjuAAAAAAAQENwBAAAAACAguAMAAAAAQEBwBwAAAACAgOAOAAAAAAABwR0AAAAAAAKCOwAAAAAABAR3AAAAAAAICO4AAAAAABAQ3AEAAAAAICC4AwAAAABAQHAHAAAAAICA4A4AAAAAAAHBHQAAAAAAAoI7AAAAAAAEBHcAAAAAAAgI7gAAAAAAEBDcAQAAAAAgILgDAAAAAEBAcAcAAAAAgIDgDgAAAAAAAcEdAAAAAAACgjsAAAAAAAQEdwAAAAAACAjuAAAAAAAQENwBAAAAACAguAMAAAAAQEBwBwAAAACAgOAOAAAAAAABwR0AAAAAAAKCOwAAAAAABAR3AAAAAAAICO4AAAAAABAQ3AEAAAAAICC4AwAAAABAQHAHAAAAAICA4A4AAAAAAAHBHQAAAAAAAoI7AAAAAAAEBHcAAAAAAAgI7gAAAAAAEBDcAQAAAAAgILgDAAAAAEBAcAcAAAAAgIDgDgAAAAAAAcEdAAAAAAACgjsAAAAAAAQEdwAAAAAACAjuAAAAAAAQENwBAAAAACAguAMAAAAAQEBwBwAAAACAgOAOAAAAAAABwR0AAAAAAAKCOwAAAAAABAR3AAAAAAAICO4AAAAAABAQ3AEAAAAAICC4AwAAAABAQHAHAAAAAICA4A4AAAAAAAHBHQAAAAAAAoI7AAAAAAAEBHcAAAAAAAgI7gAAAAAAEBDcAQAAAAAgILgDAAAAAEBAcAcAAAAAgIDgDgAAAAAAAcEdAAAAAAACgjsAAAAAAAQEdwAAAAAACAjuAAAAAAAQENwBAAAAACAguAMAAAAAQEBwBwAAAACAgOAOAAAAAAABwR0AAAAAAAKCOwAAAAAABAR3AAAAAAAICO4AAAAAABAQ3AEAAAAAICC4AwAAAABAQHAHAAAAAICA4A4AAAAAAAHBHQAAAAAAAoI7AAAAAAAEBHcAAAAAAAgI7gAAAAAAEBDcAQAAAAAgILgDAAAAAEBAcAcAAAAAgIDgDgAAAAAAAcEdAAAAAAACgjsAAAAAAAQEdwAAAAAACAjuAAAAAAAQENwBAAAAACAguAMAAAAAQEBwBwAAAACAgOAOAAAAAAABwR0AAAAAAAKCOwAAAAAABAR3AAAAAAAICO4AAAAAABAQ3AEAAAAAICC4AwAAAABAQHAHAAAAAICA4A4AAAAAAAHBHQAAAAAAAoI7AAAAAAAEBHcAAAAAAAgI7gAAAAAAEBDcAQAAAAAgILgDAAAAAEBAcAcAAAAAgIDgDgAAAAAAAcEdAAAAAAACgjsAAAAAAAQEdwAAAAAACAjuAAAAAAAQENwBAAAAACAguAMAAAAAQEBwBwAAAACAgOAOAAAAAAABwR0AAAAAAAKCOwAAAAAABAR3AAAAAAAICO4AAAAAABAQ3AEAAAAAICC4AwAAAABAQHAHAAAAAICA4A4AAAAAAAHBHQAAAAAAAoI7AAAAAAAEBHcAAAAAAAgI7gAAAAAAEBDcAQAAAAAgILgDAAAAAEBAcAcAAAAAgIDgDgAAAAAAAcEdAAAAAAACgjsAAAAAAAQEdwAAAAAACAjuAAAAAAAQENwBAAAAACAguAMAAAAAQEBwBwAAAACAgOAOAAAAAAABwR0AAAAAAAKCOwAAAAAABAR3AAAAAAAICO4AAAAAABAQ3AEAAAAAICC4AwAAAABAQHAHAAAAAICA4A4AAAAAAAHBHQAAAAAAAoI7AAAAAAAETlcPAAA4dCdn56snAAAAsAEu3AEAAAAAICC4AwAAAABAQHAHAAAAAICA4A4AAAAAAAHBHQAAAAAAAoI7AAAAAAAEBHcAAAAAAAgI7gAAAAAAEBDcAQAAAAAgILgDAAAAAEBAcAcAAAAAgIDgDgAAAAAAAcEdAAAAAAACgjsAAAAAAAQEdwAAAAAACAjuAAAAAAAQENwBAAAAACAguAMAAAAAQEBwBwAAAACAgOAOAAAAAAABwR0AAAAAAAKCOwAAAAAABAR3AAAAAAAICO4AAAAAABAQ3AEAAAAAICC4AwAAAABAQHAHAAAAAICA4A4AAAAAAAHBHQAAAAAAAoI7AAAAAAAEBHcAAAAAAAgI7gAAAAAAEBDcAQAAAAAgILgDAAAAAEBAcAcAAAAAgIDgDgAAAAAAAcEdAAAAAAACgjsAAAAAAAQEdwAAAAAACAjuAAAAAAAQENwBAAAAACAguAMAAAAAQEBwBwAAAACAgOAOAAAAAAABwR0AAAAAAAKCOwAAAAAABAR3AAAAAAAICO4AAAAAABAQ3AEAAAAAICC4AwAAAABAQHAHAAAAAICA4A4AAAAAAAHBHQAAAAAAAoI7AAAAAAAEBHcAAAAAAAgI7gAAAAAAEBDcAQAAAAAgILgDAAAAAEBAcAcAAAAAgIDgDgAAAAAAAcEdAAAAAAACgjsAAAAAAAQEdwAAAAAACAjuAAAAAAAQENwBAAAAACAguAMAAAAAQEBwBwAAAACAgOAOAAAAAAABwR0AAAAAAAKCOwAAAAAABAR3AAAAAAAICO4AAAAAABAQ3AEAAAAAICC4AwAAAABAQHAHAAAAAICA4A4AAAAAAAHBHQAAAAAAAoI7AAAAAAAEBHcAAAAAAAgI7gAAAAAAEBDcAQAAAAAgILgDAAAAAEBAcAcAAAAAgIDgDgAAAAAAAcEdAAAAAAACgjsAAAAAAAQEdwAAAAAACAjuAAAAAAAQENwBAAAAACAguAMAAAAAQEBwBwAAAACAgOAOAAAAAAABwR0AAAAAAAKCOwAAAAAABAR3AAAAAAAICO4AAAAAABAQ3AEAAAAAICC4AwAAAABAQHAHAAAAAICA4A4AAAAAAAHBHQAAAAAAAoI7AAAAAAAEBHcAAAAAAAgI7gAAAAAAEBDcAQAAAAAgILgDAAAAAEBAcAcAAAAAgIDgDgAAAAAAAcEdAAAAAAACgjsAAAAAAAQEdwAAAAAACAjuAAAAAAAQENwBAAAAACAguAMAAAAAQEBwBwAAAACAgOAOAAAAAAABwR0AAAAAAAKCOwAAAAAABAR3AAAAAAAICO4AAAAAABAQ3AEAAAAAICC4AwAAAABAQHAHAAAAAICA4A4AAAAAAIHT1QMAAA7Nxf07qycAHKSTs/PVEwAADpoLdwAAAAAACAjuAAAAAAAQENwBAAAAACAguAMAAAAAQEBwBwAAAACAgOAOAAAAAAABwR0AAAAAAAKCOwAAAAAABAR3AAAAAAAICO4AAAAAABAQ3AEAAAAAICC4AwAAAABAQHAHAAAAAICA4A4AAAAAAAHBHQAAAAAAAoI7AAAAAAAEBHcAAAAAAAgI7gAAAAAAEBDcAQAAAAAgILgDAAAAAEBAcAcAAAAAgIDgDgAAAAAAAcEdAAAAAAACgjsAAAAAAAQEdwAAAAAACAjuAAAAAAAQENwBAAAAACAguAMAAAAAQEBwBwAAAACAgOAOAAAAAAABwR0AAAAAAAKCOwAAAAAABAR3AAAAAAAICO4AAAAAABAQ3AEAAAAAICC4AwAAAABAQHAHAAAAAICA4A4AAAAAAAHBHQAAAAAAAoI7AAAAAAAEBHcAAAAAAAgI7gAAAAAAEBDcAQAAAAAgILgDAAAAAEBAcAcAAAAAgIDgDgAAAAAAAcEdAAAAAAACgjsAAAAAAAQEdwAAAAAACAjuAAAAAAAQENwBAAAAACAguAMAAAAAQEBwBwAAAACAgOAOAAAAAAABwR0AAAAAAAKCOwAAAAAABAR3AAAAAAAICO4AAAAAABAQ3AEAAAAAICC4AwAAAABAQHAHAAAAAICA4A4AAAAAAAHBHQAAAAAAAoI7AAAAAAAEBHcAAAAAAAgI7gAAAAAAEBDcAQAAAAAgILgDAAAAAEBAcAcAAAAAgIDgDgAAAAAAAcEdAAAAAAACgjsAAAAAAAQEdwAAAAAACAjuAAAAAAAQENwBAAAAACAguAMAAAAAQEBwBwAAAACAgOAOAAAAAAABwR0AAAAAAAKCOwAAAAAABAR3AAAAAAAICO4AAAAAABAQ3AEAAAAAICC4AwAAAABAQHAHAAAAAICA4A4AAAAAAAHBHQAAAAAAAoI7AAAAAAAEBHcAAAAAAAgI7gAAAAAAEBDcAQAAAAAgILgDAAAAAEBAcAcAAAAAgIDgDgAAAAAAAcEdAAAAAAACgjsAAAAAAAQEdwAAAAAACAjuAAAAAAAQENwBAAAAACAguAMAAAAAQEBwBwAAAACAgOAOAAAAAAABwR0AAAAAAAKCOwAAAAAABAR3AAAAAAAICO4AAAAAABAQ3AEAAAAAICC4AwAAAABAQHAHAAAAAICA4A4AAAAAAAHBHQAAAAAAAoI7AAAAAAAEBHcAAAAAAAgI7gAAAAAAEBDcAQAAAAAgILgDAAAAAEBAcAcAAAAAgIDgDgAAAAAAAcEdAAAAAAACgjsAAAAAAAQEdwAAAAAACAjuAAAAAAAQENwBAAAAACAguAMAAAAAQEBwBwAAAACAgOAOAAAAAAABwR0AAAAAAAKCOwAAAAAABAR3AAAAAAAICO4AAAAAABAQ3AEAAAAAICC4AwAAAABAQHAHAAAAAICA4A4AAAAAAAHBHQAAAAAAAoI7AAAAAAAEBHcAAAAAAAgI7gAAAAAAEBDcAQAAAAAgILgDAAAAAEBAcAcAAAAAgIDgDgAAAAAAAcEdAAAAAAACgjsAAAAAAAQEdwAAAAAACAjuAAAAAAAQENwBAAAAACAguAMAAAAAQEBwBwAAAACAgOAOAAAAAAABwR0AAAAAAAKCOwAAAAAABAR3AAAAAAAICO4AAAAAABAQ3AEAAAAAICC4AwAAAABAQHAHAAAAAICA4A4AAAAAAAHBHQAAAAAAAoI7AAAAAAAEBHcAAAAAAAgI7gAAAAAAEBDcAQAAAAAgILgDAAAAAEBAcAcAAAAAgIDgDgAAAAAAAcEdAAAAAAACgjsAAAAAAAQEdwAAAAAACAjuAAAAAAAQENwBAAAAACAguAMAAAAAQEBwBwAAAACAgOAOAAAAAAABwR0AAAAAAAKCOwAAAAAABAR3AAAAAAAICO4AAAAAABAQ3AEAAAAAICC4AwAAAABAQHAHAAAAAIDA6eoBAACH5uTsfPUEAAAANsiFOwAAAAAABAR3AAAAAAAICO4AAAAAABAQ3AEAAAAAICC4AwAAAABAQHAHAAAAAICA4A4AAAAAAAHBHQAAAAAAAoI7AAAAAAAEBHcAAAAAAAgI7gAAAAAAEBDcAQAAAAAgILgDAAAAAEBAcAcAAAAAgIDgDgAAAAAAAcEdAAAAAAACgjsAAAAAAAQEdwAAAAAACAjuAAAAAAAQENwBAAAAACAguAMAAAAAQEBwBwAAAACAgOAOAAAAAAABwR0AAAAAAAKCOwAAAAAABAR3AAAAAAAICO4AAAAAABAQ3AEAAAAAICC4AwAAAABAQHAHAAAAAICA4A4AAAAAAAHBHQAAAAAAAoI7AAAAAAAEBHcAAAAAAAgI7gAAAAAAEBDcAQAAAAAgILgDAAAAAEBAcAcAAAAAgIDgDgAAAAAAAcEdAAAAAAACgjsAAAAAAAQEdwAAAAAACAjuAAAAAAAQENwBAAAAACAguAMAAAAAQEBwBwAAAACAgOAOAAAAAAABwR0AAAAAAAKCOwAAAAAABAR3AAAAAAAICO4AAAAAABAQ3AEAAAAAICC4AwAAAABAQHAHAAAAAICA4A4AAAAAAAHBHQAAAAAAAoI7AAAAAAAEBHcAAAAAAAgI7gAAAAAAEBDcAQAAAAAgILgDAAAAAEBAcAcAAAAAgIDgDgAAAAAAAcEdAAAAAAACgjsAAAAAAAQEdwAAAAAACAjuAAAAAAAQENwBAAAAACAguAMAAAAAQEBwBwAAAACAgOAOAAAAAAABwR0AAAAAAAKCOwAAAAAABAR3AAAAAAAICO4AAAAAABAQ3AEAAAAAICC4AwAAAABAQHAHAAAAAICA4A4AAAAAAAHBHQAAAAAAAoI7AAAAAAAEBHcAAAAAAAgI7gAAAAAAEBDcAQAAAAAgILgDAAAAAEBAcAcAAAAAgIDgDgAAAAAAAcEdAAAAAAACgjsAAAAAAAQEdwAAAAAACAjuAAAAAAAQENwBAAAAACAguAMAAAAAQEBwBwAAAACAgOAOAAAAAAABwR0AAAAAAAKCOwAAAAAABAR3AAAAAAAICO4AAAAAABAQ3AEAAAAAICC4AwAAAABAQHAHAAAAAICA4A4AAAAAAAHBHQAAAAAAAoI7AAAAAAAEBHcAAAAAAAgI7gAAAAAAEBDcAQAAAAAgILgDAAAAAEBAcAcAAAAAgIDgDgAAAAAAAcEdAAAAAAACgjsAAAAAAAQEdwAAAAAACAjuAAAAAAAQENwBAAAAACAguAMAAAAAQEBwBwAAAACAgOAOAAAAAAABwR0AAAAAAAKCOwAAAAAABAR3AAAAAAAICO4AAAAAABAQ3AEAAAAAIHC6egAAwKG5uH9n9QSAg3Rydr56AgDAQXPhDgAAAAAAAcEdAAAAAAACgjsAAAAAAAQEdwAAAAAACAjuAAAAAAAQENwBAAAAACAguAMAAAAAQEBwBwAAAACAgOAOAAAAAAABwR0AAAAAAAKCOwAAAAAABAR3AAAAAAAICO4AAAAAABAQ3AEAAAAAICC4AwAAAABAQHAHAAAAAICA4A4AAAAAAAHBHQAAAAAAAoI7AAAAAAAEBHcAAAAAAAgI7gAAAAAAEBDcAQAAAAAgILgDAAAAAEBAcAcAAAAAgIDgDgAAAAAAAcEdAAAAAAACgjsAAAAAAAQEdwAAAAAACAjuAAAAAAAQENwBAAAAACAguAMAAAAAQEBwBwAAAACAgOAOAAAAAAABwR0AAAAAAAKCOwAAAAAABAR3AAAAAAAICO4AAAAAABAQ3AEAAAAAICC4AwAAAABAQHAHAAAAAICA4A4AAAAAAAHBHQAAAAAAAoI7AAAAAAAEBHcAAAAAAAgI7gAAAAAAEBDcAQAAAAAgILgDAAAAAEBAcAcAAAAAgIDgDgAAAAAAAcEdAAAAAAACgjsAAAAAAAQEdwAAAAAACAjuAAAAAAAQENwBAAAAACAguAMAAAAAQEBwBwAAAACAgOAOAAAAAAABwR0AAAAAAAKCOwAAAAAABAR3AAAAAAAICO4AAAAAABAQ3AEAAAAAICC4AwAAAABAQHAHAAAAAICA4A4AAAAAAAHBHQAAAAAAAoI7AAAAAAAEBHcAAAAAAAgI7gAAAAAAEBDcAQAAAAAgILgDAAAAAEBAcAcAAAAAgIDgDgAAAAAAAcEdAAAAAAACgjsAAAAAAAQEdwAAAAAACAjuAAAAAAAQENwBAAAAACAguAMAAAAAQEBwBwAAAACAgOAOAAAAAAABwR0AAAAAAAKCOwAAAAAABAR3AAAAAAAICO4AAAAAABAQ3AEAAAAAICC4AwAAAABAQHAHAAAAAICA4A4AAAAAAAHBHQAAAAAAAoI7AAAAAAAEBHcAAAAAAAgI7gAAAAAAEBDcAQAAAAAgILgDAAAAAEBAcAcAAAAAgIDgDgAAAAAAAcEdAAAAAAACgjsAAAAAAAQEdwAAAAAACAjuAAAAAAAQENwBAAAAACAguAMAAAAAQEBwBwAAAACAgOAOAAAAAAABwR0AAAAAAAKCOwAAAAAABAR3AAAAAAAICO4AAAAAABAQ3AEAAAAAICC4AwAAAABAQHAHAAAAAICA4A4AAAAAAAHBHQAAAAAAAoI7AAAAAAAEBHcAAAAAAAgI7gAAAAAAEBDcAQAAAAAgILgDAAAAAEBAcAcAAAAAgIDgDgAAAAAAAcEdAAAAAAACgjsAAAAAAAQEdwAAAAAACAjuAAAAAAAQENwBAAAAACAguAMAAAAAQEBwBwAAAACAgOAOAAAAAAABwR0AAAAAAAKCOwAAAAAABAR3AAAAAAAICO4AAAAAABAQ3AEAAAAAICC4AwAAAABAQHAHAAAAAICA4A4AAAAAAAHBHQAAAAAAAoI7AAAAAAAEBHcAAAAAAAgI7gAAAAAAEBDcAQAAAAAgILgDAAAAAEBAcAcAAAAAgIDgDgAAAAAAAcEdAAAAAAACgjsAAAAAAAQEdwAAAAAACAjuAAAAAAAQENwBAAAAACAguAMAAAAAQEBwBwAAAACAgOAOAAAAAAABwR0AAAAAAAKCOwAAAAAABAR3AAAAAAAICO4AAAAAABAQ3AEAAAAAICC4AwAAAABAQHAHAAAAAICA4A4AAAAAAAHBHQAAAAAAAoI7AAAAAAAEBHcAAAAAAAgI7gAAAAAAEBDcAQAAAAAgILgDAAAAAEBAcAcAAAAAgIDgDgAAAAAAAcEdAAAAAAACgjsAAAAAAAQEdwAAAAAACAjuAAAAAAAQENwBAAAAACAguAMAAAAAQEBwBwAAAACAgOAOAAAAAAABwR0AAAAAAAKCOwAAAAAABAR3AAAAAAAICO4AAAAAABA4XT0AAODQnJydr54AAADABrlwBwAAAACAgOAOAAAAAAABwR0AAAAAAAKCOwAAAAAABAR3AAAAAAAICO4AAAAAABAQ3AEAAAAAICC4AwAAAABAQHAHAAAAAICA4A4AAAAAAAHBHQAAAAAAAoI7AAAAAAAEBHcAAAAAAAgI7gAAAAAAEBDcAQAAAAAgILgDAAAAAEBAcAcAAAAAgIDgDgAAAAAAAcEdAAAAAAACgjsAAAAAAAQEdwAAAAAACAjuAAAAAAAQENwBAAAAACAguAMAAAAAQEBwBwAAAACAgOAOAAAAAAABwR0AAAAAAAKCOwAAAAAABAR3AAAAAAAICO4AAAAAABAQ3AEAAAAAICC4AwAAAABAQHAHAAAAAICA4A4AAAAAAAHBHQAAAAAAAoI7AAAAAAAEBHcAAAAAAAgI7gAAAAAAEBDcAQAAAAAgILgDAAAAAEBAcAcAAAAAgIDgDgAAAPDv9u7Y1csqAOP4E/Un9AdY2NDU0CAtzo3RHxA0FOQeBUJLU1FtCZGFjUGTRIubRS41FJJB3LKaJAlRUxBvt+HVMbz3+vg7nvd+PnD2h3f8vnAOABQI7gAAAAAAUCC4AwAAAABAgeAOAAAAAAAFgjsAAAAAABQI7gAAAAAAUCC4AwAAAABAgeAOAAAAAAAFgjsAAAAAABQI7gAAAAAAUCC4AwAAAABAgeAOAAAAAAAFgjsAAAAAABQI7gAAAAAAUCC4AwAAAABAgeAOAAAAAAAFgjsAAAAAABQI7gAAAAAAUCC4AwAAAABAgeAOAAAAAAAFgjsAAAAAABQI7gAAAAAAUCC4AwAAAABAgeAOAAAAAAAFgjsAAAAAABQI7gAAAAAAUCC4AwAAAABAgeAOAAAAAAAFgjsAAAAAABQI7gAAAAAAUCC4AwAAAABAgeAOAAAAAAAFgjsAAAAAABQI7gAAAAAAUCC4AwAAAABAgeAOAAAAAAAFgjsAAAAAABQI7gAAAAAAUCC4AwAAAABAgeAOAAAAAAAFgjsAAAAAABQI7gAAAAAAUCC4AwAAAABAgeAOAAAAAAAFgjsAAAAAABQI7gAAAAAAUCC4AwAAAABAgeAOAAAAAAAFgjsAAAAAABQI7gAAAAAAUCC4AwAAAABAgeAOAAAAAAAFgjsAAAAAABQI7gAAAAAAUCC4AwAAAABAgeAOAAAAAAAFgjsAAAAAABQI7gAAAAAAUCC4AwAAAABAgeAOAAAAAAAFgjsAAAAAABQI7gAAAAAAUCC4AwAAAABAgeAOAAAAAAAFgjsAAAAAABQI7gAAAAAAUCC4AwAAAABAgeAOAAAAAAAFgjsAAAAAABQI7gAAAAAAUCC4AwAAAABAgeAOAAAAAAAFMwX37dEDAAAAAADYuNujB+zWTMH9+ugBAAAAAABs3D+jB+zWTMH92ugBAAAAAABs3DRteKbgfmn0AAAAAAAANm6aNjxTcP999AAAAAAAADbuj9EDdmum4P7z6AEAAAAAAGzchdEDdmum4P7D6AEAAAAAAGzcNG14puB+bvQAAAAAAAA2bpo2PFNw/zPJ1ugRAAAAAABszFaWNjyFmYJ7knw5egAAAAAAABvz1egBezFbcP989AAAAAAAADbmi9ED9mK24H4uyS+jRwAAAAAA8MBdTPLN6BF7MVtwT5JTowcAAAAAAPDAnUzy7+gRezFjcD+R5OroEQAAAAAAPDBXk3w4esRezRjcr2SJ7gAAAAAArNOJLC14KjMG9yT5IBN+bAAAAAAA7ulKkvdHj9iPWYP7X0mOjx4BAAAAAEDd8SSXR4/Yj1mDe5J8lOS70SMAAAAAAKj5Pkv7ndLMwX07yUtJboweAgAAAADAfbuRpflujx6yXzMH9yS5kOTY6BEAAAAAANy3Y0l+Gj3ifswe3JPksySfjh4BAAAAAMC+fZKl9U5tDcE9SV5Lcmb0CAAAAAAA9uxMVnKTyVqC+60kLyQ5O3gHAAAAAAC7dzZL2701eEfFWoJ7slyo/3yS06OHAAAAAABwT6ezNN0bo4e0rCm4J8nNJC8mOTl6CAAAAAAA/+vjLC335ughTWsL7kmyneSVJC9nRX9GAAAAAABW4EaWdvtqlpa7KmsM7nedSnIkyY+DdwAAAAAAsLTaI1na7SqtObgnyfkkzyZ5I8n1wVsAAAAAAA6i60nezNJqzw/e8kCtPbgnye0k7yY5nOS9JNfGzgEAAAAAOBCuZWmyh5O8k6XVrtpBCO53XUryepJDSd5KsjV0DQAAAADAOm1labCHsjTZS0PXbNBBCu53/Z3k7SRPJTma5ESSiyMHAQAAAABM7mKW1no0S3t9O0uLPVAeGz1goJ0kX985SfJkkueSPJPk6SRPJHn8znl0xEAAAAAAgIfIdpLLd85vSS5keQj12yS/Dtz10HhkZ2dn9AYAAAAAAJjeQbxSBgAAAAAA6gR3AAAAAAAoENwBAAAAAKBAcAcAAAAAgALBHQAAAAAACgR3AAAAAAAoENwBAAAAAKBAcAcAAAAAgALBHQAAAAAACgR3AAAAAAAoENwBAAAAAKBAcAcAAAAAgALBHQAAAAAACgR3AAAAAAAoENwBAAAAAKBAcAcAAAAAgALBHQAAAAAACgR3AAAAAAAoENwBAAAAAKBAcAcAAAAAgALBHQAAAAAACgR3AAAAAAAoENwBAAAAAKBAcAcAAAAAgALBHQAAAAAACgR3AAAAAAAoENwBAAAAAKBAcAcAAAAAgALBHQAAAAAACgR3AAAAAAAoENwBAAAAAKBAcAcAAAAAgALBHQAAAAAACgR3AAAAAAAoENwBAAAAAKBAcAcAAAAAgALBHQAAAAAACgR3AAAAAAAoENwBAAAAAKBAcAcAAAAAgALBHQAAAAAACgR3AAAAAAAoENwBAAAAAKBAcAcAAAAAgALBHQAAAAAACgR3AAAAAAAoENwBAAAAAKBAcAcAAAAAgALBHQAAAAAACgR3AAAAAAAoENwBAAAAAKDgP46JziHWmXq4AAAAAElFTkSuQmCC", "visible": false, "xanchor": "center", "yanchor": "middle" } ], "legend": { "x": 0.37689872425790677, "y": 2.735632183908046, "valign": "top", "xanchor": "right", "yanchor": "bottom", "itemsizing": "trace", "traceorder": "normal", "orientation": "h" }, "xaxis2": { "side": "bottom", "type": "category", "range": [ 0.3765865450280672, 34 ], "title": { "text": "<br>" }, "anchor": "free", "domain": [ 0, 0.45 ], "autorange": false, "overlaying": false, "showspikes": false }, "yaxis2": { "side": "right", "type": "linear", "range": [ -9.826567562416649, 1016.588526777206 ], "title": { "text": "ETH Volume" }, "domain": [ 0, 1 ], "showgrid": false, "autorange": false, "overlaying": "y" }, "yaxis3": { "side": "left", "type": "linear", "range": [ -0.0756603773584906, 13 ], "title": { "text": "Clearing Rate" }, "anchor": "x2", "domain": [ 0, 1 ], "showgrid": true, "zeroline": false, "autorange": false, "overlaying": false, "zerolinecolor": "rgb(234, 234, 234)", "zerolinewidth": 1 }, "yaxis4": { "side": "right", "type": "linear", "range": [ -37735.849056603765, 3000000 ], "title": { "text": "USDC Volume" }, "anchor": "x2", "showgrid": false, "showline": false, "zeroline": false, "autorange": false, "overlaying": "y3" }, "barmode": "stack", "autosize": true, "dragmode": "pan", "showlegend": false, "annotations": [] } }, "height": null, "width": null, "user": { "profile_url": "https://chart-studio.plotly.com/~dionchu", "avatar_url": "https://storage.googleapis.com/plotly-prod-profiles/17.jpg", "background_url": "https://storage.googleapis.com/plotly-prod-profiles/bg-5.jpg", "bio": "", "nickname": "", "website": "", "stream_tokens": null, "feature_set_id": null, "csrf_token": null, "date_joined": "2023-10-20 19:36:55", "mapbox_access_tokens": null, "has_password": null, "username": "dionchu", "email": null, "is_active": null, "readonly": null, "is_dash_creator": null, "dash_created_count": null, "is_chart_creator": null, "charts_created_count": null } }, { "creation_time": "2024-04-05T13:40:16.579877Z", "comments": { "results": [], "count": 0 }, "parented": true, "embed_url": "https://chart-studio.plotly.com/~miottialberto91/1095.embed", "fid": "miottialberto91:1095", "filename": "Intelnos® Pi Cycle", "filetype": "plot", "img_url": "https://api.plotly.com/v2/files/miottialberto91:1095/image?image_name=list-thumb", "image_urls": { "default": "https://api.plotly.com/v2/files/miottialberto91:1095/image?image_name=default", "block-thumb": "https://api.plotly.com/v2/files/miottialberto91:1095/image?image_name=block-thumb", "list-thumb": "https://api.plotly.com/v2/files/miottialberto91:1095/image?image_name=list-thumb" }, "api_urls": { "files": "https://api.plotly.com/v2/files/miottialberto91:1095", "plots": "https://api.plotly.com/v2/plots/miottialberto91:1095", "parent": "https://api.plotly.com/v2/folders/home?user=miottialberto91" }, "owner": "miottialberto91", "parent": -1, "preview": "", "referencers": [], "references": [], "title": "", "views": 162, "web_url": "https://chart-studio.plotly.com/~miottialberto91/1095/", "world_readable": true, "date_modified": "2025-09-29T06:58:48.550Z", "stars": { "results": [], "count": 0 }, "collaborators": { "results": [], "count": 0 }, "subfolder_count": null, "refresh_interval": null, "organize_view_url": "https://chart-studio.plotly.com/~miottialberto91/1095/", "current_user_permission": "read", "is_theme": null, "is_template": null, "autosize": true, "caption": "", "figure": { "data": [ { "line": { "color": "black", "width": 1 }, "name": "Actual Price", "type": "scatter", "xsrc": "miottialberto91:10942:60c72c", "ysrc": "miottialberto91:10942:35569e", "hovertemplate": "%{x}, %{y:.0f}" }, { "line": { "color": "#94c649", "width": 2 }, "name": "SMA 111", "type": "scatter", "xsrc": "miottialberto91:10942:d58cd9", "ysrc": "miottialberto91:10942:dfd47a", "hoverinfo": "none" }, { "line": { "color": "#94c649", "width": 2 }, "name": "SMA 350 x 2", "type": "scatter", "xsrc": "miottialberto91:10942:277f04", "ysrc": "miottialberto91:10942:e0b209", "hoverinfo": "none" }, { "line": { "color": "#3b72b9", "width": 2 }, "name": "SMA 471", "type": "scatter", "xsrc": "miottialberto91:10942:127d4b", "ysrc": "miottialberto91:10942:615775", "hoverinfo": "none" }, { "line": { "color": "#3b72b9", "width": 2 }, "name": "EMA 150", "type": "scatter", "xsrc": "miottialberto91:10942:4f99b3", "ysrc": "miottialberto91:10942:5177f5", "hoverinfo": "none" }, { "mode": "markers", "name": "Buy", "type": "scatter", "xsrc": "miottialberto91:10942:e9b411", "ysrc": "miottialberto91:10942:1cf706", "marker": { "size": 12, "color": "green", "symbol": 5 }, "hoverinfo": "none" }, { "mode": "markers", "name": "Sell", "type": "scatter", "xsrc": "miottialberto91:10942:002118", "ysrc": "miottialberto91:10942:c7a565", "marker": { "size": 12, "color": "red", "symbol": 6 }, "hoverinfo": "none" } ], "layout": { "title": { "x": 0.5, "text": "Intelnos® Pi Cycle" }, "xaxis": { "title": { "text": "Anni" }, "showgrid": false, "gridcolor": "#c0c0c0", "gridwidth": 0, "linecolor": "black", "linewidth": 2 }, "yaxis": { "type": "log", "title": { "text": "Prezzo Logaritmico" }, "showgrid": true, "gridcolor": "#c0c0c0", "gridwidth": 0, "linecolor": "black", "linewidth": 2 }, "images": [ { "x": 0.5, "y": 0.5, "xref": "paper", "yref": "paper", "layer": "below", "sizex": 0.4, "sizey": 0.4, "source": "https://images.squarespace-cdn.com/content/v1/60ddf03daeb6821279d423d1/1625478281907-BYFRWY19L5845W0J7GZG/logo.png", "opacity": 0.1, "xanchor": "center", "yanchor": "middle" } ], "legend": { "x": 0, "y": 1.1, "bgcolor": "rgba(0,0,0,0)", "xanchor": "left", "yanchor": "top", "itemsizing": "trace" }, "autosize": true, "template": { "data": { "bar": [ { "type": "bar", "marker": { "line": { "color": "#E5ECF6", "width": 0.5 }, "pattern": { "size": 10, "fillmode": "overlay", "solidity": 0.2 } }, "error_x": { "color": "#2a3f5f" }, "error_y": { "color": "#2a3f5f" } } ], "pie": [ { "type": "pie", "automargin": true } ], "table": [ { "type": "table", "cells": { "fill": { "color": "#EBF0F8" }, "line": { "color": "white" } }, "header": { "fill": { "color": "#C8D4E3" }, "line": { "color": "white" } } } ], "carpet": [ { "type": "carpet", "aaxis": { "gridcolor": "white", "linecolor": "white", "endlinecolor": "#2a3f5f", "minorgridcolor": "white", "startlinecolor": "#2a3f5f" }, "baxis": { "gridcolor": "white", "linecolor": "white", "endlinecolor": "#2a3f5f", "minorgridcolor": "white", "startlinecolor": "#2a3f5f" } } ], "mesh3d": [ { "type": "mesh3d", "colorbar": { "ticks": "", "outlinewidth": 0 } } ], "contour": [ { "type": "contour", "colorbar": { "ticks": "", "outlinewidth": 0 }, "colorscale": [ [ 0.0, "#0d0887" ], [ 0.1111111111111111, "#46039f" ], [ 0.2222222222222222, "#7201a8" ], [ 0.3333333333333333, "#9c179e" ], [ 0.4444444444444444, "#bd3786" ], [ 0.5555555555555556, "#d8576b" ], [ 0.6666666666666666, "#ed7953" ], [ 0.7777777777777778, "#fb9f3a" ], [ 0.8888888888888888, "#fdca26" ], [ 1.0, "#f0f921" ] ] } ], "heatmap": [ { "type": "heatmap", "colorbar": { "ticks": "", "outlinewidth": 0 }, "colorscale": [ [ 0.0, "#0d0887" ], [ 0.1111111111111111, "#46039f" ], [ 0.2222222222222222, "#7201a8" ], [ 0.3333333333333333, "#9c179e" ], [ 0.4444444444444444, "#bd3786" ], [ 0.5555555555555556, "#d8576b" ], [ 0.6666666666666666, "#ed7953" ], [ 0.7777777777777778, "#fb9f3a" ], [ 0.8888888888888888, "#fdca26" ], [ 1.0, "#f0f921" ] ] } ], "scatter": [ { "type": "scatter", "fillpattern": { "size": 10, "fillmode": "overlay", "solidity": 0.2 } } ], "surface": [ { "type": "surface", "colorbar": { "ticks": "", "outlinewidth": 0 }, "colorscale": [ [ 0.0, "#0d0887" ], [ 0.1111111111111111, "#46039f" ], [ 0.2222222222222222, "#7201a8" ], [ 0.3333333333333333, "#9c179e" ], [ 0.4444444444444444, "#bd3786" ], [ 0.5555555555555556, "#d8576b" ], [ 0.6666666666666666, "#ed7953" ], [ 0.7777777777777778, "#fb9f3a" ], [ 0.8888888888888888, "#fdca26" ], [ 1.0, "#f0f921" ] ] } ], "barpolar": [ { "type": "barpolar", "marker": { "line": { "color": "#E5ECF6", "width": 0.5 }, "pattern": { "size": 10, "fillmode": "overlay", "solidity": 0.2 } } } ], "heatmapgl": [ { "type": "heatmapgl", "colorbar": { "ticks": "", "outlinewidth": 0 }, "colorscale": [ [ 0.0, "#0d0887" ], [ 0.1111111111111111, "#46039f" ], [ 0.2222222222222222, "#7201a8" ], [ 0.3333333333333333, "#9c179e" ], [ 0.4444444444444444, "#bd3786" ], [ 0.5555555555555556, "#d8576b" ], [ 0.6666666666666666, "#ed7953" ], [ 0.7777777777777778, "#fb9f3a" ], [ 0.8888888888888888, "#fdca26" ], [ 1.0, "#f0f921" ] ] } ], "histogram": [ { "type": "histogram", "marker": { "pattern": { "size": 10, "fillmode": "overlay", "solidity": 0.2 } } } ], "parcoords": [ { "line": { "colorbar": { "ticks": "", "outlinewidth": 0 } }, "type": "parcoords" } ], "scatter3d": [ { "line": { "colorbar": { "ticks": "", "outlinewidth": 0 } }, "type": "scatter3d", "marker": { "colorbar": { "ticks": "", "outlinewidth": 0 } } } ], "scattergl": [ { "type": "scattergl", "marker": { "colorbar": { "ticks": "", "outlinewidth": 0 } } } ], "choropleth": [ { "type": "choropleth", "colorbar": { "ticks": "", "outlinewidth": 0 } } ], "scattergeo": [ { "type": "scattergeo", "marker": { "colorbar": { "ticks": "", "outlinewidth": 0 } } } ], "histogram2d": [ { "type": "histogram2d", "colorbar": { "ticks": "", "outlinewidth": 0 }, "colorscale": [ [ 0.0, "#0d0887" ], [ 0.1111111111111111, "#46039f" ], [ 0.2222222222222222, "#7201a8" ], [ 0.3333333333333333, "#9c179e" ], [ 0.4444444444444444, "#bd3786" ], [ 0.5555555555555556, "#d8576b" ], [ 0.6666666666666666, "#ed7953" ], [ 0.7777777777777778, "#fb9f3a" ], [ 0.8888888888888888, "#fdca26" ], [ 1.0, "#f0f921" ] ] } ], "scatterpolar": [ { "type": "scatterpolar", "marker": { "colorbar": { "ticks": "", "outlinewidth": 0 } } } ], "contourcarpet": [ { "type": "contourcarpet", "colorbar": { "ticks": "", "outlinewidth": 0 } } ], "scattercarpet": [ { "type": "scattercarpet", "marker": { "colorbar": { "ticks": "", "outlinewidth": 0 } } } ], "scattermapbox": [ { "type": "scattermapbox", "marker": { "colorbar": { "ticks": "", "outlinewidth": 0 } } } ], "scatterpolargl": [ { "type": "scatterpolargl", "marker": { "colorbar": { "ticks": "", "outlinewidth": 0 } } } ], "scatterternary": [ { "type": "scatterternary", "marker": { "colorbar": { "ticks": "", "outlinewidth": 0 } } } ], "histogram2dcontour": [ { "type": "histogram2dcontour", "colorbar": { "ticks": "", "outlinewidth": 0 }, "colorscale": [ [ 0.0, "#0d0887" ], [ 0.1111111111111111, "#46039f" ], [ 0.2222222222222222, "#7201a8" ], [ 0.3333333333333333, "#9c179e" ], [ 0.4444444444444444, "#bd3786" ], [ 0.5555555555555556, "#d8576b" ], [ 0.6666666666666666, "#ed7953" ], [ 0.7777777777777778, "#fb9f3a" ], [ 0.8888888888888888, "#fdca26" ], [ 1.0, "#f0f921" ] ] } ] }, "layout": { "geo": { "bgcolor": "white", "showland": true, "lakecolor": "white", "landcolor": "#E5ECF6", "showlakes": true, "subunitcolor": "white" }, "font": { "color": "#2a3f5f" }, "polar": { "bgcolor": "#E5ECF6", "radialaxis": { "ticks": "", "gridcolor": "white", "linecolor": "white" }, "angularaxis": { "ticks": "", "gridcolor": "white", "linecolor": "white" } }, "scene": { "xaxis": { "ticks": "", "gridcolor": "white", "gridwidth": 2, "linecolor": "white", "zerolinecolor": "white", "showbackground": true, "backgroundcolor": "#E5ECF6" }, "yaxis": { "ticks": "", "gridcolor": "white", "gridwidth": 2, "linecolor": "white", "zerolinecolor": "white", "showbackground": true, "backgroundcolor": "#E5ECF6" }, "zaxis": { "ticks": "", "gridcolor": "white", "gridwidth": 2, "linecolor": "white", "zerolinecolor": "white", "showbackground": true, "backgroundcolor": "#E5ECF6" } }, "title": { "x": 0.05 }, "xaxis": { "ticks": "", "title": { "standoff": 15 }, "gridcolor": "white", "linecolor": "white", "automargin": true, "zerolinecolor": "white", "zerolinewidth": 2 }, "yaxis": { "ticks": "", "title": { "standoff": 15 }, "gridcolor": "white", "linecolor": "white", "automargin": true, "zerolinecolor": "white", "zerolinewidth": 2 }, "mapbox": { "style": "light" }, "ternary": { "aaxis": { "ticks": "", "gridcolor": "white", "linecolor": "white" }, "baxis": { "ticks": "", "gridcolor": "white", "linecolor": "white" }, "caxis": { "ticks": "", "gridcolor": "white", "linecolor": "white" }, "bgcolor": "#E5ECF6" }, "colorway": [ "#636efa", "#EF553B", "#00cc96", "#ab63fa", "#FFA15A", "#19d3f3", "#FF6692", "#B6E880", "#FF97FF", "#FECB52" ], "coloraxis": { "colorbar": { "ticks": "", "outlinewidth": 0 } }, "hovermode": "closest", "colorscale": { "diverging": [ [ 0, "#8e0152" ], [ 0.1, "#c51b7d" ], [ 0.2, "#de77ae" ], [ 0.3, "#f1b6da" ], [ 0.4, "#fde0ef" ], [ 0.5, "#f7f7f7" ], [ 0.6, "#e6f5d0" ], [ 0.7, "#b8e186" ], [ 0.8, "#7fbc41" ], [ 0.9, "#4d9221" ], [ 1, "#276419" ] ], "sequential": [ [ 0.0, "#0d0887" ], [ 0.1111111111111111, "#46039f" ], [ 0.2222222222222222, "#7201a8" ], [ 0.3333333333333333, "#9c179e" ], [ 0.4444444444444444, "#bd3786" ], [ 0.5555555555555556, "#d8576b" ], [ 0.6666666666666666, "#ed7953" ], [ 0.7777777777777778, "#fb9f3a" ], [ 0.8888888888888888, "#fdca26" ], [ 1.0, "#f0f921" ] ], "sequentialminus": [ [ 0.0, "#0d0887" ], [ 0.1111111111111111, "#46039f" ], [ 0.2222222222222222, "#7201a8" ], [ 0.3333333333333333, "#9c179e" ], [ 0.4444444444444444, "#bd3786" ], [ 0.5555555555555556, "#d8576b" ], [ 0.6666666666666666, "#ed7953" ], [ 0.7777777777777778, "#fb9f3a" ], [ 0.8888888888888888, "#fdca26" ], [ 1.0, "#f0f921" ] ] }, "hoverlabel": { "align": "left" }, "plot_bgcolor": "#E5ECF6", "paper_bgcolor": "white", "shapedefaults": { "line": { "color": "#2a3f5f" } }, "autotypenumbers": "strict", "annotationdefaults": { "arrowhead": 0, "arrowcolor": "#2a3f5f", "arrowwidth": 1 } } }, "plot_bgcolor": "white" } }, "height": null, "width": null, "user": { "profile_url": "https://chart-studio.plotly.com/~miottialberto91", "avatar_url": "https://storage.googleapis.com/plotly-prod-profiles/8.jpg", "background_url": "https://storage.googleapis.com/plotly-prod-profiles/bg-10.jpg", "bio": "", "nickname": "", "website": "", "stream_tokens": null, "feature_set_id": null, "csrf_token": null, "date_joined": "2022-06-27 19:21:34", "mapbox_access_tokens": null, "has_password": null, "username": "miottialberto91", "email": null, "is_active": null, "readonly": null, "is_dash_creator": null, "dash_created_count": null, "is_chart_creator": null, "charts_created_count": null } }, { "creation_time": "2024-04-05T13:37:34.592600Z", "comments": { "results": [], "count": 0 }, "parented": true, "embed_url": "https://chart-studio.plotly.com/~isso777/1.embed", "fid": "isso777:1", "filename": "Plot 1", "filetype": "plot", "img_url": "https://storage.googleapis.com/plotly-prod-images/isso777/1/9_6ARVC1XWU2UIGHBDFOMG5OTWQ1GTEI.png", "image_urls": { "default": "https://storage.googleapis.com/plotly-prod-images/isso777/1/2_DG2J4KMWF28RMNSK1DIZJ4WVMKMRJ8.png", "block-thumb": "https://storage.googleapis.com/plotly-prod-images/isso777/1/8_70IGF20FUGB9QB065G339E5B67GL8B.png", "list-thumb": "https://storage.googleapis.com/plotly-prod-images/isso777/1/9_6ARVC1XWU2UIGHBDFOMG5OTWQ1GTEI.png" }, "api_urls": { "files": "https://api.plotly.com/v2/files/isso777:1", "plots": "https://api.plotly.com/v2/plots/isso777:1", "parent": "https://api.plotly.com/v2/folders/home?user=isso777" }, "owner": "isso777", "parent": -1, "preview": "", "referencers": [], "references": [], "title": "", "views": 1, "web_url": "https://chart-studio.plotly.com/~isso777/1/", "world_readable": true, "date_modified": "2024-04-05T13:37:34.605Z", "stars": { "results": [], "count": 0 }, "collaborators": { "results": [], "count": 0 }, "subfolder_count": null, "refresh_interval": null, "organize_view_url": "https://chart-studio.plotly.com/~isso777/1/", "current_user_permission": "read", "is_theme": null, "is_template": false, "autosize": true, "caption": "", "figure": { "data": [ { "meta": { "columnNames": { "x": "A", "y": "B" } }, "mode": "lines", "type": "scatter", "xsrc": "isso777:0:4ef35b", "ysrc": "isso777:0:8528fa" }, { "meta": { "columnNames": { "x": "A", "y": "C" } }, "mode": "lines", "type": "scatter", "xsrc": "isso777:0:4ef35b", "ysrc": "isso777:0:8558f5", "stackgroup": null } ], "frames": [], "layout": { "xaxis": { "side": "bottom", "type": "linear", "range": [ 0, 460 ], "autorange": true }, "yaxis": { "side": "right", "type": "linear", "range": [ -16.833333333333332, 319.8333333333333 ], "autorange": true }, "autosize": true, "template": { "data": { "bar": [ { "type": "bar", "marker": { "colorbar": { "ticks": "", "outlinewidth": 0 } } } ], "table": [ { "type": "table", "cells": { "fill": { "color": "#EBF0F8" }, "line": { "color": "white" } }, "header": { "fill": { "color": "#C8D4E3" }, "line": { "color": "white" } } } ], "carpet": [ { "type": "carpet", "aaxis": { "gridcolor": "#C8D4E3", "linecolor": "#C8D4E3", "endlinecolor": "#2a3f5f", "minorgridcolor": "#C8D4E3", "startlinecolor": "#2a3f5f" }, "baxis": { "gridcolor": "#C8D4E3", "linecolor": "#C8D4E3", "endlinecolor": "#2a3f5f", "minorgridcolor": "#C8D4E3", "startlinecolor": "#2a3f5f" } } ], "mesh3d": [ { "type": "mesh3d", "colorbar": { "ticks": "", "outlinewidth": 0 } } ], "contour": [ { "type": "contour", "colorbar": { "ticks": "", "outlinewidth": 0 }, "autocolorscale": true } ], "heatmap": [ { "type": "heatmap", "colorbar": { "ticks": "", "outlinewidth": 0 }, "autocolorscale": true } ], "scatter": [ { "type": "scatter", "marker": { "colorbar": { "ticks": "", "outlinewidth": 0 } } } ], "surface": [ { "type": "surface", "colorbar": { "ticks": "", "outlinewidth": 0 } } ], "heatmapgl": [ { "type": "heatmapgl", "colorbar": { "ticks": "", "outlinewidth": 0 } } ], "histogram": [ { "type": "histogram", "marker": { "colorbar": { "ticks": "", "outlinewidth": 0 } } } ], "parcoords": [ { "line": { "colorbar": { "ticks": "", "outlinewidth": 0 } }, "type": "parcoords" } ], "scatter3d": [ { "type": "scatter3d", "marker": { "colorbar": { "ticks": "", "outlinewidth": 0 } } } ], "scattergl": [ { "type": "scattergl", "marker": { "colorbar": { "ticks": "", "outlinewidth": 0 } } } ], "choropleth": [ { "type": "choropleth", "colorbar": { "ticks": "", "outlinewidth": 0 } } ], "scattergeo": [ { "type": "scattergeo", "marker": { "colorbar": { "ticks": "", "outlinewidth": 0 } } } ], "histogram2d": [ { "type": "histogram2d", "colorbar": { "ticks": "", "outlinewidth": 0 }, "autocolorscale": true } ], "scatterpolar": [ { "type": "scatterpolar", "marker": { "colorbar": { "ticks": "", "outlinewidth": 0 } } } ], "contourcarpet": [ { "type": "contourcarpet", "colorbar": { "ticks": "", "outlinewidth": 0 } } ], "scattercarpet": [ { "type": "scattercarpet", "marker": { "colorbar": { "ticks": "", "outlinewidth": 0 } } } ], "scattermapbox": [ { "type": "scattermapbox", "marker": { "colorbar": { "ticks": "", "outlinewidth": 0 } } } ], "scatterpolargl": [ { "type": "scatterpolargl", "marker": { "colorbar": { "ticks": "", "outlinewidth": 0 } } } ], "scatterternary": [ { "type": "scatterternary", "marker": { "colorbar": { "ticks": "", "outlinewidth": 0 } } } ], "histogram2dcontour": [ { "type": "histogram2dcontour", "colorbar": { "ticks": "", "outlinewidth": 0 }, "autocolorscale": true } ] }, "layout": { "geo": { "bgcolor": "white", "showland": true, "lakecolor": "white", "landcolor": "white", "showlakes": true, "subunitcolor": "#C8D4E3" }, "font": { "color": "#2a3f5f" }, "polar": { "bgcolor": "white", "radialaxis": { "ticks": "", "gridcolor": "#EBF0F8", "linecolor": "#EBF0F8" }, "angularaxis": { "ticks": "", "gridcolor": "#EBF0F8", "linecolor": "#EBF0F8" } }, "scene": { "xaxis": { "ticks": "", "gridcolor": "#DFE8F3", "gridwidth": 2, "linecolor": "#EBF0F8", "zerolinecolor": "#EBF0F8", "showbackground": true, "backgroundcolor": "white" }, "yaxis": { "ticks": "", "gridcolor": "#DFE8F3", "gridwidth": 2, "linecolor": "#EBF0F8", "zerolinecolor": "#EBF0F8", "showbackground": true, "backgroundcolor": "white" }, "zaxis": { "ticks": "", "gridcolor": "#DFE8F3", "gridwidth": 2, "linecolor": "#EBF0F8", "zerolinecolor": "#EBF0F8", "showbackground": true, "backgroundcolor": "white" } }, "title": { "x": 0.05 }, "xaxis": { "ticks": "", "gridcolor": "#EBF0F8", "linecolor": "#EBF0F8", "automargin": true, "zerolinecolor": "#EBF0F8", "zerolinewidth": 2 }, "yaxis": { "ticks": "", "gridcolor": "#EBF0F8", "linecolor": "#EBF0F8", "automargin": true, "zerolinecolor": "#EBF0F8", "zerolinewidth": 2 }, "ternary": { "aaxis": { "ticks": "", "gridcolor": "#DFE8F3", "linecolor": "#A2B1C6" }, "baxis": { "ticks": "", "gridcolor": "#DFE8F3", "linecolor": "#A2B1C6" }, "caxis": { "ticks": "", "gridcolor": "#DFE8F3", "linecolor": "#A2B1C6" }, "bgcolor": "white" }, "colorway": [ "#636efa", "#EF553B", "#00cc96", "#ab63fa", "#19d3f3", "#e763fa", "#fecb52", "#ffa15a", "#ff6692", "#b6e880" ], "hovermode": "closest", "colorscale": { "diverging": [ [ 0, "#8e0152" ], [ 0.1, "#c51b7d" ], [ 0.2, "#de77ae" ], [ 0.3, "#f1b6da" ], [ 0.4, "#fde0ef" ], [ 0.5, "#f7f7f7" ], [ 0.6, "#e6f5d0" ], [ 0.7, "#b8e186" ], [ 0.8, "#7fbc41" ], [ 0.9, "#4d9221" ], [ 1, "#276419" ] ], "sequential": [ [ 0, "#0508b8" ], [ 0.0893854748603352, "#1910d8" ], [ 0.1787709497206704, "#3c19f0" ], [ 0.2681564245810056, "#6b1cfb" ], [ 0.3575418994413408, "#981cfd" ], [ 0.44692737430167595, "#bf1cfd" ], [ 0.5363128491620112, "#dd2bfd" ], [ 0.6256983240223464, "#f246fe" ], [ 0.7150837988826816, "#fc67fd" ], [ 0.8044692737430168, "#fe88fc" ], [ 0.8938547486033519, "#fea5fd" ], [ 0.9832402234636871, "#febefe" ], [ 1, "#fec3fe" ] ], "sequentialminus": [ [ 0, "#0508b8" ], [ 0.0893854748603352, "#1910d8" ], [ 0.1787709497206704, "#3c19f0" ], [ 0.2681564245810056, "#6b1cfb" ], [ 0.3575418994413408, "#981cfd" ], [ 0.44692737430167595, "#bf1cfd" ], [ 0.5363128491620112, "#dd2bfd" ], [ 0.6256983240223464, "#f246fe" ], [ 0.7150837988826816, "#fc67fd" ], [ 0.8044692737430168, "#fe88fc" ], [ 0.8938547486033519, "#fea5fd" ], [ 0.9832402234636871, "#febefe" ], [ 1, "#fec3fe" ] ] }, "plot_bgcolor": "white", "paper_bgcolor": "white", "shapedefaults": { "line": { "width": 0 }, "opacity": 0.4, "fillcolor": "#506784" }, "annotationdefaults": { "arrowhead": 0, "arrowcolor": "#506784", "arrowwidth": 1 } }, "themeRef": "PLOTLY_WHITE" } } }, "height": null, "width": null, "user": { "profile_url": "https://chart-studio.plotly.com/~isso777", "avatar_url": "https://storage.googleapis.com/plotly-prod-profiles/91.jpg", "background_url": "https://storage.googleapis.com/plotly-prod-profiles/bg-0.jpg", "bio": "", "nickname": "", "website": "", "stream_tokens": null, "feature_set_id": null, "csrf_token": null, "date_joined": "2024-04-05 13:37:06", "mapbox_access_tokens": null, "has_password": null, "username": "isso777", "email": null, "is_active": null, "readonly": null, "is_dash_creator": null, "dash_created_count": null, "is_chart_creator": null, "charts_created_count": null } }, { "creation_time": "2024-04-05T13:36:46.709423Z", "comments": { "results": [], "count": 0 }, "parented": true, "embed_url": "https://chart-studio.plotly.com/~pahep49490/9.embed", "fid": "pahep49490:9", "filename": "elástico 1", "filetype": "plot", "img_url": "https://storage.googleapis.com/plotly-prod-images/pahep49490/9/9_X6EO4LGSAT9O1LGRS6RLA5I1ABKALV.png", "image_urls": { "default": "https://storage.googleapis.com/plotly-prod-images/pahep49490/9/2_ZJVRX41R3VNUOCX4U1QK9LY1L10RJD.png", "block-thumb": "https://storage.googleapis.com/plotly-prod-images/pahep49490/9/8_JC1ZK1XDY3P82YMVW0NDC1XOFRVRCL.png", "list-thumb": "https://storage.googleapis.com/plotly-prod-images/pahep49490/9/9_X6EO4LGSAT9O1LGRS6RLA5I1ABKALV.png" }, "api_urls": { "files": "https://api.plotly.com/v2/files/pahep49490:9", "plots": "https://api.plotly.com/v2/plots/pahep49490:9", "parent": "https://api.plotly.com/v2/folders/home?user=pahep49490" }, "owner": "pahep49490", "parent": -1, "preview": "", "referencers": [], "references": [], "title": "", "views": 1, "web_url": "https://chart-studio.plotly.com/~pahep49490/9/", "world_readable": true, "date_modified": "2024-04-05T13:57:40.561Z", "stars": { "results": [], "count": 0 }, "collaborators": { "results": [], "count": 0 }, "subfolder_count": null, "refresh_interval": null, "organize_view_url": "https://chart-studio.plotly.com/~pahep49490/9/", "current_user_permission": "read", "is_theme": null, "is_template": false, "autosize": true, "caption": "", "figure": { "data": [ { "meta": { "columnNames": { "x": "A", "y": "B" } }, "mode": "markers", "name": "Ida1", "type": "scatter", "xsrc": "pahep49490:5:3a6922", "ysrc": "pahep49490:5:e7ac57", "marker": { "line": { "width": 0 } }, "error_x": { "type": "constant", "value": 0.3, "width": 5, "visible": true, "symmetric": true }, "error_y": { "type": "constant", "value": 0.3, "width": 5, "visible": true, "symmetric": true } }, { "meta": { "columnNames": { "x": "A", "y": "B" } }, "mode": "markers", "name": "volta1", "type": "scatter", "xsrc": "pahep49490:6:d5bac5", "ysrc": "pahep49490:6:b01bff", "error_x": { "type": "constant", "value": 0.3, "width": 5, "visible": true, "symmetric": true }, "error_y": { "type": "constant", "value": 0.3, "width": 5, "visible": true, "symmetric": true } }, { "meta": { "columnNames": { "x": "A", "y": "B" } }, "mode": "markers", "name": "ida2", "type": "scatter", "xsrc": "pahep49490:7:aba83b", "ysrc": "pahep49490:7:44ead2", "error_x": { "type": "constant", "value": 0.3, "width": 5, "visible": true, "symmetric": true }, "error_y": { "type": "constant", "value": 0.3, "width": 5, "visible": true, "symmetric": true }, "stackgroup": null }, { "meta": { "columnNames": { "x": "A", "y": "B" } }, "mode": "markers", "name": "volta2", "type": "scatter", "xsrc": "pahep49490:8:37a4a1", "ysrc": "pahep49490:8:9ffae7", "xaxis": "x", "error_x": { "type": "constant", "value": 0.3, "width": 5, "visible": true, "symmetric": true }, "error_y": { "type": "constant", "value": 0.3, "width": 5, "visible": true, "symmetric": true }, "stackgroup": null } ], "frames": [], "layout": { "title": { "text": "Elástico 1" }, "xaxis": { "side": "bottom", "type": "linear", "range": [ 6.199541284403679, 533.2866972477063 ], "title": { "text": "Massa (g)" }, "domain": [ 0, 1 ], "autorange": false }, "yaxis": { "type": "linear", "range": [ 7.379069767441861, 26.820930232558144 ], "title": { "text": "Distensão (cm)" }, "domain": [ 0, 1 ], "autorange": false }, "legend": { "x": 0.9880978762696215, "y": 1.16, "title": { "text": "<br>" } }, "margin": { "r": 80, "t": 90 }, "autosize": true, "dragmode": "select", "template": { "data": { "bar": [ { "type": "bar", "marker": { "colorbar": { "ticks": "", "outlinewidth": 0 } } } ], "table": [ { "type": "table", "cells": { "fill": { "color": "#EBF0F8" }, "line": { "color": "white" } }, "header": { "fill": { "color": "#C8D4E3" }, "line": { "color": "white" } } } ], "carpet": [ { "type": "carpet", "aaxis": { "gridcolor": "#C8D4E3", "linecolor": "#C8D4E3", "endlinecolor": "#2a3f5f", "minorgridcolor": "#C8D4E3", "startlinecolor": "#2a3f5f" }, "baxis": { "gridcolor": "#C8D4E3", "linecolor": "#C8D4E3", "endlinecolor": "#2a3f5f", "minorgridcolor": "#C8D4E3", "startlinecolor": "#2a3f5f" } } ], "mesh3d": [ { "type": "mesh3d", "colorbar": { "ticks": "", "outlinewidth": 0 } } ], "contour": [ { "type": "contour", "colorbar": { "ticks": "", "outlinewidth": 0 }, "autocolorscale": true } ], "heatmap": [ { "type": "heatmap", "colorbar": { "ticks": "", "outlinewidth": 0 }, "autocolorscale": true } ], "scatter": [ { "type": "scatter", "marker": { "colorbar": { "ticks": "", "outlinewidth": 0 } } } ], "surface": [ { "type": "surface", "colorbar": { "ticks": "", "outlinewidth": 0 } } ], "heatmapgl": [ { "type": "heatmapgl", "colorbar": { "ticks": "", "outlinewidth": 0 } } ], "histogram": [ { "type": "histogram", "marker": { "colorbar": { "ticks": "", "outlinewidth": 0 } } } ], "parcoords": [ { "line": { "colorbar": { "ticks": "", "outlinewidth": 0 } }, "type": "parcoords" } ], "scatter3d": [ { "type": "scatter3d", "marker": { "colorbar": { "ticks": "", "outlinewidth": 0 } } } ], "scattergl": [ { "type": "scattergl", "marker": { "colorbar": { "ticks": "", "outlinewidth": 0 } } } ], "choropleth": [ { "type": "choropleth", "colorbar": { "ticks": "", "outlinewidth": 0 } } ], "scattergeo": [ { "type": "scattergeo", "marker": { "colorbar": { "ticks": "", "outlinewidth": 0 } } } ], "histogram2d": [ { "type": "histogram2d", "colorbar": { "ticks": "", "outlinewidth": 0 }, "autocolorscale": true } ], "scatterpolar": [ { "type": "scatterpolar", "marker": { "colorbar": { "ticks": "", "outlinewidth": 0 } } } ], "contourcarpet": [ { "type": "contourcarpet", "colorbar": { "ticks": "", "outlinewidth": 0 } } ], "scattercarpet": [ { "type": "scattercarpet", "marker": { "colorbar": { "ticks": "", "outlinewidth": 0 } } } ], "scattermapbox": [ { "type": "scattermapbox", "marker": { "colorbar": { "ticks": "", "outlinewidth": 0 } } } ], "scatterpolargl": [ { "type": "scatterpolargl", "marker": { "colorbar": { "ticks": "", "outlinewidth": 0 } } } ], "scatterternary": [ { "type": "scatterternary", "marker": { "colorbar": { "ticks": "", "outlinewidth": 0 } } } ], "histogram2dcontour": [ { "type": "histogram2dcontour", "colorbar": { "ticks": "", "outlinewidth": 0 }, "autocolorscale": true } ] }, "layout": { "geo": { "bgcolor": "white", "showland": true, "lakecolor": "white", "landcolor": "white", "showlakes": true, "subunitcolor": "#C8D4E3" }, "font": { "color": "#2a3f5f" }, "polar": { "bgcolor": "white", "radialaxis": { "ticks": "", "gridcolor": "#EBF0F8", "linecolor": "#EBF0F8" }, "angularaxis": { "ticks": "", "gridcolor": "#EBF0F8", "linecolor": "#EBF0F8" } }, "scene": { "xaxis": { "ticks": "", "gridcolor": "#DFE8F3", "gridwidth": 2, "linecolor": "#EBF0F8", "zerolinecolor": "#EBF0F8", "showbackground": true, "backgroundcolor": "white" }, "yaxis": { "ticks": "", "gridcolor": "#DFE8F3", "gridwidth": 2, "linecolor": "#EBF0F8", "zerolinecolor": "#EBF0F8", "showbackground": true, "backgroundcolor": "white" }, "zaxis": { "ticks": "", "gridcolor": "#DFE8F3", "gridwidth": 2, "linecolor": "#EBF0F8", "zerolinecolor": "#EBF0F8", "showbackground": true, "backgroundcolor": "white" } }, "title": { "x": 0.05 }, "xaxis": { "ticks": "", "gridcolor": "#EBF0F8", "linecolor": "#EBF0F8", "automargin": true, "zerolinecolor": "#EBF0F8", "zerolinewidth": 2 }, "yaxis": { "ticks": "", "gridcolor": "#EBF0F8", "linecolor": "#EBF0F8", "automargin": true, "zerolinecolor": "#EBF0F8", "zerolinewidth": 2 }, "ternary": { "aaxis": { "ticks": "", "gridcolor": "#DFE8F3", "linecolor": "#A2B1C6" }, "baxis": { "ticks": "", "gridcolor": "#DFE8F3", "linecolor": "#A2B1C6" }, "caxis": { "ticks": "", "gridcolor": "#DFE8F3", "linecolor": "#A2B1C6" }, "bgcolor": "white" }, "colorway": [ "#636efa", "#EF553B", "#00cc96", "#ab63fa", "#19d3f3", "#e763fa", "#fecb52", "#ffa15a", "#ff6692", "#b6e880" ], "hovermode": "closest", "colorscale": { "diverging": [ [ 0, "#8e0152" ], [ 0.1, "#c51b7d" ], [ 0.2, "#de77ae" ], [ 0.3, "#f1b6da" ], [ 0.4, "#fde0ef" ], [ 0.5, "#f7f7f7" ], [ 0.6, "#e6f5d0" ], [ 0.7, "#b8e186" ], [ 0.8, "#7fbc41" ], [ 0.9, "#4d9221" ], [ 1, "#276419" ] ], "sequential": [ [ 0, "#0508b8" ], [ 0.0893854748603352, "#1910d8" ], [ 0.1787709497206704, "#3c19f0" ], [ 0.2681564245810056, "#6b1cfb" ], [ 0.3575418994413408, "#981cfd" ], [ 0.44692737430167595, "#bf1cfd" ], [ 0.5363128491620112, "#dd2bfd" ], [ 0.6256983240223464, "#f246fe" ], [ 0.7150837988826816, "#fc67fd" ], [ 0.8044692737430168, "#fe88fc" ], [ 0.8938547486033519, "#fea5fd" ], [ 0.9832402234636871, "#febefe" ], [ 1, "#fec3fe" ] ], "sequentialminus": [ [ 0, "#0508b8" ], [ 0.0893854748603352, "#1910d8" ], [ 0.1787709497206704, "#3c19f0" ], [ 0.2681564245810056, "#6b1cfb" ], [ 0.3575418994413408, "#981cfd" ], [ 0.44692737430167595, "#bf1cfd" ], [ 0.5363128491620112, "#dd2bfd" ], [ 0.6256983240223464, "#f246fe" ], [ 0.7150837988826816, "#fc67fd" ], [ 0.8044692737430168, "#fe88fc" ], [ 0.8938547486033519, "#fea5fd" ], [ 0.9832402234636871, "#febefe" ], [ 1, "#fec3fe" ] ] }, "plot_bgcolor": "white", "paper_bgcolor": "white", "shapedefaults": { "line": { "width": 0 }, "opacity": 0.4, "fillcolor": "#506784" }, "annotationdefaults": { "arrowhead": 0, "arrowcolor": "#506784", "arrowwidth": 1 } }, "themeRef": "PLOTLY_WHITE" }, "hovermode": "closest", "showlegend": true, "annotations": [] } }, "height": null, "width": null, "user": { "profile_url": "https://chart-studio.plotly.com/~pahep49490", "avatar_url": "https://storage.googleapis.com/plotly-prod-profiles/70.jpg", "background_url": "https://storage.googleapis.com/plotly-prod-profiles/bg-5.jpg", "bio": "", "nickname": "", "website": "", "stream_tokens": null, "feature_set_id": null, "csrf_token": null, "date_joined": "2024-04-05 01:58:14", "mapbox_access_tokens": null, "has_password": null, "username": "pahep49490", "email": null, "is_active": null, "readonly": null, "is_dash_creator": null, "dash_created_count": null, "is_chart_creator": null, "charts_created_count": null } } ] }
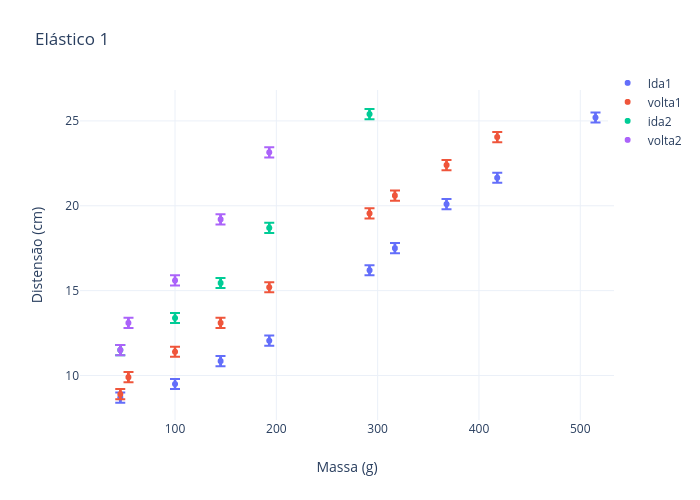