Plots


Jump to API response

This endpoint handles manipulation of Plotly plot files.

Reference

Authorization


Any user with or without a Plotly account may view public plots. For private plots, see authentication.

Actions


list

Listing all public plots can be done via a GET request to this endpoint. By default, plots will be listed in order of date created. The order_by query parameter is accepted at this endpoint. Currently, only ordering by views is supported. It is possible to filter the plots by quality with min_quality or max_quality as query parameter.

Example:

// GET https://api.plotly.com/v2/plots/ ---> 200

// GET https://api.plotly.com/v2/plots/?order_by=-views ---> 200

// GET https://api.plotly.com/v2/plots/?min_quality=5 ---> 200

// GET https://api.plotly.com/v2/plots/?max_quality=5 ---> 200

feed

Listing all handpicked feed plots can be done via a GET request to this endpoint. By default, plots will be listed in a random order.

Example:

// GET https://api.plotly.com/v2/plots/feed ---> 200

create

You can create new plot resources here. The only required field is 'figure'. Currently, the figure is restricted to only contain references to grid data. That is, this will fail if raw data arrays are passed in. To create and manipulate underlying grids for plots, see the grids endpoint.

Example:

// This fails because a figure field is required.
// POST https://api.plotly.com/v2/plots ---> 400 Bad Request
{}

// This fails because the figure has raw data
//POST https://api.plotly.com/v2/plots ---> 400 Bad Request
{
    "figure": {"data": [{"y": ['this', 'is', 'raw', 'data']}]}
}

// This succeeds because the figure has src keys, not raw data.
//POST https://api.plotly.com/v2/plots ---> 200 OK
{
    "figure": {"data": [{"ysrc": "sven:88:u8nd62"}]}
}

When creating a grid, you can optionally specify a source_fid to specify where a plot has come from:

  • source_fid: the fid of a plot that was copied (and presumably edited) to produce this one

detail

There is a lot of meta information stored about plot files including filename, title, share_url, and content_url to name a few.

This information can only be reached with a GET to this endpoint.

Example:

// GET https://api.plotly.com/v2/plots/iheartgraphs:90

content

The contents of a plot can be downloaded via the content resource. The plot content contains referenced grid/column data by default. If you wish to return the raw grid/column data, the inline_data=true query must be included in the request url. The Content-Type header will be appropriately set for the response body.

Alternatively, you can set ?map_data=unreadable to append a mapping of sources to data that belongs to grids which are unreadable for the requestor. This is useful when you have read access to another users plot, but that plot contains grid references which you don't have access to.

Examples:

// Returns referenced grid/column data
// GET https://api.plotly.com/v2/plots/iheartgraphs:90/content ---> 200 OK

// Returns full grid/column data
// GET https://api.plotly.com/v2/plots/iheartgraphs:90/content?inline_data=true ---> 200 OK

// Returns full grid/column data when requestor doesn't have permission
// to read the referenced grid.
// GET https://api.plotly.com/v2/plots/iheartgraphs:90/content?map_data=unreadable ---> 200 OK

GET /v2/plots?cursor=cD0yMDE5LTAzLTIxKzAwJTNBMDklM0E1Mi4xNDY1NTAlMkIwMCUzQTAw&format=api
HTTP 200 OK
Allow: GET, POST, HEAD, OPTIONS
Content-Type: application/json
Vary: Accept

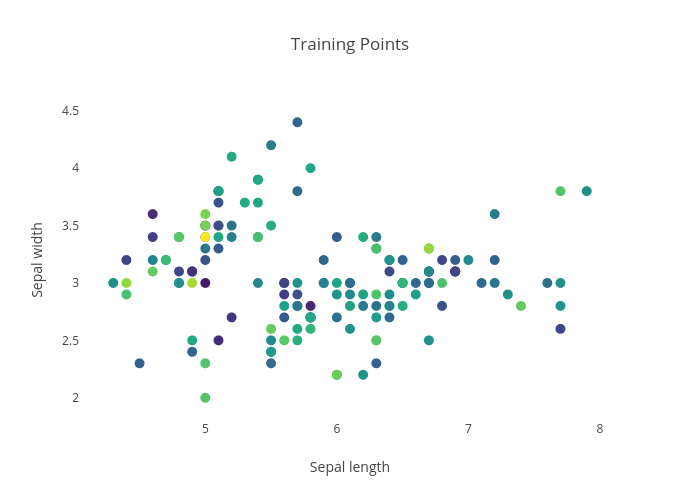
{
    "next": "https://api.plot.ly/v2/plots?cursor=cD0yMDE5LTAzLTIxKzAwJTNBMDAlM0EzNy4yOTc0NTclMkIwMCUzQTAw&format=api",
    "previous": "https://api.plot.ly/v2/plots?cursor=cj0xJnA9MjAxOS0wMy0yMSswMCUzQTA4JTNBMDcuMDY2NTg0JTJCMDAlM0EwMA%3D%3D&format=api",
    "results": [
        {
            "creation_time": "2019-03-21T00:08:07.066584Z",
            "comments": {
                "results": [],
                "count": 0
            },
            "parented": true,
            "embed_url": "https://chart-studio.plotly.com/~carolinechocholak/0.embed",
            "fid": "carolinechocholak:0",
            "filename": "Rate per 100,000 of Chlamydia Data in year 2000",
            "filetype": "plot",
            "img_url": "https://api.plotly.com/v2/files/carolinechocholak:0/image?image_name=list-thumb",
            "image_urls": {
                "default": "https://api.plotly.com/v2/files/carolinechocholak:0/image?image_name=default",
                "block-thumb": "https://api.plotly.com/v2/files/carolinechocholak:0/image?image_name=block-thumb",
                "list-thumb": "https://api.plotly.com/v2/files/carolinechocholak:0/image?image_name=list-thumb"
            },
            "api_urls": {
                "files": "https://api.plotly.com/v2/files/carolinechocholak:0",
                "plots": "https://api.plotly.com/v2/plots/carolinechocholak:0",
                "parent": "https://api.plotly.com/v2/folders/home?user=carolinechocholak"
            },
            "owner": "carolinechocholak",
            "parent": -1,
            "preview": "",
            "referencers": [],
            "references": [],
            "title": "Rate per 100,000 of Chlamydia Data in year 2000",
            "views": 3,
            "web_url": "https://chart-studio.plotly.com/~carolinechocholak/0/rate-per-100000-of-chlamydia-data-in-year-2000/",
            "world_readable": true,
            "date_modified": "2019-03-21T18:57:29.549Z",
            "stars": {
                "results": [],
                "count": 0
            },
            "collaborators": {
                "results": [],
                "count": 0
            },
            "subfolder_count": null,
            "refresh_interval": null,
            "organize_view_url": "https://chart-studio.plotly.com/~carolinechocholak/0/",
            "current_user_permission": "read",
            "is_theme": null,
            "is_template": null,
            "autosize": true,
            "caption": "",
            "figure": {
                "data": [
                    {
                        "uid": "c64fc627-b331-4250-8a38-caf9b6893f32",
                        "fill": "toself",
                        "line": {
                            "color": "rgb(255,255,255)",
                            "width": 0.5
                        },
                        "mode": "lines",
                        "name": "< -1.0",
                        "type": "scatter",
                        "xsrc": "carolinechocholak:1:62b9ea",
                        "ysrc": "carolinechocholak:1:31201d",
                        "fillcolor": "#171c42",
                        "hoverinfo": "none"
                    },
                    {
                        "uid": "87a820e1-1c71-4783-ae87-7c1599de90b0",
                        "fill": "toself",
                        "line": {
                            "color": "rgb(255,255,255)",
                            "width": 0.5
                        },
                        "mode": "lines",
                        "name": "-1.0 - 49.1",
                        "type": "scatter",
                        "xsrc": "carolinechocholak:1:bc1dfd",
                        "ysrc": "carolinechocholak:1:beea46",
                        "fillcolor": "#223f78",
                        "hoverinfo": "none"
                    },
                    {
                        "uid": "bde12af3-ad1a-4280-b0b8-6c5faf7c047c",
                        "fill": "toself",
                        "line": {
                            "color": "rgb(255,255,255)",
                            "width": 0.5
                        },
                        "mode": "lines",
                        "name": "49.1 - 99.2",
                        "type": "scatter",
                        "xsrc": "carolinechocholak:1:f24518",
                        "ysrc": "carolinechocholak:1:e82788",
                        "fillcolor": "#1267b2",
                        "hoverinfo": "none"
                    },
                    {
                        "uid": "29a8b00e-c3d2-4de3-933d-bdaf77f68fa6",
                        "fill": "toself",
                        "line": {
                            "color": "rgb(255,255,255)",
                            "width": 0.5
                        },
                        "mode": "lines",
                        "name": "99.2 - 149.3",
                        "type": "scatter",
                        "xsrc": "carolinechocholak:1:42cb1b",
                        "ysrc": "carolinechocholak:1:b06dd5",
                        "fillcolor": "#4590c4",
                        "hoverinfo": "none"
                    },
                    {
                        "uid": "4f63c96c-22c6-489f-8221-971d90e9fd1e",
                        "fill": "toself",
                        "line": {
                            "color": "rgb(255,255,255)",
                            "width": 0.5
                        },
                        "mode": "lines",
                        "name": "149.3 - 199.4",
                        "type": "scatter",
                        "xsrc": "carolinechocholak:1:689881",
                        "ysrc": "carolinechocholak:1:f1edc4",
                        "fillcolor": "#8cb5c9",
                        "hoverinfo": "none"
                    },
                    {
                        "uid": "5da7736b-3154-4c05-aaf3-6e77e84681e7",
                        "fill": "toself",
                        "line": {
                            "color": "rgb(255,255,255)",
                            "width": 0.5
                        },
                        "mode": "lines",
                        "name": "199.4 - 249.5",
                        "type": "scatter",
                        "xsrc": "carolinechocholak:1:383ec0",
                        "ysrc": "carolinechocholak:1:5037e1",
                        "fillcolor": "#b6bed5",
                        "hoverinfo": "none"
                    },
                    {
                        "uid": "7daa8c43-f1a3-47ba-b111-f5e20ea597f3",
                        "fill": "toself",
                        "line": {
                            "color": "rgb(255,255,255)",
                            "width": 0.5
                        },
                        "mode": "lines",
                        "name": "249.5 - 299.6",
                        "type": "scatter",
                        "xsrc": "carolinechocholak:1:6a6dd1",
                        "ysrc": "carolinechocholak:1:4f899b",
                        "fillcolor": "#dab2be",
                        "hoverinfo": "none"
                    },
                    {
                        "uid": "3c94544e-0f42-4d6e-911a-03bb73ca3536",
                        "fill": "toself",
                        "line": {
                            "color": "rgb(255,255,255)",
                            "width": 0.5
                        },
                        "mode": "lines",
                        "name": "299.6 - 349.7",
                        "type": "scatter",
                        "xsrc": "carolinechocholak:1:138799",
                        "ysrc": "carolinechocholak:1:a93964",
                        "fillcolor": "#d79d8b",
                        "hoverinfo": "none"
                    },
                    {
                        "uid": "f2b2e6f9-e675-4b0c-a0ae-700925206fe0",
                        "fill": "toself",
                        "line": {
                            "color": "rgb(255,255,255)",
                            "width": 0.5
                        },
                        "mode": "lines",
                        "name": "349.7 - 399.8",
                        "type": "scatter",
                        "xsrc": "carolinechocholak:1:8880dc",
                        "ysrc": "carolinechocholak:1:5addef",
                        "fillcolor": "#c46852",
                        "hoverinfo": "none"
                    },
                    {
                        "uid": "aba36cc3-3596-4612-81b5-453297ae1f80",
                        "fill": "toself",
                        "line": {
                            "color": "rgb(255,255,255)",
                            "width": 0.5
                        },
                        "mode": "lines",
                        "name": "399.8 - 449.9",
                        "type": "scatter",
                        "xsrc": "carolinechocholak:1:d3a320",
                        "ysrc": "carolinechocholak:1:44fabe",
                        "fillcolor": "#a63329",
                        "hoverinfo": "none"
                    },
                    {
                        "uid": "bdf83330-81ac-41e4-abe0-ad4e33278a71",
                        "fill": "toself",
                        "line": {
                            "color": "rgb(255,255,255)",
                            "width": 0.5
                        },
                        "mode": "lines",
                        "name": "449.9 - 500.0",
                        "type": "scatter",
                        "xsrc": "carolinechocholak:1:de4137",
                        "ysrc": "carolinechocholak:1:519b92",
                        "fillcolor": "#701b20",
                        "hoverinfo": "none"
                    },
                    {
                        "uid": "ec0b51ea-87b5-440e-a089-d20e93f1291c",
                        "fill": "toself",
                        "line": {
                            "color": "rgb(255,255,255)",
                            "width": 0.5
                        },
                        "mode": "lines",
                        "name": "> 500.0",
                        "type": "scatter",
                        "xsrc": "carolinechocholak:1:6f7346",
                        "ysrc": "carolinechocholak:1:d9ecdf",
                        "fillcolor": "#3c0911",
                        "hoverinfo": "none"
                    },
                    {
                        "uid": "360dac13-b187-476d-9162-fd64335ffbfb",
                        "mode": "markers",
                        "name": "US Counties",
                        "type": "scatter",
                        "xsrc": "carolinechocholak:1:0ad63f",
                        "ysrc": "carolinechocholak:1:ef77aa",
                        "marker": {
                            "color": "white",
                            "opacity": 0
                        },
                        "textsrc": "carolinechocholak:1:007247",
                        "selected": {
                            "marker": {
                                "size": 3,
                                "color": "white",
                                "opacity": 1
                            }
                        },
                        "hoverinfo": "text",
                        "showlegend": false,
                        "unselected": {
                            "marker": {
                                "opacity": 0
                            }
                        },
                        "legendgroup": "centroids"
                    },
                    {
                        "uid": "0fd6e1df-b39d-4599-a156-8defc5b7afe2",
                        "line": {
                            "color": "rgb(240, 240, 240)",
                            "width": 1
                        },
                        "mode": "lines",
                        "type": "scatter",
                        "xsrc": "carolinechocholak:1:0cfd3d",
                        "ysrc": "carolinechocholak:1:897730",
                        "hoverinfo": "text",
                        "showlegend": false,
                        "legendgroup": "States"
                    }
                ],
                "layout": {
                    "title": {
                        "text": "Rate per 100,000 of Chlamydia Data in year 2000"
                    },
                    "width": 900,
                    "xaxis": {
                        "range": [
                            -125.0,
                            -55.0
                        ],
                        "showgrid": false,
                        "zeroline": false,
                        "autorange": false,
                        "fixedrange": true,
                        "showticklabels": false
                    },
                    "yaxis": {
                        "range": [
                            23.0,
                            51.0
                        ],
                        "showgrid": false,
                        "zeroline": false,
                        "autorange": false,
                        "fixedrange": true,
                        "showticklabels": false
                    },
                    "height": 450,
                    "legend": {
                        "x": 1,
                        "y": 1,
                        "xanchor": "right",
                        "yanchor": "top",
                        "traceorder": "reversed"
                    },
                    "margin": {
                        "b": 20,
                        "l": 20,
                        "r": 20,
                        "t": 40
                    },
                    "dragmode": "select",
                    "hovermode": "closest",
                    "annotations": [
                        {
                            "x": 1,
                            "y": 1.05,
                            "text": "<b>% change</b>",
                            "xref": "paper",
                            "yref": "paper",
                            "xanchor": "right",
                            "showarrow": false
                        }
                    ]
                }
            },
            "height": 450,
            "width": 900,
            "user": {
                "profile_url": "https://chart-studio.plotly.com/~carolinechocholak",
                "avatar_url": "https://storage.googleapis.com/plotly-prod-profiles/56.jpg",
                "background_url": "https://storage.googleapis.com/plotly-prod-profiles/bg-14.jpg",
                "bio": "",
                "nickname": "",
                "website": "",
                "stream_tokens": null,
                "feature_set_id": null,
                "csrf_token": null,
                "date_joined": "2019-03-21 00:04:49",
                "mapbox_access_tokens": null,
                "has_password": null,
                "username": "carolinechocholak",
                "email": null,
                "is_active": null,
                "readonly": null,
                "is_dash_creator": null,
                "dash_created_count": null,
                "is_chart_creator": null,
                "charts_created_count": null
            }
        },
        {
            "creation_time": "2019-03-21T00:07:05.637297Z",
            "comments": {
                "results": [],
                "count": 0
            },
            "parented": true,
            "embed_url": "https://chart-studio.plotly.com/~cguthrie/63.embed",
            "fid": "cguthrie:63",
            "filename": "plot from API (1)",
            "filetype": "plot",
            "img_url": "https://storage.googleapis.com/plotly-prod-images/cguthrie/63/9_G7ELZ4O11A8MZII2D1WPLKT3EDQHPA.png",
            "image_urls": {
                "default": "https://storage.googleapis.com/plotly-prod-images/cguthrie/63/2_H8UB4NSUDAFO9HM9VLAWEFIVEATVZJ.png",
                "block-thumb": "https://storage.googleapis.com/plotly-prod-images/cguthrie/63/8_KO5N88TUQ0CGFH7HIOFEK01QEYAC1C.png",
                "list-thumb": "https://storage.googleapis.com/plotly-prod-images/cguthrie/63/9_G7ELZ4O11A8MZII2D1WPLKT3EDQHPA.png"
            },
            "api_urls": {
                "files": "https://api.plotly.com/v2/files/cguthrie:63",
                "plots": "https://api.plotly.com/v2/plots/cguthrie:63",
                "parent": "https://api.plotly.com/v2/folders/home?user=cguthrie"
            },
            "owner": "cguthrie",
            "parent": -1,
            "preview": "",
            "referencers": [],
            "references": [],
            "title": "Basic Sankey Diagram",
            "views": 3,
            "web_url": "https://chart-studio.plotly.com/~cguthrie/63/basic-sankey-diagram/",
            "world_readable": true,
            "date_modified": "2019-03-21T00:07:06.096Z",
            "stars": {
                "results": [],
                "count": 0
            },
            "collaborators": {
                "results": [],
                "count": 0
            },
            "subfolder_count": null,
            "refresh_interval": null,
            "organize_view_url": "https://chart-studio.plotly.com/~cguthrie/63/",
            "current_user_permission": "read",
            "is_theme": null,
            "is_template": null,
            "autosize": true,
            "caption": "",
            "figure": {
                "data": [
                    {
                        "link": {
                            "valuesrc": "cguthrie:64:0b2541",
                            "sourcesrc": "cguthrie:64:733f28",
                            "targetsrc": "cguthrie:64:deb622"
                        },
                        "node": {
                            "pad": 15,
                            "line": {
                                "color": "black",
                                "width": 0.5
                            },
                            "colorsrc": "cguthrie:64:528028",
                            "labelsrc": "cguthrie:64:43cc37",
                            "thickness": 20
                        },
                        "type": "sankey"
                    }
                ],
                "layout": {
                    "font": {
                        "size": 10
                    },
                    "title": "Basic Sankey Diagram"
                }
            },
            "height": null,
            "width": null,
            "user": {
                "profile_url": "https://chart-studio.plotly.com/~cguthrie",
                "avatar_url": "https://storage.googleapis.com/plotly-prod-profiles/32.jpg",
                "background_url": "https://storage.googleapis.com/plotly-prod-profiles/bg-4.jpg",
                "bio": "",
                "nickname": "",
                "website": "",
                "stream_tokens": null,
                "feature_set_id": null,
                "csrf_token": null,
                "date_joined": "2015-03-20 18:52:33",
                "mapbox_access_tokens": null,
                "has_password": null,
                "username": "cguthrie",
                "email": null,
                "is_active": null,
                "readonly": null,
                "is_dash_creator": null,
                "dash_created_count": null,
                "is_chart_creator": null,
                "charts_created_count": null
            }
        },
        {
            "creation_time": "2019-03-21T00:04:31.240835Z",
            "comments": {
                "results": [],
                "count": 0
            },
            "parented": true,
            "embed_url": "https://chart-studio.plotly.com/~suvrangshu/2.embed",
            "fid": "suvrangshu:2",
            "filename": "Montreal Mapbox",
            "filetype": "plot",
            "img_url": "https://api.plotly.com/v2/files/suvrangshu:2/image?image_name=list-thumb",
            "image_urls": {
                "default": "https://api.plotly.com/v2/files/suvrangshu:2/image?image_name=default",
                "block-thumb": "https://api.plotly.com/v2/files/suvrangshu:2/image?image_name=block-thumb",
                "list-thumb": "https://api.plotly.com/v2/files/suvrangshu:2/image?image_name=list-thumb"
            },
            "api_urls": {
                "files": "https://api.plotly.com/v2/files/suvrangshu:2",
                "plots": "https://api.plotly.com/v2/plots/suvrangshu:2",
                "parent": "https://api.plotly.com/v2/folders/home?user=suvrangshu"
            },
            "owner": "suvrangshu",
            "parent": -1,
            "preview": "",
            "referencers": [],
            "references": [],
            "title": "",
            "views": 11,
            "web_url": "https://chart-studio.plotly.com/~suvrangshu/2/",
            "world_readable": true,
            "date_modified": "2019-03-22T06:58:46.460Z",
            "stars": {
                "results": [],
                "count": 0
            },
            "collaborators": {
                "results": [],
                "count": 0
            },
            "subfolder_count": null,
            "refresh_interval": null,
            "organize_view_url": "https://chart-studio.plotly.com/~suvrangshu/2/",
            "current_user_permission": "read",
            "is_theme": null,
            "is_template": null,
            "autosize": true,
            "caption": "",
            "figure": {
                "data": [
                    {
                        "uid": "9632f4ff-995b-4d2d-a8e6-e9465a97266c",
                        "mode": "markers",
                        "type": "scattermapbox",
                        "latsrc": "suvrangshu:3:b7c024",
                        "lonsrc": "suvrangshu:3:60ff1b",
                        "marker": {
                            "size": 14
                        },
                        "textsrc": "suvrangshu:3:6582ae"
                    }
                ],
                "layout": {
                    "mapbox": {
                        "zoom": 5,
                        "pitch": 0,
                        "center": {
                            "lat": 45,
                            "lon": -73
                        },
                        "bearing": 0,
                        "accesstoken": "sk.eyJ1Ijoic3V2cmFuZ3NodSIsImEiOiJjanRodmZzZ2wwNmJxNDNsajU3Nmk5NWtxIn0.pcNwLGw2WlhND4YYYtFyQg"
                    },
                    "autosize": true,
                    "hovermode": "closest"
                }
            },
            "height": null,
            "width": null,
            "user": {
                "profile_url": "https://chart-studio.plotly.com/~suvrangshu",
                "avatar_url": "https://storage.googleapis.com/plotly-prod-profiles/31.jpg",
                "background_url": "https://storage.googleapis.com/plotly-prod-profiles/bg-4.jpg",
                "bio": "",
                "nickname": "",
                "website": "",
                "stream_tokens": null,
                "feature_set_id": null,
                "csrf_token": null,
                "date_joined": "2019-03-08 05:49:01",
                "mapbox_access_tokens": null,
                "has_password": null,
                "username": "suvrangshu",
                "email": null,
                "is_active": null,
                "readonly": null,
                "is_dash_creator": null,
                "dash_created_count": null,
                "is_chart_creator": null,
                "charts_created_count": null
            }
        },
        {
            "creation_time": "2019-03-21T00:03:10.743172Z",
            "comments": {
                "results": [],
                "count": 0
            },
            "parented": true,
            "embed_url": "https://chart-studio.plotly.com/~nirajdevpandey/6.embed",
            "fid": "nirajdevpandey:6",
            "filename": "plot from API (3)",
            "filetype": "plot",
            "img_url": "https://storage.googleapis.com/plotly-prod-images/nirajdevpandey/6/9_HMS1CMNDKN8SGQKOJ3GC4PJ1U5BV31.png",
            "image_urls": {
                "default": "https://storage.googleapis.com/plotly-prod-images/nirajdevpandey/6/2_BPYDC499V6IFIM8FWRIUHT6KRN4XH7.png",
                "block-thumb": "https://storage.googleapis.com/plotly-prod-images/nirajdevpandey/6/8_N1448Z9IZO49VM39FQJ0PKV0TPV2IE.png",
                "list-thumb": "https://storage.googleapis.com/plotly-prod-images/nirajdevpandey/6/9_HMS1CMNDKN8SGQKOJ3GC4PJ1U5BV31.png"
            },
            "api_urls": {
                "files": "https://api.plotly.com/v2/files/nirajdevpandey:6",
                "plots": "https://api.plotly.com/v2/plots/nirajdevpandey:6",
                "parent": "https://api.plotly.com/v2/folders/home?user=nirajdevpandey"
            },
            "owner": "nirajdevpandey",
            "parent": -1,
            "preview": "",
            "referencers": [],
            "references": [],
            "title": "Training Points",
            "views": 2,
            "web_url": "https://chart-studio.plotly.com/~nirajdevpandey/6/training-points/",
            "world_readable": true,
            "date_modified": "2019-03-21T00:03:11.162Z",
            "stars": {
                "results": [],
                "count": 0
            },
            "collaborators": {
                "results": [],
                "count": 0
            },
            "subfolder_count": null,
            "refresh_interval": null,
            "organize_view_url": "https://chart-studio.plotly.com/~nirajdevpandey/6/",
            "current_user_permission": "read",
            "is_theme": null,
            "is_template": null,
            "autosize": true,
            "caption": "",
            "figure": {
                "data": [
                    {
                        "uid": "8b6f7c68-6b9a-4278-aa18-23a0423e53c7",
                        "mode": "markers",
                        "type": "scatter",
                        "xsrc": "nirajdevpandey:7:346712",
                        "ysrc": "nirajdevpandey:7:7f7627",
                        "marker": {
                            "size": 10,
                            "colorsrc": "nirajdevpandey:7:ae644f",
                            "showscale": false,
                            "colorscale": "Viridis"
                        }
                    }
                ],
                "layout": {
                    "title": {
                        "text": "Training Points"
                    },
                    "xaxis": {
                        "title": {
                            "text": "Sepal length"
                        },
                        "showgrid": false
                    },
                    "yaxis": {
                        "title": {
                            "text": "Sepal width"
                        },
                        "showgrid": false
                    }
                }
            },
            "height": null,
            "width": null,
            "user": {
                "profile_url": "https://chart-studio.plotly.com/~nirajdevpandey",
                "avatar_url": "https://storage.googleapis.com/plotly-prod-profiles/75.jpg",
                "background_url": "https://storage.googleapis.com/plotly-prod-profiles/bg-8.jpg",
                "bio": "",
                "nickname": "",
                "website": "",
                "stream_tokens": null,
                "feature_set_id": null,
                "csrf_token": null,
                "date_joined": "2019-03-20 23:12:23",
                "mapbox_access_tokens": null,
                "has_password": null,
                "username": "nirajdevpandey",
                "email": null,
                "is_active": null,
                "readonly": null,
                "is_dash_creator": null,
                "dash_created_count": null,
                "is_chart_creator": null,
                "charts_created_count": null
            }
        },
        {
            "creation_time": "2019-03-21T00:03:01.330277Z",
            "comments": {
                "results": [],
                "count": 0
            },
            "parented": true,
            "embed_url": "https://chart-studio.plotly.com/~alrished/0.embed",
            "fid": "alrished:0",
            "filename": "Mixed Subplots Volcano",
            "filetype": "plot",
            "img_url": "https://storage.googleapis.com/plotly-prod-images/alrished/0/9_QWG356G0YXK39I81QEW1JHVKYQ7U0M.png",
            "image_urls": {
                "default": "https://storage.googleapis.com/plotly-prod-images/alrished/0/2_BHX4YKUCJNZ6KSPKA3EDOFXZCIW00S.png",
                "block-thumb": "https://storage.googleapis.com/plotly-prod-images/alrished/0/8_V98S1I7B8NL7JDKZFUIF3XYS65AYCJ.png",
                "list-thumb": "https://storage.googleapis.com/plotly-prod-images/alrished/0/9_QWG356G0YXK39I81QEW1JHVKYQ7U0M.png"
            },
            "api_urls": {
                "files": "https://api.plotly.com/v2/files/alrished:0",
                "plots": "https://api.plotly.com/v2/plots/alrished:0",
                "parent": "https://api.plotly.com/v2/folders/home?user=alrished"
            },
            "owner": "alrished",
            "parent": -1,
            "preview": "",
            "referencers": [],
            "references": [],
            "title": "<br>Volcano Database",
            "views": 4,
            "web_url": "https://chart-studio.plotly.com/~alrished/0/volcano-database/",
            "world_readable": true,
            "date_modified": "2019-03-21T01:25:24.763Z",
            "stars": {
                "results": [],
                "count": 0
            },
            "collaborators": {
                "results": [],
                "count": 0
            },
            "subfolder_count": null,
            "refresh_interval": null,
            "organize_view_url": "https://chart-studio.plotly.com/~alrished/0/",
            "current_user_permission": "read",
            "is_theme": null,
            "is_template": null,
            "autosize": true,
            "caption": "",
            "figure": {
                "data": [
                    {
                        "uid": "125a188f-c66f-4938-b482-c9ccc0fbed63",
                        "type": "bar",
                        "xsrc": "alrished:1:ac979c",
                        "ysrc": "alrished:1:a6a9bb",
                        "marker": {
                            "color": "#CF1020"
                        }
                    },
                    {
                        "uid": "1472b35b-9e69-4061-af10-fb1a1464ca2d",
                        "type": "surface",
                        "zsrc": "alrished:1:-ac979c,a6a9bb,3d5769,8335d4",
                        "showscale": false,
                        "colorscale": "Reds"
                    },
                    {
                        "geo": "geo3",
                        "uid": "b8282a49-092f-4538-b17d-27801a7913e0",
                        "mode": "markers",
                        "type": "scattergeo",
                        "latsrc": "alrished:1:3d5769",
                        "lonsrc": "alrished:1:8335d4",
                        "marker": {
                            "size": 4,
                            "color": "#CF1020",
                            "opacity": 0.8,
                            "colorscale": "Viridis"
                        },
                        "hoverinfo": "text"
                    }
                ],
                "layout": {
                    "font": {
                        "color": "white"
                    },
                    "geo3": {
                        "scope": "world",
                        "domain": {
                            "x": [
                                0,
                                0.55
                            ],
                            "y": [
                                0,
                                0.9
                            ]
                        },
                        "bgcolor": "black",
                        "showland": true,
                        "lakecolor": "rgba(127,205,255,1)",
                        "landcolor": "white",
                        "showlakes": true,
                        "showocean": true,
                        "oceancolor": "rgb(6,66,115)",
                        "projection": {
                            "type": "orthographic"
                        }
                    },
                    "scene": {
                        "xaxis": {
                            "gridcolor": "white"
                        },
                        "yaxis": {
                            "gridcolor": "white"
                        },
                        "zaxis": {
                            "gridcolor": "white"
                        },
                        "domain": {
                            "x": [
                                0.5,
                                1
                            ],
                            "y": [
                                0,
                                0.55
                            ]
                        }
                    },
                    "title": {
                        "font": {
                            "size": 20,
                            "family": "Raleway"
                        },
                        "text": "<br>Volcano Database"
                    },
                    "xaxis": {
                        "anchor": "y",
                        "domain": [
                            0.6,
                            0.95
                        ]
                    },
                    "yaxis": {
                        "anchor": "x",
                        "domain": [
                            0.65,
                            0.95
                        ],
                        "showgrid": false
                    },
                    "margin": {
                        "b": 40,
                        "l": 60,
                        "r": 10,
                        "t": 25
                    },
                    "dragmode": "zoom",
                    "showlegend": false,
                    "annotations": [
                        {
                            "x": 0,
                            "y": 0,
                            "text": "Source: NOAA",
                            "xref": "paper",
                            "yref": "paper",
                            "showarrow": false
                        }
                    ],
                    "plot_bgcolor": "black",
                    "paper_bgcolor": "black"
                }
            },
            "height": null,
            "width": null,
            "user": {
                "profile_url": "https://chart-studio.plotly.com/~alrished",
                "avatar_url": "https://storage.googleapis.com/plotly-prod-profiles/67.jpg",
                "background_url": "https://storage.googleapis.com/plotly-prod-profiles/bg-10.jpg",
                "bio": "",
                "nickname": "",
                "website": "",
                "stream_tokens": null,
                "feature_set_id": null,
                "csrf_token": null,
                "date_joined": "2019-03-20 23:57:15",
                "mapbox_access_tokens": null,
                "has_password": null,
                "username": "alrished",
                "email": null,
                "is_active": null,
                "readonly": null,
                "is_dash_creator": null,
                "dash_created_count": null,
                "is_chart_creator": null,
                "charts_created_count": null
            }
        },
        {
            "creation_time": "2019-03-21T00:01:34.565358Z",
            "comments": {
                "results": [],
                "count": 0
            },
            "parented": true,
            "embed_url": "https://chart-studio.plotly.com/~MISISINGH/9.embed",
            "fid": "MISISINGH:9",
            "filename": "Plot 9",
            "filetype": "plot",
            "img_url": "https://storage.googleapis.com/plotly-prod-images/MISISINGH/9/9_E57TSDLAH470E0RLX3IRWOIJHG567I.png",
            "image_urls": {
                "default": "https://storage.googleapis.com/plotly-prod-images/MISISINGH/9/2_INDX5TSQCYXUMUZX2OHWYETA6CCDOW.png",
                "block-thumb": "https://storage.googleapis.com/plotly-prod-images/MISISINGH/9/8_TT5B0MCKU12X3DDOKE7Z0NOFIHN3JX.png",
                "list-thumb": "https://storage.googleapis.com/plotly-prod-images/MISISINGH/9/9_E57TSDLAH470E0RLX3IRWOIJHG567I.png"
            },
            "api_urls": {
                "files": "https://api.plotly.com/v2/files/MISISINGH:9",
                "plots": "https://api.plotly.com/v2/plots/MISISINGH:9",
                "parent": "https://api.plotly.com/v2/folders/home?user=MISISINGH"
            },
            "owner": "MISISINGH",
            "parent": -1,
            "preview": "",
            "referencers": [],
            "references": [],
            "title": "",
            "views": 3,
            "web_url": "https://chart-studio.plotly.com/~MISISINGH/9/",
            "world_readable": true,
            "date_modified": "2019-03-21T00:07:53.765Z",
            "stars": {
                "results": [],
                "count": 0
            },
            "collaborators": {
                "results": [],
                "count": 0
            },
            "subfolder_count": null,
            "refresh_interval": null,
            "organize_view_url": "https://chart-studio.plotly.com/~MISISINGH/9/",
            "current_user_permission": "read",
            "is_theme": null,
            "is_template": false,
            "autosize": true,
            "caption": "",
            "figure": {
                "data": [
                    {
                        "mode": "markers",
                        "type": "bar",
                        "xsrc": "MISISINGH:8:71e035",
                        "ysrc": "MISISINGH:8:3063c0",
                        "orientation": "v"
                    }
                ],
                "frames": [],
                "layout": {
                    "title": {
                        "text": "GRAPH OF YEAR VS NHEM"
                    },
                    "xaxis": {
                        "type": "linear",
                        "range": [
                            1879.5,
                            2014.5
                        ],
                        "title": {
                            "text": "YEAR"
                        },
                        "autorange": true
                    },
                    "yaxis": {
                        "type": "linear",
                        "range": [
                            -59.94444444444444,
                            98.94444444444444
                        ],
                        "title": {
                            "text": "NHEM"
                        },
                        "autorange": true
                    },
                    "autosize": true,
                    "template": {
                        "data": {
                            "bar": [
                                {
                                    "type": "bar",
                                    "marker": {
                                        "colorbar": {
                                            "ticks": "",
                                            "outlinewidth": 0
                                        }
                                    }
                                }
                            ],
                            "table": [
                                {
                                    "type": "table",
                                    "cells": {
                                        "fill": {
                                            "color": "#EBF0F8"
                                        },
                                        "line": {
                                            "color": "white"
                                        }
                                    },
                                    "header": {
                                        "fill": {
                                            "color": "#C8D4E3"
                                        },
                                        "line": {
                                            "color": "white"
                                        }
                                    }
                                }
                            ],
                            "carpet": [
                                {
                                    "type": "carpet",
                                    "aaxis": {
                                        "gridcolor": "#C8D4E3",
                                        "linecolor": "#C8D4E3",
                                        "endlinecolor": "#2a3f5f",
                                        "minorgridcolor": "#C8D4E3",
                                        "startlinecolor": "#2a3f5f"
                                    },
                                    "baxis": {
                                        "gridcolor": "#C8D4E3",
                                        "linecolor": "#C8D4E3",
                                        "endlinecolor": "#2a3f5f",
                                        "minorgridcolor": "#C8D4E3",
                                        "startlinecolor": "#2a3f5f"
                                    }
                                }
                            ],
                            "mesh3d": [
                                {
                                    "type": "mesh3d",
                                    "colorbar": {
                                        "ticks": "",
                                        "outlinewidth": 0
                                    }
                                }
                            ],
                            "contour": [
                                {
                                    "type": "contour",
                                    "colorbar": {
                                        "ticks": "",
                                        "outlinewidth": 0
                                    },
                                    "autocolorscale": true
                                }
                            ],
                            "heatmap": [
                                {
                                    "type": "heatmap",
                                    "colorbar": {
                                        "ticks": "",
                                        "outlinewidth": 0
                                    },
                                    "autocolorscale": true
                                }
                            ],
                            "scatter": [
                                {
                                    "type": "scatter",
                                    "marker": {
                                        "colorbar": {
                                            "ticks": "",
                                            "outlinewidth": 0
                                        }
                                    }
                                }
                            ],
                            "surface": [
                                {
                                    "type": "surface",
                                    "colorbar": {
                                        "ticks": "",
                                        "outlinewidth": 0
                                    }
                                }
                            ],
                            "heatmapgl": [
                                {
                                    "type": "heatmapgl",
                                    "colorbar": {
                                        "ticks": "",
                                        "outlinewidth": 0
                                    }
                                }
                            ],
                            "histogram": [
                                {
                                    "type": "histogram",
                                    "marker": {
                                        "colorbar": {
                                            "ticks": "",
                                            "outlinewidth": 0
                                        }
                                    }
                                }
                            ],
                            "parcoords": [
                                {
                                    "line": {
                                        "colorbar": {
                                            "ticks": "",
                                            "outlinewidth": 0
                                        }
                                    },
                                    "type": "parcoords"
                                }
                            ],
                            "scatter3d": [
                                {
                                    "type": "scatter3d",
                                    "marker": {
                                        "colorbar": {
                                            "ticks": "",
                                            "outlinewidth": 0
                                        }
                                    }
                                }
                            ],
                            "scattergl": [
                                {
                                    "type": "scattergl",
                                    "marker": {
                                        "colorbar": {
                                            "ticks": "",
                                            "outlinewidth": 0
                                        }
                                    }
                                }
                            ],
                            "choropleth": [
                                {
                                    "type": "choropleth",
                                    "colorbar": {
                                        "ticks": "",
                                        "outlinewidth": 0
                                    }
                                }
                            ],
                            "scattergeo": [
                                {
                                    "type": "scattergeo",
                                    "marker": {
                                        "colorbar": {
                                            "ticks": "",
                                            "outlinewidth": 0
                                        }
                                    }
                                }
                            ],
                            "histogram2d": [
                                {
                                    "type": "histogram2d",
                                    "colorbar": {
                                        "ticks": "",
                                        "outlinewidth": 0
                                    },
                                    "autocolorscale": true
                                }
                            ],
                            "scatterpolar": [
                                {
                                    "type": "scatterpolar",
                                    "marker": {
                                        "colorbar": {
                                            "ticks": "",
                                            "outlinewidth": 0
                                        }
                                    }
                                }
                            ],
                            "contourcarpet": [
                                {
                                    "type": "contourcarpet",
                                    "colorbar": {
                                        "ticks": "",
                                        "outlinewidth": 0
                                    }
                                }
                            ],
                            "scattercarpet": [
                                {
                                    "type": "scattercarpet",
                                    "marker": {
                                        "colorbar": {
                                            "ticks": "",
                                            "outlinewidth": 0
                                        }
                                    }
                                }
                            ],
                            "scattermapbox": [
                                {
                                    "type": "scattermapbox",
                                    "marker": {
                                        "colorbar": {
                                            "ticks": "",
                                            "outlinewidth": 0
                                        }
                                    }
                                }
                            ],
                            "scatterpolargl": [
                                {
                                    "type": "scatterpolargl",
                                    "marker": {
                                        "colorbar": {
                                            "ticks": "",
                                            "outlinewidth": 0
                                        }
                                    }
                                }
                            ],
                            "scatterternary": [
                                {
                                    "type": "scatterternary",
                                    "marker": {
                                        "colorbar": {
                                            "ticks": "",
                                            "outlinewidth": 0
                                        }
                                    }
                                }
                            ],
                            "histogram2dcontour": [
                                {
                                    "type": "histogram2dcontour",
                                    "colorbar": {
                                        "ticks": "",
                                        "outlinewidth": 0
                                    },
                                    "autocolorscale": true
                                }
                            ]
                        },
                        "layout": {
                            "geo": {
                                "bgcolor": "white",
                                "showland": true,
                                "lakecolor": "white",
                                "landcolor": "white",
                                "showlakes": true,
                                "subunitcolor": "#C8D4E3"
                            },
                            "font": {
                                "color": "#2a3f5f"
                            },
                            "polar": {
                                "bgcolor": "white",
                                "radialaxis": {
                                    "ticks": "",
                                    "gridcolor": "#EBF0F8",
                                    "linecolor": "#EBF0F8"
                                },
                                "angularaxis": {
                                    "ticks": "",
                                    "gridcolor": "#EBF0F8",
                                    "linecolor": "#EBF0F8"
                                }
                            },
                            "scene": {
                                "xaxis": {
                                    "ticks": "",
                                    "gridcolor": "#DFE8F3",
                                    "gridwidth": 2,
                                    "linecolor": "#EBF0F8",
                                    "zerolinecolor": "#EBF0F8",
                                    "showbackground": true,
                                    "backgroundcolor": "white"
                                },
                                "yaxis": {
                                    "ticks": "",
                                    "gridcolor": "#DFE8F3",
                                    "gridwidth": 2,
                                    "linecolor": "#EBF0F8",
                                    "zerolinecolor": "#EBF0F8",
                                    "showbackground": true,
                                    "backgroundcolor": "white"
                                },
                                "zaxis": {
                                    "ticks": "",
                                    "gridcolor": "#DFE8F3",
                                    "gridwidth": 2,
                                    "linecolor": "#EBF0F8",
                                    "zerolinecolor": "#EBF0F8",
                                    "showbackground": true,
                                    "backgroundcolor": "white"
                                }
                            },
                            "title": {
                                "x": 0.05
                            },
                            "xaxis": {
                                "ticks": "",
                                "gridcolor": "#EBF0F8",
                                "linecolor": "#EBF0F8",
                                "automargin": true,
                                "zerolinecolor": "#EBF0F8",
                                "zerolinewidth": 2
                            },
                            "yaxis": {
                                "ticks": "",
                                "gridcolor": "#EBF0F8",
                                "linecolor": "#EBF0F8",
                                "automargin": true,
                                "zerolinecolor": "#EBF0F8",
                                "zerolinewidth": 2
                            },
                            "ternary": {
                                "aaxis": {
                                    "ticks": "",
                                    "gridcolor": "#DFE8F3",
                                    "linecolor": "#A2B1C6"
                                },
                                "baxis": {
                                    "ticks": "",
                                    "gridcolor": "#DFE8F3",
                                    "linecolor": "#A2B1C6"
                                },
                                "caxis": {
                                    "ticks": "",
                                    "gridcolor": "#DFE8F3",
                                    "linecolor": "#A2B1C6"
                                },
                                "bgcolor": "white"
                            },
                            "colorway": [
                                "#636efa",
                                "#EF553B",
                                "#00cc96",
                                "#ab63fa",
                                "#19d3f3",
                                "#e763fa",
                                "#fecb52",
                                "#ffa15a",
                                "#ff6692",
                                "#b6e880"
                            ],
                            "hovermode": "closest",
                            "colorscale": {
                                "diverging": [
                                    [
                                        0,
                                        "#8e0152"
                                    ],
                                    [
                                        0.1,
                                        "#c51b7d"
                                    ],
                                    [
                                        0.2,
                                        "#de77ae"
                                    ],
                                    [
                                        0.3,
                                        "#f1b6da"
                                    ],
                                    [
                                        0.4,
                                        "#fde0ef"
                                    ],
                                    [
                                        0.5,
                                        "#f7f7f7"
                                    ],
                                    [
                                        0.6,
                                        "#e6f5d0"
                                    ],
                                    [
                                        0.7,
                                        "#b8e186"
                                    ],
                                    [
                                        0.8,
                                        "#7fbc41"
                                    ],
                                    [
                                        0.9,
                                        "#4d9221"
                                    ],
                                    [
                                        1,
                                        "#276419"
                                    ]
                                ],
                                "sequential": [
                                    [
                                        0,
                                        "#0508b8"
                                    ],
                                    [
                                        0.0893854748603352,
                                        "#1910d8"
                                    ],
                                    [
                                        0.1787709497206704,
                                        "#3c19f0"
                                    ],
                                    [
                                        0.2681564245810056,
                                        "#6b1cfb"
                                    ],
                                    [
                                        0.3575418994413408,
                                        "#981cfd"
                                    ],
                                    [
                                        0.44692737430167595,
                                        "#bf1cfd"
                                    ],
                                    [
                                        0.5363128491620112,
                                        "#dd2bfd"
                                    ],
                                    [
                                        0.6256983240223464,
                                        "#f246fe"
                                    ],
                                    [
                                        0.7150837988826816,
                                        "#fc67fd"
                                    ],
                                    [
                                        0.8044692737430168,
                                        "#fe88fc"
                                    ],
                                    [
                                        0.8938547486033519,
                                        "#fea5fd"
                                    ],
                                    [
                                        0.9832402234636871,
                                        "#febefe"
                                    ],
                                    [
                                        1,
                                        "#fec3fe"
                                    ]
                                ],
                                "sequentialminus": [
                                    [
                                        0,
                                        "#0508b8"
                                    ],
                                    [
                                        0.0893854748603352,
                                        "#1910d8"
                                    ],
                                    [
                                        0.1787709497206704,
                                        "#3c19f0"
                                    ],
                                    [
                                        0.2681564245810056,
                                        "#6b1cfb"
                                    ],
                                    [
                                        0.3575418994413408,
                                        "#981cfd"
                                    ],
                                    [
                                        0.44692737430167595,
                                        "#bf1cfd"
                                    ],
                                    [
                                        0.5363128491620112,
                                        "#dd2bfd"
                                    ],
                                    [
                                        0.6256983240223464,
                                        "#f246fe"
                                    ],
                                    [
                                        0.7150837988826816,
                                        "#fc67fd"
                                    ],
                                    [
                                        0.8044692737430168,
                                        "#fe88fc"
                                    ],
                                    [
                                        0.8938547486033519,
                                        "#fea5fd"
                                    ],
                                    [
                                        0.9832402234636871,
                                        "#febefe"
                                    ],
                                    [
                                        1,
                                        "#fec3fe"
                                    ]
                                ]
                            },
                            "plot_bgcolor": "white",
                            "paper_bgcolor": "white",
                            "shapedefaults": {
                                "line": {
                                    "width": 0
                                },
                                "opacity": 0.4,
                                "fillcolor": "#506784"
                            },
                            "annotationdefaults": {
                                "arrowhead": 0,
                                "arrowcolor": "#506784",
                                "arrowwidth": 1
                            }
                        },
                        "themeRef": "PLOTLY_WHITE"
                    }
                }
            },
            "height": null,
            "width": null,
            "user": {
                "profile_url": "https://chart-studio.plotly.com/~MISISINGH",
                "avatar_url": "https://storage.googleapis.com/plotly-prod-profiles/59.jpg",
                "background_url": "https://storage.googleapis.com/plotly-prod-profiles/bg-13.jpg",
                "bio": "",
                "nickname": "",
                "website": "",
                "stream_tokens": null,
                "feature_set_id": null,
                "csrf_token": null,
                "date_joined": "2019-03-20 23:17:40",
                "mapbox_access_tokens": null,
                "has_password": null,
                "username": "MISISINGH",
                "email": null,
                "is_active": null,
                "readonly": null,
                "is_dash_creator": null,
                "dash_created_count": null,
                "is_chart_creator": null,
                "charts_created_count": null
            }
        },
        {
            "creation_time": "2019-03-21T00:01:19.737422Z",
            "comments": {
                "results": [],
                "count": 0
            },
            "parented": true,
            "embed_url": "https://chart-studio.plotly.com/~amper/61607.embed",
            "fid": "amper:61607",
            "filename": "03-20-19_ds-1596_alg-5421_param-1236_showamps-True-state_res-SEC",
            "filetype": "plot",
            "img_url": "https://storage.googleapis.com/plotly-prod-images/amper/61607/9_67ER64IK88R51PNHZCON6016WC1QHX.png",
            "image_urls": {
                "default": "https://storage.googleapis.com/plotly-prod-images/amper/61607/2_NLV5MA3PGG4R3IOG529OVQDULNUUIT.png",
                "block-thumb": "https://storage.googleapis.com/plotly-prod-images/amper/61607/8_0LFH4TDTN5SROMN87F0LASBHQOZ6NF.png",
                "list-thumb": "https://storage.googleapis.com/plotly-prod-images/amper/61607/9_67ER64IK88R51PNHZCON6016WC1QHX.png"
            },
            "api_urls": {
                "files": "https://api.plotly.com/v2/files/amper:61607",
                "plots": "https://api.plotly.com/v2/plots/amper:61607",
                "parent": "https://api.plotly.com/v2/folders/home?user=amper"
            },
            "owner": "amper",
            "parent": -1,
            "preview": "",
            "referencers": [],
            "references": [],
            "title": "03-20-19_ds-1596_alg-5421_param-1236_showamps-True-state_res-SEC",
            "views": 1,
            "web_url": "https://chart-studio.plotly.com/~amper/61607/_03-20-19-ds-1596-alg-5421-param-1236-showamps-true-state-res-sec/",
            "world_readable": true,
            "date_modified": "2019-03-21T00:01:20.885Z",
            "stars": {
                "results": [],
                "count": 0
            },
            "collaborators": {
                "results": [],
                "count": 0
            },
            "subfolder_count": null,
            "refresh_interval": null,
            "organize_view_url": "https://chart-studio.plotly.com/~amper/61607/",
            "current_user_permission": "read",
            "is_theme": null,
            "is_template": null,
            "autosize": true,
            "caption": "",
            "figure": {
                "data": [
                    {
                        "uid": "d0c99a28-a62e-48ed-ad46-c83fc99b9adf",
                        "mode": "lines",
                        "name": "Off",
                        "type": "scattergl",
                        "xsrc": "amper:61608:edd342",
                        "ysrc": "amper:61608:26fa32",
                        "marker": {
                            "line": {
                                "color": "rgb(248, 19, 0)",
                                "width": 1
                            },
                            "size": 1,
                            "color": "rgb(248, 19, 0)"
                        }
                    },
                    {
                        "uid": "3b5c747b-32b5-43e7-99d1-6060d2c4e352",
                        "mode": "lines",
                        "name": "Idle",
                        "type": "scattergl",
                        "xsrc": "amper:61608:edd342",
                        "ysrc": "amper:61608:e73090",
                        "marker": {
                            "line": {
                                "color": "rgb(255, 205, 0)",
                                "width": 1
                            },
                            "size": 1,
                            "color": "rgb(255, 205, 0)"
                        },
                        "connectgaps": false
                    },
                    {
                        "uid": "972751c1-b1d9-4af8-bcab-c64fa59cf50c",
                        "mode": "lines",
                        "name": "Production",
                        "type": "scattergl",
                        "xsrc": "amper:61608:edd342",
                        "ysrc": "amper:61608:42a62d",
                        "marker": {
                            "line": {
                                "color": "rgb(0, 166, 73)",
                                "width": 1
                            },
                            "size": 1,
                            "color": "rgb(0, 166, 73)"
                        },
                        "connectgaps": false
                    }
                ],
                "layout": {
                    "title": "03-20-19_ds-1596_alg-5421_param-1236_showamps-True-state_res-SEC"
                }
            },
            "height": null,
            "width": null,
            "user": {
                "profile_url": "https://chart-studio.plotly.com/~amper",
                "avatar_url": "https://storage.googleapis.com/plotly-prod-profiles/99.jpg",
                "background_url": "https://storage.googleapis.com/plotly-prod-profiles/bg-1.jpg",
                "bio": "",
                "nickname": "",
                "website": "",
                "stream_tokens": null,
                "feature_set_id": null,
                "csrf_token": null,
                "date_joined": "2017-03-17 16:47:16",
                "mapbox_access_tokens": null,
                "has_password": null,
                "username": "amper",
                "email": null,
                "is_active": null,
                "readonly": null,
                "is_dash_creator": null,
                "dash_created_count": null,
                "is_chart_creator": null,
                "charts_created_count": null
            }
        },
        {
            "creation_time": "2019-03-21T00:01:15.832508Z",
            "comments": {
                "results": [],
                "count": 0
            },
            "parented": true,
            "embed_url": "https://chart-studio.plotly.com/~chingyi071/35.embed",
            "fid": "chingyi071:35",
            "filename": "nonn-hetero-1",
            "filetype": "plot",
            "img_url": "https://storage.googleapis.com/plotly-prod-images/chingyi071/35/9_PISV2UDZPGAH7CQA2ZTFXRQ5E7B3BN.png",
            "image_urls": {
                "default": "https://storage.googleapis.com/plotly-prod-images/chingyi071/35/2_O4NUUELKW41S415TBEXBOSRS78HD06.png",
                "block-thumb": "https://storage.googleapis.com/plotly-prod-images/chingyi071/35/8_22TNCPAE6ZAIKFQAGVNE3G5N3IOKRD.png",
                "list-thumb": "https://storage.googleapis.com/plotly-prod-images/chingyi071/35/9_PISV2UDZPGAH7CQA2ZTFXRQ5E7B3BN.png"
            },
            "api_urls": {
                "files": "https://api.plotly.com/v2/files/chingyi071:35",
                "plots": "https://api.plotly.com/v2/plots/chingyi071:35",
                "parent": "https://api.plotly.com/v2/folders/home?user=chingyi071"
            },
            "owner": "chingyi071",
            "parent": -1,
            "preview": "",
            "referencers": [],
            "references": [],
            "title": "",
            "views": 1,
            "web_url": "https://chart-studio.plotly.com/~chingyi071/35/",
            "world_readable": true,
            "date_modified": "2019-03-21T01:46:08.022Z",
            "stars": {
                "results": [],
                "count": 0
            },
            "collaborators": {
                "results": [],
                "count": 0
            },
            "subfolder_count": null,
            "refresh_interval": null,
            "organize_view_url": "https://chart-studio.plotly.com/~chingyi071/35/",
            "current_user_permission": "read",
            "is_theme": null,
            "is_template": false,
            "autosize": true,
            "caption": "",
            "figure": {
                "data": [
                    {
                        "line": {
                            "color": "rgb(5, 13, 116)"
                        },
                        "mode": "markers+lines",
                        "name": "Total latency",
                        "type": "scatter",
                        "xsrc": "chingyi071:34:0df71a",
                        "ysrc": "chingyi071:34:db206c",
                        "fillcolor": "rgba(193, 193, 193, 0.5)",
                        "stackgroup": 1
                    },
                    {
                        "line": {
                            "dash": "dash",
                            "color": "rgb(204, 0, 0)"
                        },
                        "mode": "markers+lines",
                        "name": "MC1-comm",
                        "type": "scatter",
                        "xsrc": "chingyi071:34:0df71a",
                        "ysrc": "chingyi071:34:f388e6",
                        "error_x": {
                            "type": "percent",
                            "color": "#444",
                            "value": 10,
                            "width": 4,
                            "visible": false,
                            "symmetric": true,
                            "thickness": 2
                        },
                        "visible": true,
                        "orientation": "v"
                    },
                    {
                        "line": {
                            "color": "rgb(204, 0, 0)"
                        },
                        "mode": "markers+lines",
                        "name": "MC1-total",
                        "type": "scatter",
                        "xsrc": "chingyi071:34:0df71a",
                        "ysrc": "chingyi071:34:003c88",
                        "visible": true,
                        "orientation": "v"
                    },
                    {
                        "line": {
                            "dash": "dash",
                            "color": "rgb(59, 190, 59)"
                        },
                        "mode": "markers+lines",
                        "name": "RPi-comm",
                        "type": "scatter",
                        "xsrc": "chingyi071:34:ad6a51",
                        "ysrc": "chingyi071:34:4b9fc1",
                        "visible": true,
                        "stackgroup": null
                    },
                    {
                        "line": {
                            "color": "rgb(59, 190, 59)"
                        },
                        "mode": "markers+lines",
                        "name": "RPi-total",
                        "type": "scatter",
                        "xsrc": "chingyi071:34:ad6a51",
                        "ysrc": "chingyi071:34:997e14",
                        "visible": true,
                        "stackgroup": null
                    },
                    {
                        "line": {
                            "dash": "dash"
                        },
                        "mode": "markers+lines",
                        "name": "Avg latency",
                        "type": "scatter",
                        "xsrc": "chingyi071:34:0df71a",
                        "ysrc": "chingyi071:34:811382",
                        "marker": {
                            "color": "rgb(5, 13, 116)"
                        },
                        "stackgroup": null
                    }
                ],
                "frames": [],
                "layout": {
                    "title": {
                        "text": "Latency for Heterogeneous Configuration ( 1 n-stu MC1 + (8-n) 1-stu Raspberry )"
                    },
                    "xaxis": {
                        "type": "linear",
                        "range": [
                            0.5723308070735273,
                            8.427669192926473
                        ],
                        "title": {
                            "text": "Number of Students on Single MC1"
                        },
                        "autorange": true
                    },
                    "yaxis": {
                        "type": "linear",
                        "range": [
                            -6.592233990147781,
                            164.87823399014778
                        ],
                        "title": {
                            "text": "Latency (ms/frame)"
                        },
                        "autorange": true
                    },
                    "barmode": "group",
                    "autosize": true,
                    "dragmode": "select",
                    "template": {
                        "data": {
                            "bar": [
                                {
                                    "type": "bar",
                                    "marker": {
                                        "colorbar": {
                                            "ticks": "",
                                            "outlinewidth": 0
                                        }
                                    }
                                }
                            ],
                            "table": [
                                {
                                    "type": "table",
                                    "cells": {
                                        "fill": {
                                            "color": "#EBF0F8"
                                        },
                                        "line": {
                                            "color": "white"
                                        }
                                    },
                                    "header": {
                                        "fill": {
                                            "color": "#C8D4E3"
                                        },
                                        "line": {
                                            "color": "white"
                                        }
                                    }
                                }
                            ],
                            "carpet": [
                                {
                                    "type": "carpet",
                                    "aaxis": {
                                        "gridcolor": "#C8D4E3",
                                        "linecolor": "#C8D4E3",
                                        "endlinecolor": "#2a3f5f",
                                        "minorgridcolor": "#C8D4E3",
                                        "startlinecolor": "#2a3f5f"
                                    },
                                    "baxis": {
                                        "gridcolor": "#C8D4E3",
                                        "linecolor": "#C8D4E3",
                                        "endlinecolor": "#2a3f5f",
                                        "minorgridcolor": "#C8D4E3",
                                        "startlinecolor": "#2a3f5f"
                                    }
                                }
                            ],
                            "mesh3d": [
                                {
                                    "type": "mesh3d",
                                    "colorbar": {
                                        "ticks": "",
                                        "outlinewidth": 0
                                    }
                                }
                            ],
                            "contour": [
                                {
                                    "type": "contour",
                                    "colorbar": {
                                        "ticks": "",
                                        "outlinewidth": 0
                                    },
                                    "autocolorscale": true
                                }
                            ],
                            "heatmap": [
                                {
                                    "type": "heatmap",
                                    "colorbar": {
                                        "ticks": "",
                                        "outlinewidth": 0
                                    },
                                    "autocolorscale": true
                                }
                            ],
                            "scatter": [
                                {
                                    "type": "scatter",
                                    "marker": {
                                        "colorbar": {
                                            "ticks": "",
                                            "outlinewidth": 0
                                        }
                                    }
                                }
                            ],
                            "surface": [
                                {
                                    "type": "surface",
                                    "colorbar": {
                                        "ticks": "",
                                        "outlinewidth": 0
                                    }
                                }
                            ],
                            "heatmapgl": [
                                {
                                    "type": "heatmapgl",
                                    "colorbar": {
                                        "ticks": "",
                                        "outlinewidth": 0
                                    }
                                }
                            ],
                            "histogram": [
                                {
                                    "type": "histogram",
                                    "marker": {
                                        "colorbar": {
                                            "ticks": "",
                                            "outlinewidth": 0
                                        }
                                    }
                                }
                            ],
                            "parcoords": [
                                {
                                    "line": {
                                        "colorbar": {
                                            "ticks": "",
                                            "outlinewidth": 0
                                        }
                                    },
                                    "type": "parcoords"
                                }
                            ],
                            "scatter3d": [
                                {
                                    "type": "scatter3d",
                                    "marker": {
                                        "colorbar": {
                                            "ticks": "",
                                            "outlinewidth": 0
                                        }
                                    }
                                }
                            ],
                            "scattergl": [
                                {
                                    "type": "scattergl",
                                    "marker": {
                                        "colorbar": {
                                            "ticks": "",
                                            "outlinewidth": 0
                                        }
                                    }
                                }
                            ],
                            "choropleth": [
                                {
                                    "type": "choropleth",
                                    "colorbar": {
                                        "ticks": "",
                                        "outlinewidth": 0
                                    }
                                }
                            ],
                            "scattergeo": [
                                {
                                    "type": "scattergeo",
                                    "marker": {
                                        "colorbar": {
                                            "ticks": "",
                                            "outlinewidth": 0
                                        }
                                    }
                                }
                            ],
                            "histogram2d": [
                                {
                                    "type": "histogram2d",
                                    "colorbar": {
                                        "ticks": "",
                                        "outlinewidth": 0
                                    },
                                    "autocolorscale": true
                                }
                            ],
                            "scatterpolar": [
                                {
                                    "type": "scatterpolar",
                                    "marker": {
                                        "colorbar": {
                                            "ticks": "",
                                            "outlinewidth": 0
                                        }
                                    }
                                }
                            ],
                            "contourcarpet": [
                                {
                                    "type": "contourcarpet",
                                    "colorbar": {
                                        "ticks": "",
                                        "outlinewidth": 0
                                    }
                                }
                            ],
                            "scattercarpet": [
                                {
                                    "type": "scattercarpet",
                                    "marker": {
                                        "colorbar": {
                                            "ticks": "",
                                            "outlinewidth": 0
                                        }
                                    }
                                }
                            ],
                            "scattermapbox": [
                                {
                                    "type": "scattermapbox",
                                    "marker": {
                                        "colorbar": {
                                            "ticks": "",
                                            "outlinewidth": 0
                                        }
                                    }
                                }
                            ],
                            "scatterpolargl": [
                                {
                                    "type": "scatterpolargl",
                                    "marker": {
                                        "colorbar": {
                                            "ticks": "",
                                            "outlinewidth": 0
                                        }
                                    }
                                }
                            ],
                            "scatterternary": [
                                {
                                    "type": "scatterternary",
                                    "marker": {
                                        "colorbar": {
                                            "ticks": "",
                                            "outlinewidth": 0
                                        }
                                    }
                                }
                            ],
                            "histogram2dcontour": [
                                {
                                    "type": "histogram2dcontour",
                                    "colorbar": {
                                        "ticks": "",
                                        "outlinewidth": 0
                                    },
                                    "autocolorscale": true
                                }
                            ]
                        },
                        "layout": {
                            "geo": {
                                "bgcolor": "white",
                                "showland": true,
                                "lakecolor": "white",
                                "landcolor": "white",
                                "showlakes": true,
                                "subunitcolor": "#C8D4E3"
                            },
                            "font": {
                                "color": "#2a3f5f"
                            },
                            "polar": {
                                "bgcolor": "white",
                                "radialaxis": {
                                    "ticks": "",
                                    "gridcolor": "#EBF0F8",
                                    "linecolor": "#EBF0F8"
                                },
                                "angularaxis": {
                                    "ticks": "",
                                    "gridcolor": "#EBF0F8",
                                    "linecolor": "#EBF0F8"
                                }
                            },
                            "scene": {
                                "xaxis": {
                                    "ticks": "",
                                    "gridcolor": "#DFE8F3",
                                    "gridwidth": 2,
                                    "linecolor": "#EBF0F8",
                                    "zerolinecolor": "#EBF0F8",
                                    "showbackground": true,
                                    "backgroundcolor": "white"
                                },
                                "yaxis": {
                                    "ticks": "",
                                    "gridcolor": "#DFE8F3",
                                    "gridwidth": 2,
                                    "linecolor": "#EBF0F8",
                                    "zerolinecolor": "#EBF0F8",
                                    "showbackground": true,
                                    "backgroundcolor": "white"
                                },
                                "zaxis": {
                                    "ticks": "",
                                    "gridcolor": "#DFE8F3",
                                    "gridwidth": 2,
                                    "linecolor": "#EBF0F8",
                                    "zerolinecolor": "#EBF0F8",
                                    "showbackground": true,
                                    "backgroundcolor": "white"
                                }
                            },
                            "title": {
                                "x": 0.05
                            },
                            "xaxis": {
                                "ticks": "",
                                "gridcolor": "#EBF0F8",
                                "linecolor": "#EBF0F8",
                                "automargin": true,
                                "zerolinecolor": "#EBF0F8",
                                "zerolinewidth": 2
                            },
                            "yaxis": {
                                "ticks": "",
                                "gridcolor": "#EBF0F8",
                                "linecolor": "#EBF0F8",
                                "automargin": true,
                                "zerolinecolor": "#EBF0F8",
                                "zerolinewidth": 2
                            },
                            "ternary": {
                                "aaxis": {
                                    "ticks": "",
                                    "gridcolor": "#DFE8F3",
                                    "linecolor": "#A2B1C6"
                                },
                                "baxis": {
                                    "ticks": "",
                                    "gridcolor": "#DFE8F3",
                                    "linecolor": "#A2B1C6"
                                },
                                "caxis": {
                                    "ticks": "",
                                    "gridcolor": "#DFE8F3",
                                    "linecolor": "#A2B1C6"
                                },
                                "bgcolor": "white"
                            },
                            "colorway": [
                                "#636efa",
                                "#EF553B",
                                "#00cc96",
                                "#ab63fa",
                                "#19d3f3",
                                "#e763fa",
                                "#fecb52",
                                "#ffa15a",
                                "#ff6692",
                                "#b6e880"
                            ],
                            "hovermode": "closest",
                            "colorscale": {
                                "diverging": [
                                    [
                                        0,
                                        "#8e0152"
                                    ],
                                    [
                                        0.1,
                                        "#c51b7d"
                                    ],
                                    [
                                        0.2,
                                        "#de77ae"
                                    ],
                                    [
                                        0.3,
                                        "#f1b6da"
                                    ],
                                    [
                                        0.4,
                                        "#fde0ef"
                                    ],
                                    [
                                        0.5,
                                        "#f7f7f7"
                                    ],
                                    [
                                        0.6,
                                        "#e6f5d0"
                                    ],
                                    [
                                        0.7,
                                        "#b8e186"
                                    ],
                                    [
                                        0.8,
                                        "#7fbc41"
                                    ],
                                    [
                                        0.9,
                                        "#4d9221"
                                    ],
                                    [
                                        1,
                                        "#276419"
                                    ]
                                ],
                                "sequential": [
                                    [
                                        0,
                                        "#0508b8"
                                    ],
                                    [
                                        0.0893854748603352,
                                        "#1910d8"
                                    ],
                                    [
                                        0.1787709497206704,
                                        "#3c19f0"
                                    ],
                                    [
                                        0.2681564245810056,
                                        "#6b1cfb"
                                    ],
                                    [
                                        0.3575418994413408,
                                        "#981cfd"
                                    ],
                                    [
                                        0.44692737430167595,
                                        "#bf1cfd"
                                    ],
                                    [
                                        0.5363128491620112,
                                        "#dd2bfd"
                                    ],
                                    [
                                        0.6256983240223464,
                                        "#f246fe"
                                    ],
                                    [
                                        0.7150837988826816,
                                        "#fc67fd"
                                    ],
                                    [
                                        0.8044692737430168,
                                        "#fe88fc"
                                    ],
                                    [
                                        0.8938547486033519,
                                        "#fea5fd"
                                    ],
                                    [
                                        0.9832402234636871,
                                        "#febefe"
                                    ],
                                    [
                                        1,
                                        "#fec3fe"
                                    ]
                                ],
                                "sequentialminus": [
                                    [
                                        0,
                                        "#0508b8"
                                    ],
                                    [
                                        0.0893854748603352,
                                        "#1910d8"
                                    ],
                                    [
                                        0.1787709497206704,
                                        "#3c19f0"
                                    ],
                                    [
                                        0.2681564245810056,
                                        "#6b1cfb"
                                    ],
                                    [
                                        0.3575418994413408,
                                        "#981cfd"
                                    ],
                                    [
                                        0.44692737430167595,
                                        "#bf1cfd"
                                    ],
                                    [
                                        0.5363128491620112,
                                        "#dd2bfd"
                                    ],
                                    [
                                        0.6256983240223464,
                                        "#f246fe"
                                    ],
                                    [
                                        0.7150837988826816,
                                        "#fc67fd"
                                    ],
                                    [
                                        0.8044692737430168,
                                        "#fe88fc"
                                    ],
                                    [
                                        0.8938547486033519,
                                        "#fea5fd"
                                    ],
                                    [
                                        0.9832402234636871,
                                        "#febefe"
                                    ],
                                    [
                                        1,
                                        "#fec3fe"
                                    ]
                                ]
                            },
                            "plot_bgcolor": "white",
                            "paper_bgcolor": "white",
                            "shapedefaults": {
                                "line": {
                                    "width": 0
                                },
                                "opacity": 0.4,
                                "fillcolor": "#506784"
                            },
                            "annotationdefaults": {
                                "arrowhead": 0,
                                "arrowcolor": "#506784",
                                "arrowwidth": 1
                            }
                        },
                        "themeRef": "PLOTLY_WHITE"
                    }
                }
            },
            "height": null,
            "width": null,
            "user": {
                "profile_url": "https://chart-studio.plotly.com/~chingyi071",
                "avatar_url": "https://storage.googleapis.com/plotly-prod-profiles/85.jpg",
                "background_url": "https://storage.googleapis.com/plotly-prod-profiles/bg-14.jpg",
                "bio": "",
                "nickname": "",
                "website": "",
                "stream_tokens": null,
                "feature_set_id": null,
                "csrf_token": null,
                "date_joined": "2018-09-28 20:42:13",
                "mapbox_access_tokens": null,
                "has_password": null,
                "username": "chingyi071",
                "email": null,
                "is_active": null,
                "readonly": null,
                "is_dash_creator": null,
                "dash_created_count": null,
                "is_chart_creator": null,
                "charts_created_count": null
            }
        },
        {
            "creation_time": "2019-03-21T00:00:47.778170Z",
            "comments": {
                "results": [],
                "count": 0
            },
            "parented": true,
            "embed_url": "https://chart-studio.plotly.com/~amper/61605.embed",
            "fid": "amper:61605",
            "filename": "03-20-19_ds-1595_alg-5421_param-1235_showamps-True-state_res-SEC",
            "filetype": "plot",
            "img_url": "https://storage.googleapis.com/plotly-prod-images/amper/61605/9_QTIGNM7KTE16L4C9D9URUMQRGT2VZR.png",
            "image_urls": {
                "default": "https://storage.googleapis.com/plotly-prod-images/amper/61605/2_3YRJAHRMOCBUPZD6RRRH62JTU59V2U.png",
                "block-thumb": "https://api.plotly.com/v2/files/amper:61605/image?image_name=block-thumb",
                "list-thumb": "https://storage.googleapis.com/plotly-prod-images/amper/61605/9_QTIGNM7KTE16L4C9D9URUMQRGT2VZR.png"
            },
            "api_urls": {
                "files": "https://api.plotly.com/v2/files/amper:61605",
                "plots": "https://api.plotly.com/v2/plots/amper:61605",
                "parent": "https://api.plotly.com/v2/folders/home?user=amper"
            },
            "owner": "amper",
            "parent": -1,
            "preview": "",
            "referencers": [],
            "references": [],
            "title": "03-20-19_ds-1595_alg-5421_param-1235_showamps-True-state_res-SEC",
            "views": 2,
            "web_url": "https://chart-studio.plotly.com/~amper/61605/_03-20-19-ds-1595-alg-5421-param-1235-showamps-true-state-res-sec/",
            "world_readable": true,
            "date_modified": "2019-03-21T00:00:49.021Z",
            "stars": {
                "results": [],
                "count": 0
            },
            "collaborators": {
                "results": [],
                "count": 0
            },
            "subfolder_count": null,
            "refresh_interval": null,
            "organize_view_url": "https://chart-studio.plotly.com/~amper/61605/",
            "current_user_permission": "read",
            "is_theme": null,
            "is_template": null,
            "autosize": true,
            "caption": "",
            "figure": {
                "data": [
                    {
                        "uid": "e58d9988-0165-40b7-8f8b-ac1422932307",
                        "mode": "lines",
                        "name": "Idle",
                        "type": "scattergl",
                        "xsrc": "amper:61606:60aa49",
                        "ysrc": "amper:61606:9b6a18",
                        "marker": {
                            "line": {
                                "color": "rgb(255, 205, 0)",
                                "width": 1
                            },
                            "size": 1,
                            "color": "rgb(255, 205, 0)"
                        },
                        "connectgaps": false
                    },
                    {
                        "uid": "69431c74-f1d1-4a7e-9d27-cfe99f4ba87d",
                        "mode": "lines",
                        "name": "Production",
                        "type": "scattergl",
                        "xsrc": "amper:61606:60aa49",
                        "ysrc": "amper:61606:b224ac",
                        "marker": {
                            "line": {
                                "color": "rgb(0, 166, 73)",
                                "width": 1
                            },
                            "size": 1,
                            "color": "rgb(0, 166, 73)"
                        },
                        "connectgaps": false
                    }
                ],
                "layout": {
                    "title": "03-20-19_ds-1595_alg-5421_param-1235_showamps-True-state_res-SEC"
                }
            },
            "height": null,
            "width": null,
            "user": {
                "profile_url": "https://chart-studio.plotly.com/~amper",
                "avatar_url": "https://storage.googleapis.com/plotly-prod-profiles/99.jpg",
                "background_url": "https://storage.googleapis.com/plotly-prod-profiles/bg-1.jpg",
                "bio": "",
                "nickname": "",
                "website": "",
                "stream_tokens": null,
                "feature_set_id": null,
                "csrf_token": null,
                "date_joined": "2017-03-17 16:47:16",
                "mapbox_access_tokens": null,
                "has_password": null,
                "username": "amper",
                "email": null,
                "is_active": null,
                "readonly": null,
                "is_dash_creator": null,
                "dash_created_count": null,
                "is_chart_creator": null,
                "charts_created_count": null
            }
        },
        {
            "creation_time": "2019-03-21T00:00:37.297457Z",
            "comments": {
                "results": [],
                "count": 0
            },
            "parented": true,
            "embed_url": "https://chart-studio.plotly.com/~nirajdevpandey/4.embed",
            "fid": "nirajdevpandey:4",
            "filename": "plot from API (2)",
            "filetype": "plot",
            "img_url": "https://storage.googleapis.com/plotly-prod-images/nirajdevpandey/4/9_IYNLS8LZZQLC89NNTDDGDTM7Q7GR2X.png",
            "image_urls": {
                "default": "https://storage.googleapis.com/plotly-prod-images/nirajdevpandey/4/2_ZL2281F4YU25GWAT2SCZL8R982RDQQ.png",
                "block-thumb": "https://storage.googleapis.com/plotly-prod-images/nirajdevpandey/4/8_9NM4NNEQMUIJM3AXVRWE1VITMW0R82.png",
                "list-thumb": "https://storage.googleapis.com/plotly-prod-images/nirajdevpandey/4/9_IYNLS8LZZQLC89NNTDDGDTM7Q7GR2X.png"
            },
            "api_urls": {
                "files": "https://api.plotly.com/v2/files/nirajdevpandey:4",
                "plots": "https://api.plotly.com/v2/plots/nirajdevpandey:4",
                "parent": "https://api.plotly.com/v2/folders/home?user=nirajdevpandey"
            },
            "owner": "nirajdevpandey",
            "parent": -1,
            "preview": "",
            "referencers": [],
            "references": [],
            "title": "Training Points",
            "views": 3,
            "web_url": "https://chart-studio.plotly.com/~nirajdevpandey/4/training-points/",
            "world_readable": true,
            "date_modified": "2019-03-21T00:00:37.807Z",
            "stars": {
                "results": [],
                "count": 0
            },
            "collaborators": {
                "results": [],
                "count": 0
            },
            "subfolder_count": null,
            "refresh_interval": null,
            "organize_view_url": "https://chart-studio.plotly.com/~nirajdevpandey/4/",
            "current_user_permission": "read",
            "is_theme": null,
            "is_template": null,
            "autosize": true,
            "caption": "",
            "figure": {
                "data": [
                    {
                        "uid": "8b6f7c68-6b9a-4278-aa18-23a0423e53c7",
                        "mode": "markers",
                        "type": "scatter",
                        "xsrc": "nirajdevpandey:5:dd6d00",
                        "ysrc": "nirajdevpandey:5:2d056a",
                        "marker": {
                            "size": 10,
                            "colorsrc": "nirajdevpandey:5:d89e74",
                            "showscale": false,
                            "colorscale": "Viridis"
                        }
                    }
                ],
                "layout": {
                    "title": {
                        "text": "Training Points"
                    },
                    "xaxis": {
                        "title": {
                            "text": "Sepal length"
                        },
                        "showgrid": false
                    },
                    "yaxis": {
                        "title": {
                            "text": "Sepal width"
                        },
                        "showgrid": false
                    }
                }
            },
            "height": null,
            "width": null,
            "user": {
                "profile_url": "https://chart-studio.plotly.com/~nirajdevpandey",
                "avatar_url": "https://storage.googleapis.com/plotly-prod-profiles/75.jpg",
                "background_url": "https://storage.googleapis.com/plotly-prod-profiles/bg-8.jpg",
                "bio": "",
                "nickname": "",
                "website": "",
                "stream_tokens": null,
                "feature_set_id": null,
                "csrf_token": null,
                "date_joined": "2019-03-20 23:12:23",
                "mapbox_access_tokens": null,
                "has_password": null,
                "username": "nirajdevpandey",
                "email": null,
                "is_active": null,
                "readonly": null,
                "is_dash_creator": null,
                "dash_created_count": null,
                "is_chart_creator": null,
                "charts_created_count": null
            }
        }
    ]
}