Plots List
Plots
This endpoint handles manipulation of Plotly plot files.
Reference
Authorization
Any user with or without a Plotly account may view public plots. For private plots, see authentication.
Actions
list
Listing all public plots can be done via a GET request to this endpoint.
By default, plots will be listed in order of date created. The order_by
query parameter is accepted at this endpoint. Currently, only ordering by
views is supported. It is possible to filter the plots by quality
with min_quality or max_quality as query parameter.
Example:
// GET https://api.plotly.com/v2/plots/ ---> 200

// GET https://api.plotly.com/v2/plots/?order_by=-views ---> 200

// GET https://api.plotly.com/v2/plots/?min_quality=5 ---> 200

// GET https://api.plotly.com/v2/plots/?max_quality=5 ---> 200
feed
Listing all handpicked feed plots can be done via a GET request to this endpoint. By default, plots will be listed in a random order.
Example:
// GET https://api.plotly.com/v2/plots/feed ---> 200
create
You can create new plot resources here. The only required field is 'figure'. Currently, the figure is restricted to only contain references to grid data. That is, this will fail if raw data arrays are passed in. To create and manipulate underlying grids for plots, see the grids endpoint.
Example:
// This fails because a figure field is required.
// POST https://api.plotly.com/v2/plots ---> 400 Bad Request
{}

// This fails because the figure has raw data
//POST https://api.plotly.com/v2/plots ---> 400 Bad Request
{
    "figure": {"data": [{"y": ['this', 'is', 'raw', 'data']}]}
}

// This succeeds because the figure has src keys, not raw data.
//POST https://api.plotly.com/v2/plots ---> 200 OK
{
    "figure": {"data": [{"ysrc": "sven:88:u8nd62"}]}
}
When creating a grid, you can optionally specify a source_fid to specify where a plot has come from:
- source_fid: the fid of a plot that was copied (and presumably edited) to produce this one
detail
There is a lot of meta information stored about plot files including filename, title, share_url, and content_url to name a few.
This information can only be reached with a GET to this endpoint.
Example:
// GET https://api.plotly.com/v2/plots/iheartgraphs:90
content
The contents of a plot can be downloaded via the content resource. The plot
content contains referenced grid/column data by default. If you wish to
return the raw grid/column data, the inline_data=true query must be included
in the request url. The Content-Type header will be appropriately set for the
response body.
Alternatively, you can set ?map_data=unreadable to append a mapping of
sources to data that belongs to grids which are unreadable for the
requestor. This is useful when you have read access to another users plot,
but that plot contains grid references which you don't have access to.
Examples:
// Returns referenced grid/column data
// GET https://api.plotly.com/v2/plots/iheartgraphs:90/content ---> 200 OK

// Returns full grid/column data
// GET https://api.plotly.com/v2/plots/iheartgraphs:90/content?inline_data=true ---> 200 OK

// Returns full grid/column data when requestor doesn't have permission
// to read the referenced grid.
// GET https://api.plotly.com/v2/plots/iheartgraphs:90/content?map_data=unreadable ---> 200 OK
GET /v2/plots?cursor=cD0yMDE5LTAzLTIwKzE5JTNBNDIlM0EwMS43MTA5NDclMkIwMCUzQTAw&format=api
{ "next": "https://api.plot.ly/v2/plots?cursor=cD0yMDE5LTAzLTIwKzE5JTNBMzQlM0EwNi4wMTEwODElMkIwMCUzQTAw&format=api", "previous": "https://api.plot.ly/v2/plots?cursor=cj0xJnA9MjAxOS0wMy0yMCsxOSUzQTQxJTNBNDIuMTc5ODc4JTJCMDAlM0EwMA%3D%3D&format=api", "results": [ { "creation_time": "2019-03-20T19:41:42.179878Z", "comments": { "results": [], "count": 0 }, "parented": true, "embed_url": "https://chart-studio.plotly.com/~tuvasr/1.embed", "fid": "tuvasr:1", "filename": "Plot 1", "filetype": "plot", "img_url": "https://api.plotly.com/v2/files/tuvasr:1/image?image_name=list-thumb", "image_urls": { "default": "https://api.plotly.com/v2/files/tuvasr:1/image?image_name=default", "block-thumb": "https://api.plotly.com/v2/files/tuvasr:1/image?image_name=block-thumb", "list-thumb": "https://api.plotly.com/v2/files/tuvasr:1/image?image_name=list-thumb" }, "api_urls": { "files": "https://api.plotly.com/v2/files/tuvasr:1", "plots": "https://api.plotly.com/v2/plots/tuvasr:1", "parent": "https://api.plotly.com/v2/folders/home?user=tuvasr" }, "owner": "tuvasr", "parent": -1, "preview": "", "referencers": [], "references": [], "title": "", "views": 1, "web_url": "https://chart-studio.plotly.com/~tuvasr/1/", "world_readable": true, "date_modified": "2019-03-20T19:43:05.592Z", "stars": { "results": [], "count": 0 }, "collaborators": { "results": [], "count": 0 }, "subfolder_count": null, "refresh_interval": null, "organize_view_url": "https://chart-studio.plotly.com/~tuvasr/1/", "current_user_permission": "read", "is_theme": null, "is_template": false, "autosize": true, "caption": "", "figure": { "data": [ { "mode": "markers", "type": "box", "ysrc": "tuvasr:0:213a4d", "boxpoints": false, "orientation": "v" } ], "frames": [], "layout": { "xaxis": { "type": "category", "range": [ -0.0784313725490196, -0.05269607843137253 ], "autorange": false }, "yaxis": { "type": "linear", "range": [ 25.395076784101175, 34.22886178861789 ], "autorange": false }, "autosize": true, "template": { "data": { "bar": [ { "type": "bar", "marker": { "colorbar": { "ticks": "", "outlinewidth": 0 } } } ], "table": [ { "type": "table", "cells": { "fill": { "color": "#EBF0F8" }, "line": { "color": "white" } }, "header": { "fill": { "color": "#C8D4E3" }, "line": { "color": "white" } } } ], "carpet": [ { "type": "carpet", "aaxis": { "gridcolor": "#C8D4E3", "linecolor": "#C8D4E3", "endlinecolor": "#2a3f5f", "minorgridcolor": "#C8D4E3", "startlinecolor": "#2a3f5f" }, "baxis": { "gridcolor": "#C8D4E3", "linecolor": "#C8D4E3", "endlinecolor": "#2a3f5f", "minorgridcolor": "#C8D4E3", "startlinecolor": "#2a3f5f" } } ], "mesh3d": [ { "type": "mesh3d", "colorbar": { "ticks": "", "outlinewidth": 0 } } ], "contour": [ { "type": "contour", "colorbar": { "ticks": "", "outlinewidth": 0 }, "autocolorscale": true } ], "heatmap": [ { "type": "heatmap", "colorbar": { "ticks": "", "outlinewidth": 0 }, "autocolorscale": true } ], "scatter": [ { "type": "scatter", "marker": { "colorbar": { "ticks": "", "outlinewidth": 0 } } } ], "surface": [ { "type": "surface", "colorbar": { "ticks": "", "outlinewidth": 0 } } ], "heatmapgl": [ { "type": "heatmapgl", "colorbar": { "ticks": "", "outlinewidth": 0 } } ], "histogram": [ { "type": "histogram", "marker": { "colorbar": { "ticks": "", "outlinewidth": 0 } } } ], "parcoords": [ { "line": { "colorbar": { "ticks": "", "outlinewidth": 0 } }, "type": "parcoords" } ], "scatter3d": [ { "type": "scatter3d", "marker": { "colorbar": { "ticks": "", "outlinewidth": 0 } } } ], "scattergl": [ { "type": "scattergl", "marker": { "colorbar": { "ticks": "", "outlinewidth": 0 } } } ], "choropleth": [ { "type": "choropleth", "colorbar": { "ticks": "", "outlinewidth": 0 } } ], "scattergeo": [ { "type": "scattergeo", "marker": { "colorbar": { "ticks": "", "outlinewidth": 0 } } } ], "histogram2d": [ { "type": "histogram2d", "colorbar": { "ticks": "", "outlinewidth": 0 }, "autocolorscale": true } ], "scatterpolar": [ { "type": "scatterpolar", "marker": { "colorbar": { "ticks": "", "outlinewidth": 0 } } } ], "contourcarpet": [ { "type": "contourcarpet", "colorbar": { "ticks": "", "outlinewidth": 0 } } ], "scattercarpet": [ { "type": "scattercarpet", "marker": { "colorbar": { "ticks": "", "outlinewidth": 0 } } } ], "scattermapbox": [ { "type": "scattermapbox", "marker": { "colorbar": { "ticks": "", "outlinewidth": 0 } } } ], "scatterpolargl": [ { "type": "scatterpolargl", "marker": { "colorbar": { "ticks": "", "outlinewidth": 0 } } } ], "scatterternary": [ { "type": "scatterternary", "marker": { "colorbar": { "ticks": "", "outlinewidth": 0 } } } ], "histogram2dcontour": [ { "type": "histogram2dcontour", "colorbar": { "ticks": "", "outlinewidth": 0 }, "autocolorscale": true } ] }, "layout": { "geo": { "bgcolor": "white", "showland": true, "lakecolor": "white", "landcolor": "white", "showlakes": true, "subunitcolor": "#C8D4E3" }, "font": { "color": "#2a3f5f" }, "polar": { "bgcolor": "white", "radialaxis": { "ticks": "", "gridcolor": "#EBF0F8", "linecolor": "#EBF0F8" }, "angularaxis": { "ticks": "", "gridcolor": "#EBF0F8", "linecolor": "#EBF0F8" } }, "scene": { "xaxis": { "ticks": "", "gridcolor": "#DFE8F3", "gridwidth": 2, "linecolor": "#EBF0F8", "zerolinecolor": "#EBF0F8", "showbackground": true, "backgroundcolor": "white" }, "yaxis": { "ticks": "", "gridcolor": "#DFE8F3", "gridwidth": 2, "linecolor": "#EBF0F8", "zerolinecolor": "#EBF0F8", "showbackground": true, "backgroundcolor": "white" }, "zaxis": { "ticks": "", "gridcolor": "#DFE8F3", "gridwidth": 2, "linecolor": "#EBF0F8", "zerolinecolor": "#EBF0F8", "showbackground": true, "backgroundcolor": "white" } }, "title": { "x": 0.05 }, "xaxis": { "ticks": "", "gridcolor": "#EBF0F8", "linecolor": "#EBF0F8", "automargin": true, "zerolinecolor": "#EBF0F8", "zerolinewidth": 2 }, "yaxis": { "ticks": "", "gridcolor": "#EBF0F8", "linecolor": "#EBF0F8", "automargin": true, "zerolinecolor": "#EBF0F8", "zerolinewidth": 2 }, "ternary": { "aaxis": { "ticks": "", "gridcolor": "#DFE8F3", "linecolor": "#A2B1C6" }, "baxis": { "ticks": "", "gridcolor": "#DFE8F3", "linecolor": "#A2B1C6" }, "caxis": { "ticks": "", "gridcolor": "#DFE8F3", "linecolor": "#A2B1C6" }, "bgcolor": "white" }, "colorway": [ "#636efa", "#EF553B", "#00cc96", "#ab63fa", "#19d3f3", "#e763fa", "#fecb52", "#ffa15a", "#ff6692", "#b6e880" ], "hovermode": "closest", "colorscale": { "diverging": [ [ 0, "#8e0152" ], [ 0.1, "#c51b7d" ], [ 0.2, "#de77ae" ], [ 0.3, "#f1b6da" ], [ 0.4, "#fde0ef" ], [ 0.5, "#f7f7f7" ], [ 0.6, "#e6f5d0" ], [ 0.7, "#b8e186" ], [ 0.8, "#7fbc41" ], [ 0.9, "#4d9221" ], [ 1, "#276419" ] ], "sequential": [ [ 0, "#0508b8" ], [ 0.0893854748603352, "#1910d8" ], [ 0.1787709497206704, "#3c19f0" ], [ 0.2681564245810056, "#6b1cfb" ], [ 0.3575418994413408, "#981cfd" ], [ 0.44692737430167595, "#bf1cfd" ], [ 0.5363128491620112, "#dd2bfd" ], [ 0.6256983240223464, "#f246fe" ], [ 0.7150837988826816, "#fc67fd" ], [ 0.8044692737430168, "#fe88fc" ], [ 0.8938547486033519, "#fea5fd" ], [ 0.9832402234636871, "#febefe" ], [ 1, "#fec3fe" ] ], "sequentialminus": [ [ 0, "#0508b8" ], [ 0.0893854748603352, "#1910d8" ], [ 0.1787709497206704, "#3c19f0" ], [ 0.2681564245810056, "#6b1cfb" ], [ 0.3575418994413408, "#981cfd" ], [ 0.44692737430167595, "#bf1cfd" ], [ 0.5363128491620112, "#dd2bfd" ], [ 0.6256983240223464, "#f246fe" ], [ 0.7150837988826816, "#fc67fd" ], [ 0.8044692737430168, "#fe88fc" ], [ 0.8938547486033519, "#fea5fd" ], [ 0.9832402234636871, "#febefe" ], [ 1, "#fec3fe" ] ] }, "plot_bgcolor": "white", "paper_bgcolor": "white", "shapedefaults": { "line": { "width": 0 }, "opacity": 0.4, "fillcolor": "#506784" }, "annotationdefaults": { "arrowhead": 0, "arrowcolor": "#506784", "arrowwidth": 1 } }, "themeRef": "PLOTLY_WHITE" } } }, "height": null, "width": null, "user": { "profile_url": "https://chart-studio.plotly.com/~tuvasr", "avatar_url": "https://storage.googleapis.com/plotly-prod-profiles/83.jpg", "background_url": "https://storage.googleapis.com/plotly-prod-profiles/bg-11.jpg", "bio": "", "nickname": "", "website": "", "stream_tokens": null, "feature_set_id": null, "csrf_token": null, "date_joined": "2019-03-20 19:41:00", "mapbox_access_tokens": null, "has_password": null, "username": "tuvasr", "email": null, "is_active": null, "readonly": null, "is_dash_creator": null, "dash_created_count": null, "is_chart_creator": null, "charts_created_count": null } }, { "creation_time": "2019-03-20T19:41:39.172898Z", "comments": { "results": [], "count": 0 }, "parented": true, "embed_url": "https://chart-studio.plotly.com/~konradbartczak/0.embed", "fid": "konradbartczak:0", "filename": "sample-data-table", "filetype": "plot", "img_url": "https://api.plotly.com/v2/files/konradbartczak:0/image?image_name=list-thumb", "image_urls": { "default": "https://api.plotly.com/v2/files/konradbartczak:0/image?image_name=default", "block-thumb": "https://storage.googleapis.com/plotly-prod-images/konradbartczak/0/8_3W00BVQ41T388TXOR32I8JFD3TMWSL.png", "list-thumb": "https://api.plotly.com/v2/files/konradbartczak:0/image?image_name=list-thumb" }, "api_urls": { "files": "https://api.plotly.com/v2/files/konradbartczak:0", "plots": "https://api.plotly.com/v2/plots/konradbartczak:0", "parent": "https://api.plotly.com/v2/folders/home?user=konradbartczak" }, "owner": "konradbartczak", "parent": -1, "preview": "", "referencers": [], "references": [], "title": "", "views": 0, "web_url": "https://chart-studio.plotly.com/~konradbartczak/0/", "world_readable": true, "date_modified": "2019-03-20T20:01:40.792Z", "stars": { "results": [], "count": 0 }, "collaborators": { "results": [], "count": 0 }, "subfolder_count": null, "refresh_interval": null, "organize_view_url": "https://chart-studio.plotly.com/~konradbartczak/0/", "current_user_permission": "read", "is_theme": null, "is_template": null, "autosize": true, "caption": "", "figure": { "data": [ { "uid": "b50ed571-4e0c-437c-b00c-57cd28558e2a", "type": "heatmap", "zsrc": "konradbartczak:1:", "opacity": 0.75, "hoverinfo": "none", "showscale": false, "colorscale": [ [ 0, "#00083e" ], [ 0.5, "#ededee" ], [ 1, "#ffffff" ] ] } ], "layout": { "xaxis": { "dtick": 1, "tick0": -0.5, "ticks": "", "zeroline": false, "gridwidth": 2, "showticklabels": false }, "yaxis": { "dtick": 1, "tick0": 0.5, "ticks": "", "zeroline": false, "autorange": "reversed", "gridwidth": 2, "showticklabels": false }, "height": 230, "margin": { "b": 0, "l": 0, "r": 0, "t": 0 }, "annotations": [ { "x": -0.45, "y": 0, "font": { "color": "#ffffff" }, "text": "<b>Number</b>", "xref": "x", "yref": "y", "align": "left", "xanchor": "left", "showarrow": false }, { "x": 0.55, "y": 0, "font": { "color": "#ffffff" }, "text": "<b>Borehole</b>", "xref": "x", "yref": "y", "align": "left", "xanchor": "left", "showarrow": false }, { "x": 1.55, "y": 0, "font": { "color": "#ffffff" }, "text": "<b>Layer</b>", "xref": "x", "yref": "y", "align": "left", "xanchor": "left", "showarrow": false }, { "x": 2.55, "y": 0, "font": { "color": "#ffffff" }, "text": "<b>MinDep</b>", "xref": "x", "yref": "y", "align": "left", "xanchor": "left", "showarrow": false }, { "x": 3.55, "y": 0, "font": { "color": "#ffffff" }, "text": "<b>MaxDep</b>", "xref": "x", "yref": "y", "align": "left", "xanchor": "left", "showarrow": false }, { "x": 4.55, "y": 0, "font": { "color": "#ffffff" }, "text": "<b>Depth</b>", "xref": "x", "yref": "y", "align": "left", "xanchor": "left", "showarrow": false }, { "x": 5.55, "y": 0, "font": { "color": "#ffffff" }, "text": "<b>Ep</b>", "xref": "x", "yref": "y", "align": "left", "xanchor": "left", "showarrow": false }, { "x": 6.55, "y": 0, "font": { "color": "#ffffff" }, "text": "<b>Er</b>", "xref": "x", "yref": "y", "align": "left", "xanchor": "left", "showarrow": false }, { "x": 7.55, "y": 0, "font": { "color": "#ffffff" }, "text": "<b>MP</b>", "xref": "x", "yref": "y", "align": "left", "xanchor": "left", "showarrow": false }, { "x": 8.55, "y": 0, "font": { "color": "#ffffff" }, "text": "<b>LL</b>", "xref": "x", "yref": "y", "align": "left", "xanchor": "left", "showarrow": false }, { "x": 9.55, "y": 0, "font": { "color": "#ffffff" }, "text": "<b>PL</b>", "xref": "x", "yref": "y", "align": "left", "xanchor": "left", "showarrow": false }, { "x": 10.55, "y": 0, "font": { "color": "#ffffff" }, "text": "<b>PI</b>", "xref": "x", "yref": "y", "align": "left", "xanchor": "left", "showarrow": false }, { "x": 11.55, "y": 0, "font": { "color": "#ffffff" }, "text": "<b>WC</b>", "xref": "x", "yref": "y", "align": "left", "xanchor": "left", "showarrow": false }, { "x": 12.55, "y": 0, "font": { "color": "#ffffff" }, "text": "<b>CC</b>", "xref": "x", "yref": "y", "align": "left", "xanchor": "left", "showarrow": false }, { "x": 13.55, "y": 0, "font": { "color": "#ffffff" }, "text": "<b>FS</b>", "xref": "x", "yref": "y", "align": "left", "xanchor": "left", "showarrow": false }, { "x": 14.55, "y": 0, "font": { "color": "#ffffff" }, "text": "<b>SP</b>", "xref": "x", "yref": "y", "align": "left", "xanchor": "left", "showarrow": false }, { "x": 15.55, "y": 0, "font": { "color": "#ffffff" }, "text": "<b>OM</b>", "xref": "x", "yref": "y", "align": "left", "xanchor": "left", "showarrow": false }, { "x": 16.55, "y": 0, "font": { "color": "#ffffff" }, "text": "<b>DUW</b>", "xref": "x", "yref": "y", "align": "left", "xanchor": "left", "showarrow": false }, { "x": 17.55, "y": 0, "font": { "color": "#ffffff" }, "text": "<b>TWC</b>", "xref": "x", "yref": "y", "align": "left", "xanchor": "left", "showarrow": false }, { "x": 18.55, "y": 0, "font": { "color": "#ffffff" }, "text": "<b>type</b>", "xref": "x", "yref": "y", "align": "left", "xanchor": "left", "showarrow": false }, { "x": 19.55, "y": 0, "font": { "color": "#ffffff" }, "text": "<b>phi</b>", "xref": "x", "yref": "y", "align": "left", "xanchor": "left", "showarrow": false }, { "x": 20.55, "y": 0, "font": { "color": "#ffffff" }, "text": "<b>c</b>", "xref": "x", "yref": "y", "align": "left", "xanchor": "left", "showarrow": false }, { "x": 21.55, "y": 0, "font": { "color": "#ffffff" }, "text": "<b>phi'</b>", "xref": "x", "yref": "y", "align": "left", "xanchor": "left", "showarrow": false }, { "x": 22.55, "y": 0, "font": { "color": "#ffffff" }, "text": "<b>c'</b>", "xref": "x", "yref": "y", "align": "left", "xanchor": "left", "showarrow": false }, { "x": 23.55, "y": 0, "font": { "color": "#ffffff" }, "text": "<b>cu</b>", "xref": "x", "yref": "y", "align": "left", "xanchor": "left", "showarrow": false }, { "x": 24.55, "y": 0, "font": { "color": "#ffffff" }, "text": "<b>Load Stresses</b>", "xref": "x", "yref": "y", "align": "left", "xanchor": "left", "showarrow": false }, { "x": 25.55, "y": 0, "font": { "color": "#ffffff" }, "text": "<b>Ce</b>", "xref": "x", "yref": "y", "align": "left", "xanchor": "left", "showarrow": false }, { "x": 26.55, "y": 0, "font": { "color": "#ffffff" }, "text": "<b>Cc</b>", "xref": "x", "yref": "y", "align": "left", "xanchor": "left", "showarrow": false }, { "x": 27.55, "y": 0, "font": { "color": "#ffffff" }, "text": "<b>s'p</b>", "xref": "x", "yref": "y", "align": "left", "xanchor": "left", "showarrow": false }, { "x": 28.55, "y": 0, "font": { "color": "#ffffff" }, "text": "<b>e.0</b>", "xref": "x", "yref": "y", "align": "left", "xanchor": "left", "showarrow": false }, { "x": -0.45, "y": 1, "font": { "color": "#000000" }, "text": "1", "xref": "x", "yref": "y", "align": "left", "xanchor": "left", "showarrow": false }, { "x": 0.55, "y": 1, "font": { "color": "#000000" }, "text": "S23", "xref": "x", "yref": "y", "align": "left", "xanchor": "left", "showarrow": false }, { "x": 1.55, "y": 1, "font": { "color": "#000000" }, "text": "CH", "xref": "x", "yref": "y", "align": "left", "xanchor": "left", "showarrow": false }, { "x": 2.55, "y": 1, "font": { "color": "#000000" }, "text": "34.5", "xref": "x", "yref": "y", "align": "left", "xanchor": "left", "showarrow": false }, { "x": 3.55, "y": 1, "font": { "color": "#000000" }, "text": "34.95", "xref": "x", "yref": "y", "align": "left", "xanchor": "left", "showarrow": false }, { "x": 4.55, "y": 1, "font": { "color": "#000000" }, "text": "34.73", "xref": "x", "yref": "y", "align": "left", "xanchor": "left", "showarrow": false }, { "x": 5.55, "y": 1, "font": { "color": "#000000" }, "text": "nan", "xref": "x", "yref": "y", "align": "left", "xanchor": "left", "showarrow": false }, { "x": 6.55, "y": 1, "font": { "color": "#000000" }, "text": "nan", "xref": "x", "yref": "y", "align": "left", "xanchor": "left", "showarrow": false }, { "x": 7.55, "y": 1, "font": { "color": "#000000" }, "text": "nan", "xref": "x", "yref": "y", "align": "left", "xanchor": "left", "showarrow": false }, { "x": 8.55, "y": 1, "font": { "color": "#000000" }, "text": "56.0", "xref": "x", "yref": "y", "align": "left", "xanchor": "left", "showarrow": false }, { "x": 9.55, "y": 1, "font": { "color": "#000000" }, "text": "17.0", "xref": "x", "yref": "y", "align": "left", "xanchor": "left", "showarrow": false }, { "x": 10.55, "y": 1, "font": { "color": "#000000" }, "text": "39.0", "xref": "x", "yref": "y", "align": "left", "xanchor": "left", "showarrow": false }, { "x": 11.55, "y": 1, "font": { "color": "#000000" }, "text": "37.1", "xref": "x", "yref": "y", "align": "left", "xanchor": "left", "showarrow": false }, { "x": 12.55, "y": 1, "font": { "color": "#000000" }, "text": "nan", "xref": "x", "yref": "y", "align": "left", "xanchor": "left", "showarrow": false }, { "x": 13.55, "y": 1, "font": { "color": "#000000" }, "text": "nan", "xref": "x", "yref": "y", "align": "left", "xanchor": "left", "showarrow": false }, { "x": 14.55, "y": 1, "font": { "color": "#000000" }, "text": "nan", "xref": "x", "yref": "y", "align": "left", "xanchor": "left", "showarrow": false }, { "x": 15.55, "y": 1, "font": { "color": "#000000" }, "text": "nan", "xref": "x", "yref": "y", "align": "left", "xanchor": "left", "showarrow": false }, { "x": 16.55, "y": 1, "font": { "color": "#000000" }, "text": "nan", "xref": "x", "yref": "y", "align": "left", "xanchor": "left", "showarrow": false }, { "x": 17.55, "y": 1, "font": { "color": "#000000" }, "text": "nan", "xref": "x", "yref": "y", "align": "left", "xanchor": "left", "showarrow": false }, { "x": 18.55, "y": 1, "font": { "color": "#000000" }, "text": "nan", "xref": "x", "yref": "y", "align": "left", "xanchor": "left", "showarrow": false }, { "x": 19.55, "y": 1, "font": { "color": "#000000" }, "text": "nan", "xref": "x", "yref": "y", "align": "left", "xanchor": "left", "showarrow": false }, { "x": 20.55, "y": 1, "font": { "color": "#000000" }, "text": "nan", "xref": "x", "yref": "y", "align": "left", "xanchor": "left", "showarrow": false }, { "x": 21.55, "y": 1, "font": { "color": "#000000" }, "text": "nan", "xref": "x", "yref": "y", "align": "left", "xanchor": "left", "showarrow": false }, { "x": 22.55, "y": 1, "font": { "color": "#000000" }, "text": "nan", "xref": "x", "yref": "y", "align": "left", "xanchor": "left", "showarrow": false }, { "x": 23.55, "y": 1, "font": { "color": "#000000" }, "text": "nan", "xref": "x", "yref": "y", "align": "left", "xanchor": "left", "showarrow": false }, { "x": 24.55, "y": 1, "font": { "color": "#000000" }, "text": "nan", "xref": "x", "yref": "y", "align": "left", "xanchor": "left", "showarrow": false }, { "x": 25.55, "y": 1, "font": { "color": "#000000" }, "text": "nan", "xref": "x", "yref": "y", "align": "left", "xanchor": "left", "showarrow": false }, { "x": 26.55, "y": 1, "font": { "color": "#000000" }, "text": "nan", "xref": "x", "yref": "y", "align": "left", "xanchor": "left", "showarrow": false }, { "x": 27.55, "y": 1, "font": { "color": "#000000" }, "text": "nan", "xref": "x", "yref": "y", "align": "left", "xanchor": "left", "showarrow": false }, { "x": 28.55, "y": 1, "font": { "color": "#000000" }, "text": "nan", "xref": "x", "yref": "y", "align": "left", "xanchor": "left", "showarrow": false }, { "x": -0.45, "y": 2, "font": { "color": "#000000" }, "text": "2", "xref": "x", "yref": "y", "align": "left", "xanchor": "left", "showarrow": false }, { "x": 0.55, "y": 2, "font": { "color": "#000000" }, "text": "S23", "xref": "x", "yref": "y", "align": "left", "xanchor": "left", "showarrow": false }, { "x": 1.55, "y": 2, "font": { "color": "#000000" }, "text": "CL", "xref": "x", "yref": "y", "align": "left", "xanchor": "left", "showarrow": false }, { "x": 2.55, "y": 2, "font": { "color": "#000000" }, "text": "36.0", "xref": "x", "yref": "y", "align": "left", "xanchor": "left", "showarrow": false }, { "x": 3.55, "y": 2, "font": { "color": "#000000" }, "text": "36.45", "xref": "x", "yref": "y", "align": "left", "xanchor": "left", "showarrow": false }, { "x": 4.55, "y": 2, "font": { "color": "#000000" }, "text": "36.23", "xref": "x", "yref": "y", "align": "left", "xanchor": "left", "showarrow": false }, { "x": 5.55, "y": 2, "font": { "color": "#000000" }, "text": "nan", "xref": "x", "yref": "y", "align": "left", "xanchor": "left", "showarrow": false }, { "x": 6.55, "y": 2, "font": { "color": "#000000" }, "text": "nan", "xref": "x", "yref": "y", "align": "left", "xanchor": "left", "showarrow": false }, { "x": 7.55, "y": 2, "font": { "color": "#000000" }, "text": "nan", "xref": "x", "yref": "y", "align": "left", "xanchor": "left", "showarrow": false }, { "x": 8.55, "y": 2, "font": { "color": "#000000" }, "text": "nan", "xref": "x", "yref": "y", "align": "left", "xanchor": "left", "showarrow": false }, { "x": 9.55, "y": 2, "font": { "color": "#000000" }, "text": "nan", "xref": "x", "yref": "y", "align": "left", "xanchor": "left", "showarrow": false }, { "x": 10.55, "y": 2, "font": { "color": "#000000" }, "text": "nan", "xref": "x", "yref": "y", "align": "left", "xanchor": "left", "showarrow": false }, { "x": 11.55, "y": 2, "font": { "color": "#000000" }, "text": "25.2", "xref": "x", "yref": "y", "align": "left", "xanchor": "left", "showarrow": false }, { "x": 12.55, "y": 2, "font": { "color": "#000000" }, "text": "nan", "xref": "x", "yref": "y", "align": "left", "xanchor": "left", "showarrow": false }, { "x": 13.55, "y": 2, "font": { "color": "#000000" }, "text": "nan", "xref": "x", "yref": "y", "align": "left", "xanchor": "left", "showarrow": false }, { "x": 14.55, "y": 2, "font": { "color": "#000000" }, "text": "nan", "xref": "x", "yref": "y", "align": "left", "xanchor": "left", "showarrow": false }, { "x": 15.55, "y": 2, "font": { "color": "#000000" }, "text": "nan", "xref": "x", "yref": "y", "align": "left", "xanchor": "left", "showarrow": false }, { "x": 16.55, "y": 2, "font": { "color": "#000000" }, "text": "nan", "xref": "x", "yref": "y", "align": "left", "xanchor": "left", "showarrow": false }, { "x": 17.55, "y": 2, "font": { "color": "#000000" }, "text": "nan", "xref": "x", "yref": "y", "align": "left", "xanchor": "left", "showarrow": false }, { "x": 18.55, "y": 2, "font": { "color": "#000000" }, "text": "nan", "xref": "x", "yref": "y", "align": "left", "xanchor": "left", "showarrow": false }, { "x": 19.55, "y": 2, "font": { "color": "#000000" }, "text": "nan", "xref": "x", "yref": "y", "align": "left", "xanchor": "left", "showarrow": false }, { "x": 20.55, "y": 2, "font": { "color": "#000000" }, "text": "nan", "xref": "x", "yref": "y", "align": "left", "xanchor": "left", "showarrow": false }, { "x": 21.55, "y": 2, "font": { "color": "#000000" }, "text": "nan", "xref": "x", "yref": "y", "align": "left", "xanchor": "left", "showarrow": false }, { "x": 22.55, "y": 2, "font": { "color": "#000000" }, "text": "nan", "xref": "x", "yref": "y", "align": "left", "xanchor": "left", "showarrow": false }, { "x": 23.55, "y": 2, "font": { "color": "#000000" }, "text": "nan", "xref": "x", "yref": "y", "align": "left", "xanchor": "left", "showarrow": false }, { "x": 24.55, "y": 2, "font": { "color": "#000000" }, "text": "nan", "xref": "x", "yref": "y", "align": "left", "xanchor": "left", "showarrow": false }, { "x": 25.55, "y": 2, "font": { "color": "#000000" }, "text": "nan", "xref": "x", "yref": "y", "align": "left", "xanchor": "left", "showarrow": false }, { "x": 26.55, "y": 2, "font": { "color": "#000000" }, "text": "nan", "xref": "x", "yref": "y", "align": "left", "xanchor": "left", "showarrow": false }, { "x": 27.55, "y": 2, "font": { "color": "#000000" }, "text": "nan", "xref": "x", "yref": "y", "align": "left", "xanchor": "left", "showarrow": false }, { "x": 28.55, "y": 2, "font": { "color": "#000000" }, "text": "nan", "xref": "x", "yref": "y", "align": "left", "xanchor": "left", "showarrow": false }, { "x": -0.45, "y": 3, "font": { "color": "#000000" }, "text": "3", "xref": "x", "yref": "y", "align": "left", "xanchor": "left", "showarrow": false }, { "x": 0.55, "y": 3, "font": { "color": "#000000" }, "text": "550", "xref": "x", "yref": "y", "align": "left", "xanchor": "left", "showarrow": false }, { "x": 1.55, "y": 3, "font": { "color": "#000000" }, "text": "CL", "xref": "x", "yref": "y", "align": "left", "xanchor": "left", "showarrow": false }, { "x": 2.55, "y": 3, "font": { "color": "#000000" }, "text": "35.3", "xref": "x", "yref": "y", "align": "left", "xanchor": "left", "showarrow": false }, { "x": 3.55, "y": 3, "font": { "color": "#000000" }, "text": "35.3", "xref": "x", "yref": "y", "align": "left", "xanchor": "left", "showarrow": false }, { "x": 4.55, "y": 3, "font": { "color": "#000000" }, "text": "35.3", "xref": "x", "yref": "y", "align": "left", "xanchor": "left", "showarrow": false }, { "x": 5.55, "y": 3, "font": { "color": "#000000" }, "text": "41.6", "xref": "x", "yref": "y", "align": "left", "xanchor": "left", "showarrow": false }, { "x": 6.55, "y": 3, "font": { "color": "#000000" }, "text": "141.0", "xref": "x", "yref": "y", "align": "left", "xanchor": "left", "showarrow": false }, { "x": 7.55, "y": 3, "font": { "color": "#000000" }, "text": "2.49", "xref": "x", "yref": "y", "align": "left", "xanchor": "left", "showarrow": false }, { "x": 8.55, "y": 3, "font": { "color": "#000000" }, "text": "nan", "xref": "x", "yref": "y", "align": "left", "xanchor": "left", "showarrow": false }, { "x": 9.55, "y": 3, "font": { "color": "#000000" }, "text": "nan", "xref": "x", "yref": "y", "align": "left", "xanchor": "left", "showarrow": false }, { "x": 10.55, "y": 3, "font": { "color": "#000000" }, "text": "nan", "xref": "x", "yref": "y", "align": "left", "xanchor": "left", "showarrow": false }, { "x": 11.55, "y": 3, "font": { "color": "#000000" }, "text": "nan", "xref": "x", "yref": "y", "align": "left", "xanchor": "left", "showarrow": false }, { "x": 12.55, "y": 3, "font": { "color": "#000000" }, "text": "nan", "xref": "x", "yref": "y", "align": "left", "xanchor": "left", "showarrow": false }, { "x": 13.55, "y": 3, "font": { "color": "#000000" }, "text": "nan", "xref": "x", "yref": "y", "align": "left", "xanchor": "left", "showarrow": false }, { "x": 14.55, "y": 3, "font": { "color": "#000000" }, "text": "nan", "xref": "x", "yref": "y", "align": "left", "xanchor": "left", "showarrow": false }, { "x": 15.55, "y": 3, "font": { "color": "#000000" }, "text": "nan", "xref": "x", "yref": "y", "align": "left", "xanchor": "left", "showarrow": false }, { "x": 16.55, "y": 3, "font": { "color": "#000000" }, "text": "nan", "xref": "x", "yref": "y", "align": "left", "xanchor": "left", "showarrow": false }, { "x": 17.55, "y": 3, "font": { "color": "#000000" }, "text": "nan", "xref": "x", "yref": "y", "align": "left", "xanchor": "left", "showarrow": false }, { "x": 18.55, "y": 3, "font": { "color": "#000000" }, "text": "nan", "xref": "x", "yref": "y", "align": "left", "xanchor": "left", "showarrow": false }, { "x": 19.55, "y": 3, "font": { "color": "#000000" }, "text": "nan", "xref": "x", "yref": "y", "align": "left", "xanchor": "left", "showarrow": false }, { "x": 20.55, "y": 3, "font": { "color": "#000000" }, "text": "nan", "xref": "x", "yref": "y", "align": "left", "xanchor": "left", "showarrow": false }, { "x": 21.55, "y": 3, "font": { "color": "#000000" }, "text": "nan", "xref": "x", "yref": "y", "align": "left", "xanchor": "left", "showarrow": false }, { "x": 22.55, "y": 3, "font": { "color": "#000000" }, "text": "nan", "xref": "x", "yref": "y", "align": "left", "xanchor": "left", "showarrow": false }, { "x": 23.55, "y": 3, "font": { "color": "#000000" }, "text": "nan", "xref": "x", "yref": "y", "align": "left", "xanchor": "left", "showarrow": false }, { "x": 24.55, "y": 3, "font": { "color": "#000000" }, "text": "nan", "xref": "x", "yref": "y", "align": "left", "xanchor": "left", "showarrow": false }, { "x": 25.55, "y": 3, "font": { "color": "#000000" }, "text": "nan", "xref": "x", "yref": "y", "align": "left", "xanchor": "left", "showarrow": false }, { "x": 26.55, "y": 3, "font": { "color": "#000000" }, "text": "nan", "xref": "x", "yref": "y", "align": "left", "xanchor": "left", "showarrow": false }, { "x": 27.55, "y": 3, "font": { "color": "#000000" }, "text": "nan", "xref": "x", "yref": "y", "align": "left", "xanchor": "left", "showarrow": false }, { "x": 28.55, "y": 3, "font": { "color": "#000000" }, "text": "nan", "xref": "x", "yref": "y", "align": "left", "xanchor": "left", "showarrow": false }, { "x": -0.45, "y": 4, "font": { "color": "#000000" }, "text": "4", "xref": "x", "yref": "y", "align": "left", "xanchor": "left", "showarrow": false }, { "x": 0.55, "y": 4, "font": { "color": "#000000" }, "text": "550", "xref": "x", "yref": "y", "align": "left", "xanchor": "left", "showarrow": false }, { "x": 1.55, "y": 4, "font": { "color": "#000000" }, "text": "CH", "xref": "x", "yref": "y", "align": "left", "xanchor": "left", "showarrow": false }, { "x": 2.55, "y": 4, "font": { "color": "#000000" }, "text": "37.45", "xref": "x", "yref": "y", "align": "left", "xanchor": "left", "showarrow": false }, { "x": 3.55, "y": 4, "font": { "color": "#000000" }, "text": "39.0", "xref": "x", "yref": "y", "align": "left", "xanchor": "left", "showarrow": false }, { "x": 4.55, "y": 4, "font": { "color": "#000000" }, "text": "38.23", "xref": "x", "yref": "y", "align": "left", "xanchor": "left", "showarrow": false }, { "x": 5.55, "y": 4, "font": { "color": "#000000" }, "text": "nan", "xref": "x", "yref": "y", "align": "left", "xanchor": "left", "showarrow": false }, { "x": 6.55, "y": 4, "font": { "color": "#000000" }, "text": "nan", "xref": "x", "yref": "y", "align": "left", "xanchor": "left", "showarrow": false }, { "x": 7.55, "y": 4, "font": { "color": "#000000" }, "text": "nan", "xref": "x", "yref": "y", "align": "left", "xanchor": "left", "showarrow": false }, { "x": 8.55, "y": 4, "font": { "color": "#000000" }, "text": "88.0", "xref": "x", "yref": "y", "align": "left", "xanchor": "left", "showarrow": false }, { "x": 9.55, "y": 4, "font": { "color": "#000000" }, "text": "28.0", "xref": "x", "yref": "y", "align": "left", "xanchor": "left", "showarrow": false }, { "x": 10.55, "y": 4, "font": { "color": "#000000" }, "text": "60.0", "xref": "x", "yref": "y", "align": "left", "xanchor": "left", "showarrow": false }, { "x": 11.55, "y": 4, "font": { "color": "#000000" }, "text": "nan", "xref": "x", "yref": "y", "align": "left", "xanchor": "left", "showarrow": false }, { "x": 12.55, "y": 4, "font": { "color": "#000000" }, "text": "nan", "xref": "x", "yref": "y", "align": "left", "xanchor": "left", "showarrow": false }, { "x": 13.55, "y": 4, "font": { "color": "#000000" }, "text": "125.0", "xref": "x", "yref": "y", "align": "left", "xanchor": "left", "showarrow": false }, { "x": 14.55, "y": 4, "font": { "color": "#000000" }, "text": "nan", "xref": "x", "yref": "y", "align": "left", "xanchor": "left", "showarrow": false }, { "x": 15.55, "y": 4, "font": { "color": "#000000" }, "text": "nan", "xref": "x", "yref": "y", "align": "left", "xanchor": "left", "showarrow": false }, { "x": 16.55, "y": 4, "font": { "color": "#000000" }, "text": "nan", "xref": "x", "yref": "y", "align": "left", "xanchor": "left", "showarrow": false }, { "x": 17.55, "y": 4, "font": { "color": "#000000" }, "text": "nan", "xref": "x", "yref": "y", "align": "left", "xanchor": "left", "showarrow": false }, { "x": 18.55, "y": 4, "font": { "color": "#000000" }, "text": "nan", "xref": "x", "yref": "y", "align": "left", "xanchor": "left", "showarrow": false }, { "x": 19.55, "y": 4, "font": { "color": "#000000" }, "text": "nan", "xref": "x", "yref": "y", "align": "left", "xanchor": "left", "showarrow": false }, { "x": 20.55, "y": 4, "font": { "color": "#000000" }, "text": "nan", "xref": "x", "yref": "y", "align": "left", "xanchor": "left", "showarrow": false }, { "x": 21.55, "y": 4, "font": { "color": "#000000" }, "text": "nan", "xref": "x", "yref": "y", "align": "left", "xanchor": "left", "showarrow": false }, { "x": 22.55, "y": 4, "font": { "color": "#000000" }, "text": "nan", "xref": "x", "yref": "y", "align": "left", "xanchor": "left", "showarrow": false }, { "x": 23.55, "y": 4, "font": { "color": "#000000" }, "text": "nan", "xref": "x", "yref": "y", "align": "left", "xanchor": "left", "showarrow": false }, { "x": 24.55, "y": 4, "font": { "color": "#000000" }, "text": "nan", "xref": "x", "yref": "y", "align": "left", "xanchor": "left", "showarrow": false }, { "x": 25.55, "y": 4, "font": { "color": "#000000" }, "text": "nan", "xref": "x", "yref": "y", "align": "left", "xanchor": "left", "showarrow": false }, { "x": 26.55, "y": 4, "font": { "color": "#000000" }, "text": "nan", "xref": "x", "yref": "y", "align": "left", "xanchor": "left", "showarrow": false }, { "x": 27.55, "y": 4, "font": { "color": "#000000" }, "text": "nan", "xref": "x", "yref": "y", "align": "left", "xanchor": "left", "showarrow": false }, { "x": 28.55, "y": 4, "font": { "color": "#000000" }, "text": "nan", "xref": "x", "yref": "y", "align": "left", "xanchor": "left", "showarrow": false }, { "x": -0.45, "y": 5, "font": { "color": "#000000" }, "text": "5", "xref": "x", "yref": "y", "align": "left", "xanchor": "left", "showarrow": false }, { "x": 0.55, "y": 5, "font": { "color": "#000000" }, "text": "550", "xref": "x", "yref": "y", "align": "left", "xanchor": "left", "showarrow": false }, { "x": 1.55, "y": 5, "font": { "color": "#000000" }, "text": "CH", "xref": "x", "yref": "y", "align": "left", "xanchor": "left", "showarrow": false }, { "x": 2.55, "y": 5, "font": { "color": "#000000" }, "text": "38.3", "xref": "x", "yref": "y", "align": "left", "xanchor": "left", "showarrow": false }, { "x": 3.55, "y": 5, "font": { "color": "#000000" }, "text": "38.3", "xref": "x", "yref": "y", "align": "left", "xanchor": "left", "showarrow": false }, { "x": 4.55, "y": 5, "font": { "color": "#000000" }, "text": "38.3", "xref": "x", "yref": "y", "align": "left", "xanchor": "left", "showarrow": false }, { "x": 5.55, "y": 5, "font": { "color": "#000000" }, "text": "22.2", "xref": "x", "yref": "y", "align": "left", "xanchor": "left", "showarrow": false }, { "x": 6.55, "y": 5, "font": { "color": "#000000" }, "text": "139.2", "xref": "x", "yref": "y", "align": "left", "xanchor": "left", "showarrow": false }, { "x": 7.55, "y": 5, "font": { "color": "#000000" }, "text": "nan", "xref": "x", "yref": "y", "align": "left", "xanchor": "left", "showarrow": false }, { "x": 8.55, "y": 5, "font": { "color": "#000000" }, "text": "nan", "xref": "x", "yref": "y", "align": "left", "xanchor": "left", "showarrow": false }, { "x": 9.55, "y": 5, "font": { "color": "#000000" }, "text": "nan", "xref": "x", "yref": "y", "align": "left", "xanchor": "left", "showarrow": false }, { "x": 10.55, "y": 5, "font": { "color": "#000000" }, "text": "nan", "xref": "x", "yref": "y", "align": "left", "xanchor": "left", "showarrow": false }, { "x": 11.55, "y": 5, "font": { "color": "#000000" }, "text": "nan", "xref": "x", "yref": "y", "align": "left", "xanchor": "left", "showarrow": false }, { "x": 12.55, "y": 5, "font": { "color": "#000000" }, "text": "nan", "xref": "x", "yref": "y", "align": "left", "xanchor": "left", "showarrow": false }, { "x": 13.55, "y": 5, "font": { "color": "#000000" }, "text": "nan", "xref": "x", "yref": "y", "align": "left", "xanchor": "left", "showarrow": false }, { "x": 14.55, "y": 5, "font": { "color": "#000000" }, "text": "nan", "xref": "x", "yref": "y", "align": "left", "xanchor": "left", "showarrow": false }, { "x": 15.55, "y": 5, "font": { "color": "#000000" }, "text": "nan", "xref": "x", "yref": "y", "align": "left", "xanchor": "left", "showarrow": false }, { "x": 16.55, "y": 5, "font": { "color": "#000000" }, "text": "nan", "xref": "x", "yref": "y", "align": "left", "xanchor": "left", "showarrow": false }, { "x": 17.55, "y": 5, "font": { "color": "#000000" }, "text": "nan", "xref": "x", "yref": "y", "align": "left", "xanchor": "left", "showarrow": false }, { "x": 18.55, "y": 5, "font": { "color": "#000000" }, "text": "nan", "xref": "x", "yref": "y", "align": "left", "xanchor": "left", "showarrow": false }, { "x": 19.55, "y": 5, "font": { "color": "#000000" }, "text": "nan", "xref": "x", "yref": "y", "align": "left", "xanchor": "left", "showarrow": false }, { "x": 20.55, "y": 5, "font": { "color": "#000000" }, "text": "nan", "xref": "x", "yref": "y", "align": "left", "xanchor": "left", "showarrow": false }, { "x": 21.55, "y": 5, "font": { "color": "#000000" }, "text": "nan", "xref": "x", "yref": "y", "align": "left", "xanchor": "left", "showarrow": false }, { "x": 22.55, "y": 5, "font": { "color": "#000000" }, "text": "nan", "xref": "x", "yref": "y", "align": "left", "xanchor": "left", "showarrow": false }, { "x": 23.55, "y": 5, "font": { "color": "#000000" }, "text": "nan", "xref": "x", "yref": "y", "align": "left", "xanchor": "left", "showarrow": false }, { "x": 24.55, "y": 5, "font": { "color": "#000000" }, "text": "nan", "xref": "x", "yref": "y", "align": "left", "xanchor": "left", "showarrow": false }, { "x": 25.55, "y": 5, "font": { "color": "#000000" }, "text": "nan", "xref": "x", "yref": "y", "align": "left", "xanchor": "left", "showarrow": false }, { "x": 26.55, "y": 5, "font": { "color": "#000000" }, "text": "nan", "xref": "x", "yref": "y", "align": "left", "xanchor": "left", "showarrow": false }, { "x": 27.55, "y": 5, "font": { "color": "#000000" }, "text": "nan", "xref": "x", "yref": "y", "align": "left", "xanchor": "left", "showarrow": false }, { "x": 28.55, "y": 5, "font": { "color": "#000000" }, "text": "nan", "xref": "x", "yref": "y", "align": "left", "xanchor": "left", "showarrow": false } ] } }, "height": 230, "width": null, "user": { "profile_url": "https://chart-studio.plotly.com/~konradbartczak", "avatar_url": "https://storage.googleapis.com/plotly-prod-profiles/36.jpg", "background_url": "https://storage.googleapis.com/plotly-prod-profiles/bg-9.jpg", "bio": "", "nickname": "", "website": "", "stream_tokens": null, "feature_set_id": null, "csrf_token": null, "date_joined": "2019-03-20 19:38:36", "mapbox_access_tokens": null, "has_password": null, "username": "konradbartczak", "email": null, "is_active": null, "readonly": null, "is_dash_creator": null, "dash_created_count": null, "is_chart_creator": null, "charts_created_count": null } }, { "creation_time": "2019-03-20T19:40:34.357937Z", "comments": { "results": [], "count": 0 }, "parented": true, "embed_url": "https://chart-studio.plotly.com/~erik.the.read/57.embed", "fid": "erik.the.read:57", "filename": "Cand_News_Pie_One", "filetype": "plot", "img_url": "https://api.plotly.com/v2/files/erik.the.read:57/image?image_name=list-thumb", "image_urls": { "default": "https://storage.googleapis.com/plotly-prod-images/erik.the.read/57/2_686RKGNU2S5UK4CVC5XDBKR203G93C.png", "block-thumb": "https://storage.googleapis.com/plotly-prod-images/erik.the.read/57/8_XKDC84V8DNL4I2NWB9NCEQIEUKTGTS.png", "list-thumb": "https://api.plotly.com/v2/files/erik.the.read:57/image?image_name=list-thumb" }, "api_urls": { "files": "https://api.plotly.com/v2/files/erik.the.read:57", "plots": "https://api.plotly.com/v2/plots/erik.the.read:57", "parent": "https://api.plotly.com/v2/folders/home?user=erik.the.read" }, "owner": "erik.the.read", "parent": -1, "preview": "", "referencers": [], "references": [], "title": "", "views": 54, "web_url": "https://chart-studio.plotly.com/~erik.the.read/57/", "world_readable": true, "date_modified": "2019-04-11T18:56:31.078Z", "stars": { "results": [], "count": 0 }, "collaborators": { "results": [], "count": 0 }, "subfolder_count": null, "refresh_interval": null, "organize_view_url": "https://chart-studio.plotly.com/~erik.the.read/57/", "current_user_permission": "read", "is_theme": null, "is_template": false, "autosize": true, "caption": "", "figure": { "data": [ { "uid": "175cb8be-1a35-4ac6-9424-0e67f91cd366", "type": "pie", "title": "Last Name in Online Headlines 2/2/2019 - 4/11/2019", "marker": { "line": { "color": "#000000", "width": 1 }, "colors": [ "red" ] }, "textfont": { "size": 10 }, "textinfo": "value", "hoverinfo": "label+percent", "labelssrc": "erik.the.read:76:5f794e", "valuessrc": "erik.the.read:76:69f12c" } ], "layout": {} }, "height": null, "width": null, "user": { "profile_url": "https://chart-studio.plotly.com/~erik.the.read", "avatar_url": "https://storage.googleapis.com/plotly-prod-profiles/78.jpg", "background_url": "https://storage.googleapis.com/plotly-prod-profiles/bg-3.jpg", "bio": "", "nickname": "", "website": "", "stream_tokens": null, "feature_set_id": null, "csrf_token": null, "date_joined": "2018-10-23 02:01:59", "mapbox_access_tokens": null, "has_password": null, "username": "erik.the.read", "email": null, "is_active": null, "readonly": null, "is_dash_creator": null, "dash_created_count": null, "is_chart_creator": null, "charts_created_count": null } }, { "creation_time": "2019-03-20T19:38:38.887410Z", "comments": { "results": [], "count": 0 }, "parented": true, "embed_url": "https://chart-studio.plotly.com/~OHUD/16.embed", "fid": "OHUD:16", "filename": "grouped-bar", "filetype": "plot", "img_url": "https://api.plotly.com/v2/files/OHUD:16/image?image_name=list-thumb", "image_urls": { "default": "https://storage.googleapis.com/plotly-prod-images/OHUD/16/2_9IG9Q1U0AWWIX3ZVYJ0SP953AVG3KI.png", "block-thumb": "https://storage.googleapis.com/plotly-prod-images/OHUD/16/8_C1YND19NBEAPRWUIFF20O8GLATIY9D.png", "list-thumb": "https://api.plotly.com/v2/files/OHUD:16/image?image_name=list-thumb" }, "api_urls": { "files": "https://api.plotly.com/v2/files/OHUD:16", "plots": "https://api.plotly.com/v2/plots/OHUD:16", "parent": "https://api.plotly.com/v2/folders/home?user=OHUD" }, "owner": "OHUD", "parent": -1, "preview": "", "referencers": [], "references": [], "title": "Number of Births & Deaths through the years", "views": 33, "web_url": "https://chart-studio.plotly.com/~OHUD/16/number-of-births-deaths-through-the-years/", "world_readable": true, "date_modified": "2019-03-30T13:09:14.871Z", "stars": { "results": [], "count": 0 }, "collaborators": { "results": [], "count": 0 }, "subfolder_count": null, "refresh_interval": null, "organize_view_url": "https://chart-studio.plotly.com/~OHUD/16/", "current_user_permission": "read", "is_theme": null, "is_template": false, "autosize": true, "caption": "", "figure": { "data": [ { "uid": "0bdf8351-e60e-46c9-abde-283bb1411e48", "name": "Births Number", "type": "bar", "xsrc": "OHUD:17:2ecfe6", "ysrc": "OHUD:17:733c57" }, { "uid": "2d7fe368-2133-4785-b121-1c2dd271b2ae", "name": "Deaths Number", "type": "bar", "xsrc": "OHUD:17:2ecfe6", "ysrc": "OHUD:17:0e3036" } ], "frames": [], "layout": { "title": { "text": "Number of Births & Deaths through the years" }, "xaxis": { "type": "linear", "range": [ 2014.5, 2017.5 ], "title": { "text": "Years" }, "autorange": true }, "yaxis": { "type": "linear", "range": [ 0, 297.89473684210526 ], "title": { "text": "Births & Deaths Numbers" }, "autorange": true }, "barmode": "group" } }, "height": null, "width": null, "user": { "profile_url": "https://chart-studio.plotly.com/~OHUD", "avatar_url": "https://storage.googleapis.com/plotly-prod-profiles/98.jpg", "background_url": "https://storage.googleapis.com/plotly-prod-profiles/bg-4.jpg", "bio": "", "nickname": "", "website": "", "stream_tokens": null, "feature_set_id": null, "csrf_token": null, "date_joined": "2019-03-11 19:01:48", "mapbox_access_tokens": null, "has_password": null, "username": "OHUD", "email": null, "is_active": null, "readonly": null, "is_dash_creator": null, "dash_created_count": null, "is_chart_creator": null, "charts_created_count": null } }, { "creation_time": "2019-03-20T19:36:46.070873Z", "comments": { "results": [], "count": 0 }, "parented": true, "embed_url": "https://chart-studio.plotly.com/~ckkt91/30.embed", "fid": "ckkt91:30", "filename": "Charmander_Region3_50ms_0hotspots", "filetype": "plot", "img_url": "https://storage.googleapis.com/plotly-prod-images/ckkt91/30/9_0CTF46ROYFXTGPVTM3S2TI8A1JTZEP.png", "image_urls": { "default": "https://api.plotly.com/v2/files/ckkt91:30/image?image_name=default", "block-thumb": "https://api.plotly.com/v2/files/ckkt91:30/image?image_name=block-thumb", "list-thumb": "https://storage.googleapis.com/plotly-prod-images/ckkt91/30/9_0CTF46ROYFXTGPVTM3S2TI8A1JTZEP.png" }, "api_urls": { "files": "https://api.plotly.com/v2/files/ckkt91:30", "plots": "https://api.plotly.com/v2/plots/ckkt91:30", "parent": "https://api.plotly.com/v2/folders/home?user=ckkt91" }, "owner": "ckkt91", "parent": -1, "preview": "", "referencers": [], "references": [], "title": "", "views": 0, "web_url": "https://chart-studio.plotly.com/~ckkt91/30/", "world_readable": true, "date_modified": "2019-03-21T16:34:12.563Z", "stars": { "results": [], "count": 0 }, "collaborators": { "results": [], "count": 0 }, "subfolder_count": null, "refresh_interval": null, "organize_view_url": "https://chart-studio.plotly.com/~ckkt91/30/", "current_user_permission": "read", "is_theme": null, "is_template": true, "autosize": true, "caption": "", "figure": { "data": [ { "line": { "color": "rgb(0, 0, 0)" }, "mode": "lines", "name": "Averaged Damage Variable", "type": "scatter", "xsrc": "ckkt91:29:a4257e", "ysrc": "ckkt91:29:c5d5d0", "showlegend": true }, { "mode": "lines", "name": "Relative Change in Resistivity", "type": "scatter", "xsrc": "ckkt91:29:a4257e", "ysrc": "ckkt91:29:059f5b", "yaxis": "y2", "stackgroup": null }, { "line": { "color": "rgb(87, 165, 30)" }, "mode": "lines", "name": "Averaged Strain", "type": "scatter", "xsrc": "ckkt91:29:a4257e", "ysrc": "ckkt91:29:a8814b", "yaxis": "y3", "visible": true, "showlegend": true, "connectgaps": false, "orientation": "v" } ], "frames": [], "layout": { "title": { "x": 0.275, "font": { "size": 20, "color": "rgb(0, 0, 0)" }, "text": "$\\text{Region 3 | 50 m/s Impact Loading Scenario | 0% Hotspots}$" }, "xaxis": { "side": "bottom", "type": "linear", "range": [ 1.45153e-08, 1.45153e-05 ], "ticks": "inside", "title": { "font": { "size": 20, "family": "Balto" }, "text": "$\\text{Time [s]}$" }, "anchor": "y", "domain": [ 0, 1 ], "showgrid": false, "tickfont": { "size": 20 }, "tickmode": "auto", "autorange": true, "rangeslider": { "range": [ -0.9999854847, 5.0000145153 ], "yaxis": {}, "yaxis2": {}, "visible": false, "autorange": true, "thickness": 0 } }, "yaxis": { "type": "linear", "range": [ -0.013533333333333335, 0.2571333333333333 ], "ticks": "outside", "title": { "font": { "size": 20, "family": "Balto" }, "text": "$\\text{Damage Variable}$" }, "domain": [ 0, 1 ], "showgrid": false, "showline": false, "tickfont": { "size": 20 }, "zeroline": false, "autorange": true }, "legend": { "x": 1.04, "y": 1.05, "font": { "size": 24, "family": "Balto" }, "valign": "middle", "xanchor": "left", "yanchor": "auto", "orientation": "h" }, "shapes": [ { "x0": 4.79e-06, "x1": 4.79e-06, "y0": 0, "y1": 0.25, "line": { "dash": "dashdot", "color": "rgb(130, 130, 130)", "width": 3 }, "type": "line", "opacity": 0.5, "fillcolor": "#7f7f7f" }, { "x0": 9.58e-06, "x1": 9.58e-06, "y0": 0, "y1": 0.25, "line": { "dash": "dashdot", "color": "rgb(130, 130, 130)", "width": 3 }, "type": "line", "opacity": 0.5, "fillcolor": "#7f7f7f" } ], "yaxis2": { "side": "right", "type": "linear", "range": [ -0.09756781011111111, 1.614022132111111 ], "ticks": "outside", "title": { "font": { "size": 25, "family": "Balto" }, "text": "$\\Delta \\rho / \\rho_0$" }, "showgrid": false, "showline": true, "tickfont": { "size": 20 }, "zeroline": false, "autorange": true, "overlaying": "y" }, "yaxis3": { "side": "right", "type": "linear", "range": [ -0.026724499999999998, 0.0047655 ], "ticks": "outside", "title": { "font": { "size": 25, "family": "Balto" }, "text": "$\\epsilon_{yy}$" }, "anchor": "free", "domain": [ 0, 1 ], "showgrid": false, "showline": true, "tickfont": { "size": 20 }, "zeroline": false, "autorange": true, "overlaying": "y" }, "autosize": true, "template": { "data": { "bar": [ { "type": "bar", "marker": { "colorbar": { "ticks": "", "outlinewidth": 0 } } } ], "table": [ { "type": "table", "cells": { "fill": { "color": "#EBF0F8" }, "line": { "color": "white" } }, "header": { "fill": { "color": "#C8D4E3" }, "line": { "color": "white" } } } ], "carpet": [ { "type": "carpet", "aaxis": { "gridcolor": "#C8D4E3", "linecolor": "#C8D4E3", "endlinecolor": "#2a3f5f", "minorgridcolor": "#C8D4E3", "startlinecolor": "#2a3f5f" }, "baxis": { "gridcolor": "#C8D4E3", "linecolor": "#C8D4E3", "endlinecolor": "#2a3f5f", "minorgridcolor": "#C8D4E3", "startlinecolor": "#2a3f5f" } } ], "mesh3d": [ { "type": "mesh3d", "colorbar": { "ticks": "", "outlinewidth": 0 } } ], "contour": [ { "type": "contour", "colorbar": { "ticks": "", "outlinewidth": 0 }, "autocolorscale": true } ], "heatmap": [ { "type": "heatmap", "colorbar": { "ticks": "", "outlinewidth": 0 }, "autocolorscale": true } ], "scatter": [ { "type": "scatter", "marker": { "colorbar": { "ticks": "", "outlinewidth": 0 } } } ], "surface": [ { "type": "surface", "colorbar": { "ticks": "", "outlinewidth": 0 } } ], "heatmapgl": [ { "type": "heatmapgl", "colorbar": { "ticks": "", "outlinewidth": 0 } } ], "histogram": [ { "type": "histogram", "marker": { "colorbar": { "ticks": "", "outlinewidth": 0 } } } ], "parcoords": [ { "line": { "colorbar": { "ticks": "", "outlinewidth": 0 } }, "type": "parcoords" } ], "scatter3d": [ { "type": "scatter3d", "marker": { "colorbar": { "ticks": "", "outlinewidth": 0 } } } ], "scattergl": [ { "type": "scattergl", "marker": { "colorbar": { "ticks": "", "outlinewidth": 0 } } } ], "choropleth": [ { "type": "choropleth", "colorbar": { "ticks": "", "outlinewidth": 0 } } ], "scattergeo": [ { "type": "scattergeo", "marker": { "colorbar": { "ticks": "", "outlinewidth": 0 } } } ], "histogram2d": [ { "type": "histogram2d", "colorbar": { "ticks": "", "outlinewidth": 0 }, "autocolorscale": true } ], "scatterpolar": [ { "type": "scatterpolar", "marker": { "colorbar": { "ticks": "", "outlinewidth": 0 } } } ], "contourcarpet": [ { "type": "contourcarpet", "colorbar": { "ticks": "", "outlinewidth": 0 } } ], "scattercarpet": [ { "type": "scattercarpet", "marker": { "colorbar": { "ticks": "", "outlinewidth": 0 } } } ], "scattermapbox": [ { "type": "scattermapbox", "marker": { "colorbar": { "ticks": "", "outlinewidth": 0 } } } ], "scatterpolargl": [ { "type": "scatterpolargl", "marker": { "colorbar": { "ticks": "", "outlinewidth": 0 } } } ], "scatterternary": [ { "type": "scatterternary", "marker": { "colorbar": { "ticks": "", "outlinewidth": 0 } } } ], "histogram2dcontour": [ { "type": "histogram2dcontour", "colorbar": { "ticks": "", "outlinewidth": 0 }, "autocolorscale": true } ] }, "layout": { "geo": { "bgcolor": "white", "showland": true, "lakecolor": "white", "landcolor": "white", "showlakes": true, "subunitcolor": "#C8D4E3" }, "font": { "color": "#2a3f5f" }, "polar": { "bgcolor": "white", "radialaxis": { "ticks": "", "gridcolor": "#EBF0F8", "linecolor": "#EBF0F8" }, "angularaxis": { "ticks": "", "gridcolor": "#EBF0F8", "linecolor": "#EBF0F8" } }, "scene": { "xaxis": { "ticks": "", "gridcolor": "#DFE8F3", "gridwidth": 2, "linecolor": "#EBF0F8", "zerolinecolor": "#EBF0F8", "showbackground": true, "backgroundcolor": "white" }, "yaxis": { "ticks": "", "gridcolor": "#DFE8F3", "gridwidth": 2, "linecolor": "#EBF0F8", "zerolinecolor": "#EBF0F8", "showbackground": true, "backgroundcolor": "white" }, "zaxis": { "ticks": "", "gridcolor": "#DFE8F3", "gridwidth": 2, "linecolor": "#EBF0F8", "zerolinecolor": "#EBF0F8", "showbackground": true, "backgroundcolor": "white" } }, "title": { "x": 0.05 }, "xaxis": { "ticks": "", "gridcolor": "#EBF0F8", "linecolor": "#EBF0F8", "automargin": true, "zerolinecolor": "#EBF0F8", "zerolinewidth": 2 }, "yaxis": { "ticks": "", "gridcolor": "#EBF0F8", "linecolor": "#EBF0F8", "automargin": true, "zerolinecolor": "#EBF0F8", "zerolinewidth": 2 }, "ternary": { "aaxis": { "ticks": "", "gridcolor": "#DFE8F3", "linecolor": "#A2B1C6" }, "baxis": { "ticks": "", "gridcolor": "#DFE8F3", "linecolor": "#A2B1C6" }, "caxis": { "ticks": "", "gridcolor": "#DFE8F3", "linecolor": "#A2B1C6" }, "bgcolor": "white" }, "colorway": [ "#636efa", "#EF553B", "#00cc96", "#ab63fa", "#19d3f3", "#e763fa", "#fecb52", "#ffa15a", "#ff6692", "#b6e880" ], "hovermode": "closest", "colorscale": { "diverging": [ [ 0, "#8e0152" ], [ 0.1, "#c51b7d" ], [ 0.2, "#de77ae" ], [ 0.3, "#f1b6da" ], [ 0.4, "#fde0ef" ], [ 0.5, "#f7f7f7" ], [ 0.6, "#e6f5d0" ], [ 0.7, "#b8e186" ], [ 0.8, "#7fbc41" ], [ 0.9, "#4d9221" ], [ 1, "#276419" ] ], "sequential": [ [ 0, "#0508b8" ], [ 0.0893854748603352, "#1910d8" ], [ 0.1787709497206704, "#3c19f0" ], [ 0.2681564245810056, "#6b1cfb" ], [ 0.3575418994413408, "#981cfd" ], [ 0.44692737430167595, "#bf1cfd" ], [ 0.5363128491620112, "#dd2bfd" ], [ 0.6256983240223464, "#f246fe" ], [ 0.7150837988826816, "#fc67fd" ], [ 0.8044692737430168, "#fe88fc" ], [ 0.8938547486033519, "#fea5fd" ], [ 0.9832402234636871, "#febefe" ], [ 1, "#fec3fe" ] ], "sequentialminus": [ [ 0, "#0508b8" ], [ 0.0893854748603352, "#1910d8" ], [ 0.1787709497206704, "#3c19f0" ], [ 0.2681564245810056, "#6b1cfb" ], [ 0.3575418994413408, "#981cfd" ], [ 0.44692737430167595, "#bf1cfd" ], [ 0.5363128491620112, "#dd2bfd" ], [ 0.6256983240223464, "#f246fe" ], [ 0.7150837988826816, "#fc67fd" ], [ 0.8044692737430168, "#fe88fc" ], [ 0.8938547486033519, "#fea5fd" ], [ 0.9832402234636871, "#febefe" ], [ 1, "#fec3fe" ] ] }, "plot_bgcolor": "white", "paper_bgcolor": "white", "shapedefaults": { "line": { "width": 0 }, "opacity": 0.4, "fillcolor": "#506784" }, "annotationdefaults": { "arrowhead": 0, "arrowcolor": "#506784", "arrowwidth": 1 } }, "themeRef": "PLOTLY_WHITE" }, "showlegend": true, "annotations": [ { "x": 4.79e-06, "y": 0, "font": { "size": 17 }, "text": "$t = 4.79 \\, \\mu s$", "yanchor": "top", "showarrow": false }, { "x": 9.58e-06, "y": 0, "font": { "size": 17 }, "text": "$t = 9.58 \\, \\mu s$", "yanchor": "top", "showarrow": false } ] } }, "height": null, "width": null, "user": { "profile_url": "https://chart-studio.plotly.com/~ckkt91", "avatar_url": "https://storage.googleapis.com/plotly-prod-profiles/6.jpg", "background_url": "https://storage.googleapis.com/plotly-prod-profiles/bg-8.jpg", "bio": "", "nickname": "", "website": "", "stream_tokens": null, "feature_set_id": null, "csrf_token": null, "date_joined": "2019-03-19 19:34:50", "mapbox_access_tokens": null, "has_password": null, "username": "ckkt91", "email": null, "is_active": null, "readonly": null, "is_dash_creator": null, "dash_created_count": null, "is_chart_creator": null, "charts_created_count": null } }, { "creation_time": "2019-03-20T19:36:25.108843Z", "comments": { "results": [], "count": 0 }, "parented": true, "embed_url": "https://chart-studio.plotly.com/~ToniTarantini/4.embed", "fid": "ToniTarantini:4", "filename": "Plot 4", "filetype": "plot", "img_url": "https://storage.googleapis.com/plotly-prod-images/ToniTarantini/4/9_CCVS0CPLDIM0JZHR8EHCLHN0ZPRYXY.png", "image_urls": { "default": "https://api.plotly.com/v2/files/ToniTarantini:4/image?image_name=default", "block-thumb": "https://api.plotly.com/v2/files/ToniTarantini:4/image?image_name=block-thumb", "list-thumb": "https://storage.googleapis.com/plotly-prod-images/ToniTarantini/4/9_CCVS0CPLDIM0JZHR8EHCLHN0ZPRYXY.png" }, "api_urls": { "files": "https://api.plotly.com/v2/files/ToniTarantini:4", "plots": "https://api.plotly.com/v2/plots/ToniTarantini:4", "parent": "https://api.plotly.com/v2/folders/home?user=ToniTarantini" }, "owner": "ToniTarantini", "parent": -1, "preview": "", "referencers": [], "references": [], "title": "", "views": 0, "web_url": "https://chart-studio.plotly.com/~ToniTarantini/4/", "world_readable": true, "date_modified": "2019-03-20T19:36:25.128Z", "stars": { "results": [], "count": 0 }, "collaborators": { "results": [], "count": 0 }, "subfolder_count": null, "refresh_interval": null, "organize_view_url": "https://chart-studio.plotly.com/~ToniTarantini/4/", "current_user_permission": "read", "is_theme": null, "is_template": false, "autosize": true, "caption": "", "figure": { "data": [ { "mode": "markers", "name": "Africa", "type": "scatter", "xsrc": "ToniTarantini:3:1b65b0", "ysrc": "ToniTarantini:3:bd1514", "marker": { "line": { "width": 2 }, "symbol": "circle", "sizeref": 0.85, "sizesrc": "ToniTarantini:3:71b5bd", "sizemode": "diameter" }, "textsrc": "ToniTarantini:3:7cb153" }, { "mode": "markers", "name": "Americas", "type": "scatter", "xsrc": "ToniTarantini:3:996adb", "ysrc": "ToniTarantini:3:e7b950", "marker": { "line": { "width": 2 }, "sizeref": 0.85, "sizesrc": "ToniTarantini:3:68f3ec", "sizemode": "diameter" }, "textsrc": "ToniTarantini:3:31ddc7" }, { "mode": "markers", "name": "Asia", "type": "scatter", "xsrc": "ToniTarantini:3:7a50cd", "ysrc": "ToniTarantini:3:c12484", "marker": { "line": { "width": 2 }, "sizeref": 0.85, "sizesrc": "ToniTarantini:3:570007", "sizemode": "diameter" }, "textsrc": "ToniTarantini:3:46c7a5" }, { "mode": "markers", "name": "Europe", "type": "scatter", "xsrc": "ToniTarantini:3:6a0319", "ysrc": "ToniTarantini:3:0b1949", "marker": { "line": { "width": 2 }, "sizeref": 0.85, "sizesrc": "ToniTarantini:3:3555e8", "sizemode": "diameter" }, "textsrc": "ToniTarantini:3:268a70" }, { "mode": "markers", "name": "Oceania", "type": "scatter", "xsrc": "ToniTarantini:3:892861", "ysrc": "ToniTarantini:3:385f2d", "marker": { "line": { "width": 2 }, "sizeref": 0.85, "sizesrc": "ToniTarantini:3:ed44d3", "sizemode": "diameter" }, "textsrc": "ToniTarantini:3:32fb22" } ], "frames": [], "layout": { "title": { "text": "Life Expectancy v. Per Capita GDP, 2007" }, "xaxis": { "type": "log", "range": [ 2.003297660701705, 5.191505530708712 ], "title": { "text": "GDP per capita (2000 dollars)" }, "ticklen": 5, "gridcolor": "rgb(255, 255, 255)", "gridwidth": 2, "zerolinewidth": 1 }, "yaxis": { "type": "linear", "range": [ 36.12621671352166, 91.72921793264332 ], "title": { "text": "Life Expectancy (years)" }, "ticklen": 5, "gridcolor": "rgb(255, 255, 255)", "gridwidth": 2, "zerolinewidth": 1 }, "plot_bgcolor": "rgb(243, 243, 243)", "paper_bgcolor": "rgb(243, 243, 243)" } }, "height": null, "width": null, "user": { "profile_url": "https://chart-studio.plotly.com/~ToniTarantini", "avatar_url": "https://storage.googleapis.com/plotly-prod-profiles/2.jpg", "background_url": "https://storage.googleapis.com/plotly-prod-profiles/bg-3.jpg", "bio": "", "nickname": "", "website": "", "stream_tokens": null, "feature_set_id": null, "csrf_token": null, "date_joined": "2019-03-20 15:44:41", "mapbox_access_tokens": null, "has_password": null, "username": "ToniTarantini", "email": null, "is_active": null, "readonly": null, "is_dash_creator": null, "dash_created_count": null, "is_chart_creator": null, "charts_created_count": null } }, { "creation_time": "2019-03-20T19:35:44.125360Z", "comments": { "results": [], "count": 0 }, "parented": true, "embed_url": "https://chart-studio.plotly.com/~nart27/0.embed", "fid": "nart27:0", "filename": "networkx", "filetype": "plot", "img_url": "https://api.plotly.com/v2/files/nart27:0/image?image_name=list-thumb", "image_urls": { "default": "https://api.plotly.com/v2/files/nart27:0/image?image_name=default", "block-thumb": "https://api.plotly.com/v2/files/nart27:0/image?image_name=block-thumb", "list-thumb": "https://api.plotly.com/v2/files/nart27:0/image?image_name=list-thumb" }, "api_urls": { "files": "https://api.plotly.com/v2/files/nart27:0", "plots": "https://api.plotly.com/v2/plots/nart27:0", "parent": "https://api.plotly.com/v2/folders/home?user=nart27" }, "owner": "nart27", "parent": -1, "preview": "", "referencers": [], "references": [], "title": "<br>Network graph made with Python", "views": 0, "web_url": "https://chart-studio.plotly.com/~nart27/0/network-graph-made-with-python/", "world_readable": true, "date_modified": "2019-03-20T19:40:04.228Z", "stars": { "results": [], "count": 0 }, "collaborators": { "results": [], "count": 0 }, "subfolder_count": null, "refresh_interval": null, "organize_view_url": "https://chart-studio.plotly.com/~nart27/0/", "current_user_permission": "read", "is_theme": null, "is_template": null, "autosize": true, "caption": "", "figure": { "data": [ { "uid": "9cb0f48e-eeb9-4fda-943b-915136393816", "line": { "color": "#888", "width": 0.5 }, "mode": "lines", "type": "scatter", "xsrc": "nart27:1:cbc41a", "ysrc": "nart27:1:9f1a93", "hoverinfo": "none" }, { "uid": "221206f7-0c2a-45af-9575-f2db4f9a5d74", "mode": "markers", "type": "scatter", "xsrc": "nart27:1:2acfd7", "ysrc": "nart27:1:605140", "marker": { "line": { "width": 2 }, "size": 10, "colorbar": { "title": { "side": "right", "text": "Node Connections" }, "xanchor": "left", "thickness": 15 }, "colorsrc": "nart27:1:30c809", "showscale": true, "colorscale": "YlGnBu", "reversescale": true }, "textsrc": "nart27:1:08f085", "hoverinfo": "text" } ], "layout": { "title": { "font": { "size": 16 }, "text": "<br>Network graph made with Python" }, "xaxis": { "showgrid": false, "zeroline": false, "showticklabels": false }, "yaxis": { "showgrid": false, "zeroline": false, "showticklabels": false }, "margin": { "b": 20, "l": 5, "r": 5, "t": 40 }, "hovermode": "closest", "showlegend": false, "annotations": [ { "x": 0.005, "y": -0.002, "text": "Python code: <a href='https://plot.ly/ipython-notebooks/network-graphs/'> https://plot.ly/ipython-notebooks/network-graphs/</a>", "xref": "paper", "yref": "paper", "showarrow": false } ] } }, "height": null, "width": null, "user": { "profile_url": "https://chart-studio.plotly.com/~nart27", "avatar_url": "https://storage.googleapis.com/plotly-prod-profiles/72.jpg", "background_url": "https://storage.googleapis.com/plotly-prod-profiles/bg-13.jpg", "bio": "", "nickname": "", "website": "", "stream_tokens": null, "feature_set_id": null, "csrf_token": null, "date_joined": "2019-03-20 19:33:24", "mapbox_access_tokens": null, "has_password": null, "username": "nart27", "email": null, "is_active": null, "readonly": null, "is_dash_creator": null, "dash_created_count": null, "is_chart_creator": null, "charts_created_count": null } }, { "creation_time": "2019-03-20T19:34:17.445231Z", "comments": { "results": [], "count": 0 }, "parented": true, "embed_url": "https://chart-studio.plotly.com/~ckkt91/28.embed", "fid": "ckkt91:28", "filename": "Charmander_Region2_50ms_02hotspots", "filetype": "plot", "img_url": "https://storage.googleapis.com/plotly-prod-images/ckkt91/28/9_IBERBH6O1UC0EUHMQGW37VP7C4ESE1.png", "image_urls": { "default": "https://storage.googleapis.com/plotly-prod-images/ckkt91/28/2_JRNMMG3EDR1OALU0I90A070VQLQK7Y.png", "block-thumb": "https://api.plotly.com/v2/files/ckkt91:28/image?image_name=block-thumb", "list-thumb": "https://storage.googleapis.com/plotly-prod-images/ckkt91/28/9_IBERBH6O1UC0EUHMQGW37VP7C4ESE1.png" }, "api_urls": { "files": "https://api.plotly.com/v2/files/ckkt91:28", "plots": "https://api.plotly.com/v2/plots/ckkt91:28", "parent": "https://api.plotly.com/v2/folders/home?user=ckkt91" }, "owner": "ckkt91", "parent": -1, "preview": "", "referencers": [], "references": [], "title": "", "views": 33, "web_url": "https://chart-studio.plotly.com/~ckkt91/28/", "world_readable": true, "date_modified": "2019-03-21T16:34:19.191Z", "stars": { "results": [], "count": 0 }, "collaborators": { "results": [], "count": 0 }, "subfolder_count": null, "refresh_interval": null, "organize_view_url": "https://chart-studio.plotly.com/~ckkt91/28/", "current_user_permission": "read", "is_theme": null, "is_template": true, "autosize": true, "caption": "", "figure": { "data": [ { "line": { "color": "rgb(0, 0, 0)" }, "mode": "lines", "name": "Averaged Damage Variable", "type": "scatter", "xsrc": "ckkt91:27:56e61c", "ysrc": "ckkt91:27:18b56c", "showlegend": true }, { "mode": "lines", "name": "Relative Change in Resistivity", "type": "scatter", "xsrc": "ckkt91:27:56e61c", "ysrc": "ckkt91:27:fc019e", "yaxis": "y2", "stackgroup": null }, { "line": { "color": "rgb(87, 165, 30)" }, "mode": "lines", "name": "Averaged Strain", "type": "scatter", "xsrc": "ckkt91:27:56e61c", "ysrc": "ckkt91:27:34c4d2", "yaxis": "y3", "visible": true, "showlegend": true, "connectgaps": false, "orientation": "v" } ], "frames": [], "layout": { "title": { "x": 0.275, "font": { "size": 20, "color": "rgb(0, 0, 0)" }, "text": "$\\text{Region 2 | 50 m/s Impact Loading Scenario | 0.2% Hotspots}$" }, "xaxis": { "side": "bottom", "type": "linear", "range": [ 1.45153e-08, 1.45153e-05 ], "ticks": "inside", "title": { "font": { "size": 20, "family": "Balto" }, "text": "$\\text{Time [s]}$" }, "anchor": "y", "domain": [ 0, 1 ], "showgrid": false, "tickfont": { "size": 20 }, "tickmode": "auto", "autorange": true, "rangeslider": { "range": [ -0.9999854847, 5.0000145153 ], "yaxis": {}, "yaxis2": {}, "visible": false, "autorange": true, "thickness": 0 } }, "yaxis": { "type": "linear", "range": [ -0.013760333333333333, 0.26144633333333334 ], "ticks": "outside", "title": { "font": { "size": 20, "family": "Balto" }, "text": "$\\text{Damage Variable}$" }, "domain": [ 0, 1 ], "showgrid": false, "showline": false, "tickfont": { "size": 20 }, "zeroline": false, "autorange": true }, "legend": { "x": 1.04, "y": 1.05, "font": { "size": 24, "family": "Balto" }, "valign": "middle", "xanchor": "left", "yanchor": "auto", "orientation": "h" }, "shapes": [ { "x0": 4.79e-06, "x1": 4.79e-06, "y0": 0, "y1": 0.25, "line": { "dash": "dashdot", "color": "rgb(130, 130, 130)", "width": 3 }, "type": "line", "opacity": 0.5, "fillcolor": "#7f7f7f" }, { "x0": 9.58e-06, "x1": 9.58e-06, "y0": 0, "y1": 0.25, "line": { "dash": "dashdot", "color": "rgb(130, 130, 130)", "width": 3 }, "type": "line", "opacity": 0.5, "fillcolor": "#7f7f7f" } ], "yaxis2": { "side": "right", "type": "linear", "range": [ -0.07772211277777778, 1.2136406627777778 ], "ticks": "outside", "title": { "font": { "size": 25, "family": "Balto" }, "text": "$\\Delta \\rho / \\rho_0$" }, "showgrid": false, "showline": true, "tickfont": { "size": 20 }, "zeroline": false, "autorange": true, "overlaying": "y" }, "yaxis3": { "side": "right", "type": "linear", "range": [ -0.014899944444444443, 0.0008989444444444444 ], "ticks": "outside", "title": { "font": { "size": 25, "family": "Balto" }, "text": "$\\epsilon_{yy}$" }, "anchor": "free", "domain": [ 0, 1 ], "showgrid": false, "showline": true, "tickfont": { "size": 20 }, "zeroline": false, "autorange": true, "overlaying": "y" }, "autosize": true, "dragmode": "pan", "template": { "data": { "bar": [ { "type": "bar", "marker": { "colorbar": { "ticks": "", "outlinewidth": 0 } } } ], "table": [ { "type": "table", "cells": { "fill": { "color": "#EBF0F8" }, "line": { "color": "white" } }, "header": { "fill": { "color": "#C8D4E3" }, "line": { "color": "white" } } } ], "carpet": [ { "type": "carpet", "aaxis": { "gridcolor": "#C8D4E3", "linecolor": "#C8D4E3", "endlinecolor": "#2a3f5f", "minorgridcolor": "#C8D4E3", "startlinecolor": "#2a3f5f" }, "baxis": { "gridcolor": "#C8D4E3", "linecolor": "#C8D4E3", "endlinecolor": "#2a3f5f", "minorgridcolor": "#C8D4E3", "startlinecolor": "#2a3f5f" } } ], "mesh3d": [ { "type": "mesh3d", "colorbar": { "ticks": "", "outlinewidth": 0 } } ], "contour": [ { "type": "contour", "colorbar": { "ticks": "", "outlinewidth": 0 }, "autocolorscale": true } ], "heatmap": [ { "type": "heatmap", "colorbar": { "ticks": "", "outlinewidth": 0 }, "autocolorscale": true } ], "scatter": [ { "type": "scatter", "marker": { "colorbar": { "ticks": "", "outlinewidth": 0 } } } ], "surface": [ { "type": "surface", "colorbar": { "ticks": "", "outlinewidth": 0 } } ], "heatmapgl": [ { "type": "heatmapgl", "colorbar": { "ticks": "", "outlinewidth": 0 } } ], "histogram": [ { "type": "histogram", "marker": { "colorbar": { "ticks": "", "outlinewidth": 0 } } } ], "parcoords": [ { "line": { "colorbar": { "ticks": "", "outlinewidth": 0 } }, "type": "parcoords" } ], "scatter3d": [ { "type": "scatter3d", "marker": { "colorbar": { "ticks": "", "outlinewidth": 0 } } } ], "scattergl": [ { "type": "scattergl", "marker": { "colorbar": { "ticks": "", "outlinewidth": 0 } } } ], "choropleth": [ { "type": "choropleth", "colorbar": { "ticks": "", "outlinewidth": 0 } } ], "scattergeo": [ { "type": "scattergeo", "marker": { "colorbar": { "ticks": "", "outlinewidth": 0 } } } ], "histogram2d": [ { "type": "histogram2d", "colorbar": { "ticks": "", "outlinewidth": 0 }, "autocolorscale": true } ], "scatterpolar": [ { "type": "scatterpolar", "marker": { "colorbar": { "ticks": "", "outlinewidth": 0 } } } ], "contourcarpet": [ { "type": "contourcarpet", "colorbar": { "ticks": "", "outlinewidth": 0 } } ], "scattercarpet": [ { "type": "scattercarpet", "marker": { "colorbar": { "ticks": "", "outlinewidth": 0 } } } ], "scattermapbox": [ { "type": "scattermapbox", "marker": { "colorbar": { "ticks": "", "outlinewidth": 0 } } } ], "scatterpolargl": [ { "type": "scatterpolargl", "marker": { "colorbar": { "ticks": "", "outlinewidth": 0 } } } ], "scatterternary": [ { "type": "scatterternary", "marker": { "colorbar": { "ticks": "", "outlinewidth": 0 } } } ], "histogram2dcontour": [ { "type": "histogram2dcontour", "colorbar": { "ticks": "", "outlinewidth": 0 }, "autocolorscale": true } ] }, "layout": { "geo": { "bgcolor": "white", "showland": true, "lakecolor": "white", "landcolor": "white", "showlakes": true, "subunitcolor": "#C8D4E3" }, "font": { "color": "#2a3f5f" }, "polar": { "bgcolor": "white", "radialaxis": { "ticks": "", "gridcolor": "#EBF0F8", "linecolor": "#EBF0F8" }, "angularaxis": { "ticks": "", "gridcolor": "#EBF0F8", "linecolor": "#EBF0F8" } }, "scene": { "xaxis": { "ticks": "", "gridcolor": "#DFE8F3", "gridwidth": 2, "linecolor": "#EBF0F8", "zerolinecolor": "#EBF0F8", "showbackground": true, "backgroundcolor": "white" }, "yaxis": { "ticks": "", "gridcolor": "#DFE8F3", "gridwidth": 2, "linecolor": "#EBF0F8", "zerolinecolor": "#EBF0F8", "showbackground": true, "backgroundcolor": "white" }, "zaxis": { "ticks": "", "gridcolor": "#DFE8F3", "gridwidth": 2, "linecolor": "#EBF0F8", "zerolinecolor": "#EBF0F8", "showbackground": true, "backgroundcolor": "white" } }, "title": { "x": 0.05 }, "xaxis": { "ticks": "", "gridcolor": "#EBF0F8", "linecolor": "#EBF0F8", "automargin": true, "zerolinecolor": "#EBF0F8", "zerolinewidth": 2 }, "yaxis": { "ticks": "", "gridcolor": "#EBF0F8", "linecolor": "#EBF0F8", "automargin": true, "zerolinecolor": "#EBF0F8", "zerolinewidth": 2 }, "ternary": { "aaxis": { "ticks": "", "gridcolor": "#DFE8F3", "linecolor": "#A2B1C6" }, "baxis": { "ticks": "", "gridcolor": "#DFE8F3", "linecolor": "#A2B1C6" }, "caxis": { "ticks": "", "gridcolor": "#DFE8F3", "linecolor": "#A2B1C6" }, "bgcolor": "white" }, "colorway": [ "#636efa", "#EF553B", "#00cc96", "#ab63fa", "#19d3f3", "#e763fa", "#fecb52", "#ffa15a", "#ff6692", "#b6e880" ], "hovermode": "closest", "colorscale": { "diverging": [ [ 0, "#8e0152" ], [ 0.1, "#c51b7d" ], [ 0.2, "#de77ae" ], [ 0.3, "#f1b6da" ], [ 0.4, "#fde0ef" ], [ 0.5, "#f7f7f7" ], [ 0.6, "#e6f5d0" ], [ 0.7, "#b8e186" ], [ 0.8, "#7fbc41" ], [ 0.9, "#4d9221" ], [ 1, "#276419" ] ], "sequential": [ [ 0, "#0508b8" ], [ 0.0893854748603352, "#1910d8" ], [ 0.1787709497206704, "#3c19f0" ], [ 0.2681564245810056, "#6b1cfb" ], [ 0.3575418994413408, "#981cfd" ], [ 0.44692737430167595, "#bf1cfd" ], [ 0.5363128491620112, "#dd2bfd" ], [ 0.6256983240223464, "#f246fe" ], [ 0.7150837988826816, "#fc67fd" ], [ 0.8044692737430168, "#fe88fc" ], [ 0.8938547486033519, "#fea5fd" ], [ 0.9832402234636871, "#febefe" ], [ 1, "#fec3fe" ] ], "sequentialminus": [ [ 0, "#0508b8" ], [ 0.0893854748603352, "#1910d8" ], [ 0.1787709497206704, "#3c19f0" ], [ 0.2681564245810056, "#6b1cfb" ], [ 0.3575418994413408, "#981cfd" ], [ 0.44692737430167595, "#bf1cfd" ], [ 0.5363128491620112, "#dd2bfd" ], [ 0.6256983240223464, "#f246fe" ], [ 0.7150837988826816, "#fc67fd" ], [ 0.8044692737430168, "#fe88fc" ], [ 0.8938547486033519, "#fea5fd" ], [ 0.9832402234636871, "#febefe" ], [ 1, "#fec3fe" ] ] }, "plot_bgcolor": "white", "paper_bgcolor": "white", "shapedefaults": { "line": { "width": 0 }, "opacity": 0.4, "fillcolor": "#506784" }, "annotationdefaults": { "arrowhead": 0, "arrowcolor": "#506784", "arrowwidth": 1 } }, "themeRef": "PLOTLY_WHITE" }, "showlegend": true, "annotations": [ { "x": 4.79e-06, "y": 0, "font": { "size": 17, "family": "Balto" }, "text": "$t = 4.79 \\, \\mu s$", "yanchor": "top", "showarrow": false }, { "x": 9.58e-06, "y": 0, "font": { "size": 17, "family": "Balto" }, "text": "$t = 9.58 \\, \\mu s$", "yanchor": "top", "showarrow": false } ] } }, "height": null, "width": null, "user": { "profile_url": "https://chart-studio.plotly.com/~ckkt91", "avatar_url": "https://storage.googleapis.com/plotly-prod-profiles/6.jpg", "background_url": "https://storage.googleapis.com/plotly-prod-profiles/bg-8.jpg", "bio": "", "nickname": "", "website": "", "stream_tokens": null, "feature_set_id": null, "csrf_token": null, "date_joined": "2019-03-19 19:34:50", "mapbox_access_tokens": null, "has_password": null, "username": "ckkt91", "email": null, "is_active": null, "readonly": null, "is_dash_creator": null, "dash_created_count": null, "is_chart_creator": null, "charts_created_count": null } }, { "creation_time": "2019-03-20T19:34:09.026738Z", "comments": { "results": [], "count": 0 }, "parented": true, "embed_url": "https://chart-studio.plotly.com/~PythonPlotBot/3241.embed", "fid": "PythonPlotBot:3241", "filename": "multiple-custom-sized-subplots", "filetype": "plot", "img_url": "https://storage.googleapis.com/plotly-prod-images/PythonPlotBot/3241/9_HZRUPFKL99WEJF9IAHM8VZN1OZU0L2.png", "image_urls": { "default": "https://storage.googleapis.com/plotly-prod-images/PythonPlotBot/3241/2_ZCG2K8HVX2ZJTT14PEVVWJ8AQBBXTX.png", "block-thumb": "https://storage.googleapis.com/plotly-prod-images/PythonPlotBot/3241/8_5LGBIPW6NAEL69JV1WA3251A1SLKGY.png", "list-thumb": "https://storage.googleapis.com/plotly-prod-images/PythonPlotBot/3241/9_HZRUPFKL99WEJF9IAHM8VZN1OZU0L2.png" }, "api_urls": { "files": "https://api.plotly.com/v2/files/PythonPlotBot:3241", "plots": "https://api.plotly.com/v2/plots/PythonPlotBot:3241", "parent": "https://api.plotly.com/v2/folders/home?user=PythonPlotBot" }, "owner": "PythonPlotBot", "parent": -1, "preview": "", "referencers": [], "references": [], "title": "specs examples", "views": 3, "web_url": "https://chart-studio.plotly.com/~PythonPlotBot/3241/specs-examples/", "world_readable": true, "date_modified": "2019-03-20T19:34:10.389Z", "stars": { "results": [], "count": 0 }, "collaborators": { "results": [], "count": 0 }, "subfolder_count": null, "refresh_interval": null, "organize_view_url": "https://chart-studio.plotly.com/~PythonPlotBot/3241/", "current_user_permission": "read", "is_theme": null, "is_template": null, "autosize": true, "caption": "", "figure": { "data": [ { "uid": "9ca704c1-81bc-43dd-bc56-3d8c6f2f666a", "name": "(1,1)", "type": "scatter", "xsrc": "PythonPlotBot:3242:5f0aa0", "ysrc": "PythonPlotBot:3242:9de52e", "xaxis": "x", "yaxis": "y" }, { "uid": "f7afc1a5-fc11-4917-b036-a4c86ed7f9a9", "name": "(1,2)", "type": "scatter", "xsrc": "PythonPlotBot:3242:5f0aa0", "ysrc": "PythonPlotBot:3242:9de52e", "xaxis": "x2", "yaxis": "y2" }, { "uid": "cebeed43-cfa6-45a0-b89f-6b6040638bb4", "name": "(2,1)", "type": "scatter", "xsrc": "PythonPlotBot:3242:5f0aa0", "ysrc": "PythonPlotBot:3242:9de52e", "xaxis": "x3", "yaxis": "y3" }, { "uid": "097a2287-f0ed-41ee-993e-60b85d7099a9", "name": "(3,1)", "type": "scatter", "xsrc": "PythonPlotBot:3242:5f0aa0", "ysrc": "PythonPlotBot:3242:9de52e", "xaxis": "x4", "yaxis": "y4" }, { "uid": "9b0dfb84-b520-4307-9924-2e9bc98c203f", "name": "(5,1)", "type": "scatter", "xsrc": "PythonPlotBot:3242:5f0aa0", "ysrc": "PythonPlotBot:3242:9de52e", "xaxis": "x5", "yaxis": "y5" }, { "uid": "363832fd-b5b8-47bb-beb8-5d4a7af9842e", "name": "(5,2)", "type": "scatter", "xsrc": "PythonPlotBot:3242:5f0aa0", "ysrc": "PythonPlotBot:3242:9de52e", "xaxis": "x6", "yaxis": "y6" } ], "layout": { "title": { "text": "specs examples" }, "width": 600, "xaxis": { "anchor": "y", "domain": [ 0.0, 0.45 ] }, "yaxis": { "anchor": "x", "domain": [ 0.848, 1.0 ] }, "height": 600, "xaxis2": { "anchor": "y2", "domain": [ 0.55, 1.0 ] }, "xaxis3": { "anchor": "y3", "domain": [ 0.0, 0.45 ] }, "xaxis4": { "anchor": "y4", "domain": [ 0.0, 1.0 ] }, "xaxis5": { "anchor": "y5", "domain": [ 0.0, 0.45 ] }, "xaxis6": { "anchor": "y6", "domain": [ 0.55, 1.0 ] }, "yaxis2": { "anchor": "x2", "domain": [ 0.6359999999999999, 1.0 ] }, "yaxis3": { "anchor": "x3", "domain": [ 0.6359999999999999, 0.7879999999999999 ] }, "yaxis4": { "anchor": "x4", "domain": [ 0.212, 0.576 ] }, "yaxis5": { "anchor": "x5", "domain": [ 0.0, 0.152 ] }, "yaxis6": { "anchor": "x6", "domain": [ 0.0, 0.152 ] } } }, "height": 600, "width": 600, "user": { "profile_url": "https://chart-studio.plotly.com/~PythonPlotBot", "avatar_url": "https://storage.googleapis.com/plotly-prod-profiles/15.jpg", "background_url": "https://storage.googleapis.com/plotly-prod-profiles/bg-14.jpg", "bio": "", "nickname": "", "website": "", "stream_tokens": null, "feature_set_id": null, "csrf_token": null, "date_joined": "2017-02-14 21:07:30", "mapbox_access_tokens": null, "has_password": null, "username": "PythonPlotBot", "email": null, "is_active": null, "readonly": null, "is_dash_creator": null, "dash_created_count": null, "is_chart_creator": null, "charts_created_count": null } }, { "creation_time": "2019-03-20T19:34:06.011081Z", "comments": { "results": [], "count": 0 }, "parented": true, "embed_url": "https://chart-studio.plotly.com/~PythonPlotBot/3239.embed", "fid": "PythonPlotBot:3239", "filename": "custom-sized-subplot-with-subplot-titles", "filetype": "plot", "img_url": "https://storage.googleapis.com/plotly-prod-images/PythonPlotBot/3239/9_4XA6UIOTF4BLMLUZHCRLCUBH9SCC8Q.png", "image_urls": { "default": "https://storage.googleapis.com/plotly-prod-images/PythonPlotBot/3239/2_R2ADKNVL4PMHITGZ4QQT47TZA29MQG.png", "block-thumb": "https://storage.googleapis.com/plotly-prod-images/PythonPlotBot/3239/8_T1AY7ENRMVALZ18FWCSNQRML0P20ZK.png", "list-thumb": "https://storage.googleapis.com/plotly-prod-images/PythonPlotBot/3239/9_4XA6UIOTF4BLMLUZHCRLCUBH9SCC8Q.png" }, "api_urls": { "files": "https://api.plotly.com/v2/files/PythonPlotBot:3239", "plots": "https://api.plotly.com/v2/plots/PythonPlotBot:3239", "parent": "https://api.plotly.com/v2/folders/home?user=PythonPlotBot" }, "owner": "PythonPlotBot", "parent": -1, "preview": "", "referencers": [], "references": [], "title": "Specs with Subplot Title", "views": 3, "web_url": "https://chart-studio.plotly.com/~PythonPlotBot/3239/specs-with-subplot-title/", "world_readable": true, "date_modified": "2019-03-20T19:34:07.189Z", "stars": { "results": [], "count": 0 }, "collaborators": { "results": [], "count": 0 }, "subfolder_count": null, "refresh_interval": null, "organize_view_url": "https://chart-studio.plotly.com/~PythonPlotBot/3239/", "current_user_permission": "read", "is_theme": null, "is_template": null, "autosize": true, "caption": "", "figure": { "data": [ { "uid": "abc3e924-8fae-4a78-a9c2-07845c2cc475", "type": "scatter", "xsrc": "PythonPlotBot:3240:ff4d1e", "ysrc": "PythonPlotBot:3240:2dbd6d", "xaxis": "x", "yaxis": "y" }, { "uid": "3623be87-fd49-4a68-ae30-2f6d8dab7624", "type": "scatter", "xsrc": "PythonPlotBot:3240:ff4d1e", "ysrc": "PythonPlotBot:3240:2dbd6d", "xaxis": "x2", "yaxis": "y2" }, { "uid": "42e17094-ae92-42a0-8543-124a82479c4d", "type": "scatter", "xsrc": "PythonPlotBot:3240:cc3129", "ysrc": "PythonPlotBot:3240:23a4a5", "xaxis": "x3", "yaxis": "y3" } ], "layout": { "title": { "text": "Specs with Subplot Title" }, "xaxis": { "anchor": "y", "domain": [ 0.0, 0.45 ] }, "yaxis": { "anchor": "x", "domain": [ 0.625, 1.0 ] }, "xaxis2": { "anchor": "y2", "domain": [ 0.55, 1.0 ] }, "xaxis3": { "anchor": "y3", "domain": [ 0.0, 1.0 ] }, "yaxis2": { "anchor": "x2", "domain": [ 0.625, 1.0 ] }, "yaxis3": { "anchor": "x3", "domain": [ 0.0, 0.375 ] }, "showlegend": false, "annotations": [ { "x": 0.225, "y": 1.0, "font": { "size": 16 }, "text": "First Subplot", "xref": "paper", "yref": "paper", "xanchor": "center", "yanchor": "bottom", "showarrow": false }, { "x": 0.775, "y": 1.0, "font": { "size": 16 }, "text": "Second Subplot", "xref": "paper", "yref": "paper", "xanchor": "center", "yanchor": "bottom", "showarrow": false }, { "x": 0.5, "y": 0.375, "font": { "size": 16 }, "text": "Third Subplot", "xref": "paper", "yref": "paper", "xanchor": "center", "yanchor": "bottom", "showarrow": false } ] } }, "height": null, "width": null, "user": { "profile_url": "https://chart-studio.plotly.com/~PythonPlotBot", "avatar_url": "https://storage.googleapis.com/plotly-prod-profiles/15.jpg", "background_url": "https://storage.googleapis.com/plotly-prod-profiles/bg-14.jpg", "bio": "", "nickname": "", "website": "", "stream_tokens": null, "feature_set_id": null, "csrf_token": null, "date_joined": "2017-02-14 21:07:30", "mapbox_access_tokens": null, "has_password": null, "username": "PythonPlotBot", "email": null, "is_active": null, "readonly": null, "is_dash_creator": null, "dash_created_count": null, "is_chart_creator": null, "charts_created_count": null } } ] }
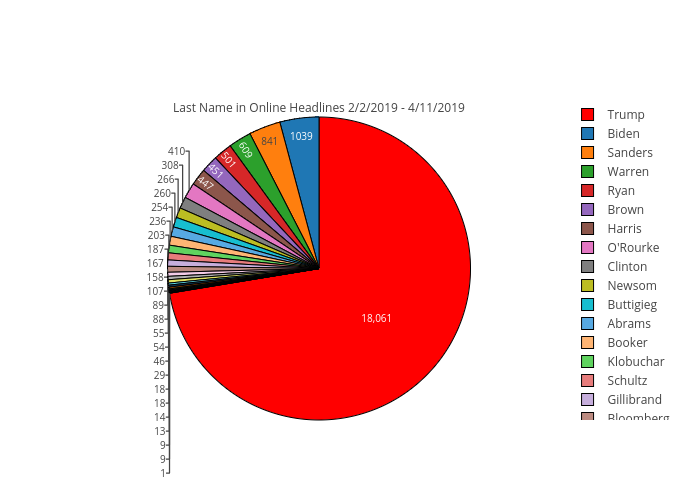
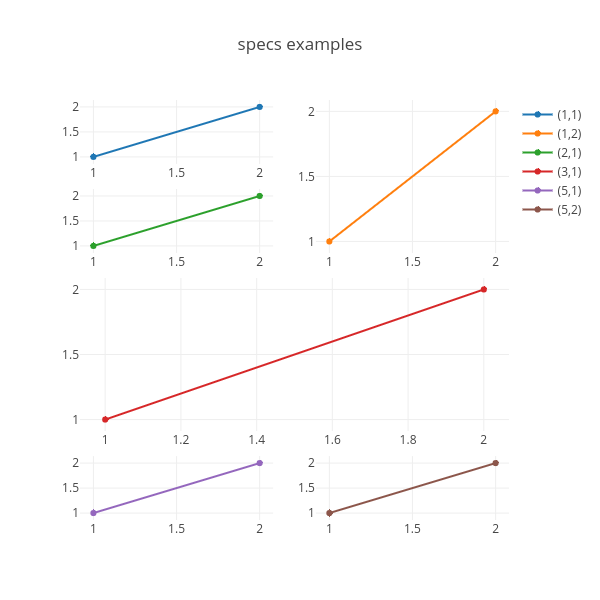
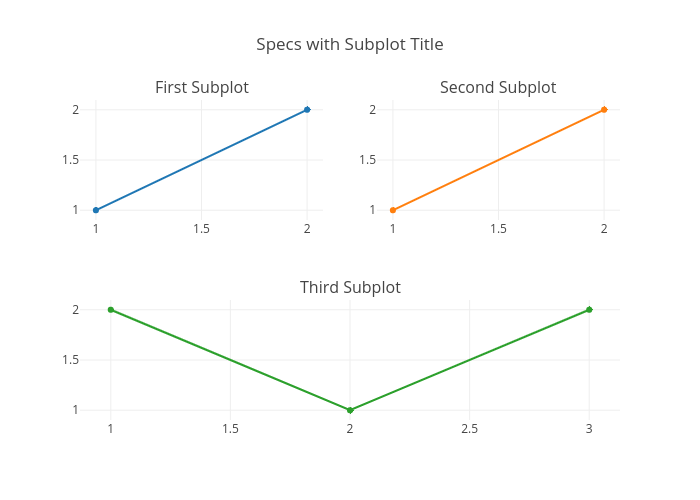