Plots List
Plots
This endpoint handles manipulation of Plotly plot files.
Reference
Authorization
Any user with or without a Plotly account may view public plots. For private plots, see authentication.
Actions
list
Listing all public plots can be done via a GET request to this endpoint.
By default, plots will be listed in order of date created. The order_by
query parameter is accepted at this endpoint. Currently, only ordering by
views is supported. It is possible to filter the plots by quality
with min_quality or max_quality as query parameter.
Example:
// GET https://api.plotly.com/v2/plots/ ---> 200

// GET https://api.plotly.com/v2/plots/?order_by=-views ---> 200

// GET https://api.plotly.com/v2/plots/?min_quality=5 ---> 200

// GET https://api.plotly.com/v2/plots/?max_quality=5 ---> 200
feed
Listing all handpicked feed plots can be done via a GET request to this endpoint. By default, plots will be listed in a random order.
Example:
// GET https://api.plotly.com/v2/plots/feed ---> 200
create
You can create new plot resources here. The only required field is 'figure'. Currently, the figure is restricted to only contain references to grid data. That is, this will fail if raw data arrays are passed in. To create and manipulate underlying grids for plots, see the grids endpoint.
Example:
// This fails because a figure field is required.
// POST https://api.plotly.com/v2/plots ---> 400 Bad Request
{}

// This fails because the figure has raw data
//POST https://api.plotly.com/v2/plots ---> 400 Bad Request
{
    "figure": {"data": [{"y": ['this', 'is', 'raw', 'data']}]}
}

// This succeeds because the figure has src keys, not raw data.
//POST https://api.plotly.com/v2/plots ---> 200 OK
{
    "figure": {"data": [{"ysrc": "sven:88:u8nd62"}]}
}
When creating a grid, you can optionally specify a source_fid to specify where a plot has come from:
- source_fid: the fid of a plot that was copied (and presumably edited) to produce this one
detail
There is a lot of meta information stored about plot files including filename, title, share_url, and content_url to name a few.
This information can only be reached with a GET to this endpoint.
Example:
// GET https://api.plotly.com/v2/plots/iheartgraphs:90
content
The contents of a plot can be downloaded via the content resource. The plot
content contains referenced grid/column data by default. If you wish to
return the raw grid/column data, the inline_data=true query must be included
in the request url. The Content-Type header will be appropriately set for the
response body.
Alternatively, you can set ?map_data=unreadable to append a mapping of
sources to data that belongs to grids which are unreadable for the
requestor. This is useful when you have read access to another users plot,
but that plot contains grid references which you don't have access to.
Examples:
// Returns referenced grid/column data
// GET https://api.plotly.com/v2/plots/iheartgraphs:90/content ---> 200 OK

// Returns full grid/column data
// GET https://api.plotly.com/v2/plots/iheartgraphs:90/content?inline_data=true ---> 200 OK

// Returns full grid/column data when requestor doesn't have permission
// to read the referenced grid.
// GET https://api.plotly.com/v2/plots/iheartgraphs:90/content?map_data=unreadable ---> 200 OK
GET /v2/plots?cursor=cD0yMDE5LTAzLTIwKzE5JTNBMzQlM0EwNi4wMTEwODElMkIwMCUzQTAw&format=api
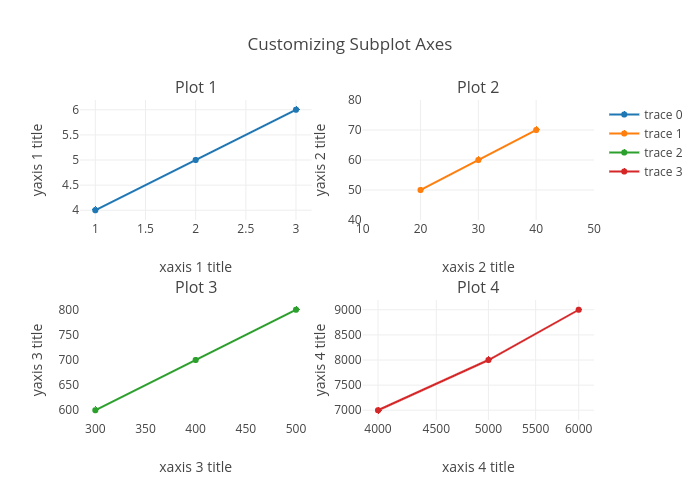
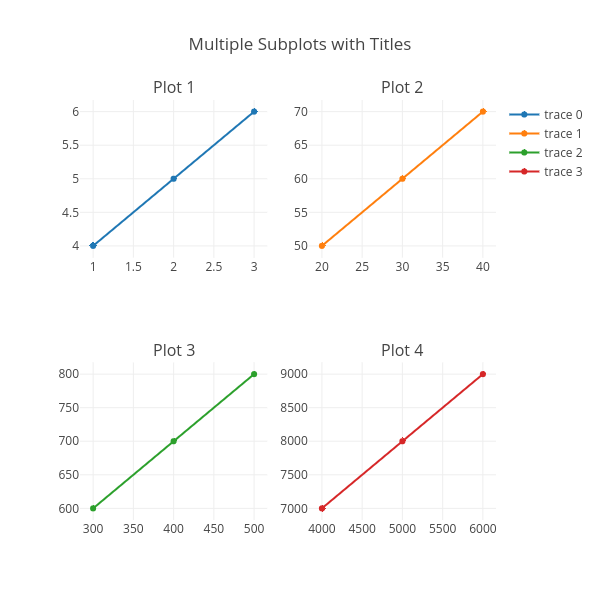
{ "next": "https://api.plot.ly/v2/plots?cursor=cD0yMDE5LTAzLTIwKzE5JTNBMzIlM0EwNy4yNzc4NTMlMkIwMCUzQTAw&format=api", "previous": "https://api.plot.ly/v2/plots?cursor=cj0xJnA9MjAxOS0wMy0yMCsxOSUzQTMzJTNBNTguODY3MDg1JTJCMDAlM0EwMA%3D%3D&format=api", "results": [ { "creation_time": "2019-03-20T19:33:58.867085Z", "comments": { "results": [], "count": 0 }, "parented": true, "embed_url": "https://chart-studio.plotly.com/~PythonPlotBot/3237.embed", "fid": "PythonPlotBot:3237", "filename": "stacked-subplots", "filetype": "plot", "img_url": "https://storage.googleapis.com/plotly-prod-images/PythonPlotBot/3237/9_V4I4C5AVOJ1S9CHSMIWZHX8U8LYGSM.png", "image_urls": { "default": "https://storage.googleapis.com/plotly-prod-images/PythonPlotBot/3237/2_BRTEA3EBNRPELSF8B7PRC5Y9EOJTDW.png", "block-thumb": "https://storage.googleapis.com/plotly-prod-images/PythonPlotBot/3237/8_5EGU53P60N2LWZDP0UOYKQBEI91R3X.png", "list-thumb": "https://storage.googleapis.com/plotly-prod-images/PythonPlotBot/3237/9_V4I4C5AVOJ1S9CHSMIWZHX8U8LYGSM.png" }, "api_urls": { "files": "https://api.plotly.com/v2/files/PythonPlotBot:3237", "plots": "https://api.plotly.com/v2/plots/PythonPlotBot:3237", "parent": "https://api.plotly.com/v2/folders/home?user=PythonPlotBot" }, "owner": "PythonPlotBot", "parent": -1, "preview": "", "referencers": [], "references": [], "title": "Stacked subplots", "views": 3, "web_url": "https://chart-studio.plotly.com/~PythonPlotBot/3237/stacked-subplots/", "world_readable": true, "date_modified": "2019-03-20T19:34:01.249Z", "stars": { "results": [], "count": 0 }, "collaborators": { "results": [], "count": 0 }, "subfolder_count": null, "refresh_interval": null, "organize_view_url": "https://chart-studio.plotly.com/~PythonPlotBot/3237/", "current_user_permission": "read", "is_theme": null, "is_template": null, "autosize": true, "caption": "", "figure": { "data": [ { "uid": "d59645ec-adfe-41fe-8151-bf86925408c2", "type": "scatter", "xsrc": "PythonPlotBot:3238:3930fe", "ysrc": "PythonPlotBot:3238:3421bd", "xaxis": "x", "yaxis": "y" }, { "uid": "b0450324-29d2-43bd-8c63-7f2b6ddf02d2", "type": "scatter", "xsrc": "PythonPlotBot:3238:8cf3d1", "ysrc": "PythonPlotBot:3238:567550", "xaxis": "x2", "yaxis": "y2" }, { "uid": "ab8d0926-e180-44e6-86cf-d1333dc84f6a", "type": "scatter", "xsrc": "PythonPlotBot:3238:89acb1", "ysrc": "PythonPlotBot:3238:b14ee5", "xaxis": "x3", "yaxis": "y3" } ], "layout": { "title": { "text": "Stacked subplots" }, "width": 600, "xaxis": { "anchor": "y", "domain": [ 0.0, 1.0 ] }, "yaxis": { "anchor": "x", "domain": [ 0.7333333333333333, 1.0 ] }, "height": 600, "xaxis2": { "anchor": "y2", "domain": [ 0.0, 1.0 ] }, "xaxis3": { "anchor": "y3", "domain": [ 0.0, 1.0 ] }, "yaxis2": { "anchor": "x2", "domain": [ 0.36666666666666664, 0.6333333333333333 ] }, "yaxis3": { "anchor": "x3", "domain": [ 0.0, 0.26666666666666666 ] } } }, "height": 600, "width": 600, "user": { "profile_url": "https://chart-studio.plotly.com/~PythonPlotBot", "avatar_url": "https://storage.googleapis.com/plotly-prod-profiles/15.jpg", "background_url": "https://storage.googleapis.com/plotly-prod-profiles/bg-14.jpg", "bio": "", "nickname": "", "website": "", "stream_tokens": null, "feature_set_id": null, "csrf_token": null, "date_joined": "2017-02-14 21:07:30", "mapbox_access_tokens": null, "has_password": null, "username": "PythonPlotBot", "email": null, "is_active": null, "readonly": null, "is_dash_creator": null, "dash_created_count": null, "is_chart_creator": null, "charts_created_count": null } }, { "creation_time": "2019-03-20T19:33:55.830583Z", "comments": { "results": [], "count": 0 }, "parented": true, "embed_url": "https://chart-studio.plotly.com/~PythonPlotBot/3235.embed", "fid": "PythonPlotBot:3235", "filename": "shared-axes-subplots", "filetype": "plot", "img_url": "https://storage.googleapis.com/plotly-prod-images/PythonPlotBot/3235/9_UKMQS4LQGOREH4K8T6SWXQ7TUXFAD2.png", "image_urls": { "default": "https://storage.googleapis.com/plotly-prod-images/PythonPlotBot/3235/2_NQ0884XK6NQ80N6WTQ56HB5ZHYPDYD.png", "block-thumb": "https://storage.googleapis.com/plotly-prod-images/PythonPlotBot/3235/8_1N5DXXUMC44OL3G0AD214GLJPIUNOH.png", "list-thumb": "https://storage.googleapis.com/plotly-prod-images/PythonPlotBot/3235/9_UKMQS4LQGOREH4K8T6SWXQ7TUXFAD2.png" }, "api_urls": { "files": "https://api.plotly.com/v2/files/PythonPlotBot:3235", "plots": "https://api.plotly.com/v2/plots/PythonPlotBot:3235", "parent": "https://api.plotly.com/v2/folders/home?user=PythonPlotBot" }, "owner": "PythonPlotBot", "parent": -1, "preview": "", "referencers": [], "references": [], "title": "", "views": 3, "web_url": "https://chart-studio.plotly.com/~PythonPlotBot/3235/", "world_readable": true, "date_modified": "2019-03-20T19:33:56.977Z", "stars": { "results": [], "count": 0 }, "collaborators": { "results": [], "count": 0 }, "subfolder_count": null, "refresh_interval": null, "organize_view_url": "https://chart-studio.plotly.com/~PythonPlotBot/3235/", "current_user_permission": "read", "is_theme": null, "is_template": null, "autosize": true, "caption": "", "figure": { "data": [ { "uid": "634c8a28-43ab-47a3-b1fc-5b1494a9930c", "type": "scatter", "xsrc": "PythonPlotBot:3236:e34998", "ysrc": "PythonPlotBot:3236:5ad91c" }, { "uid": "72124281-8545-4210-a365-189123b4b457", "type": "scatter", "xsrc": "PythonPlotBot:3236:e861a5", "ysrc": "PythonPlotBot:3236:009f52", "xaxis": "x2", "yaxis": "y" }, { "uid": "8f5bfd53-6d9e-42fa-8a61-45e56fc4f05e", "type": "scatter", "xsrc": "PythonPlotBot:3236:fd99eb", "ysrc": "PythonPlotBot:3236:fb4209", "xaxis": "x", "yaxis": "y3" }, { "uid": "dcc39f90-e2ab-4335-9b87-77efe57904b5", "type": "scatter", "xsrc": "PythonPlotBot:3236:8904da", "ysrc": "PythonPlotBot:3236:0931c1", "xaxis": "x4", "yaxis": "y4" } ], "layout": { "xaxis": { "domain": [ 0, 0.45 ] }, "yaxis": { "domain": [ 0, 0.45 ] }, "xaxis2": { "domain": [ 0.55, 1 ] }, "xaxis4": { "anchor": "y4", "domain": [ 0.55, 1 ] }, "yaxis3": { "domain": [ 0.55, 1 ] }, "yaxis4": { "anchor": "x4", "domain": [ 0.55, 1 ] } } }, "height": null, "width": null, "user": { "profile_url": "https://chart-studio.plotly.com/~PythonPlotBot", "avatar_url": "https://storage.googleapis.com/plotly-prod-profiles/15.jpg", "background_url": "https://storage.googleapis.com/plotly-prod-profiles/bg-14.jpg", "bio": "", "nickname": "", "website": "", "stream_tokens": null, "feature_set_id": null, "csrf_token": null, "date_joined": "2017-02-14 21:07:30", "mapbox_access_tokens": null, "has_password": null, "username": "PythonPlotBot", "email": null, "is_active": null, "readonly": null, "is_dash_creator": null, "dash_created_count": null, "is_chart_creator": null, "charts_created_count": null } }, { "creation_time": "2019-03-20T19:33:51.915812Z", "comments": { "results": [], "count": 0 }, "parented": true, "embed_url": "https://chart-studio.plotly.com/~PythonPlotBot/3233.embed", "fid": "PythonPlotBot:3233", "filename": "multiple-subplots-shared-yaxes", "filetype": "plot", "img_url": "https://storage.googleapis.com/plotly-prod-images/PythonPlotBot/3233/9_YG8NP63ICP2A00NJNZJEC87ATJDCTM.png", "image_urls": { "default": "https://storage.googleapis.com/plotly-prod-images/PythonPlotBot/3233/2_M2VK4VORZJQ7U8EPNWPSVOCM0E67H4.png", "block-thumb": "https://storage.googleapis.com/plotly-prod-images/PythonPlotBot/3233/8_XN7JS8Q42BYNFWC2P8RA9P8WT9O609.png", "list-thumb": "https://storage.googleapis.com/plotly-prod-images/PythonPlotBot/3233/9_YG8NP63ICP2A00NJNZJEC87ATJDCTM.png" }, "api_urls": { "files": "https://api.plotly.com/v2/files/PythonPlotBot:3233", "plots": "https://api.plotly.com/v2/plots/PythonPlotBot:3233", "parent": "https://api.plotly.com/v2/folders/home?user=PythonPlotBot" }, "owner": "PythonPlotBot", "parent": -1, "preview": "", "referencers": [], "references": [], "title": "Multiple Subplots with Shared Y-Axes", "views": 3, "web_url": "https://chart-studio.plotly.com/~PythonPlotBot/3233/multiple-subplots-with-shared-y-axes/", "world_readable": true, "date_modified": "2019-03-20T19:33:54.037Z", "stars": { "results": [], "count": 0 }, "collaborators": { "results": [], "count": 0 }, "subfolder_count": null, "refresh_interval": null, "organize_view_url": "https://chart-studio.plotly.com/~PythonPlotBot/3233/", "current_user_permission": "read", "is_theme": null, "is_template": null, "autosize": true, "caption": "", "figure": { "data": [ { "uid": "46b1b0e5-7968-4278-a7fd-270103d54c21", "type": "scatter", "xsrc": "PythonPlotBot:3234:835c2e", "ysrc": "PythonPlotBot:3234:ef9a84", "xaxis": "x", "yaxis": "y" }, { "uid": "f7510d65-7237-400b-b205-96d39245b890", "type": "scatter", "xsrc": "PythonPlotBot:3234:e1fbc3", "ysrc": "PythonPlotBot:3234:ae04bd", "xaxis": "x2", "yaxis": "y" }, { "uid": "c7cdf384-91f1-4e1c-8a1d-f95158f2a101", "type": "scatter", "xsrc": "PythonPlotBot:3234:55c184", "ysrc": "PythonPlotBot:3234:f98731", "xaxis": "x3", "yaxis": "y2" }, { "uid": "0eca330e-5607-4046-b825-c43c00cd792f", "type": "scatter", "xsrc": "PythonPlotBot:3234:5d94f9", "ysrc": "PythonPlotBot:3234:c4fcaf", "xaxis": "x4", "yaxis": "y2" } ], "layout": { "title": { "text": "Multiple Subplots with Shared Y-Axes" }, "width": 600, "xaxis": { "anchor": "y", "domain": [ 0.0, 0.45 ] }, "yaxis": { "anchor": "x", "domain": [ 0.575, 1.0 ] }, "height": 600, "xaxis2": { "anchor": "free", "domain": [ 0.55, 1.0 ], "position": 0.575 }, "xaxis3": { "anchor": "y2", "domain": [ 0.0, 0.45 ] }, "xaxis4": { "anchor": "free", "domain": [ 0.55, 1.0 ], "position": 0.0 }, "yaxis2": { "anchor": "x3", "domain": [ 0.0, 0.425 ] } } }, "height": 600, "width": 600, "user": { "profile_url": "https://chart-studio.plotly.com/~PythonPlotBot", "avatar_url": "https://storage.googleapis.com/plotly-prod-profiles/15.jpg", "background_url": "https://storage.googleapis.com/plotly-prod-profiles/bg-14.jpg", "bio": "", "nickname": "", "website": "", "stream_tokens": null, "feature_set_id": null, "csrf_token": null, "date_joined": "2017-02-14 21:07:30", "mapbox_access_tokens": null, "has_password": null, "username": "PythonPlotBot", "email": null, "is_active": null, "readonly": null, "is_dash_creator": null, "dash_created_count": null, "is_chart_creator": null, "charts_created_count": null } }, { "creation_time": "2019-03-20T19:33:48.258959Z", "comments": { "results": [], "count": 0 }, "parented": true, "embed_url": "https://chart-studio.plotly.com/~PythonPlotBot/3231.embed", "fid": "PythonPlotBot:3231", "filename": "stacked-subplots-shared-xaxes", "filetype": "plot", "img_url": "https://storage.googleapis.com/plotly-prod-images/PythonPlotBot/3231/9_CV5T0MG9RQX4JLH13CF0AWIL9CLHHL.png", "image_urls": { "default": "https://storage.googleapis.com/plotly-prod-images/PythonPlotBot/3231/2_LVCFU6DDDSOG94GHR2OLURV03AIO9G.png", "block-thumb": "https://storage.googleapis.com/plotly-prod-images/PythonPlotBot/3231/8_XJ8QPH3FVKF38XN88R9P0PI8V90HIS.png", "list-thumb": "https://storage.googleapis.com/plotly-prod-images/PythonPlotBot/3231/9_CV5T0MG9RQX4JLH13CF0AWIL9CLHHL.png" }, "api_urls": { "files": "https://api.plotly.com/v2/files/PythonPlotBot:3231", "plots": "https://api.plotly.com/v2/plots/PythonPlotBot:3231", "parent": "https://api.plotly.com/v2/folders/home?user=PythonPlotBot" }, "owner": "PythonPlotBot", "parent": -1, "preview": "", "referencers": [], "references": [], "title": "Stacked Subplots with Shared X-Axes", "views": 3, "web_url": "https://chart-studio.plotly.com/~PythonPlotBot/3231/stacked-subplots-with-shared-x-axes/", "world_readable": true, "date_modified": "2019-03-20T19:33:49.756Z", "stars": { "results": [], "count": 0 }, "collaborators": { "results": [], "count": 0 }, "subfolder_count": null, "refresh_interval": null, "organize_view_url": "https://chart-studio.plotly.com/~PythonPlotBot/3231/", "current_user_permission": "read", "is_theme": null, "is_template": null, "autosize": true, "caption": "", "figure": { "data": [ { "uid": "84086c39-3658-4930-9045-15a17e25e45b", "type": "scatter", "xsrc": "PythonPlotBot:3232:8e5027", "ysrc": "PythonPlotBot:3232:6ca79f", "xaxis": "x", "yaxis": "y3" }, { "uid": "81475b9e-c1a5-4e52-863b-dc4c49ffa67f", "type": "scatter", "xsrc": "PythonPlotBot:3232:d66afb", "ysrc": "PythonPlotBot:3232:840a24", "xaxis": "x", "yaxis": "y2" }, { "uid": "b74ea69e-8c83-4593-9bec-43132ae2ff64", "type": "scatter", "xsrc": "PythonPlotBot:3232:b81e3d", "ysrc": "PythonPlotBot:3232:f729ba", "xaxis": "x", "yaxis": "y" } ], "layout": { "title": { "text": "Stacked Subplots with Shared X-Axes" }, "width": 600, "xaxis": { "anchor": "y3", "domain": [ 0.0, 1.0 ] }, "yaxis": { "anchor": "free", "domain": [ 0.6673333333333333, 1.0 ], "position": 0.0 }, "height": 600, "yaxis2": { "anchor": "free", "domain": [ 0.33366666666666667, 0.6663333333333333 ], "position": 0.0 }, "yaxis3": { "anchor": "x", "domain": [ 0.0, 0.33266666666666667 ] } } }, "height": 600, "width": 600, "user": { "profile_url": "https://chart-studio.plotly.com/~PythonPlotBot", "avatar_url": "https://storage.googleapis.com/plotly-prod-profiles/15.jpg", "background_url": "https://storage.googleapis.com/plotly-prod-profiles/bg-14.jpg", "bio": "", "nickname": "", "website": "", "stream_tokens": null, "feature_set_id": null, "csrf_token": null, "date_joined": "2017-02-14 21:07:30", "mapbox_access_tokens": null, "has_password": null, "username": "PythonPlotBot", "email": null, "is_active": null, "readonly": null, "is_dash_creator": null, "dash_created_count": null, "is_chart_creator": null, "charts_created_count": null } }, { "creation_time": "2019-03-20T19:33:34.749503Z", "comments": { "results": [], "count": 0 }, "parented": true, "embed_url": "https://chart-studio.plotly.com/~PythonPlotBot/3229.embed", "fid": "PythonPlotBot:3229", "filename": "customizing-subplot-axes", "filetype": "plot", "img_url": "https://storage.googleapis.com/plotly-prod-images/PythonPlotBot/3229/9_U5FPRCXJWNVVQ9KXP8SGFADTNFU4UG.png", "image_urls": { "default": "https://storage.googleapis.com/plotly-prod-images/PythonPlotBot/3229/2_YQ5WRSLUVRR4OLB2TNK53AC2E9QLSX.png", "block-thumb": "https://storage.googleapis.com/plotly-prod-images/PythonPlotBot/3229/8_Z6J0JMBCOX58C0JB7MOG1D1LZL8XSD.png", "list-thumb": "https://storage.googleapis.com/plotly-prod-images/PythonPlotBot/3229/9_U5FPRCXJWNVVQ9KXP8SGFADTNFU4UG.png" }, "api_urls": { "files": "https://api.plotly.com/v2/files/PythonPlotBot:3229", "plots": "https://api.plotly.com/v2/plots/PythonPlotBot:3229", "parent": "https://api.plotly.com/v2/folders/home?user=PythonPlotBot" }, "owner": "PythonPlotBot", "parent": -1, "preview": "", "referencers": [], "references": [], "title": "Customizing Subplot Axes", "views": 3, "web_url": "https://chart-studio.plotly.com/~PythonPlotBot/3229/customizing-subplot-axes/", "world_readable": true, "date_modified": "2019-03-20T19:33:37.207Z", "stars": { "results": [], "count": 0 }, "collaborators": { "results": [], "count": 0 }, "subfolder_count": null, "refresh_interval": null, "organize_view_url": "https://chart-studio.plotly.com/~PythonPlotBot/3229/", "current_user_permission": "read", "is_theme": null, "is_template": null, "autosize": true, "caption": "", "figure": { "data": [ { "uid": "690dcf7e-3b79-4f15-b789-f722488886ef", "type": "scatter", "xsrc": "PythonPlotBot:3230:9b77d2", "ysrc": "PythonPlotBot:3230:afbcdb", "xaxis": "x", "yaxis": "y" }, { "uid": "159704e5-6fce-4d9b-8d78-d3e43b450dc1", "type": "scatter", "xsrc": "PythonPlotBot:3230:bc1b65", "ysrc": "PythonPlotBot:3230:6bd0b2", "xaxis": "x2", "yaxis": "y2" }, { "uid": "23f3fce9-f430-4f17-b1ab-c90e93393df8", "type": "scatter", "xsrc": "PythonPlotBot:3230:9ac479", "ysrc": "PythonPlotBot:3230:a40716", "xaxis": "x3", "yaxis": "y3" }, { "uid": "4041aabf-4121-45e3-bd94-9a98c9faf7c2", "type": "scatter", "xsrc": "PythonPlotBot:3230:951f0e", "ysrc": "PythonPlotBot:3230:ca3b61", "xaxis": "x4", "yaxis": "y4" } ], "layout": { "title": { "text": "Customizing Subplot Axes" }, "xaxis": { "title": { "text": "xaxis 1 title" }, "anchor": "y", "domain": [ 0.0, 0.45 ] }, "yaxis": { "title": { "text": "yaxis 1 title" }, "anchor": "x", "domain": [ 0.625, 1.0 ] }, "xaxis2": { "range": [ 10, 50 ], "title": { "text": "xaxis 2 title" }, "anchor": "y2", "domain": [ 0.55, 1.0 ] }, "xaxis3": { "title": { "text": "xaxis 3 title" }, "anchor": "y3", "domain": [ 0.0, 0.45 ], "showgrid": false }, "xaxis4": { "type": "log", "title": { "text": "xaxis 4 title" }, "anchor": "y4", "domain": [ 0.55, 1.0 ] }, "yaxis2": { "range": [ 40, 80 ], "title": { "text": "yaxis 2 title" }, "anchor": "x2", "domain": [ 0.625, 1.0 ] }, "yaxis3": { "title": { "text": "yaxis 3 title" }, "anchor": "x3", "domain": [ 0.0, 0.375 ], "showgrid": false }, "yaxis4": { "title": { "text": "yaxis 4 title" }, "anchor": "x4", "domain": [ 0.0, 0.375 ] }, "annotations": [ { "x": 0.225, "y": 1.0, "font": { "size": 16 }, "text": "Plot 1", "xref": "paper", "yref": "paper", "xanchor": "center", "yanchor": "bottom", "showarrow": false }, { "x": 0.775, "y": 1.0, "font": { "size": 16 }, "text": "Plot 2", "xref": "paper", "yref": "paper", "xanchor": "center", "yanchor": "bottom", "showarrow": false }, { "x": 0.225, "y": 0.375, "font": { "size": 16 }, "text": "Plot 3", "xref": "paper", "yref": "paper", "xanchor": "center", "yanchor": "bottom", "showarrow": false }, { "x": 0.775, "y": 0.375, "font": { "size": 16 }, "text": "Plot 4", "xref": "paper", "yref": "paper", "xanchor": "center", "yanchor": "bottom", "showarrow": false } ] } }, "height": null, "width": null, "user": { "profile_url": "https://chart-studio.plotly.com/~PythonPlotBot", "avatar_url": "https://storage.googleapis.com/plotly-prod-profiles/15.jpg", "background_url": "https://storage.googleapis.com/plotly-prod-profiles/bg-14.jpg", "bio": "", "nickname": "", "website": "", "stream_tokens": null, "feature_set_id": null, "csrf_token": null, "date_joined": "2017-02-14 21:07:30", "mapbox_access_tokens": null, "has_password": null, "username": "PythonPlotBot", "email": null, "is_active": null, "readonly": null, "is_dash_creator": null, "dash_created_count": null, "is_chart_creator": null, "charts_created_count": null } }, { "creation_time": "2019-03-20T19:33:15.954813Z", "comments": { "results": [], "count": 0 }, "parented": true, "embed_url": "https://chart-studio.plotly.com/~PythonPlotBot/3227.embed", "fid": "PythonPlotBot:3227", "filename": "make-subplots-multiple-with-titles", "filetype": "plot", "img_url": "https://storage.googleapis.com/plotly-prod-images/PythonPlotBot/3227/9_4OOSO7Z2GYYFM7TCWOMZOCA59AFJDA.png", "image_urls": { "default": "https://storage.googleapis.com/plotly-prod-images/PythonPlotBot/3227/2_0DVU4KCPWOSF16KKVAM9G2AU7E64S8.png", "block-thumb": "https://storage.googleapis.com/plotly-prod-images/PythonPlotBot/3227/8_JB221WOV1IIYMZLCZJKDH5J7XZI7IU.png", "list-thumb": "https://storage.googleapis.com/plotly-prod-images/PythonPlotBot/3227/9_4OOSO7Z2GYYFM7TCWOMZOCA59AFJDA.png" }, "api_urls": { "files": "https://api.plotly.com/v2/files/PythonPlotBot:3227", "plots": "https://api.plotly.com/v2/plots/PythonPlotBot:3227", "parent": "https://api.plotly.com/v2/folders/home?user=PythonPlotBot" }, "owner": "PythonPlotBot", "parent": -1, "preview": "", "referencers": [], "references": [], "title": "Multiple Subplots with Titles", "views": 8, "web_url": "https://chart-studio.plotly.com/~PythonPlotBot/3227/multiple-subplots-with-titles/", "world_readable": true, "date_modified": "2019-03-20T19:33:16.840Z", "stars": { "results": [], "count": 0 }, "collaborators": { "results": [], "count": 0 }, "subfolder_count": null, "refresh_interval": null, "organize_view_url": "https://chart-studio.plotly.com/~PythonPlotBot/3227/", "current_user_permission": "read", "is_theme": null, "is_template": null, "autosize": true, "caption": "", "figure": { "data": [ { "uid": "b56826e9-68c6-4f8c-9ce4-76a1035a82b7", "type": "scatter", "xsrc": "PythonPlotBot:3228:7aa767", "ysrc": "PythonPlotBot:3228:5e1323", "xaxis": "x", "yaxis": "y" }, { "uid": "ebca8dac-54a2-4b9b-b4fa-34b574cfe518", "type": "scatter", "xsrc": "PythonPlotBot:3228:e5d26b", "ysrc": "PythonPlotBot:3228:64c191", "xaxis": "x2", "yaxis": "y2" }, { "uid": "29d5c1e4-bddf-40f6-bfd9-95d4e2356308", "type": "scatter", "xsrc": "PythonPlotBot:3228:8e7bd4", "ysrc": "PythonPlotBot:3228:10baf1", "xaxis": "x3", "yaxis": "y3" }, { "uid": "0e03b0f6-c49c-416d-8d3d-7d8a6e15d327", "type": "scatter", "xsrc": "PythonPlotBot:3228:b3ba0e", "ysrc": "PythonPlotBot:3228:4d5008", "xaxis": "x4", "yaxis": "y4" } ], "layout": { "title": { "text": "Multiple Subplots with Titles" }, "width": 600, "xaxis": { "anchor": "y", "domain": [ 0.0, 0.45 ] }, "yaxis": { "anchor": "x", "domain": [ 0.625, 1.0 ] }, "height": 600, "xaxis2": { "anchor": "y2", "domain": [ 0.55, 1.0 ] }, "xaxis3": { "anchor": "y3", "domain": [ 0.0, 0.45 ] }, "xaxis4": { "anchor": "y4", "domain": [ 0.55, 1.0 ] }, "yaxis2": { "anchor": "x2", "domain": [ 0.625, 1.0 ] }, "yaxis3": { "anchor": "x3", "domain": [ 0.0, 0.375 ] }, "yaxis4": { "anchor": "x4", "domain": [ 0.0, 0.375 ] }, "annotations": [ { "x": 0.225, "y": 1.0, "font": { "size": 16 }, "text": "Plot 1", "xref": "paper", "yref": "paper", "xanchor": "center", "yanchor": "bottom", "showarrow": false }, { "x": 0.775, "y": 1.0, "font": { "size": 16 }, "text": "Plot 2", "xref": "paper", "yref": "paper", "xanchor": "center", "yanchor": "bottom", "showarrow": false }, { "x": 0.225, "y": 0.375, "font": { "size": 16 }, "text": "Plot 3", "xref": "paper", "yref": "paper", "xanchor": "center", "yanchor": "bottom", "showarrow": false }, { "x": 0.775, "y": 0.375, "font": { "size": 16 }, "text": "Plot 4", "xref": "paper", "yref": "paper", "xanchor": "center", "yanchor": "bottom", "showarrow": false } ] } }, "height": 600, "width": 600, "user": { "profile_url": "https://chart-studio.plotly.com/~PythonPlotBot", "avatar_url": "https://storage.googleapis.com/plotly-prod-profiles/15.jpg", "background_url": "https://storage.googleapis.com/plotly-prod-profiles/bg-14.jpg", "bio": "", "nickname": "", "website": "", "stream_tokens": null, "feature_set_id": null, "csrf_token": null, "date_joined": "2017-02-14 21:07:30", "mapbox_access_tokens": null, "has_password": null, "username": "PythonPlotBot", "email": null, "is_active": null, "readonly": null, "is_dash_creator": null, "dash_created_count": null, "is_chart_creator": null, "charts_created_count": null } }, { "creation_time": "2019-03-20T19:33:03.958893Z", "comments": { "results": [], "count": 0 }, "parented": true, "embed_url": "https://chart-studio.plotly.com/~i.f.student/22.embed", "fid": "i.f.student:22", "filename": "plot from API (11)", "filetype": "plot", "img_url": "https://api.plotly.com/v2/files/i.f.student:22/image?image_name=list-thumb", "image_urls": { "default": "https://api.plotly.com/v2/files/i.f.student:22/image?image_name=default", "block-thumb": "https://storage.googleapis.com/plotly-prod-images/i.f.student/22/8_HTMWW1U5I8P23E4HO5MJ8D1C4ECFEM.png", "list-thumb": "https://api.plotly.com/v2/files/i.f.student:22/image?image_name=list-thumb" }, "api_urls": { "files": "https://api.plotly.com/v2/files/i.f.student:22", "plots": "https://api.plotly.com/v2/plots/i.f.student:22", "parent": "https://api.plotly.com/v2/folders/home?user=i.f.student" }, "owner": "i.f.student", "parent": -1, "preview": "", "referencers": [], "references": [], "title": "Scatterplot criticality and vulnerability for all road segments (gradient of total traffic)", "views": 0, "web_url": "https://chart-studio.plotly.com/~i.f.student/22/scatterplot-criticality-and-vulnerability-for-all-road-segments-gradient-of-tota/", "world_readable": true, "date_modified": "2019-03-20T19:33:04.627Z", "stars": { "results": [], "count": 0 }, "collaborators": { "results": [], "count": 0 }, "subfolder_count": null, "refresh_interval": null, "organize_view_url": "https://chart-studio.plotly.com/~i.f.student/22/", "current_user_permission": "read", "is_theme": null, "is_template": null, "autosize": true, "caption": "", "figure": { "data": [ { "uid": "d55f6e1c-886b-48e3-aa3f-4161d27db29e", "mode": "markers", "name": "Data points", "type": "scattergl", "xsrc": "i.f.student:23:a8ceb3", "ysrc": "i.f.student:23:e7e448", "marker": { "size": 8, "opacity": 0.75, "colorbar": { "title": { "text": "Grade" } }, "colorsrc": "i.f.student:23:67484b", "showscale": true, "colorscale": "YlGnBu" }, "textsrc": "i.f.student:23:1f2258" } ], "layout": { "title": { "text": "Scatterplot criticality and vulnerability for all road segments (gradient of total traffic)" }, "xaxis": { "title": { "text": "Vulnerability (normalised)" } }, "yaxis": { "title": { "text": "Criticality (normalised)" } }, "hovermode": "closest" } }, "height": null, "width": null, "user": { "profile_url": "https://chart-studio.plotly.com/~i.f.student", "avatar_url": "https://storage.googleapis.com/plotly-prod-profiles/82.jpg", "background_url": "https://storage.googleapis.com/plotly-prod-profiles/bg-1.jpg", "bio": "", "nickname": "", "website": "", "stream_tokens": null, "feature_set_id": null, "csrf_token": null, "date_joined": "2019-03-20 16:46:59", "mapbox_access_tokens": null, "has_password": null, "username": "i.f.student", "email": null, "is_active": null, "readonly": null, "is_dash_creator": null, "dash_created_count": null, "is_chart_creator": null, "charts_created_count": null } }, { "creation_time": "2019-03-20T19:32:34.802998Z", "comments": { "results": [], "count": 0 }, "parented": true, "embed_url": "https://chart-studio.plotly.com/~sheryc/0.embed", "fid": "sheryc:0", "filename": "gantt-simple-gantt-chart", "filetype": "plot", "img_url": "https://api.plotly.com/v2/files/sheryc:0/image?image_name=list-thumb", "image_urls": { "default": "https://api.plotly.com/v2/files/sheryc:0/image?image_name=default", "block-thumb": "https://api.plotly.com/v2/files/sheryc:0/image?image_name=block-thumb", "list-thumb": "https://api.plotly.com/v2/files/sheryc:0/image?image_name=list-thumb" }, "api_urls": { "files": "https://api.plotly.com/v2/files/sheryc:0", "plots": "https://api.plotly.com/v2/plots/sheryc:0", "parent": "https://api.plotly.com/v2/folders/home?user=sheryc" }, "owner": "sheryc", "parent": -1, "preview": "", "referencers": [], "references": [], "title": "Gantt Chart", "views": 0, "web_url": "https://chart-studio.plotly.com/~sheryc/0/gantt-chart/", "world_readable": true, "date_modified": "2019-03-20T19:55:28.990Z", "stars": { "results": [], "count": 0 }, "collaborators": { "results": [], "count": 0 }, "subfolder_count": null, "refresh_interval": null, "organize_view_url": "https://chart-studio.plotly.com/~sheryc/0/", "current_user_permission": "read", "is_theme": null, "is_template": null, "autosize": true, "caption": "", "figure": { "data": [ { "uid": "e46120b1-ac48-45ae-a396-0901f923b767", "name": "", "type": "scatter", "xsrc": "sheryc:1:62b124", "ysrc": "sheryc:1:8a5d92", "marker": { "color": "white" } }, { "uid": "da8bcae7-ad2e-4d5c-a769-6fb57471519c", "name": "", "type": "scatter", "xsrc": "sheryc:1:0049c5", "ysrc": "sheryc:1:6033e7", "marker": { "color": "white" } }, { "uid": "03630fd3-1322-4169-a161-1ab668a142a2", "name": "", "type": "scatter", "xsrc": "sheryc:1:3333f6", "ysrc": "sheryc:1:9c7c9e", "marker": { "color": "white" } }, { "uid": "568aaa95-a9be-4888-ab85-9b33e3cdb5a2", "name": "", "type": "scatter", "xsrc": "sheryc:1:dfbec0", "ysrc": "sheryc:1:d2c339", "marker": { "color": "white" } }, { "uid": "c12aacd3-cf0d-4308-9994-7f9a82b25a2b", "name": "", "type": "scatter", "xsrc": "sheryc:1:a2de88", "ysrc": "sheryc:1:5c06f2", "marker": { "color": "white" } }, { "uid": "da65f80c-ab3b-4aa7-bcb7-c79548bc782a", "name": "", "type": "scatter", "xsrc": "sheryc:1:b74c73", "ysrc": "sheryc:1:3c9c0d", "marker": { "color": "white" } }, { "uid": "3814a433-0269-4109-a1c7-3d47aa7d4520", "name": "", "type": "scatter", "xsrc": "sheryc:1:4507b5", "ysrc": "sheryc:1:64cbaa", "marker": { "color": "white" } }, { "uid": "5be03997-e6b0-47cb-8f0d-80c4a1fbc6e9", "name": "", "type": "scatter", "xsrc": "sheryc:1:c21f41", "ysrc": "sheryc:1:ab572c", "marker": { "color": "white" } }, { "uid": "f9122f04-b9a8-40a3-97a7-795daa82cf1f", "name": "", "type": "scatter", "xsrc": "sheryc:1:c21f41", "ysrc": "sheryc:1:6391b7", "marker": { "color": "white" } }, { "uid": "eff5a9bf-3ace-4e96-8211-997b89f66a04", "name": "", "type": "scatter", "xsrc": "sheryc:1:3dd9e3", "ysrc": "sheryc:1:00b5ae", "marker": { "color": "white" } }, { "uid": "97c1d868-bc1e-41c0-809f-b3a4876314fb", "name": "", "type": "scatter", "xsrc": "sheryc:1:e28c62", "ysrc": "sheryc:1:a70779", "marker": { "color": "white" } }, { "uid": "7b59f720-e41b-4c1c-b4bc-aade2a53bb6e", "name": "", "type": "scatter", "xsrc": "sheryc:1:e0e054", "ysrc": "sheryc:1:70d6a9", "marker": { "color": "white" } }, { "uid": "daf08d5f-def1-4b7f-9079-76b242fbf366", "name": "", "type": "scatter", "xsrc": "sheryc:1:2068cf", "ysrc": "sheryc:1:70d4d4", "marker": { "color": "white" } }, { "uid": "11bf8a04-1d4a-4620-b570-52651ab8e129", "name": "", "type": "scatter", "xsrc": "sheryc:1:a8b512", "ysrc": "sheryc:1:db5f54", "marker": { "color": "white" } }, { "uid": "d1dddaf3-6b76-4b08-ba47-02aed2ba6ca4", "name": "", "type": "scatter", "xsrc": "sheryc:1:ac390a", "ysrc": "sheryc:1:98e95f", "marker": { "color": "white" } }, { "uid": "40963534-3b53-4040-ad4f-5fdffdab6002", "name": "", "type": "scatter", "xsrc": "sheryc:1:147902", "ysrc": "sheryc:1:a24bc5", "marker": { "color": "white" } }, { "uid": "1b16ad73-6684-418c-92e7-1aa1f1c06748", "name": "", "type": "scatter", "xsrc": "sheryc:1:c7ec97", "ysrc": "sheryc:1:ec57fa", "marker": { "color": "white" } }, { "uid": "58a08ca4-7340-4ab5-a53c-a42f5574e979", "name": "", "type": "scatter", "xsrc": "sheryc:1:6ec629", "ysrc": "sheryc:1:569bee", "marker": { "color": "white" } }, { "uid": "0c46410e-60fb-4a9b-b350-87f1d13d28f7", "name": "", "type": "scatter", "xsrc": "sheryc:1:d7b1db", "ysrc": "sheryc:1:831914", "marker": { "color": "white" } }, { "uid": "f80d8650-fa24-4412-b4bc-5dd9d06988e0", "name": "", "type": "scatter", "xsrc": "sheryc:1:a5daeb", "ysrc": "sheryc:1:c766e6", "marker": { "color": "white" } }, { "uid": "8d5bff18-640e-466d-a1f5-737efc59c666", "name": "", "type": "scatter", "xsrc": "sheryc:1:0c0dd1", "ysrc": "sheryc:1:cc906e", "marker": { "color": "white" } }, { "uid": "83fa941b-a74a-4863-96bb-cb58b0d2d70b", "name": "", "type": "scatter", "xsrc": "sheryc:1:1abb68", "ysrc": "sheryc:1:2341e2", "marker": { "color": "white" } }, { "uid": "f1927118-c226-4603-ab92-9a724c27f829", "name": "", "type": "scatter", "xsrc": "sheryc:1:d7b1db", "ysrc": "sheryc:1:53100e", "marker": { "color": "white" } }, { "uid": "a6cce947-f671-48e8-9af1-84446f72d6b3", "name": "", "type": "scatter", "xsrc": "sheryc:1:51cb2e", "ysrc": "sheryc:1:3fd376", "marker": { "color": "white" } }, { "uid": "129de97e-adc5-48e9-8e33-fe7daea27e03", "name": "", "type": "scatter", "xsrc": "sheryc:1:51cb2e", "ysrc": "sheryc:1:5bb915", "marker": { "color": "white" } }, { "uid": "a45561ea-43c6-44f0-b915-9a0b6524e8d6", "name": "", "type": "scatter", "xsrc": "sheryc:1:87cd43", "ysrc": "sheryc:1:50dcc6", "marker": { "color": "white" } }, { "uid": "54b46dc8-8351-4f45-b154-d3d73a66cca9", "name": "", "type": "scatter", "xsrc": "sheryc:1:87cd43", "ysrc": "sheryc:1:66c36d", "marker": { "color": "white" } }, { "uid": "66416900-f54f-47e7-b733-31c0cc36a0c8", "name": "", "type": "scatter", "xsrc": "sheryc:1:b2abcb", "ysrc": "sheryc:1:f57128", "marker": { "color": "white" } }, { "uid": "774651b8-6cb6-44fc-a2ab-fc7625a94495", "name": "", "type": "scatter", "xsrc": "sheryc:1:9c1b26", "ysrc": "sheryc:1:5a8467", "marker": { "color": "white" } }, { "uid": "c6132d3d-d63d-472b-9782-99afc9f7ac01", "name": "", "type": "scatter", "xsrc": "sheryc:1:9c1b26", "ysrc": "sheryc:1:76ca27", "marker": { "color": "white" } }, { "uid": "5be516b7-9501-425b-9146-e10ae475e245", "name": "", "type": "scatter", "xsrc": "sheryc:1:2127b1", "ysrc": "sheryc:1:bfe0ae", "marker": { "color": "white" } }, { "uid": "86f14ff7-3dd8-41c6-ad5e-60cfb1a8b7d8", "name": "", "type": "scatter", "xsrc": "sheryc:1:aa0034", "ysrc": "sheryc:1:13b75f", "marker": { "color": "white" } }, { "uid": "5a4b247a-71cb-4f7f-bf1f-ff69155a44a5", "name": "", "type": "scatter", "xsrc": "sheryc:1:2127b1", "ysrc": "sheryc:1:88b163", "marker": { "color": "white" } }, { "uid": "425f5f5d-4ac2-4030-803e-b673629511b6", "name": "", "type": "scatter", "xsrc": "sheryc:1:b2a42d", "ysrc": "sheryc:1:5de0a5", "marker": { "color": "white" } }, { "uid": "8a5347fb-11af-49c0-917f-bc64e812bb6b", "name": "", "type": "scatter", "xsrc": "sheryc:1:8cce39", "ysrc": "sheryc:1:6b5735", "marker": { "color": "white" } }, { "uid": "cab672ec-f43d-44d8-8f19-4ed6a6fa49a5", "name": "", "type": "scatter", "xsrc": "sheryc:1:ad5738", "ysrc": "sheryc:1:96f52b", "marker": { "color": "white" } } ], "layout": { "title": { "text": "Gantt Chart" }, "width": 900, "xaxis": { "type": "date", "showgrid": false, "zeroline": false, "rangeselector": { "buttons": [ { "step": "day", "count": 7, "label": "1w", "stepmode": "backward" }, { "step": "month", "count": 1, "label": "1m", "stepmode": "backward" }, { "step": "month", "count": 6, "label": "6m", "stepmode": "backward" }, { "step": "year", "count": 1, "label": "YTD", "stepmode": "todate" }, { "step": "year", "count": 1, "label": "1y", "stepmode": "backward" }, { "step": "all" } ] } }, "yaxis": { "range": [ -1, 37 ], "showgrid": false, "ticktext": [ 288, 289, 301, 302, 304, 314, 315, 318, 324, 326, 343, 365, 378, 392, 398, 399, 403, 417, 418, 419, 422, 423, 427, 444, 445, 446, 448, 449, 450, 452, 453, 494, 499, 514, 517, 522 ], "tickvals": [ 0, 1, 2, 3, 4, 5, 6, 7, 8, 9, 10, 11, 12, 13, 14, 15, 16, 17, 18, 19, 20, 21, 22, 23, 24, 25, 26, 27, 28, 29, 30, 31, 32, 33, 34, 35 ], "zeroline": false, "autorange": false }, "height": 600, "shapes": [ { "x0": "2017-11-20", "x1": "2017-11-22", "y0": -0.2, "y1": 0.2, "line": { "width": 0 }, "type": "rect", "xref": "x", "yref": "y", "opacity": 1, "fillcolor": "rgb(31, 119, 180)" }, { "x0": "2017-11-17", "x1": "2017-11-19", "y0": 0.8, "y1": 1.2, "line": { "width": 0 }, "type": "rect", "xref": "x", "yref": "y", "opacity": 1, "fillcolor": "rgb(255, 127, 14)" }, { "x0": "2018-02-02", "x1": "2018-02-04", "y0": 1.8, "y1": 2.2, "line": { "width": 0 }, "type": "rect", "xref": "x", "yref": "y", "opacity": 1, "fillcolor": "rgb(44, 160, 44)" }, { "x0": "2018-02-07", "x1": "2018-02-20", "y0": 2.8, "y1": 3.2, "line": { "width": 0 }, "type": "rect", "xref": "x", "yref": "y", "opacity": 1, "fillcolor": "rgb(214, 39, 40)" }, { "x0": "2018-02-15", "x1": "2018-02-18", "y0": 3.8, "y1": 4.2, "line": { "width": 0 }, "type": "rect", "xref": "x", "yref": "y", "opacity": 1, "fillcolor": "rgb(148, 103, 189)" }, { "x0": "2018-03-14", "x1": "2018-03-15", "y0": 4.8, "y1": 5.2, "line": { "width": 0 }, "type": "rect", "xref": "x", "yref": "y", "opacity": 1, "fillcolor": "rgb(140, 86, 75)" }, { "x0": "2018-03-21", "x1": "2018-04-03", "y0": 5.8, "y1": 6.2, "line": { "width": 0 }, "type": "rect", "xref": "x", "yref": "y", "opacity": 1, "fillcolor": "rgb(227, 119, 194)" }, { "x0": "2018-03-15", "x1": "2018-03-15", "y0": 6.8, "y1": 7.2, "line": { "width": 0 }, "type": "rect", "xref": "x", "yref": "y", "opacity": 1, "fillcolor": "rgb(127, 127, 127)" }, { "x0": "2018-03-15", "x1": "2018-03-15", "y0": 7.8, "y1": 8.2, "line": { "width": 0 }, "type": "rect", "xref": "x", "yref": "y", "opacity": 1, "fillcolor": "rgb(188, 189, 34)" }, { "x0": "2018-03-24", "x1": "2018-03-24", "y0": 8.8, "y1": 9.2, "line": { "width": 0 }, "type": "rect", "xref": "x", "yref": "y", "opacity": 1, "fillcolor": "rgb(23, 190, 207)" }, { "x0": "2018-04-03", "x1": "2018-04-04", "y0": 9.8, "y1": 10.2, "line": { "width": 0 }, "type": "rect", "xref": "x", "yref": "y", "opacity": 1, "fillcolor": "rgb(31, 119, 180)" }, { "x0": "2018-05-09", "x1": "2018-05-16", "y0": 10.8, "y1": 11.2, "line": { "width": 0 }, "type": "rect", "xref": "x", "yref": "y", "opacity": 1, "fillcolor": "rgb(255, 127, 14)" }, { "x0": "2018-06-13", "x1": "2018-06-17", "y0": 11.8, "y1": 12.2, "line": { "width": 0 }, "type": "rect", "xref": "x", "yref": "y", "opacity": 1, "fillcolor": "rgb(44, 160, 44)" }, { "x0": "2018-06-29", "x1": "2018-07-01", "y0": 12.8, "y1": 13.2, "line": { "width": 0 }, "type": "rect", "xref": "x", "yref": "y", "opacity": 1, "fillcolor": "rgb(214, 39, 40)" }, { "x0": "2018-07-12", "x1": "2018-07-15", "y0": 13.8, "y1": 14.2, "line": { "width": 0 }, "type": "rect", "xref": "x", "yref": "y", "opacity": 1, "fillcolor": "rgb(148, 103, 189)" }, { "x0": "2018-07-21", "x1": "2018-07-21", "y0": 14.8, "y1": 15.2, "line": { "width": 0 }, "type": "rect", "xref": "x", "yref": "y", "opacity": 1, "fillcolor": "rgb(140, 86, 75)" }, { "x0": "2018-07-11", "x1": "2018-07-15", "y0": 15.8, "y1": 16.2, "line": { "width": 0 }, "type": "rect", "xref": "x", "yref": "y", "opacity": 1, "fillcolor": "rgb(227, 119, 194)" }, { "x0": "2018-07-27", "x1": "2018-07-29", "y0": 16.8, "y1": 17.2, "line": { "width": 0 }, "type": "rect", "xref": "x", "yref": "y", "opacity": 1, "fillcolor": "rgb(127, 127, 127)" }, { "x0": "2018-08-03", "x1": "2018-08-05", "y0": 17.8, "y1": 18.2, "line": { "width": 0 }, "type": "rect", "xref": "x", "yref": "y", "opacity": 1, "fillcolor": "rgb(188, 189, 34)" }, { "x0": "2018-08-10", "x1": "2018-08-12", "y0": 18.8, "y1": 19.2, "line": { "width": 0 }, "type": "rect", "xref": "x", "yref": "y", "opacity": 1, "fillcolor": "rgb(23, 190, 207)" }, { "x0": "2018-08-12", "x1": "2018-08-18", "y0": 19.8, "y1": 20.2, "line": { "width": 0 }, "type": "rect", "xref": "x", "yref": "y", "opacity": 1, "fillcolor": "rgb(31, 119, 180)" }, { "x0": "2018-08-19", "x1": "2018-08-25", "y0": 20.8, "y1": 21.2, "line": { "width": 0 }, "type": "rect", "xref": "x", "yref": "y", "opacity": 1, "fillcolor": "rgb(255, 127, 14)" }, { "x0": "2018-08-03", "x1": "2018-08-05", "y0": 21.8, "y1": 22.2, "line": { "width": 0 }, "type": "rect", "xref": "x", "yref": "y", "opacity": 1, "fillcolor": "rgb(44, 160, 44)" }, { "x0": "2018-09-06", "x1": "2018-09-06", "y0": 22.8, "y1": 23.2, "line": { "width": 0 }, "type": "rect", "xref": "x", "yref": "y", "opacity": 1, "fillcolor": "rgb(214, 39, 40)" }, { "x0": "2018-09-06", "x1": "2018-09-06", "y0": 23.8, "y1": 24.2, "line": { "width": 0 }, "type": "rect", "xref": "x", "yref": "y", "opacity": 1, "fillcolor": "rgb(148, 103, 189)" }, { "x0": "2018-09-13", "x1": "2018-09-13", "y0": 24.8, "y1": 25.2, "line": { "width": 0 }, "type": "rect", "xref": "x", "yref": "y", "opacity": 1, "fillcolor": "rgb(140, 86, 75)" }, { "x0": "2018-09-13", "x1": "2018-09-13", "y0": 25.8, "y1": 26.2, "line": { "width": 0 }, "type": "rect", "xref": "x", "yref": "y", "opacity": 1, "fillcolor": "rgb(227, 119, 194)" }, { "x0": "2018-09-20", "x1": "2018-09-20", "y0": 26.8, "y1": 27.2, "line": { "width": 0 }, "type": "rect", "xref": "x", "yref": "y", "opacity": 1, "fillcolor": "rgb(127, 127, 127)" }, { "x0": "2018-09-27", "x1": "2018-09-27", "y0": 27.8, "y1": 28.2, "line": { "width": 0 }, "type": "rect", "xref": "x", "yref": "y", "opacity": 1, "fillcolor": "rgb(188, 189, 34)" }, { "x0": "2018-09-27", "x1": "2018-09-27", "y0": 28.8, "y1": 29.2, "line": { "width": 0 }, "type": "rect", "xref": "x", "yref": "y", "opacity": 1, "fillcolor": "rgb(23, 190, 207)" }, { "x0": "2018-10-04", "x1": "2018-10-04", "y0": 29.8, "y1": 30.2, "line": { "width": 0 }, "type": "rect", "xref": "x", "yref": "y", "opacity": 1, "fillcolor": "rgb(31, 119, 180)" }, { "x0": "2018-09-27", "x1": "2018-09-30", "y0": 30.8, "y1": 31.2, "line": { "width": 0 }, "type": "rect", "xref": "x", "yref": "y", "opacity": 1, "fillcolor": "rgb(255, 127, 14)" }, { "x0": "2018-10-04", "x1": "2018-10-04", "y0": 31.8, "y1": 32.2, "line": { "width": 0 }, "type": "rect", "xref": "x", "yref": "y", "opacity": 1, "fillcolor": "rgb(44, 160, 44)" }, { "x0": "2018-10-18", "x1": "2018-10-18", "y0": 32.8, "y1": 33.2, "line": { "width": 0 }, "type": "rect", "xref": "x", "yref": "y", "opacity": 1, "fillcolor": "rgb(214, 39, 40)" }, { "x0": "2018-11-02", "x1": "2018-11-04", "y0": 33.8, "y1": 34.2, "line": { "width": 0 }, "type": "rect", "xref": "x", "yref": "y", "opacity": 1, "fillcolor": "rgb(148, 103, 189)" }, { "x0": "2018-11-21", "x1": "2018-11-27", "y0": 34.8, "y1": 35.2, "line": { "width": 0 }, "type": "rect", "xref": "x", "yref": "y", "opacity": 1, "fillcolor": "rgb(140, 86, 75)" } ], "hovermode": "closest", "showlegend": false } }, "height": 600, "width": 900, "user": { "profile_url": "https://chart-studio.plotly.com/~sheryc", "avatar_url": "https://storage.googleapis.com/plotly-prod-profiles/61.jpg", "background_url": "https://storage.googleapis.com/plotly-prod-profiles/bg-11.jpg", "bio": "", "nickname": "", "website": "", "stream_tokens": null, "feature_set_id": null, "csrf_token": null, "date_joined": "2019-03-20 19:22:02", "mapbox_access_tokens": null, "has_password": null, "username": "sheryc", "email": null, "is_active": null, "readonly": null, "is_dash_creator": null, "dash_created_count": null, "is_chart_creator": null, "charts_created_count": null } }, { "creation_time": "2019-03-20T19:32:21.338252Z", "comments": { "results": [], "count": 0 }, "parented": true, "embed_url": "https://chart-studio.plotly.com/~PythonPlotBot/3225.embed", "fid": "PythonPlotBot:3225", "filename": "multiple-subplots", "filetype": "plot", "img_url": "https://storage.googleapis.com/plotly-prod-images/PythonPlotBot/3225/9_XBSN05K027FSHAS490BQWV6QFTVDIN.png", "image_urls": { "default": "https://storage.googleapis.com/plotly-prod-images/PythonPlotBot/3225/2_8YY5N7SD6FT6KUN6T79Q7I2FEHKHQQ.png", "block-thumb": "https://storage.googleapis.com/plotly-prod-images/PythonPlotBot/3225/8_VC257EJVYOOWJNNP49W377UUADSCRB.png", "list-thumb": "https://storage.googleapis.com/plotly-prod-images/PythonPlotBot/3225/9_XBSN05K027FSHAS490BQWV6QFTVDIN.png" }, "api_urls": { "files": "https://api.plotly.com/v2/files/PythonPlotBot:3225", "plots": "https://api.plotly.com/v2/plots/PythonPlotBot:3225", "parent": "https://api.plotly.com/v2/folders/home?user=PythonPlotBot" }, "owner": "PythonPlotBot", "parent": -1, "preview": "", "referencers": [], "references": [], "title": "", "views": 7, "web_url": "https://chart-studio.plotly.com/~PythonPlotBot/3225/", "world_readable": true, "date_modified": "2019-03-20T20:22:47.293Z", "stars": { "results": [], "count": 0 }, "collaborators": { "results": [], "count": 0 }, "subfolder_count": null, "refresh_interval": null, "organize_view_url": "https://chart-studio.plotly.com/~PythonPlotBot/3225/", "current_user_permission": "read", "is_theme": null, "is_template": null, "autosize": true, "caption": "", "figure": { "data": [ { "uid": "158bf2d5-cf71-4d50-99f4-928f86b30117", "type": "scatter", "xsrc": "PythonPlotBot:3226:e0b93e", "ysrc": "PythonPlotBot:3226:cf8700" }, { "uid": "68dbe946-54dc-4f60-ac5b-cc0052a3cf8d", "type": "scatter", "xsrc": "PythonPlotBot:3226:838075", "ysrc": "PythonPlotBot:3226:bf9eb3", "xaxis": "x2", "yaxis": "y2" }, { "uid": "471ed9c9-3486-4c83-b574-334c78464b92", "type": "scatter", "xsrc": "PythonPlotBot:3226:95e079", "ysrc": "PythonPlotBot:3226:8410e4", "xaxis": "x3", "yaxis": "y3" }, { "uid": "2dcabcdf-bd9a-4a6d-a184-14b3743bb821", "type": "scatter", "xsrc": "PythonPlotBot:3226:05e1dd", "ysrc": "PythonPlotBot:3226:8415f2", "xaxis": "x4", "yaxis": "y4" } ], "layout": { "xaxis": { "domain": [ 0, 0.45 ] }, "yaxis": { "domain": [ 0, 0.45 ] }, "xaxis2": { "domain": [ 0.55, 1 ] }, "xaxis3": { "anchor": "y3", "domain": [ 0, 0.45 ] }, "xaxis4": { "anchor": "y4", "domain": [ 0.55, 1 ] }, "yaxis2": { "anchor": "x2", "domain": [ 0, 0.45 ] }, "yaxis3": { "domain": [ 0.55, 1 ] }, "yaxis4": { "anchor": "x4", "domain": [ 0.55, 1 ] } } }, "height": null, "width": null, "user": { "profile_url": "https://chart-studio.plotly.com/~PythonPlotBot", "avatar_url": "https://storage.googleapis.com/plotly-prod-profiles/15.jpg", "background_url": "https://storage.googleapis.com/plotly-prod-profiles/bg-14.jpg", "bio": "", "nickname": "", "website": "", "stream_tokens": null, "feature_set_id": null, "csrf_token": null, "date_joined": "2017-02-14 21:07:30", "mapbox_access_tokens": null, "has_password": null, "username": "PythonPlotBot", "email": null, "is_active": null, "readonly": null, "is_dash_creator": null, "dash_created_count": null, "is_chart_creator": null, "charts_created_count": null } }, { "creation_time": "2019-03-20T19:32:07.277853Z", "comments": { "results": [], "count": 0 }, "parented": true, "embed_url": "https://chart-studio.plotly.com/~PythonPlotBot/3223.embed", "fid": "PythonPlotBot:3223", "filename": "simple-subplot-with-annotations", "filetype": "plot", "img_url": "https://storage.googleapis.com/plotly-prod-images/PythonPlotBot/3223/9_QFS7J40FM6ZIM6UBYD4R538IXL2OXE.png", "image_urls": { "default": "https://storage.googleapis.com/plotly-prod-images/PythonPlotBot/3223/2_N1D1Z0HTIAVA9DCEB87H4B4BNXY2YU.png", "block-thumb": "https://storage.googleapis.com/plotly-prod-images/PythonPlotBot/3223/8_PTVD3WAKLU273FU07PX7V4BDM26FXX.png", "list-thumb": "https://storage.googleapis.com/plotly-prod-images/PythonPlotBot/3223/9_QFS7J40FM6ZIM6UBYD4R538IXL2OXE.png" }, "api_urls": { "files": "https://api.plotly.com/v2/files/PythonPlotBot:3223", "plots": "https://api.plotly.com/v2/plots/PythonPlotBot:3223", "parent": "https://api.plotly.com/v2/folders/home?user=PythonPlotBot" }, "owner": "PythonPlotBot", "parent": -1, "preview": "", "referencers": [], "references": [], "title": "i <3 annotations and subplots", "views": 6, "web_url": "https://chart-studio.plotly.com/~PythonPlotBot/3223/i-3-annotations-and-subplots/", "world_readable": true, "date_modified": "2019-03-20T19:33:22.895Z", "stars": { "results": [], "count": 0 }, "collaborators": { "results": [], "count": 0 }, "subfolder_count": null, "refresh_interval": null, "organize_view_url": "https://chart-studio.plotly.com/~PythonPlotBot/3223/", "current_user_permission": "read", "is_theme": null, "is_template": null, "autosize": true, "caption": "", "figure": { "data": [ { "uid": "6382d452-1f34-4afe-9e1c-60a5893daf70", "mode": "markers+text", "type": "scatter", "xsrc": "PythonPlotBot:3224:4b57a2", "ysrc": "PythonPlotBot:3224:b795a3", "xaxis": "x", "yaxis": "y", "textsrc": "PythonPlotBot:3224:2508c9", "textposition": "bottom center" }, { "uid": "3a532203-3896-4769-aadb-9122af98ba97", "mode": "markers+text", "type": "scatter", "xsrc": "PythonPlotBot:3224:2aec9d", "ysrc": "PythonPlotBot:3224:9166de", "xaxis": "x2", "yaxis": "y2", "textsrc": "PythonPlotBot:3224:ed7f2a", "textposition": "bottom center" } ], "layout": { "title": { "text": "i <3 annotations and subplots" }, "width": 800, "xaxis": { "anchor": "y", "domain": [ 0.0, 0.45 ] }, "yaxis": { "anchor": "x", "domain": [ 0.0, 1.0 ] }, "height": 600, "xaxis2": { "anchor": "y2", "domain": [ 0.55, 1.0 ] }, "yaxis2": { "anchor": "x2", "domain": [ 0.0, 1.0 ] } } }, "height": 600, "width": 800, "user": { "profile_url": "https://chart-studio.plotly.com/~PythonPlotBot", "avatar_url": "https://storage.googleapis.com/plotly-prod-profiles/15.jpg", "background_url": "https://storage.googleapis.com/plotly-prod-profiles/bg-14.jpg", "bio": "", "nickname": "", "website": "", "stream_tokens": null, "feature_set_id": null, "csrf_token": null, "date_joined": "2017-02-14 21:07:30", "mapbox_access_tokens": null, "has_password": null, "username": "PythonPlotBot", "email": null, "is_active": null, "readonly": null, "is_dash_creator": null, "dash_created_count": null, "is_chart_creator": null, "charts_created_count": null } } ] }