Plots List
Plots
This endpoint handles manipulation of Plotly plot files.
Reference
Authorization
Any user with or without a Plotly account may view public plots. For private plots, see authentication.
Actions
list
Listing all public plots can be done via a GET request to this endpoint.
By default, plots will be listed in order of date created. The order_by
query parameter is accepted at this endpoint. Currently, only ordering by
views is supported. It is possible to filter the plots by quality
with min_quality or max_quality as query parameter.
Example:
// GET https://api.plotly.com/v2/plots/ ---> 200

// GET https://api.plotly.com/v2/plots/?order_by=-views ---> 200

// GET https://api.plotly.com/v2/plots/?min_quality=5 ---> 200

// GET https://api.plotly.com/v2/plots/?max_quality=5 ---> 200
feed
Listing all handpicked feed plots can be done via a GET request to this endpoint. By default, plots will be listed in a random order.
Example:
// GET https://api.plotly.com/v2/plots/feed ---> 200
create
You can create new plot resources here. The only required field is 'figure'. Currently, the figure is restricted to only contain references to grid data. That is, this will fail if raw data arrays are passed in. To create and manipulate underlying grids for plots, see the grids endpoint.
Example:
// This fails because a figure field is required.
// POST https://api.plotly.com/v2/plots ---> 400 Bad Request
{}

// This fails because the figure has raw data
//POST https://api.plotly.com/v2/plots ---> 400 Bad Request
{
    "figure": {"data": [{"y": ['this', 'is', 'raw', 'data']}]}
}

// This succeeds because the figure has src keys, not raw data.
//POST https://api.plotly.com/v2/plots ---> 200 OK
{
    "figure": {"data": [{"ysrc": "sven:88:u8nd62"}]}
}
When creating a grid, you can optionally specify a source_fid to specify where a plot has come from:
- source_fid: the fid of a plot that was copied (and presumably edited) to produce this one
detail
There is a lot of meta information stored about plot files including filename, title, share_url, and content_url to name a few.
This information can only be reached with a GET to this endpoint.
Example:
// GET https://api.plotly.com/v2/plots/iheartgraphs:90
content
The contents of a plot can be downloaded via the content resource. The plot
content contains referenced grid/column data by default. If you wish to
return the raw grid/column data, the inline_data=true query must be included
in the request url. The Content-Type header will be appropriately set for the
response body.
Alternatively, you can set ?map_data=unreadable to append a mapping of
sources to data that belongs to grids which are unreadable for the
requestor. This is useful when you have read access to another users plot,
but that plot contains grid references which you don't have access to.
Examples:
// Returns referenced grid/column data
// GET https://api.plotly.com/v2/plots/iheartgraphs:90/content ---> 200 OK

// Returns full grid/column data
// GET https://api.plotly.com/v2/plots/iheartgraphs:90/content?inline_data=true ---> 200 OK

// Returns full grid/column data when requestor doesn't have permission
// to read the referenced grid.
// GET https://api.plotly.com/v2/plots/iheartgraphs:90/content?map_data=unreadable ---> 200 OK
GET /v2/plots?cursor=cD0yMDE5LTA2LTE3KzE4JTNBNTMlM0EwNi4yOTY5NjglMkIwMCUzQTAw&format=api
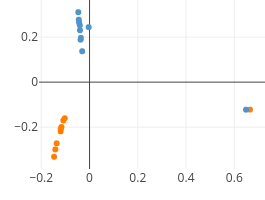
{ "next": "https://api.plot.ly/v2/plots?cursor=cD0yMDE5LTA2LTE3KzE4JTNBNDglM0E1MS42MjgyNjIlMkIwMCUzQTAw&format=api", "previous": "https://api.plot.ly/v2/plots?cursor=cj0xJnA9MjAxOS0wNi0xNysxOCUzQTUzJTNBMDYuMjgwMDk5JTJCMDAlM0EwMA%3D%3D&format=api", "results": [ { "creation_time": "2019-06-17T18:53:06.280099Z", "comments": { "results": [], "count": 0 }, "parented": true, "embed_url": "https://chart-studio.plotly.com/~nicolashu11/10.embed", "fid": "nicolashu11:10", "filename": "plot from API (4)", "filetype": "plot", "img_url": "https://storage.googleapis.com/plotly-prod-images/nicolashu11/10/9_MQ98Y4XJLJLSDWXRZAM8NZ0GRYJYGS.png", "image_urls": { "default": "https://storage.googleapis.com/plotly-prod-images/nicolashu11/10/2_VIF2KB45603TKZOCPRFZM93B6GTGL7.png", "block-thumb": "https://storage.googleapis.com/plotly-prod-images/nicolashu11/10/8_JVF1WRHELEK2ZEMFG8PDAX7UXU9QDY.png", "list-thumb": "https://storage.googleapis.com/plotly-prod-images/nicolashu11/10/9_MQ98Y4XJLJLSDWXRZAM8NZ0GRYJYGS.png" }, "api_urls": { "files": "https://api.plotly.com/v2/files/nicolashu11:10", "plots": "https://api.plotly.com/v2/plots/nicolashu11:10", "parent": "https://api.plotly.com/v2/folders/home?user=nicolashu11" }, "owner": "nicolashu11", "parent": -1, "preview": "", "referencers": [], "references": [], "title": "ROC curve", "views": 0, "web_url": "https://chart-studio.plotly.com/~nicolashu11/10/roc-curve/", "world_readable": true, "date_modified": "2019-06-17T18:53:06.706Z", "stars": { "results": [], "count": 0 }, "collaborators": { "results": [], "count": 0 }, "subfolder_count": null, "refresh_interval": null, "organize_view_url": "https://chart-studio.plotly.com/~nicolashu11/10/", "current_user_permission": "read", "is_theme": null, "is_template": null, "autosize": true, "caption": "", "figure": { "data": [ { "uid": "dea2e4ca-5523-477c-92ea-ae994b2053ee", "line": { "color": "darkorange", "width": 2 }, "mode": "lines", "name": "ROC curve (area = 0.9556)", "type": "scatter", "xsrc": "nicolashu11:11:34fb75", "ysrc": "nicolashu11:11:67838f" }, { "uid": "36736600-3bc9-49a1-83f0-f3131298bab1", "line": { "dash": "dash", "color": "navy", "width": 2 }, "mode": "lines", "type": "scatter", "xsrc": "nicolashu11:11:2f4564", "ysrc": "nicolashu11:11:6d6b0d", "showlegend": false } ], "layout": { "title": { "text": "ROC curve" }, "xaxis": { "title": { "text": "False Positive Rate" } }, "yaxis": { "title": { "text": "True Positive Rate" } } } }, "height": null, "width": null, "user": { "profile_url": "https://chart-studio.plotly.com/~nicolashu11", "avatar_url": "https://storage.googleapis.com/plotly-prod-profiles/65.jpg", "background_url": "https://storage.googleapis.com/plotly-prod-profiles/bg-12.jpg", "bio": "", "nickname": "", "website": "", "stream_tokens": null, "feature_set_id": null, "csrf_token": null, "date_joined": "2019-06-12 19:21:52", "mapbox_access_tokens": null, "has_password": null, "username": "nicolashu11", "email": null, "is_active": null, "readonly": null, "is_dash_creator": null, "dash_created_count": null, "is_chart_creator": null, "charts_created_count": null } }, { "creation_time": "2019-06-17T18:52:53.402928Z", "comments": { "results": [], "count": 0 }, "parented": true, "embed_url": "https://chart-studio.plotly.com/~amper/67128.embed", "fid": "amper:67128", "filename": "06-04-19_ds-1649_alg-5421_param-1254_showamps-True-state_res-SEC", "filetype": "plot", "img_url": "https://storage.googleapis.com/plotly-prod-images/amper/67128/9_1Z4HQ5VYHVOWKB9JOCG40RXSF6BKS0.png", "image_urls": { "default": "https://storage.googleapis.com/plotly-prod-images/amper/67128/2_3TG7NAYA9LGWYJKNA7NOZV34NVPHAW.png", "block-thumb": "https://storage.googleapis.com/plotly-prod-images/amper/67128/8_N2245BQ1BA2DQSA2KAXB8J8MW3245X.png", "list-thumb": "https://storage.googleapis.com/plotly-prod-images/amper/67128/9_1Z4HQ5VYHVOWKB9JOCG40RXSF6BKS0.png" }, "api_urls": { "files": "https://api.plotly.com/v2/files/amper:67128", "plots": "https://api.plotly.com/v2/plots/amper:67128", "parent": "https://api.plotly.com/v2/folders/home?user=amper" }, "owner": "amper", "parent": -1, "preview": "", "referencers": [], "references": [], "title": "06-04-19_ds-1649_alg-5421_param-1254_showamps-True-state_res-SEC", "views": 1, "web_url": "https://chart-studio.plotly.com/~amper/67128/_06-04-19-ds-1649-alg-5421-param-1254-showamps-true-state-res-sec/", "world_readable": true, "date_modified": "2019-06-17T18:52:54.664Z", "stars": { "results": [], "count": 0 }, "collaborators": { "results": [], "count": 0 }, "subfolder_count": null, "refresh_interval": null, "organize_view_url": "https://chart-studio.plotly.com/~amper/67128/", "current_user_permission": "read", "is_theme": null, "is_template": null, "autosize": true, "caption": "", "figure": { "data": [ { "uid": "95583e79-1d31-41d9-806f-38af3e9bd239", "mode": "lines", "name": "Idle", "type": "scattergl", "xsrc": "amper:67129:ad5727", "ysrc": "amper:67129:9d9a32", "marker": { "line": { "color": "rgb(255, 205, 0)", "width": 1 }, "size": 1, "color": "rgb(255, 205, 0)" }, "connectgaps": false }, { "uid": "74e5bebc-1f6f-448b-a707-0ee39c5ec6cf", "mode": "lines", "name": "Production", "type": "scattergl", "xsrc": "amper:67129:ad5727", "ysrc": "amper:67129:12f90c", "marker": { "line": { "color": "rgb(0, 166, 73)", "width": 1 }, "size": 1, "color": "rgb(0, 166, 73)" }, "connectgaps": false } ], "layout": { "title": "06-04-19_ds-1649_alg-5421_param-1254_showamps-True-state_res-SEC" } }, "height": null, "width": null, "user": { "profile_url": "https://chart-studio.plotly.com/~amper", "avatar_url": "https://storage.googleapis.com/plotly-prod-profiles/99.jpg", "background_url": "https://storage.googleapis.com/plotly-prod-profiles/bg-1.jpg", "bio": "", "nickname": "", "website": "", "stream_tokens": null, "feature_set_id": null, "csrf_token": null, "date_joined": "2017-03-17 16:47:16", "mapbox_access_tokens": null, "has_password": null, "username": "amper", "email": null, "is_active": null, "readonly": null, "is_dash_creator": null, "dash_created_count": null, "is_chart_creator": null, "charts_created_count": null } }, { "creation_time": "2019-06-17T18:52:21.414487Z", "comments": { "results": [], "count": 0 }, "parented": true, "embed_url": "https://chart-studio.plotly.com/~amper/67126.embed", "fid": "amper:67126", "filename": "06-03-19_ds-1649_alg-5421_param-1254_showamps-True-state_res-SEC", "filetype": "plot", "img_url": "https://storage.googleapis.com/plotly-prod-images/amper/67126/9_KJE0F18VLS2ZD1OY054CUUPB2BTUPE.png", "image_urls": { "default": "https://storage.googleapis.com/plotly-prod-images/amper/67126/2_XDH79VQZTZUECG1Y2FB4QNN3Y686O7.png", "block-thumb": "https://storage.googleapis.com/plotly-prod-images/amper/67126/8_SQJZ8QK5Y1ZVE0WQFY4ASIC597JTBZ.png", "list-thumb": "https://storage.googleapis.com/plotly-prod-images/amper/67126/9_KJE0F18VLS2ZD1OY054CUUPB2BTUPE.png" }, "api_urls": { "files": "https://api.plotly.com/v2/files/amper:67126", "plots": "https://api.plotly.com/v2/plots/amper:67126", "parent": "https://api.plotly.com/v2/folders/home?user=amper" }, "owner": "amper", "parent": -1, "preview": "", "referencers": [], "references": [], "title": "06-03-19_ds-1649_alg-5421_param-1254_showamps-True-state_res-SEC", "views": 2, "web_url": "https://chart-studio.plotly.com/~amper/67126/_06-03-19-ds-1649-alg-5421-param-1254-showamps-true-state-res-sec/", "world_readable": true, "date_modified": "2019-06-17T18:52:22.311Z", "stars": { "results": [], "count": 0 }, "collaborators": { "results": [], "count": 0 }, "subfolder_count": null, "refresh_interval": null, "organize_view_url": "https://chart-studio.plotly.com/~amper/67126/", "current_user_permission": "read", "is_theme": null, "is_template": null, "autosize": true, "caption": "", "figure": { "data": [ { "uid": "76a941a3-a0a1-43df-a5b7-0fb6a579747b", "mode": "lines", "name": "Idle", "type": "scattergl", "xsrc": "amper:67127:8ec98b", "ysrc": "amper:67127:79ab2f", "marker": { "line": { "color": "rgb(255, 205, 0)", "width": 1 }, "size": 1, "color": "rgb(255, 205, 0)" }, "connectgaps": false }, { "uid": "01c3d5ac-b64c-4d59-bc1b-b606ecbcfb26", "mode": "lines", "name": "Production", "type": "scattergl", "xsrc": "amper:67127:8ec98b", "ysrc": "amper:67127:50cb7c", "marker": { "line": { "color": "rgb(0, 166, 73)", "width": 1 }, "size": 1, "color": "rgb(0, 166, 73)" }, "connectgaps": false } ], "layout": { "title": "06-03-19_ds-1649_alg-5421_param-1254_showamps-True-state_res-SEC" } }, "height": null, "width": null, "user": { "profile_url": "https://chart-studio.plotly.com/~amper", "avatar_url": "https://storage.googleapis.com/plotly-prod-profiles/99.jpg", "background_url": "https://storage.googleapis.com/plotly-prod-profiles/bg-1.jpg", "bio": "", "nickname": "", "website": "", "stream_tokens": null, "feature_set_id": null, "csrf_token": null, "date_joined": "2017-03-17 16:47:16", "mapbox_access_tokens": null, "has_password": null, "username": "amper", "email": null, "is_active": null, "readonly": null, "is_dash_creator": null, "dash_created_count": null, "is_chart_creator": null, "charts_created_count": null } }, { "creation_time": "2019-06-17T18:51:18.166576Z", "comments": { "results": [], "count": 0 }, "parented": true, "embed_url": "https://chart-studio.plotly.com/~nicolashu11/8.embed", "fid": "nicolashu11:8", "filename": "plot from API (3)", "filetype": "plot", "img_url": "https://storage.googleapis.com/plotly-prod-images/nicolashu11/8/9_P12U5FC8MI46CA4XT6HN9MD64J2AD3.png", "image_urls": { "default": "https://storage.googleapis.com/plotly-prod-images/nicolashu11/8/2_DA4ISXCSWG55LAS426K5NON7WO8V22.png", "block-thumb": "https://storage.googleapis.com/plotly-prod-images/nicolashu11/8/8_VR1PJZT4AKQ46W01TMBJ291W8MWMDD.png", "list-thumb": "https://storage.googleapis.com/plotly-prod-images/nicolashu11/8/9_P12U5FC8MI46CA4XT6HN9MD64J2AD3.png" }, "api_urls": { "files": "https://api.plotly.com/v2/files/nicolashu11:8", "plots": "https://api.plotly.com/v2/plots/nicolashu11:8", "parent": "https://api.plotly.com/v2/folders/home?user=nicolashu11" }, "owner": "nicolashu11", "parent": -1, "preview": "", "referencers": [], "references": [], "title": "Receiver operating characteristic", "views": 0, "web_url": "https://chart-studio.plotly.com/~nicolashu11/8/receiver-operating-characteristic/", "world_readable": true, "date_modified": "2019-06-17T18:51:18.609Z", "stars": { "results": [], "count": 0 }, "collaborators": { "results": [], "count": 0 }, "subfolder_count": null, "refresh_interval": null, "organize_view_url": "https://chart-studio.plotly.com/~nicolashu11/8/", "current_user_permission": "read", "is_theme": null, "is_template": null, "autosize": true, "caption": "", "figure": { "data": [ { "uid": "7c95d443-33f1-40fd-877c-8a5a4992454e", "line": { "color": "darkorange", "width": 2 }, "mode": "lines", "name": "ROC curve (area = 0.9556)", "type": "scatter", "xsrc": "nicolashu11:9:edec03", "ysrc": "nicolashu11:9:9e7916" }, { "uid": "7ba15623-d0cc-465f-a900-f5f8a82697d6", "line": { "dash": "dash", "color": "navy", "width": 2 }, "mode": "lines", "type": "scatter", "xsrc": "nicolashu11:9:cefcc4", "ysrc": "nicolashu11:9:7cf756", "showlegend": false } ], "layout": { "title": { "text": "Receiver operating characteristic" }, "xaxis": { "title": { "text": "False Positive Rate" } }, "yaxis": { "title": { "text": "True Positive Rate" } } } }, "height": null, "width": null, "user": { "profile_url": "https://chart-studio.plotly.com/~nicolashu11", "avatar_url": "https://storage.googleapis.com/plotly-prod-profiles/65.jpg", "background_url": "https://storage.googleapis.com/plotly-prod-profiles/bg-12.jpg", "bio": "", "nickname": "", "website": "", "stream_tokens": null, "feature_set_id": null, "csrf_token": null, "date_joined": "2019-06-12 19:21:52", "mapbox_access_tokens": null, "has_password": null, "username": "nicolashu11", "email": null, "is_active": null, "readonly": null, "is_dash_creator": null, "dash_created_count": null, "is_chart_creator": null, "charts_created_count": null } }, { "creation_time": "2019-06-17T18:51:15.383409Z", "comments": { "results": [], "count": 0 }, "parented": true, "embed_url": "https://chart-studio.plotly.com/~nicolashu11/6.embed", "fid": "nicolashu11:6", "filename": "plot from API (2)", "filetype": "plot", "img_url": "https://storage.googleapis.com/plotly-prod-images/nicolashu11/6/9_SZ7Y0TKB1RWM0364EZG0Z7MU7LDT6D.png", "image_urls": { "default": "https://storage.googleapis.com/plotly-prod-images/nicolashu11/6/2_UIIRGBWEPX4OLS57O0EJ8JTAAYCTTF.png", "block-thumb": "https://storage.googleapis.com/plotly-prod-images/nicolashu11/6/8_ML73C14119CXBQLXGQBQ2XRW7AOCK4.png", "list-thumb": "https://storage.googleapis.com/plotly-prod-images/nicolashu11/6/9_SZ7Y0TKB1RWM0364EZG0Z7MU7LDT6D.png" }, "api_urls": { "files": "https://api.plotly.com/v2/files/nicolashu11:6", "plots": "https://api.plotly.com/v2/plots/nicolashu11:6", "parent": "https://api.plotly.com/v2/folders/home?user=nicolashu11" }, "owner": "nicolashu11", "parent": -1, "preview": "", "referencers": [], "references": [], "title": "Receiver operating characteristic", "views": 0, "web_url": "https://chart-studio.plotly.com/~nicolashu11/6/receiver-operating-characteristic/", "world_readable": true, "date_modified": "2019-06-17T18:51:15.884Z", "stars": { "results": [], "count": 0 }, "collaborators": { "results": [], "count": 0 }, "subfolder_count": null, "refresh_interval": null, "organize_view_url": "https://chart-studio.plotly.com/~nicolashu11/6/", "current_user_permission": "read", "is_theme": null, "is_template": null, "autosize": true, "caption": "", "figure": { "data": [ { "uid": "f68d1700-f73a-40b0-8f77-db6e0d1471c4", "line": { "color": "darkorange", "width": 2 }, "mode": "lines", "name": "ROC curve (area = 0.9556)", "type": "scatter", "xsrc": "nicolashu11:7:e6da0a", "ysrc": "nicolashu11:7:b8ee84" }, { "uid": "d89bce1b-5731-4f28-b395-52c5f254f554", "line": { "dash": "dash", "color": "navy", "width": 2 }, "mode": "lines", "type": "scatter", "xsrc": "nicolashu11:7:ea6d94", "ysrc": "nicolashu11:7:1c8ee9", "showlegend": false } ], "layout": { "title": { "text": "Receiver operating characteristic" }, "xaxis": { "title": { "text": "False Positive Rate" } }, "yaxis": { "title": { "text": "True Positive Rate" } } } }, "height": null, "width": null, "user": { "profile_url": "https://chart-studio.plotly.com/~nicolashu11", "avatar_url": "https://storage.googleapis.com/plotly-prod-profiles/65.jpg", "background_url": "https://storage.googleapis.com/plotly-prod-profiles/bg-12.jpg", "bio": "", "nickname": "", "website": "", "stream_tokens": null, "feature_set_id": null, "csrf_token": null, "date_joined": "2019-06-12 19:21:52", "mapbox_access_tokens": null, "has_password": null, "username": "nicolashu11", "email": null, "is_active": null, "readonly": null, "is_dash_creator": null, "dash_created_count": null, "is_chart_creator": null, "charts_created_count": null } }, { "creation_time": "2019-06-17T18:50:45.990506Z", "comments": { "results": [], "count": 0 }, "parented": true, "embed_url": "https://chart-studio.plotly.com/~nicolashu11/4.embed", "fid": "nicolashu11:4", "filename": "plot from API (1)", "filetype": "plot", "img_url": "https://storage.googleapis.com/plotly-prod-images/nicolashu11/4/9_99LWBBE3DRSUPK9D8REEZLLUPW2ZT9.png", "image_urls": { "default": "https://storage.googleapis.com/plotly-prod-images/nicolashu11/4/2_5YR7L419JQCKGKQLG4WBS6ER8QEF09.png", "block-thumb": "https://storage.googleapis.com/plotly-prod-images/nicolashu11/4/8_QKB19Y5410KPR4IMGYBS8AZ52PPLW3.png", "list-thumb": "https://storage.googleapis.com/plotly-prod-images/nicolashu11/4/9_99LWBBE3DRSUPK9D8REEZLLUPW2ZT9.png" }, "api_urls": { "files": "https://api.plotly.com/v2/files/nicolashu11:4", "plots": "https://api.plotly.com/v2/plots/nicolashu11:4", "parent": "https://api.plotly.com/v2/folders/home?user=nicolashu11" }, "owner": "nicolashu11", "parent": -1, "preview": "", "referencers": [], "references": [], "title": "Receiver operating characteristic", "views": 0, "web_url": "https://chart-studio.plotly.com/~nicolashu11/4/receiver-operating-characteristic/", "world_readable": true, "date_modified": "2019-06-17T18:50:46.529Z", "stars": { "results": [], "count": 0 }, "collaborators": { "results": [], "count": 0 }, "subfolder_count": null, "refresh_interval": null, "organize_view_url": "https://chart-studio.plotly.com/~nicolashu11/4/", "current_user_permission": "read", "is_theme": null, "is_template": null, "autosize": true, "caption": "", "figure": { "data": [ { "uid": "009f14a1-213f-42ac-af33-ffebec5f6987", "line": { "color": "darkorange", "width": 2 }, "mode": "lines", "name": "ROC curve (area = 0.9556)", "type": "scatter", "xsrc": "nicolashu11:5:748de9", "ysrc": "nicolashu11:5:6814a6" }, { "uid": "4992bfbb-0071-4643-87c6-e66bf0b49fe7", "line": { "dash": "dash", "color": "navy", "width": 2 }, "mode": "lines", "type": "scatter", "xsrc": "nicolashu11:5:893902", "ysrc": "nicolashu11:5:8809b8", "showlegend": false } ], "layout": { "title": { "text": "Receiver operating characteristic" }, "xaxis": { "title": { "text": "False Positive Rate" } }, "yaxis": { "title": { "text": "True Positive Rate" } } } }, "height": null, "width": null, "user": { "profile_url": "https://chart-studio.plotly.com/~nicolashu11", "avatar_url": "https://storage.googleapis.com/plotly-prod-profiles/65.jpg", "background_url": "https://storage.googleapis.com/plotly-prod-profiles/bg-12.jpg", "bio": "", "nickname": "", "website": "", "stream_tokens": null, "feature_set_id": null, "csrf_token": null, "date_joined": "2019-06-12 19:21:52", "mapbox_access_tokens": null, "has_password": null, "username": "nicolashu11", "email": null, "is_active": null, "readonly": null, "is_dash_creator": null, "dash_created_count": null, "is_chart_creator": null, "charts_created_count": null } }, { "creation_time": "2019-06-17T18:50:45.541524Z", "comments": { "results": [], "count": 0 }, "parented": true, "embed_url": "https://chart-studio.plotly.com/~jwang41/2.embed", "fid": "jwang41:2", "filename": "West Africa Ebola cases 2014", "filetype": "plot", "img_url": "https://storage.googleapis.com/plotly-prod-images/jwang41/2/9_HIZ97EDWIOSTF4GBTJPDENMX1R5GOU.png", "image_urls": { "default": "https://storage.googleapis.com/plotly-prod-images/jwang41/2/2_KL6P0HR8OCIT4OCYYXUI22YUYA8OG5.png", "block-thumb": "https://storage.googleapis.com/plotly-prod-images/jwang41/2/8_277F5VO4GACSKI6BZAZ15ZUVO6CIT3.png", "list-thumb": "https://storage.googleapis.com/plotly-prod-images/jwang41/2/9_HIZ97EDWIOSTF4GBTJPDENMX1R5GOU.png" }, "api_urls": { "files": "https://api.plotly.com/v2/files/jwang41:2", "plots": "https://api.plotly.com/v2/plots/jwang41:2", "parent": "https://api.plotly.com/v2/folders/home?user=jwang41" }, "owner": "jwang41", "parent": -1, "preview": "", "referencers": [], "references": [], "title": "Ebola cases reported by month in West Africa 2014<br> Source: <a href=\"https://data.hdx.rwlabs.org/dataset/rowca-ebola-cases\">HDX</a>", "views": 2, "web_url": "https://chart-studio.plotly.com/~jwang41/2/ebola-cases-reported-by-month-in-west-africa-2014-source-hdx/", "world_readable": true, "date_modified": "2019-06-17T20:04:00.966Z", "stars": { "results": [], "count": 0 }, "collaborators": { "results": [], "count": 0 }, "subfolder_count": null, "refresh_interval": null, "organize_view_url": "https://chart-studio.plotly.com/~jwang41/2/", "current_user_permission": "read", "is_theme": null, "is_template": null, "autosize": true, "caption": "", "figure": { "data": [ { "uid": "7b4c8f59-49a1-4edf-8fc0-2d9a7d90b362", "mode": "markers+text", "name": "Sept", "type": "scattergeo", "latsrc": "jwang41:3:493e8a", "lonsrc": "jwang41:3:2df275", "marker": { "line": { "width": 0 }, "color": "rgb(33,113,181)", "sizesrc": "jwang41:3:8d399a" }, "textsrc": "jwang41:3:91bb87", "textposition": "bottom center" }, { "uid": "02426402-25b7-4147-b12c-defe757e48a6", "name": "Aug", "type": "scattergeo", "latsrc": "jwang41:3:493e8a", "lonsrc": "jwang41:3:2df275", "marker": { "line": { "width": 0 }, "color": "rgb(107,174,214)", "sizesrc": "jwang41:3:5ddc65" }, "textsrc": "jwang41:3:36bf94" }, { "uid": "ee11881b-a7d5-4865-a981-29830d048993", "name": "July", "type": "scattergeo", "latsrc": "jwang41:3:d89e6d", "lonsrc": "jwang41:3:e03e22", "marker": { "line": { "width": 0 }, "color": "rgb(189,215,231)", "sizesrc": "jwang41:3:7b8b01" }, "textsrc": "jwang41:3:1c0b84" }, { "uid": "830da18a-3791-4012-8ed6-561456f617de", "name": "June", "type": "scattergeo", "latsrc": "jwang41:3:d89e6d", "lonsrc": "jwang41:3:e03e22", "marker": { "line": { "width": 0 }, "color": "rgb(239,243,255)", "sizesrc": "jwang41:3:3c2d35" }, "textsrc": "jwang41:3:a5b5f8" }, { "geo": "geo2", "uid": "aaeb08a0-98a3-4619-819e-c39af10bf11e", "type": "choropleth", "zsrc": "jwang41:3:73fb21", "textsrc": "jwang41:3:e3eb39", "showscale": false, "colorscale": [ [ 0, "rgb(0, 0, 0)" ], [ 1, "rgb(0, 0, 0)" ] ], "locationmode": "country names", "locationssrc": "jwang41:3:5018d8", "autocolorscale": false }, { "geo": "geo2", "uid": "4d6ef2a4-c39d-4857-b3ec-fa4f67e2f014", "mode": "text", "type": "scattergeo", "latsrc": "jwang41:3:031328", "lonsrc": "jwang41:3:5c3f91", "textsrc": "jwang41:3:3a6abb", "showlegend": false } ], "layout": { "geo": { "scope": "africa", "domain": { "x": [ 0, 1 ], "y": [ 0, 1 ] }, "lataxis": { "range": [ 0.0, 12.0 ] }, "lonaxis": { "range": [ -15.0, -5.0 ] }, "showland": true, "landcolor": "rgb(229, 229, 229)", "showframe": false, "projection": { "type": "equirectangular" }, "resolution": 50, "countrycolor": "rgb(255, 255, 255)", "coastlinecolor": "rgb(255, 255, 255)", "showcoastlines": true }, "geo2": { "scope": "africa", "domain": { "x": [ 0, 0.6 ], "y": [ 0, 0.6 ] }, "bgcolor": "rgba(255, 255, 255, 0.0)", "showland": true, "landcolor": "rgb(229, 229, 229)", "showframe": false, "showcountries": false }, "title": { "text": "Ebola cases reported by month in West Africa 2014<br> Source: <a href=\"https://data.hdx.rwlabs.org/dataset/rowca-ebola-cases\">HDX</a>" }, "legend": { "traceorder": "reversed" } } }, "height": null, "width": null, "user": { "profile_url": "https://chart-studio.plotly.com/~jwang41", "avatar_url": "https://storage.googleapis.com/plotly-prod-profiles/10.jpg", "background_url": "https://storage.googleapis.com/plotly-prod-profiles/bg-12.jpg", "bio": "", "nickname": "", "website": "", "stream_tokens": null, "feature_set_id": null, "csrf_token": null, "date_joined": "2019-06-14 20:54:28", "mapbox_access_tokens": null, "has_password": null, "username": "jwang41", "email": null, "is_active": null, "readonly": null, "is_dash_creator": null, "dash_created_count": null, "is_chart_creator": null, "charts_created_count": null } }, { "creation_time": "2019-06-17T18:49:49.712388Z", "comments": { "results": [], "count": 0 }, "parented": true, "embed_url": "https://chart-studio.plotly.com/~jwang41/0.embed", "fid": "jwang41:0", "filename": "d3-cloropleth-map", "filetype": "plot", "img_url": "https://storage.googleapis.com/plotly-prod-images/jwang41/0/9_1WEP1D277FLB1QVCQFV4LJLNP0ONAL.png", "image_urls": { "default": "https://storage.googleapis.com/plotly-prod-images/jwang41/0/2_84R1NXTDJ4T7BV188P8AZN5DCEMJX5.png", "block-thumb": "https://storage.googleapis.com/plotly-prod-images/jwang41/0/8_6T2RZYGXEKS5HCJ1MXJCOHMHZWQCEK.png", "list-thumb": "https://storage.googleapis.com/plotly-prod-images/jwang41/0/9_1WEP1D277FLB1QVCQFV4LJLNP0ONAL.png" }, "api_urls": { "files": "https://api.plotly.com/v2/files/jwang41:0", "plots": "https://api.plotly.com/v2/plots/jwang41:0", "parent": "https://api.plotly.com/v2/folders/home?user=jwang41" }, "owner": "jwang41", "parent": -1, "preview": "", "referencers": [], "references": [], "title": "Ebola cases reported by month in West Africa 2014<br> Source: <a href=\"https://data.hdx.rwlabs.org/dataset/rowca-ebola-cases\">HDX</a>", "views": 2, "web_url": "https://chart-studio.plotly.com/~jwang41/0/ebola-cases-reported-by-month-in-west-africa-2014-source-hdx/", "world_readable": true, "date_modified": "2019-06-17T19:34:17.846Z", "stars": { "results": [], "count": 0 }, "collaborators": { "results": [], "count": 0 }, "subfolder_count": null, "refresh_interval": null, "organize_view_url": "https://chart-studio.plotly.com/~jwang41/0/", "current_user_permission": "read", "is_theme": null, "is_template": null, "autosize": true, "caption": "", "figure": { "data": [ { "uid": "3db26967-db2a-4115-bfc7-0960d71def86", "mode": "markers+text", "name": "Sept", "type": "scattergeo", "latsrc": "jwang41:1:074e88", "lonsrc": "jwang41:1:f97a20", "marker": { "line": { "width": 0 }, "color": "rgb(33,113,181)", "sizesrc": "jwang41:1:1a5946" }, "textsrc": "jwang41:1:d5f5a4", "textposition": "bottom center" }, { "uid": "40542819-345e-4f04-9711-7997c9d2eedf", "name": "Aug", "type": "scattergeo", "latsrc": "jwang41:1:074e88", "lonsrc": "jwang41:1:f97a20", "marker": { "line": { "width": 0 }, "color": "rgb(107,174,214)", "sizesrc": "jwang41:1:5fe6d6" }, "textsrc": "jwang41:1:89e45c" }, { "uid": "912077a9-f9f7-4968-b7a1-6d0c2548e8b8", "name": "July", "type": "scattergeo", "latsrc": "jwang41:1:c7e2b4", "lonsrc": "jwang41:1:555128", "marker": { "line": { "width": 0 }, "color": "rgb(189,215,231)", "sizesrc": "jwang41:1:1cf02f" }, "textsrc": "jwang41:1:a7aef3" }, { "uid": "f4ea193d-e619-499a-9d39-0cd4d3aa6a7c", "name": "June", "type": "scattergeo", "latsrc": "jwang41:1:c7e2b4", "lonsrc": "jwang41:1:555128", "marker": { "line": { "width": 0 }, "color": "rgb(239,243,255)", "sizesrc": "jwang41:1:cd9abe" }, "textsrc": "jwang41:1:07c3eb" }, { "geo": "geo2", "uid": "d51166c3-92ea-4530-a4d0-4f414af3711a", "type": "choropleth", "zsrc": "jwang41:1:c533b4", "textsrc": "jwang41:1:7c1977", "showscale": false, "colorscale": [ [ 0, "rgb(0, 0, 0)" ], [ 1, "rgb(0, 0, 0)" ] ], "locationmode": "country names", "locationssrc": "jwang41:1:83cefe", "autocolorscale": false }, { "geo": "geo2", "uid": "3dfe9236-c160-40c7-ac85-0825c682064d", "mode": "text", "type": "scattergeo", "latsrc": "jwang41:1:64a88e", "lonsrc": "jwang41:1:67ff0c", "textsrc": "jwang41:1:2f9ea5", "showlegend": false } ], "layout": { "geo": { "scope": "africa", "domain": { "x": [ 0, 1 ], "y": [ 0, 1 ] }, "lataxis": { "range": [ 0.0, 12.0 ] }, "lonaxis": { "range": [ -15.0, -5.0 ] }, "showland": true, "landcolor": "rgb(229, 229, 229)", "showframe": false, "projection": { "type": "equirectangular" }, "resolution": 50, "countrycolor": "rgb(255, 255, 255)", "coastlinecolor": "rgb(255, 255, 255)", "showcoastlines": true }, "geo2": { "scope": "africa", "domain": { "x": [ 0, 0.6 ], "y": [ 0, 0.6 ] }, "bgcolor": "rgba(255, 255, 255, 0.0)", "showland": true, "landcolor": "rgb(229, 229, 229)", "showframe": false, "showcountries": false }, "title": { "text": "Ebola cases reported by month in West Africa 2014<br> Source: <a href=\"https://data.hdx.rwlabs.org/dataset/rowca-ebola-cases\">HDX</a>" }, "legend": { "traceorder": "reversed" } } }, "height": null, "width": null, "user": { "profile_url": "https://chart-studio.plotly.com/~jwang41", "avatar_url": "https://storage.googleapis.com/plotly-prod-profiles/10.jpg", "background_url": "https://storage.googleapis.com/plotly-prod-profiles/bg-12.jpg", "bio": "", "nickname": "", "website": "", "stream_tokens": null, "feature_set_id": null, "csrf_token": null, "date_joined": "2019-06-14 20:54:28", "mapbox_access_tokens": null, "has_password": null, "username": "jwang41", "email": null, "is_active": null, "readonly": null, "is_dash_creator": null, "dash_created_count": null, "is_chart_creator": null, "charts_created_count": null } }, { "creation_time": "2019-06-17T18:49:15.049089Z", "comments": { "results": [], "count": 0 }, "parented": true, "embed_url": "https://chart-studio.plotly.com/~LibbyM/14.embed", "fid": "LibbyM:14", "filename": "LAZB_INBU_only_PCA", "filetype": "plot", "img_url": "https://storage.googleapis.com/plotly-prod-images/LibbyM/14/9_5B5J094SLO8P96RJJB703L11Z67ZRS.png", "image_urls": { "default": "https://storage.googleapis.com/plotly-prod-images/LibbyM/14/2_J6S8C1UC5KQ9Y4150B80RU255SFVUC.png", "block-thumb": "https://storage.googleapis.com/plotly-prod-images/LibbyM/14/8_JD1WRF5W8VOWW3B76WYK5HXC9SFDG2.png", "list-thumb": "https://storage.googleapis.com/plotly-prod-images/LibbyM/14/9_5B5J094SLO8P96RJJB703L11Z67ZRS.png" }, "api_urls": { "files": "https://api.plotly.com/v2/files/LibbyM:14", "plots": "https://api.plotly.com/v2/plots/LibbyM:14", "parent": "https://api.plotly.com/v2/folders/home?user=LibbyM" }, "owner": "LibbyM", "parent": -1, "preview": "", "referencers": [], "references": [], "title": "", "views": 1, "web_url": "https://chart-studio.plotly.com/~LibbyM/14/", "world_readable": true, "date_modified": "2019-06-17T18:49:15.062Z", "stars": { "results": [], "count": 0 }, "collaborators": { "results": [], "count": 0 }, "subfolder_count": null, "refresh_interval": null, "organize_view_url": "https://chart-studio.plotly.com/~LibbyM/14/", "current_user_permission": "read", "is_theme": null, "is_template": null, "autosize": true, "caption": "", "figure": { "data": [ { "line": { "color": "rgba(255,127,0,1)" }, "mode": "markers", "name": "amoena", "type": "scatter", "xsrc": "LibbyM:13:a6f399", "ysrc": "LibbyM:13:934193", "frame": null, "xaxis": "x", "yaxis": "y", "marker": { "line": { "color": "rgba(255,127,0,1)" }, "color": "rgba(255,127,0,1)" }, "error_x": { "color": "rgba(255,127,0,1)" }, "error_y": { "color": "rgba(255,127,0,1)" }, "textsrc": "LibbyM:13:d7e6aa", "textfont": { "color": "rgba(255,127,0,1)" } }, { "line": { "color": "rgba(79,148,205,1)" }, "mode": "markers", "name": "cyanea", "type": "scatter", "xsrc": "LibbyM:13:8e510b", "ysrc": "LibbyM:13:de7f26", "frame": null, "xaxis": "x", "yaxis": "y", "marker": { "line": { "color": "rgba(79,148,205,1)" }, "color": "rgba(79,148,205,1)" }, "error_x": { "color": "rgba(79,148,205,1)" }, "error_y": { "color": "rgba(79,148,205,1)" }, "textsrc": "LibbyM:13:5aeda5", "textfont": { "color": "rgba(79,148,205,1)" } } ], "layout": { "xaxis": { "title": "EV1", "domain": [ 0, 1 ], "automargin": true }, "yaxis": { "title": "EV2", "domain": [ 0, 1 ], "automargin": true }, "margin": { "b": 40, "l": 60, "r": 10, "t": 25 }, "hovermode": "closest", "showlegend": true } }, "height": null, "width": null, "user": { "profile_url": "https://chart-studio.plotly.com/~LibbyM", "avatar_url": "https://storage.googleapis.com/plotly-prod-profiles/83.jpg", "background_url": "https://storage.googleapis.com/plotly-prod-profiles/bg-8.jpg", "bio": "", "nickname": "", "website": "", "stream_tokens": null, "feature_set_id": null, "csrf_token": null, "date_joined": "2016-03-30 18:50:36", "mapbox_access_tokens": null, "has_password": null, "username": "LibbyM", "email": null, "is_active": null, "readonly": null, "is_dash_creator": null, "dash_created_count": null, "is_chart_creator": null, "charts_created_count": null } }, { "creation_time": "2019-06-17T18:48:51.628262Z", "comments": { "results": [], "count": 0 }, "parented": true, "embed_url": "https://chart-studio.plotly.com/~AxelRasse/3.embed", "fid": "AxelRasse:3", "filename": "Plot 3", "filetype": "plot", "img_url": "https://storage.googleapis.com/plotly-prod-images/AxelRasse/3/9_20X2QUSO853M6V2ZUYM4PWNBV2B4BH.png", "image_urls": { "default": "https://storage.googleapis.com/plotly-prod-images/AxelRasse/3/2_3Q8BLRC78MK7YOXRZMI3WQK4DL5HPY.png", "block-thumb": "https://storage.googleapis.com/plotly-prod-images/AxelRasse/3/8_Y5HST2KOIF5QG9672WPCGRX6HDBU1C.png", "list-thumb": "https://storage.googleapis.com/plotly-prod-images/AxelRasse/3/9_20X2QUSO853M6V2ZUYM4PWNBV2B4BH.png" }, "api_urls": { "files": "https://api.plotly.com/v2/files/AxelRasse:3", "plots": "https://api.plotly.com/v2/plots/AxelRasse:3", "parent": "https://api.plotly.com/v2/folders/home?user=AxelRasse" }, "owner": "AxelRasse", "parent": -1, "preview": "", "referencers": [], "references": [], "title": "", "views": 1, "web_url": "https://chart-studio.plotly.com/~AxelRasse/3/", "world_readable": true, "date_modified": "2019-06-17T18:48:51.640Z", "stars": { "results": [], "count": 0 }, "collaborators": { "results": [], "count": 0 }, "subfolder_count": null, "refresh_interval": null, "organize_view_url": "https://chart-studio.plotly.com/~AxelRasse/3/", "current_user_permission": "read", "is_theme": null, "is_template": false, "autosize": true, "caption": "", "figure": { "data": [ { "uid": "89e13f8b-38b6-402b-8fda-52109cfe60e3", "line": { "color": "black", "width": 0.5 }, "mode": "lines", "type": "scatter", "xsrc": "AxelRasse:2:f36812", "ysrc": "AxelRasse:2:ec444e", "hoverinfo": "none", "showlegend": false }, { "uid": "12a189ed-936b-4764-be42-3ecbe6b4e97d", "mode": "markers", "type": "scatter" }, { "uid": "d39f5127-bda7-45db-8c0b-7e1235a091b6", "mode": "markers", "type": "scatter", "xsrc": "AxelRasse:2:ca54f1", "ysrc": "AxelRasse:2:c3ded8", "marker": { "line": { "width": 0.5 }, "size": 9, "colorbar": { "title": { "font": { "size": 20 }, "side": "top", "text": "Voltage" }, "xanchor": "left", "tickfont": { "size": 16 }, "thickness": 10 }, "colorsrc": "AxelRasse:2:4bfcb4", "showscale": true, "colorscale": "Reds" }, "textsrc": "AxelRasse:2:3cd39a", "hoverinfo": "text", "showlegend": false }, { "uid": "c2938bda-e6ad-4c58-890a-b81bab3297d2", "mode": "markers", "name": "PV nodes", "type": "scatter", "xsrc": "AxelRasse:2:1b1c2b", "ysrc": "AxelRasse:2:665c1b", "marker": { "line": { "width": 1 }, "size": 10, "color": "yellow" }, "textsrc": "AxelRasse:2:9ccbdc", "hoverinfo": "text" }, { "uid": "8bc8b819-561b-49d8-bfc9-ea0ff0118865", "mode": "markers", "name": "Source node", "text": "Source node: 1.03", "type": "scatter", "xsrc": "AxelRasse:2:41217f", "ysrc": "AxelRasse:2:4afe74", "marker": { "line": { "width": 1 }, "size": 10, "color": "darkcyan" }, "hoverinfo": "text" } ], "frames": [], "layout": { "font": { "size": 20 }, "title": { "font": { "size": 24 }, "text": "BURLINGAME 0404 -Network at 12 pm - Volt_Var_control" }, "xaxis": { "type": "linear", "range": [ 1824577.6069707822, 1829544.0900416505 ], "title": { "text": "" }, "showgrid": false, "zeroline": false, "autorange": true, "showticklabels": false }, "yaxis": { "type": "linear", "range": [ 108.2702724017564, 108.33640267760867 ], "title": { "text": "" }, "showgrid": false, "zeroline": false, "autorange": true, "showticklabels": false }, "legend": { "x": -0.1, "y": 0, "font": { "size": 20 } }, "margin": { "b": 20, "l": 5, "r": 5, "t": 40 }, "autosize": true } }, "height": null, "width": null, "user": { "profile_url": "https://chart-studio.plotly.com/~AxelRasse", "avatar_url": "https://storage.googleapis.com/plotly-prod-profiles/5.jpg", "background_url": "https://storage.googleapis.com/plotly-prod-profiles/bg-13.jpg", "bio": "", "nickname": "", "website": "", "stream_tokens": null, "feature_set_id": null, "csrf_token": null, "date_joined": "2019-06-14 00:39:24", "mapbox_access_tokens": null, "has_password": null, "username": "AxelRasse", "email": null, "is_active": null, "readonly": null, "is_dash_creator": null, "dash_created_count": null, "is_chart_creator": null, "charts_created_count": null } } ] }