Plots


Jump to API response

This endpoint handles manipulation of Plotly plot files.

Reference

Authorization


Any user with or without a Plotly account may view public plots. For private plots, see authentication.

Actions


list

Listing all public plots can be done via a GET request to this endpoint. By default, plots will be listed in order of date created. The order_by query parameter is accepted at this endpoint. Currently, only ordering by views is supported. It is possible to filter the plots by quality with min_quality or max_quality as query parameter.

Example:

// GET https://api.plotly.com/v2/plots/ ---> 200

// GET https://api.plotly.com/v2/plots/?order_by=-views ---> 200

// GET https://api.plotly.com/v2/plots/?min_quality=5 ---> 200

// GET https://api.plotly.com/v2/plots/?max_quality=5 ---> 200

feed

Listing all handpicked feed plots can be done via a GET request to this endpoint. By default, plots will be listed in a random order.

Example:

// GET https://api.plotly.com/v2/plots/feed ---> 200

create

You can create new plot resources here. The only required field is 'figure'. Currently, the figure is restricted to only contain references to grid data. That is, this will fail if raw data arrays are passed in. To create and manipulate underlying grids for plots, see the grids endpoint.

Example:

// This fails because a figure field is required.
// POST https://api.plotly.com/v2/plots ---> 400 Bad Request
{}

// This fails because the figure has raw data
//POST https://api.plotly.com/v2/plots ---> 400 Bad Request
{
    "figure": {"data": [{"y": ['this', 'is', 'raw', 'data']}]}
}

// This succeeds because the figure has src keys, not raw data.
//POST https://api.plotly.com/v2/plots ---> 200 OK
{
    "figure": {"data": [{"ysrc": "sven:88:u8nd62"}]}
}

When creating a grid, you can optionally specify a source_fid to specify where a plot has come from:

  • source_fid: the fid of a plot that was copied (and presumably edited) to produce this one

detail

There is a lot of meta information stored about plot files including filename, title, share_url, and content_url to name a few.

This information can only be reached with a GET to this endpoint.

Example:

// GET https://api.plotly.com/v2/plots/iheartgraphs:90

content

The contents of a plot can be downloaded via the content resource. The plot content contains referenced grid/column data by default. If you wish to return the raw grid/column data, the inline_data=true query must be included in the request url. The Content-Type header will be appropriately set for the response body.

Alternatively, you can set ?map_data=unreadable to append a mapping of sources to data that belongs to grids which are unreadable for the requestor. This is useful when you have read access to another users plot, but that plot contains grid references which you don't have access to.

Examples:

// Returns referenced grid/column data
// GET https://api.plotly.com/v2/plots/iheartgraphs:90/content ---> 200 OK

// Returns full grid/column data
// GET https://api.plotly.com/v2/plots/iheartgraphs:90/content?inline_data=true ---> 200 OK

// Returns full grid/column data when requestor doesn't have permission
// to read the referenced grid.
// GET https://api.plotly.com/v2/plots/iheartgraphs:90/content?map_data=unreadable ---> 200 OK

GET /v2/plots?cursor=cD0yMDE5LTA2LTE3KzE3JTNBMzIlM0ExMi44NDY1MDUlMkIwMCUzQTAw&format=api
HTTP 200 OK
Allow: GET, POST, HEAD, OPTIONS
Content-Type: application/json
Vary: Accept

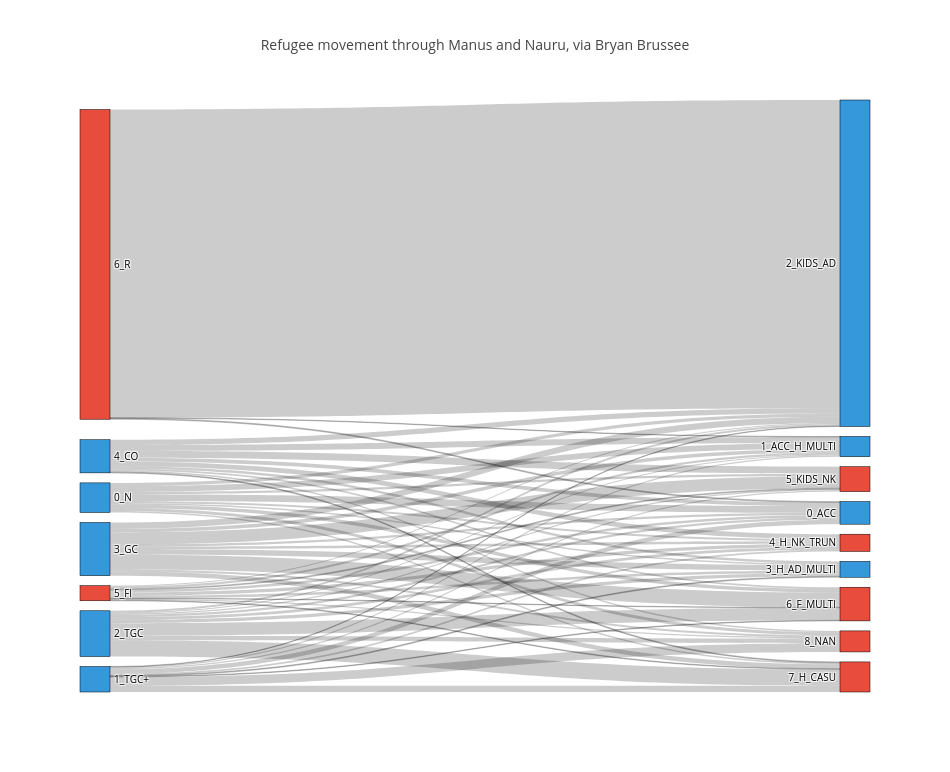
{
    "next": "https://api.plot.ly/v2/plots?cursor=cD0yMDE5LTA2LTE3KzE3JTNBMjYlM0EwOC42ODEwNDglMkIwMCUzQTAw&format=api",
    "previous": "https://api.plot.ly/v2/plots?cursor=cj0xJnA9MjAxOS0wNi0xNysxNyUzQTMxJTNBNDUuNzk4NzkzJTJCMDAlM0EwMA%3D%3D&format=api",
    "results": [
        {
            "creation_time": "2019-06-17T17:31:45.798793Z",
            "comments": {
                "results": [],
                "count": 0
            },
            "parented": true,
            "embed_url": "https://chart-studio.plotly.com/~ultracold/5.embed",
            "fid": "ultracold:5",
            "filename": "Feshbach Coil Temperature",
            "filetype": "plot",
            "img_url": "https://api.plotly.com/v2/files/ultracold:5/image?image_name=list-thumb",
            "image_urls": {
                "default": "https://api.plotly.com/v2/files/ultracold:5/image?image_name=default",
                "block-thumb": "https://api.plotly.com/v2/files/ultracold:5/image?image_name=block-thumb",
                "list-thumb": "https://api.plotly.com/v2/files/ultracold:5/image?image_name=list-thumb"
            },
            "api_urls": {
                "files": "https://api.plotly.com/v2/files/ultracold:5",
                "plots": "https://api.plotly.com/v2/plots/ultracold:5",
                "parent": "https://api.plotly.com/v2/folders/home?user=ultracold"
            },
            "owner": "ultracold",
            "parent": -1,
            "preview": "",
            "referencers": [],
            "references": [],
            "title": "",
            "views": 0,
            "web_url": "https://chart-studio.plotly.com/~ultracold/5/",
            "world_readable": true,
            "date_modified": "2019-06-17T17:55:01.535Z",
            "stars": {
                "results": [],
                "count": 0
            },
            "collaborators": {
                "results": [],
                "count": 0
            },
            "subfolder_count": null,
            "refresh_interval": null,
            "organize_view_url": "https://chart-studio.plotly.com/~ultracold/5/",
            "current_user_permission": "read",
            "is_theme": null,
            "is_template": false,
            "autosize": true,
            "caption": "",
            "figure": {
                "data": [
                    {
                        "mode": "lines",
                        "type": "scatter",
                        "xsrc": "ultracold:4:3e2a56",
                        "ysrc": "ultracold:4:cf0d9d",
                        "autocolorscale": true
                    }
                ],
                "frames": [],
                "layout": {
                    "title": {
                        "text": "Feshbach Coil Temperature"
                    },
                    "xaxis": {
                        "type": "date",
                        "range": [
                            "2019-06-17 13:25:46.336",
                            "2019-06-17 13:26:07.38"
                        ],
                        "title": {
                            "text": "Time"
                        },
                        "autorange": true
                    },
                    "yaxis": {
                        "type": "linear",
                        "range": [
                            26.900555555555556,
                            32.28944444444445
                        ],
                        "title": {
                            "text": "Temperature (C)"
                        },
                        "autorange": true
                    },
                    "autosize": true,
                    "template": {
                        "data": {
                            "bar": [
                                {
                                    "type": "bar",
                                    "marker": {
                                        "colorbar": {
                                            "ticks": "",
                                            "outlinewidth": 0
                                        }
                                    }
                                }
                            ],
                            "table": [
                                {
                                    "type": "table",
                                    "cells": {
                                        "fill": {
                                            "color": "#506784"
                                        },
                                        "line": {
                                            "color": "rgb(17,17,17)"
                                        }
                                    },
                                    "header": {
                                        "fill": {
                                            "color": "#2a3f5f"
                                        },
                                        "line": {
                                            "color": "rgb(17,17,17)"
                                        }
                                    }
                                }
                            ],
                            "carpet": [
                                {
                                    "type": "carpet",
                                    "aaxis": {
                                        "gridcolor": "#506784",
                                        "linecolor": "#506784",
                                        "endlinecolor": "#A2B1C6",
                                        "minorgridcolor": "#506784",
                                        "startlinecolor": "#A2B1C6"
                                    },
                                    "baxis": {
                                        "gridcolor": "#506784",
                                        "linecolor": "#506784",
                                        "endlinecolor": "#A2B1C6",
                                        "minorgridcolor": "#506784",
                                        "startlinecolor": "#A2B1C6"
                                    }
                                }
                            ],
                            "mesh3d": [
                                {
                                    "type": "mesh3d",
                                    "colorbar": {
                                        "ticks": "",
                                        "outlinewidth": 0
                                    }
                                }
                            ],
                            "contour": [
                                {
                                    "type": "contour",
                                    "colorbar": {
                                        "ticks": "",
                                        "outlinewidth": 0
                                    },
                                    "autocolorscale": true
                                }
                            ],
                            "heatmap": [
                                {
                                    "type": "heatmap",
                                    "colorbar": {
                                        "ticks": "",
                                        "outlinewidth": 0
                                    },
                                    "autocolorscale": true
                                }
                            ],
                            "scatter": [
                                {
                                    "type": "scatter",
                                    "marker": {
                                        "colorbar": {
                                            "ticks": "",
                                            "outlinewidth": 0
                                        }
                                    }
                                }
                            ],
                            "surface": [
                                {
                                    "type": "surface",
                                    "colorbar": {
                                        "ticks": "",
                                        "outlinewidth": 0
                                    }
                                }
                            ],
                            "heatmapgl": [
                                {
                                    "type": "heatmapgl",
                                    "colorbar": {
                                        "ticks": "",
                                        "outlinewidth": 0
                                    }
                                }
                            ],
                            "histogram": [
                                {
                                    "type": "histogram",
                                    "marker": {
                                        "colorbar": {
                                            "ticks": "",
                                            "outlinewidth": 0
                                        }
                                    }
                                }
                            ],
                            "parcoords": [
                                {
                                    "line": {
                                        "colorbar": {
                                            "ticks": "",
                                            "outlinewidth": 0
                                        }
                                    },
                                    "type": "parcoords"
                                }
                            ],
                            "scatter3d": [
                                {
                                    "type": "scatter3d",
                                    "marker": {
                                        "colorbar": {
                                            "ticks": "",
                                            "outlinewidth": 0
                                        }
                                    }
                                }
                            ],
                            "scattergl": [
                                {
                                    "type": "scattergl",
                                    "marker": {
                                        "colorbar": {
                                            "ticks": "",
                                            "outlinewidth": 0
                                        }
                                    }
                                }
                            ],
                            "choropleth": [
                                {
                                    "type": "choropleth",
                                    "colorbar": {
                                        "ticks": "",
                                        "outlinewidth": 0
                                    }
                                }
                            ],
                            "scattergeo": [
                                {
                                    "type": "scattergeo",
                                    "marker": {
                                        "colorbar": {
                                            "ticks": "",
                                            "outlinewidth": 0
                                        }
                                    }
                                }
                            ],
                            "histogram2d": [
                                {
                                    "type": "histogram2d",
                                    "colorbar": {
                                        "ticks": "",
                                        "outlinewidth": 0
                                    },
                                    "autocolorscale": true
                                }
                            ],
                            "scatterpolar": [
                                {
                                    "type": "scatterpolar",
                                    "marker": {
                                        "colorbar": {
                                            "ticks": "",
                                            "outlinewidth": 0
                                        }
                                    }
                                }
                            ],
                            "contourcarpet": [
                                {
                                    "type": "contourcarpet",
                                    "colorbar": {
                                        "ticks": "",
                                        "outlinewidth": 0
                                    }
                                }
                            ],
                            "scattercarpet": [
                                {
                                    "type": "scattercarpet",
                                    "marker": {
                                        "colorbar": {
                                            "ticks": "",
                                            "outlinewidth": 0
                                        }
                                    }
                                }
                            ],
                            "scattermapbox": [
                                {
                                    "type": "scattermapbox",
                                    "marker": {
                                        "colorbar": {
                                            "ticks": "",
                                            "outlinewidth": 0
                                        }
                                    }
                                }
                            ],
                            "scatterpolargl": [
                                {
                                    "type": "scatterpolargl",
                                    "marker": {
                                        "colorbar": {
                                            "ticks": "",
                                            "outlinewidth": 0
                                        }
                                    }
                                }
                            ],
                            "scatterternary": [
                                {
                                    "type": "scatterternary",
                                    "marker": {
                                        "colorbar": {
                                            "ticks": "",
                                            "outlinewidth": 0
                                        }
                                    }
                                }
                            ],
                            "histogram2dcontour": [
                                {
                                    "type": "histogram2dcontour",
                                    "colorbar": {
                                        "ticks": "",
                                        "outlinewidth": 0
                                    },
                                    "autocolorscale": true
                                }
                            ]
                        },
                        "layout": {
                            "geo": {
                                "bgcolor": "rgb(17,17,17)",
                                "showland": true,
                                "lakecolor": "rgb(17,17,17)",
                                "landcolor": "rgb(17,17,17)",
                                "showlakes": true,
                                "subunitcolor": "#506784"
                            },
                            "font": {
                                "color": "#f2f5fa"
                            },
                            "polar": {
                                "bgcolor": "rgb(17,17,17)",
                                "radialaxis": {
                                    "ticks": "",
                                    "gridcolor": "#506784",
                                    "linecolor": "#506784"
                                },
                                "angularaxis": {
                                    "ticks": "",
                                    "gridcolor": "#506784",
                                    "linecolor": "#506784"
                                }
                            },
                            "scene": {
                                "xaxis": {
                                    "ticks": "",
                                    "gridcolor": "#506784",
                                    "gridwidth": 2,
                                    "linecolor": "#506784",
                                    "zerolinecolor": "#C8D4E3",
                                    "showbackground": true,
                                    "backgroundcolor": "rgb(17,17,17)"
                                },
                                "yaxis": {
                                    "ticks": "",
                                    "gridcolor": "#506784",
                                    "gridwidth": 2,
                                    "linecolor": "#506784",
                                    "zerolinecolor": "#C8D4E3",
                                    "showbackground": true,
                                    "backgroundcolor": "rgb(17,17,17)"
                                },
                                "zaxis": {
                                    "ticks": "",
                                    "gridcolor": "#506784",
                                    "gridwidth": 2,
                                    "linecolor": "#506784",
                                    "zerolinecolor": "#C8D4E3",
                                    "showbackground": true,
                                    "backgroundcolor": "rgb(17,17,17)"
                                }
                            },
                            "title": {
                                "x": 0.05
                            },
                            "xaxis": {
                                "ticks": "",
                                "gridcolor": "#283442",
                                "linecolor": "#506784",
                                "automargin": true,
                                "zerolinecolor": "#283442",
                                "zerolinewidth": 2
                            },
                            "yaxis": {
                                "ticks": "",
                                "gridcolor": "#283442",
                                "linecolor": "#506784",
                                "automargin": true,
                                "zerolinecolor": "#283442",
                                "zerolinewidth": 2
                            },
                            "ternary": {
                                "aaxis": {
                                    "ticks": "",
                                    "gridcolor": "#506784",
                                    "linecolor": "#506784"
                                },
                                "baxis": {
                                    "ticks": "",
                                    "gridcolor": "#506784",
                                    "linecolor": "#506784"
                                },
                                "caxis": {
                                    "ticks": "",
                                    "gridcolor": "#506784",
                                    "linecolor": "#506784"
                                },
                                "bgcolor": "rgb(17,17,17)"
                            },
                            "colorway": [
                                "#636efa",
                                "#EF553B",
                                "#00cc96",
                                "#ab63fa",
                                "#19d3f3",
                                "#e763fa",
                                "#fecb52",
                                "#ffa15a",
                                "#ff6692",
                                "#b6e880"
                            ],
                            "hovermode": "closest",
                            "colorscale": {
                                "diverging": [
                                    [
                                        0,
                                        "#8e0152"
                                    ],
                                    [
                                        0.1,
                                        "#c51b7d"
                                    ],
                                    [
                                        0.2,
                                        "#de77ae"
                                    ],
                                    [
                                        0.3,
                                        "#f1b6da"
                                    ],
                                    [
                                        0.4,
                                        "#fde0ef"
                                    ],
                                    [
                                        0.5,
                                        "#f7f7f7"
                                    ],
                                    [
                                        0.6,
                                        "#e6f5d0"
                                    ],
                                    [
                                        0.7,
                                        "#b8e186"
                                    ],
                                    [
                                        0.8,
                                        "#7fbc41"
                                    ],
                                    [
                                        0.9,
                                        "#4d9221"
                                    ],
                                    [
                                        1,
                                        "#276419"
                                    ]
                                ],
                                "sequential": [
                                    [
                                        0,
                                        "#0508b8"
                                    ],
                                    [
                                        0.0893854748603352,
                                        "#1910d8"
                                    ],
                                    [
                                        0.1787709497206704,
                                        "#3c19f0"
                                    ],
                                    [
                                        0.2681564245810056,
                                        "#6b1cfb"
                                    ],
                                    [
                                        0.3575418994413408,
                                        "#981cfd"
                                    ],
                                    [
                                        0.44692737430167595,
                                        "#bf1cfd"
                                    ],
                                    [
                                        0.5363128491620112,
                                        "#dd2bfd"
                                    ],
                                    [
                                        0.6256983240223464,
                                        "#f246fe"
                                    ],
                                    [
                                        0.7150837988826816,
                                        "#fc67fd"
                                    ],
                                    [
                                        0.8044692737430168,
                                        "#fe88fc"
                                    ],
                                    [
                                        0.8938547486033519,
                                        "#fea5fd"
                                    ],
                                    [
                                        0.9832402234636871,
                                        "#febefe"
                                    ],
                                    [
                                        1,
                                        "#fec3fe"
                                    ]
                                ],
                                "sequentialminus": [
                                    [
                                        0,
                                        "#0508b8"
                                    ],
                                    [
                                        0.0893854748603352,
                                        "#1910d8"
                                    ],
                                    [
                                        0.1787709497206704,
                                        "#3c19f0"
                                    ],
                                    [
                                        0.2681564245810056,
                                        "#6b1cfb"
                                    ],
                                    [
                                        0.3575418994413408,
                                        "#981cfd"
                                    ],
                                    [
                                        0.44692737430167595,
                                        "#bf1cfd"
                                    ],
                                    [
                                        0.5363128491620112,
                                        "#dd2bfd"
                                    ],
                                    [
                                        0.6256983240223464,
                                        "#f246fe"
                                    ],
                                    [
                                        0.7150837988826816,
                                        "#fc67fd"
                                    ],
                                    [
                                        0.8044692737430168,
                                        "#fe88fc"
                                    ],
                                    [
                                        0.8938547486033519,
                                        "#fea5fd"
                                    ],
                                    [
                                        0.9832402234636871,
                                        "#febefe"
                                    ],
                                    [
                                        1,
                                        "#fec3fe"
                                    ]
                                ]
                            },
                            "plot_bgcolor": "rgb(17,17,17)",
                            "paper_bgcolor": "rgb(17,17,17)",
                            "shapedefaults": {
                                "line": {
                                    "width": 0
                                },
                                "opacity": 0.4,
                                "fillcolor": "#f2f5fa"
                            },
                            "sliderdefaults": {
                                "bgcolor": "#C8D4E3",
                                "tickwidth": 0,
                                "bordercolor": "rgb(17,17,17)",
                                "borderwidth": 1
                            },
                            "annotationdefaults": {
                                "arrowhead": 0,
                                "arrowcolor": "#f2f5fa",
                                "arrowwidth": 1
                            },
                            "updatemenudefaults": {
                                "bgcolor": "#506784",
                                "borderwidth": 0
                            }
                        },
                        "themeRef": "PLOTLY_DARK"
                    }
                }
            },
            "height": null,
            "width": null,
            "user": {
                "profile_url": "https://chart-studio.plotly.com/~ultracold",
                "avatar_url": "https://storage.googleapis.com/plotly-prod-profiles/23.jpg",
                "background_url": "https://storage.googleapis.com/plotly-prod-profiles/bg-14.jpg",
                "bio": "",
                "nickname": "",
                "website": "",
                "stream_tokens": null,
                "feature_set_id": null,
                "csrf_token": null,
                "date_joined": "2019-06-17 14:47:46",
                "mapbox_access_tokens": null,
                "has_password": null,
                "username": "ultracold",
                "email": null,
                "is_active": null,
                "readonly": null,
                "is_dash_creator": null,
                "dash_created_count": null,
                "is_chart_creator": null,
                "charts_created_count": null
            }
        },
        {
            "creation_time": "2019-06-17T17:31:10.710799Z",
            "comments": {
                "results": [],
                "count": 0
            },
            "parented": true,
            "embed_url": "https://chart-studio.plotly.com/~ebean/81.embed",
            "fid": "ebean:81",
            "filename": "pAwithAndWithout100%3DsurfaceFIXED",
            "filetype": "plot",
            "img_url": "https://api.plotly.com/v2/files/ebean:81/image?image_name=list-thumb",
            "image_urls": {
                "default": "https://api.plotly.com/v2/files/ebean:81/image?image_name=default",
                "block-thumb": "https://storage.googleapis.com/plotly-prod-images/ebean/81/8_S4V2GZW3SM7IEP4Q2HPCGHZR3WA7HP.png",
                "list-thumb": "https://api.plotly.com/v2/files/ebean:81/image?image_name=list-thumb"
            },
            "api_urls": {
                "files": "https://api.plotly.com/v2/files/ebean:81",
                "plots": "https://api.plotly.com/v2/plots/ebean:81",
                "parent": "https://api.plotly.com/v2/folders/home?user=ebean"
            },
            "owner": "ebean",
            "parent": -1,
            "preview": "",
            "referencers": [],
            "references": [],
            "title": "",
            "views": 1,
            "web_url": "https://chart-studio.plotly.com/~ebean/81/",
            "world_readable": true,
            "date_modified": "2019-06-17T17:31:10.722Z",
            "stars": {
                "results": [],
                "count": 0
            },
            "collaborators": {
                "results": [],
                "count": 0
            },
            "subfolder_count": null,
            "refresh_interval": null,
            "organize_view_url": "https://chart-studio.plotly.com/~ebean/81/",
            "current_user_permission": "read",
            "is_theme": null,
            "is_template": null,
            "autosize": true,
            "caption": "",
            "figure": {
                "data": [
                    {
                        "type": "surface",
                        "xsrc": "ebean:80:393935",
                        "ysrc": "ebean:80:10cb1a",
                        "zsrc": "ebean:80:0b26bb",
                        "frame": null,
                        "scene": "scene2",
                        "colorbar": {
                            "y": 1,
                            "len": 0.333333333333333,
                            "title": "",
                            "lenmode": "fraction",
                            "ticklen": 2,
                            "yanchor": "top"
                        },
                        "contours": {
                            "z": {
                                "show": false,
                                "project": {
                                    "z": true
                                },
                                "usecolormap": true,
                                "highlightcolor": "ff0000"
                            }
                        },
                        "showscale": true,
                        "colorscale": [
                            [
                                "0",
                                "rgba(68,1,84,1)"
                            ],
                            [
                                "0.0416666666666666",
                                "rgba(70,19,97,1)"
                            ],
                            [
                                "0.0833333333333332",
                                "rgba(72,32,111,1)"
                            ],
                            [
                                "0.125",
                                "rgba(71,45,122,1)"
                            ],
                            [
                                "0.166666666666667",
                                "rgba(68,58,128,1)"
                            ],
                            [
                                "0.208333333333333",
                                "rgba(64,70,135,1)"
                            ],
                            [
                                "0.25",
                                "rgba(60,82,138,1)"
                            ],
                            [
                                "0.291666666666667",
                                "rgba(56,93,140,1)"
                            ],
                            [
                                "0.333333333333333",
                                "rgba(49,104,142,1)"
                            ],
                            [
                                "0.375",
                                "rgba(46,114,142,1)"
                            ],
                            [
                                "0.416666666666667",
                                "rgba(42,123,142,1)"
                            ],
                            [
                                "0.458333333333333",
                                "rgba(38,133,141,1)"
                            ],
                            [
                                "0.5",
                                "rgba(37,144,140,1)"
                            ],
                            [
                                "0.541666666666667",
                                "rgba(33,154,138,1)"
                            ],
                            [
                                "0.583333333333333",
                                "rgba(39,164,133,1)"
                            ],
                            [
                                "0.625",
                                "rgba(47,174,127,1)"
                            ],
                            [
                                "0.666666666666667",
                                "rgba(53,183,121,1)"
                            ],
                            [
                                "0.708333333333333",
                                "rgba(79,191,110,1)"
                            ],
                            [
                                "0.75",
                                "rgba(98,199,98,1)"
                            ],
                            [
                                "0.791666666666667",
                                "rgba(119,207,85,1)"
                            ],
                            [
                                "0.833333333333334",
                                "rgba(147,214,70,1)"
                            ],
                            [
                                "0.875",
                                "rgba(172,220,52,1)"
                            ],
                            [
                                "0.916666666666667",
                                "rgba(199,225,42,1)"
                            ],
                            [
                                "0.958333333333333",
                                "rgba(226,228,40,1)"
                            ],
                            [
                                "1",
                                "rgba(253,231,37,1)"
                            ]
                        ]
                    },
                    {
                        "type": "surface",
                        "xsrc": "ebean:80:4aecb9",
                        "ysrc": "ebean:80:73e6ac",
                        "zsrc": "ebean:80:becd4f",
                        "frame": null,
                        "scene": "scene",
                        "colorbar": {
                            "y": 0.666666666666667,
                            "len": 0.333333333333333,
                            "title": "",
                            "lenmode": "fraction",
                            "ticklen": 2,
                            "yanchor": "top"
                        },
                        "contours": {
                            "z": {
                                "show": false,
                                "project": {
                                    "z": true
                                },
                                "usecolormap": true,
                                "highlightcolor": "ff0000"
                            }
                        },
                        "showscale": true,
                        "colorscale": [
                            [
                                "0",
                                "rgba(68,1,84,1)"
                            ],
                            [
                                "0.0416666666666665",
                                "rgba(70,19,97,1)"
                            ],
                            [
                                "0.0833333333333334",
                                "rgba(72,32,111,1)"
                            ],
                            [
                                "0.125",
                                "rgba(71,45,122,1)"
                            ],
                            [
                                "0.166666666666667",
                                "rgba(68,58,128,1)"
                            ],
                            [
                                "0.208333333333333",
                                "rgba(64,70,135,1)"
                            ],
                            [
                                "0.25",
                                "rgba(60,82,138,1)"
                            ],
                            [
                                "0.291666666666667",
                                "rgba(56,93,140,1)"
                            ],
                            [
                                "0.333333333333333",
                                "rgba(49,104,142,1)"
                            ],
                            [
                                "0.375",
                                "rgba(46,114,142,1)"
                            ],
                            [
                                "0.416666666666667",
                                "rgba(42,123,142,1)"
                            ],
                            [
                                "0.458333333333334",
                                "rgba(38,133,141,1)"
                            ],
                            [
                                "0.5",
                                "rgba(37,144,140,1)"
                            ],
                            [
                                "0.541666666666667",
                                "rgba(33,154,138,1)"
                            ],
                            [
                                "0.583333333333333",
                                "rgba(39,164,133,1)"
                            ],
                            [
                                "0.625",
                                "rgba(47,174,127,1)"
                            ],
                            [
                                "0.666666666666667",
                                "rgba(53,183,121,1)"
                            ],
                            [
                                "0.708333333333333",
                                "rgba(79,191,110,1)"
                            ],
                            [
                                "0.75",
                                "rgba(98,199,98,1)"
                            ],
                            [
                                "0.791666666666667",
                                "rgba(119,207,85,1)"
                            ],
                            [
                                "0.833333333333334",
                                "rgba(147,214,70,1)"
                            ],
                            [
                                "0.875",
                                "rgba(172,220,52,1)"
                            ],
                            [
                                "0.916666666666667",
                                "rgba(199,225,42,1)"
                            ],
                            [
                                "0.958333333333333",
                                "rgba(226,228,40,1)"
                            ],
                            [
                                "1",
                                "rgba(253,231,37,1)"
                            ]
                        ]
                    }
                ],
                "layout": {
                    "NA": {
                        "anchor": [],
                        "domain": [
                            0,
                            1
                        ]
                    },
                    "NA2": {
                        "anchor": [],
                        "domain": [
                            0,
                            1
                        ]
                    },
                    "scene": {
                        "xaxis": {
                            "title": []
                        },
                        "yaxis": {
                            "title": []
                        },
                        "zaxis": {
                            "title": []
                        },
                        "aspectmode": "cube"
                    },
                    "title": "pA, without (left) and with (right) 100%",
                    "legend": {
                        "y": 0.333333333333333,
                        "yanchor": "top"
                    },
                    "margin": {
                        "b": 40,
                        "l": 60,
                        "r": 10,
                        "t": 25
                    },
                    "scene2": {
                        "aspectmode": "cube"
                    },
                    "hovermode": "closest",
                    "showlegend": false
                }
            },
            "height": null,
            "width": null,
            "user": {
                "profile_url": "https://chart-studio.plotly.com/~ebean",
                "avatar_url": "https://storage.googleapis.com/plotly-prod-profiles/20.jpg",
                "background_url": "https://storage.googleapis.com/plotly-prod-profiles/bg-7.jpg",
                "bio": "",
                "nickname": "Emily Bean",
                "website": "",
                "stream_tokens": null,
                "feature_set_id": null,
                "csrf_token": null,
                "date_joined": "2019-06-06 19:04:37",
                "mapbox_access_tokens": null,
                "has_password": null,
                "username": "ebean",
                "email": null,
                "is_active": null,
                "readonly": null,
                "is_dash_creator": null,
                "dash_created_count": null,
                "is_chart_creator": null,
                "charts_created_count": null
            }
        },
        {
            "creation_time": "2019-06-17T17:30:30.476753Z",
            "comments": {
                "results": [],
                "count": 0
            },
            "parented": true,
            "embed_url": "https://chart-studio.plotly.com/~ebean/79.embed",
            "fid": "ebean:79",
            "filename": "cAWithAndWithout100FIXED",
            "filetype": "plot",
            "img_url": "https://api.plotly.com/v2/files/ebean:79/image?image_name=list-thumb",
            "image_urls": {
                "default": "https://api.plotly.com/v2/files/ebean:79/image?image_name=default",
                "block-thumb": "https://storage.googleapis.com/plotly-prod-images/ebean/79/8_EW06HVFWKOVLYJ7MDZ6C7F4AQKPWFB.png",
                "list-thumb": "https://api.plotly.com/v2/files/ebean:79/image?image_name=list-thumb"
            },
            "api_urls": {
                "files": "https://api.plotly.com/v2/files/ebean:79",
                "plots": "https://api.plotly.com/v2/plots/ebean:79",
                "parent": "https://api.plotly.com/v2/folders/home?user=ebean"
            },
            "owner": "ebean",
            "parent": -1,
            "preview": "",
            "referencers": [],
            "references": [],
            "title": "",
            "views": 0,
            "web_url": "https://chart-studio.plotly.com/~ebean/79/",
            "world_readable": true,
            "date_modified": "2019-06-17T17:30:30.488Z",
            "stars": {
                "results": [],
                "count": 0
            },
            "collaborators": {
                "results": [],
                "count": 0
            },
            "subfolder_count": null,
            "refresh_interval": null,
            "organize_view_url": "https://chart-studio.plotly.com/~ebean/79/",
            "current_user_permission": "read",
            "is_theme": null,
            "is_template": null,
            "autosize": true,
            "caption": "",
            "figure": {
                "data": [
                    {
                        "type": "surface",
                        "xsrc": "ebean:78:7aa9f4",
                        "ysrc": "ebean:78:afa59e",
                        "zsrc": "ebean:78:66eb4e",
                        "frame": null,
                        "scene": "scene2",
                        "colorbar": {
                            "y": 1,
                            "len": 0.333333333333333,
                            "title": "",
                            "lenmode": "fraction",
                            "ticklen": 2,
                            "yanchor": "top"
                        },
                        "contours": {
                            "z": {
                                "show": false,
                                "project": {
                                    "z": true
                                },
                                "usecolormap": true,
                                "highlightcolor": "ff0000"
                            }
                        },
                        "showscale": true,
                        "colorscale": [
                            [
                                "0",
                                "rgba(68,1,84,1)"
                            ],
                            [
                                "0.0416666666666664",
                                "rgba(70,19,97,1)"
                            ],
                            [
                                "0.0833333333333337",
                                "rgba(72,32,111,1)"
                            ],
                            [
                                "0.125",
                                "rgba(71,45,122,1)"
                            ],
                            [
                                "0.166666666666667",
                                "rgba(68,58,128,1)"
                            ],
                            [
                                "0.208333333333333",
                                "rgba(64,70,135,1)"
                            ],
                            [
                                "0.25",
                                "rgba(60,82,138,1)"
                            ],
                            [
                                "0.291666666666667",
                                "rgba(56,93,140,1)"
                            ],
                            [
                                "0.333333333333333",
                                "rgba(49,104,142,1)"
                            ],
                            [
                                "0.375",
                                "rgba(46,114,142,1)"
                            ],
                            [
                                "0.416666666666667",
                                "rgba(42,123,142,1)"
                            ],
                            [
                                "0.458333333333333",
                                "rgba(38,133,141,1)"
                            ],
                            [
                                "0.5",
                                "rgba(37,144,140,1)"
                            ],
                            [
                                "0.541666666666667",
                                "rgba(33,154,138,1)"
                            ],
                            [
                                "0.583333333333333",
                                "rgba(39,164,133,1)"
                            ],
                            [
                                "0.625",
                                "rgba(47,174,127,1)"
                            ],
                            [
                                "0.666666666666667",
                                "rgba(53,183,121,1)"
                            ],
                            [
                                "0.708333333333333",
                                "rgba(79,191,110,1)"
                            ],
                            [
                                "0.75",
                                "rgba(98,199,98,1)"
                            ],
                            [
                                "0.791666666666666",
                                "rgba(119,207,85,1)"
                            ],
                            [
                                "0.833333333333333",
                                "rgba(147,214,70,1)"
                            ],
                            [
                                "0.875",
                                "rgba(172,220,52,1)"
                            ],
                            [
                                "0.916666666666666",
                                "rgba(199,225,42,1)"
                            ],
                            [
                                "0.958333333333334",
                                "rgba(226,228,40,1)"
                            ],
                            [
                                "1",
                                "rgba(253,231,37,1)"
                            ]
                        ]
                    },
                    {
                        "type": "surface",
                        "xsrc": "ebean:78:892fa8",
                        "ysrc": "ebean:78:bd36cc",
                        "zsrc": "ebean:78:77872c",
                        "frame": null,
                        "scene": "scene",
                        "colorbar": {
                            "y": 0.666666666666667,
                            "len": 0.333333333333333,
                            "title": "",
                            "lenmode": "fraction",
                            "ticklen": 2,
                            "yanchor": "top"
                        },
                        "contours": {
                            "z": {
                                "show": false,
                                "project": {
                                    "z": true
                                },
                                "usecolormap": true,
                                "highlightcolor": "ff0000"
                            }
                        },
                        "showscale": true,
                        "colorscale": [
                            [
                                "0",
                                "rgba(68,1,84,1)"
                            ],
                            [
                                "0.041666666666667",
                                "rgba(70,19,97,1)"
                            ],
                            [
                                "0.0833333333333333",
                                "rgba(72,32,111,1)"
                            ],
                            [
                                "0.125",
                                "rgba(71,45,122,1)"
                            ],
                            [
                                "0.166666666666667",
                                "rgba(68,58,128,1)"
                            ],
                            [
                                "0.208333333333334",
                                "rgba(64,70,135,1)"
                            ],
                            [
                                "0.25",
                                "rgba(60,82,138,1)"
                            ],
                            [
                                "0.291666666666667",
                                "rgba(56,93,140,1)"
                            ],
                            [
                                "0.333333333333333",
                                "rgba(49,104,142,1)"
                            ],
                            [
                                "0.375",
                                "rgba(46,114,142,1)"
                            ],
                            [
                                "0.416666666666666",
                                "rgba(42,123,142,1)"
                            ],
                            [
                                "0.458333333333333",
                                "rgba(38,133,141,1)"
                            ],
                            [
                                "0.5",
                                "rgba(37,144,140,1)"
                            ],
                            [
                                "0.541666666666667",
                                "rgba(33,154,138,1)"
                            ],
                            [
                                "0.583333333333334",
                                "rgba(39,164,133,1)"
                            ],
                            [
                                "0.625",
                                "rgba(47,174,127,1)"
                            ],
                            [
                                "0.666666666666667",
                                "rgba(53,183,121,1)"
                            ],
                            [
                                "0.708333333333333",
                                "rgba(79,191,110,1)"
                            ],
                            [
                                "0.75",
                                "rgba(98,199,98,1)"
                            ],
                            [
                                "0.791666666666666",
                                "rgba(119,207,85,1)"
                            ],
                            [
                                "0.833333333333333",
                                "rgba(147,214,70,1)"
                            ],
                            [
                                "0.875",
                                "rgba(172,220,52,1)"
                            ],
                            [
                                "0.916666666666667",
                                "rgba(199,225,42,1)"
                            ],
                            [
                                "0.958333333333334",
                                "rgba(226,228,40,1)"
                            ],
                            [
                                "1",
                                "rgba(253,231,37,1)"
                            ]
                        ]
                    }
                ],
                "layout": {
                    "NA": {
                        "anchor": [],
                        "domain": [
                            0,
                            1
                        ]
                    },
                    "NA2": {
                        "anchor": [],
                        "domain": [
                            0,
                            1
                        ]
                    },
                    "scene": {
                        "xaxis": {
                            "title": []
                        },
                        "yaxis": {
                            "title": []
                        },
                        "zaxis": {
                            "title": []
                        },
                        "aspectmode": "cube"
                    },
                    "title": "cA, without (left) and with (right) 100%",
                    "legend": {
                        "y": 0.333333333333333,
                        "yanchor": "top"
                    },
                    "margin": {
                        "b": 40,
                        "l": 60,
                        "r": 10,
                        "t": 25
                    },
                    "scene2": {
                        "aspectmode": "cube"
                    },
                    "hovermode": "closest",
                    "showlegend": false
                }
            },
            "height": null,
            "width": null,
            "user": {
                "profile_url": "https://chart-studio.plotly.com/~ebean",
                "avatar_url": "https://storage.googleapis.com/plotly-prod-profiles/20.jpg",
                "background_url": "https://storage.googleapis.com/plotly-prod-profiles/bg-7.jpg",
                "bio": "",
                "nickname": "Emily Bean",
                "website": "",
                "stream_tokens": null,
                "feature_set_id": null,
                "csrf_token": null,
                "date_joined": "2019-06-06 19:04:37",
                "mapbox_access_tokens": null,
                "has_password": null,
                "username": "ebean",
                "email": null,
                "is_active": null,
                "readonly": null,
                "is_dash_creator": null,
                "dash_created_count": null,
                "is_chart_creator": null,
                "charts_created_count": null
            }
        },
        {
            "creation_time": "2019-06-17T17:30:24.414096Z",
            "comments": {
                "results": [],
                "count": 0
            },
            "parented": true,
            "embed_url": "https://chart-studio.plotly.com/~moiz_sakha/38.embed",
            "fid": "moiz_sakha:38",
            "filename": "Saarlouis_Scheid_Bahnhofstr_14_2017-05-20.png",
            "filetype": "plot",
            "img_url": "https://api.plotly.com/v2/files/moiz_sakha:38/image?image_name=list-thumb",
            "image_urls": {
                "default": "https://api.plotly.com/v2/files/moiz_sakha:38/image?image_name=default",
                "block-thumb": "https://storage.googleapis.com/plotly-prod-images/moiz_sakha/38/8_EHG9A5AX3VTXU1SVGEE3HE3FNBUGA6.png",
                "list-thumb": "https://api.plotly.com/v2/files/moiz_sakha:38/image?image_name=list-thumb"
            },
            "api_urls": {
                "files": "https://api.plotly.com/v2/files/moiz_sakha:38",
                "plots": "https://api.plotly.com/v2/plots/moiz_sakha:38",
                "parent": "https://api.plotly.com/v2/folders/home?user=moiz_sakha"
            },
            "owner": "moiz_sakha",
            "parent": -1,
            "preview": "",
            "referencers": [],
            "references": [],
            "title": "Location: Saarlouis_Scheid_Bahnhofstr_14, Date: 2017-05-20",
            "views": 0,
            "web_url": "https://chart-studio.plotly.com/~moiz_sakha/38/location-saarlouis-scheid-bahnhofstr-14-date-2017-05-20/",
            "world_readable": true,
            "date_modified": "2019-06-21T12:49:44.111Z",
            "stars": {
                "results": [],
                "count": 0
            },
            "collaborators": {
                "results": [],
                "count": 0
            },
            "subfolder_count": null,
            "refresh_interval": null,
            "organize_view_url": "https://chart-studio.plotly.com/~moiz_sakha/38/",
            "current_user_permission": "read",
            "is_theme": null,
            "is_template": null,
            "autosize": true,
            "caption": "",
            "figure": {
                "data": [
                    {
                        "uid": "09125dd0-9423-11e9-8974-340286037753",
                        "mode": "lines",
                        "name": "label",
                        "type": "scatter",
                        "xsrc": "moiz_sakha:39:69aa45",
                        "ysrc": "moiz_sakha:39:ecbeef"
                    },
                    {
                        "uid": "09125dd1-9423-11e9-8974-340286037753",
                        "mode": "lines",
                        "name": "pred_nodb",
                        "type": "scatter",
                        "xsrc": "moiz_sakha:39:69aa45",
                        "ysrc": "moiz_sakha:39:6f3a8d"
                    },
                    {
                        "uid": "09125dd2-9423-11e9-8974-340286037753",
                        "mode": "lines",
                        "name": "pred_db",
                        "type": "scatter",
                        "xsrc": "moiz_sakha:39:69aa45",
                        "ysrc": "moiz_sakha:39:1d2eac"
                    },
                    {
                        "uid": "09125dd3-9423-11e9-8974-340286037753",
                        "mode": "lines",
                        "name": "pred_rf",
                        "type": "scatter",
                        "xsrc": "moiz_sakha:39:69aa45",
                        "ysrc": "moiz_sakha:39:868ac4"
                    },
                    {
                        "uid": "09125dd4-9423-11e9-8974-340286037753",
                        "mode": "lines",
                        "name": "pred_rf_conf",
                        "type": "scatter",
                        "xsrc": "moiz_sakha:39:69aa45",
                        "ysrc": "moiz_sakha:39:868ac4",
                        "error_y": {
                            "arraysrc": "moiz_sakha:39:f04370",
                            "symmetric": false,
                            "arrayminussrc": "moiz_sakha:39:b6aec3"
                        }
                    },
                    {
                        "uid": "09125dd5-9423-11e9-8974-340286037753",
                        "fill": "tonexty",
                        "line": {
                            "color": "rgb(180, 142, 31)"
                        },
                        "mode": "lines",
                        "name": "pred_dropout",
                        "type": "scatter",
                        "xsrc": "moiz_sakha:39:69aa45",
                        "ysrc": "moiz_sakha:39:36dd86",
                        "fillcolor": "rgba(68, 68, 68, 0.3)"
                    }
                ],
                "layout": {
                    "title": "Location: Saarlouis_Scheid_Bahnhofstr_14, Date: 2017-05-20",
                    "xaxis": {
                        "title": "Time"
                    },
                    "yaxis": {
                        "title": "mpower (kW)"
                    }
                }
            },
            "height": null,
            "width": null,
            "user": {
                "profile_url": "https://chart-studio.plotly.com/~moiz_sakha",
                "avatar_url": "https://storage.googleapis.com/plotly-prod-profiles/87.jpg",
                "background_url": "https://storage.googleapis.com/plotly-prod-profiles/bg-11.jpg",
                "bio": "",
                "nickname": "",
                "website": "",
                "stream_tokens": null,
                "feature_set_id": null,
                "csrf_token": null,
                "date_joined": "2019-04-01 11:22:04",
                "mapbox_access_tokens": null,
                "has_password": null,
                "username": "moiz_sakha",
                "email": null,
                "is_active": null,
                "readonly": null,
                "is_dash_creator": null,
                "dash_created_count": null,
                "is_chart_creator": null,
                "charts_created_count": null
            }
        },
        {
            "creation_time": "2019-06-17T17:29:56.338699Z",
            "comments": {
                "results": [],
                "count": 0
            },
            "parented": true,
            "embed_url": "https://chart-studio.plotly.com/~clkickEDHEC/4.embed",
            "fid": "clkickEDHEC:4",
            "filename": "plot from API (2)",
            "filetype": "plot",
            "img_url": "https://api.plotly.com/v2/files/clkickEDHEC:4/image?image_name=list-thumb",
            "image_urls": {
                "default": "https://api.plotly.com/v2/files/clkickEDHEC:4/image?image_name=default",
                "block-thumb": "https://api.plotly.com/v2/files/clkickEDHEC:4/image?image_name=block-thumb",
                "list-thumb": "https://api.plotly.com/v2/files/clkickEDHEC:4/image?image_name=list-thumb"
            },
            "api_urls": {
                "files": "https://api.plotly.com/v2/files/clkickEDHEC:4",
                "plots": "https://api.plotly.com/v2/plots/clkickEDHEC:4",
                "parent": "https://api.plotly.com/v2/folders/home?user=clkickEDHEC"
            },
            "owner": "clkickEDHEC",
            "parent": -1,
            "preview": "",
            "referencers": [],
            "references": [],
            "title": "Refugee movement through Manus and Nauru, via <a href='http://www.bryanbrussee.com/sankey.html'>Bryan Brussee</a>",
            "views": 0,
            "web_url": "https://chart-studio.plotly.com/~clkickEDHEC/4/refugee-movement-through-manus-and-nauru-via-bryan-brussee/",
            "world_readable": true,
            "date_modified": "2019-06-17T17:29:56.829Z",
            "stars": {
                "results": [],
                "count": 0
            },
            "collaborators": {
                "results": [],
                "count": 0
            },
            "subfolder_count": null,
            "refresh_interval": null,
            "organize_view_url": "https://chart-studio.plotly.com/~clkickEDHEC/4/",
            "current_user_permission": "read",
            "is_theme": null,
            "is_template": null,
            "autosize": true,
            "caption": "",
            "figure": {
                "data": [
                    {
                        "link": {
                            "valuesrc": "clkickEDHEC:5:f7178f",
                            "sourcesrc": "clkickEDHEC:5:15f48a",
                            "targetsrc": "clkickEDHEC:5:cf2a44"
                        },
                        "node": {
                            "pad": 10,
                            "line": {
                                "color": "black",
                                "width": 0.5
                            },
                            "colorsrc": "clkickEDHEC:5:29c904",
                            "labelsrc": "clkickEDHEC:5:05022d",
                            "thickness": 30
                        },
                        "type": "sankey",
                        "domain": {
                            "x": [
                                0,
                                1
                            ],
                            "y": [
                                0,
                                1
                            ]
                        },
                        "orientation": "h",
                        "valueformat": ".0f"
                    }
                ],
                "layout": {
                    "font": {
                        "size": 10
                    },
                    "title": "Refugee movement through Manus and Nauru, via <a href='http://www.bryanbrussee.com/sankey.html'>Bryan Brussee</a>",
                    "width": 950,
                    "height": 772
                }
            },
            "height": 772,
            "width": 950,
            "user": {
                "profile_url": "https://chart-studio.plotly.com/~clkickEDHEC",
                "avatar_url": "https://storage.googleapis.com/plotly-prod-profiles/37.jpg",
                "background_url": "https://storage.googleapis.com/plotly-prod-profiles/bg-10.jpg",
                "bio": "",
                "nickname": "",
                "website": "",
                "stream_tokens": null,
                "feature_set_id": null,
                "csrf_token": null,
                "date_joined": "2019-06-17 16:58:19",
                "mapbox_access_tokens": null,
                "has_password": null,
                "username": "clkickEDHEC",
                "email": null,
                "is_active": null,
                "readonly": null,
                "is_dash_creator": null,
                "dash_created_count": null,
                "is_chart_creator": null,
                "charts_created_count": null
            }
        },
        {
            "creation_time": "2019-06-17T17:29:02.527207Z",
            "comments": {
                "results": [],
                "count": 0
            },
            "parented": true,
            "embed_url": "https://chart-studio.plotly.com/~RPlitique/0.embed",
            "fid": "RPlitique:0",
            "filename": "basic-line",
            "filetype": "plot",
            "img_url": "https://api.plotly.com/v2/files/RPlitique:0/image?image_name=list-thumb",
            "image_urls": {
                "default": "https://api.plotly.com/v2/files/RPlitique:0/image?image_name=default",
                "block-thumb": "https://storage.googleapis.com/plotly-prod-images/RPlitique/0/8_Q5PAOQ7EVQRHW26YS5J2WXWJF8VG1C.png",
                "list-thumb": "https://api.plotly.com/v2/files/RPlitique:0/image?image_name=list-thumb"
            },
            "api_urls": {
                "files": "https://api.plotly.com/v2/files/RPlitique:0",
                "plots": "https://api.plotly.com/v2/plots/RPlitique:0",
                "parent": "https://api.plotly.com/v2/folders/home?user=RPlitique"
            },
            "owner": "RPlitique",
            "parent": -1,
            "preview": "",
            "referencers": [],
            "references": [],
            "title": "",
            "views": 0,
            "web_url": "https://chart-studio.plotly.com/~RPlitique/0/",
            "world_readable": true,
            "date_modified": "2019-06-17T17:29:02.975Z",
            "stars": {
                "results": [],
                "count": 0
            },
            "collaborators": {
                "results": [],
                "count": 0
            },
            "subfolder_count": null,
            "refresh_interval": null,
            "organize_view_url": "https://chart-studio.plotly.com/~RPlitique/0/",
            "current_user_permission": "read",
            "is_theme": null,
            "is_template": null,
            "autosize": true,
            "caption": "",
            "figure": {
                "data": [
                    {
                        "uid": "8035a70c-0062-40c5-8ecf-396306c7a599",
                        "type": "scatter",
                        "xsrc": "RPlitique:1:9b6c6b",
                        "ysrc": "RPlitique:1:6c0f57"
                    }
                ],
                "layout": {}
            },
            "height": null,
            "width": null,
            "user": {
                "profile_url": "https://chart-studio.plotly.com/~RPlitique",
                "avatar_url": "https://storage.googleapis.com/plotly-prod-profiles/11.jpg",
                "background_url": "https://storage.googleapis.com/plotly-prod-profiles/bg-2.jpg",
                "bio": "",
                "nickname": "",
                "website": "",
                "stream_tokens": null,
                "feature_set_id": null,
                "csrf_token": null,
                "date_joined": "2019-06-17 17:27:46",
                "mapbox_access_tokens": null,
                "has_password": null,
                "username": "RPlitique",
                "email": null,
                "is_active": null,
                "readonly": null,
                "is_dash_creator": null,
                "dash_created_count": null,
                "is_chart_creator": null,
                "charts_created_count": null
            }
        },
        {
            "creation_time": "2019-06-17T17:28:21.909218Z",
            "comments": {
                "results": [],
                "count": 0
            },
            "parented": true,
            "embed_url": "https://chart-studio.plotly.com/~neujeffski/13.embed",
            "fid": "neujeffski:13",
            "filename": "Plotly Playground 2019-06-17 19:28:20",
            "filetype": "plot",
            "img_url": "https://api.plotly.com/v2/files/neujeffski:13/image?image_name=list-thumb",
            "image_urls": {
                "default": "https://storage.googleapis.com/plotly-prod-images/neujeffski/13/2_Y15581HNZ61WFKT678IOB4536UHJX3.png",
                "block-thumb": "https://storage.googleapis.com/plotly-prod-images/neujeffski/13/8_07V71A85C3JZCYGZ22GO752SR574CC.png",
                "list-thumb": "https://api.plotly.com/v2/files/neujeffski:13/image?image_name=list-thumb"
            },
            "api_urls": {
                "files": "https://api.plotly.com/v2/files/neujeffski:13",
                "plots": "https://api.plotly.com/v2/plots/neujeffski:13",
                "parent": "https://api.plotly.com/v2/folders/home?user=neujeffski"
            },
            "owner": "neujeffski",
            "parent": -1,
            "preview": "",
            "referencers": [],
            "references": [],
            "title": "{'font': {'color': '#151516'}}",
            "views": 0,
            "web_url": "https://chart-studio.plotly.com/~neujeffski/13/font-color-151516/",
            "world_readable": true,
            "date_modified": "2019-06-17T17:28:22.349Z",
            "stars": {
                "results": [],
                "count": 0
            },
            "collaborators": {
                "results": [],
                "count": 0
            },
            "subfolder_count": null,
            "refresh_interval": null,
            "organize_view_url": "https://chart-studio.plotly.com/~neujeffski/13/",
            "current_user_permission": "read",
            "is_theme": null,
            "is_template": null,
            "autosize": true,
            "caption": "",
            "figure": {
                "data": [
                    {
                        "uid": "ca9eec9f-1d2c-4a68-a164-3cd28893538f",
                        "fill": "tozeroy",
                        "line": {
                            "dash": "solid",
                            "color": "rgba(226, 74, 51, 1.0)",
                            "shape": "linear",
                            "width": 1.3
                        },
                        "mode": "lines",
                        "name": "b",
                        "text": "",
                        "type": "scatter",
                        "xsrc": "neujeffski:14:145baf",
                        "ysrc": "neujeffski:14:03c62f",
                        "fillcolor": "rgba(226, 74, 51, 0.3)"
                    },
                    {
                        "uid": "0086e48b-cab5-494e-95a5-7f395518cb6a",
                        "fill": "tozeroy",
                        "line": {
                            "dash": "solid",
                            "color": "rgba(62, 111, 176, 1.0)",
                            "shape": "linear",
                            "width": 1.3
                        },
                        "mode": "lines",
                        "name": "c",
                        "text": "",
                        "type": "scatter",
                        "xsrc": "neujeffski:14:145baf",
                        "ysrc": "neujeffski:14:757998",
                        "fillcolor": "rgba(62, 111, 176, 0.3)"
                    }
                ],
                "layout": {
                    "title": {
                        "font": {
                            "color": "#151516"
                        }
                    },
                    "xaxis": {
                        "title": {
                            "font": {
                                "color": "#666666"
                            },
                            "text": ""
                        },
                        "showgrid": true,
                        "tickfont": {
                            "color": "#666666"
                        },
                        "gridcolor": "#F6F6F6",
                        "zerolinecolor": "#F6F6F6"
                    },
                    "yaxis": {
                        "title": {
                            "font": {
                                "color": "#666666"
                            },
                            "text": ""
                        },
                        "showgrid": true,
                        "tickfont": {
                            "color": "#666666"
                        },
                        "gridcolor": "#F6F6F6",
                        "zerolinecolor": "#F6F6F6"
                    },
                    "legend": {
                        "font": {
                            "color": "#666666"
                        },
                        "bgcolor": "#FFFFFF"
                    },
                    "plot_bgcolor": "#E5E5E5",
                    "paper_bgcolor": "#FFFFFF"
                }
            },
            "height": null,
            "width": null,
            "user": {
                "profile_url": "https://chart-studio.plotly.com/~neujeffski",
                "avatar_url": "https://storage.googleapis.com/plotly-prod-profiles/73.jpg",
                "background_url": "https://storage.googleapis.com/plotly-prod-profiles/bg-14.jpg",
                "bio": "",
                "nickname": "",
                "website": "",
                "stream_tokens": null,
                "feature_set_id": null,
                "csrf_token": null,
                "date_joined": "2019-06-17 16:57:42",
                "mapbox_access_tokens": null,
                "has_password": null,
                "username": "neujeffski",
                "email": null,
                "is_active": null,
                "readonly": null,
                "is_dash_creator": null,
                "dash_created_count": null,
                "is_chart_creator": null,
                "charts_created_count": null
            }
        },
        {
            "creation_time": "2019-06-17T17:28:21.550015Z",
            "comments": {
                "results": [],
                "count": 0
            },
            "parented": true,
            "embed_url": "https://chart-studio.plotly.com/~sergeman/18.embed",
            "fid": "sergeman:18",
            "filename": "correlation distance 11-mer embedding ncbi-genomes-2019-04-07",
            "filetype": "plot",
            "img_url": "https://api.plotly.com/v2/files/sergeman:18/image?image_name=list-thumb",
            "image_urls": {
                "default": "https://api.plotly.com/v2/files/sergeman:18/image?image_name=default",
                "block-thumb": "https://storage.googleapis.com/plotly-prod-images/sergeman/18/8_3KHLT82TS6URAFVHVXSNCZOVIOP7N4.png",
                "list-thumb": "https://api.plotly.com/v2/files/sergeman:18/image?image_name=list-thumb"
            },
            "api_urls": {
                "files": "https://api.plotly.com/v2/files/sergeman:18",
                "plots": "https://api.plotly.com/v2/plots/sergeman:18",
                "parent": "https://api.plotly.com/v2/folders/home?user=sergeman"
            },
            "owner": "sergeman",
            "parent": -1,
            "preview": "",
            "referencers": [],
            "references": [],
            "title": "Bacillus, Rhizobium, Staphylococcus, Streptococcus, Streptomyces, Vibrio",
            "views": 1,
            "web_url": "https://chart-studio.plotly.com/~sergeman/18/bacillus-rhizobium-staphylococcus-streptococcus-streptomyces-vibrio/",
            "world_readable": true,
            "date_modified": "2019-06-17T17:28:22.244Z",
            "stars": {
                "results": [],
                "count": 0
            },
            "collaborators": {
                "results": [],
                "count": 0
            },
            "subfolder_count": null,
            "refresh_interval": null,
            "organize_view_url": "https://chart-studio.plotly.com/~sergeman/18/",
            "current_user_permission": "read",
            "is_theme": null,
            "is_template": null,
            "autosize": true,
            "caption": "",
            "figure": {
                "data": [
                    {
                        "uid": "92268116-8286-4884-9b4e-eefb94cf31ad",
                        "mode": "markers",
                        "name": "Bacillus",
                        "type": "scatter3d",
                        "xsrc": "sergeman:19:d0b64e",
                        "ysrc": "sergeman:19:09d288",
                        "zsrc": "sergeman:19:1f39f6",
                        "marker": {
                            "size": 8,
                            "color": 0,
                            "opacity": 0.5,
                            "colorscale": "Jet"
                        }
                    },
                    {
                        "uid": "a751f6c2-3b34-46f8-b825-226a69821991",
                        "mode": "markers",
                        "name": "Rhizobium",
                        "type": "scatter3d",
                        "xsrc": "sergeman:19:6f0a9e",
                        "ysrc": "sergeman:19:5e8eef",
                        "zsrc": "sergeman:19:daddbf",
                        "marker": {
                            "size": 8,
                            "color": 1,
                            "opacity": 0.5,
                            "colorscale": "Jet"
                        }
                    },
                    {
                        "uid": "a9c5d226-0aa2-4800-a3fd-c7614678d6a2",
                        "mode": "markers",
                        "name": "Staphylococcus",
                        "type": "scatter3d",
                        "xsrc": "sergeman:19:66e41a",
                        "ysrc": "sergeman:19:21209c",
                        "zsrc": "sergeman:19:20b238",
                        "marker": {
                            "size": 8,
                            "color": 2,
                            "opacity": 0.5,
                            "colorscale": "Jet"
                        }
                    },
                    {
                        "uid": "a9b654fa-3ab0-4475-8d87-7981c631adff",
                        "mode": "markers",
                        "name": "Streptococcus",
                        "type": "scatter3d",
                        "xsrc": "sergeman:19:1944da",
                        "ysrc": "sergeman:19:628016",
                        "zsrc": "sergeman:19:897020",
                        "marker": {
                            "size": 8,
                            "color": 3,
                            "opacity": 0.5,
                            "colorscale": "Jet"
                        }
                    },
                    {
                        "uid": "704af86b-5287-4048-bd5a-e2ee3b172cbd",
                        "mode": "markers",
                        "name": "Streptomyces",
                        "type": "scatter3d",
                        "xsrc": "sergeman:19:0d18e7",
                        "ysrc": "sergeman:19:fd52e3",
                        "zsrc": "sergeman:19:3a0d83",
                        "marker": {
                            "size": 8,
                            "color": 4,
                            "opacity": 0.5,
                            "colorscale": "Jet"
                        }
                    },
                    {
                        "uid": "89e13fcf-e13c-4dc3-b8e4-3da57c2074fc",
                        "mode": "markers",
                        "name": "Vibrio",
                        "type": "scatter3d",
                        "xsrc": "sergeman:19:336790",
                        "ysrc": "sergeman:19:a99f33",
                        "zsrc": "sergeman:19:cfc598",
                        "marker": {
                            "size": 8,
                            "color": 5,
                            "opacity": 0.5,
                            "colorscale": "Jet"
                        }
                    }
                ],
                "layout": {
                    "width": 1299,
                    "height": 1299,
                    "margin": {
                        "b": 0,
                        "l": 0,
                        "r": 0,
                        "t": 0
                    }
                }
            },
            "height": 1299,
            "width": 1299,
            "user": {
                "profile_url": "https://chart-studio.plotly.com/~sergeman",
                "avatar_url": "https://storage.googleapis.com/plotly-prod-profiles/3.jpg",
                "background_url": "https://storage.googleapis.com/plotly-prod-profiles/bg-3.jpg",
                "bio": "",
                "nickname": "",
                "website": "",
                "stream_tokens": null,
                "feature_set_id": null,
                "csrf_token": null,
                "date_joined": "2019-05-31 01:29:47",
                "mapbox_access_tokens": null,
                "has_password": null,
                "username": "sergeman",
                "email": null,
                "is_active": null,
                "readonly": null,
                "is_dash_creator": null,
                "dash_created_count": null,
                "is_chart_creator": null,
                "charts_created_count": null
            }
        },
        {
            "creation_time": "2019-06-17T17:26:28.871443Z",
            "comments": {
                "results": [],
                "count": 0
            },
            "parented": true,
            "embed_url": "https://chart-studio.plotly.com/~Booleans/173.embed",
            "fid": "Booleans:173",
            "filename": "clusters-3d-new",
            "filetype": "plot",
            "img_url": "https://api.plotly.com/v2/files/Booleans:173/image?image_name=list-thumb",
            "image_urls": {
                "default": "https://storage.googleapis.com/plotly-prod-images/Booleans/173/2_95E352VA50KSH9HRY77EGBYO0HYNBB.png",
                "block-thumb": "https://storage.googleapis.com/plotly-prod-images/Booleans/173/8_DLV4X3Y9V1FHRHOQLUMJ9SQTLOEFT4.png",
                "list-thumb": "https://api.plotly.com/v2/files/Booleans:173/image?image_name=list-thumb"
            },
            "api_urls": {
                "files": "https://api.plotly.com/v2/files/Booleans:173",
                "plots": "https://api.plotly.com/v2/plots/Booleans:173",
                "parent": "https://api.plotly.com/v2/folders/home?user=Booleans"
            },
            "owner": "Booleans",
            "parent": -1,
            "preview": "",
            "referencers": [],
            "references": [],
            "title": "Plot Title",
            "views": 12,
            "web_url": "https://chart-studio.plotly.com/~Booleans/173/plot-title/",
            "world_readable": true,
            "date_modified": "2019-06-17T17:42:40.366Z",
            "stars": {
                "results": [],
                "count": 0
            },
            "collaborators": {
                "results": [],
                "count": 0
            },
            "subfolder_count": null,
            "refresh_interval": null,
            "organize_view_url": "https://chart-studio.plotly.com/~Booleans/173/",
            "current_user_permission": "read",
            "is_theme": null,
            "is_template": false,
            "autosize": true,
            "caption": "",
            "figure": {
                "data": [
                    {
                        "uid": "2765f334-b9bb-493f-ba5e-ea7ffe339395",
                        "mode": "markers",
                        "name": "Low Risk",
                        "type": "scatter3d",
                        "xsrc": "Booleans:174:8a5732",
                        "ysrc": "Booleans:174:1b3eab",
                        "zsrc": "Booleans:174:b4a60b",
                        "marker": {
                            "line": {
                                "color": "#000000",
                                "width": 1
                            },
                            "size": 12,
                            "color": "#3cb44b",
                            "symbol": "circle",
                            "opacity": 0.9
                        }
                    },
                    {
                        "uid": "2b80580b-2e54-41a0-b383-b56511a793dd",
                        "mode": "markers",
                        "name": "Medium Risk",
                        "type": "scatter3d",
                        "xsrc": "Booleans:174:fb3baa",
                        "ysrc": "Booleans:174:6d717e",
                        "zsrc": "Booleans:174:fdee1b",
                        "marker": {
                            "line": {
                                "color": "#000000",
                                "width": 1
                            },
                            "size": 12,
                            "color": "#ffe119",
                            "symbol": "circle",
                            "opacity": 0.9
                        }
                    },
                    {
                        "uid": "f045ab11-9f1f-4dda-a760-80b96e804ab7",
                        "mode": "markers",
                        "name": "High Risk",
                        "type": "scatter3d",
                        "xsrc": "Booleans:174:88f100",
                        "ysrc": "Booleans:174:376ea0",
                        "zsrc": "Booleans:174:0204c8",
                        "marker": {
                            "line": {
                                "color": "#000000",
                                "width": 1
                            },
                            "size": 12,
                            "color": "#e6194b",
                            "symbol": "circle",
                            "opacity": 0.9
                        },
                        "orientation": "v"
                    }
                ],
                "frames": [],
                "layout": {
                    "scene": {
                        "xaxis": {
                            "type": "linear",
                            "title": {
                                "text": "R Score"
                            }
                        },
                        "yaxis": {
                            "type": "linear",
                            "title": {
                                "text": "F Score"
                            }
                        },
                        "zaxis": {
                            "type": "linear",
                            "title": {
                                "text": "M Score<br>"
                            }
                        },
                        "camera": {
                            "up": {
                                "x": 0,
                                "y": 0,
                                "z": 1
                            },
                            "eye": {
                                "x": 0.5076836492741152,
                                "y": 2.9181738539431383,
                                "z": -0.12853906882452895
                            },
                            "center": {
                                "x": 0,
                                "y": 0,
                                "z": 0
                            },
                            "projection": {
                                "type": "perspective"
                            }
                        },
                        "aspectmode": "auto",
                        "aspectratio": {
                            "x": 1.0004045717174255,
                            "y": 0.999589332050513,
                            "z": 1.0000062624159172
                        }
                    },
                    "title": {
                        "text": "Plot Title"
                    },
                    "xaxis": {
                        "type": "linear",
                        "range": [
                            -0.19993257165303224,
                            3.1887417238026767
                        ],
                        "title": {
                            "font": {
                                "size": 18,
                                "color": "#7f7f7f",
                                "family": "Courier New, monospace"
                            },
                            "text": "x Axis"
                        },
                        "autorange": true
                    },
                    "yaxis": {
                        "type": "linear",
                        "range": [
                            -0.49452558593464213,
                            5.498162016514152
                        ],
                        "title": {
                            "font": {
                                "size": 18,
                                "color": "#7f7f7f",
                                "family": "Courier New, monospace"
                            },
                            "text": "y Axis"
                        },
                        "autorange": true
                    },
                    "margin": {
                        "b": 0,
                        "l": 0,
                        "r": 0,
                        "t": 0
                    }
                }
            },
            "height": null,
            "width": null,
            "user": {
                "profile_url": "https://chart-studio.plotly.com/~Booleans",
                "avatar_url": "https://storage.googleapis.com/plotly-prod-profiles/53.jpg",
                "background_url": "https://storage.googleapis.com/plotly-prod-profiles/bg-5.jpg",
                "bio": "",
                "nickname": "",
                "website": "",
                "stream_tokens": null,
                "feature_set_id": null,
                "csrf_token": null,
                "date_joined": "2017-08-04 00:07:27",
                "mapbox_access_tokens": null,
                "has_password": null,
                "username": "Booleans",
                "email": null,
                "is_active": null,
                "readonly": null,
                "is_dash_creator": null,
                "dash_created_count": null,
                "is_chart_creator": null,
                "charts_created_count": null
            }
        },
        {
            "creation_time": "2019-06-17T17:26:08.681048Z",
            "comments": {
                "results": [],
                "count": 0
            },
            "parented": true,
            "embed_url": "https://chart-studio.plotly.com/~neujeffski/11.embed",
            "fid": "neujeffski:11",
            "filename": "Plotly Playground 2019-06-17 19:26:07",
            "filetype": "plot",
            "img_url": "https://api.plotly.com/v2/files/neujeffski:11/image?image_name=list-thumb",
            "image_urls": {
                "default": "https://api.plotly.com/v2/files/neujeffski:11/image?image_name=default",
                "block-thumb": "https://api.plotly.com/v2/files/neujeffski:11/image?image_name=block-thumb",
                "list-thumb": "https://api.plotly.com/v2/files/neujeffski:11/image?image_name=list-thumb"
            },
            "api_urls": {
                "files": "https://api.plotly.com/v2/files/neujeffski:11",
                "plots": "https://api.plotly.com/v2/plots/neujeffski:11",
                "parent": "https://api.plotly.com/v2/folders/home?user=neujeffski"
            },
            "owner": "neujeffski",
            "parent": -1,
            "preview": "",
            "referencers": [],
            "references": [],
            "title": "{'font': {'color': '#151516'}}",
            "views": 0,
            "web_url": "https://chart-studio.plotly.com/~neujeffski/11/font-color-151516/",
            "world_readable": true,
            "date_modified": "2019-06-17T17:26:09.119Z",
            "stars": {
                "results": [],
                "count": 0
            },
            "collaborators": {
                "results": [],
                "count": 0
            },
            "subfolder_count": null,
            "refresh_interval": null,
            "organize_view_url": "https://chart-studio.plotly.com/~neujeffski/11/",
            "current_user_permission": "read",
            "is_theme": null,
            "is_template": null,
            "autosize": true,
            "caption": "",
            "figure": {
                "data": [
                    {
                        "uid": "61fc4df3-29de-4f96-ba2b-8e37b35e5a04",
                        "fill": "tozeroy",
                        "line": {
                            "dash": "solid",
                            "color": "rgba(226, 74, 51, 1.0)",
                            "shape": "linear",
                            "width": 1.3
                        },
                        "mode": "lines",
                        "name": "VCY.TV",
                        "text": "",
                        "type": "scatter",
                        "xsrc": "neujeffski:12:6d0597",
                        "ysrc": "neujeffski:12:4ddab8",
                        "fillcolor": "rgba(226, 74, 51, 0.3)"
                    },
                    {
                        "uid": "59e62a22-1ad0-418e-b6fd-592d208b2a8e",
                        "fill": "tozeroy",
                        "line": {
                            "dash": "solid",
                            "color": "rgba(62, 111, 176, 1.0)",
                            "shape": "linear",
                            "width": 1.3
                        },
                        "mode": "lines",
                        "name": "OXO.SN",
                        "text": "",
                        "type": "scatter",
                        "xsrc": "neujeffski:12:6d0597",
                        "ysrc": "neujeffski:12:45962b",
                        "fillcolor": "rgba(62, 111, 176, 0.3)"
                    }
                ],
                "layout": {
                    "title": {
                        "font": {
                            "color": "#151516"
                        }
                    },
                    "xaxis": {
                        "title": {
                            "font": {
                                "color": "#666666"
                            },
                            "text": ""
                        },
                        "showgrid": true,
                        "tickfont": {
                            "color": "#666666"
                        },
                        "gridcolor": "#F6F6F6",
                        "zerolinecolor": "#F6F6F6"
                    },
                    "yaxis": {
                        "title": {
                            "font": {
                                "color": "#666666"
                            },
                            "text": ""
                        },
                        "showgrid": true,
                        "tickfont": {
                            "color": "#666666"
                        },
                        "gridcolor": "#F6F6F6",
                        "zerolinecolor": "#F6F6F6"
                    },
                    "legend": {
                        "font": {
                            "color": "#666666"
                        },
                        "bgcolor": "#FFFFFF"
                    },
                    "plot_bgcolor": "#E5E5E5",
                    "paper_bgcolor": "#FFFFFF"
                }
            },
            "height": null,
            "width": null,
            "user": {
                "profile_url": "https://chart-studio.plotly.com/~neujeffski",
                "avatar_url": "https://storage.googleapis.com/plotly-prod-profiles/73.jpg",
                "background_url": "https://storage.googleapis.com/plotly-prod-profiles/bg-14.jpg",
                "bio": "",
                "nickname": "",
                "website": "",
                "stream_tokens": null,
                "feature_set_id": null,
                "csrf_token": null,
                "date_joined": "2019-06-17 16:57:42",
                "mapbox_access_tokens": null,
                "has_password": null,
                "username": "neujeffski",
                "email": null,
                "is_active": null,
                "readonly": null,
                "is_dash_creator": null,
                "dash_created_count": null,
                "is_chart_creator": null,
                "charts_created_count": null
            }
        }
    ]
}