Plots List
Plots
This endpoint handles manipulation of Plotly plot files.
Reference
Authorization
Any user with or without a Plotly account may view public plots. For private plots, see authentication.
Actions
list
Listing all public plots can be done via a GET request to this endpoint.
By default, plots will be listed in order of date created. The order_by
query parameter is accepted at this endpoint. Currently, only ordering by
views is supported. It is possible to filter the plots by quality
with min_quality or max_quality as query parameter.
Example:
// GET https://api.plotly.com/v2/plots/ ---> 200

// GET https://api.plotly.com/v2/plots/?order_by=-views ---> 200

// GET https://api.plotly.com/v2/plots/?min_quality=5 ---> 200

// GET https://api.plotly.com/v2/plots/?max_quality=5 ---> 200
feed
Listing all handpicked feed plots can be done via a GET request to this endpoint. By default, plots will be listed in a random order.
Example:
// GET https://api.plotly.com/v2/plots/feed ---> 200
create
You can create new plot resources here. The only required field is 'figure'. Currently, the figure is restricted to only contain references to grid data. That is, this will fail if raw data arrays are passed in. To create and manipulate underlying grids for plots, see the grids endpoint.
Example:
// This fails because a figure field is required.
// POST https://api.plotly.com/v2/plots ---> 400 Bad Request
{}

// This fails because the figure has raw data
//POST https://api.plotly.com/v2/plots ---> 400 Bad Request
{
    "figure": {"data": [{"y": ['this', 'is', 'raw', 'data']}]}
}

// This succeeds because the figure has src keys, not raw data.
//POST https://api.plotly.com/v2/plots ---> 200 OK
{
    "figure": {"data": [{"ysrc": "sven:88:u8nd62"}]}
}
When creating a grid, you can optionally specify a source_fid to specify where a plot has come from:
- source_fid: the fid of a plot that was copied (and presumably edited) to produce this one
detail
There is a lot of meta information stored about plot files including filename, title, share_url, and content_url to name a few.
This information can only be reached with a GET to this endpoint.
Example:
// GET https://api.plotly.com/v2/plots/iheartgraphs:90
content
The contents of a plot can be downloaded via the content resource. The plot
content contains referenced grid/column data by default. If you wish to
return the raw grid/column data, the inline_data=true query must be included
in the request url. The Content-Type header will be appropriately set for the
response body.
Alternatively, you can set ?map_data=unreadable to append a mapping of
sources to data that belongs to grids which are unreadable for the
requestor. This is useful when you have read access to another users plot,
but that plot contains grid references which you don't have access to.
Examples:
// Returns referenced grid/column data
// GET https://api.plotly.com/v2/plots/iheartgraphs:90/content ---> 200 OK

// Returns full grid/column data
// GET https://api.plotly.com/v2/plots/iheartgraphs:90/content?inline_data=true ---> 200 OK

// Returns full grid/column data when requestor doesn't have permission
// to read the referenced grid.
// GET https://api.plotly.com/v2/plots/iheartgraphs:90/content?map_data=unreadable ---> 200 OK
GET /v2/plots/?cursor=cj0xJnA9MjAyNS0wNy0xNisxMSUzQTA3JTNBMjYuMDkxNTc3JTJCMDAlM0EwMA%3D%3D&format=api
{ "next": "https://api.plot.ly/v2/plots/?cursor=cD0yMDI1LTA3LTE2KzExJTNBMTQlM0EzNi43NDU2NDklMkIwMCUzQTAw&format=api", "previous": "https://api.plot.ly/v2/plots/?cursor=cj0xJnA9MjAyNS0wNy0xNisxNCUzQTI4JTNBNDAuMzYzMzcwJTJCMDAlM0EwMA%3D%3D&format=api", "results": [ { "creation_time": "2025-07-16T14:28:40.363370Z", "comments": { "results": [], "count": 0 }, "parented": true, "embed_url": "https://chart-studio.plotly.com/~absolutelycopypastgod/7.embed", "fid": "absolutelycopypastgod:7", "filename": "stock_prediction_lstm", "filetype": "plot", "img_url": "https://api.plotly.com/v2/files/absolutelycopypastgod:7/image?image_name=list-thumb", "image_urls": { "default": "https://storage.googleapis.com/plotly-prod-images/absolutelycopypastgod/7/2_3SJHHM38O5R4YMR6786RBP6490EIBG.png", "block-thumb": "https://storage.googleapis.com/plotly-prod-images/absolutelycopypastgod/7/8_38ZZN53CHGIBS7WYR1KA5MUT571YQ6.png", "list-thumb": "https://api.plotly.com/v2/files/absolutelycopypastgod:7/image?image_name=list-thumb" }, "api_urls": { "files": "https://api.plotly.com/v2/files/absolutelycopypastgod:7", "plots": "https://api.plotly.com/v2/plots/absolutelycopypastgod:7", "parent": "https://api.plotly.com/v2/folders/home?user=absolutelycopypastgod" }, "owner": "absolutelycopypastgod", "parent": -1, "preview": "", "referencers": [], "references": [], "title": "", "views": 0, "web_url": "https://chart-studio.plotly.com/~absolutelycopypastgod/7/", "world_readable": true, "date_modified": "2025-07-16T14:28:40.377Z", "stars": { "results": [], "count": 0 }, "collaborators": { "results": [], "count": 0 }, "subfolder_count": null, "refresh_interval": null, "organize_view_url": "https://chart-studio.plotly.com/~absolutelycopypastgod/7/", "current_user_permission": "read", "is_theme": null, "is_template": null, "autosize": true, "caption": "", "figure": { "data": [ { "mode": "lines", "name": "Train prediction", "type": "scatter", "xsrc": "absolutelycopypastgod:6:d2156e", "ysrc": "absolutelycopypastgod:6:50e171" }, { "mode": "lines", "name": "Test prediction", "type": "scatter", "xsrc": "absolutelycopypastgod:6:e2b368", "ysrc": "absolutelycopypastgod:6:be5547" }, { "mode": "lines", "name": "Actual Value", "type": "scatter", "xsrc": "absolutelycopypastgod:6:e6cf35", "ysrc": "absolutelycopypastgod:6:4ef49a" } ], "layout": { "xaxis": { "showgrid": true, "showline": true, "linecolor": "white", "linewidth": 2, "showticklabels": false }, "yaxis": { "ticks": "outside", "title": { "font": { "size": 12, "color": "white", "family": "Rockwell" }, "text": "Close (USD)" }, "showgrid": true, "showline": true, "tickfont": { "size": 12, "color": "white", "family": "Rockwell" }, "linecolor": "white", "linewidth": 2, "showticklabels": true }, "template": { "data": { "bar": [ { "type": "bar", "marker": { "line": { "color": "rgb(17,17,17)", "width": 0.5 }, "pattern": { "size": 10, "fillmode": "overlay", "solidity": 0.2 } }, "error_x": { "color": "#f2f5fa" }, "error_y": { "color": "#f2f5fa" } } ], "pie": [ { "type": "pie", "automargin": true } ], "table": [ { "type": "table", "cells": { "fill": { "color": "#506784" }, "line": { "color": "rgb(17,17,17)" } }, "header": { "fill": { "color": "#2a3f5f" }, "line": { "color": "rgb(17,17,17)" } } } ], "carpet": [ { "type": "carpet", "aaxis": { "gridcolor": "#506784", "linecolor": "#506784", "endlinecolor": "#A2B1C6", "minorgridcolor": "#506784", "startlinecolor": "#A2B1C6" }, "baxis": { "gridcolor": "#506784", "linecolor": "#506784", "endlinecolor": "#A2B1C6", "minorgridcolor": "#506784", "startlinecolor": "#A2B1C6" } } ], "mesh3d": [ { "type": "mesh3d", "colorbar": { "ticks": "", "outlinewidth": 0 } } ], "contour": [ { "type": "contour", "colorbar": { "ticks": "", "outlinewidth": 0 }, "colorscale": [ [ 0.0, "#0d0887" ], [ 0.1111111111111111, "#46039f" ], [ 0.2222222222222222, "#7201a8" ], [ 0.3333333333333333, "#9c179e" ], [ 0.4444444444444444, "#bd3786" ], [ 0.5555555555555556, "#d8576b" ], [ 0.6666666666666666, "#ed7953" ], [ 0.7777777777777778, "#fb9f3a" ], [ 0.8888888888888888, "#fdca26" ], [ 1.0, "#f0f921" ] ] } ], "heatmap": [ { "type": "heatmap", "colorbar": { "ticks": "", "outlinewidth": 0 }, "colorscale": [ [ 0.0, "#0d0887" ], [ 0.1111111111111111, "#46039f" ], [ 0.2222222222222222, "#7201a8" ], [ 0.3333333333333333, "#9c179e" ], [ 0.4444444444444444, "#bd3786" ], [ 0.5555555555555556, "#d8576b" ], [ 0.6666666666666666, "#ed7953" ], [ 0.7777777777777778, "#fb9f3a" ], [ 0.8888888888888888, "#fdca26" ], [ 1.0, "#f0f921" ] ] } ], "scatter": [ { "type": "scatter", "marker": { "line": { "color": "#283442" } } } ], "surface": [ { "type": "surface", "colorbar": { "ticks": "", "outlinewidth": 0 }, "colorscale": [ [ 0.0, "#0d0887" ], [ 0.1111111111111111, "#46039f" ], [ 0.2222222222222222, "#7201a8" ], [ 0.3333333333333333, "#9c179e" ], [ 0.4444444444444444, "#bd3786" ], [ 0.5555555555555556, "#d8576b" ], [ 0.6666666666666666, "#ed7953" ], [ 0.7777777777777778, "#fb9f3a" ], [ 0.8888888888888888, "#fdca26" ], [ 1.0, "#f0f921" ] ] } ], "barpolar": [ { "type": "barpolar", "marker": { "line": { "color": "rgb(17,17,17)", "width": 0.5 }, "pattern": { "size": 10, "fillmode": "overlay", "solidity": 0.2 } } } ], "heatmapgl": [ { "type": "heatmapgl", "colorbar": { "ticks": "", "outlinewidth": 0 }, "colorscale": [ [ 0.0, "#0d0887" ], [ 0.1111111111111111, "#46039f" ], [ 0.2222222222222222, "#7201a8" ], [ 0.3333333333333333, "#9c179e" ], [ 0.4444444444444444, "#bd3786" ], [ 0.5555555555555556, "#d8576b" ], [ 0.6666666666666666, "#ed7953" ], [ 0.7777777777777778, "#fb9f3a" ], [ 0.8888888888888888, "#fdca26" ], [ 1.0, "#f0f921" ] ] } ], "histogram": [ { "type": "histogram", "marker": { "pattern": { "size": 10, "fillmode": "overlay", "solidity": 0.2 } } } ], "parcoords": [ { "line": { "colorbar": { "ticks": "", "outlinewidth": 0 } }, "type": "parcoords" } ], "scatter3d": [ { "line": { "colorbar": { "ticks": "", "outlinewidth": 0 } }, "type": "scatter3d", "marker": { "colorbar": { "ticks": "", "outlinewidth": 0 } } } ], "scattergl": [ { "type": "scattergl", "marker": { "line": { "color": "#283442" } } } ], "choropleth": [ { "type": "choropleth", "colorbar": { "ticks": "", "outlinewidth": 0 } } ], "scattergeo": [ { "type": "scattergeo", "marker": { "colorbar": { "ticks": "", "outlinewidth": 0 } } } ], "histogram2d": [ { "type": "histogram2d", "colorbar": { "ticks": "", "outlinewidth": 0 }, "colorscale": [ [ 0.0, "#0d0887" ], [ 0.1111111111111111, "#46039f" ], [ 0.2222222222222222, "#7201a8" ], [ 0.3333333333333333, "#9c179e" ], [ 0.4444444444444444, "#bd3786" ], [ 0.5555555555555556, "#d8576b" ], [ 0.6666666666666666, "#ed7953" ], [ 0.7777777777777778, "#fb9f3a" ], [ 0.8888888888888888, "#fdca26" ], [ 1.0, "#f0f921" ] ] } ], "scatterpolar": [ { "type": "scatterpolar", "marker": { "colorbar": { "ticks": "", "outlinewidth": 0 } } } ], "contourcarpet": [ { "type": "contourcarpet", "colorbar": { "ticks": "", "outlinewidth": 0 } } ], "scattercarpet": [ { "type": "scattercarpet", "marker": { "colorbar": { "ticks": "", "outlinewidth": 0 } } } ], "scattermapbox": [ { "type": "scattermapbox", "marker": { "colorbar": { "ticks": "", "outlinewidth": 0 } } } ], "scatterpolargl": [ { "type": "scatterpolargl", "marker": { "colorbar": { "ticks": "", "outlinewidth": 0 } } } ], "scatterternary": [ { "type": "scatterternary", "marker": { "colorbar": { "ticks": "", "outlinewidth": 0 } } } ], "histogram2dcontour": [ { "type": "histogram2dcontour", "colorbar": { "ticks": "", "outlinewidth": 0 }, "colorscale": [ [ 0.0, "#0d0887" ], [ 0.1111111111111111, "#46039f" ], [ 0.2222222222222222, "#7201a8" ], [ 0.3333333333333333, "#9c179e" ], [ 0.4444444444444444, "#bd3786" ], [ 0.5555555555555556, "#d8576b" ], [ 0.6666666666666666, "#ed7953" ], [ 0.7777777777777778, "#fb9f3a" ], [ 0.8888888888888888, "#fdca26" ], [ 1.0, "#f0f921" ] ] } ] }, "layout": { "geo": { "bgcolor": "rgb(17,17,17)", "showland": true, "lakecolor": "rgb(17,17,17)", "landcolor": "rgb(17,17,17)", "showlakes": true, "subunitcolor": "#506784" }, "font": { "color": "#f2f5fa" }, "polar": { "bgcolor": "rgb(17,17,17)", "radialaxis": { "ticks": "", "gridcolor": "#506784", "linecolor": "#506784" }, "angularaxis": { "ticks": "", "gridcolor": "#506784", "linecolor": "#506784" } }, "scene": { "xaxis": { "ticks": "", "gridcolor": "#506784", "gridwidth": 2, "linecolor": "#506784", "zerolinecolor": "#C8D4E3", "showbackground": true, "backgroundcolor": "rgb(17,17,17)" }, "yaxis": { "ticks": "", "gridcolor": "#506784", "gridwidth": 2, "linecolor": "#506784", "zerolinecolor": "#C8D4E3", "showbackground": true, "backgroundcolor": "rgb(17,17,17)" }, "zaxis": { "ticks": "", "gridcolor": "#506784", "gridwidth": 2, "linecolor": "#506784", "zerolinecolor": "#C8D4E3", "showbackground": true, "backgroundcolor": "rgb(17,17,17)" } }, "title": { "x": 0.05 }, "xaxis": { "ticks": "", "title": { "standoff": 15 }, "gridcolor": "#283442", "linecolor": "#506784", "automargin": true, "zerolinecolor": "#283442", "zerolinewidth": 2 }, "yaxis": { "ticks": "", "title": { "standoff": 15 }, "gridcolor": "#283442", "linecolor": "#506784", "automargin": true, "zerolinecolor": "#283442", "zerolinewidth": 2 }, "mapbox": { "style": "dark" }, "ternary": { "aaxis": { "ticks": "", "gridcolor": "#506784", "linecolor": "#506784" }, "baxis": { "ticks": "", "gridcolor": "#506784", "linecolor": "#506784" }, "caxis": { "ticks": "", "gridcolor": "#506784", "linecolor": "#506784" }, "bgcolor": "rgb(17,17,17)" }, "colorway": [ "#636efa", "#EF553B", "#00cc96", "#ab63fa", "#FFA15A", "#19d3f3", "#FF6692", "#B6E880", "#FF97FF", "#FECB52" ], "coloraxis": { "colorbar": { "ticks": "", "outlinewidth": 0 } }, "hovermode": "closest", "colorscale": { "diverging": [ [ 0, "#8e0152" ], [ 0.1, "#c51b7d" ], [ 0.2, "#de77ae" ], [ 0.3, "#f1b6da" ], [ 0.4, "#fde0ef" ], [ 0.5, "#f7f7f7" ], [ 0.6, "#e6f5d0" ], [ 0.7, "#b8e186" ], [ 0.8, "#7fbc41" ], [ 0.9, "#4d9221" ], [ 1, "#276419" ] ], "sequential": [ [ 0.0, "#0d0887" ], [ 0.1111111111111111, "#46039f" ], [ 0.2222222222222222, "#7201a8" ], [ 0.3333333333333333, "#9c179e" ], [ 0.4444444444444444, "#bd3786" ], [ 0.5555555555555556, "#d8576b" ], [ 0.6666666666666666, "#ed7953" ], [ 0.7777777777777778, "#fb9f3a" ], [ 0.8888888888888888, "#fdca26" ], [ 1.0, "#f0f921" ] ], "sequentialminus": [ [ 0.0, "#0d0887" ], [ 0.1111111111111111, "#46039f" ], [ 0.2222222222222222, "#7201a8" ], [ 0.3333333333333333, "#9c179e" ], [ 0.4444444444444444, "#bd3786" ], [ 0.5555555555555556, "#d8576b" ], [ 0.6666666666666666, "#ed7953" ], [ 0.7777777777777778, "#fb9f3a" ], [ 0.8888888888888888, "#fdca26" ], [ 1.0, "#f0f921" ] ] }, "hoverlabel": { "align": "left" }, "plot_bgcolor": "rgb(17,17,17)", "paper_bgcolor": "rgb(17,17,17)", "shapedefaults": { "line": { "color": "#f2f5fa" } }, "sliderdefaults": { "bgcolor": "#C8D4E3", "tickwidth": 0, "bordercolor": "rgb(17,17,17)", "borderwidth": 1 }, "autotypenumbers": "strict", "annotationdefaults": { "arrowhead": 0, "arrowcolor": "#f2f5fa", "arrowwidth": 1 }, "updatemenudefaults": { "bgcolor": "#506784", "borderwidth": 0 } } }, "showlegend": true, "annotations": [ { "x": 0.0, "y": 1.05, "font": { "size": 26, "color": "white", "family": "Rockwell" }, "text": "Results (LSTM)", "xref": "paper", "yref": "paper", "xanchor": "left", "yanchor": "bottom", "showarrow": false } ] } }, "height": null, "width": null, "user": { "profile_url": "https://chart-studio.plotly.com/~absolutelycopypastgod", "avatar_url": "https://storage.googleapis.com/plotly-prod-profiles/84.jpg", "background_url": "https://storage.googleapis.com/plotly-prod-profiles/bg-5.jpg", "bio": "", "nickname": "", "website": "", "stream_tokens": null, "feature_set_id": null, "csrf_token": null, "date_joined": "2025-07-16 14:16:37", "mapbox_access_tokens": null, "has_password": null, "username": "absolutelycopypastgod", "email": null, "is_active": null, "readonly": null, "is_dash_creator": null, "dash_created_count": null, "is_chart_creator": null, "charts_created_count": null } }, { "creation_time": "2025-07-16T14:04:55.764789Z", "comments": { "results": [], "count": 0 }, "parented": true, "embed_url": "https://chart-studio.plotly.com/~yya98/3.embed", "fid": "yya98:3", "filename": "Plot 3", "filetype": "plot", "img_url": "https://api.plotly.com/v2/files/yya98:3/image?image_name=list-thumb", "image_urls": { "default": "https://storage.googleapis.com/plotly-prod-images/yya98/3/2_8PTFK7EHBT2DH3OSAFOOWH3I128ST0.png", "block-thumb": "https://storage.googleapis.com/plotly-prod-images/yya98/3/8_2WIDDJ9DJ32SA24WFZOOXLI1L3XFCY.png", "list-thumb": "https://api.plotly.com/v2/files/yya98:3/image?image_name=list-thumb" }, "api_urls": { "files": "https://api.plotly.com/v2/files/yya98:3", "plots": "https://api.plotly.com/v2/plots/yya98:3", "parent": "https://api.plotly.com/v2/folders/home?user=yya98" }, "owner": "yya98", "parent": -1, "preview": "", "referencers": [], "references": [], "title": "", "views": 0, "web_url": "https://chart-studio.plotly.com/~yya98/3/", "world_readable": true, "date_modified": "2025-07-16T14:04:55.776Z", "stars": { "results": [], "count": 0 }, "collaborators": { "results": [], "count": 0 }, "subfolder_count": null, "refresh_interval": null, "organize_view_url": "https://chart-studio.plotly.com/~yya98/3/", "current_user_permission": "read", "is_theme": null, "is_template": false, "autosize": true, "caption": "", "figure": { "data": [ { "meta": { "columnNames": { "x": "x", "y": "y" } }, "mode": "lines", "type": "scatter", "xsrc": "yya98:2:273cd6", "ysrc": "yya98:2:d1cd44" } ], "frames": [], "layout": { "title": { "text": "Diffractogramme de rayons X de l’échantillon de MnWO₄" }, "xaxis": { "type": "linear", "range": [ 20.034947354188848, 70.70861092801974 ], "title": { "text": "2θ (°)" }, "autorange": true }, "yaxis": { "type": "linear", "range": [ -0.06754910989213986, 1.0428440373695311 ], "title": { "text": "Intensité (u.a.)" }, "autorange": true }, "autosize": true } }, "height": null, "width": null, "user": { "profile_url": "https://chart-studio.plotly.com/~yya98", "avatar_url": "https://storage.googleapis.com/plotly-prod-profiles/31.jpg", "background_url": "https://storage.googleapis.com/plotly-prod-profiles/bg-14.jpg", "bio": "", "nickname": "", "website": "", "stream_tokens": null, "feature_set_id": null, "csrf_token": null, "date_joined": "2025-07-16 05:46:33", "mapbox_access_tokens": null, "has_password": null, "username": "yya98", "email": null, "is_active": null, "readonly": null, "is_dash_creator": null, "dash_created_count": null, "is_chart_creator": null, "charts_created_count": null } }, { "creation_time": "2025-07-16T14:02:02.227626Z", "comments": { "results": [], "count": 0 }, "parented": true, "embed_url": "https://chart-studio.plotly.com/~dev.purohit/11.embed", "fid": "dev.purohit:11", "filename": "Stakeholder weight comparision Cumulative drop off for Individual Stakeholders copy", "filetype": "plot", "img_url": "https://api.plotly.com/v2/files/dev.purohit:11/image?image_name=list-thumb", "image_urls": { "default": "https://api.plotly.com/v2/files/dev.purohit:11/image?image_name=default", "block-thumb": "https://storage.googleapis.com/plotly-prod-images/dev.purohit/11/8_AEUQNDV790J50CGWQIO4U5HPQ0YXQ1.png", "list-thumb": "https://api.plotly.com/v2/files/dev.purohit:11/image?image_name=list-thumb" }, "api_urls": { "files": "https://api.plotly.com/v2/files/dev.purohit:11", "plots": "https://api.plotly.com/v2/plots/dev.purohit:11", "parent": "https://api.plotly.com/v2/folders/home?user=dev.purohit" }, "owner": "dev.purohit", "parent": -1, "preview": "", "referencers": [], "references": [], "title": "", "views": 0, "web_url": "https://chart-studio.plotly.com/~dev.purohit/11/", "world_readable": true, "date_modified": "2025-07-17T06:03:57.240Z", "stars": { "results": [], "count": 0 }, "collaborators": { "results": [], "count": 0 }, "subfolder_count": null, "refresh_interval": null, "organize_view_url": "https://chart-studio.plotly.com/~dev.purohit/11/", "current_user_permission": "read", "is_theme": null, "is_template": false, "autosize": true, "caption": "", "figure": { "data": [ { "uid": "c6221c", "line": { "color": "rgb(252, 12, 12)" }, "meta": { "columnNames": { "x": "B", "y": "F" } }, "mode": "lines", "name": "All Drop off together", "type": "scatter", "xsrc": "dev.purohit:10:9ef98e", "ysrc": "dev.purohit:10:30a520", "visible": true, "stackgroup": null }, { "uid": "aaca10", "line": { "color": "rgb(139, 115, 237)" }, "meta": { "columnNames": { "x": "B", "y": "M" } }, "mode": "lines", "name": "10,6 CEO Fails", "type": "scatter", "xsrc": "dev.purohit:10:9ef98e", "ysrc": "dev.purohit:10:4890a0", "visible": true, "stackgroup": null }, { "uid": "c82434", "line": { "color": "rgb(245, 173, 173)" }, "meta": { "columnNames": { "x": "B", "y": "J" } }, "mode": "lines", "name": "10,5 CEO Fails", "type": "scatter", "xsrc": "dev.purohit:10:9ef98e", "ysrc": "dev.purohit:10:c99448", "visible": true, "stackgroup": null }, { "uid": "7fb9e1", "line": { "color": "rgb(111, 185, 244)" }, "meta": { "columnNames": { "x": "B", "y": "C" } }, "mode": "lines", "name": "10,4 CEO Fails", "type": "scatter", "xsrc": "dev.purohit:10:9ef98e", "ysrc": "dev.purohit:10:db963e", "visible": true, "stackgroup": null }, { "uid": "2f9636", "line": { "color": "rgb(242, 100, 114)" }, "meta": { "columnNames": { "x": "B", "y": "P" } }, "mode": "lines", "name": "8,4 CEO Fails", "type": "scatter", "xsrc": "dev.purohit:10:9ef98e", "ysrc": "dev.purohit:10:e38cbc", "visible": true, "stackgroup": null }, { "uid": "4441bf", "line": { "color": "rgb(111, 185, 244)" }, "meta": { "columnNames": { "x": "B", "y": "G" } }, "mode": "lines", "name": "9,3 CEO Fails", "type": "scatter", "xsrc": "dev.purohit:10:9ef98e", "ysrc": "dev.purohit:10:1574e4", "visible": true, "stackgroup": null }, { "uid": "51a851", "meta": { "columnNames": { "x": "B", "y": "V" } }, "mode": "lines", "name": "2,2 CEO Fails", "type": "scatter", "xsrc": "dev.purohit:10:9ef98e", "ysrc": "dev.purohit:10:538aa1", "visible": "legendonly", "stackgroup": null }, { "uid": "82e8f7", "line": { "color": "rgb(241, 161, 58)" }, "meta": { "columnNames": { "x": "B", "y": "S" } }, "mode": "lines", "name": "1,1 CEO Fails", "type": "scatter", "xsrc": "dev.purohit:10:9ef98e", "ysrc": "dev.purohit:10:66379d", "visible": "legendonly", "stackgroup": null }, { "line": { "color": "rgb(236, 219, 122)" }, "meta": { "columnNames": { "x": "B", "y": "Y" } }, "mode": "lines", "name": "2,3 CEO Fails", "type": "scatter", "xsrc": "dev.purohit:10:9ef98e", "ysrc": "dev.purohit:10:490463", "visible": "legendonly", "stackgroup": null }, { "uid": "60926d", "line": { "color": "rgb(139, 115, 237)" }, "meta": { "columnNames": { "x": "B", "y": "N" } }, "mode": "lines", "name": "10,6 Manager Fails", "type": "scatter", "xsrc": "dev.purohit:10:9ef98e", "ysrc": "dev.purohit:10:c80125", "visible": "legendonly", "stackgroup": null }, { "uid": "682c10", "line": { "color": "rgb(245, 173, 173)" }, "meta": { "columnNames": { "x": "B", "y": "K" } }, "mode": "lines", "name": "10,5 Manager Fails", "type": "scatter", "xsrc": "dev.purohit:10:9ef98e", "ysrc": "dev.purohit:10:264a61", "visible": "legendonly", "stackgroup": null }, { "uid": "79b5dd", "line": { "color": "rgb(31, 119, 180)" }, "meta": { "columnNames": { "x": "B", "y": "D" } }, "mode": "lines", "name": "10,4 Manager Fails", "type": "scatter", "xsrc": "dev.purohit:10:9ef98e", "ysrc": "dev.purohit:10:2671de", "xaxis": "x", "hoveron": "points", "visible": "legendonly" }, { "uid": "15ed7f", "line": { "color": "rgb(242, 100, 114)" }, "meta": { "columnNames": { "x": "B", "y": "Q" } }, "mode": "lines", "name": "8,4 Manager Fails", "type": "scatter", "xsrc": "dev.purohit:10:9ef98e", "ysrc": "dev.purohit:10:35bdf3", "visible": "legendonly", "stackgroup": null }, { "uid": "a6ae48", "line": { "color": "rgb(111, 185, 244)" }, "meta": { "columnNames": { "x": "B", "y": "H" } }, "mode": "lines", "name": "9,3 Manager Fails", "type": "scatter", "xsrc": "dev.purohit:10:9ef98e", "ysrc": "dev.purohit:10:1ebcde", "visible": "legendonly", "stackgroup": null }, { "line": { "color": "rgb(23, 190, 207)" }, "meta": { "columnNames": { "x": "B", "y": "W" } }, "mode": "lines", "name": "2,2 Manager Fails", "type": "scatter", "xsrc": "dev.purohit:10:9ef98e", "ysrc": "dev.purohit:10:0f1390", "visible": "legendonly", "stackgroup": null }, { "uid": "e76ed9", "line": { "color": "rgb(241, 161, 58)" }, "meta": { "columnNames": { "x": "B", "y": "T" } }, "mode": "lines", "name": "1,1 Manager Fails", "type": "scatter", "xsrc": "dev.purohit:10:9ef98e", "ysrc": "dev.purohit:10:c6b8d1", "visible": "legendonly", "stackgroup": null }, { "line": { "color": "rgb(236, 219, 122)" }, "meta": { "columnNames": { "x": "B", "y": "Z" } }, "mode": "lines", "name": "2,3 Manager Fails", "type": "scatter", "xsrc": "dev.purohit:10:9ef98e", "ysrc": "dev.purohit:10:6c982f", "visible": "legendonly", "stackgroup": null }, { "uid": "1a89d8", "line": { "color": "rgb(139, 115, 237)" }, "meta": { "columnNames": { "x": "B", "y": "O" } }, "mode": "lines", "name": "10,6 Intern Fails", "type": "scatter", "xsrc": "dev.purohit:10:9ef98e", "ysrc": "dev.purohit:10:db696c", "visible": true, "stackgroup": null }, { "uid": "530e7c", "line": { "color": "rgb(245, 173, 173)" }, "meta": { "columnNames": { "x": "B", "y": "L" } }, "mode": "lines", "name": "10,5 Intern Fails", "type": "scatter", "xsrc": "dev.purohit:10:9ef98e", "ysrc": "dev.purohit:10:3a9f8f", "visible": true, "stackgroup": null }, { "uid": "ba694d", "line": { "color": "rgb(31, 119, 180)" }, "meta": { "columnNames": { "x": "B", "y": "E" } }, "mode": "lines", "name": "10,4 Intern Fails", "type": "scatter", "xsrc": "dev.purohit:10:9ef98e", "ysrc": "dev.purohit:10:5e15da", "visible": true, "stackgroup": null }, { "uid": "427db3", "line": { "color": "rgb(242, 100, 114)" }, "meta": { "columnNames": { "x": "B", "y": "R" } }, "mode": "lines", "name": "8,4 Intern fails", "type": "scatter", "xsrc": "dev.purohit:10:9ef98e", "ysrc": "dev.purohit:10:0e2f33", "visible": true, "stackgroup": null }, { "uid": "1de987", "line": { "color": "rgb(111, 185, 244)" }, "meta": { "columnNames": { "x": "B", "y": "I" } }, "mode": "lines", "name": "9,3 Intern Fails", "type": "scatter", "xsrc": "dev.purohit:10:9ef98e", "ysrc": "dev.purohit:10:913e4a", "visible": true, "stackgroup": null }, { "line": { "color": "rgb(23, 190, 207)" }, "meta": { "columnNames": { "x": "B", "y": "X" } }, "mode": "lines", "name": "2,2 Intern Fails", "type": "scatter", "xsrc": "dev.purohit:10:9ef98e", "ysrc": "dev.purohit:10:36a4b9", "visible": "legendonly", "stackgroup": null }, { "uid": "26cab4", "line": { "color": "rgb(241, 161, 58)" }, "meta": { "columnNames": { "x": "B", "y": "U" } }, "mode": "lines", "name": "1,1 Intern Fails", "type": "scatter", "xsrc": "dev.purohit:10:9ef98e", "ysrc": "dev.purohit:10:df4cac", "visible": "legendonly", "stackgroup": null }, { "line": { "color": "rgb(236, 219, 122)" }, "meta": { "columnNames": { "x": "B", "y": "AA" } }, "mode": "lines", "name": "2,3 Intern Fails", "type": "scatter", "xsrc": "dev.purohit:10:9ef98e", "ysrc": "dev.purohit:10:a84e4b", "visible": "legendonly", "stackgroup": null } ], "frames": [], "layout": { "title": { "text": "Engagement Drop off for different Stakeholders" }, "xaxis": { "type": "linear", "range": [ 0, 100 ], "title": { "text": "Engagement %" }, "autorange": true, "showspikes": false }, "yaxis": { "type": "linear", "range": [ -5.555555555555555, 105.55555555555556 ], "title": { "text": "Total Engagement Score" }, "autorange": true, "showspikes": false }, "legend": { "x": 0.845098814229249, "y": 0.7439516129032258 }, "autosize": true, "dragmode": "pan", "template": { "data": { "bar": [ { "type": "bar", "marker": { "colorbar": { "ticks": "", "outlinewidth": 0 } } } ], "table": [ { "type": "table", "cells": { "fill": { "color": "#506784" }, "line": { "color": "rgb(17,17,17)" } }, "header": { "fill": { "color": "#2a3f5f" }, "line": { "color": "rgb(17,17,17)" } } } ], "carpet": [ { "type": "carpet", "aaxis": { "gridcolor": "#506784", "linecolor": "#506784", "endlinecolor": "#A2B1C6", "minorgridcolor": "#506784", "startlinecolor": "#A2B1C6" }, "baxis": { "gridcolor": "#506784", "linecolor": "#506784", "endlinecolor": "#A2B1C6", "minorgridcolor": "#506784", "startlinecolor": "#A2B1C6" } } ], "mesh3d": [ { "type": "mesh3d", "colorbar": { "ticks": "", "outlinewidth": 0 } } ], "contour": [ { "type": "contour", "colorbar": { "ticks": "", "outlinewidth": 0 }, "autocolorscale": true } ], "heatmap": [ { "type": "heatmap", "colorbar": { "ticks": "", "outlinewidth": 0 }, "autocolorscale": true } ], "scatter": [ { "type": "scatter", "marker": { "colorbar": { "ticks": "", "outlinewidth": 0 } } } ], "surface": [ { "type": "surface", "colorbar": { "ticks": "", "outlinewidth": 0 } } ], "heatmapgl": [ { "type": "heatmapgl", "colorbar": { "ticks": "", "outlinewidth": 0 } } ], "histogram": [ { "type": "histogram", "marker": { "colorbar": { "ticks": "", "outlinewidth": 0 } } } ], "parcoords": [ { "line": { "colorbar": { "ticks": "", "outlinewidth": 0 } }, "type": "parcoords" } ], "scatter3d": [ { "type": "scatter3d", "marker": { "colorbar": { "ticks": "", "outlinewidth": 0 } } } ], "scattergl": [ { "type": "scattergl", "marker": { "colorbar": { "ticks": "", "outlinewidth": 0 } } } ], "choropleth": [ { "type": "choropleth", "colorbar": { "ticks": "", "outlinewidth": 0 } } ], "scattergeo": [ { "type": "scattergeo", "marker": { "colorbar": { "ticks": "", "outlinewidth": 0 } } } ], "histogram2d": [ { "type": "histogram2d", "colorbar": { "ticks": "", "outlinewidth": 0 }, "autocolorscale": true } ], "scatterpolar": [ { "type": "scatterpolar", "marker": { "colorbar": { "ticks": "", "outlinewidth": 0 } } } ], "contourcarpet": [ { "type": "contourcarpet", "colorbar": { "ticks": "", "outlinewidth": 0 } } ], "scattercarpet": [ { "type": "scattercarpet", "marker": { "colorbar": { "ticks": "", "outlinewidth": 0 } } } ], "scattermapbox": [ { "type": "scattermapbox", "marker": { "colorbar": { "ticks": "", "outlinewidth": 0 } } } ], "scatterpolargl": [ { "type": "scatterpolargl", "marker": { "colorbar": { "ticks": "", "outlinewidth": 0 } } } ], "scatterternary": [ { "type": "scatterternary", "marker": { "colorbar": { "ticks": "", "outlinewidth": 0 } } } ], "histogram2dcontour": [ { "type": "histogram2dcontour", "colorbar": { "ticks": "", "outlinewidth": 0 }, "autocolorscale": true } ] }, "layout": { "geo": { "bgcolor": "rgb(17,17,17)", "showland": true, "lakecolor": "rgb(17,17,17)", "landcolor": "rgb(17,17,17)", "showlakes": true, "subunitcolor": "#506784" }, "font": { "color": "#f2f5fa" }, "polar": { "bgcolor": "rgb(17,17,17)", "radialaxis": { "ticks": "", "gridcolor": "#506784", "linecolor": "#506784" }, "angularaxis": { "ticks": "", "gridcolor": "#506784", "linecolor": "#506784" } }, "scene": { "xaxis": { "ticks": "", "gridcolor": "#506784", "gridwidth": 2, "linecolor": "#506784", "zerolinecolor": "#C8D4E3", "showbackground": true, "backgroundcolor": "rgb(17,17,17)" }, "yaxis": { "ticks": "", "gridcolor": "#506784", "gridwidth": 2, "linecolor": "#506784", "zerolinecolor": "#C8D4E3", "showbackground": true, "backgroundcolor": "rgb(17,17,17)" }, "zaxis": { "ticks": "", "gridcolor": "#506784", "gridwidth": 2, "linecolor": "#506784", "zerolinecolor": "#C8D4E3", "showbackground": true, "backgroundcolor": "rgb(17,17,17)" } }, "title": { "x": 0.05 }, "xaxis": { "ticks": "", "gridcolor": "#283442", "linecolor": "#506784", "automargin": true, "zerolinecolor": "#283442", "zerolinewidth": 2 }, "yaxis": { "ticks": "", "gridcolor": "#283442", "linecolor": "#506784", "automargin": true, "zerolinecolor": "#283442", "zerolinewidth": 2 }, "ternary": { "aaxis": { "ticks": "", "gridcolor": "#506784", "linecolor": "#506784" }, "baxis": { "ticks": "", "gridcolor": "#506784", "linecolor": "#506784" }, "caxis": { "ticks": "", "gridcolor": "#506784", "linecolor": "#506784" }, "bgcolor": "rgb(17,17,17)" }, "colorway": [ "#636efa", "#EF553B", "#00cc96", "#ab63fa", "#19d3f3", "#e763fa", "#fecb52", "#ffa15a", "#ff6692", "#b6e880" ], "hovermode": "closest", "colorscale": { "diverging": [ [ 0, "#8e0152" ], [ 0.1, "#c51b7d" ], [ 0.2, "#de77ae" ], [ 0.3, "#f1b6da" ], [ 0.4, "#fde0ef" ], [ 0.5, "#f7f7f7" ], [ 0.6, "#e6f5d0" ], [ 0.7, "#b8e186" ], [ 0.8, "#7fbc41" ], [ 0.9, "#4d9221" ], [ 1, "#276419" ] ], "sequential": [ [ 0, "#0508b8" ], [ 0.0893854748603352, "#1910d8" ], [ 0.1787709497206704, "#3c19f0" ], [ 0.2681564245810056, "#6b1cfb" ], [ 0.3575418994413408, "#981cfd" ], [ 0.44692737430167595, "#bf1cfd" ], [ 0.5363128491620112, "#dd2bfd" ], [ 0.6256983240223464, "#f246fe" ], [ 0.7150837988826816, "#fc67fd" ], [ 0.8044692737430168, "#fe88fc" ], [ 0.8938547486033519, "#fea5fd" ], [ 0.9832402234636871, "#febefe" ], [ 1, "#fec3fe" ] ], "sequentialminus": [ [ 0, "#0508b8" ], [ 0.0893854748603352, "#1910d8" ], [ 0.1787709497206704, "#3c19f0" ], [ 0.2681564245810056, "#6b1cfb" ], [ 0.3575418994413408, "#981cfd" ], [ 0.44692737430167595, "#bf1cfd" ], [ 0.5363128491620112, "#dd2bfd" ], [ 0.6256983240223464, "#f246fe" ], [ 0.7150837988826816, "#fc67fd" ], [ 0.8044692737430168, "#fe88fc" ], [ 0.8938547486033519, "#fea5fd" ], [ 0.9832402234636871, "#febefe" ], [ 1, "#fec3fe" ] ] }, "plot_bgcolor": "rgb(17,17,17)", "paper_bgcolor": "rgb(17,17,17)", "shapedefaults": { "line": { "width": 0 }, "opacity": 0.4, "fillcolor": "#f2f5fa" }, "sliderdefaults": { "bgcolor": "#C8D4E3", "tickwidth": 0, "bordercolor": "rgb(17,17,17)", "borderwidth": 1 }, "annotationdefaults": { "arrowhead": 0, "arrowcolor": "#f2f5fa", "arrowwidth": 1 }, "updatemenudefaults": { "bgcolor": "#506784", "borderwidth": 0 } }, "themeRef": "PLOTLY_DARK" }, "hovermode": "x", "annotations": [ { "x": 18.78396871945259, "y": 86.06630824372759, "ax": 18.9991788856305, "ay": 77.98387096774194, "text": "", "axref": "x", "ayref": "y", "showarrow": false } ] } }, "height": null, "width": null, "user": { "profile_url": "https://chart-studio.plotly.com/~dev.purohit", "avatar_url": "https://storage.googleapis.com/plotly-prod-profiles/22.jpg", "background_url": "https://storage.googleapis.com/plotly-prod-profiles/bg-13.jpg", "bio": "", "nickname": "", "website": "", "stream_tokens": null, "feature_set_id": null, "csrf_token": null, "date_joined": "2025-07-15 13:57:27", "mapbox_access_tokens": null, "has_password": null, "username": "dev.purohit", "email": null, "is_active": null, "readonly": null, "is_dash_creator": null, "dash_created_count": null, "is_chart_creator": null, "charts_created_count": null } }, { "creation_time": "2025-07-16T13:43:56.608507Z", "comments": { "results": [], "count": 0 }, "parented": true, "embed_url": "https://chart-studio.plotly.com/~ishtumpid/17.embed", "fid": "ishtumpid:17", "filename": "Fraction vs pH", "filetype": "plot", "img_url": "https://storage.googleapis.com/plotly-prod-images/ishtumpid/17/9_1FGKZQ5DWIF8IS7ZQE77649MTSL7TQ.png", "image_urls": { "default": "https://api.plotly.com/v2/files/ishtumpid:17/image?image_name=default", "block-thumb": "https://storage.googleapis.com/plotly-prod-images/ishtumpid/17/8_YH9GUUOMSKNYQG0HRZQ1YPR4K3FBO3.png", "list-thumb": "https://storage.googleapis.com/plotly-prod-images/ishtumpid/17/9_1FGKZQ5DWIF8IS7ZQE77649MTSL7TQ.png" }, "api_urls": { "files": "https://api.plotly.com/v2/files/ishtumpid:17", "plots": "https://api.plotly.com/v2/plots/ishtumpid:17", "parent": "https://api.plotly.com/v2/folders/home?user=ishtumpid" }, "owner": "ishtumpid", "parent": -1, "preview": "", "referencers": [], "references": [], "title": "", "views": 0, "web_url": "https://chart-studio.plotly.com/~ishtumpid/17/", "world_readable": true, "date_modified": "2025-07-24T11:25:38.434Z", "stars": { "results": [], "count": 0 }, "collaborators": { "results": [], "count": 0 }, "subfolder_count": null, "refresh_interval": null, "organize_view_url": "https://chart-studio.plotly.com/~ishtumpid/17/", "current_user_permission": "read", "is_theme": null, "is_template": false, "autosize": true, "caption": "", "figure": { "data": [ { "line": { "color": "rgb(214, 40, 40)", "shape": "spline", "width": 6, "smoothing": 1.3 }, "meta": { "columnNames": { "x": "A", "y": "B" } }, "mode": "markers+lines", "name": "<b>10 nm</b>", "type": "scatter", "xsrc": "ishtumpid:16:eb7564", "ysrc": "ishtumpid:16:adb8c5", "marker": { "line": { "color": "rgb(0, 0, 0)", "width": 3 }, "size": 14 } }, { "line": { "color": "rgb(6, 214, 160)", "shape": "spline", "width": 6, "smoothing": 1.3 }, "meta": { "columnNames": { "x": "A", "y": "C" } }, "mode": "markers+lines", "name": "<b>10</b><sup><b>2</b></sup><b> nm</b>", "type": "scatter", "xsrc": "ishtumpid:16:eb7564", "ysrc": "ishtumpid:16:623aa3", "marker": { "line": { "color": "rgb(0, 0, 0)", "width": 3 }, "size": 14, "symbol": "square" }, "stackgroup": null }, { "line": { "color": "rgb(255, 190, 11)", "shape": "spline", "width": 6, "smoothing": 1.3 }, "meta": { "columnNames": { "x": "A", "y": "D" } }, "mode": "markers+lines", "name": "<b>10</b><sup><b>3</b></sup><b> nm</b>", "type": "scatter", "xsrc": "ishtumpid:16:eb7564", "ysrc": "ishtumpid:16:d2d754", "marker": { "line": { "color": "rgb(0, 0, 0)", "width": 3 }, "size": 14, "symbol": "diamond" }, "stackgroup": null }, { "line": { "color": "rgb(112, 214, 255)", "shape": "spline", "width": 6, "smoothing": 1.3 }, "meta": { "columnNames": { "x": "A", "y": "E" } }, "mode": "markers+lines", "name": "<b>10</b><sup><b>4</b></sup><b> nm</b>", "type": "scatter", "xsrc": "ishtumpid:16:eb7564", "ysrc": "ishtumpid:16:f4d67d", "marker": { "line": { "color": "rgb(0, 0, 0)", "width": 3 }, "size": 14, "symbol": "cross" }, "stackgroup": null }, { "line": { "color": "rgb(0, 128, 128)", "shape": "spline", "width": 6, "smoothing": 1.3 }, "meta": { "columnNames": { "x": "A", "y": "F" } }, "mode": "markers+lines", "name": "<b>10</b><sup><b>5</b></sup><b> nm</b>", "type": "scatter", "xsrc": "ishtumpid:16:eb7564", "ysrc": "ishtumpid:16:e58daa", "marker": { "line": { "color": "rgb(0, 0, 0)", "width": 3 }, "size": 14, "color": "rgb(0, 128, 128)", "symbol": "x" }, "stackgroup": null }, { "line": { "dash": "dash", "color": "rgb(214, 40, 40)", "shape": "spline", "width": 6, "smoothing": 1.3 }, "meta": { "columnNames": { "x": "H", "y": "I" } }, "mode": "markers+lines", "type": "scatter", "xsrc": "ishtumpid:16:0071ed", "ysrc": "ishtumpid:16:2c3ce8", "xaxis": "x2", "yaxis": "y2", "marker": { "line": { "color": "rgb(0, 0, 0)", "width": 3 }, "size": 14 }, "showlegend": false }, { "line": { "dash": "dash", "color": "rgb(6, 214, 160)", "shape": "spline", "width": 6, "smoothing": 1.3 }, "meta": { "columnNames": { "x": "H", "y": "J" } }, "mode": "markers+lines", "type": "scatter", "xsrc": "ishtumpid:16:0071ed", "ysrc": "ishtumpid:16:d4417f", "xaxis": "x2", "yaxis": "y2", "marker": { "line": { "color": "rgb(0, 0, 0)", "width": 3 }, "size": 14, "symbol": "square" }, "showlegend": false, "stackgroup": null }, { "line": { "dash": "dash", "color": "rgb(255, 190, 11)", "shape": "spline", "width": 6, "smoothing": 1.3 }, "meta": { "columnNames": { "x": "H", "y": "K" } }, "mode": "markers+lines", "type": "scatter", "xsrc": "ishtumpid:16:0071ed", "ysrc": "ishtumpid:16:ed1876", "xaxis": "x2", "yaxis": "y2", "marker": { "line": { "color": "rgb(0, 0, 0)", "width": 3 }, "size": 14, "symbol": "diamond" }, "showlegend": false, "stackgroup": null }, { "line": { "dash": "dash", "color": "rgb(112, 214, 255)", "shape": "spline", "width": 6, "smoothing": 1.3 }, "meta": { "columnNames": { "x": "H", "y": "L" } }, "mode": "markers+lines", "type": "scatter", "xsrc": "ishtumpid:16:0071ed", "ysrc": "ishtumpid:16:684f63", "xaxis": "x2", "yaxis": "y2", "marker": { "line": { "color": "rgb(0, 0, 0)", "width": 3 }, "size": 14, "symbol": "cross" }, "showlegend": false, "stackgroup": null }, { "line": { "dash": "dash", "color": "rgb(54, 69, 79)", "shape": "spline", "width": 6, "smoothing": 1.3 }, "meta": { "columnNames": { "x": "H", "y": "M" } }, "mode": "markers+lines", "type": "scatter", "xsrc": "ishtumpid:16:0071ed", "ysrc": "ishtumpid:16:dc28bb", "xaxis": "x2", "yaxis": "y2", "marker": { "line": { "color": "rgb(0, 0, 0)", "width": 3 }, "size": 14, "symbol": "x" }, "showlegend": false, "stackgroup": null } ], "frames": [], "layout": { "xaxis": { "type": "category", "range": [ -0.2075347705828119, 3.2075347705828117 ], "ticks": "outside", "title": { "font": { "size": 36, "color": "rgb(0, 0, 0)", "family": "Arial" }, "text": "<b>pH</b>" }, "domain": [ 0, 0.49 ], "mirror": "ticks", "ticklen": 10, "showgrid": false, "showline": true, "tickfont": { "size": 36, "color": "rgb(0, 0, 0)", "family": "Arial" }, "zeroline": false, "autorange": true, "linecolor": "rgb(0, 0, 0)", "linewidth": 2, "tickcolor": "rgb(0, 0, 0)", "tickwidth": 3 }, "yaxis": { "type": "linear", "range": [ 0, 1 ], "ticks": "outside", "title": { "font": { "size": 36, "color": "rgb(0, 0, 0)", "family": "Arial" }, "text": "<b>Fraction</b>" }, "domain": [ 0, 1 ], "mirror": "ticks", "ticklen": 10, "showgrid": false, "showline": true, "tickfont": { "size": 36, "color": "rgb(0, 0, 0)", "family": "Arial" }, "zeroline": false, "autorange": false, "linecolor": "rgb(0, 0, 0)", "linewidth": 2, "tickcolor": "rgb(0, 0, 0)", "tickwidth": 3 }, "legend": { "x": 0.5286519911776376, "y": 0.020000000000000018, "font": { "size": 36, "color": "rgb(0, 0, 0)", "family": "Arial" } }, "xaxis2": { "side": "bottom", "type": "category", "range": [ -0.2075347705828119, 3.2075347705828117 ], "ticks": "outside", "title": { "font": { "size": 36, "color": "rgb(0, 0, 0)", "family": "Arial" }, "text": "<b>pH</b>" }, "anchor": "y2", "domain": [ 0.51, 1 ], "mirror": "ticks", "ticklen": 10, "showgrid": false, "showline": true, "tickfont": { "size": 36, "color": "rgb(0, 0, 0)", "family": "Arial" }, "zeroline": false, "autorange": true, "linecolor": "rgb(0, 0, 0)", "linewidth": 2, "tickcolor": "rgb(0, 0, 0)", "tickwidth": 3, "overlaying": false }, "yaxis2": { "side": "right", "type": "linear", "range": [ 0, 1 ], "ticks": "outside", "title": { "font": { "size": 36, "color": "rgb(0, 0, 0)", "family": "Arial" }, "text": "<b>Fraction</b>" }, "anchor": "x2", "domain": [ 0, 1 ], "mirror": "ticks", "ticklen": 10, "showgrid": false, "showline": true, "tickfont": { "size": 36, "color": "rgb(0, 0, 0)", "family": "Arial" }, "zeroline": false, "autorange": false, "linecolor": "rgb(0, 0, 0)", "linewidth": 2, "tickcolor": "rgb(0, 0, 0)", "tickwidth": 3, "overlaying": false }, "autosize": true, "template": { "data": { "bar": [ { "type": "bar", "marker": { "colorbar": { "ticks": "", "outlinewidth": 0 } } } ], "table": [ { "type": "table", "cells": { "fill": { "color": "#EBF0F8" }, "line": { "color": "white" } }, "header": { "fill": { "color": "#C8D4E3" }, "line": { "color": "white" } } } ], "carpet": [ { "type": "carpet", "aaxis": { "gridcolor": "#C8D4E3", "linecolor": "#C8D4E3", "endlinecolor": "#2a3f5f", "minorgridcolor": "#C8D4E3", "startlinecolor": "#2a3f5f" }, "baxis": { "gridcolor": "#C8D4E3", "linecolor": "#C8D4E3", "endlinecolor": "#2a3f5f", "minorgridcolor": "#C8D4E3", "startlinecolor": "#2a3f5f" } } ], "mesh3d": [ { "type": "mesh3d", "colorbar": { "ticks": "", "outlinewidth": 0 } } ], "contour": [ { "type": "contour", "colorbar": { "ticks": "", "outlinewidth": 0 }, "autocolorscale": true } ], "heatmap": [ { "type": "heatmap", "colorbar": { "ticks": "", "outlinewidth": 0 }, "autocolorscale": true } ], "scatter": [ { "type": "scatter", "marker": { "colorbar": { "ticks": "", "outlinewidth": 0 } } } ], "surface": [ { "type": "surface", "colorbar": { "ticks": "", "outlinewidth": 0 } } ], "heatmapgl": [ { "type": "heatmapgl", "colorbar": { "ticks": "", "outlinewidth": 0 } } ], "histogram": [ { "type": "histogram", "marker": { "colorbar": { "ticks": "", "outlinewidth": 0 } } } ], "parcoords": [ { "line": { "colorbar": { "ticks": "", "outlinewidth": 0 } }, "type": "parcoords" } ], "scatter3d": [ { "type": "scatter3d", "marker": { "colorbar": { "ticks": "", "outlinewidth": 0 } } } ], "scattergl": [ { "type": "scattergl", "marker": { "colorbar": { "ticks": "", "outlinewidth": 0 } } } ], "choropleth": [ { "type": "choropleth", "colorbar": { "ticks": "", "outlinewidth": 0 } } ], "scattergeo": [ { "type": "scattergeo", "marker": { "colorbar": { "ticks": "", "outlinewidth": 0 } } } ], "histogram2d": [ { "type": "histogram2d", "colorbar": { "ticks": "", "outlinewidth": 0 }, "autocolorscale": true } ], "scatterpolar": [ { "type": "scatterpolar", "marker": { "colorbar": { "ticks": "", "outlinewidth": 0 } } } ], "contourcarpet": [ { "type": "contourcarpet", "colorbar": { "ticks": "", "outlinewidth": 0 } } ], "scattercarpet": [ { "type": "scattercarpet", "marker": { "colorbar": { "ticks": "", "outlinewidth": 0 } } } ], "scattermapbox": [ { "type": "scattermapbox", "marker": { "colorbar": { "ticks": "", "outlinewidth": 0 } } } ], "scatterpolargl": [ { "type": "scatterpolargl", "marker": { "colorbar": { "ticks": "", "outlinewidth": 0 } } } ], "scatterternary": [ { "type": "scatterternary", "marker": { "colorbar": { "ticks": "", "outlinewidth": 0 } } } ], "histogram2dcontour": [ { "type": "histogram2dcontour", "colorbar": { "ticks": "", "outlinewidth": 0 }, "autocolorscale": true } ] }, "layout": { "geo": { "bgcolor": "white", "showland": true, "lakecolor": "white", "landcolor": "white", "showlakes": true, "subunitcolor": "#C8D4E3" }, "font": { "color": "#2a3f5f" }, "polar": { "bgcolor": "white", "radialaxis": { "ticks": "", "gridcolor": "#EBF0F8", "linecolor": "#EBF0F8" }, "angularaxis": { "ticks": "", "gridcolor": "#EBF0F8", "linecolor": "#EBF0F8" } }, "scene": { "xaxis": { "ticks": "", "gridcolor": "#DFE8F3", "gridwidth": 2, "linecolor": "#EBF0F8", "zerolinecolor": "#EBF0F8", "showbackground": true, "backgroundcolor": "white" }, "yaxis": { "ticks": "", "gridcolor": "#DFE8F3", "gridwidth": 2, "linecolor": "#EBF0F8", "zerolinecolor": "#EBF0F8", "showbackground": true, "backgroundcolor": "white" }, "zaxis": { "ticks": "", "gridcolor": "#DFE8F3", "gridwidth": 2, "linecolor": "#EBF0F8", "zerolinecolor": "#EBF0F8", "showbackground": true, "backgroundcolor": "white" } }, "title": { "x": 0.05 }, "xaxis": { "ticks": "", "gridcolor": "#EBF0F8", "linecolor": "#EBF0F8", "automargin": true, "zerolinecolor": "#EBF0F8", "zerolinewidth": 2 }, "yaxis": { "ticks": "", "gridcolor": "#EBF0F8", "linecolor": "#EBF0F8", "automargin": true, "zerolinecolor": "#EBF0F8", "zerolinewidth": 2 }, "ternary": { "aaxis": { "ticks": "", "gridcolor": "#DFE8F3", "linecolor": "#A2B1C6" }, "baxis": { "ticks": "", "gridcolor": "#DFE8F3", "linecolor": "#A2B1C6" }, "caxis": { "ticks": "", "gridcolor": "#DFE8F3", "linecolor": "#A2B1C6" }, "bgcolor": "white" }, "colorway": [ "#636efa", "#EF553B", "#00cc96", "#ab63fa", "#19d3f3", "#e763fa", "#fecb52", "#ffa15a", "#ff6692", "#b6e880" ], "hovermode": "closest", "colorscale": { "diverging": [ [ 0, "#8e0152" ], [ 0.1, "#c51b7d" ], [ 0.2, "#de77ae" ], [ 0.3, "#f1b6da" ], [ 0.4, "#fde0ef" ], [ 0.5, "#f7f7f7" ], [ 0.6, "#e6f5d0" ], [ 0.7, "#b8e186" ], [ 0.8, "#7fbc41" ], [ 0.9, "#4d9221" ], [ 1, "#276419" ] ], "sequential": [ [ 0, "#0508b8" ], [ 0.0893854748603352, "#1910d8" ], [ 0.1787709497206704, "#3c19f0" ], [ 0.2681564245810056, "#6b1cfb" ], [ 0.3575418994413408, "#981cfd" ], [ 0.44692737430167595, "#bf1cfd" ], [ 0.5363128491620112, "#dd2bfd" ], [ 0.6256983240223464, "#f246fe" ], [ 0.7150837988826816, "#fc67fd" ], [ 0.8044692737430168, "#fe88fc" ], [ 0.8938547486033519, "#fea5fd" ], [ 0.9832402234636871, "#febefe" ], [ 1, "#fec3fe" ] ], "sequentialminus": [ [ 0, "#0508b8" ], [ 0.0893854748603352, "#1910d8" ], [ 0.1787709497206704, "#3c19f0" ], [ 0.2681564245810056, "#6b1cfb" ], [ 0.3575418994413408, "#981cfd" ], [ 0.44692737430167595, "#bf1cfd" ], [ 0.5363128491620112, "#dd2bfd" ], [ 0.6256983240223464, "#f246fe" ], [ 0.7150837988826816, "#fc67fd" ], [ 0.8044692737430168, "#fe88fc" ], [ 0.8938547486033519, "#fea5fd" ], [ 0.9832402234636871, "#febefe" ], [ 1, "#fec3fe" ] ] }, "plot_bgcolor": "white", "paper_bgcolor": "white", "shapedefaults": { "line": { "width": 0 }, "opacity": 0.4, "fillcolor": "#506784" }, "annotationdefaults": { "arrowhead": 0, "arrowcolor": "#506784", "arrowwidth": 1 } }, "themeRef": "PLOTLY_WHITE" }, "annotations": [ { "x": 0.0013423476740509477, "y": 0.996018202502844, "font": { "size": 36, "color": "rgb(0, 0, 0)", "family": "Arial" }, "text": "<b>(a) Sodium Octanoate</b>", "xref": "paper", "yref": "paper", "showarrow": false }, { "x": 0.9962466487935657, "y": 0.9954493742889646, "font": { "size": 36, "color": "rgb(0, 0, 0)", "family": "Arial" }, "text": "<b>(b) Octanoic Acid</b>", "xref": "paper", "yref": "paper", "showarrow": false } ] } }, "height": null, "width": null, "user": { "profile_url": "https://chart-studio.plotly.com/~ishtumpid", "avatar_url": "https://storage.googleapis.com/plotly-prod-profiles/44.jpg", "background_url": "https://storage.googleapis.com/plotly-prod-profiles/bg-11.jpg", "bio": "", "nickname": "", "website": "", "stream_tokens": null, "feature_set_id": null, "csrf_token": null, "date_joined": "2025-04-17 18:18:45", "mapbox_access_tokens": null, "has_password": null, "username": "ishtumpid", "email": null, "is_active": null, "readonly": null, "is_dash_creator": null, "dash_created_count": null, "is_chart_creator": null, "charts_created_count": null } }, { "creation_time": "2025-07-16T13:21:36.768874Z", "comments": { "results": [], "count": 0 }, "parented": true, "embed_url": "https://chart-studio.plotly.com/~jntmbb/19.embed", "fid": "jntmbb:19", "filename": "treemap-from-csv", "filetype": "plot", "img_url": "https://storage.googleapis.com/plotly-prod-images/jntmbb/19/9_IFPOAQ3PM3ZUMA0XYI2VRRQAFP2RQP.png", "image_urls": { "default": "https://storage.googleapis.com/plotly-prod-images/jntmbb/19/2_2OMVV1R69QUN36RVYNXZ0BBQH9PLHY.png", "block-thumb": "https://storage.googleapis.com/plotly-prod-images/jntmbb/19/8_JPI6NFTQDGIFOJ3CJA6FKFBKXJ9TN8.png", "list-thumb": "https://storage.googleapis.com/plotly-prod-images/jntmbb/19/9_IFPOAQ3PM3ZUMA0XYI2VRRQAFP2RQP.png" }, "api_urls": { "files": "https://api.plotly.com/v2/files/jntmbb:19", "plots": "https://api.plotly.com/v2/plots/jntmbb:19", "parent": "https://api.plotly.com/v2/folders/home?user=jntmbb" }, "owner": "jntmbb", "parent": -1, "preview": "", "referencers": [], "references": [], "title": "", "views": 2, "web_url": "https://chart-studio.plotly.com/~jntmbb/19/", "world_readable": true, "date_modified": "2025-07-16T14:27:11.437Z", "stars": { "results": [], "count": 0 }, "collaborators": { "results": [], "count": 0 }, "subfolder_count": null, "refresh_interval": null, "organize_view_url": "https://chart-studio.plotly.com/~jntmbb/19/", "current_user_permission": "read", "is_theme": null, "is_template": null, "autosize": true, "caption": "", "figure": { "data": [ { "name": "", "type": "treemap", "domain": { "x": [ 0.0, 1.0 ], "y": [ 0.0, 1.0 ] }, "idssrc": "jntmbb:34:87c38c", "marker": { "colorssrc": "jntmbb:34:204518" }, "textfont": { "size": 20 }, "textinfo": "label+value+percent parent+percent root", "labelssrc": "jntmbb:34:f1c152", "valuessrc": "jntmbb:34:57ddae", "parentssrc": "jntmbb:34:e19f3e", "branchvalues": "total", "textposition": "middle center", "customdatasrc": "jntmbb:34:5ed2fa", "hovertemplate": "labels=%{label}<br>Count=%{value}<br>parent=%{parent}<br>id=%{id}<br>Target=%{customdata[0]}<extra></extra>" } ], "layout": { "title": { "text": "Dropout by Course" }, "legend": { "tracegroupgap": 0 }, "template": { "data": { "bar": [ { "type": "bar", "marker": { "line": { "color": "#E5ECF6", "width": 0.5 }, "pattern": { "size": 10, "fillmode": "overlay", "solidity": 0.2 } }, "error_x": { "color": "#2a3f5f" }, "error_y": { "color": "#2a3f5f" } } ], "pie": [ { "type": "pie", "automargin": true } ], "table": [ { "type": "table", "cells": { "fill": { "color": "#EBF0F8" }, "line": { "color": "white" } }, "header": { "fill": { "color": "#C8D4E3" }, "line": { "color": "white" } } } ], "carpet": [ { "type": "carpet", "aaxis": { "gridcolor": "white", "linecolor": "white", "endlinecolor": "#2a3f5f", "minorgridcolor": "white", "startlinecolor": "#2a3f5f" }, "baxis": { "gridcolor": "white", "linecolor": "white", "endlinecolor": "#2a3f5f", "minorgridcolor": "white", "startlinecolor": "#2a3f5f" } } ], "mesh3d": [ { "type": "mesh3d", "colorbar": { "ticks": "", "outlinewidth": 0 } } ], "contour": [ { "type": "contour", "colorbar": { "ticks": "", "outlinewidth": 0 }, "colorscale": [ [ 0.0, "#0d0887" ], [ 0.1111111111111111, "#46039f" ], [ 0.2222222222222222, "#7201a8" ], [ 0.3333333333333333, "#9c179e" ], [ 0.4444444444444444, "#bd3786" ], [ 0.5555555555555556, "#d8576b" ], [ 0.6666666666666666, "#ed7953" ], [ 0.7777777777777778, "#fb9f3a" ], [ 0.8888888888888888, "#fdca26" ], [ 1.0, "#f0f921" ] ] } ], "heatmap": [ { "type": "heatmap", "colorbar": { "ticks": "", "outlinewidth": 0 }, "colorscale": [ [ 0.0, "#0d0887" ], [ 0.1111111111111111, "#46039f" ], [ 0.2222222222222222, "#7201a8" ], [ 0.3333333333333333, "#9c179e" ], [ 0.4444444444444444, "#bd3786" ], [ 0.5555555555555556, "#d8576b" ], [ 0.6666666666666666, "#ed7953" ], [ 0.7777777777777778, "#fb9f3a" ], [ 0.8888888888888888, "#fdca26" ], [ 1.0, "#f0f921" ] ] } ], "scatter": [ { "type": "scatter", "fillpattern": { "size": 10, "fillmode": "overlay", "solidity": 0.2 } } ], "surface": [ { "type": "surface", "colorbar": { "ticks": "", "outlinewidth": 0 }, "colorscale": [ [ 0.0, "#0d0887" ], [ 0.1111111111111111, "#46039f" ], [ 0.2222222222222222, "#7201a8" ], [ 0.3333333333333333, "#9c179e" ], [ 0.4444444444444444, "#bd3786" ], [ 0.5555555555555556, "#d8576b" ], [ 0.6666666666666666, "#ed7953" ], [ 0.7777777777777778, "#fb9f3a" ], [ 0.8888888888888888, "#fdca26" ], [ 1.0, "#f0f921" ] ] } ], "barpolar": [ { "type": "barpolar", "marker": { "line": { "color": "#E5ECF6", "width": 0.5 }, "pattern": { "size": 10, "fillmode": "overlay", "solidity": 0.2 } } } ], "heatmapgl": [ { "type": "heatmapgl", "colorbar": { "ticks": "", "outlinewidth": 0 }, "colorscale": [ [ 0.0, "#0d0887" ], [ 0.1111111111111111, "#46039f" ], [ 0.2222222222222222, "#7201a8" ], [ 0.3333333333333333, "#9c179e" ], [ 0.4444444444444444, "#bd3786" ], [ 0.5555555555555556, "#d8576b" ], [ 0.6666666666666666, "#ed7953" ], [ 0.7777777777777778, "#fb9f3a" ], [ 0.8888888888888888, "#fdca26" ], [ 1.0, "#f0f921" ] ] } ], "histogram": [ { "type": "histogram", "marker": { "pattern": { "size": 10, "fillmode": "overlay", "solidity": 0.2 } } } ], "parcoords": [ { "line": { "colorbar": { "ticks": "", "outlinewidth": 0 } }, "type": "parcoords" } ], "scatter3d": [ { "line": { "colorbar": { "ticks": "", "outlinewidth": 0 } }, "type": "scatter3d", "marker": { "colorbar": { "ticks": "", "outlinewidth": 0 } } } ], "scattergl": [ { "type": "scattergl", "marker": { "colorbar": { "ticks": "", "outlinewidth": 0 } } } ], "choropleth": [ { "type": "choropleth", "colorbar": { "ticks": "", "outlinewidth": 0 } } ], "scattergeo": [ { "type": "scattergeo", "marker": { "colorbar": { "ticks": "", "outlinewidth": 0 } } } ], "histogram2d": [ { "type": "histogram2d", "colorbar": { "ticks": "", "outlinewidth": 0 }, "colorscale": [ [ 0.0, "#0d0887" ], [ 0.1111111111111111, "#46039f" ], [ 0.2222222222222222, "#7201a8" ], [ 0.3333333333333333, "#9c179e" ], [ 0.4444444444444444, "#bd3786" ], [ 0.5555555555555556, "#d8576b" ], [ 0.6666666666666666, "#ed7953" ], [ 0.7777777777777778, "#fb9f3a" ], [ 0.8888888888888888, "#fdca26" ], [ 1.0, "#f0f921" ] ] } ], "scatterpolar": [ { "type": "scatterpolar", "marker": { "colorbar": { "ticks": "", "outlinewidth": 0 } } } ], "contourcarpet": [ { "type": "contourcarpet", "colorbar": { "ticks": "", "outlinewidth": 0 } } ], "scattercarpet": [ { "type": "scattercarpet", "marker": { "colorbar": { "ticks": "", "outlinewidth": 0 } } } ], "scattermapbox": [ { "type": "scattermapbox", "marker": { "colorbar": { "ticks": "", "outlinewidth": 0 } } } ], "scatterpolargl": [ { "type": "scatterpolargl", "marker": { "colorbar": { "ticks": "", "outlinewidth": 0 } } } ], "scatterternary": [ { "type": "scatterternary", "marker": { "colorbar": { "ticks": "", "outlinewidth": 0 } } } ], "histogram2dcontour": [ { "type": "histogram2dcontour", "colorbar": { "ticks": "", "outlinewidth": 0 }, "colorscale": [ [ 0.0, "#0d0887" ], [ 0.1111111111111111, "#46039f" ], [ 0.2222222222222222, "#7201a8" ], [ 0.3333333333333333, "#9c179e" ], [ 0.4444444444444444, "#bd3786" ], [ 0.5555555555555556, "#d8576b" ], [ 0.6666666666666666, "#ed7953" ], [ 0.7777777777777778, "#fb9f3a" ], [ 0.8888888888888888, "#fdca26" ], [ 1.0, "#f0f921" ] ] } ] }, "layout": { "geo": { "bgcolor": "white", "showland": true, "lakecolor": "white", "landcolor": "#E5ECF6", "showlakes": true, "subunitcolor": "white" }, "font": { "color": "#2a3f5f" }, "polar": { "bgcolor": "#E5ECF6", "radialaxis": { "ticks": "", "gridcolor": "white", "linecolor": "white" }, "angularaxis": { "ticks": "", "gridcolor": "white", "linecolor": "white" } }, "scene": { "xaxis": { "ticks": "", "gridcolor": "white", "gridwidth": 2, "linecolor": "white", "zerolinecolor": "white", "showbackground": true, "backgroundcolor": "#E5ECF6" }, "yaxis": { "ticks": "", "gridcolor": "white", "gridwidth": 2, "linecolor": "white", "zerolinecolor": "white", "showbackground": true, "backgroundcolor": "#E5ECF6" }, "zaxis": { "ticks": "", "gridcolor": "white", "gridwidth": 2, "linecolor": "white", "zerolinecolor": "white", "showbackground": true, "backgroundcolor": "#E5ECF6" } }, "title": { "x": 0.05 }, "xaxis": { "ticks": "", "title": { "standoff": 15 }, "gridcolor": "white", "linecolor": "white", "automargin": true, "zerolinecolor": "white", "zerolinewidth": 2 }, "yaxis": { "ticks": "", "title": { "standoff": 15 }, "gridcolor": "white", "linecolor": "white", "automargin": true, "zerolinecolor": "white", "zerolinewidth": 2 }, "mapbox": { "style": "light" }, "ternary": { "aaxis": { "ticks": "", "gridcolor": "white", "linecolor": "white" }, "baxis": { "ticks": "", "gridcolor": "white", "linecolor": "white" }, "caxis": { "ticks": "", "gridcolor": "white", "linecolor": "white" }, "bgcolor": "#E5ECF6" }, "colorway": [ "#636efa", "#EF553B", "#00cc96", "#ab63fa", "#FFA15A", "#19d3f3", "#FF6692", "#B6E880", "#FF97FF", "#FECB52" ], "coloraxis": { "colorbar": { "ticks": "", "outlinewidth": 0 } }, "hovermode": "closest", "colorscale": { "diverging": [ [ 0, "#8e0152" ], [ 0.1, "#c51b7d" ], [ 0.2, "#de77ae" ], [ 0.3, "#f1b6da" ], [ 0.4, "#fde0ef" ], [ 0.5, "#f7f7f7" ], [ 0.6, "#e6f5d0" ], [ 0.7, "#b8e186" ], [ 0.8, "#7fbc41" ], [ 0.9, "#4d9221" ], [ 1, "#276419" ] ], "sequential": [ [ 0.0, "#0d0887" ], [ 0.1111111111111111, "#46039f" ], [ 0.2222222222222222, "#7201a8" ], [ 0.3333333333333333, "#9c179e" ], [ 0.4444444444444444, "#bd3786" ], [ 0.5555555555555556, "#d8576b" ], [ 0.6666666666666666, "#ed7953" ], [ 0.7777777777777778, "#fb9f3a" ], [ 0.8888888888888888, "#fdca26" ], [ 1.0, "#f0f921" ] ], "sequentialminus": [ [ 0.0, "#0d0887" ], [ 0.1111111111111111, "#46039f" ], [ 0.2222222222222222, "#7201a8" ], [ 0.3333333333333333, "#9c179e" ], [ 0.4444444444444444, "#bd3786" ], [ 0.5555555555555556, "#d8576b" ], [ 0.6666666666666666, "#ed7953" ], [ 0.7777777777777778, "#fb9f3a" ], [ 0.8888888888888888, "#fdca26" ], [ 1.0, "#f0f921" ] ] }, "hoverlabel": { "align": "left" }, "plot_bgcolor": "#E5ECF6", "paper_bgcolor": "white", "shapedefaults": { "line": { "color": "#2a3f5f" } }, "autotypenumbers": "strict", "annotationdefaults": { "arrowhead": 0, "arrowcolor": "#2a3f5f", "arrowwidth": 1 } } } } }, "height": null, "width": null, "user": { "profile_url": "https://chart-studio.plotly.com/~jntmbb", "avatar_url": "https://storage.googleapis.com/plotly-prod-profiles/40.jpg", "background_url": "https://storage.googleapis.com/plotly-prod-profiles/bg-1.jpg", "bio": "", "nickname": "", "website": "", "stream_tokens": null, "feature_set_id": null, "csrf_token": null, "date_joined": "2025-07-15 18:37:43", "mapbox_access_tokens": null, "has_password": null, "username": "jntmbb", "email": null, "is_active": null, "readonly": null, "is_dash_creator": null, "dash_created_count": null, "is_chart_creator": null, "charts_created_count": null } }, { "creation_time": "2025-07-16T12:35:47.649976Z", "comments": { "results": [], "count": 0 }, "parented": true, "embed_url": "https://chart-studio.plotly.com/~ishtumpid/15.embed", "fid": "ishtumpid:15", "filename": "OCA_Monolayer", "filetype": "plot", "img_url": "https://api.plotly.com/v2/files/ishtumpid:15/image?image_name=list-thumb", "image_urls": { "default": "https://storage.googleapis.com/plotly-prod-images/ishtumpid/15/2_ES4NJXQ7YSB99LBBWYH9FQFCPRFEYD.png", "block-thumb": "https://storage.googleapis.com/plotly-prod-images/ishtumpid/15/8_D63ZQAQ0ZYDMJ0ULL48ZUIRIUJT0U9.png", "list-thumb": "https://api.plotly.com/v2/files/ishtumpid:15/image?image_name=list-thumb" }, "api_urls": { "files": "https://api.plotly.com/v2/files/ishtumpid:15", "plots": "https://api.plotly.com/v2/plots/ishtumpid:15", "parent": "https://api.plotly.com/v2/folders/home?user=ishtumpid" }, "owner": "ishtumpid", "parent": -1, "preview": "", "referencers": [], "references": [], "title": "", "views": 1, "web_url": "https://chart-studio.plotly.com/~ishtumpid/15/", "world_readable": true, "date_modified": "2025-07-24T11:02:43.069Z", "stars": { "results": [], "count": 0 }, "collaborators": { "results": [], "count": 0 }, "subfolder_count": null, "refresh_interval": null, "organize_view_url": "https://chart-studio.plotly.com/~ishtumpid/15/", "current_user_permission": "read", "is_theme": null, "is_template": false, "autosize": true, "caption": "", "figure": { "data": [ { "line": { "color": "rgb(214, 40, 40)", "shape": "spline", "width": 6, "smoothing": 1.3 }, "meta": { "columnNames": { "x": "A", "y": "B" } }, "mode": "markers+lines", "name": "<b>C</b><sub><b>C8H</b></sub><b> = 0.25 mM</b>", "type": "scatter", "xsrc": "ishtumpid:14:5a9e7c", "ysrc": "ishtumpid:14:2b8eab", "marker": { "line": { "color": "rgb(0, 0, 0)", "width": 3 }, "size": 12 } }, { "line": { "dash": "dot", "color": "rgb(6, 214, 160)", "shape": "spline", "width": 6, "smoothing": 1.3 }, "meta": { "columnNames": { "x": "A", "y": "C" } }, "mode": "markers+lines", "name": "<b>C</b><sub><b>C8H</b></sub><b> = 2.72 mM</b>", "type": "scatter", "xsrc": "ishtumpid:14:5a9e7c", "ysrc": "ishtumpid:14:bda7b8", "marker": { "line": { "color": "rgb(0, 0, 0)", "width": 3 }, "size": 12, "symbol": "square" }, "stackgroup": null }, { "line": { "dash": "dash", "color": "rgb(255, 190, 11)", "shape": "spline", "width": 6, "smoothing": 1.3 }, "meta": { "columnNames": { "x": "A", "y": "D" } }, "mode": "markers+lines", "name": "<b>C</b><sub><b>C8H</b></sub><b> = 12.50 mM</b>", "type": "scatter", "xsrc": "ishtumpid:14:5a9e7c", "ysrc": "ishtumpid:14:08c993", "marker": { "line": { "color": "rgb(0, 0, 0)", "width": 3 }, "size": 12, "symbol": "diamond" }, "stackgroup": null }, { "line": { "dash": "dashdot", "color": "rgb(112, 214, 255)", "shape": "spline", "width": 6, "smoothing": 1.3 }, "meta": { "columnNames": { "x": "A", "y": "E" } }, "mode": "markers+lines", "name": "<b>C</b><sub><b>C8H</b></sub><b> = 22.73 mM</b>", "type": "scatter", "xsrc": "ishtumpid:14:5a9e7c", "ysrc": "ishtumpid:14:a6a9cd", "marker": { "line": { "color": "rgb(0, 0, 0)", "width": 3 }, "size": 12, "symbol": "x" }, "stackgroup": null }, { "line": { "color": "rgb(214, 40, 40)", "shape": "spline", "width": 6, "smoothing": 1.3 }, "meta": { "columnNames": { "x": "G", "y": "H" } }, "mode": "markers+lines", "type": "scatter", "xsrc": "ishtumpid:14:aecab4", "ysrc": "ishtumpid:14:f48894", "xaxis": "x2", "yaxis": "y2", "marker": { "line": { "color": "rgb(0, 0, 0)", "width": 3 }, "size": 12 }, "showlegend": false, "stackgroup": null }, { "line": { "dash": "dot", "color": "rgb(6, 214, 160)", "shape": "spline", "width": 6, "smoothing": 1.3 }, "meta": { "columnNames": { "x": "G", "y": "I" } }, "mode": "markers+lines", "type": "scatter", "xsrc": "ishtumpid:14:aecab4", "ysrc": "ishtumpid:14:f6c5cf", "xaxis": "x2", "yaxis": "y2", "marker": { "line": { "color": "rgb(0, 0, 0)", "width": 3 }, "size": 12, "symbol": "square" }, "showlegend": false, "stackgroup": null }, { "line": { "dash": "dash", "color": "rgb(255, 190, 11)", "shape": "spline", "width": 6, "smoothing": 1.3 }, "meta": { "columnNames": { "x": "G", "y": "J" } }, "mode": "markers+lines", "type": "scatter", "xsrc": "ishtumpid:14:aecab4", "ysrc": "ishtumpid:14:98f39e", "xaxis": "x2", "yaxis": "y2", "marker": { "line": { "color": "rgb(0, 0, 0)", "width": 3 }, "size": 12, "symbol": "diamond" }, "showlegend": false, "stackgroup": null }, { "line": { "dash": "dashdot", "color": "rgb(112, 214, 255)", "shape": "spline", "width": 6, "smoothing": 1.3 }, "meta": { "columnNames": { "x": "G", "y": "K" } }, "mode": "markers+lines", "type": "scatter", "xsrc": "ishtumpid:14:aecab4", "ysrc": "ishtumpid:14:c1cc08", "xaxis": "x2", "yaxis": "y2", "marker": { "line": { "color": "rgb(0, 0, 0)", "width": 3 }, "size": 12, "symbol": "x" }, "showlegend": false, "stackgroup": null }, { "line": { "color": "rgb(214, 40, 40)", "shape": "spline", "width": 6, "smoothing": 1.3 }, "meta": { "columnNames": { "x": "M", "y": "N" } }, "mode": "markers+lines", "type": "scatter", "xsrc": "ishtumpid:14:865089", "ysrc": "ishtumpid:14:5c8f10", "xaxis": "x3", "yaxis": "y3", "marker": { "line": { "color": "rgb(0, 0, 0)", "width": 3 }, "size": 12 }, "showlegend": false, "stackgroup": null }, { "line": { "dash": "dot", "color": "rgb(6, 214, 160)", "shape": "spline", "width": 6, "smoothing": 1.3 }, "meta": { "columnNames": { "x": "M", "y": "O" } }, "mode": "markers+lines", "type": "scatter", "xsrc": "ishtumpid:14:865089", "ysrc": "ishtumpid:14:32d56c", "xaxis": "x3", "yaxis": "y3", "marker": { "line": { "color": "rgb(0, 0, 0)", "width": 3 }, "size": 12, "symbol": "square" }, "showlegend": false, "stackgroup": null }, { "line": { "dash": "dash", "color": "rgb(255, 190, 11)", "shape": "spline", "width": 6, "smoothing": 1.3 }, "meta": { "columnNames": { "x": "M", "y": "P" } }, "mode": "markers+lines", "type": "scatter", "xsrc": "ishtumpid:14:865089", "ysrc": "ishtumpid:14:5c2dff", "xaxis": "x3", "yaxis": "y3", "marker": { "line": { "color": "rgb(0, 0, 0)", "width": 3 }, "size": 12, "symbol": "diamond" }, "showlegend": false, "stackgroup": null }, { "line": { "dash": "dashdot", "color": "rgb(112, 214, 255)", "shape": "spline", "width": 6, "smoothing": 1.3 }, "meta": { "columnNames": { "x": "M", "y": "Q" } }, "mode": "markers+lines", "type": "scatter", "xsrc": "ishtumpid:14:865089", "ysrc": "ishtumpid:14:4f32de", "xaxis": "x3", "yaxis": "y3", "marker": { "line": { "color": "rgb(0, 0, 0)", "width": 3 }, "size": 12, "symbol": "x" }, "showlegend": false, "stackgroup": null }, { "line": { "color": "rgb(214, 40, 40)", "shape": "spline", "width": 6, "smoothing": 1.3 }, "meta": { "columnNames": { "x": "S", "y": "T" } }, "mode": "markers+lines", "type": "scatter", "xsrc": "ishtumpid:14:7747fe", "ysrc": "ishtumpid:14:a2707e", "xaxis": "x4", "yaxis": "y4", "marker": { "line": { "color": "rgb(0, 0, 0)", "width": 3 }, "size": 12 }, "showlegend": false, "stackgroup": null }, { "line": { "dash": "dot", "color": "rgb(6, 214, 160)", "shape": "spline", "width": 6, "smoothing": 1.3 }, "meta": { "columnNames": { "x": "S", "y": "U" } }, "mode": "markers+lines", "type": "scatter", "xsrc": "ishtumpid:14:7747fe", "ysrc": "ishtumpid:14:b99224", "xaxis": "x4", "yaxis": "y4", "marker": { "line": { "color": "rgb(0, 0, 0)", "width": 3 }, "size": 12, "symbol": "square" }, "showlegend": false, "stackgroup": null }, { "line": { "dash": "dash", "color": "rgb(255, 190, 11)", "shape": "spline", "width": 6, "smoothing": 1.3 }, "meta": { "columnNames": { "x": "S", "y": "V" } }, "mode": "markers+lines", "type": "scatter", "xsrc": "ishtumpid:14:7747fe", "ysrc": "ishtumpid:14:1332fb", "xaxis": "x4", "yaxis": "y4", "marker": { "line": { "color": "rgb(0, 0, 0)", "width": 3 }, "size": 12, "symbol": "diamond" }, "showlegend": false, "stackgroup": null }, { "line": { "dash": "dashdot", "color": "rgb(112, 214, 255)", "shape": "spline", "width": 6, "smoothing": 1.3 }, "meta": { "columnNames": { "x": "S", "y": "W" } }, "mode": "markers+lines", "type": "scatter", "xsrc": "ishtumpid:14:7747fe", "ysrc": "ishtumpid:14:234db9", "xaxis": "x4", "yaxis": "y4", "marker": { "line": { "color": "rgb(0, 0, 0)", "width": 3 }, "size": 12, "symbol": "x" }, "showlegend": false, "stackgroup": null }, { "line": { "dash": "longdashdot", "color": "rgb(214, 40, 40)", "width": 4 }, "meta": { "columnNames": { "x": "Z", "y": "AA" } }, "mode": "lines", "name": "<b>x</b><sub><b>2</b></sub><b> = 4.46E-06</b>", "type": "scatter", "xsrc": "ishtumpid:14:31a46c", "ysrc": "ishtumpid:14:f029f4", "xaxis": "x2", "yaxis": "y2", "showlegend": true }, { "line": { "dash": "longdashdot", "color": "rgb(6, 214, 160)", "width": 4 }, "meta": { "columnNames": { "x": "Z", "y": "AB" } }, "mode": "lines", "name": "<b>x</b><sub><b>2</b></sub><b> = 4.09E-05</b>", "type": "scatter", "xsrc": "ishtumpid:14:31a46c", "ysrc": "ishtumpid:14:475fd8", "xaxis": "x2", "yaxis": "y2", "showlegend": true, "stackgroup": null }, { "line": { "dash": "longdashdot", "color": "rgb(255, 190, 11)", "width": 4 }, "meta": { "columnNames": { "x": "Z", "y": "AC" } }, "mode": "lines", "name": "<b>x</b><sub><b>2</b></sub><b> = 2.25E-04</b>", "type": "scatter", "xsrc": "ishtumpid:14:31a46c", "ysrc": "ishtumpid:14:e5d5a8", "xaxis": "x2", "yaxis": "y2", "showlegend": true, "stackgroup": null }, { "line": { "dash": "longdashdot", "color": "rgb(112, 214, 255)", "width": 4 }, "meta": { "columnNames": { "x": "Z", "y": "AD" } }, "mode": "lines", "name": "<b>x</b><sub><b>2</b></sub><b> = 4.09E-04</b>", "type": "scatter", "xsrc": "ishtumpid:14:31a46c", "ysrc": "ishtumpid:14:e8d363", "xaxis": "x2", "yaxis": "y2", "showlegend": true, "stackgroup": null } ], "frames": [], "layout": { "xaxis": { "side": "top", "type": "log", "range": [ 0.7348309742654164, 5.265169025734584 ], "ticks": "outside", "title": { "font": { "size": 44, "color": "rgb(0, 0, 0)", "family": "Arial" }, "text": "<br>" }, "domain": [ 0, 0.49 ], "mirror": "ticks", "nticks": 5, "ticklen": 10, "showgrid": false, "showline": true, "tickfont": { "size": 36, "color": "rgb(0, 0, 0)", "family": "Arial" }, "zeroline": false, "autorange": true, "linecolor": "rgb(0, 0, 0)", "linewidth": 2, "tickcolor": "rgb(0, 0, 0)", "tickwidth": 3, "exponentformat": "power" }, "yaxis": { "type": "linear", "range": [ -0.04846141249203024, 0.6318629724920303 ], "ticks": "outside", "title": { "font": { "size": 44, "color": "rgb(0, 0, 0)", "family": "Arial" }, "text": "<b>x</b><sub><b>2</b></sub><sup><b>S</b></sup>" }, "domain": [ 0.51, 1 ], "mirror": "ticks", "ticklen": 10, "showgrid": false, "showline": true, "tickfont": { "size": 36, "color": "rgb(0, 0, 0)", "family": "Arial" }, "zeroline": false, "autorange": true, "linecolor": "rgb(0, 0, 0)", "linewidth": 2, "tickcolor": "rgb(0, 0, 0)", "tickwidth": 3 }, "legend": { "x": 0.019769642060306472, "y": 1.318994052873271, "font": { "size": 48, "color": "rgb(0, 0, 0)", "family": "Arial" }, "orientation": "h" }, "xaxis2": { "side": "bottom", "type": "log", "range": [ 0.7348309742654164, 5.265169025734584 ], "ticks": "outside", "title": { "font": { "size": 44, "color": "rgb(0, 0, 0)", "family": "Arial" }, "text": "<b>Radius (nm)</b>" }, "anchor": "y2", "domain": [ 0, 0.49 ], "mirror": "ticks", "nticks": 5, "ticklen": 10, "showgrid": false, "showline": true, "tickfont": { "size": 36, "color": "rgb(0, 0, 0)", "family": "Arial" }, "zeroline": false, "autorange": true, "linecolor": "rgb(0, 0, 0)", "linewidth": 2, "tickcolor": "rgb(0, 0, 0)", "tickwidth": 3, "overlaying": false, "exponentformat": "power" }, "xaxis3": { "side": "top", "type": "log", "range": [ 0.7348309742654164, 5.265169025734584 ], "ticks": "outside", "title": { "font": { "size": 44, "color": "rgb(0, 0, 0)", "family": "Arial" }, "text": "<br>" }, "anchor": "y3", "domain": [ 0.51, 1 ], "mirror": "ticks", "nticks": 5, "ticklen": 10, "showgrid": false, "showline": true, "tickfont": { "size": 36, "color": "rgb(0, 0, 0)", "family": "Arial" }, "zeroline": false, "autorange": true, "linecolor": "rgb(0, 0, 0)", "linewidth": 2, "tickcolor": "rgb(0, 0, 0)", "tickwidth": 3, "overlaying": false, "exponentformat": "power" }, "xaxis4": { "side": "bottom", "type": "log", "range": [ 0.7348309742654164, 5.265169025734584 ], "ticks": "outside", "title": { "font": { "size": 44, "color": "rgb(0, 0, 0)", "family": "Arial" }, "text": "<b>Radius (nm)</b>" }, "anchor": "y4", "domain": [ 0.51, 1 ], "mirror": "ticks", "nticks": 5, "ticklen": 10, "showgrid": false, "showline": true, "tickfont": { "size": 36, "color": "rgb(0, 0, 0)", "family": "Arial" }, "zeroline": false, "autorange": true, "linecolor": "rgb(0, 0, 0)", "linewidth": 2, "tickcolor": "rgb(0, 0, 0)", "tickwidth": 3, "overlaying": false, "exponentformat": "power" }, "yaxis2": { "side": "left", "type": "linear", "dtick": 7, "range": [ -3.6299060801975636e-05, 0.00048391506080197567 ], "ticks": "outside", "title": { "font": { "size": 44, "color": "rgb(0, 0, 0)", "family": "Arial" }, "text": "<b>x</b><sub><b>2</b></sub><sup><b>b</b></sup>" }, "anchor": "x2", "domain": [ 0, 0.49 ], "mirror": "ticks", "nticks": 5, "ticklen": 10, "showgrid": false, "showline": true, "tickfont": { "size": 36, "color": "rgb(0, 0, 0)", "family": "Arial" }, "tickmode": "auto", "zeroline": false, "autorange": true, "linecolor": "rgb(0, 0, 0)", "linewidth": 2, "tickcolor": "rgb(0, 0, 0)", "tickwidth": 3, "overlaying": false, "exponentformat": "E" }, "yaxis3": { "side": "right", "type": "linear", "range": [ 0.36077330002272584, 0.7061846699772741 ], "ticks": "outside", "title": { "font": { "size": 44, "color": "rgb(0, 0, 0)", "family": "Arial" }, "text": "<b>δ (nm)</b>" }, "anchor": "x3", "domain": [ 0.51, 1 ], "mirror": "ticks", "nticks": 9, "ticklen": 10, "showgrid": false, "showline": true, "tickfont": { "size": 36, "color": "rgb(0, 0, 0)", "family": "Arial" }, "zeroline": false, "autorange": true, "linecolor": "rgb(0, 0, 0)", "linewidth": 2, "tickcolor": "rgb(0, 0, 0)", "tickwidth": 3, "overlaying": false }, "yaxis4": { "side": "right", "type": "linear", "range": [ 25, 75 ], "ticks": "outside", "title": { "font": { "size": 44, "color": "rgb(0, 0, 0)", "family": "Arial" }, "text": "<b>σ (mN m</b><sup><b>-1</b></sup><b>)</b>" }, "anchor": "x4", "domain": [ 0, 0.49 ], "mirror": "ticks", "ticklen": 10, "showgrid": false, "showline": true, "tickfont": { "size": 36, "color": "rgb(0, 0, 0)", "family": "Arial" }, "zeroline": false, "autorange": false, "linecolor": "rgb(0, 0, 0)", "linewidth": 2, "tickcolor": "rgb(0, 0, 0)", "tickwidth": 3, "overlaying": false }, "autosize": true, "template": { "data": { "bar": [ { "type": "bar", "marker": { "colorbar": { "ticks": "", "outlinewidth": 0 } } } ], "table": [ { "type": "table", "cells": { "fill": { "color": "#EBF0F8" }, "line": { "color": "white" } }, "header": { "fill": { "color": "#C8D4E3" }, "line": { "color": "white" } } } ], "carpet": [ { "type": "carpet", "aaxis": { "gridcolor": "#C8D4E3", "linecolor": "#C8D4E3", "endlinecolor": "#2a3f5f", "minorgridcolor": "#C8D4E3", "startlinecolor": "#2a3f5f" }, "baxis": { "gridcolor": "#C8D4E3", "linecolor": "#C8D4E3", "endlinecolor": "#2a3f5f", "minorgridcolor": "#C8D4E3", "startlinecolor": "#2a3f5f" } } ], "mesh3d": [ { "type": "mesh3d", "colorbar": { "ticks": "", "outlinewidth": 0 } } ], "contour": [ { "type": "contour", "colorbar": { "ticks": "", "outlinewidth": 0 }, "autocolorscale": true } ], "heatmap": [ { "type": "heatmap", "colorbar": { "ticks": "", "outlinewidth": 0 }, "autocolorscale": true } ], "scatter": [ { "type": "scatter", "marker": { "colorbar": { "ticks": "", "outlinewidth": 0 } } } ], "surface": [ { "type": "surface", "colorbar": { "ticks": "", "outlinewidth": 0 } } ], "heatmapgl": [ { "type": "heatmapgl", "colorbar": { "ticks": "", "outlinewidth": 0 } } ], "histogram": [ { "type": "histogram", "marker": { "colorbar": { "ticks": "", "outlinewidth": 0 } } } ], "parcoords": [ { "line": { "colorbar": { "ticks": "", "outlinewidth": 0 } }, "type": "parcoords" } ], "scatter3d": [ { "type": "scatter3d", "marker": { "colorbar": { "ticks": "", "outlinewidth": 0 } } } ], "scattergl": [ { "type": "scattergl", "marker": { "colorbar": { "ticks": "", "outlinewidth": 0 } } } ], "choropleth": [ { "type": "choropleth", "colorbar": { "ticks": "", "outlinewidth": 0 } } ], "scattergeo": [ { "type": "scattergeo", "marker": { "colorbar": { "ticks": "", "outlinewidth": 0 } } } ], "histogram2d": [ { "type": "histogram2d", "colorbar": { "ticks": "", "outlinewidth": 0 }, "autocolorscale": true } ], "scatterpolar": [ { "type": "scatterpolar", "marker": { "colorbar": { "ticks": "", "outlinewidth": 0 } } } ], "contourcarpet": [ { "type": "contourcarpet", "colorbar": { "ticks": "", "outlinewidth": 0 } } ], "scattercarpet": [ { "type": "scattercarpet", "marker": { "colorbar": { "ticks": "", "outlinewidth": 0 } } } ], "scattermapbox": [ { "type": "scattermapbox", "marker": { "colorbar": { "ticks": "", "outlinewidth": 0 } } } ], "scatterpolargl": [ { "type": "scatterpolargl", "marker": { "colorbar": { "ticks": "", "outlinewidth": 0 } } } ], "scatterternary": [ { "type": "scatterternary", "marker": { "colorbar": { "ticks": "", "outlinewidth": 0 } } } ], "histogram2dcontour": [ { "type": "histogram2dcontour", "colorbar": { "ticks": "", "outlinewidth": 0 }, "autocolorscale": true } ] }, "layout": { "geo": { "bgcolor": "white", "showland": true, "lakecolor": "white", "landcolor": "white", "showlakes": true, "subunitcolor": "#C8D4E3" }, "font": { "color": "#2a3f5f" }, "polar": { "bgcolor": "white", "radialaxis": { "ticks": "", "gridcolor": "#EBF0F8", "linecolor": "#EBF0F8" }, "angularaxis": { "ticks": "", "gridcolor": "#EBF0F8", "linecolor": "#EBF0F8" } }, "scene": { "xaxis": { "ticks": "", "gridcolor": "#DFE8F3", "gridwidth": 2, "linecolor": "#EBF0F8", "zerolinecolor": "#EBF0F8", "showbackground": true, "backgroundcolor": "white" }, "yaxis": { "ticks": "", "gridcolor": "#DFE8F3", "gridwidth": 2, "linecolor": "#EBF0F8", "zerolinecolor": "#EBF0F8", "showbackground": true, "backgroundcolor": "white" }, "zaxis": { "ticks": "", "gridcolor": "#DFE8F3", "gridwidth": 2, "linecolor": "#EBF0F8", "zerolinecolor": "#EBF0F8", "showbackground": true, "backgroundcolor": "white" } }, "title": { "x": 0.05 }, "xaxis": { "ticks": "", "gridcolor": "#EBF0F8", "linecolor": "#EBF0F8", "automargin": true, "zerolinecolor": "#EBF0F8", "zerolinewidth": 2 }, "yaxis": { "ticks": "", "gridcolor": "#EBF0F8", "linecolor": "#EBF0F8", "automargin": true, "zerolinecolor": "#EBF0F8", "zerolinewidth": 2 }, "ternary": { "aaxis": { "ticks": "", "gridcolor": "#DFE8F3", "linecolor": "#A2B1C6" }, "baxis": { "ticks": "", "gridcolor": "#DFE8F3", "linecolor": "#A2B1C6" }, "caxis": { "ticks": "", "gridcolor": "#DFE8F3", "linecolor": "#A2B1C6" }, "bgcolor": "white" }, "colorway": [ "#636efa", "#EF553B", "#00cc96", "#ab63fa", "#19d3f3", "#e763fa", "#fecb52", "#ffa15a", "#ff6692", "#b6e880" ], "hovermode": "closest", "colorscale": { "diverging": [ [ 0, "#8e0152" ], [ 0.1, "#c51b7d" ], [ 0.2, "#de77ae" ], [ 0.3, "#f1b6da" ], [ 0.4, "#fde0ef" ], [ 0.5, "#f7f7f7" ], [ 0.6, "#e6f5d0" ], [ 0.7, "#b8e186" ], [ 0.8, "#7fbc41" ], [ 0.9, "#4d9221" ], [ 1, "#276419" ] ], "sequential": [ [ 0, "#0508b8" ], [ 0.0893854748603352, "#1910d8" ], [ 0.1787709497206704, "#3c19f0" ], [ 0.2681564245810056, "#6b1cfb" ], [ 0.3575418994413408, "#981cfd" ], [ 0.44692737430167595, "#bf1cfd" ], [ 0.5363128491620112, "#dd2bfd" ], [ 0.6256983240223464, "#f246fe" ], [ 0.7150837988826816, "#fc67fd" ], [ 0.8044692737430168, "#fe88fc" ], [ 0.8938547486033519, "#fea5fd" ], [ 0.9832402234636871, "#febefe" ], [ 1, "#fec3fe" ] ], "sequentialminus": [ [ 0, "#0508b8" ], [ 0.0893854748603352, "#1910d8" ], [ 0.1787709497206704, "#3c19f0" ], [ 0.2681564245810056, "#6b1cfb" ], [ 0.3575418994413408, "#981cfd" ], [ 0.44692737430167595, "#bf1cfd" ], [ 0.5363128491620112, "#dd2bfd" ], [ 0.6256983240223464, "#f246fe" ], [ 0.7150837988826816, "#fc67fd" ], [ 0.8044692737430168, "#fe88fc" ], [ 0.8938547486033519, "#fea5fd" ], [ 0.9832402234636871, "#febefe" ], [ 1, "#fec3fe" ] ] }, "plot_bgcolor": "white", "paper_bgcolor": "white", "shapedefaults": { "line": { "width": 0 }, "opacity": 0.4, "fillcolor": "#506784" }, "annotationdefaults": { "arrowhead": 0, "arrowcolor": "#506784", "arrowwidth": 1 } }, "themeRef": "PLOTLY_WHITE" }, "annotations": [ { "x": 0.0027870680044593255, "y": 0.9388038942976356, "font": { "size": 36, "color": "rgb(0, 0, 0)", "family": "Arial" }, "text": "<b>(a)</b>", "xref": "paper", "yref": "paper", "showarrow": false } ] } }, "height": null, "width": null, "user": { "profile_url": "https://chart-studio.plotly.com/~ishtumpid", "avatar_url": "https://storage.googleapis.com/plotly-prod-profiles/44.jpg", "background_url": "https://storage.googleapis.com/plotly-prod-profiles/bg-11.jpg", "bio": "", "nickname": "", "website": "", "stream_tokens": null, "feature_set_id": null, "csrf_token": null, "date_joined": "2025-04-17 18:18:45", "mapbox_access_tokens": null, "has_password": null, "username": "ishtumpid", "email": null, "is_active": null, "readonly": null, "is_dash_creator": null, "dash_created_count": null, "is_chart_creator": null, "charts_created_count": null } }, { "creation_time": "2025-07-16T12:27:57.898097Z", "comments": { "results": [], "count": 0 }, "parented": true, "embed_url": "https://chart-studio.plotly.com/~lakas.dinges/3.embed", "fid": "lakas.dinges:3", "filename": "Plot 3", "filetype": "plot", "img_url": "https://api.plotly.com/v2/files/lakas.dinges:3/image?image_name=list-thumb", "image_urls": { "default": "https://api.plotly.com/v2/files/lakas.dinges:3/image?image_name=default", "block-thumb": "https://storage.googleapis.com/plotly-prod-images/lakas.dinges/3/8_X7HBOJW06BO0Q7LKWIJ1RW2M8WT78L.png", "list-thumb": "https://api.plotly.com/v2/files/lakas.dinges:3/image?image_name=list-thumb" }, "api_urls": { "files": "https://api.plotly.com/v2/files/lakas.dinges:3", "plots": "https://api.plotly.com/v2/plots/lakas.dinges:3", "parent": "https://api.plotly.com/v2/folders/home?user=lakas.dinges" }, "owner": "lakas.dinges", "parent": -1, "preview": "", "referencers": [], "references": [], "title": "", "views": 0, "web_url": "https://chart-studio.plotly.com/~lakas.dinges/3/", "world_readable": true, "date_modified": "2025-07-16T12:29:58.556Z", "stars": { "results": [], "count": 0 }, "collaborators": { "results": [], "count": 0 }, "subfolder_count": null, "refresh_interval": null, "organize_view_url": "https://chart-studio.plotly.com/~lakas.dinges/3/", "current_user_permission": "read", "is_theme": null, "is_template": false, "autosize": true, "caption": "", "figure": { "data": [ { "meta": { "columnNames": { "x": "A" } }, "mode": "markers", "type": "box", "xsrc": "lakas.dinges:2:bbbb26", "boxpoints": false }, { "meta": { "columnNames": { "x": "B" } }, "type": "box", "xsrc": "lakas.dinges:2:192b94", "boxpoints": false }, { "meta": { "columnNames": { "x": "C" } }, "type": "box", "xsrc": "lakas.dinges:2:6856fa", "boxpoints": false }, { "meta": { "columnNames": { "x": "D" } }, "type": "box", "xsrc": "lakas.dinges:2:8607e6", "boxpoints": false }, { "meta": { "columnNames": { "x": "E" } }, "type": "box", "xsrc": "lakas.dinges:2:f96e1d", "boxpoints": false }, { "meta": { "columnNames": { "x": "F" } }, "type": "box", "xsrc": "lakas.dinges:2:213e37", "boxpoints": false }, { "meta": { "columnNames": { "x": "G" } }, "type": "box", "xsrc": "lakas.dinges:2:811cca", "boxpoints": false } ], "frames": [], "layout": { "xaxis": { "range": [ -28.777777777777786, 726.7777777777778 ], "autorange": true }, "yaxis": { "type": "category", "range": [ -0.5, 6.5 ], "autorange": true }, "autosize": true, "template": { "data": { "bar": [ { "type": "bar", "marker": { "colorbar": { "ticks": "", "outlinewidth": 0 } } } ], "table": [ { "type": "table", "cells": { "fill": { "color": "#EBF0F8" }, "line": { "color": "white" } }, "header": { "fill": { "color": "#C8D4E3" }, "line": { "color": "white" } } } ], "carpet": [ { "type": "carpet", "aaxis": { "gridcolor": "#C8D4E3", "linecolor": "#C8D4E3", "endlinecolor": "#2a3f5f", "minorgridcolor": "#C8D4E3", "startlinecolor": "#2a3f5f" }, "baxis": { "gridcolor": "#C8D4E3", "linecolor": "#C8D4E3", "endlinecolor": "#2a3f5f", "minorgridcolor": "#C8D4E3", "startlinecolor": "#2a3f5f" } } ], "mesh3d": [ { "type": "mesh3d", "colorbar": { "ticks": "", "outlinewidth": 0 } } ], "contour": [ { "type": "contour", "colorbar": { "ticks": "", "outlinewidth": 0 }, "autocolorscale": true } ], "heatmap": [ { "type": "heatmap", "colorbar": { "ticks": "", "outlinewidth": 0 }, "autocolorscale": true } ], "scatter": [ { "type": "scatter", "marker": { "colorbar": { "ticks": "", "outlinewidth": 0 } } } ], "surface": [ { "type": "surface", "colorbar": { "ticks": "", "outlinewidth": 0 } } ], "heatmapgl": [ { "type": "heatmapgl", "colorbar": { "ticks": "", "outlinewidth": 0 } } ], "histogram": [ { "type": "histogram", "marker": { "colorbar": { "ticks": "", "outlinewidth": 0 } } } ], "parcoords": [ { "line": { "colorbar": { "ticks": "", "outlinewidth": 0 } }, "type": "parcoords" } ], "scatter3d": [ { "type": "scatter3d", "marker": { "colorbar": { "ticks": "", "outlinewidth": 0 } } } ], "scattergl": [ { "type": "scattergl", "marker": { "colorbar": { "ticks": "", "outlinewidth": 0 } } } ], "choropleth": [ { "type": "choropleth", "colorbar": { "ticks": "", "outlinewidth": 0 } } ], "scattergeo": [ { "type": "scattergeo", "marker": { "colorbar": { "ticks": "", "outlinewidth": 0 } } } ], "histogram2d": [ { "type": "histogram2d", "colorbar": { "ticks": "", "outlinewidth": 0 }, "autocolorscale": true } ], "scatterpolar": [ { "type": "scatterpolar", "marker": { "colorbar": { "ticks": "", "outlinewidth": 0 } } } ], "contourcarpet": [ { "type": "contourcarpet", "colorbar": { "ticks": "", "outlinewidth": 0 } } ], "scattercarpet": [ { "type": "scattercarpet", "marker": { "colorbar": { "ticks": "", "outlinewidth": 0 } } } ], "scattermapbox": [ { "type": "scattermapbox", "marker": { "colorbar": { "ticks": "", "outlinewidth": 0 } } } ], "scatterpolargl": [ { "type": "scatterpolargl", "marker": { "colorbar": { "ticks": "", "outlinewidth": 0 } } } ], "scatterternary": [ { "type": "scatterternary", "marker": { "colorbar": { "ticks": "", "outlinewidth": 0 } } } ], "histogram2dcontour": [ { "type": "histogram2dcontour", "colorbar": { "ticks": "", "outlinewidth": 0 }, "autocolorscale": true } ] }, "layout": { "geo": { "bgcolor": "white", "showland": true, "lakecolor": "white", "landcolor": "white", "showlakes": true, "subunitcolor": "#C8D4E3" }, "font": { "color": "#2a3f5f" }, "polar": { "bgcolor": "white", "radialaxis": { "ticks": "", "gridcolor": "#EBF0F8", "linecolor": "#EBF0F8" }, "angularaxis": { "ticks": "", "gridcolor": "#EBF0F8", "linecolor": "#EBF0F8" } }, "scene": { "xaxis": { "ticks": "", "gridcolor": "#DFE8F3", "gridwidth": 2, "linecolor": "#EBF0F8", "zerolinecolor": "#EBF0F8", "showbackground": true, "backgroundcolor": "white" }, "yaxis": { "ticks": "", "gridcolor": "#DFE8F3", "gridwidth": 2, "linecolor": "#EBF0F8", "zerolinecolor": "#EBF0F8", "showbackground": true, "backgroundcolor": "white" }, "zaxis": { "ticks": "", "gridcolor": "#DFE8F3", "gridwidth": 2, "linecolor": "#EBF0F8", "zerolinecolor": "#EBF0F8", "showbackground": true, "backgroundcolor": "white" } }, "title": { "x": 0.05 }, "xaxis": { "ticks": "", "gridcolor": "#EBF0F8", "linecolor": "#EBF0F8", "automargin": true, "zerolinecolor": "#EBF0F8", "zerolinewidth": 2 }, "yaxis": { "ticks": "", "gridcolor": "#EBF0F8", "linecolor": "#EBF0F8", "automargin": true, "zerolinecolor": "#EBF0F8", "zerolinewidth": 2 }, "ternary": { "aaxis": { "ticks": "", "gridcolor": "#DFE8F3", "linecolor": "#A2B1C6" }, "baxis": { "ticks": "", "gridcolor": "#DFE8F3", "linecolor": "#A2B1C6" }, "caxis": { "ticks": "", "gridcolor": "#DFE8F3", "linecolor": "#A2B1C6" }, "bgcolor": "white" }, "colorway": [ "#636efa", "#EF553B", "#00cc96", "#ab63fa", "#19d3f3", "#e763fa", "#fecb52", "#ffa15a", "#ff6692", "#b6e880" ], "hovermode": "closest", "colorscale": { "diverging": [ [ 0, "#8e0152" ], [ 0.1, "#c51b7d" ], [ 0.2, "#de77ae" ], [ 0.3, "#f1b6da" ], [ 0.4, "#fde0ef" ], [ 0.5, "#f7f7f7" ], [ 0.6, "#e6f5d0" ], [ 0.7, "#b8e186" ], [ 0.8, "#7fbc41" ], [ 0.9, "#4d9221" ], [ 1, "#276419" ] ], "sequential": [ [ 0, "#0508b8" ], [ 0.0893854748603352, "#1910d8" ], [ 0.1787709497206704, "#3c19f0" ], [ 0.2681564245810056, "#6b1cfb" ], [ 0.3575418994413408, "#981cfd" ], [ 0.44692737430167595, "#bf1cfd" ], [ 0.5363128491620112, "#dd2bfd" ], [ 0.6256983240223464, "#f246fe" ], [ 0.7150837988826816, "#fc67fd" ], [ 0.8044692737430168, "#fe88fc" ], [ 0.8938547486033519, "#fea5fd" ], [ 0.9832402234636871, "#febefe" ], [ 1, "#fec3fe" ] ], "sequentialminus": [ [ 0, "#0508b8" ], [ 0.0893854748603352, "#1910d8" ], [ 0.1787709497206704, "#3c19f0" ], [ 0.2681564245810056, "#6b1cfb" ], [ 0.3575418994413408, "#981cfd" ], [ 0.44692737430167595, "#bf1cfd" ], [ 0.5363128491620112, "#dd2bfd" ], [ 0.6256983240223464, "#f246fe" ], [ 0.7150837988826816, "#fc67fd" ], [ 0.8044692737430168, "#fe88fc" ], [ 0.8938547486033519, "#fea5fd" ], [ 0.9832402234636871, "#febefe" ], [ 1, "#fec3fe" ] ] }, "plot_bgcolor": "white", "paper_bgcolor": "white", "shapedefaults": { "line": { "width": 0 }, "opacity": 0.4, "fillcolor": "#506784" }, "annotationdefaults": { "arrowhead": 0, "arrowcolor": "#506784", "arrowwidth": 1 } }, "themeRef": "PLOTLY_WHITE" } } }, "height": null, "width": null, "user": { "profile_url": "https://chart-studio.plotly.com/~lakas.dinges", "avatar_url": "https://storage.googleapis.com/plotly-prod-profiles/35.jpg", "background_url": "https://storage.googleapis.com/plotly-prod-profiles/bg-7.jpg", "bio": "", "nickname": "", "website": "", "stream_tokens": null, "feature_set_id": null, "csrf_token": null, "date_joined": "2025-07-15 19:10:56", "mapbox_access_tokens": null, "has_password": null, "username": "lakas.dinges", "email": null, "is_active": null, "readonly": null, "is_dash_creator": null, "dash_created_count": null, "is_chart_creator": null, "charts_created_count": null } }, { "creation_time": "2025-07-16T12:15:50.724161Z", "comments": { "results": [], "count": 0 }, "parented": true, "embed_url": "https://chart-studio.plotly.com/~dev.purohit/9.embed", "fid": "dev.purohit:9", "filename": "5% Steps All Documents with % Engagement drop off copy", "filetype": "plot", "img_url": "https://api.plotly.com/v2/files/dev.purohit:9/image?image_name=list-thumb", "image_urls": { "default": "https://api.plotly.com/v2/files/dev.purohit:9/image?image_name=default", "block-thumb": "https://storage.googleapis.com/plotly-prod-images/dev.purohit/9/8_JJ1WYMF44OEDNOK742N8DQA4H6H4QP.png", "list-thumb": "https://api.plotly.com/v2/files/dev.purohit:9/image?image_name=list-thumb" }, "api_urls": { "files": "https://api.plotly.com/v2/files/dev.purohit:9", "plots": "https://api.plotly.com/v2/plots/dev.purohit:9", "parent": "https://api.plotly.com/v2/folders/home?user=dev.purohit" }, "owner": "dev.purohit", "parent": -1, "preview": "", "referencers": [], "references": [], "title": "", "views": 0, "web_url": "https://chart-studio.plotly.com/~dev.purohit/9/", "world_readable": true, "date_modified": "2025-07-16T12:16:11.674Z", "stars": { "results": [], "count": 0 }, "collaborators": { "results": [], "count": 0 }, "subfolder_count": null, "refresh_interval": null, "organize_view_url": "https://chart-studio.plotly.com/~dev.purohit/9/", "current_user_permission": "read", "is_theme": null, "is_template": false, "autosize": true, "caption": "", "figure": { "data": [ { "meta": { "columnNames": { "x": "A", "y": "J" } }, "mode": "lines", "name": "Zero Document", "type": "scatter", "xsrc": "dev.purohit:8:e3ca48", "ysrc": "dev.purohit:8:d4c2ba", "stackgroup": null }, { "meta": { "columnNames": { "x": "A", "y": "B" } }, "mode": "lines", "name": "Very Short", "type": "scatter", "xsrc": "dev.purohit:8:e3ca48", "ysrc": "dev.purohit:8:422d98", "visible": true, "stackgroup": null }, { "meta": { "columnNames": { "x": "A", "y": "C" } }, "mode": "lines", "name": "Short", "type": "scatter", "xsrc": "dev.purohit:8:e3ca48", "ysrc": "dev.purohit:8:1ded34", "xaxis": "x" }, { "meta": { "columnNames": { "x": "A", "y": "D" } }, "mode": "lines", "name": "Standard", "type": "scatter", "xsrc": "dev.purohit:8:e3ca48", "ysrc": "dev.purohit:8:d37dd8", "stackgroup": null }, { "meta": { "columnNames": { "x": "A", "y": "F" } }, "mode": "lines", "name": "Detailed/Technical", "type": "scatter", "xsrc": "dev.purohit:8:e3ca48", "ysrc": "dev.purohit:8:fd003f", "stackgroup": null }, { "meta": { "columnNames": { "x": "A", "y": "G" } }, "mode": "lines", "name": "Long/Complex", "type": "scatter", "xsrc": "dev.purohit:8:e3ca48", "ysrc": "dev.purohit:8:eb58bd", "stackgroup": null }, { "meta": { "columnNames": { "x": "A", "y": "H" } }, "mode": "lines", "name": "Enterprise/Govt", "type": "scatter", "xsrc": "dev.purohit:8:e3ca48", "ysrc": "dev.purohit:8:6ce256", "stackgroup": null }, { "meta": { "columnNames": { "x": "A", "y": "I" } }, "mode": "lines", "name": "Very Large", "type": "scatter", "xsrc": "dev.purohit:8:e3ca48", "ysrc": "dev.purohit:8:1709f7", "stackgroup": null } ], "frames": [], "layout": { "title": { "text": "Total Time Spent fall off for different Stakeholders" }, "xaxis": { "type": "linear", "range": [ 0, 100 ], "autorange": true, "showspikes": false }, "yaxis": { "type": "linear", "range": [ -5.555555555555555, 105.55555555555556 ], "autorange": true, "showspikes": false }, "legend": { "x": 0.8374005848220127, "y": 0.4815941984545565 }, "autosize": true, "dragmode": "pan", "hovermode": "x", "annotations": [ { "x": 18.78396871945259, "y": 86.06630824372759, "ax": 18.9991788856305, "ay": 77.98387096774194, "text": "", "axref": "x", "ayref": "y", "showarrow": false } ] } }, "height": null, "width": null, "user": { "profile_url": "https://chart-studio.plotly.com/~dev.purohit", "avatar_url": "https://storage.googleapis.com/plotly-prod-profiles/22.jpg", "background_url": "https://storage.googleapis.com/plotly-prod-profiles/bg-13.jpg", "bio": "", "nickname": "", "website": "", "stream_tokens": null, "feature_set_id": null, "csrf_token": null, "date_joined": "2025-07-15 13:57:27", "mapbox_access_tokens": null, "has_password": null, "username": "dev.purohit", "email": null, "is_active": null, "readonly": null, "is_dash_creator": null, "dash_created_count": null, "is_chart_creator": null, "charts_created_count": null } }, { "creation_time": "2025-07-16T12:12:13.860406Z", "comments": { "results": [], "count": 0 }, "parented": true, "embed_url": "https://chart-studio.plotly.com/~bruh123456789/1.embed", "fid": "bruh123456789:1", "filename": "Plot 1", "filetype": "plot", "img_url": "https://api.plotly.com/v2/files/bruh123456789:1/image?image_name=list-thumb", "image_urls": { "default": "https://api.plotly.com/v2/files/bruh123456789:1/image?image_name=default", "block-thumb": "https://storage.googleapis.com/plotly-prod-images/bruh123456789/1/8_8SUZF0FUTRWSZ5QX0YU9KQ1UWIGQ5S.png", "list-thumb": "https://api.plotly.com/v2/files/bruh123456789:1/image?image_name=list-thumb" }, "api_urls": { "files": "https://api.plotly.com/v2/files/bruh123456789:1", "plots": "https://api.plotly.com/v2/plots/bruh123456789:1", "parent": "https://api.plotly.com/v2/folders/home?user=bruh123456789" }, "owner": "bruh123456789", "parent": -1, "preview": "", "referencers": [], "references": [], "title": "", "views": 0, "web_url": "https://chart-studio.plotly.com/~bruh123456789/1/", "world_readable": true, "date_modified": "2025-07-16T12:40:08.056Z", "stars": { "results": [], "count": 0 }, "collaborators": { "results": [], "count": 0 }, "subfolder_count": null, "refresh_interval": null, "organize_view_url": "https://chart-studio.plotly.com/~bruh123456789/1/", "current_user_permission": "read", "is_theme": null, "is_template": false, "autosize": false, "caption": "", "figure": { "data": [ { "line": { "shape": "spline", "width": 3 }, "meta": { "columnNames": { "x": "K", "y": "Depth From" } }, "mode": "lines", "name": "K (g/ton)", "type": "scatter", "xsrc": "bruh123456789:0:9e4ed7", "ysrc": "bruh123456789:0:71c859", "yaxis": "y" }, { "line": { "shape": "spline", "width": 3 }, "meta": { "columnNames": { "x": "Ca", "y": "Depth From" } }, "mode": "lines", "name": "Ca (g/ton)", "type": "scatter", "xsrc": "bruh123456789:0:3bc9f2", "ysrc": "bruh123456789:0:71c859", "stackgroup": null } ], "frames": [], "layout": { "title": { "font": { "size": 18 } }, "width": 550, "xaxis": { "type": "linear", "range": [ 0, 29000 ], "autorange": true }, "yaxis": { "type": "linear", "range": [ 839.3670555555556, 840.0259444444445 ], "autorange": true }, "height": 900, "legend": { "title": { "font": { "family": "Arial" }, "text": "Concentrations of" }, "borderwidth": 1 }, "margin": { "b": 0, "l": 0, "r": 0, "t": 0, "pad": 12 }, "autosize": false, "template": { "data": { "bar": [ { "type": "bar", "marker": { "colorbar": { "ticks": "", "outlinewidth": 0 } } } ], "table": [ { "type": "table", "cells": { "fill": { "color": "#EBF0F8" }, "line": { "color": "white" } }, "header": { "fill": { "color": "#C8D4E3" }, "line": { "color": "white" } } } ], "carpet": [ { "type": "carpet", "aaxis": { "gridcolor": "#C8D4E3", "linecolor": "#C8D4E3", "endlinecolor": "#2a3f5f", "minorgridcolor": "#C8D4E3", "startlinecolor": "#2a3f5f" }, "baxis": { "gridcolor": "#C8D4E3", "linecolor": "#C8D4E3", "endlinecolor": "#2a3f5f", "minorgridcolor": "#C8D4E3", "startlinecolor": "#2a3f5f" } } ], "mesh3d": [ { "type": "mesh3d", "colorbar": { "ticks": "", "outlinewidth": 0 } } ], "contour": [ { "type": "contour", "colorbar": { "ticks": "", "outlinewidth": 0 }, "autocolorscale": true } ], "heatmap": [ { "type": "heatmap", "colorbar": { "ticks": "", "outlinewidth": 0 }, "autocolorscale": true } ], "scatter": [ { "type": "scatter", "marker": { "colorbar": { "ticks": "", "outlinewidth": 0 } } } ], "surface": [ { "type": "surface", "colorbar": { "ticks": "", "outlinewidth": 0 } } ], "heatmapgl": [ { "type": "heatmapgl", "colorbar": { "ticks": "", "outlinewidth": 0 } } ], "histogram": [ { "type": "histogram", "marker": { "colorbar": { "ticks": "", "outlinewidth": 0 } } } ], "parcoords": [ { "line": { "colorbar": { "ticks": "", "outlinewidth": 0 } }, "type": "parcoords" } ], "scatter3d": [ { "type": "scatter3d", "marker": { "colorbar": { "ticks": "", "outlinewidth": 0 } } } ], "scattergl": [ { "type": "scattergl", "marker": { "colorbar": { "ticks": "", "outlinewidth": 0 } } } ], "choropleth": [ { "type": "choropleth", "colorbar": { "ticks": "", "outlinewidth": 0 } } ], "scattergeo": [ { "type": "scattergeo", "marker": { "colorbar": { "ticks": "", "outlinewidth": 0 } } } ], "histogram2d": [ { "type": "histogram2d", "colorbar": { "ticks": "", "outlinewidth": 0 }, "autocolorscale": true } ], "scatterpolar": [ { "type": "scatterpolar", "marker": { "colorbar": { "ticks": "", "outlinewidth": 0 } } } ], "contourcarpet": [ { "type": "contourcarpet", "colorbar": { "ticks": "", "outlinewidth": 0 } } ], "scattercarpet": [ { "type": "scattercarpet", "marker": { "colorbar": { "ticks": "", "outlinewidth": 0 } } } ], "scattermapbox": [ { "type": "scattermapbox", "marker": { "colorbar": { "ticks": "", "outlinewidth": 0 } } } ], "scatterpolargl": [ { "type": "scatterpolargl", "marker": { "colorbar": { "ticks": "", "outlinewidth": 0 } } } ], "scatterternary": [ { "type": "scatterternary", "marker": { "colorbar": { "ticks": "", "outlinewidth": 0 } } } ], "histogram2dcontour": [ { "type": "histogram2dcontour", "colorbar": { "ticks": "", "outlinewidth": 0 }, "autocolorscale": true } ] }, "layout": { "geo": { "bgcolor": "white", "showland": true, "lakecolor": "white", "landcolor": "white", "showlakes": true, "subunitcolor": "#C8D4E3" }, "font": { "color": "#2a3f5f" }, "polar": { "bgcolor": "white", "radialaxis": { "ticks": "", "gridcolor": "#EBF0F8", "linecolor": "#EBF0F8" }, "angularaxis": { "ticks": "", "gridcolor": "#EBF0F8", "linecolor": "#EBF0F8" } }, "scene": { "xaxis": { "ticks": "", "gridcolor": "#DFE8F3", "gridwidth": 2, "linecolor": "#EBF0F8", "zerolinecolor": "#EBF0F8", "showbackground": true, "backgroundcolor": "white" }, "yaxis": { "ticks": "", "gridcolor": "#DFE8F3", "gridwidth": 2, "linecolor": "#EBF0F8", "zerolinecolor": "#EBF0F8", "showbackground": true, "backgroundcolor": "white" }, "zaxis": { "ticks": "", "gridcolor": "#DFE8F3", "gridwidth": 2, "linecolor": "#EBF0F8", "zerolinecolor": "#EBF0F8", "showbackground": true, "backgroundcolor": "white" } }, "title": { "x": 0.05 }, "xaxis": { "ticks": "", "gridcolor": "#EBF0F8", "linecolor": "#EBF0F8", "automargin": true, "zerolinecolor": "#EBF0F8", "zerolinewidth": 2 }, "yaxis": { "ticks": "", "gridcolor": "#EBF0F8", "linecolor": "#EBF0F8", "automargin": true, "zerolinecolor": "#EBF0F8", "zerolinewidth": 2 }, "ternary": { "aaxis": { "ticks": "", "gridcolor": "#DFE8F3", "linecolor": "#A2B1C6" }, "baxis": { "ticks": "", "gridcolor": "#DFE8F3", "linecolor": "#A2B1C6" }, "caxis": { "ticks": "", "gridcolor": "#DFE8F3", "linecolor": "#A2B1C6" }, "bgcolor": "white" }, "colorway": [ "#636efa", "#EF553B", "#00cc96", "#ab63fa", "#19d3f3", "#e763fa", "#fecb52", "#ffa15a", "#ff6692", "#b6e880" ], "hovermode": "closest", "colorscale": { "diverging": [ [ 0, "#8e0152" ], [ 0.1, "#c51b7d" ], [ 0.2, "#de77ae" ], [ 0.3, "#f1b6da" ], [ 0.4, "#fde0ef" ], [ 0.5, "#f7f7f7" ], [ 0.6, "#e6f5d0" ], [ 0.7, "#b8e186" ], [ 0.8, "#7fbc41" ], [ 0.9, "#4d9221" ], [ 1, "#276419" ] ], "sequential": [ [ 0, "#0508b8" ], [ 0.0893854748603352, "#1910d8" ], [ 0.1787709497206704, "#3c19f0" ], [ 0.2681564245810056, "#6b1cfb" ], [ 0.3575418994413408, "#981cfd" ], [ 0.44692737430167595, "#bf1cfd" ], [ 0.5363128491620112, "#dd2bfd" ], [ 0.6256983240223464, "#f246fe" ], [ 0.7150837988826816, "#fc67fd" ], [ 0.8044692737430168, "#fe88fc" ], [ 0.8938547486033519, "#fea5fd" ], [ 0.9832402234636871, "#febefe" ], [ 1, "#fec3fe" ] ], "sequentialminus": [ [ 0, "#0508b8" ], [ 0.0893854748603352, "#1910d8" ], [ 0.1787709497206704, "#3c19f0" ], [ 0.2681564245810056, "#6b1cfb" ], [ 0.3575418994413408, "#981cfd" ], [ 0.44692737430167595, "#bf1cfd" ], [ 0.5363128491620112, "#dd2bfd" ], [ 0.6256983240223464, "#f246fe" ], [ 0.7150837988826816, "#fc67fd" ], [ 0.8044692737430168, "#fe88fc" ], [ 0.8938547486033519, "#fea5fd" ], [ 0.9832402234636871, "#febefe" ], [ 1, "#fec3fe" ] ] }, "plot_bgcolor": "white", "paper_bgcolor": "white", "shapedefaults": { "line": { "width": 0 }, "opacity": 0.4, "fillcolor": "#506784" }, "annotationdefaults": { "arrowhead": 0, "arrowcolor": "#506784", "arrowwidth": 1 } }, "themeRef": "PLOTLY_WHITE" } } }, "height": 900, "width": 550, "user": { "profile_url": "https://chart-studio.plotly.com/~bruh123456789", "avatar_url": "https://storage.googleapis.com/plotly-prod-profiles/74.jpg", "background_url": "https://storage.googleapis.com/plotly-prod-profiles/bg-14.jpg", "bio": "", "nickname": "", "website": "", "stream_tokens": null, "feature_set_id": null, "csrf_token": null, "date_joined": "2025-07-16 12:06:36", "mapbox_access_tokens": null, "has_password": null, "username": "bruh123456789", "email": null, "is_active": null, "readonly": null, "is_dash_creator": null, "dash_created_count": null, "is_chart_creator": null, "charts_created_count": null } }, { "creation_time": "2025-07-16T11:14:36.745649Z", "comments": { "results": [], "count": 0 }, "parented": true, "embed_url": "https://chart-studio.plotly.com/~DalyaB/3.embed", "fid": "DalyaB:3", "filename": "Plot 3", "filetype": "plot", "img_url": "https://api.plotly.com/v2/files/DalyaB:3/image?image_name=list-thumb", "image_urls": { "default": "https://storage.googleapis.com/plotly-prod-images/DalyaB/3/2_FT1FOYY9WGX3ABFC2MAH594FUBVN3R.png", "block-thumb": "https://storage.googleapis.com/plotly-prod-images/DalyaB/3/8_TMJW668HM9KWER3F5JRA0ABTXBLNI2.png", "list-thumb": "https://api.plotly.com/v2/files/DalyaB:3/image?image_name=list-thumb" }, "api_urls": { "files": "https://api.plotly.com/v2/files/DalyaB:3", "plots": "https://api.plotly.com/v2/plots/DalyaB:3", "parent": "https://api.plotly.com/v2/folders/home?user=DalyaB" }, "owner": "DalyaB", "parent": -1, "preview": "", "referencers": [], "references": [], "title": "", "views": 0, "web_url": "https://chart-studio.plotly.com/~DalyaB/3/", "world_readable": true, "date_modified": "2025-07-16T11:14:49.834Z", "stars": { "results": [], "count": 0 }, "collaborators": { "results": [], "count": 0 }, "subfolder_count": null, "refresh_interval": null, "organize_view_url": "https://chart-studio.plotly.com/~DalyaB/3/", "current_user_permission": "read", "is_theme": null, "is_template": false, "autosize": true, "caption": "", "figure": { "data": [ { "meta": { "columnNames": { "x": "48-Texas, x; 06-California, x; 17-Illinois, x; 42-Pennsylvania, x; 39-Ohio, x; 36-New York, x; 12-Florida, x; 26-Michigan, x; 13-Georgia, x; 34-New Jersey, x; 37-North Carolina, x; 18-Indiana, x; 47-Tennessee, x; 55-Wisconsin, x; 27-Minnesota, x; 53-Washington, x; 29-Missouri, x; 22-Louisiana, x; 51-Virginia, x; 21-Kentucky, x; 25-Massachusetts, x; 01-Alabama, x; 19-Iowa, x; 20-Kansas, x; 45-South Carolina, x; 08-Colorado, x; 04-Arizona, x; 24-Maryland, x; 40-Oklahoma, x; 09-Connecticut, x; 28-Mississippi, x; 41-Oregon, x; 05-Arkansas, x; 31-Nebraska, x; 49-Utah, x; 38-North Dakota, x; 32-Nevada, x; 54-West Virginia, x; 16-Idaho, x; 35-New Mexico, x; 10-Delaware, x; 33-New Hampshire, x; 46-South Dakota, x; 44-Rhode Island, x; 23-Maine, x; 56-Wyoming, x; 30-Montana, x; 02-Alaska, x; 15-Hawaii, x; 50-Vermont, x; 11-Washington DC, x", "y": "48-Texas, y" } }, "mode": "lines+markers", "name": "48-Texas", "type": "scatter", "xsrc": "DalyaB:2:6ec859", "ysrc": "DalyaB:2:5d23d8" }, { "meta": { "columnNames": { "x": "48-Texas, x; 06-California, x; 17-Illinois, x; 42-Pennsylvania, x; 39-Ohio, x; 36-New York, x; 12-Florida, x; 26-Michigan, x; 13-Georgia, x; 34-New Jersey, x; 37-North Carolina, x; 18-Indiana, x; 47-Tennessee, x; 55-Wisconsin, x; 27-Minnesota, x; 53-Washington, x; 29-Missouri, x; 22-Louisiana, x; 51-Virginia, x; 21-Kentucky, x; 25-Massachusetts, x; 01-Alabama, x; 19-Iowa, x; 20-Kansas, x; 45-South Carolina, x; 08-Colorado, x; 04-Arizona, x; 24-Maryland, x; 40-Oklahoma, x; 09-Connecticut, x; 28-Mississippi, x; 41-Oregon, x; 05-Arkansas, x; 31-Nebraska, x; 49-Utah, x; 38-North Dakota, x; 32-Nevada, x; 54-West Virginia, x; 16-Idaho, x; 35-New Mexico, x; 10-Delaware, x; 33-New Hampshire, x; 46-South Dakota, x; 44-Rhode Island, x; 23-Maine, x; 56-Wyoming, x; 30-Montana, x; 02-Alaska, x; 15-Hawaii, x; 50-Vermont, x; 11-Washington DC, x", "y": "06-California, y" } }, "mode": "lines+markers", "name": "06-California", "type": "scatter", "xsrc": "DalyaB:2:6ec859", "ysrc": "DalyaB:2:8eb845" }, { "meta": { "columnNames": { "x": "48-Texas, x; 06-California, x; 17-Illinois, x; 42-Pennsylvania, x; 39-Ohio, x; 36-New York, x; 12-Florida, x; 26-Michigan, x; 13-Georgia, x; 34-New Jersey, x; 37-North Carolina, x; 18-Indiana, x; 47-Tennessee, x; 55-Wisconsin, x; 27-Minnesota, x; 53-Washington, x; 29-Missouri, x; 22-Louisiana, x; 51-Virginia, x; 21-Kentucky, x; 25-Massachusetts, x; 01-Alabama, x; 19-Iowa, x; 20-Kansas, x; 45-South Carolina, x; 08-Colorado, x; 04-Arizona, x; 24-Maryland, x; 40-Oklahoma, x; 09-Connecticut, x; 28-Mississippi, x; 41-Oregon, x; 05-Arkansas, x; 31-Nebraska, x; 49-Utah, x; 38-North Dakota, x; 32-Nevada, x; 54-West Virginia, x; 16-Idaho, x; 35-New Mexico, x; 10-Delaware, x; 33-New Hampshire, x; 46-South Dakota, x; 44-Rhode Island, x; 23-Maine, x; 56-Wyoming, x; 30-Montana, x; 02-Alaska, x; 15-Hawaii, x; 50-Vermont, x; 11-Washington DC, x", "y": "17-Illinois, y" } }, "mode": "lines+markers", "name": "17-Illinois", "type": "scatter", "xsrc": "DalyaB:2:6ec859", "ysrc": "DalyaB:2:460f1f" }, { "meta": { "columnNames": { "x": "48-Texas, x; 06-California, x; 17-Illinois, x; 42-Pennsylvania, x; 39-Ohio, x; 36-New York, x; 12-Florida, x; 26-Michigan, x; 13-Georgia, x; 34-New Jersey, x; 37-North Carolina, x; 18-Indiana, x; 47-Tennessee, x; 55-Wisconsin, x; 27-Minnesota, x; 53-Washington, x; 29-Missouri, x; 22-Louisiana, x; 51-Virginia, x; 21-Kentucky, x; 25-Massachusetts, x; 01-Alabama, x; 19-Iowa, x; 20-Kansas, x; 45-South Carolina, x; 08-Colorado, x; 04-Arizona, x; 24-Maryland, x; 40-Oklahoma, x; 09-Connecticut, x; 28-Mississippi, x; 41-Oregon, x; 05-Arkansas, x; 31-Nebraska, x; 49-Utah, x; 38-North Dakota, x; 32-Nevada, x; 54-West Virginia, x; 16-Idaho, x; 35-New Mexico, x; 10-Delaware, x; 33-New Hampshire, x; 46-South Dakota, x; 44-Rhode Island, x; 23-Maine, x; 56-Wyoming, x; 30-Montana, x; 02-Alaska, x; 15-Hawaii, x; 50-Vermont, x; 11-Washington DC, x", "y": "42-Pennsylvania, y" } }, "mode": "lines+markers", "name": "42-Pennsylvania", "type": "scatter", "xsrc": "DalyaB:2:6ec859", "ysrc": "DalyaB:2:27ec69" }, { "meta": { "columnNames": { "x": "48-Texas, x; 06-California, x; 17-Illinois, x; 42-Pennsylvania, x; 39-Ohio, x; 36-New York, x; 12-Florida, x; 26-Michigan, x; 13-Georgia, x; 34-New Jersey, x; 37-North Carolina, x; 18-Indiana, x; 47-Tennessee, x; 55-Wisconsin, x; 27-Minnesota, x; 53-Washington, x; 29-Missouri, x; 22-Louisiana, x; 51-Virginia, x; 21-Kentucky, x; 25-Massachusetts, x; 01-Alabama, x; 19-Iowa, x; 20-Kansas, x; 45-South Carolina, x; 08-Colorado, x; 04-Arizona, x; 24-Maryland, x; 40-Oklahoma, x; 09-Connecticut, x; 28-Mississippi, x; 41-Oregon, x; 05-Arkansas, x; 31-Nebraska, x; 49-Utah, x; 38-North Dakota, x; 32-Nevada, x; 54-West Virginia, x; 16-Idaho, x; 35-New Mexico, x; 10-Delaware, x; 33-New Hampshire, x; 46-South Dakota, x; 44-Rhode Island, x; 23-Maine, x; 56-Wyoming, x; 30-Montana, x; 02-Alaska, x; 15-Hawaii, x; 50-Vermont, x; 11-Washington DC, x", "y": "39-Ohio, y" } }, "mode": "lines+markers", "name": "39-Ohio", "type": "scatter", "xsrc": "DalyaB:2:6ec859", "ysrc": "DalyaB:2:f4c732" }, { "meta": { "columnNames": { "x": "48-Texas, x; 06-California, x; 17-Illinois, x; 42-Pennsylvania, x; 39-Ohio, x; 36-New York, x; 12-Florida, x; 26-Michigan, x; 13-Georgia, x; 34-New Jersey, x; 37-North Carolina, x; 18-Indiana, x; 47-Tennessee, x; 55-Wisconsin, x; 27-Minnesota, x; 53-Washington, x; 29-Missouri, x; 22-Louisiana, x; 51-Virginia, x; 21-Kentucky, x; 25-Massachusetts, x; 01-Alabama, x; 19-Iowa, x; 20-Kansas, x; 45-South Carolina, x; 08-Colorado, x; 04-Arizona, x; 24-Maryland, x; 40-Oklahoma, x; 09-Connecticut, x; 28-Mississippi, x; 41-Oregon, x; 05-Arkansas, x; 31-Nebraska, x; 49-Utah, x; 38-North Dakota, x; 32-Nevada, x; 54-West Virginia, x; 16-Idaho, x; 35-New Mexico, x; 10-Delaware, x; 33-New Hampshire, x; 46-South Dakota, x; 44-Rhode Island, x; 23-Maine, x; 56-Wyoming, x; 30-Montana, x; 02-Alaska, x; 15-Hawaii, x; 50-Vermont, x; 11-Washington DC, x", "y": "36-New York, y" } }, "mode": "lines+markers", "name": "36-New York", "type": "scatter", "xsrc": "DalyaB:2:6ec859", "ysrc": "DalyaB:2:e638a3" }, { "meta": { "columnNames": { "x": "48-Texas, x; 06-California, x; 17-Illinois, x; 42-Pennsylvania, x; 39-Ohio, x; 36-New York, x; 12-Florida, x; 26-Michigan, x; 13-Georgia, x; 34-New Jersey, x; 37-North Carolina, x; 18-Indiana, x; 47-Tennessee, x; 55-Wisconsin, x; 27-Minnesota, x; 53-Washington, x; 29-Missouri, x; 22-Louisiana, x; 51-Virginia, x; 21-Kentucky, x; 25-Massachusetts, x; 01-Alabama, x; 19-Iowa, x; 20-Kansas, x; 45-South Carolina, x; 08-Colorado, x; 04-Arizona, x; 24-Maryland, x; 40-Oklahoma, x; 09-Connecticut, x; 28-Mississippi, x; 41-Oregon, x; 05-Arkansas, x; 31-Nebraska, x; 49-Utah, x; 38-North Dakota, x; 32-Nevada, x; 54-West Virginia, x; 16-Idaho, x; 35-New Mexico, x; 10-Delaware, x; 33-New Hampshire, x; 46-South Dakota, x; 44-Rhode Island, x; 23-Maine, x; 56-Wyoming, x; 30-Montana, x; 02-Alaska, x; 15-Hawaii, x; 50-Vermont, x; 11-Washington DC, x", "y": "12-Florida, y" } }, "mode": "lines+markers", "name": "12-Florida", "type": "scatter", "xsrc": "DalyaB:2:6ec859", "ysrc": "DalyaB:2:dca2dd" }, { "meta": { "columnNames": { "x": "48-Texas, x; 06-California, x; 17-Illinois, x; 42-Pennsylvania, x; 39-Ohio, x; 36-New York, x; 12-Florida, x; 26-Michigan, x; 13-Georgia, x; 34-New Jersey, x; 37-North Carolina, x; 18-Indiana, x; 47-Tennessee, x; 55-Wisconsin, x; 27-Minnesota, x; 53-Washington, x; 29-Missouri, x; 22-Louisiana, x; 51-Virginia, x; 21-Kentucky, x; 25-Massachusetts, x; 01-Alabama, x; 19-Iowa, x; 20-Kansas, x; 45-South Carolina, x; 08-Colorado, x; 04-Arizona, x; 24-Maryland, x; 40-Oklahoma, x; 09-Connecticut, x; 28-Mississippi, x; 41-Oregon, x; 05-Arkansas, x; 31-Nebraska, x; 49-Utah, x; 38-North Dakota, x; 32-Nevada, x; 54-West Virginia, x; 16-Idaho, x; 35-New Mexico, x; 10-Delaware, x; 33-New Hampshire, x; 46-South Dakota, x; 44-Rhode Island, x; 23-Maine, x; 56-Wyoming, x; 30-Montana, x; 02-Alaska, x; 15-Hawaii, x; 50-Vermont, x; 11-Washington DC, x", "y": "26-Michigan, y" } }, "mode": "lines+markers", "name": "26-Michigan", "type": "scatter", "xsrc": "DalyaB:2:6ec859", "ysrc": "DalyaB:2:ad701a" }, { "meta": { "columnNames": { "x": "48-Texas, x; 06-California, x; 17-Illinois, x; 42-Pennsylvania, x; 39-Ohio, x; 36-New York, x; 12-Florida, x; 26-Michigan, x; 13-Georgia, x; 34-New Jersey, x; 37-North Carolina, x; 18-Indiana, x; 47-Tennessee, x; 55-Wisconsin, x; 27-Minnesota, x; 53-Washington, x; 29-Missouri, x; 22-Louisiana, x; 51-Virginia, x; 21-Kentucky, x; 25-Massachusetts, x; 01-Alabama, x; 19-Iowa, x; 20-Kansas, x; 45-South Carolina, x; 08-Colorado, x; 04-Arizona, x; 24-Maryland, x; 40-Oklahoma, x; 09-Connecticut, x; 28-Mississippi, x; 41-Oregon, x; 05-Arkansas, x; 31-Nebraska, x; 49-Utah, x; 38-North Dakota, x; 32-Nevada, x; 54-West Virginia, x; 16-Idaho, x; 35-New Mexico, x; 10-Delaware, x; 33-New Hampshire, x; 46-South Dakota, x; 44-Rhode Island, x; 23-Maine, x; 56-Wyoming, x; 30-Montana, x; 02-Alaska, x; 15-Hawaii, x; 50-Vermont, x; 11-Washington DC, x", "y": "13-Georgia, y" } }, "mode": "lines+markers", "name": "13-Georgia", "type": "scatter", "xsrc": "DalyaB:2:6ec859", "ysrc": "DalyaB:2:2000bf" }, { "meta": { "columnNames": { "x": "48-Texas, x; 06-California, x; 17-Illinois, x; 42-Pennsylvania, x; 39-Ohio, x; 36-New York, x; 12-Florida, x; 26-Michigan, x; 13-Georgia, x; 34-New Jersey, x; 37-North Carolina, x; 18-Indiana, x; 47-Tennessee, x; 55-Wisconsin, x; 27-Minnesota, x; 53-Washington, x; 29-Missouri, x; 22-Louisiana, x; 51-Virginia, x; 21-Kentucky, x; 25-Massachusetts, x; 01-Alabama, x; 19-Iowa, x; 20-Kansas, x; 45-South Carolina, x; 08-Colorado, x; 04-Arizona, x; 24-Maryland, x; 40-Oklahoma, x; 09-Connecticut, x; 28-Mississippi, x; 41-Oregon, x; 05-Arkansas, x; 31-Nebraska, x; 49-Utah, x; 38-North Dakota, x; 32-Nevada, x; 54-West Virginia, x; 16-Idaho, x; 35-New Mexico, x; 10-Delaware, x; 33-New Hampshire, x; 46-South Dakota, x; 44-Rhode Island, x; 23-Maine, x; 56-Wyoming, x; 30-Montana, x; 02-Alaska, x; 15-Hawaii, x; 50-Vermont, x; 11-Washington DC, x", "y": "34-New Jersey, y" } }, "mode": "lines+markers", "name": "34-New Jersey", "type": "scatter", "xsrc": "DalyaB:2:6ec859", "ysrc": "DalyaB:2:368689" }, { "meta": { "columnNames": { "x": "48-Texas, x; 06-California, x; 17-Illinois, x; 42-Pennsylvania, x; 39-Ohio, x; 36-New York, x; 12-Florida, x; 26-Michigan, x; 13-Georgia, x; 34-New Jersey, x; 37-North Carolina, x; 18-Indiana, x; 47-Tennessee, x; 55-Wisconsin, x; 27-Minnesota, x; 53-Washington, x; 29-Missouri, x; 22-Louisiana, x; 51-Virginia, x; 21-Kentucky, x; 25-Massachusetts, x; 01-Alabama, x; 19-Iowa, x; 20-Kansas, x; 45-South Carolina, x; 08-Colorado, x; 04-Arizona, x; 24-Maryland, x; 40-Oklahoma, x; 09-Connecticut, x; 28-Mississippi, x; 41-Oregon, x; 05-Arkansas, x; 31-Nebraska, x; 49-Utah, x; 38-North Dakota, x; 32-Nevada, x; 54-West Virginia, x; 16-Idaho, x; 35-New Mexico, x; 10-Delaware, x; 33-New Hampshire, x; 46-South Dakota, x; 44-Rhode Island, x; 23-Maine, x; 56-Wyoming, x; 30-Montana, x; 02-Alaska, x; 15-Hawaii, x; 50-Vermont, x; 11-Washington DC, x", "y": "37-North Carolina, y" } }, "mode": "lines+markers", "name": "37-North Carolina", "type": "scatter", "xsrc": "DalyaB:2:6ec859", "ysrc": "DalyaB:2:21fdec" }, { "meta": { "columnNames": { "x": "48-Texas, x; 06-California, x; 17-Illinois, x; 42-Pennsylvania, x; 39-Ohio, x; 36-New York, x; 12-Florida, x; 26-Michigan, x; 13-Georgia, x; 34-New Jersey, x; 37-North Carolina, x; 18-Indiana, x; 47-Tennessee, x; 55-Wisconsin, x; 27-Minnesota, x; 53-Washington, x; 29-Missouri, x; 22-Louisiana, x; 51-Virginia, x; 21-Kentucky, x; 25-Massachusetts, x; 01-Alabama, x; 19-Iowa, x; 20-Kansas, x; 45-South Carolina, x; 08-Colorado, x; 04-Arizona, x; 24-Maryland, x; 40-Oklahoma, x; 09-Connecticut, x; 28-Mississippi, x; 41-Oregon, x; 05-Arkansas, x; 31-Nebraska, x; 49-Utah, x; 38-North Dakota, x; 32-Nevada, x; 54-West Virginia, x; 16-Idaho, x; 35-New Mexico, x; 10-Delaware, x; 33-New Hampshire, x; 46-South Dakota, x; 44-Rhode Island, x; 23-Maine, x; 56-Wyoming, x; 30-Montana, x; 02-Alaska, x; 15-Hawaii, x; 50-Vermont, x; 11-Washington DC, x", "y": "18-Indiana, y" } }, "mode": "lines+markers", "name": "18-Indiana", "type": "scatter", "xsrc": "DalyaB:2:6ec859", "ysrc": "DalyaB:2:eb2308" }, { "meta": { "columnNames": { "x": "48-Texas, x; 06-California, x; 17-Illinois, x; 42-Pennsylvania, x; 39-Ohio, x; 36-New York, x; 12-Florida, x; 26-Michigan, x; 13-Georgia, x; 34-New Jersey, x; 37-North Carolina, x; 18-Indiana, x; 47-Tennessee, x; 55-Wisconsin, x; 27-Minnesota, x; 53-Washington, x; 29-Missouri, x; 22-Louisiana, x; 51-Virginia, x; 21-Kentucky, x; 25-Massachusetts, x; 01-Alabama, x; 19-Iowa, x; 20-Kansas, x; 45-South Carolina, x; 08-Colorado, x; 04-Arizona, x; 24-Maryland, x; 40-Oklahoma, x; 09-Connecticut, x; 28-Mississippi, x; 41-Oregon, x; 05-Arkansas, x; 31-Nebraska, x; 49-Utah, x; 38-North Dakota, x; 32-Nevada, x; 54-West Virginia, x; 16-Idaho, x; 35-New Mexico, x; 10-Delaware, x; 33-New Hampshire, x; 46-South Dakota, x; 44-Rhode Island, x; 23-Maine, x; 56-Wyoming, x; 30-Montana, x; 02-Alaska, x; 15-Hawaii, x; 50-Vermont, x; 11-Washington DC, x", "y": "47-Tennessee, y" } }, "mode": "lines+markers", "name": "47-Tennessee", "type": "scatter", "xsrc": "DalyaB:2:6ec859", "ysrc": "DalyaB:2:fd47a2" }, { "meta": { "columnNames": { "x": "48-Texas, x; 06-California, x; 17-Illinois, x; 42-Pennsylvania, x; 39-Ohio, x; 36-New York, x; 12-Florida, x; 26-Michigan, x; 13-Georgia, x; 34-New Jersey, x; 37-North Carolina, x; 18-Indiana, x; 47-Tennessee, x; 55-Wisconsin, x; 27-Minnesota, x; 53-Washington, x; 29-Missouri, x; 22-Louisiana, x; 51-Virginia, x; 21-Kentucky, x; 25-Massachusetts, x; 01-Alabama, x; 19-Iowa, x; 20-Kansas, x; 45-South Carolina, x; 08-Colorado, x; 04-Arizona, x; 24-Maryland, x; 40-Oklahoma, x; 09-Connecticut, x; 28-Mississippi, x; 41-Oregon, x; 05-Arkansas, x; 31-Nebraska, x; 49-Utah, x; 38-North Dakota, x; 32-Nevada, x; 54-West Virginia, x; 16-Idaho, x; 35-New Mexico, x; 10-Delaware, x; 33-New Hampshire, x; 46-South Dakota, x; 44-Rhode Island, x; 23-Maine, x; 56-Wyoming, x; 30-Montana, x; 02-Alaska, x; 15-Hawaii, x; 50-Vermont, x; 11-Washington DC, x", "y": "55-Wisconsin, y" } }, "mode": "lines+markers", "name": "55-Wisconsin", "type": "scatter", "xsrc": "DalyaB:2:6ec859", "ysrc": "DalyaB:2:06efa9" }, { "meta": { "columnNames": { "x": "48-Texas, x; 06-California, x; 17-Illinois, x; 42-Pennsylvania, x; 39-Ohio, x; 36-New York, x; 12-Florida, x; 26-Michigan, x; 13-Georgia, x; 34-New Jersey, x; 37-North Carolina, x; 18-Indiana, x; 47-Tennessee, x; 55-Wisconsin, x; 27-Minnesota, x; 53-Washington, x; 29-Missouri, x; 22-Louisiana, x; 51-Virginia, x; 21-Kentucky, x; 25-Massachusetts, x; 01-Alabama, x; 19-Iowa, x; 20-Kansas, x; 45-South Carolina, x; 08-Colorado, x; 04-Arizona, x; 24-Maryland, x; 40-Oklahoma, x; 09-Connecticut, x; 28-Mississippi, x; 41-Oregon, x; 05-Arkansas, x; 31-Nebraska, x; 49-Utah, x; 38-North Dakota, x; 32-Nevada, x; 54-West Virginia, x; 16-Idaho, x; 35-New Mexico, x; 10-Delaware, x; 33-New Hampshire, x; 46-South Dakota, x; 44-Rhode Island, x; 23-Maine, x; 56-Wyoming, x; 30-Montana, x; 02-Alaska, x; 15-Hawaii, x; 50-Vermont, x; 11-Washington DC, x", "y": "27-Minnesota, y" } }, "mode": "lines+markers", "name": "27-Minnesota", "type": "scatter", "xsrc": "DalyaB:2:6ec859", "ysrc": "DalyaB:2:07437d" }, { "meta": { "columnNames": { "x": "48-Texas, x; 06-California, x; 17-Illinois, x; 42-Pennsylvania, x; 39-Ohio, x; 36-New York, x; 12-Florida, x; 26-Michigan, x; 13-Georgia, x; 34-New Jersey, x; 37-North Carolina, x; 18-Indiana, x; 47-Tennessee, x; 55-Wisconsin, x; 27-Minnesota, x; 53-Washington, x; 29-Missouri, x; 22-Louisiana, x; 51-Virginia, x; 21-Kentucky, x; 25-Massachusetts, x; 01-Alabama, x; 19-Iowa, x; 20-Kansas, x; 45-South Carolina, x; 08-Colorado, x; 04-Arizona, x; 24-Maryland, x; 40-Oklahoma, x; 09-Connecticut, x; 28-Mississippi, x; 41-Oregon, x; 05-Arkansas, x; 31-Nebraska, x; 49-Utah, x; 38-North Dakota, x; 32-Nevada, x; 54-West Virginia, x; 16-Idaho, x; 35-New Mexico, x; 10-Delaware, x; 33-New Hampshire, x; 46-South Dakota, x; 44-Rhode Island, x; 23-Maine, x; 56-Wyoming, x; 30-Montana, x; 02-Alaska, x; 15-Hawaii, x; 50-Vermont, x; 11-Washington DC, x", "y": "53-Washington, y" } }, "mode": "lines+markers", "name": "53-Washington", "type": "scatter", "xsrc": "DalyaB:2:6ec859", "ysrc": "DalyaB:2:378946" }, { "meta": { "columnNames": { "x": "48-Texas, x; 06-California, x; 17-Illinois, x; 42-Pennsylvania, x; 39-Ohio, x; 36-New York, x; 12-Florida, x; 26-Michigan, x; 13-Georgia, x; 34-New Jersey, x; 37-North Carolina, x; 18-Indiana, x; 47-Tennessee, x; 55-Wisconsin, x; 27-Minnesota, x; 53-Washington, x; 29-Missouri, x; 22-Louisiana, x; 51-Virginia, x; 21-Kentucky, x; 25-Massachusetts, x; 01-Alabama, x; 19-Iowa, x; 20-Kansas, x; 45-South Carolina, x; 08-Colorado, x; 04-Arizona, x; 24-Maryland, x; 40-Oklahoma, x; 09-Connecticut, x; 28-Mississippi, x; 41-Oregon, x; 05-Arkansas, x; 31-Nebraska, x; 49-Utah, x; 38-North Dakota, x; 32-Nevada, x; 54-West Virginia, x; 16-Idaho, x; 35-New Mexico, x; 10-Delaware, x; 33-New Hampshire, x; 46-South Dakota, x; 44-Rhode Island, x; 23-Maine, x; 56-Wyoming, x; 30-Montana, x; 02-Alaska, x; 15-Hawaii, x; 50-Vermont, x; 11-Washington DC, x", "y": "29-Missouri, y" } }, "mode": "lines+markers", "name": "29-Missouri", "type": "scatter", "xsrc": "DalyaB:2:6ec859", "ysrc": "DalyaB:2:6eb3b7" }, { "meta": { "columnNames": { "x": "48-Texas, x; 06-California, x; 17-Illinois, x; 42-Pennsylvania, x; 39-Ohio, x; 36-New York, x; 12-Florida, x; 26-Michigan, x; 13-Georgia, x; 34-New Jersey, x; 37-North Carolina, x; 18-Indiana, x; 47-Tennessee, x; 55-Wisconsin, x; 27-Minnesota, x; 53-Washington, x; 29-Missouri, x; 22-Louisiana, x; 51-Virginia, x; 21-Kentucky, x; 25-Massachusetts, x; 01-Alabama, x; 19-Iowa, x; 20-Kansas, x; 45-South Carolina, x; 08-Colorado, x; 04-Arizona, x; 24-Maryland, x; 40-Oklahoma, x; 09-Connecticut, x; 28-Mississippi, x; 41-Oregon, x; 05-Arkansas, x; 31-Nebraska, x; 49-Utah, x; 38-North Dakota, x; 32-Nevada, x; 54-West Virginia, x; 16-Idaho, x; 35-New Mexico, x; 10-Delaware, x; 33-New Hampshire, x; 46-South Dakota, x; 44-Rhode Island, x; 23-Maine, x; 56-Wyoming, x; 30-Montana, x; 02-Alaska, x; 15-Hawaii, x; 50-Vermont, x; 11-Washington DC, x", "y": "22-Louisiana, y" } }, "mode": "lines+markers", "name": "22-Louisiana", "type": "scatter", "xsrc": "DalyaB:2:6ec859", "ysrc": "DalyaB:2:d80cac" }, { "meta": { "columnNames": { "x": "48-Texas, x; 06-California, x; 17-Illinois, x; 42-Pennsylvania, x; 39-Ohio, x; 36-New York, x; 12-Florida, x; 26-Michigan, x; 13-Georgia, x; 34-New Jersey, x; 37-North Carolina, x; 18-Indiana, x; 47-Tennessee, x; 55-Wisconsin, x; 27-Minnesota, x; 53-Washington, x; 29-Missouri, x; 22-Louisiana, x; 51-Virginia, x; 21-Kentucky, x; 25-Massachusetts, x; 01-Alabama, x; 19-Iowa, x; 20-Kansas, x; 45-South Carolina, x; 08-Colorado, x; 04-Arizona, x; 24-Maryland, x; 40-Oklahoma, x; 09-Connecticut, x; 28-Mississippi, x; 41-Oregon, x; 05-Arkansas, x; 31-Nebraska, x; 49-Utah, x; 38-North Dakota, x; 32-Nevada, x; 54-West Virginia, x; 16-Idaho, x; 35-New Mexico, x; 10-Delaware, x; 33-New Hampshire, x; 46-South Dakota, x; 44-Rhode Island, x; 23-Maine, x; 56-Wyoming, x; 30-Montana, x; 02-Alaska, x; 15-Hawaii, x; 50-Vermont, x; 11-Washington DC, x", "y": "51-Virginia, y" } }, "mode": "lines+markers", "name": "51-Virginia", "type": "scatter", "xsrc": "DalyaB:2:6ec859", "ysrc": "DalyaB:2:5e3e75" }, { "meta": { "columnNames": { "x": "48-Texas, x; 06-California, x; 17-Illinois, x; 42-Pennsylvania, x; 39-Ohio, x; 36-New York, x; 12-Florida, x; 26-Michigan, x; 13-Georgia, x; 34-New Jersey, x; 37-North Carolina, x; 18-Indiana, x; 47-Tennessee, x; 55-Wisconsin, x; 27-Minnesota, x; 53-Washington, x; 29-Missouri, x; 22-Louisiana, x; 51-Virginia, x; 21-Kentucky, x; 25-Massachusetts, x; 01-Alabama, x; 19-Iowa, x; 20-Kansas, x; 45-South Carolina, x; 08-Colorado, x; 04-Arizona, x; 24-Maryland, x; 40-Oklahoma, x; 09-Connecticut, x; 28-Mississippi, x; 41-Oregon, x; 05-Arkansas, x; 31-Nebraska, x; 49-Utah, x; 38-North Dakota, x; 32-Nevada, x; 54-West Virginia, x; 16-Idaho, x; 35-New Mexico, x; 10-Delaware, x; 33-New Hampshire, x; 46-South Dakota, x; 44-Rhode Island, x; 23-Maine, x; 56-Wyoming, x; 30-Montana, x; 02-Alaska, x; 15-Hawaii, x; 50-Vermont, x; 11-Washington DC, x", "y": "21-Kentucky, y" } }, "mode": "lines+markers", "name": "21-Kentucky", "type": "scatter", "xsrc": "DalyaB:2:6ec859", "ysrc": "DalyaB:2:4ba9df" }, { "meta": { "columnNames": { "x": "48-Texas, x; 06-California, x; 17-Illinois, x; 42-Pennsylvania, x; 39-Ohio, x; 36-New York, x; 12-Florida, x; 26-Michigan, x; 13-Georgia, x; 34-New Jersey, x; 37-North Carolina, x; 18-Indiana, x; 47-Tennessee, x; 55-Wisconsin, x; 27-Minnesota, x; 53-Washington, x; 29-Missouri, x; 22-Louisiana, x; 51-Virginia, x; 21-Kentucky, x; 25-Massachusetts, x; 01-Alabama, x; 19-Iowa, x; 20-Kansas, x; 45-South Carolina, x; 08-Colorado, x; 04-Arizona, x; 24-Maryland, x; 40-Oklahoma, x; 09-Connecticut, x; 28-Mississippi, x; 41-Oregon, x; 05-Arkansas, x; 31-Nebraska, x; 49-Utah, x; 38-North Dakota, x; 32-Nevada, x; 54-West Virginia, x; 16-Idaho, x; 35-New Mexico, x; 10-Delaware, x; 33-New Hampshire, x; 46-South Dakota, x; 44-Rhode Island, x; 23-Maine, x; 56-Wyoming, x; 30-Montana, x; 02-Alaska, x; 15-Hawaii, x; 50-Vermont, x; 11-Washington DC, x", "y": "25-Massachusetts, y" } }, "mode": "lines+markers", "name": "25-Massachusetts", "type": "scatter", "xsrc": "DalyaB:2:6ec859", "ysrc": "DalyaB:2:9e6178" }, { "meta": { "columnNames": { "x": "48-Texas, x; 06-California, x; 17-Illinois, x; 42-Pennsylvania, x; 39-Ohio, x; 36-New York, x; 12-Florida, x; 26-Michigan, x; 13-Georgia, x; 34-New Jersey, x; 37-North Carolina, x; 18-Indiana, x; 47-Tennessee, x; 55-Wisconsin, x; 27-Minnesota, x; 53-Washington, x; 29-Missouri, x; 22-Louisiana, x; 51-Virginia, x; 21-Kentucky, x; 25-Massachusetts, x; 01-Alabama, x; 19-Iowa, x; 20-Kansas, x; 45-South Carolina, x; 08-Colorado, x; 04-Arizona, x; 24-Maryland, x; 40-Oklahoma, x; 09-Connecticut, x; 28-Mississippi, x; 41-Oregon, x; 05-Arkansas, x; 31-Nebraska, x; 49-Utah, x; 38-North Dakota, x; 32-Nevada, x; 54-West Virginia, x; 16-Idaho, x; 35-New Mexico, x; 10-Delaware, x; 33-New Hampshire, x; 46-South Dakota, x; 44-Rhode Island, x; 23-Maine, x; 56-Wyoming, x; 30-Montana, x; 02-Alaska, x; 15-Hawaii, x; 50-Vermont, x; 11-Washington DC, x", "y": "01-Alabama, y" } }, "mode": "lines+markers", "name": "01-Alabama", "type": "scatter", "xsrc": "DalyaB:2:6ec859", "ysrc": "DalyaB:2:4ab10c" }, { "meta": { "columnNames": { "x": "48-Texas, x; 06-California, x; 17-Illinois, x; 42-Pennsylvania, x; 39-Ohio, x; 36-New York, x; 12-Florida, x; 26-Michigan, x; 13-Georgia, x; 34-New Jersey, x; 37-North Carolina, x; 18-Indiana, x; 47-Tennessee, x; 55-Wisconsin, x; 27-Minnesota, x; 53-Washington, x; 29-Missouri, x; 22-Louisiana, x; 51-Virginia, x; 21-Kentucky, x; 25-Massachusetts, x; 01-Alabama, x; 19-Iowa, x; 20-Kansas, x; 45-South Carolina, x; 08-Colorado, x; 04-Arizona, x; 24-Maryland, x; 40-Oklahoma, x; 09-Connecticut, x; 28-Mississippi, x; 41-Oregon, x; 05-Arkansas, x; 31-Nebraska, x; 49-Utah, x; 38-North Dakota, x; 32-Nevada, x; 54-West Virginia, x; 16-Idaho, x; 35-New Mexico, x; 10-Delaware, x; 33-New Hampshire, x; 46-South Dakota, x; 44-Rhode Island, x; 23-Maine, x; 56-Wyoming, x; 30-Montana, x; 02-Alaska, x; 15-Hawaii, x; 50-Vermont, x; 11-Washington DC, x", "y": "19-Iowa, y" } }, "mode": "lines+markers", "name": "19-Iowa", "type": "scatter", "xsrc": "DalyaB:2:6ec859", "ysrc": "DalyaB:2:48ad72" }, { "meta": { "columnNames": { "x": "48-Texas, x; 06-California, x; 17-Illinois, x; 42-Pennsylvania, x; 39-Ohio, x; 36-New York, x; 12-Florida, x; 26-Michigan, x; 13-Georgia, x; 34-New Jersey, x; 37-North Carolina, x; 18-Indiana, x; 47-Tennessee, x; 55-Wisconsin, x; 27-Minnesota, x; 53-Washington, x; 29-Missouri, x; 22-Louisiana, x; 51-Virginia, x; 21-Kentucky, x; 25-Massachusetts, x; 01-Alabama, x; 19-Iowa, x; 20-Kansas, x; 45-South Carolina, x; 08-Colorado, x; 04-Arizona, x; 24-Maryland, x; 40-Oklahoma, x; 09-Connecticut, x; 28-Mississippi, x; 41-Oregon, x; 05-Arkansas, x; 31-Nebraska, x; 49-Utah, x; 38-North Dakota, x; 32-Nevada, x; 54-West Virginia, x; 16-Idaho, x; 35-New Mexico, x; 10-Delaware, x; 33-New Hampshire, x; 46-South Dakota, x; 44-Rhode Island, x; 23-Maine, x; 56-Wyoming, x; 30-Montana, x; 02-Alaska, x; 15-Hawaii, x; 50-Vermont, x; 11-Washington DC, x", "y": "20-Kansas, y" } }, "mode": "lines+markers", "name": "20-Kansas", "type": "scatter", "xsrc": "DalyaB:2:6ec859", "ysrc": "DalyaB:2:3f6fdd" }, { "meta": { "columnNames": { "x": "48-Texas, x; 06-California, x; 17-Illinois, x; 42-Pennsylvania, x; 39-Ohio, x; 36-New York, x; 12-Florida, x; 26-Michigan, x; 13-Georgia, x; 34-New Jersey, x; 37-North Carolina, x; 18-Indiana, x; 47-Tennessee, x; 55-Wisconsin, x; 27-Minnesota, x; 53-Washington, x; 29-Missouri, x; 22-Louisiana, x; 51-Virginia, x; 21-Kentucky, x; 25-Massachusetts, x; 01-Alabama, x; 19-Iowa, x; 20-Kansas, x; 45-South Carolina, x; 08-Colorado, x; 04-Arizona, x; 24-Maryland, x; 40-Oklahoma, x; 09-Connecticut, x; 28-Mississippi, x; 41-Oregon, x; 05-Arkansas, x; 31-Nebraska, x; 49-Utah, x; 38-North Dakota, x; 32-Nevada, x; 54-West Virginia, x; 16-Idaho, x; 35-New Mexico, x; 10-Delaware, x; 33-New Hampshire, x; 46-South Dakota, x; 44-Rhode Island, x; 23-Maine, x; 56-Wyoming, x; 30-Montana, x; 02-Alaska, x; 15-Hawaii, x; 50-Vermont, x; 11-Washington DC, x", "y": "45-South Carolina, y" } }, "mode": "lines+markers", "name": "45-South Carolina", "type": "scatter", "xsrc": "DalyaB:2:6ec859", "ysrc": "DalyaB:2:81d175" }, { "meta": { "columnNames": { "x": "48-Texas, x; 06-California, x; 17-Illinois, x; 42-Pennsylvania, x; 39-Ohio, x; 36-New York, x; 12-Florida, x; 26-Michigan, x; 13-Georgia, x; 34-New Jersey, x; 37-North Carolina, x; 18-Indiana, x; 47-Tennessee, x; 55-Wisconsin, x; 27-Minnesota, x; 53-Washington, x; 29-Missouri, x; 22-Louisiana, x; 51-Virginia, x; 21-Kentucky, x; 25-Massachusetts, x; 01-Alabama, x; 19-Iowa, x; 20-Kansas, x; 45-South Carolina, x; 08-Colorado, x; 04-Arizona, x; 24-Maryland, x; 40-Oklahoma, x; 09-Connecticut, x; 28-Mississippi, x; 41-Oregon, x; 05-Arkansas, x; 31-Nebraska, x; 49-Utah, x; 38-North Dakota, x; 32-Nevada, x; 54-West Virginia, x; 16-Idaho, x; 35-New Mexico, x; 10-Delaware, x; 33-New Hampshire, x; 46-South Dakota, x; 44-Rhode Island, x; 23-Maine, x; 56-Wyoming, x; 30-Montana, x; 02-Alaska, x; 15-Hawaii, x; 50-Vermont, x; 11-Washington DC, x", "y": "08-Colorado, y" } }, "mode": "lines+markers", "name": "08-Colorado", "type": "scatter", "xsrc": "DalyaB:2:6ec859", "ysrc": "DalyaB:2:1ba798" }, { "meta": { "columnNames": { "x": "48-Texas, x; 06-California, x; 17-Illinois, x; 42-Pennsylvania, x; 39-Ohio, x; 36-New York, x; 12-Florida, x; 26-Michigan, x; 13-Georgia, x; 34-New Jersey, x; 37-North Carolina, x; 18-Indiana, x; 47-Tennessee, x; 55-Wisconsin, x; 27-Minnesota, x; 53-Washington, x; 29-Missouri, x; 22-Louisiana, x; 51-Virginia, x; 21-Kentucky, x; 25-Massachusetts, x; 01-Alabama, x; 19-Iowa, x; 20-Kansas, x; 45-South Carolina, x; 08-Colorado, x; 04-Arizona, x; 24-Maryland, x; 40-Oklahoma, x; 09-Connecticut, x; 28-Mississippi, x; 41-Oregon, x; 05-Arkansas, x; 31-Nebraska, x; 49-Utah, x; 38-North Dakota, x; 32-Nevada, x; 54-West Virginia, x; 16-Idaho, x; 35-New Mexico, x; 10-Delaware, x; 33-New Hampshire, x; 46-South Dakota, x; 44-Rhode Island, x; 23-Maine, x; 56-Wyoming, x; 30-Montana, x; 02-Alaska, x; 15-Hawaii, x; 50-Vermont, x; 11-Washington DC, x", "y": "04-Arizona, y" } }, "mode": "lines+markers", "name": "04-Arizona", "type": "scatter", "xsrc": "DalyaB:2:6ec859", "ysrc": "DalyaB:2:68166a" }, { "meta": { "columnNames": { "x": "48-Texas, x; 06-California, x; 17-Illinois, x; 42-Pennsylvania, x; 39-Ohio, x; 36-New York, x; 12-Florida, x; 26-Michigan, x; 13-Georgia, x; 34-New Jersey, x; 37-North Carolina, x; 18-Indiana, x; 47-Tennessee, x; 55-Wisconsin, x; 27-Minnesota, x; 53-Washington, x; 29-Missouri, x; 22-Louisiana, x; 51-Virginia, x; 21-Kentucky, x; 25-Massachusetts, x; 01-Alabama, x; 19-Iowa, x; 20-Kansas, x; 45-South Carolina, x; 08-Colorado, x; 04-Arizona, x; 24-Maryland, x; 40-Oklahoma, x; 09-Connecticut, x; 28-Mississippi, x; 41-Oregon, x; 05-Arkansas, x; 31-Nebraska, x; 49-Utah, x; 38-North Dakota, x; 32-Nevada, x; 54-West Virginia, x; 16-Idaho, x; 35-New Mexico, x; 10-Delaware, x; 33-New Hampshire, x; 46-South Dakota, x; 44-Rhode Island, x; 23-Maine, x; 56-Wyoming, x; 30-Montana, x; 02-Alaska, x; 15-Hawaii, x; 50-Vermont, x; 11-Washington DC, x", "y": "24-Maryland, y" } }, "mode": "lines+markers", "name": "24-Maryland", "type": "scatter", "xsrc": "DalyaB:2:6ec859", "ysrc": "DalyaB:2:72e17b" }, { "meta": { "columnNames": { "x": "48-Texas, x; 06-California, x; 17-Illinois, x; 42-Pennsylvania, x; 39-Ohio, x; 36-New York, x; 12-Florida, x; 26-Michigan, x; 13-Georgia, x; 34-New Jersey, x; 37-North Carolina, x; 18-Indiana, x; 47-Tennessee, x; 55-Wisconsin, x; 27-Minnesota, x; 53-Washington, x; 29-Missouri, x; 22-Louisiana, x; 51-Virginia, x; 21-Kentucky, x; 25-Massachusetts, x; 01-Alabama, x; 19-Iowa, x; 20-Kansas, x; 45-South Carolina, x; 08-Colorado, x; 04-Arizona, x; 24-Maryland, x; 40-Oklahoma, x; 09-Connecticut, x; 28-Mississippi, x; 41-Oregon, x; 05-Arkansas, x; 31-Nebraska, x; 49-Utah, x; 38-North Dakota, x; 32-Nevada, x; 54-West Virginia, x; 16-Idaho, x; 35-New Mexico, x; 10-Delaware, x; 33-New Hampshire, x; 46-South Dakota, x; 44-Rhode Island, x; 23-Maine, x; 56-Wyoming, x; 30-Montana, x; 02-Alaska, x; 15-Hawaii, x; 50-Vermont, x; 11-Washington DC, x", "y": "40-Oklahoma, y" } }, "mode": "lines+markers", "name": "40-Oklahoma", "type": "scatter", "xsrc": "DalyaB:2:6ec859", "ysrc": "DalyaB:2:161d6e" }, { "meta": { "columnNames": { "x": "48-Texas, x; 06-California, x; 17-Illinois, x; 42-Pennsylvania, x; 39-Ohio, x; 36-New York, x; 12-Florida, x; 26-Michigan, x; 13-Georgia, x; 34-New Jersey, x; 37-North Carolina, x; 18-Indiana, x; 47-Tennessee, x; 55-Wisconsin, x; 27-Minnesota, x; 53-Washington, x; 29-Missouri, x; 22-Louisiana, x; 51-Virginia, x; 21-Kentucky, x; 25-Massachusetts, x; 01-Alabama, x; 19-Iowa, x; 20-Kansas, x; 45-South Carolina, x; 08-Colorado, x; 04-Arizona, x; 24-Maryland, x; 40-Oklahoma, x; 09-Connecticut, x; 28-Mississippi, x; 41-Oregon, x; 05-Arkansas, x; 31-Nebraska, x; 49-Utah, x; 38-North Dakota, x; 32-Nevada, x; 54-West Virginia, x; 16-Idaho, x; 35-New Mexico, x; 10-Delaware, x; 33-New Hampshire, x; 46-South Dakota, x; 44-Rhode Island, x; 23-Maine, x; 56-Wyoming, x; 30-Montana, x; 02-Alaska, x; 15-Hawaii, x; 50-Vermont, x; 11-Washington DC, x", "y": "09-Connecticut, y" } }, "mode": "lines+markers", "name": "09-Connecticut", "type": "scatter", "xsrc": "DalyaB:2:6ec859", "ysrc": "DalyaB:2:97b3ca" }, { "meta": { "columnNames": { "x": "48-Texas, x; 06-California, x; 17-Illinois, x; 42-Pennsylvania, x; 39-Ohio, x; 36-New York, x; 12-Florida, x; 26-Michigan, x; 13-Georgia, x; 34-New Jersey, x; 37-North Carolina, x; 18-Indiana, x; 47-Tennessee, x; 55-Wisconsin, x; 27-Minnesota, x; 53-Washington, x; 29-Missouri, x; 22-Louisiana, x; 51-Virginia, x; 21-Kentucky, x; 25-Massachusetts, x; 01-Alabama, x; 19-Iowa, x; 20-Kansas, x; 45-South Carolina, x; 08-Colorado, x; 04-Arizona, x; 24-Maryland, x; 40-Oklahoma, x; 09-Connecticut, x; 28-Mississippi, x; 41-Oregon, x; 05-Arkansas, x; 31-Nebraska, x; 49-Utah, x; 38-North Dakota, x; 32-Nevada, x; 54-West Virginia, x; 16-Idaho, x; 35-New Mexico, x; 10-Delaware, x; 33-New Hampshire, x; 46-South Dakota, x; 44-Rhode Island, x; 23-Maine, x; 56-Wyoming, x; 30-Montana, x; 02-Alaska, x; 15-Hawaii, x; 50-Vermont, x; 11-Washington DC, x", "y": "28-Mississippi, y" } }, "mode": "lines+markers", "name": "28-Mississippi", "type": "scatter", "xsrc": "DalyaB:2:6ec859", "ysrc": "DalyaB:2:7c1428" }, { "meta": { "columnNames": { "x": "48-Texas, x; 06-California, x; 17-Illinois, x; 42-Pennsylvania, x; 39-Ohio, x; 36-New York, x; 12-Florida, x; 26-Michigan, x; 13-Georgia, x; 34-New Jersey, x; 37-North Carolina, x; 18-Indiana, x; 47-Tennessee, x; 55-Wisconsin, x; 27-Minnesota, x; 53-Washington, x; 29-Missouri, x; 22-Louisiana, x; 51-Virginia, x; 21-Kentucky, x; 25-Massachusetts, x; 01-Alabama, x; 19-Iowa, x; 20-Kansas, x; 45-South Carolina, x; 08-Colorado, x; 04-Arizona, x; 24-Maryland, x; 40-Oklahoma, x; 09-Connecticut, x; 28-Mississippi, x; 41-Oregon, x; 05-Arkansas, x; 31-Nebraska, x; 49-Utah, x; 38-North Dakota, x; 32-Nevada, x; 54-West Virginia, x; 16-Idaho, x; 35-New Mexico, x; 10-Delaware, x; 33-New Hampshire, x; 46-South Dakota, x; 44-Rhode Island, x; 23-Maine, x; 56-Wyoming, x; 30-Montana, x; 02-Alaska, x; 15-Hawaii, x; 50-Vermont, x; 11-Washington DC, x", "y": "41-Oregon, y" } }, "mode": "lines+markers", "name": "41-Oregon", "type": "scatter", "xsrc": "DalyaB:2:6ec859", "ysrc": "DalyaB:2:68eca4" }, { "meta": { "columnNames": { "x": "48-Texas, x; 06-California, x; 17-Illinois, x; 42-Pennsylvania, x; 39-Ohio, x; 36-New York, x; 12-Florida, x; 26-Michigan, x; 13-Georgia, x; 34-New Jersey, x; 37-North Carolina, x; 18-Indiana, x; 47-Tennessee, x; 55-Wisconsin, x; 27-Minnesota, x; 53-Washington, x; 29-Missouri, x; 22-Louisiana, x; 51-Virginia, x; 21-Kentucky, x; 25-Massachusetts, x; 01-Alabama, x; 19-Iowa, x; 20-Kansas, x; 45-South Carolina, x; 08-Colorado, x; 04-Arizona, x; 24-Maryland, x; 40-Oklahoma, x; 09-Connecticut, x; 28-Mississippi, x; 41-Oregon, x; 05-Arkansas, x; 31-Nebraska, x; 49-Utah, x; 38-North Dakota, x; 32-Nevada, x; 54-West Virginia, x; 16-Idaho, x; 35-New Mexico, x; 10-Delaware, x; 33-New Hampshire, x; 46-South Dakota, x; 44-Rhode Island, x; 23-Maine, x; 56-Wyoming, x; 30-Montana, x; 02-Alaska, x; 15-Hawaii, x; 50-Vermont, x; 11-Washington DC, x", "y": "05-Arkansas, y" } }, "mode": "lines+markers", "name": "05-Arkansas", "type": "scatter", "xsrc": "DalyaB:2:6ec859", "ysrc": "DalyaB:2:32cc1c" }, { "meta": { "columnNames": { "x": "48-Texas, x; 06-California, x; 17-Illinois, x; 42-Pennsylvania, x; 39-Ohio, x; 36-New York, x; 12-Florida, x; 26-Michigan, x; 13-Georgia, x; 34-New Jersey, x; 37-North Carolina, x; 18-Indiana, x; 47-Tennessee, x; 55-Wisconsin, x; 27-Minnesota, x; 53-Washington, x; 29-Missouri, x; 22-Louisiana, x; 51-Virginia, x; 21-Kentucky, x; 25-Massachusetts, x; 01-Alabama, x; 19-Iowa, x; 20-Kansas, x; 45-South Carolina, x; 08-Colorado, x; 04-Arizona, x; 24-Maryland, x; 40-Oklahoma, x; 09-Connecticut, x; 28-Mississippi, x; 41-Oregon, x; 05-Arkansas, x; 31-Nebraska, x; 49-Utah, x; 38-North Dakota, x; 32-Nevada, x; 54-West Virginia, x; 16-Idaho, x; 35-New Mexico, x; 10-Delaware, x; 33-New Hampshire, x; 46-South Dakota, x; 44-Rhode Island, x; 23-Maine, x; 56-Wyoming, x; 30-Montana, x; 02-Alaska, x; 15-Hawaii, x; 50-Vermont, x; 11-Washington DC, x", "y": "31-Nebraska, y" } }, "mode": "lines+markers", "name": "31-Nebraska", "type": "scatter", "xsrc": "DalyaB:2:6ec859", "ysrc": "DalyaB:2:d54417" }, { "meta": { "columnNames": { "x": "48-Texas, x; 06-California, x; 17-Illinois, x; 42-Pennsylvania, x; 39-Ohio, x; 36-New York, x; 12-Florida, x; 26-Michigan, x; 13-Georgia, x; 34-New Jersey, x; 37-North Carolina, x; 18-Indiana, x; 47-Tennessee, x; 55-Wisconsin, x; 27-Minnesota, x; 53-Washington, x; 29-Missouri, x; 22-Louisiana, x; 51-Virginia, x; 21-Kentucky, x; 25-Massachusetts, x; 01-Alabama, x; 19-Iowa, x; 20-Kansas, x; 45-South Carolina, x; 08-Colorado, x; 04-Arizona, x; 24-Maryland, x; 40-Oklahoma, x; 09-Connecticut, x; 28-Mississippi, x; 41-Oregon, x; 05-Arkansas, x; 31-Nebraska, x; 49-Utah, x; 38-North Dakota, x; 32-Nevada, x; 54-West Virginia, x; 16-Idaho, x; 35-New Mexico, x; 10-Delaware, x; 33-New Hampshire, x; 46-South Dakota, x; 44-Rhode Island, x; 23-Maine, x; 56-Wyoming, x; 30-Montana, x; 02-Alaska, x; 15-Hawaii, x; 50-Vermont, x; 11-Washington DC, x", "y": "49-Utah, y" } }, "mode": "lines+markers", "name": "49-Utah", "type": "scatter", "xsrc": "DalyaB:2:6ec859", "ysrc": "DalyaB:2:2e520e" }, { "meta": { "columnNames": { "x": "48-Texas, x; 06-California, x; 17-Illinois, x; 42-Pennsylvania, x; 39-Ohio, x; 36-New York, x; 12-Florida, x; 26-Michigan, x; 13-Georgia, x; 34-New Jersey, x; 37-North Carolina, x; 18-Indiana, x; 47-Tennessee, x; 55-Wisconsin, x; 27-Minnesota, x; 53-Washington, x; 29-Missouri, x; 22-Louisiana, x; 51-Virginia, x; 21-Kentucky, x; 25-Massachusetts, x; 01-Alabama, x; 19-Iowa, x; 20-Kansas, x; 45-South Carolina, x; 08-Colorado, x; 04-Arizona, x; 24-Maryland, x; 40-Oklahoma, x; 09-Connecticut, x; 28-Mississippi, x; 41-Oregon, x; 05-Arkansas, x; 31-Nebraska, x; 49-Utah, x; 38-North Dakota, x; 32-Nevada, x; 54-West Virginia, x; 16-Idaho, x; 35-New Mexico, x; 10-Delaware, x; 33-New Hampshire, x; 46-South Dakota, x; 44-Rhode Island, x; 23-Maine, x; 56-Wyoming, x; 30-Montana, x; 02-Alaska, x; 15-Hawaii, x; 50-Vermont, x; 11-Washington DC, x", "y": "38-North Dakota, y" } }, "mode": "lines+markers", "name": "38-North Dakota", "type": "scatter", "xsrc": "DalyaB:2:6ec859", "ysrc": "DalyaB:2:679f43" }, { "meta": { "columnNames": { "x": "48-Texas, x; 06-California, x; 17-Illinois, x; 42-Pennsylvania, x; 39-Ohio, x; 36-New York, x; 12-Florida, x; 26-Michigan, x; 13-Georgia, x; 34-New Jersey, x; 37-North Carolina, x; 18-Indiana, x; 47-Tennessee, x; 55-Wisconsin, x; 27-Minnesota, x; 53-Washington, x; 29-Missouri, x; 22-Louisiana, x; 51-Virginia, x; 21-Kentucky, x; 25-Massachusetts, x; 01-Alabama, x; 19-Iowa, x; 20-Kansas, x; 45-South Carolina, x; 08-Colorado, x; 04-Arizona, x; 24-Maryland, x; 40-Oklahoma, x; 09-Connecticut, x; 28-Mississippi, x; 41-Oregon, x; 05-Arkansas, x; 31-Nebraska, x; 49-Utah, x; 38-North Dakota, x; 32-Nevada, x; 54-West Virginia, x; 16-Idaho, x; 35-New Mexico, x; 10-Delaware, x; 33-New Hampshire, x; 46-South Dakota, x; 44-Rhode Island, x; 23-Maine, x; 56-Wyoming, x; 30-Montana, x; 02-Alaska, x; 15-Hawaii, x; 50-Vermont, x; 11-Washington DC, x", "y": "32-Nevada, y" } }, "mode": "lines+markers", "name": "32-Nevada", "type": "scatter", "xsrc": "DalyaB:2:6ec859", "ysrc": "DalyaB:2:3e352d" }, { "meta": { "columnNames": { "x": "48-Texas, x; 06-California, x; 17-Illinois, x; 42-Pennsylvania, x; 39-Ohio, x; 36-New York, x; 12-Florida, x; 26-Michigan, x; 13-Georgia, x; 34-New Jersey, x; 37-North Carolina, x; 18-Indiana, x; 47-Tennessee, x; 55-Wisconsin, x; 27-Minnesota, x; 53-Washington, x; 29-Missouri, x; 22-Louisiana, x; 51-Virginia, x; 21-Kentucky, x; 25-Massachusetts, x; 01-Alabama, x; 19-Iowa, x; 20-Kansas, x; 45-South Carolina, x; 08-Colorado, x; 04-Arizona, x; 24-Maryland, x; 40-Oklahoma, x; 09-Connecticut, x; 28-Mississippi, x; 41-Oregon, x; 05-Arkansas, x; 31-Nebraska, x; 49-Utah, x; 38-North Dakota, x; 32-Nevada, x; 54-West Virginia, x; 16-Idaho, x; 35-New Mexico, x; 10-Delaware, x; 33-New Hampshire, x; 46-South Dakota, x; 44-Rhode Island, x; 23-Maine, x; 56-Wyoming, x; 30-Montana, x; 02-Alaska, x; 15-Hawaii, x; 50-Vermont, x; 11-Washington DC, x", "y": "54-West Virginia, y" } }, "mode": "lines+markers", "name": "54-West Virginia", "type": "scatter", "xsrc": "DalyaB:2:6ec859", "ysrc": "DalyaB:2:166201" }, { "meta": { "columnNames": { "x": "48-Texas, x; 06-California, x; 17-Illinois, x; 42-Pennsylvania, x; 39-Ohio, x; 36-New York, x; 12-Florida, x; 26-Michigan, x; 13-Georgia, x; 34-New Jersey, x; 37-North Carolina, x; 18-Indiana, x; 47-Tennessee, x; 55-Wisconsin, x; 27-Minnesota, x; 53-Washington, x; 29-Missouri, x; 22-Louisiana, x; 51-Virginia, x; 21-Kentucky, x; 25-Massachusetts, x; 01-Alabama, x; 19-Iowa, x; 20-Kansas, x; 45-South Carolina, x; 08-Colorado, x; 04-Arizona, x; 24-Maryland, x; 40-Oklahoma, x; 09-Connecticut, x; 28-Mississippi, x; 41-Oregon, x; 05-Arkansas, x; 31-Nebraska, x; 49-Utah, x; 38-North Dakota, x; 32-Nevada, x; 54-West Virginia, x; 16-Idaho, x; 35-New Mexico, x; 10-Delaware, x; 33-New Hampshire, x; 46-South Dakota, x; 44-Rhode Island, x; 23-Maine, x; 56-Wyoming, x; 30-Montana, x; 02-Alaska, x; 15-Hawaii, x; 50-Vermont, x; 11-Washington DC, x", "y": "16-Idaho, y" } }, "mode": "lines+markers", "name": "16-Idaho", "type": "scatter", "xsrc": "DalyaB:2:6ec859", "ysrc": "DalyaB:2:28d397" }, { "meta": { "columnNames": { "x": "48-Texas, x; 06-California, x; 17-Illinois, x; 42-Pennsylvania, x; 39-Ohio, x; 36-New York, x; 12-Florida, x; 26-Michigan, x; 13-Georgia, x; 34-New Jersey, x; 37-North Carolina, x; 18-Indiana, x; 47-Tennessee, x; 55-Wisconsin, x; 27-Minnesota, x; 53-Washington, x; 29-Missouri, x; 22-Louisiana, x; 51-Virginia, x; 21-Kentucky, x; 25-Massachusetts, x; 01-Alabama, x; 19-Iowa, x; 20-Kansas, x; 45-South Carolina, x; 08-Colorado, x; 04-Arizona, x; 24-Maryland, x; 40-Oklahoma, x; 09-Connecticut, x; 28-Mississippi, x; 41-Oregon, x; 05-Arkansas, x; 31-Nebraska, x; 49-Utah, x; 38-North Dakota, x; 32-Nevada, x; 54-West Virginia, x; 16-Idaho, x; 35-New Mexico, x; 10-Delaware, x; 33-New Hampshire, x; 46-South Dakota, x; 44-Rhode Island, x; 23-Maine, x; 56-Wyoming, x; 30-Montana, x; 02-Alaska, x; 15-Hawaii, x; 50-Vermont, x; 11-Washington DC, x", "y": "35-New Mexico, y" } }, "mode": "lines+markers", "name": "35-New Mexico", "type": "scatter", "xsrc": "DalyaB:2:6ec859", "ysrc": "DalyaB:2:437661" }, { "meta": { "columnNames": { "x": "48-Texas, x; 06-California, x; 17-Illinois, x; 42-Pennsylvania, x; 39-Ohio, x; 36-New York, x; 12-Florida, x; 26-Michigan, x; 13-Georgia, x; 34-New Jersey, x; 37-North Carolina, x; 18-Indiana, x; 47-Tennessee, x; 55-Wisconsin, x; 27-Minnesota, x; 53-Washington, x; 29-Missouri, x; 22-Louisiana, x; 51-Virginia, x; 21-Kentucky, x; 25-Massachusetts, x; 01-Alabama, x; 19-Iowa, x; 20-Kansas, x; 45-South Carolina, x; 08-Colorado, x; 04-Arizona, x; 24-Maryland, x; 40-Oklahoma, x; 09-Connecticut, x; 28-Mississippi, x; 41-Oregon, x; 05-Arkansas, x; 31-Nebraska, x; 49-Utah, x; 38-North Dakota, x; 32-Nevada, x; 54-West Virginia, x; 16-Idaho, x; 35-New Mexico, x; 10-Delaware, x; 33-New Hampshire, x; 46-South Dakota, x; 44-Rhode Island, x; 23-Maine, x; 56-Wyoming, x; 30-Montana, x; 02-Alaska, x; 15-Hawaii, x; 50-Vermont, x; 11-Washington DC, x", "y": "10-Delaware, y" } }, "mode": "lines+markers", "name": "10-Delaware", "type": "scatter", "xsrc": "DalyaB:2:6ec859", "ysrc": "DalyaB:2:31c5d1" }, { "meta": { "columnNames": { "x": "48-Texas, x; 06-California, x; 17-Illinois, x; 42-Pennsylvania, x; 39-Ohio, x; 36-New York, x; 12-Florida, x; 26-Michigan, x; 13-Georgia, x; 34-New Jersey, x; 37-North Carolina, x; 18-Indiana, x; 47-Tennessee, x; 55-Wisconsin, x; 27-Minnesota, x; 53-Washington, x; 29-Missouri, x; 22-Louisiana, x; 51-Virginia, x; 21-Kentucky, x; 25-Massachusetts, x; 01-Alabama, x; 19-Iowa, x; 20-Kansas, x; 45-South Carolina, x; 08-Colorado, x; 04-Arizona, x; 24-Maryland, x; 40-Oklahoma, x; 09-Connecticut, x; 28-Mississippi, x; 41-Oregon, x; 05-Arkansas, x; 31-Nebraska, x; 49-Utah, x; 38-North Dakota, x; 32-Nevada, x; 54-West Virginia, x; 16-Idaho, x; 35-New Mexico, x; 10-Delaware, x; 33-New Hampshire, x; 46-South Dakota, x; 44-Rhode Island, x; 23-Maine, x; 56-Wyoming, x; 30-Montana, x; 02-Alaska, x; 15-Hawaii, x; 50-Vermont, x; 11-Washington DC, x", "y": "33-New Hampshire, y" } }, "mode": "lines+markers", "name": "33-New Hampshire", "type": "scatter", "xsrc": "DalyaB:2:6ec859", "ysrc": "DalyaB:2:11b4e2" }, { "meta": { "columnNames": { "x": "48-Texas, x; 06-California, x; 17-Illinois, x; 42-Pennsylvania, x; 39-Ohio, x; 36-New York, x; 12-Florida, x; 26-Michigan, x; 13-Georgia, x; 34-New Jersey, x; 37-North Carolina, x; 18-Indiana, x; 47-Tennessee, x; 55-Wisconsin, x; 27-Minnesota, x; 53-Washington, x; 29-Missouri, x; 22-Louisiana, x; 51-Virginia, x; 21-Kentucky, x; 25-Massachusetts, x; 01-Alabama, x; 19-Iowa, x; 20-Kansas, x; 45-South Carolina, x; 08-Colorado, x; 04-Arizona, x; 24-Maryland, x; 40-Oklahoma, x; 09-Connecticut, x; 28-Mississippi, x; 41-Oregon, x; 05-Arkansas, x; 31-Nebraska, x; 49-Utah, x; 38-North Dakota, x; 32-Nevada, x; 54-West Virginia, x; 16-Idaho, x; 35-New Mexico, x; 10-Delaware, x; 33-New Hampshire, x; 46-South Dakota, x; 44-Rhode Island, x; 23-Maine, x; 56-Wyoming, x; 30-Montana, x; 02-Alaska, x; 15-Hawaii, x; 50-Vermont, x; 11-Washington DC, x", "y": "46-South Dakota, y" } }, "mode": "lines+markers", "name": "46-South Dakota", "type": "scatter", "xsrc": "DalyaB:2:6ec859", "ysrc": "DalyaB:2:dc3450" }, { "meta": { "columnNames": { "x": "48-Texas, x; 06-California, x; 17-Illinois, x; 42-Pennsylvania, x; 39-Ohio, x; 36-New York, x; 12-Florida, x; 26-Michigan, x; 13-Georgia, x; 34-New Jersey, x; 37-North Carolina, x; 18-Indiana, x; 47-Tennessee, x; 55-Wisconsin, x; 27-Minnesota, x; 53-Washington, x; 29-Missouri, x; 22-Louisiana, x; 51-Virginia, x; 21-Kentucky, x; 25-Massachusetts, x; 01-Alabama, x; 19-Iowa, x; 20-Kansas, x; 45-South Carolina, x; 08-Colorado, x; 04-Arizona, x; 24-Maryland, x; 40-Oklahoma, x; 09-Connecticut, x; 28-Mississippi, x; 41-Oregon, x; 05-Arkansas, x; 31-Nebraska, x; 49-Utah, x; 38-North Dakota, x; 32-Nevada, x; 54-West Virginia, x; 16-Idaho, x; 35-New Mexico, x; 10-Delaware, x; 33-New Hampshire, x; 46-South Dakota, x; 44-Rhode Island, x; 23-Maine, x; 56-Wyoming, x; 30-Montana, x; 02-Alaska, x; 15-Hawaii, x; 50-Vermont, x; 11-Washington DC, x", "y": "44-Rhode Island, y" } }, "mode": "lines+markers", "name": "44-Rhode Island", "type": "scatter", "xsrc": "DalyaB:2:6ec859", "ysrc": "DalyaB:2:3c74bf" }, { "meta": { "columnNames": { "x": "48-Texas, x; 06-California, x; 17-Illinois, x; 42-Pennsylvania, x; 39-Ohio, x; 36-New York, x; 12-Florida, x; 26-Michigan, x; 13-Georgia, x; 34-New Jersey, x; 37-North Carolina, x; 18-Indiana, x; 47-Tennessee, x; 55-Wisconsin, x; 27-Minnesota, x; 53-Washington, x; 29-Missouri, x; 22-Louisiana, x; 51-Virginia, x; 21-Kentucky, x; 25-Massachusetts, x; 01-Alabama, x; 19-Iowa, x; 20-Kansas, x; 45-South Carolina, x; 08-Colorado, x; 04-Arizona, x; 24-Maryland, x; 40-Oklahoma, x; 09-Connecticut, x; 28-Mississippi, x; 41-Oregon, x; 05-Arkansas, x; 31-Nebraska, x; 49-Utah, x; 38-North Dakota, x; 32-Nevada, x; 54-West Virginia, x; 16-Idaho, x; 35-New Mexico, x; 10-Delaware, x; 33-New Hampshire, x; 46-South Dakota, x; 44-Rhode Island, x; 23-Maine, x; 56-Wyoming, x; 30-Montana, x; 02-Alaska, x; 15-Hawaii, x; 50-Vermont, x; 11-Washington DC, x", "y": "23-Maine, y" } }, "mode": "lines+markers", "name": "23-Maine", "type": "scatter", "xsrc": "DalyaB:2:6ec859", "ysrc": "DalyaB:2:fb3f72" }, { "meta": { "columnNames": { "x": "48-Texas, x; 06-California, x; 17-Illinois, x; 42-Pennsylvania, x; 39-Ohio, x; 36-New York, x; 12-Florida, x; 26-Michigan, x; 13-Georgia, x; 34-New Jersey, x; 37-North Carolina, x; 18-Indiana, x; 47-Tennessee, x; 55-Wisconsin, x; 27-Minnesota, x; 53-Washington, x; 29-Missouri, x; 22-Louisiana, x; 51-Virginia, x; 21-Kentucky, x; 25-Massachusetts, x; 01-Alabama, x; 19-Iowa, x; 20-Kansas, x; 45-South Carolina, x; 08-Colorado, x; 04-Arizona, x; 24-Maryland, x; 40-Oklahoma, x; 09-Connecticut, x; 28-Mississippi, x; 41-Oregon, x; 05-Arkansas, x; 31-Nebraska, x; 49-Utah, x; 38-North Dakota, x; 32-Nevada, x; 54-West Virginia, x; 16-Idaho, x; 35-New Mexico, x; 10-Delaware, x; 33-New Hampshire, x; 46-South Dakota, x; 44-Rhode Island, x; 23-Maine, x; 56-Wyoming, x; 30-Montana, x; 02-Alaska, x; 15-Hawaii, x; 50-Vermont, x; 11-Washington DC, x", "y": "56-Wyoming, y" } }, "mode": "lines+markers", "name": "56-Wyoming", "type": "scatter", "xsrc": "DalyaB:2:6ec859", "ysrc": "DalyaB:2:ee94dd" }, { "meta": { "columnNames": { "x": "48-Texas, x; 06-California, x; 17-Illinois, x; 42-Pennsylvania, x; 39-Ohio, x; 36-New York, x; 12-Florida, x; 26-Michigan, x; 13-Georgia, x; 34-New Jersey, x; 37-North Carolina, x; 18-Indiana, x; 47-Tennessee, x; 55-Wisconsin, x; 27-Minnesota, x; 53-Washington, x; 29-Missouri, x; 22-Louisiana, x; 51-Virginia, x; 21-Kentucky, x; 25-Massachusetts, x; 01-Alabama, x; 19-Iowa, x; 20-Kansas, x; 45-South Carolina, x; 08-Colorado, x; 04-Arizona, x; 24-Maryland, x; 40-Oklahoma, x; 09-Connecticut, x; 28-Mississippi, x; 41-Oregon, x; 05-Arkansas, x; 31-Nebraska, x; 49-Utah, x; 38-North Dakota, x; 32-Nevada, x; 54-West Virginia, x; 16-Idaho, x; 35-New Mexico, x; 10-Delaware, x; 33-New Hampshire, x; 46-South Dakota, x; 44-Rhode Island, x; 23-Maine, x; 56-Wyoming, x; 30-Montana, x; 02-Alaska, x; 15-Hawaii, x; 50-Vermont, x; 11-Washington DC, x", "y": "30-Montana, y" } }, "mode": "lines+markers", "name": "30-Montana", "type": "scatter", "xsrc": "DalyaB:2:6ec859", "ysrc": "DalyaB:2:5f7761" }, { "meta": { "columnNames": { "x": "48-Texas, x; 06-California, x; 17-Illinois, x; 42-Pennsylvania, x; 39-Ohio, x; 36-New York, x; 12-Florida, x; 26-Michigan, x; 13-Georgia, x; 34-New Jersey, x; 37-North Carolina, x; 18-Indiana, x; 47-Tennessee, x; 55-Wisconsin, x; 27-Minnesota, x; 53-Washington, x; 29-Missouri, x; 22-Louisiana, x; 51-Virginia, x; 21-Kentucky, x; 25-Massachusetts, x; 01-Alabama, x; 19-Iowa, x; 20-Kansas, x; 45-South Carolina, x; 08-Colorado, x; 04-Arizona, x; 24-Maryland, x; 40-Oklahoma, x; 09-Connecticut, x; 28-Mississippi, x; 41-Oregon, x; 05-Arkansas, x; 31-Nebraska, x; 49-Utah, x; 38-North Dakota, x; 32-Nevada, x; 54-West Virginia, x; 16-Idaho, x; 35-New Mexico, x; 10-Delaware, x; 33-New Hampshire, x; 46-South Dakota, x; 44-Rhode Island, x; 23-Maine, x; 56-Wyoming, x; 30-Montana, x; 02-Alaska, x; 15-Hawaii, x; 50-Vermont, x; 11-Washington DC, x", "y": "02-Alaska, y" } }, "mode": "lines+markers", "name": "02-Alaska", "type": "scatter", "xsrc": "DalyaB:2:6ec859", "ysrc": "DalyaB:2:a762e7" }, { "meta": { "columnNames": { "x": "48-Texas, x; 06-California, x; 17-Illinois, x; 42-Pennsylvania, x; 39-Ohio, x; 36-New York, x; 12-Florida, x; 26-Michigan, x; 13-Georgia, x; 34-New Jersey, x; 37-North Carolina, x; 18-Indiana, x; 47-Tennessee, x; 55-Wisconsin, x; 27-Minnesota, x; 53-Washington, x; 29-Missouri, x; 22-Louisiana, x; 51-Virginia, x; 21-Kentucky, x; 25-Massachusetts, x; 01-Alabama, x; 19-Iowa, x; 20-Kansas, x; 45-South Carolina, x; 08-Colorado, x; 04-Arizona, x; 24-Maryland, x; 40-Oklahoma, x; 09-Connecticut, x; 28-Mississippi, x; 41-Oregon, x; 05-Arkansas, x; 31-Nebraska, x; 49-Utah, x; 38-North Dakota, x; 32-Nevada, x; 54-West Virginia, x; 16-Idaho, x; 35-New Mexico, x; 10-Delaware, x; 33-New Hampshire, x; 46-South Dakota, x; 44-Rhode Island, x; 23-Maine, x; 56-Wyoming, x; 30-Montana, x; 02-Alaska, x; 15-Hawaii, x; 50-Vermont, x; 11-Washington DC, x", "y": "15-Hawaii, y" } }, "mode": "lines+markers", "name": "15-Hawaii", "type": "scatter", "xsrc": "DalyaB:2:6ec859", "ysrc": "DalyaB:2:039de4" }, { "meta": { "columnNames": { "x": "48-Texas, x; 06-California, x; 17-Illinois, x; 42-Pennsylvania, x; 39-Ohio, x; 36-New York, x; 12-Florida, x; 26-Michigan, x; 13-Georgia, x; 34-New Jersey, x; 37-North Carolina, x; 18-Indiana, x; 47-Tennessee, x; 55-Wisconsin, x; 27-Minnesota, x; 53-Washington, x; 29-Missouri, x; 22-Louisiana, x; 51-Virginia, x; 21-Kentucky, x; 25-Massachusetts, x; 01-Alabama, x; 19-Iowa, x; 20-Kansas, x; 45-South Carolina, x; 08-Colorado, x; 04-Arizona, x; 24-Maryland, x; 40-Oklahoma, x; 09-Connecticut, x; 28-Mississippi, x; 41-Oregon, x; 05-Arkansas, x; 31-Nebraska, x; 49-Utah, x; 38-North Dakota, x; 32-Nevada, x; 54-West Virginia, x; 16-Idaho, x; 35-New Mexico, x; 10-Delaware, x; 33-New Hampshire, x; 46-South Dakota, x; 44-Rhode Island, x; 23-Maine, x; 56-Wyoming, x; 30-Montana, x; 02-Alaska, x; 15-Hawaii, x; 50-Vermont, x; 11-Washington DC, x", "y": "50-Vermont, y" } }, "mode": "lines+markers", "name": "50-Vermont", "type": "scatter", "xsrc": "DalyaB:2:6ec859", "ysrc": "DalyaB:2:4218ff" }, { "meta": { "columnNames": { "x": "48-Texas, x; 06-California, x; 17-Illinois, x; 42-Pennsylvania, x; 39-Ohio, x; 36-New York, x; 12-Florida, x; 26-Michigan, x; 13-Georgia, x; 34-New Jersey, x; 37-North Carolina, x; 18-Indiana, x; 47-Tennessee, x; 55-Wisconsin, x; 27-Minnesota, x; 53-Washington, x; 29-Missouri, x; 22-Louisiana, x; 51-Virginia, x; 21-Kentucky, x; 25-Massachusetts, x; 01-Alabama, x; 19-Iowa, x; 20-Kansas, x; 45-South Carolina, x; 08-Colorado, x; 04-Arizona, x; 24-Maryland, x; 40-Oklahoma, x; 09-Connecticut, x; 28-Mississippi, x; 41-Oregon, x; 05-Arkansas, x; 31-Nebraska, x; 49-Utah, x; 38-North Dakota, x; 32-Nevada, x; 54-West Virginia, x; 16-Idaho, x; 35-New Mexico, x; 10-Delaware, x; 33-New Hampshire, x; 46-South Dakota, x; 44-Rhode Island, x; 23-Maine, x; 56-Wyoming, x; 30-Montana, x; 02-Alaska, x; 15-Hawaii, x; 50-Vermont, x; 11-Washington DC, x", "y": "11-Washington DC, y" } }, "mode": "lines+markers", "name": "11-Washington DC", "type": "scatter", "xsrc": "DalyaB:2:6ec859", "ysrc": "DalyaB:2:1d0444" } ], "frames": [], "layout": { "title": { "font": { "size": 18 }, "text": "Total value of shipments (M$) by domestic origin" }, "width": 951.2, "xaxis": { "type": "linear", "range": [ 2000.7420718816068, 2023.2579281183932 ], "title": { "font": { "size": 18 }, "text": "Year" }, "tickfont": { "size": 18 }, "tickvals": [ "2002", "2007", "2012", "2017", "2018", "2019", "2020", "2021", "2022" ], "autorange": true, "automargin": true }, "yaxis": { "type": "linear", "range": [ -107152.78511044596, 1844534.042310446 ], "title": { "font": { "size": 18 }, "text": "Total value of shipments (M$)" }, "tickfont": { "size": 18 }, "autorange": true, "automargin": true }, "height": 734.4, "legend": { "font": { "size": 18 } }, "template": "seaborn", "hovermode": "closest" } }, "height": 734, "width": 951, "user": { "profile_url": "https://chart-studio.plotly.com/~DalyaB", "avatar_url": "https://storage.googleapis.com/plotly-prod-profiles/62.jpg", "background_url": "https://storage.googleapis.com/plotly-prod-profiles/bg-11.jpg", "bio": "", "nickname": "", "website": "", "stream_tokens": null, "feature_set_id": null, "csrf_token": null, "date_joined": "2025-07-16 10:57:09", "mapbox_access_tokens": null, "has_password": null, "username": "DalyaB", "email": null, "is_active": null, "readonly": null, "is_dash_creator": null, "dash_created_count": null, "is_chart_creator": null, "charts_created_count": null } } ] }
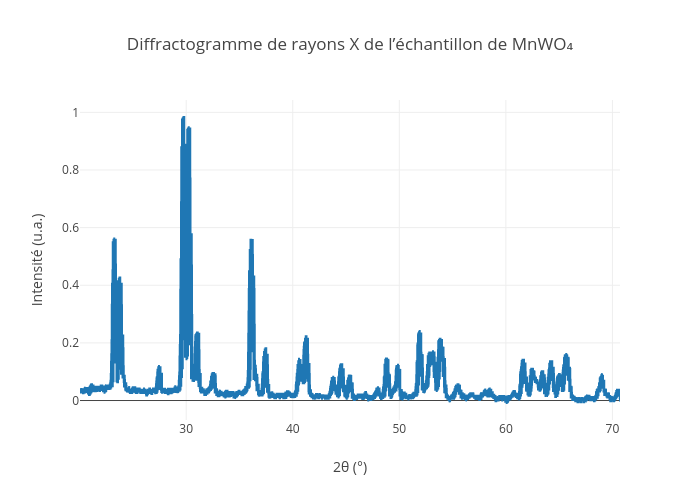