Plots List
Plots
This endpoint handles manipulation of Plotly plot files.
Reference
Authorization
Any user with or without a Plotly account may view public plots. For private plots, see authentication.
Actions
list
Listing all public plots can be done via a GET request to this endpoint.
By default, plots will be listed in order of date created. The order_by
query parameter is accepted at this endpoint. Currently, only ordering by
views is supported. It is possible to filter the plots by quality
with min_quality or max_quality as query parameter.
Example:
// GET https://api.plotly.com/v2/plots/ ---> 200

// GET https://api.plotly.com/v2/plots/?order_by=-views ---> 200

// GET https://api.plotly.com/v2/plots/?min_quality=5 ---> 200

// GET https://api.plotly.com/v2/plots/?max_quality=5 ---> 200
feed
Listing all handpicked feed plots can be done via a GET request to this endpoint. By default, plots will be listed in a random order.
Example:
// GET https://api.plotly.com/v2/plots/feed ---> 200
create
You can create new plot resources here. The only required field is 'figure'. Currently, the figure is restricted to only contain references to grid data. That is, this will fail if raw data arrays are passed in. To create and manipulate underlying grids for plots, see the grids endpoint.
Example:
// This fails because a figure field is required.
// POST https://api.plotly.com/v2/plots ---> 400 Bad Request
{}

// This fails because the figure has raw data
//POST https://api.plotly.com/v2/plots ---> 400 Bad Request
{
    "figure": {"data": [{"y": ['this', 'is', 'raw', 'data']}]}
}

// This succeeds because the figure has src keys, not raw data.
//POST https://api.plotly.com/v2/plots ---> 200 OK
{
    "figure": {"data": [{"ysrc": "sven:88:u8nd62"}]}
}
When creating a grid, you can optionally specify a source_fid to specify where a plot has come from:
- source_fid: the fid of a plot that was copied (and presumably edited) to produce this one
detail
There is a lot of meta information stored about plot files including filename, title, share_url, and content_url to name a few.
This information can only be reached with a GET to this endpoint.
Example:
// GET https://api.plotly.com/v2/plots/iheartgraphs:90
content
The contents of a plot can be downloaded via the content resource. The plot
content contains referenced grid/column data by default. If you wish to
return the raw grid/column data, the inline_data=true query must be included
in the request url. The Content-Type header will be appropriately set for the
response body.
Alternatively, you can set ?map_data=unreadable to append a mapping of
sources to data that belongs to grids which are unreadable for the
requestor. This is useful when you have read access to another users plot,
but that plot contains grid references which you don't have access to.
Examples:
// Returns referenced grid/column data
// GET https://api.plotly.com/v2/plots/iheartgraphs:90/content ---> 200 OK

// Returns full grid/column data
// GET https://api.plotly.com/v2/plots/iheartgraphs:90/content?inline_data=true ---> 200 OK

// Returns full grid/column data when requestor doesn't have permission
// to read the referenced grid.
// GET https://api.plotly.com/v2/plots/iheartgraphs:90/content?map_data=unreadable ---> 200 OK
GET /v2/plots/?cursor=cj0xJnA9MjAyNC0wNC0zMCsxNyUzQTA0JTNBMDIuNjQwNjgxJTJCMDAlM0EwMA%3D%3D&format=api
{ "next": "https://api.plot.ly/v2/plots/?cursor=cD0yMDI0LTA0LTMwKzE3JTNBNDIlM0E0My44NDg3MTElMkIwMCUzQTAw&format=api", "previous": "https://api.plot.ly/v2/plots/?cursor=cj0xJnA9MjAyNC0wNC0zMCsxOCUzQTQ2JTNBNDYuOTI3NjA3JTJCMDAlM0EwMA%3D%3D&format=api", "results": [ { "creation_time": "2024-04-30T18:46:46.927607Z", "comments": { "results": [], "count": 0 }, "parented": true, "embed_url": "https://chart-studio.plotly.com/~vbhvsingh595/27.embed", "fid": "vbhvsingh595:27", "filename": "5trajs_fomo1410_02_intcoorsc5pyr", "filetype": "plot", "img_url": "https://storage.googleapis.com/plotly-prod-images/vbhvsingh595/27/9_QU68IME4VV68U5V1KAC21WX6AJ4DQD.png", "image_urls": { "default": "https://storage.googleapis.com/plotly-prod-images/vbhvsingh595/27/2_TSBED7PC68V63XIOVO7M1FGY3VPEWY.png", "block-thumb": "https://storage.googleapis.com/plotly-prod-images/vbhvsingh595/27/8_HRC20VPUPB5U99NJWY7CKOCKJE7V6K.png", "list-thumb": "https://storage.googleapis.com/plotly-prod-images/vbhvsingh595/27/9_QU68IME4VV68U5V1KAC21WX6AJ4DQD.png" }, "api_urls": { "files": "https://api.plotly.com/v2/files/vbhvsingh595:27", "plots": "https://api.plotly.com/v2/plots/vbhvsingh595:27", "parent": "https://api.plotly.com/v2/folders/home?user=vbhvsingh595" }, "owner": "vbhvsingh595", "parent": -1, "preview": "", "referencers": [], "references": [], "title": "", "views": 3, "web_url": "https://chart-studio.plotly.com/~vbhvsingh595/27/", "world_readable": true, "date_modified": "2024-05-06T16:09:35.358Z", "stars": { "results": [], "count": 0 }, "collaborators": { "results": [], "count": 0 }, "subfolder_count": null, "refresh_interval": null, "organize_view_url": "https://chart-studio.plotly.com/~vbhvsingh595/27/", "current_user_permission": "read", "is_theme": null, "is_template": false, "autosize": true, "caption": "", "figure": { "data": [ { "line": { "width": 4 }, "meta": { "columnNames": { "x": "A", "y": "B" } }, "mode": "markers+lines", "name": "TRAJ1", "type": "scatter", "xsrc": "vbhvsingh595:26:03a8b8", "ysrc": "vbhvsingh595:26:5eb99d", "marker": { "size": 7, "color": "rgb(189, 189, 194)" }, "showlegend": false, "legendgroup": 1 }, { "line": { "width": 4 }, "meta": { "columnNames": { "x": "A", "y": "C" } }, "mode": "markers+lines", "name": "TRAJ2", "type": "scatter", "xsrc": "vbhvsingh595:26:03a8b8", "ysrc": "vbhvsingh595:26:22fe4d", "marker": { "size": 7, "color": "rgb(182, 176, 175)" }, "visible": true, "showlegend": false, "stackgroup": null }, { "line": { "width": 4 }, "meta": { "columnNames": { "x": "A", "y": "D" } }, "mode": "markers+lines", "name": "TRAJ3", "type": "scatter", "xsrc": "vbhvsingh595:26:03a8b8", "ysrc": "vbhvsingh595:26:26b792", "marker": { "color": "rgb(168, 176, 171)" }, "visible": true, "showlegend": false, "stackgroup": null }, { "line": { "width": 4 }, "meta": { "columnNames": { "x": "A", "y": "F" } }, "mode": "markers+lines", "name": "TRAJ5", "type": "scatter", "xsrc": "vbhvsingh595:26:03a8b8", "ysrc": "vbhvsingh595:26:3a82c1", "marker": { "color": "rgb(160, 162, 162)" }, "showlegend": false, "stackgroup": null }, { "line": { "width": 4 }, "meta": { "columnNames": { "x": "A", "y": "O" } }, "mode": "markers+lines", "name": "TRAJ7<br>", "type": "scatter", "xsrc": "vbhvsingh595:26:03a8b8", "ysrc": "vbhvsingh595:26:2beef3", "marker": { "size": 7, "color": "rgb(179, 183, 183)" }, "showlegend": false, "stackgroup": null }, { "line": { "width": 4 }, "meta": { "columnNames": { "x": "A", "y": "P" } }, "mode": "markers+lines", "name": "TRAJ9", "type": "scatter", "xsrc": "vbhvsingh595:26:03a8b8", "ysrc": "vbhvsingh595:26:8b4f05", "marker": { "size": 7, "color": "rgb(186, 181, 186)" }, "showlegend": false, "stackgroup": null }, { "line": { "width": 4 }, "meta": { "columnNames": { "x": "A", "y": "Q" } }, "mode": "markers+lines", "name": "TRAJ10", "type": "scatter", "xsrc": "vbhvsingh595:26:03a8b8", "ysrc": "vbhvsingh595:26:011ae6", "marker": { "size": 7, "color": "rgb(181, 178, 175)" }, "showlegend": false, "stackgroup": null }, { "line": { "width": 4 }, "meta": { "columnNames": { "x": "A", "y": "R" } }, "mode": "markers+lines", "name": "TRAJ 11", "type": "scatter", "xsrc": "vbhvsingh595:26:03a8b8", "ysrc": "vbhvsingh595:26:d37fc4", "marker": { "size": 7, "color": "rgb(179, 172, 167)" }, "showlegend": false, "stackgroup": null }, { "line": { "width": 4 }, "meta": { "columnNames": { "x": "A", "y": "S" } }, "mode": "markers+lines", "name": "TRAJ 12", "type": "scatter", "xsrc": "vbhvsingh595:26:03a8b8", "ysrc": "vbhvsingh595:26:1207d3", "marker": { "size": 7, "color": "rgb(184, 173, 176)" }, "showlegend": false, "stackgroup": null }, { "line": { "width": 4 }, "meta": { "columnNames": { "x": "A", "y": "T" } }, "mode": "markers+lines", "name": "TRAJ 13", "type": "scatter", "xsrc": "vbhvsingh595:26:03a8b8", "ysrc": "vbhvsingh595:26:63c93d", "marker": { "size": 7, "color": "rgb(194, 198, 190)" }, "showlegend": false, "stackgroup": null }, { "line": { "width": 4 }, "meta": { "columnNames": { "x": "A", "y": "U" } }, "mode": "markers+lines", "name": "TRAJ14", "type": "scatter", "xsrc": "vbhvsingh595:26:03a8b8", "ysrc": "vbhvsingh595:26:ac6557", "marker": { "size": 7, "color": "rgb(176, 177, 185)" }, "showlegend": false, "stackgroup": null }, { "line": { "width": 4 }, "meta": { "columnNames": { "x": "A", "y": "V" } }, "mode": "markers+lines", "name": "TRAJ15", "type": "scatter", "xsrc": "vbhvsingh595:26:03a8b8", "ysrc": "vbhvsingh595:26:b8c3c3", "marker": { "size": 7, "color": "rgb(189, 181, 180)" }, "showlegend": false, "stackgroup": null }, { "line": { "width": 4 }, "meta": { "columnNames": { "x": "A", "y": "W" } }, "mode": "markers+lines", "name": "TRAJ17<br>", "type": "scatter", "xsrc": "vbhvsingh595:26:03a8b8", "ysrc": "vbhvsingh595:26:3fe176", "marker": { "size": 7, "color": "rgb(169, 176, 175)" }, "showlegend": false, "stackgroup": null }, { "meta": { "columnNames": { "x": "H", "y": "I" } }, "mode": "markers", "name": "S2 -> S1", "type": "scatter", "xsrc": "vbhvsingh595:26:93ca6d", "ysrc": "vbhvsingh595:26:ad582b", "marker": { "size": 10, "color": "rgb(99, 131, 250)", "symbol": "x" }, "stackgroup": null }, { "meta": { "columnNames": { "x": "L", "y": "M" } }, "mode": "markers", "name": "S1 -> S0", "type": "scatter", "xsrc": "vbhvsingh595:26:49a4b4", "ysrc": "vbhvsingh595:26:ca1382", "marker": { "size": 9, "color": "rgb(230, 25, 21)" }, "stackgroup": null } ], "frames": [], "layout": { "font": { "size": 34 }, "title": { "x": 0.5, "text": "FOMO(14,10)_0.2" }, "xaxis": { "type": "linear", "range": [ -63.941833175788005, 1061.9983865184654 ], "ticks": "outside", "title": { "text": "Time (fs)" }, "ticklen": 6, "showgrid": false, "showline": true, "autorange": true, "linecolor": "rgb(1, 7, 18)", "linewidth": 3, "tickwidth": 2 }, "yaxis": { "type": "linear", "range": [ 0, 350 ], "ticks": "outside", "title": { "text": "C5 Pyr (<sup>o</sup>)" }, "ticklen": 6, "showgrid": false, "showline": true, "autorange": false, "gridcolor": "rgb(1, 6, 15)", "linecolor": "rgb(1, 6, 16)", "linewidth": 3, "tickwidth": 3 }, "legend": { "x": 0.8787688670667394, "y": 1.0954021247678085, "orientation": "h" }, "autosize": true, "template": { "data": { "bar": [ { "type": "bar", "marker": { "colorbar": { "ticks": "", "outlinewidth": 0 } } } ], "table": [ { "type": "table", "cells": { "fill": { "color": "#EBF0F8" }, "line": { "color": "white" } }, "header": { "fill": { "color": "#C8D4E3" }, "line": { "color": "white" } } } ], "carpet": [ { "type": "carpet", "aaxis": { "gridcolor": "#C8D4E3", "linecolor": "#C8D4E3", "endlinecolor": "#2a3f5f", "minorgridcolor": "#C8D4E3", "startlinecolor": "#2a3f5f" }, "baxis": { "gridcolor": "#C8D4E3", "linecolor": "#C8D4E3", "endlinecolor": "#2a3f5f", "minorgridcolor": "#C8D4E3", "startlinecolor": "#2a3f5f" } } ], "mesh3d": [ { "type": "mesh3d", "colorbar": { "ticks": "", "outlinewidth": 0 } } ], "contour": [ { "type": "contour", "colorbar": { "ticks": "", "outlinewidth": 0 }, "autocolorscale": true } ], "heatmap": [ { "type": "heatmap", "colorbar": { "ticks": "", "outlinewidth": 0 }, "autocolorscale": true } ], "scatter": [ { "type": "scatter", "marker": { "colorbar": { "ticks": "", "outlinewidth": 0 } } } ], "surface": [ { "type": "surface", "colorbar": { "ticks": "", "outlinewidth": 0 } } ], "heatmapgl": [ { "type": "heatmapgl", "colorbar": { "ticks": "", "outlinewidth": 0 } } ], "histogram": [ { "type": "histogram", "marker": { "colorbar": { "ticks": "", "outlinewidth": 0 } } } ], "parcoords": [ { "line": { "colorbar": { "ticks": "", "outlinewidth": 0 } }, "type": "parcoords" } ], "scatter3d": [ { "type": "scatter3d", "marker": { "colorbar": { "ticks": "", "outlinewidth": 0 } } } ], "scattergl": [ { "type": "scattergl", "marker": { "colorbar": { "ticks": "", "outlinewidth": 0 } } } ], "choropleth": [ { "type": "choropleth", "colorbar": { "ticks": "", "outlinewidth": 0 } } ], "scattergeo": [ { "type": "scattergeo", "marker": { "colorbar": { "ticks": "", "outlinewidth": 0 } } } ], "histogram2d": [ { "type": "histogram2d", "colorbar": { "ticks": "", "outlinewidth": 0 }, "autocolorscale": true } ], "scatterpolar": [ { "type": "scatterpolar", "marker": { "colorbar": { "ticks": "", "outlinewidth": 0 } } } ], "contourcarpet": [ { "type": "contourcarpet", "colorbar": { "ticks": "", "outlinewidth": 0 } } ], "scattercarpet": [ { "type": "scattercarpet", "marker": { "colorbar": { "ticks": "", "outlinewidth": 0 } } } ], "scattermapbox": [ { "type": "scattermapbox", "marker": { "colorbar": { "ticks": "", "outlinewidth": 0 } } } ], "scatterpolargl": [ { "type": "scatterpolargl", "marker": { "colorbar": { "ticks": "", "outlinewidth": 0 } } } ], "scatterternary": [ { "type": "scatterternary", "marker": { "colorbar": { "ticks": "", "outlinewidth": 0 } } } ], "histogram2dcontour": [ { "type": "histogram2dcontour", "colorbar": { "ticks": "", "outlinewidth": 0 }, "autocolorscale": true } ] }, "layout": { "geo": { "bgcolor": "white", "showland": true, "lakecolor": "white", "landcolor": "white", "showlakes": true, "subunitcolor": "#C8D4E3" }, "font": { "color": "#2a3f5f" }, "polar": { "bgcolor": "white", "radialaxis": { "ticks": "", "gridcolor": "#EBF0F8", "linecolor": "#EBF0F8" }, "angularaxis": { "ticks": "", "gridcolor": "#EBF0F8", "linecolor": "#EBF0F8" } }, "scene": { "xaxis": { "ticks": "", "gridcolor": "#DFE8F3", "gridwidth": 2, "linecolor": "#EBF0F8", "zerolinecolor": "#EBF0F8", "showbackground": true, "backgroundcolor": "white" }, "yaxis": { "ticks": "", "gridcolor": "#DFE8F3", "gridwidth": 2, "linecolor": "#EBF0F8", "zerolinecolor": "#EBF0F8", "showbackground": true, "backgroundcolor": "white" }, "zaxis": { "ticks": "", "gridcolor": "#DFE8F3", "gridwidth": 2, "linecolor": "#EBF0F8", "zerolinecolor": "#EBF0F8", "showbackground": true, "backgroundcolor": "white" } }, "title": { "x": 0.05 }, "xaxis": { "ticks": "", "gridcolor": "#EBF0F8", "linecolor": "#EBF0F8", "automargin": true, "zerolinecolor": "#EBF0F8", "zerolinewidth": 2 }, "yaxis": { "ticks": "", "gridcolor": "#EBF0F8", "linecolor": "#EBF0F8", "automargin": true, "zerolinecolor": "#EBF0F8", "zerolinewidth": 2 }, "ternary": { "aaxis": { "ticks": "", "gridcolor": "#DFE8F3", "linecolor": "#A2B1C6" }, "baxis": { "ticks": "", "gridcolor": "#DFE8F3", "linecolor": "#A2B1C6" }, "caxis": { "ticks": "", "gridcolor": "#DFE8F3", "linecolor": "#A2B1C6" }, "bgcolor": "white" }, "colorway": [ "#636efa", "#EF553B", "#00cc96", "#ab63fa", "#19d3f3", "#e763fa", "#fecb52", "#ffa15a", "#ff6692", "#b6e880" ], "hovermode": "closest", "colorscale": { "diverging": [ [ 0, "#8e0152" ], [ 0.1, "#c51b7d" ], [ 0.2, "#de77ae" ], [ 0.3, "#f1b6da" ], [ 0.4, "#fde0ef" ], [ 0.5, "#f7f7f7" ], [ 0.6, "#e6f5d0" ], [ 0.7, "#b8e186" ], [ 0.8, "#7fbc41" ], [ 0.9, "#4d9221" ], [ 1, "#276419" ] ], "sequential": [ [ 0, "#0508b8" ], [ 0.0893854748603352, "#1910d8" ], [ 0.1787709497206704, "#3c19f0" ], [ 0.2681564245810056, "#6b1cfb" ], [ 0.3575418994413408, "#981cfd" ], [ 0.44692737430167595, "#bf1cfd" ], [ 0.5363128491620112, "#dd2bfd" ], [ 0.6256983240223464, "#f246fe" ], [ 0.7150837988826816, "#fc67fd" ], [ 0.8044692737430168, "#fe88fc" ], [ 0.8938547486033519, "#fea5fd" ], [ 0.9832402234636871, "#febefe" ], [ 1, "#fec3fe" ] ], "sequentialminus": [ [ 0, "#0508b8" ], [ 0.0893854748603352, "#1910d8" ], [ 0.1787709497206704, "#3c19f0" ], [ 0.2681564245810056, "#6b1cfb" ], [ 0.3575418994413408, "#981cfd" ], [ 0.44692737430167595, "#bf1cfd" ], [ 0.5363128491620112, "#dd2bfd" ], [ 0.6256983240223464, "#f246fe" ], [ 0.7150837988826816, "#fc67fd" ], [ 0.8044692737430168, "#fe88fc" ], [ 0.8938547486033519, "#fea5fd" ], [ 0.9832402234636871, "#febefe" ], [ 1, "#fec3fe" ] ] }, "plot_bgcolor": "white", "paper_bgcolor": "white", "shapedefaults": { "line": { "width": 0 }, "opacity": 0.4, "fillcolor": "#506784" }, "annotationdefaults": { "arrowhead": 0, "arrowcolor": "#506784", "arrowwidth": 1 } }, "themeRef": "PLOTLY_WHITE" }, "showlegend": true } }, "height": null, "width": null, "user": { "profile_url": "https://chart-studio.plotly.com/~vbhvsingh595", "avatar_url": "https://storage.googleapis.com/plotly-prod-profiles/7.jpg", "background_url": "https://storage.googleapis.com/plotly-prod-profiles/bg-4.jpg", "bio": "", "nickname": "", "website": "", "stream_tokens": null, "feature_set_id": null, "csrf_token": null, "date_joined": "2024-02-25 16:27:48", "mapbox_access_tokens": null, "has_password": null, "username": "vbhvsingh595", "email": null, "is_active": null, "readonly": null, "is_dash_creator": null, "dash_created_count": null, "is_chart_creator": null, "charts_created_count": null } }, { "creation_time": "2024-04-30T18:40:26.978862Z", "comments": { "results": [], "count": 0 }, "parented": true, "embed_url": "https://chart-studio.plotly.com/~cs4208/10.embed", "fid": "cs4208:10", "filename": "most aligned map", "filetype": "plot", "img_url": "https://storage.googleapis.com/plotly-prod-images/cs4208/10/9_DFUO0OZJK5LPGT26CBMYLEKZ39KZXZ.png", "image_urls": { "default": "https://storage.googleapis.com/plotly-prod-images/cs4208/10/2_7HYJOL74UFDE24MWMWKRIJS4KCH99U.png", "block-thumb": "https://storage.googleapis.com/plotly-prod-images/cs4208/10/8_ZODSP3943A2IXH50AGW8AYVX0S42GM.png", "list-thumb": "https://storage.googleapis.com/plotly-prod-images/cs4208/10/9_DFUO0OZJK5LPGT26CBMYLEKZ39KZXZ.png" }, "api_urls": { "files": "https://api.plotly.com/v2/files/cs4208:10", "plots": "https://api.plotly.com/v2/plots/cs4208:10", "parent": "https://api.plotly.com/v2/folders/home?user=cs4208" }, "owner": "cs4208", "parent": -1, "preview": "", "referencers": [], "references": [], "title": "", "views": 1, "web_url": "https://chart-studio.plotly.com/~cs4208/10/", "world_readable": true, "date_modified": "2024-04-30T18:41:36.030Z", "stars": { "results": [], "count": 0 }, "collaborators": { "results": [], "count": 0 }, "subfolder_count": null, "refresh_interval": null, "organize_view_url": "https://chart-studio.plotly.com/~cs4208/10/", "current_user_permission": "read", "is_theme": null, "is_template": null, "autosize": true, "caption": "", "figure": { "data": [ { "geo": "geo", "name": "", "type": "choropleth", "zsrc": "cs4208:11:b1c1f8", "coloraxis": "coloraxis", "locationssrc": "cs4208:11:fb21b6", "customdatasrc": "cs4208:11:cc49c2", "hovertemplate": "iso_alpha_3=%{location}<br>country_name=%{customdata[0]}<br>Continent=%{customdata[1]}<br>uscn score=%{z}<extra></extra>" } ], "layout": { "geo": { "center": {}, "domain": { "x": [ 0.0, 1.0 ], "y": [ 0.0, 1.0 ] } }, "title": { "text": "Map of Most Aligned Countries (2002-2022)" }, "legend": { "tracegroupgap": 0 }, "margin": { "b": 50, "l": 10, "r": 10, "t": 50 }, "template": { "data": { "bar": [ { "type": "bar", "marker": { "line": { "color": "#E5ECF6", "width": 0.5 }, "pattern": { "size": 10, "fillmode": "overlay", "solidity": 0.2 } }, "error_x": { "color": "#2a3f5f" }, "error_y": { "color": "#2a3f5f" } } ], "pie": [ { "type": "pie", "automargin": true } ], "table": [ { "type": "table", "cells": { "fill": { "color": "#EBF0F8" }, "line": { "color": "white" } }, "header": { "fill": { "color": "#C8D4E3" }, "line": { "color": "white" } } } ], "carpet": [ { "type": "carpet", "aaxis": { "gridcolor": "white", "linecolor": "white", "endlinecolor": "#2a3f5f", "minorgridcolor": "white", "startlinecolor": "#2a3f5f" }, "baxis": { "gridcolor": "white", "linecolor": "white", "endlinecolor": "#2a3f5f", "minorgridcolor": "white", "startlinecolor": "#2a3f5f" } } ], "mesh3d": [ { "type": "mesh3d", "colorbar": { "ticks": "", "outlinewidth": 0 } } ], "contour": [ { "type": "contour", "colorbar": { "ticks": "", "outlinewidth": 0 }, "colorscale": [ [ 0.0, "#0d0887" ], [ 0.1111111111111111, "#46039f" ], [ 0.2222222222222222, "#7201a8" ], [ 0.3333333333333333, "#9c179e" ], [ 0.4444444444444444, "#bd3786" ], [ 0.5555555555555556, "#d8576b" ], [ 0.6666666666666666, "#ed7953" ], [ 0.7777777777777778, "#fb9f3a" ], [ 0.8888888888888888, "#fdca26" ], [ 1.0, "#f0f921" ] ] } ], "heatmap": [ { "type": "heatmap", "colorbar": { "ticks": "", "outlinewidth": 0 }, "colorscale": [ [ 0.0, "#0d0887" ], [ 0.1111111111111111, "#46039f" ], [ 0.2222222222222222, "#7201a8" ], [ 0.3333333333333333, "#9c179e" ], [ 0.4444444444444444, "#bd3786" ], [ 0.5555555555555556, "#d8576b" ], [ 0.6666666666666666, "#ed7953" ], [ 0.7777777777777778, "#fb9f3a" ], [ 0.8888888888888888, "#fdca26" ], [ 1.0, "#f0f921" ] ] } ], "scatter": [ { "type": "scatter", "fillpattern": { "size": 10, "fillmode": "overlay", "solidity": 0.2 } } ], "surface": [ { "type": "surface", "colorbar": { "ticks": "", "outlinewidth": 0 }, "colorscale": [ [ 0.0, "#0d0887" ], [ 0.1111111111111111, "#46039f" ], [ 0.2222222222222222, "#7201a8" ], [ 0.3333333333333333, "#9c179e" ], [ 0.4444444444444444, "#bd3786" ], [ 0.5555555555555556, "#d8576b" ], [ 0.6666666666666666, "#ed7953" ], [ 0.7777777777777778, "#fb9f3a" ], [ 0.8888888888888888, "#fdca26" ], [ 1.0, "#f0f921" ] ] } ], "barpolar": [ { "type": "barpolar", "marker": { "line": { "color": "#E5ECF6", "width": 0.5 }, "pattern": { "size": 10, "fillmode": "overlay", "solidity": 0.2 } } } ], "heatmapgl": [ { "type": "heatmapgl", "colorbar": { "ticks": "", "outlinewidth": 0 }, "colorscale": [ [ 0.0, "#0d0887" ], [ 0.1111111111111111, "#46039f" ], [ 0.2222222222222222, "#7201a8" ], [ 0.3333333333333333, "#9c179e" ], [ 0.4444444444444444, "#bd3786" ], [ 0.5555555555555556, "#d8576b" ], [ 0.6666666666666666, "#ed7953" ], [ 0.7777777777777778, "#fb9f3a" ], [ 0.8888888888888888, "#fdca26" ], [ 1.0, "#f0f921" ] ] } ], "histogram": [ { "type": "histogram", "marker": { "pattern": { "size": 10, "fillmode": "overlay", "solidity": 0.2 } } } ], "parcoords": [ { "line": { "colorbar": { "ticks": "", "outlinewidth": 0 } }, "type": "parcoords" } ], "scatter3d": [ { "line": { "colorbar": { "ticks": "", "outlinewidth": 0 } }, "type": "scatter3d", "marker": { "colorbar": { "ticks": "", "outlinewidth": 0 } } } ], "scattergl": [ { "type": "scattergl", "marker": { "colorbar": { "ticks": "", "outlinewidth": 0 } } } ], "choropleth": [ { "type": "choropleth", "colorbar": { "ticks": "", "outlinewidth": 0 } } ], "scattergeo": [ { "type": "scattergeo", "marker": { "colorbar": { "ticks": "", "outlinewidth": 0 } } } ], "histogram2d": [ { "type": "histogram2d", "colorbar": { "ticks": "", "outlinewidth": 0 }, "colorscale": [ [ 0.0, "#0d0887" ], [ 0.1111111111111111, "#46039f" ], [ 0.2222222222222222, "#7201a8" ], [ 0.3333333333333333, "#9c179e" ], [ 0.4444444444444444, "#bd3786" ], [ 0.5555555555555556, "#d8576b" ], [ 0.6666666666666666, "#ed7953" ], [ 0.7777777777777778, "#fb9f3a" ], [ 0.8888888888888888, "#fdca26" ], [ 1.0, "#f0f921" ] ] } ], "scatterpolar": [ { "type": "scatterpolar", "marker": { "colorbar": { "ticks": "", "outlinewidth": 0 } } } ], "contourcarpet": [ { "type": "contourcarpet", "colorbar": { "ticks": "", "outlinewidth": 0 } } ], "scattercarpet": [ { "type": "scattercarpet", "marker": { "colorbar": { "ticks": "", "outlinewidth": 0 } } } ], "scattermapbox": [ { "type": "scattermapbox", "marker": { "colorbar": { "ticks": "", "outlinewidth": 0 } } } ], "scatterpolargl": [ { "type": "scatterpolargl", "marker": { "colorbar": { "ticks": "", "outlinewidth": 0 } } } ], "scatterternary": [ { "type": "scatterternary", "marker": { "colorbar": { "ticks": "", "outlinewidth": 0 } } } ], "histogram2dcontour": [ { "type": "histogram2dcontour", "colorbar": { "ticks": "", "outlinewidth": 0 }, "colorscale": [ [ 0.0, "#0d0887" ], [ 0.1111111111111111, "#46039f" ], [ 0.2222222222222222, "#7201a8" ], [ 0.3333333333333333, "#9c179e" ], [ 0.4444444444444444, "#bd3786" ], [ 0.5555555555555556, "#d8576b" ], [ 0.6666666666666666, "#ed7953" ], [ 0.7777777777777778, "#fb9f3a" ], [ 0.8888888888888888, "#fdca26" ], [ 1.0, "#f0f921" ] ] } ] }, "layout": { "geo": { "bgcolor": "white", "showland": true, "lakecolor": "white", "landcolor": "#E5ECF6", "showlakes": true, "subunitcolor": "white" }, "font": { "color": "#2a3f5f" }, "polar": { "bgcolor": "#E5ECF6", "radialaxis": { "ticks": "", "gridcolor": "white", "linecolor": "white" }, "angularaxis": { "ticks": "", "gridcolor": "white", "linecolor": "white" } }, "scene": { "xaxis": { "ticks": "", "gridcolor": "white", "gridwidth": 2, "linecolor": "white", "zerolinecolor": "white", "showbackground": true, "backgroundcolor": "#E5ECF6" }, "yaxis": { "ticks": "", "gridcolor": "white", "gridwidth": 2, "linecolor": "white", "zerolinecolor": "white", "showbackground": true, "backgroundcolor": "#E5ECF6" }, "zaxis": { "ticks": "", "gridcolor": "white", "gridwidth": 2, "linecolor": "white", "zerolinecolor": "white", "showbackground": true, "backgroundcolor": "#E5ECF6" } }, "title": { "x": 0.05 }, "xaxis": { "ticks": "", "title": { "standoff": 15 }, "gridcolor": "white", "linecolor": "white", "automargin": true, "zerolinecolor": "white", "zerolinewidth": 2 }, "yaxis": { "ticks": "", "title": { "standoff": 15 }, "gridcolor": "white", "linecolor": "white", "automargin": true, "zerolinecolor": "white", "zerolinewidth": 2 }, "mapbox": { "style": "light" }, "ternary": { "aaxis": { "ticks": "", "gridcolor": "white", "linecolor": "white" }, "baxis": { "ticks": "", "gridcolor": "white", "linecolor": "white" }, "caxis": { "ticks": "", "gridcolor": "white", "linecolor": "white" }, "bgcolor": "#E5ECF6" }, "colorway": [ "#636efa", "#EF553B", "#00cc96", "#ab63fa", "#FFA15A", "#19d3f3", "#FF6692", "#B6E880", "#FF97FF", "#FECB52" ], "coloraxis": { "colorbar": { "ticks": "", "outlinewidth": 0 } }, "hovermode": "closest", "colorscale": { "diverging": [ [ 0, "#8e0152" ], [ 0.1, "#c51b7d" ], [ 0.2, "#de77ae" ], [ 0.3, "#f1b6da" ], [ 0.4, "#fde0ef" ], [ 0.5, "#f7f7f7" ], [ 0.6, "#e6f5d0" ], [ 0.7, "#b8e186" ], [ 0.8, "#7fbc41" ], [ 0.9, "#4d9221" ], [ 1, "#276419" ] ], "sequential": [ [ 0.0, "#0d0887" ], [ 0.1111111111111111, "#46039f" ], [ 0.2222222222222222, "#7201a8" ], [ 0.3333333333333333, "#9c179e" ], [ 0.4444444444444444, "#bd3786" ], [ 0.5555555555555556, "#d8576b" ], [ 0.6666666666666666, "#ed7953" ], [ 0.7777777777777778, "#fb9f3a" ], [ 0.8888888888888888, "#fdca26" ], [ 1.0, "#f0f921" ] ], "sequentialminus": [ [ 0.0, "#0d0887" ], [ 0.1111111111111111, "#46039f" ], [ 0.2222222222222222, "#7201a8" ], [ 0.3333333333333333, "#9c179e" ], [ 0.4444444444444444, "#bd3786" ], [ 0.5555555555555556, "#d8576b" ], [ 0.6666666666666666, "#ed7953" ], [ 0.7777777777777778, "#fb9f3a" ], [ 0.8888888888888888, "#fdca26" ], [ 1.0, "#f0f921" ] ] }, "hoverlabel": { "align": "left" }, "plot_bgcolor": "#E5ECF6", "paper_bgcolor": "white", "shapedefaults": { "line": { "color": "#2a3f5f" } }, "autotypenumbers": "strict", "annotationdefaults": { "arrowhead": 0, "arrowcolor": "#2a3f5f", "arrowwidth": 1 } } }, "coloraxis": { "colorbar": { "title": { "text": "uscn score" } }, "showscale": false, "colorscale": [ [ 0, "#E4ECF6" ], [ 0.5, "#FF0000" ], [ 1, "#0000FF" ] ] }, "annotations": [ { "x": 0.35, "y": -0.05, "font": { "size": 12, "color": "blue" }, "text": "Blue = U.S. Aligned.", "xref": "paper", "yref": "paper", "align": "right", "showarrow": false }, { "x": 0.65, "y": -0.05, "font": { "size": 12, "color": "red" }, "text": "Red = China Aligned", "xref": "paper", "yref": "paper", "align": "left", "showarrow": false } ] } }, "height": null, "width": null, "user": { "profile_url": "https://chart-studio.plotly.com/~cs4208", "avatar_url": "https://storage.googleapis.com/plotly-prod-profiles/55.jpg", "background_url": "https://storage.googleapis.com/plotly-prod-profiles/bg-4.jpg", "bio": "", "nickname": "", "website": "", "stream_tokens": null, "feature_set_id": null, "csrf_token": null, "date_joined": "2024-04-21 23:35:57", "mapbox_access_tokens": null, "has_password": null, "username": "cs4208", "email": null, "is_active": null, "readonly": null, "is_dash_creator": null, "dash_created_count": null, "is_chart_creator": null, "charts_created_count": null } }, { "creation_time": "2024-04-30T18:33:12.080807Z", "comments": { "results": [], "count": 0 }, "parented": true, "embed_url": "https://chart-studio.plotly.com/~vbhvsingh595/25.embed", "fid": "vbhvsingh595:25", "filename": "5trajs_fomo1410_02_intcoorsc5c6twist", "filetype": "plot", "img_url": "https://storage.googleapis.com/plotly-prod-images/vbhvsingh595/25/9_BRID2DOGCPH1RC1UWKSFOXYY1VJJGR.png", "image_urls": { "default": "https://storage.googleapis.com/plotly-prod-images/vbhvsingh595/25/2_D6NG8XDIMLCXOFJEA8CO6YF7HUC351.png", "block-thumb": "https://storage.googleapis.com/plotly-prod-images/vbhvsingh595/25/8_PNMM050MWISW0S40KNJWK89ZJKKTVQ.png", "list-thumb": "https://storage.googleapis.com/plotly-prod-images/vbhvsingh595/25/9_BRID2DOGCPH1RC1UWKSFOXYY1VJJGR.png" }, "api_urls": { "files": "https://api.plotly.com/v2/files/vbhvsingh595:25", "plots": "https://api.plotly.com/v2/plots/vbhvsingh595:25", "parent": "https://api.plotly.com/v2/folders/home?user=vbhvsingh595" }, "owner": "vbhvsingh595", "parent": -1, "preview": "", "referencers": [], "references": [], "title": "", "views": 3, "web_url": "https://chart-studio.plotly.com/~vbhvsingh595/25/", "world_readable": true, "date_modified": "2024-05-06T15:59:40.797Z", "stars": { "results": [], "count": 0 }, "collaborators": { "results": [], "count": 0 }, "subfolder_count": null, "refresh_interval": null, "organize_view_url": "https://chart-studio.plotly.com/~vbhvsingh595/25/", "current_user_permission": "read", "is_theme": null, "is_template": false, "autosize": true, "caption": "", "figure": { "data": [ { "line": { "width": 4 }, "meta": { "columnNames": { "x": "A", "y": "B" } }, "mode": "markers+lines", "name": "TRAJ1", "type": "scatter", "xsrc": "vbhvsingh595:24:bd3929", "ysrc": "vbhvsingh595:24:661140", "marker": { "size": 7, "color": "rgb(189, 189, 194)" }, "showlegend": false, "legendgroup": 1 }, { "line": { "width": 4 }, "meta": { "columnNames": { "x": "A", "y": "C" } }, "mode": "markers+lines", "name": "TRAJ2", "type": "scatter", "xsrc": "vbhvsingh595:24:bd3929", "ysrc": "vbhvsingh595:24:ecf065", "marker": { "size": 7, "color": "rgb(182, 176, 175)" }, "visible": true, "showlegend": false, "stackgroup": null }, { "line": { "width": 4 }, "meta": { "columnNames": { "x": "A", "y": "D" } }, "mode": "markers+lines", "name": "TRAJ3", "type": "scatter", "xsrc": "vbhvsingh595:24:bd3929", "ysrc": "vbhvsingh595:24:cb9459", "marker": { "color": "rgb(168, 176, 171)" }, "visible": true, "showlegend": false, "stackgroup": null }, { "line": { "width": 4 }, "meta": { "columnNames": { "x": "A", "y": "F" } }, "mode": "markers+lines", "name": "TRAJ5", "type": "scatter", "xsrc": "vbhvsingh595:24:bd3929", "ysrc": "vbhvsingh595:24:83db08", "marker": { "color": "rgb(160, 162, 162)" }, "showlegend": false, "stackgroup": null }, { "line": { "width": 4 }, "meta": { "columnNames": { "x": "A", "y": "N" } }, "mode": "markers+lines", "name": "TRAJ7", "type": "scatter", "xsrc": "vbhvsingh595:24:bd3929", "ysrc": "vbhvsingh595:24:b7026e", "marker": { "size": 7, "color": "rgb(163, 168, 161)" }, "showlegend": false, "stackgroup": null }, { "line": { "width": 4 }, "meta": { "columnNames": { "x": "A", "y": "O" } }, "mode": "markers+lines", "name": "TRAJ9", "type": "scatter", "xsrc": "vbhvsingh595:24:bd3929", "ysrc": "vbhvsingh595:24:1eacca", "marker": { "size": 7, "color": "rgb(174, 165, 174)" }, "showlegend": false, "stackgroup": null }, { "line": { "width": 4 }, "meta": { "columnNames": { "x": "A", "y": "P" } }, "mode": "markers+lines", "name": "TRAJ10<br>", "type": "scatter", "xsrc": "vbhvsingh595:24:bd3929", "ysrc": "vbhvsingh595:24:573bc0", "marker": { "size": 7, "color": "rgb(169, 168, 166)" }, "showlegend": false, "stackgroup": null }, { "line": { "width": 3 }, "meta": { "columnNames": { "x": "A", "y": "Q" } }, "mode": "markers+lines", "name": "TRAJ8", "type": "scatter", "xsrc": "vbhvsingh595:24:bd3929", "ysrc": "vbhvsingh595:24:42ad97", "marker": { "size": 7, "color": "rgb(192, 189, 187)" }, "showlegend": false, "stackgroup": null }, { "meta": { "columnNames": { "x": "A", "y": "R" } }, "mode": "markers+lines", "name": "TRAJ 11", "type": "scatter", "xsrc": "vbhvsingh595:24:bd3929", "ysrc": "vbhvsingh595:24:b11b7c", "marker": { "size": 7, "color": "rgb(190, 178, 181)" }, "showlegend": false, "stackgroup": null }, { "line": { "width": 4 }, "meta": { "columnNames": { "x": "A", "y": "S" } }, "mode": "markers+lines", "name": "TRAJ 12", "type": "scatter", "xsrc": "vbhvsingh595:24:bd3929", "ysrc": "vbhvsingh595:24:07fe77", "marker": { "size": 7, "color": "rgb(183, 187, 179)" }, "showlegend": false, "stackgroup": null }, { "line": { "width": 4 }, "meta": { "columnNames": { "x": "A", "y": "T" } }, "mode": "markers+lines", "name": "TRAJ 13", "type": "scatter", "xsrc": "vbhvsingh595:24:bd3929", "ysrc": "vbhvsingh595:24:48f542", "marker": { "size": 7, "color": "rgb(186, 187, 192)" }, "showlegend": false, "stackgroup": null }, { "line": { "width": 4 }, "meta": { "columnNames": { "x": "A", "y": "U" } }, "mode": "markers+lines", "name": "TRAJ14", "type": "scatter", "xsrc": "vbhvsingh595:24:bd3929", "ysrc": "vbhvsingh595:24:4e9c3d", "marker": { "size": 7, "color": "rgb(170, 164, 162)" }, "showlegend": false, "stackgroup": null }, { "line": { "width": 4 }, "meta": { "columnNames": { "x": "A", "y": "V" } }, "mode": "markers+lines", "name": "TRAJ 15", "type": "scatter", "xsrc": "vbhvsingh595:24:bd3929", "ysrc": "vbhvsingh595:24:3e5721", "marker": { "size": 7, "color": "rgb(163, 170, 168)" }, "showlegend": false, "stackgroup": null }, { "meta": { "columnNames": { "x": "A", "y": "W" } }, "mode": "markers+lines", "name": "TRAJ17", "type": "scatter", "xsrc": "vbhvsingh595:24:bd3929", "ysrc": "vbhvsingh595:24:e8104c", "marker": { "color": "rgb(168, 163, 172)" }, "showlegend": false, "stackgroup": null }, { "meta": { "columnNames": { "x": "H", "y": "I" } }, "mode": "markers", "name": "S2 -> S1", "type": "scatter", "xsrc": "vbhvsingh595:24:9d32ec", "ysrc": "vbhvsingh595:24:e860f9", "marker": { "size": 10, "color": "rgb(99, 131, 250)", "symbol": "x" }, "stackgroup": null }, { "meta": { "columnNames": { "x": "K", "y": "L" } }, "mode": "markers", "name": "S1 -> S0", "type": "scatter", "xsrc": "vbhvsingh595:24:c2fc86", "ysrc": "vbhvsingh595:24:6c6499", "marker": { "size": 9, "color": "rgb(230, 25, 21)" }, "stackgroup": null } ], "frames": [], "layout": { "font": { "size": 34 }, "title": { "x": 0.5, "text": "FOMO(14,10)_0.2" }, "xaxis": { "type": "linear", "range": [ -64.18908914274229, 1062.1778667381327 ], "ticks": "outside", "title": { "text": "Time (fs)" }, "ticklen": 6, "showgrid": false, "showline": true, "autorange": true, "linecolor": "rgb(1, 7, 18)", "linewidth": 3, "tickwidth": 2 }, "yaxis": { "type": "linear", "range": [ -310, 310 ], "ticks": "outside", "title": { "text": "C5=C6 twist (<sup>o</sup>)" }, "ticklen": 6, "showgrid": false, "showline": true, "autorange": false, "gridcolor": "rgb(1, 6, 15)", "linecolor": "rgb(1, 6, 16)", "linewidth": 3, "tickwidth": 3 }, "legend": { "x": 0.8787688670667394, "y": 1.0954021247678085, "orientation": "h" }, "autosize": true, "template": { "data": { "bar": [ { "type": "bar", "marker": { "colorbar": { "ticks": "", "outlinewidth": 0 } } } ], "table": [ { "type": "table", "cells": { "fill": { "color": "#EBF0F8" }, "line": { "color": "white" } }, "header": { "fill": { "color": "#C8D4E3" }, "line": { "color": "white" } } } ], "carpet": [ { "type": "carpet", "aaxis": { "gridcolor": "#C8D4E3", "linecolor": "#C8D4E3", "endlinecolor": "#2a3f5f", "minorgridcolor": "#C8D4E3", "startlinecolor": "#2a3f5f" }, "baxis": { "gridcolor": "#C8D4E3", "linecolor": "#C8D4E3", "endlinecolor": "#2a3f5f", "minorgridcolor": "#C8D4E3", "startlinecolor": "#2a3f5f" } } ], "mesh3d": [ { "type": "mesh3d", "colorbar": { "ticks": "", "outlinewidth": 0 } } ], "contour": [ { "type": "contour", "colorbar": { "ticks": "", "outlinewidth": 0 }, "autocolorscale": true } ], "heatmap": [ { "type": "heatmap", "colorbar": { "ticks": "", "outlinewidth": 0 }, "autocolorscale": true } ], "scatter": [ { "type": "scatter", "marker": { "colorbar": { "ticks": "", "outlinewidth": 0 } } } ], "surface": [ { "type": "surface", "colorbar": { "ticks": "", "outlinewidth": 0 } } ], "heatmapgl": [ { "type": "heatmapgl", "colorbar": { "ticks": "", "outlinewidth": 0 } } ], "histogram": [ { "type": "histogram", "marker": { "colorbar": { "ticks": "", "outlinewidth": 0 } } } ], "parcoords": [ { "line": { "colorbar": { "ticks": "", "outlinewidth": 0 } }, "type": "parcoords" } ], "scatter3d": [ { "type": "scatter3d", "marker": { "colorbar": { "ticks": "", "outlinewidth": 0 } } } ], "scattergl": [ { "type": "scattergl", "marker": { "colorbar": { "ticks": "", "outlinewidth": 0 } } } ], "choropleth": [ { "type": "choropleth", "colorbar": { "ticks": "", "outlinewidth": 0 } } ], "scattergeo": [ { "type": "scattergeo", "marker": { "colorbar": { "ticks": "", "outlinewidth": 0 } } } ], "histogram2d": [ { "type": "histogram2d", "colorbar": { "ticks": "", "outlinewidth": 0 }, "autocolorscale": true } ], "scatterpolar": [ { "type": "scatterpolar", "marker": { "colorbar": { "ticks": "", "outlinewidth": 0 } } } ], "contourcarpet": [ { "type": "contourcarpet", "colorbar": { "ticks": "", "outlinewidth": 0 } } ], "scattercarpet": [ { "type": "scattercarpet", "marker": { "colorbar": { "ticks": "", "outlinewidth": 0 } } } ], "scattermapbox": [ { "type": "scattermapbox", "marker": { "colorbar": { "ticks": "", "outlinewidth": 0 } } } ], "scatterpolargl": [ { "type": "scatterpolargl", "marker": { "colorbar": { "ticks": "", "outlinewidth": 0 } } } ], "scatterternary": [ { "type": "scatterternary", "marker": { "colorbar": { "ticks": "", "outlinewidth": 0 } } } ], "histogram2dcontour": [ { "type": "histogram2dcontour", "colorbar": { "ticks": "", "outlinewidth": 0 }, "autocolorscale": true } ] }, "layout": { "geo": { "bgcolor": "white", "showland": true, "lakecolor": "white", "landcolor": "white", "showlakes": true, "subunitcolor": "#C8D4E3" }, "font": { "color": "#2a3f5f" }, "polar": { "bgcolor": "white", "radialaxis": { "ticks": "", "gridcolor": "#EBF0F8", "linecolor": "#EBF0F8" }, "angularaxis": { "ticks": "", "gridcolor": "#EBF0F8", "linecolor": "#EBF0F8" } }, "scene": { "xaxis": { "ticks": "", "gridcolor": "#DFE8F3", "gridwidth": 2, "linecolor": "#EBF0F8", "zerolinecolor": "#EBF0F8", "showbackground": true, "backgroundcolor": "white" }, "yaxis": { "ticks": "", "gridcolor": "#DFE8F3", "gridwidth": 2, "linecolor": "#EBF0F8", "zerolinecolor": "#EBF0F8", "showbackground": true, "backgroundcolor": "white" }, "zaxis": { "ticks": "", "gridcolor": "#DFE8F3", "gridwidth": 2, "linecolor": "#EBF0F8", "zerolinecolor": "#EBF0F8", "showbackground": true, "backgroundcolor": "white" } }, "title": { "x": 0.05 }, "xaxis": { "ticks": "", "gridcolor": "#EBF0F8", "linecolor": "#EBF0F8", "automargin": true, "zerolinecolor": "#EBF0F8", "zerolinewidth": 2 }, "yaxis": { "ticks": "", "gridcolor": "#EBF0F8", "linecolor": "#EBF0F8", "automargin": true, "zerolinecolor": "#EBF0F8", "zerolinewidth": 2 }, "ternary": { "aaxis": { "ticks": "", "gridcolor": "#DFE8F3", "linecolor": "#A2B1C6" }, "baxis": { "ticks": "", "gridcolor": "#DFE8F3", "linecolor": "#A2B1C6" }, "caxis": { "ticks": "", "gridcolor": "#DFE8F3", "linecolor": "#A2B1C6" }, "bgcolor": "white" }, "colorway": [ "#636efa", "#EF553B", "#00cc96", "#ab63fa", "#19d3f3", "#e763fa", "#fecb52", "#ffa15a", "#ff6692", "#b6e880" ], "hovermode": "closest", "colorscale": { "diverging": [ [ 0, "#8e0152" ], [ 0.1, "#c51b7d" ], [ 0.2, "#de77ae" ], [ 0.3, "#f1b6da" ], [ 0.4, "#fde0ef" ], [ 0.5, "#f7f7f7" ], [ 0.6, "#e6f5d0" ], [ 0.7, "#b8e186" ], [ 0.8, "#7fbc41" ], [ 0.9, "#4d9221" ], [ 1, "#276419" ] ], "sequential": [ [ 0, "#0508b8" ], [ 0.0893854748603352, "#1910d8" ], [ 0.1787709497206704, "#3c19f0" ], [ 0.2681564245810056, "#6b1cfb" ], [ 0.3575418994413408, "#981cfd" ], [ 0.44692737430167595, "#bf1cfd" ], [ 0.5363128491620112, "#dd2bfd" ], [ 0.6256983240223464, "#f246fe" ], [ 0.7150837988826816, "#fc67fd" ], [ 0.8044692737430168, "#fe88fc" ], [ 0.8938547486033519, "#fea5fd" ], [ 0.9832402234636871, "#febefe" ], [ 1, "#fec3fe" ] ], "sequentialminus": [ [ 0, "#0508b8" ], [ 0.0893854748603352, "#1910d8" ], [ 0.1787709497206704, "#3c19f0" ], [ 0.2681564245810056, "#6b1cfb" ], [ 0.3575418994413408, "#981cfd" ], [ 0.44692737430167595, "#bf1cfd" ], [ 0.5363128491620112, "#dd2bfd" ], [ 0.6256983240223464, "#f246fe" ], [ 0.7150837988826816, "#fc67fd" ], [ 0.8044692737430168, "#fe88fc" ], [ 0.8938547486033519, "#fea5fd" ], [ 0.9832402234636871, "#febefe" ], [ 1, "#fec3fe" ] ] }, "plot_bgcolor": "white", "paper_bgcolor": "white", "shapedefaults": { "line": { "width": 0 }, "opacity": 0.4, "fillcolor": "#506784" }, "annotationdefaults": { "arrowhead": 0, "arrowcolor": "#506784", "arrowwidth": 1 } }, "themeRef": "PLOTLY_WHITE" }, "showlegend": true } }, "height": null, "width": null, "user": { "profile_url": "https://chart-studio.plotly.com/~vbhvsingh595", "avatar_url": "https://storage.googleapis.com/plotly-prod-profiles/7.jpg", "background_url": "https://storage.googleapis.com/plotly-prod-profiles/bg-4.jpg", "bio": "", "nickname": "", "website": "", "stream_tokens": null, "feature_set_id": null, "csrf_token": null, "date_joined": "2024-02-25 16:27:48", "mapbox_access_tokens": null, "has_password": null, "username": "vbhvsingh595", "email": null, "is_active": null, "readonly": null, "is_dash_creator": null, "dash_created_count": null, "is_chart_creator": null, "charts_created_count": null } }, { "creation_time": "2024-04-30T18:30:44.763455Z", "comments": { "results": [], "count": 0 }, "parented": true, "embed_url": "https://chart-studio.plotly.com/~braydenms/1.embed", "fid": "braydenms:1", "filename": "Plot 1", "filetype": "plot", "img_url": "https://storage.googleapis.com/plotly-prod-images/braydenms/1/9_NRT576XXCAIS1SPJMP4H04979IZZFK.png", "image_urls": { "default": "https://storage.googleapis.com/plotly-prod-images/braydenms/1/2_KR6AVAXQ291OHJFC7OLY5OHJ2ZN18B.png", "block-thumb": "https://storage.googleapis.com/plotly-prod-images/braydenms/1/8_YJ1QY0GD2PSZURXOFBEMAEIXDCSLQT.png", "list-thumb": "https://storage.googleapis.com/plotly-prod-images/braydenms/1/9_NRT576XXCAIS1SPJMP4H04979IZZFK.png" }, "api_urls": { "files": "https://api.plotly.com/v2/files/braydenms:1", "plots": "https://api.plotly.com/v2/plots/braydenms:1", "parent": "https://api.plotly.com/v2/folders/home?user=braydenms" }, "owner": "braydenms", "parent": -1, "preview": "", "referencers": [], "references": [], "title": "", "views": 1, "web_url": "https://chart-studio.plotly.com/~braydenms/1/", "world_readable": true, "date_modified": "2024-04-30T18:30:44.775Z", "stars": { "results": [], "count": 0 }, "collaborators": { "results": [], "count": 0 }, "subfolder_count": null, "refresh_interval": null, "organize_view_url": "https://chart-studio.plotly.com/~braydenms/1/", "current_user_permission": "read", "is_theme": null, "is_template": false, "autosize": true, "caption": "", "figure": { "data": [ { "meta": { "columnNames": { "x": "B", "y": "A" } }, "mode": "markers", "type": "scatter", "xsrc": "braydenms:0:ccb20f", "ysrc": "braydenms:0:f6e72e" } ], "frames": [], "layout": { "xaxis": { "type": "category", "range": [ -0.1213235294117647, 2.1213235294117645 ], "title": { "text": "Fan Setting" }, "autorange": true }, "yaxis": { "type": "linear", "range": [ -5.51464766429137, 415.5146476642914 ], "title": { "text": "Output (mV)" }, "autorange": true }, "autosize": true, "template": { "data": { "bar": [ { "type": "bar", "marker": { "colorbar": { "ticks": "", "outlinewidth": 0 } } } ], "table": [ { "type": "table", "cells": { "fill": { "color": "#EBF0F8" }, "line": { "color": "white" } }, "header": { "fill": { "color": "#C8D4E3" }, "line": { "color": "white" } } } ], "carpet": [ { "type": "carpet", "aaxis": { "gridcolor": "#C8D4E3", "linecolor": "#C8D4E3", "endlinecolor": "#2a3f5f", "minorgridcolor": "#C8D4E3", "startlinecolor": "#2a3f5f" }, "baxis": { "gridcolor": "#C8D4E3", "linecolor": "#C8D4E3", "endlinecolor": "#2a3f5f", "minorgridcolor": "#C8D4E3", "startlinecolor": "#2a3f5f" } } ], "mesh3d": [ { "type": "mesh3d", "colorbar": { "ticks": "", "outlinewidth": 0 } } ], "contour": [ { "type": "contour", "colorbar": { "ticks": "", "outlinewidth": 0 }, "autocolorscale": true } ], "heatmap": [ { "type": "heatmap", "colorbar": { "ticks": "", "outlinewidth": 0 }, "autocolorscale": true } ], "scatter": [ { "type": "scatter", "marker": { "colorbar": { "ticks": "", "outlinewidth": 0 } } } ], "surface": [ { "type": "surface", "colorbar": { "ticks": "", "outlinewidth": 0 } } ], "heatmapgl": [ { "type": "heatmapgl", "colorbar": { "ticks": "", "outlinewidth": 0 } } ], "histogram": [ { "type": "histogram", "marker": { "colorbar": { "ticks": "", "outlinewidth": 0 } } } ], "parcoords": [ { "line": { "colorbar": { "ticks": "", "outlinewidth": 0 } }, "type": "parcoords" } ], "scatter3d": [ { "type": "scatter3d", "marker": { "colorbar": { "ticks": "", "outlinewidth": 0 } } } ], "scattergl": [ { "type": "scattergl", "marker": { "colorbar": { "ticks": "", "outlinewidth": 0 } } } ], "choropleth": [ { "type": "choropleth", "colorbar": { "ticks": "", "outlinewidth": 0 } } ], "scattergeo": [ { "type": "scattergeo", "marker": { "colorbar": { "ticks": "", "outlinewidth": 0 } } } ], "histogram2d": [ { "type": "histogram2d", "colorbar": { "ticks": "", "outlinewidth": 0 }, "autocolorscale": true } ], "scatterpolar": [ { "type": "scatterpolar", "marker": { "colorbar": { "ticks": "", "outlinewidth": 0 } } } ], "contourcarpet": [ { "type": "contourcarpet", "colorbar": { "ticks": "", "outlinewidth": 0 } } ], "scattercarpet": [ { "type": "scattercarpet", "marker": { "colorbar": { "ticks": "", "outlinewidth": 0 } } } ], "scattermapbox": [ { "type": "scattermapbox", "marker": { "colorbar": { "ticks": "", "outlinewidth": 0 } } } ], "scatterpolargl": [ { "type": "scatterpolargl", "marker": { "colorbar": { "ticks": "", "outlinewidth": 0 } } } ], "scatterternary": [ { "type": "scatterternary", "marker": { "colorbar": { "ticks": "", "outlinewidth": 0 } } } ], "histogram2dcontour": [ { "type": "histogram2dcontour", "colorbar": { "ticks": "", "outlinewidth": 0 }, "autocolorscale": true } ] }, "layout": { "geo": { "bgcolor": "white", "showland": true, "lakecolor": "white", "landcolor": "white", "showlakes": true, "subunitcolor": "#C8D4E3" }, "font": { "color": "#2a3f5f" }, "polar": { "bgcolor": "white", "radialaxis": { "ticks": "", "gridcolor": "#EBF0F8", "linecolor": "#EBF0F8" }, "angularaxis": { "ticks": "", "gridcolor": "#EBF0F8", "linecolor": "#EBF0F8" } }, "scene": { "xaxis": { "ticks": "", "gridcolor": "#DFE8F3", "gridwidth": 2, "linecolor": "#EBF0F8", "zerolinecolor": "#EBF0F8", "showbackground": true, "backgroundcolor": "white" }, "yaxis": { "ticks": "", "gridcolor": "#DFE8F3", "gridwidth": 2, "linecolor": "#EBF0F8", "zerolinecolor": "#EBF0F8", "showbackground": true, "backgroundcolor": "white" }, "zaxis": { "ticks": "", "gridcolor": "#DFE8F3", "gridwidth": 2, "linecolor": "#EBF0F8", "zerolinecolor": "#EBF0F8", "showbackground": true, "backgroundcolor": "white" } }, "title": { "x": 0.05 }, "xaxis": { "ticks": "", "gridcolor": "#EBF0F8", "linecolor": "#EBF0F8", "automargin": true, "zerolinecolor": "#EBF0F8", "zerolinewidth": 2 }, "yaxis": { "ticks": "", "gridcolor": "#EBF0F8", "linecolor": "#EBF0F8", "automargin": true, "zerolinecolor": "#EBF0F8", "zerolinewidth": 2 }, "ternary": { "aaxis": { "ticks": "", "gridcolor": "#DFE8F3", "linecolor": "#A2B1C6" }, "baxis": { "ticks": "", "gridcolor": "#DFE8F3", "linecolor": "#A2B1C6" }, "caxis": { "ticks": "", "gridcolor": "#DFE8F3", "linecolor": "#A2B1C6" }, "bgcolor": "white" }, "colorway": [ "#636efa", "#EF553B", "#00cc96", "#ab63fa", "#19d3f3", "#e763fa", "#fecb52", "#ffa15a", "#ff6692", "#b6e880" ], "hovermode": "closest", "colorscale": { "diverging": [ [ 0, "#8e0152" ], [ 0.1, "#c51b7d" ], [ 0.2, "#de77ae" ], [ 0.3, "#f1b6da" ], [ 0.4, "#fde0ef" ], [ 0.5, "#f7f7f7" ], [ 0.6, "#e6f5d0" ], [ 0.7, "#b8e186" ], [ 0.8, "#7fbc41" ], [ 0.9, "#4d9221" ], [ 1, "#276419" ] ], "sequential": [ [ 0, "#0508b8" ], [ 0.0893854748603352, "#1910d8" ], [ 0.1787709497206704, "#3c19f0" ], [ 0.2681564245810056, "#6b1cfb" ], [ 0.3575418994413408, "#981cfd" ], [ 0.44692737430167595, "#bf1cfd" ], [ 0.5363128491620112, "#dd2bfd" ], [ 0.6256983240223464, "#f246fe" ], [ 0.7150837988826816, "#fc67fd" ], [ 0.8044692737430168, "#fe88fc" ], [ 0.8938547486033519, "#fea5fd" ], [ 0.9832402234636871, "#febefe" ], [ 1, "#fec3fe" ] ], "sequentialminus": [ [ 0, "#0508b8" ], [ 0.0893854748603352, "#1910d8" ], [ 0.1787709497206704, "#3c19f0" ], [ 0.2681564245810056, "#6b1cfb" ], [ 0.3575418994413408, "#981cfd" ], [ 0.44692737430167595, "#bf1cfd" ], [ 0.5363128491620112, "#dd2bfd" ], [ 0.6256983240223464, "#f246fe" ], [ 0.7150837988826816, "#fc67fd" ], [ 0.8044692737430168, "#fe88fc" ], [ 0.8938547486033519, "#fea5fd" ], [ 0.9832402234636871, "#febefe" ], [ 1, "#fec3fe" ] ] }, "plot_bgcolor": "white", "paper_bgcolor": "white", "shapedefaults": { "line": { "width": 0 }, "opacity": 0.4, "fillcolor": "#506784" }, "annotationdefaults": { "arrowhead": 0, "arrowcolor": "#506784", "arrowwidth": 1 } }, "themeRef": "PLOTLY_WHITE" } } }, "height": null, "width": null, "user": { "profile_url": "https://chart-studio.plotly.com/~braydenms", "avatar_url": "https://storage.googleapis.com/plotly-prod-profiles/61.jpg", "background_url": "https://storage.googleapis.com/plotly-prod-profiles/bg-5.jpg", "bio": "", "nickname": "", "website": "", "stream_tokens": null, "feature_set_id": null, "csrf_token": null, "date_joined": "2024-04-30 18:30:23", "mapbox_access_tokens": null, "has_password": null, "username": "braydenms", "email": null, "is_active": null, "readonly": null, "is_dash_creator": null, "dash_created_count": null, "is_chart_creator": null, "charts_created_count": null } }, { "creation_time": "2024-04-30T18:17:41.227026Z", "comments": { "results": [], "count": 0 }, "parented": true, "embed_url": "https://chart-studio.plotly.com/~r3my/1.embed", "fid": "r3my:1", "filename": "Plot 1", "filetype": "plot", "img_url": "https://storage.googleapis.com/plotly-prod-images/r3my/1/9_B2HAXW2CI8NLD4DB0RTQA73VZZ3UN9.png", "image_urls": { "default": "https://storage.googleapis.com/plotly-prod-images/r3my/1/2_RSBDMS0HYW890WDZD4R4RAI4GFYS1D.png", "block-thumb": "https://storage.googleapis.com/plotly-prod-images/r3my/1/8_U2H2YQY7FVYLBD0B1JZM89CH17ETZB.png", "list-thumb": "https://storage.googleapis.com/plotly-prod-images/r3my/1/9_B2HAXW2CI8NLD4DB0RTQA73VZZ3UN9.png" }, "api_urls": { "files": "https://api.plotly.com/v2/files/r3my:1", "plots": "https://api.plotly.com/v2/plots/r3my:1", "parent": "https://api.plotly.com/v2/folders/home?user=r3my" }, "owner": "r3my", "parent": -1, "preview": "", "referencers": [], "references": [], "title": "", "views": 1, "web_url": "https://chart-studio.plotly.com/~r3my/1/", "world_readable": true, "date_modified": "2024-04-30T18:17:41.237Z", "stars": { "results": [], "count": 0 }, "collaborators": { "results": [], "count": 0 }, "subfolder_count": null, "refresh_interval": null, "organize_view_url": "https://chart-studio.plotly.com/~r3my/1/", "current_user_permission": "read", "is_theme": null, "is_template": false, "autosize": true, "caption": "", "figure": { "data": [ { "meta": { "columnNames": { "x": "B", "y": "A" } }, "mode": "lines", "type": "scatter", "xsrc": "r3my:0:056323", "ysrc": "r3my:0:2fe5c8", "stackgroup": null }, { "meta": { "columnNames": { "x": "B", "y": "A" } }, "mode": "lines", "type": "scatter", "xsrc": "r3my:0:056323", "ysrc": "r3my:0:2fe5c8", "visible": "legendonly" }, { "mode": "lines", "type": "scatter", "stackgroup": null } ], "frames": [], "layout": { "title": { "text": "3 Year Projections" }, "xaxis": { "type": "linear", "range": [ 0, 3 ], "title": { "text": "Years" }, "autorange": true }, "yaxis": { "type": "linear", "range": [ -1.25, 23.75 ], "title": { "text": "Units X 100" }, "autorange": true }, "autosize": true, "template": { "data": { "bar": [ { "type": "bar", "marker": { "colorbar": { "ticks": "outside", "ticklen": 8, "tickcolor": "rgb(36,36,36)", "tickwidth": 2, "outlinewidth": 0 } } } ], "table": [ { "type": "table", "cells": { "fill": { "color": "rgb(231,231,240)" }, "line": { "color": "white" } }, "header": { "fill": { "color": "rgb(183,183,191)" }, "line": { "color": "white" } } } ], "carpet": [ { "type": "carpet", "aaxis": { "gridcolor": "white", "linecolor": "white", "endlinecolor": "rgb(36,36,36)", "minorgridcolor": "white", "startlinecolor": "rgb(36,36,36)" }, "baxis": { "gridcolor": "white", "linecolor": "white", "endlinecolor": "rgb(36,36,36)", "minorgridcolor": "white", "startlinecolor": "rgb(36,36,36)" } } ], "mesh3d": [ { "type": "mesh3d", "colorbar": { "ticks": "outside", "ticklen": 8, "tickcolor": "rgb(36,36,36)", "tickwidth": 2, "outlinewidth": 0 } } ], "contour": [ { "type": "contour", "colorbar": { "ticks": "outside", "ticklen": 8, "tickcolor": "rgb(36,36,36)", "tickwidth": 2, "outlinewidth": 0 }, "autocolorscale": true } ], "heatmap": [ { "type": "heatmap", "colorbar": { "ticks": "outside", "ticklen": 8, "tickcolor": "rgb(36,36,36)", "tickwidth": 2, "outlinewidth": 0 }, "autocolorscale": true } ], "scatter": [ { "type": "scatter", "marker": { "colorbar": { "ticks": "outside", "ticklen": 8, "tickcolor": "rgb(36,36,36)", "tickwidth": 2, "outlinewidth": 0 } } } ], "surface": [ { "type": "surface", "colorbar": { "ticks": "outside", "ticklen": 8, "tickcolor": "rgb(36,36,36)", "tickwidth": 2, "outlinewidth": 0 } } ], "heatmapgl": [ { "type": "heatmapgl", "colorbar": { "ticks": "outside", "ticklen": 8, "tickcolor": "rgb(36,36,36)", "tickwidth": 2, "outlinewidth": 0 } } ], "histogram": [ { "type": "histogram", "marker": { "colorbar": { "ticks": "outside", "ticklen": 8, "tickcolor": "rgb(36,36,36)", "tickwidth": 2, "outlinewidth": 0 } } } ], "parcoords": [ { "line": { "colorbar": { "ticks": "outside", "ticklen": 8, "tickcolor": "rgb(36,36,36)", "tickwidth": 2, "outlinewidth": 0 } }, "type": "parcoords" } ], "scatter3d": [ { "type": "scatter3d", "marker": { "colorbar": { "ticks": "outside", "ticklen": 8, "tickcolor": "rgb(36,36,36)", "tickwidth": 2, "outlinewidth": 0 } } } ], "scattergl": [ { "type": "scattergl", "marker": { "colorbar": { "ticks": "outside", "ticklen": 8, "tickcolor": "rgb(36,36,36)", "tickwidth": 2, "outlinewidth": 0 } } } ], "choropleth": [ { "type": "choropleth", "colorbar": { "ticks": "outside", "ticklen": 8, "tickcolor": "rgb(36,36,36)", "tickwidth": 2, "outlinewidth": 0 } } ], "scattergeo": [ { "type": "scattergeo", "marker": { "colorbar": { "ticks": "outside", "ticklen": 8, "tickcolor": "rgb(36,36,36)", "tickwidth": 2, "outlinewidth": 0 } } } ], "histogram2d": [ { "type": "histogram2d", "colorbar": { "ticks": "outside", "ticklen": 8, "tickcolor": "rgb(36,36,36)", "tickwidth": 2, "outlinewidth": 0 }, "autocolorscale": true } ], "scatterpolar": [ { "type": "scatterpolar", "marker": { "colorbar": { "ticks": "outside", "ticklen": 8, "tickcolor": "rgb(36,36,36)", "tickwidth": 2, "outlinewidth": 0 } } } ], "contourcarpet": [ { "type": "contourcarpet", "colorbar": { "ticks": "outside", "ticklen": 8, "tickcolor": "rgb(36,36,36)", "tickwidth": 2, "outlinewidth": 0 } } ], "scattercarpet": [ { "type": "scattercarpet", "marker": { "colorbar": { "ticks": "outside", "ticklen": 8, "tickcolor": "rgb(36,36,36)", "tickwidth": 2, "outlinewidth": 0 } } } ], "scattermapbox": [ { "type": "scattermapbox", "marker": { "colorbar": { "ticks": "outside", "ticklen": 8, "tickcolor": "rgb(36,36,36)", "tickwidth": 2, "outlinewidth": 0 } } } ], "scatterpolargl": [ { "type": "scatterpolargl", "marker": { "colorbar": { "ticks": "outside", "ticklen": 8, "tickcolor": "rgb(36,36,36)", "tickwidth": 2, "outlinewidth": 0 } } } ], "scatterternary": [ { "type": "scatterternary", "marker": { "colorbar": { "ticks": "outside", "ticklen": 8, "tickcolor": "rgb(36,36,36)", "tickwidth": 2, "outlinewidth": 0 } } } ], "histogram2dcontour": [ { "type": "histogram2dcontour", "colorbar": { "ticks": "outside", "ticklen": 8, "tickcolor": "rgb(36,36,36)", "tickwidth": 2, "outlinewidth": 0 }, "autocolorscale": true } ] }, "layout": { "geo": { "bgcolor": "white", "showland": true, "lakecolor": "white", "landcolor": "rgb(234,234,242)", "showlakes": true, "subunitcolor": "white" }, "font": { "color": "rgb(36,36,36)" }, "polar": { "bgcolor": "rgb(234,234,242)", "radialaxis": { "ticks": "", "showgrid": true, "gridcolor": "white", "linecolor": "white" }, "angularaxis": { "ticks": "", "showgrid": true, "gridcolor": "white", "linecolor": "white" } }, "scene": { "xaxis": { "ticks": "", "showgrid": true, "gridcolor": "white", "gridwidth": 2, "linecolor": "white", "zerolinecolor": "white", "showbackground": true, "backgroundcolor": "rgb(234,234,242)" }, "yaxis": { "ticks": "", "showgrid": true, "gridcolor": "white", "gridwidth": 2, "linecolor": "white", "zerolinecolor": "white", "showbackground": true, "backgroundcolor": "rgb(234,234,242)" }, "zaxis": { "ticks": "", "showgrid": true, "gridcolor": "white", "gridwidth": 2, "linecolor": "white", "zerolinecolor": "white", "showbackground": true, "backgroundcolor": "rgb(234,234,242)" } }, "xaxis": { "ticks": "", "showgrid": true, "gridcolor": "white", "linecolor": "white", "automargin": true, "zerolinecolor": "white" }, "yaxis": { "ticks": "", "showgrid": true, "gridcolor": "white", "linecolor": "white", "automargin": true, "zerolinecolor": "white" }, "ternary": { "aaxis": { "ticks": "", "showgrid": true, "gridcolor": "white", "linecolor": "white" }, "baxis": { "ticks": "", "showgrid": true, "gridcolor": "white", "linecolor": "white" }, "caxis": { "ticks": "", "showgrid": true, "gridcolor": "white", "linecolor": "white" }, "bgcolor": "rgb(234,234,242)" }, "colorway": [ "rgb(76,114,176)", "rgb(221,132,82)", "rgb(85,168,104)", "rgb(196,78,82)", "rgb(129,114,179)", "rgb(147,120,96)", "rgb(218,139,195)", "rgb(140,140,140)", "rgb(204,185,116)", "rgb(100,181,205)" ], "hovermode": "closest", "colorscale": { "diverging": [ [ 0, "#67001f" ], [ 0.1, "#b2182b" ], [ 0.2, "#d6604d" ], [ 0.3, "#f4a582" ], [ 0.4, "#fddbc7" ], [ 0.5, "#f7f7f7" ], [ 0.6, "#d1e5f0" ], [ 0.7, "#92c5de" ], [ 0.8, "#4393c3" ], [ 0.9, "#2166ac" ], [ 1, "#053061" ] ], "sequential": [ [ 0, "rgb(2,4,25)" ], [ 0.06274509803921569, "rgb(24,15,41)" ], [ 0.12549019607843137, "rgb(47,23,57)" ], [ 0.18823529411764706, "rgb(71,28,72)" ], [ 0.25098039215686274, "rgb(97,30,82)" ], [ 0.3137254901960784, "rgb(123,30,89)" ], [ 0.3764705882352941, "rgb(150,27,91)" ], [ 0.4392156862745098, "rgb(177,22,88)" ], [ 0.5019607843137255, "rgb(203,26,79)" ], [ 0.5647058823529412, "rgb(223,47,67)" ], [ 0.6274509803921569, "rgb(236,76,61)" ], [ 0.6901960784313725, "rgb(242,107,73)" ], [ 0.7529411764705882, "rgb(244,135,95)" ], [ 0.8156862745098039, "rgb(245,162,122)" ], [ 0.8784313725490196, "rgb(246,188,153)" ], [ 0.9411764705882353, "rgb(247,212,187)" ], [ 1, "rgb(250,234,220)" ] ], "sequentialminus": [ [ 0, "rgb(2,4,25)" ], [ 0.06274509803921569, "rgb(24,15,41)" ], [ 0.12549019607843137, "rgb(47,23,57)" ], [ 0.18823529411764706, "rgb(71,28,72)" ], [ 0.25098039215686274, "rgb(97,30,82)" ], [ 0.3137254901960784, "rgb(123,30,89)" ], [ 0.3764705882352941, "rgb(150,27,91)" ], [ 0.4392156862745098, "rgb(177,22,88)" ], [ 0.5019607843137255, "rgb(203,26,79)" ], [ 0.5647058823529412, "rgb(223,47,67)" ], [ 0.6274509803921569, "rgb(236,76,61)" ], [ 0.6901960784313725, "rgb(242,107,73)" ], [ 0.7529411764705882, "rgb(244,135,95)" ], [ 0.8156862745098039, "rgb(245,162,122)" ], [ 0.8784313725490196, "rgb(246,188,153)" ], [ 0.9411764705882353, "rgb(247,212,187)" ], [ 1, "rgb(250,234,220)" ] ] }, "plot_bgcolor": "rgb(234,234,242)", "paper_bgcolor": "white", "shapedefaults": { "line": { "width": 0 }, "opacity": 0.5, "fillcolor": "rgb(67,103,167)" }, "annotationdefaults": { "arrowcolor": "rgb(67,103,167)" } }, "themeRef": "SEABORN" } } }, "height": null, "width": null, "user": { "profile_url": "https://chart-studio.plotly.com/~r3my", "avatar_url": "https://storage.googleapis.com/plotly-prod-profiles/63.jpg", "background_url": "https://storage.googleapis.com/plotly-prod-profiles/bg-11.jpg", "bio": "", "nickname": "", "website": "", "stream_tokens": null, "feature_set_id": null, "csrf_token": null, "date_joined": "2024-04-30 18:16:09", "mapbox_access_tokens": null, "has_password": null, "username": "r3my", "email": null, "is_active": null, "readonly": null, "is_dash_creator": null, "dash_created_count": null, "is_chart_creator": null, "charts_created_count": null } }, { "creation_time": "2024-04-30T18:06:42.216392Z", "comments": { "results": [], "count": 0 }, "parented": true, "embed_url": "https://chart-studio.plotly.com/~vbhvsingh595/23.embed", "fid": "vbhvsingh595:23", "filename": "5trajs_fomo1410_intcoorsc6pyr", "filetype": "plot", "img_url": "https://storage.googleapis.com/plotly-prod-images/vbhvsingh595/23/9_RSO4UCYC8DMHTYFFROSMASPXPTLURM.png", "image_urls": { "default": "https://storage.googleapis.com/plotly-prod-images/vbhvsingh595/23/2_IOCGMP6IOCMQ6AS1R603G39D6GPKU9.png", "block-thumb": "https://storage.googleapis.com/plotly-prod-images/vbhvsingh595/23/8_Q3TXEKBCVSFW9HHC3BO8XRWOXALIY2.png", "list-thumb": "https://storage.googleapis.com/plotly-prod-images/vbhvsingh595/23/9_RSO4UCYC8DMHTYFFROSMASPXPTLURM.png" }, "api_urls": { "files": "https://api.plotly.com/v2/files/vbhvsingh595:23", "plots": "https://api.plotly.com/v2/plots/vbhvsingh595:23", "parent": "https://api.plotly.com/v2/folders/home?user=vbhvsingh595" }, "owner": "vbhvsingh595", "parent": -1, "preview": "", "referencers": [], "references": [], "title": "", "views": 3, "web_url": "https://chart-studio.plotly.com/~vbhvsingh595/23/", "world_readable": true, "date_modified": "2024-04-30T18:07:12.340Z", "stars": { "results": [], "count": 0 }, "collaborators": { "results": [], "count": 0 }, "subfolder_count": null, "refresh_interval": null, "organize_view_url": "https://chart-studio.plotly.com/~vbhvsingh595/23/", "current_user_permission": "read", "is_theme": null, "is_template": false, "autosize": true, "caption": "", "figure": { "data": [ { "line": { "width": 4 }, "meta": { "columnNames": { "x": "A", "y": "B" } }, "mode": "markers+lines", "name": "TRAJ1", "type": "scatter", "xsrc": "vbhvsingh595:22:6dc0d1", "ysrc": "vbhvsingh595:22:a68165", "marker": { "size": 7, "color": "rgb(189, 189, 194)" }, "showlegend": false, "legendgroup": 1 }, { "line": { "width": 4 }, "meta": { "columnNames": { "x": "A", "y": "C" } }, "mode": "markers+lines", "name": "TRAJ2", "type": "scatter", "xsrc": "vbhvsingh595:22:6dc0d1", "ysrc": "vbhvsingh595:22:75d629", "marker": { "size": 7, "color": "rgb(182, 176, 175)" }, "visible": true, "showlegend": false, "stackgroup": null }, { "line": { "width": 4 }, "meta": { "columnNames": { "x": "A", "y": "D" } }, "mode": "markers+lines", "name": "TRAJ3", "type": "scatter", "xsrc": "vbhvsingh595:22:6dc0d1", "ysrc": "vbhvsingh595:22:4e79af", "marker": { "color": "rgb(168, 176, 171)" }, "visible": true, "showlegend": false, "stackgroup": null }, { "line": { "width": 4 }, "meta": { "columnNames": { "x": "A", "y": "E" } }, "mode": "markers+lines", "name": "TRAJ4", "type": "scatter", "xsrc": "vbhvsingh595:22:6dc0d1", "ysrc": "vbhvsingh595:22:409a13", "marker": { "color": "rgb(167, 165, 169)" }, "visible": true, "showlegend": false, "stackgroup": null }, { "line": { "width": 4 }, "meta": { "columnNames": { "x": "A", "y": "F" } }, "mode": "markers+lines", "name": "TRAJ5", "type": "scatter", "xsrc": "vbhvsingh595:22:6dc0d1", "ysrc": "vbhvsingh595:22:a26c30", "marker": { "color": "rgb(160, 162, 162)" }, "showlegend": false, "stackgroup": null }, { "meta": { "columnNames": { "x": "H", "y": "I" } }, "mode": "markers", "name": "S2 -> S1", "type": "scatter", "xsrc": "vbhvsingh595:22:fbf4b8", "ysrc": "vbhvsingh595:22:74d687", "marker": { "size": 10, "color": "rgb(99, 131, 250)", "symbol": "x" }, "stackgroup": null }, { "meta": { "columnNames": { "x": "L", "y": "M" } }, "mode": "markers", "name": "S1 -> S0", "type": "scatter", "xsrc": "vbhvsingh595:22:4cec92", "ysrc": "vbhvsingh595:22:f834bd", "marker": { "size": 9, "color": "rgb(230, 25, 21)" }, "stackgroup": null } ], "frames": [], "layout": { "font": { "size": 34 }, "title": { "x": 0.5, "text": "FOMO(14,10)_0.3" }, "xaxis": { "type": "linear", "range": [ -29.570687082333095, 507.5706870823331 ], "ticks": "outside", "title": { "text": "Time (fs)" }, "ticklen": 6, "showgrid": false, "showline": true, "autorange": true, "linecolor": "rgb(1, 7, 18)", "linewidth": 3, "tickwidth": 2 }, "yaxis": { "type": "linear", "range": [ 99.90774490840522, 245.02353918786508 ], "ticks": "outside", "title": { "text": "C6 Pyr (<sup>o</sup>)" }, "ticklen": 6, "showgrid": false, "showline": true, "autorange": true, "gridcolor": "rgb(1, 6, 15)", "linecolor": "rgb(1, 6, 16)", "linewidth": 3, "tickwidth": 3 }, "legend": { "x": 0.7700627701782436, "y": 1.1279322172200108, "orientation": "h" }, "autosize": true, "template": { "data": { "bar": [ { "type": "bar", "marker": { "colorbar": { "ticks": "", "outlinewidth": 0 } } } ], "table": [ { "type": "table", "cells": { "fill": { "color": "#EBF0F8" }, "line": { "color": "white" } }, "header": { "fill": { "color": "#C8D4E3" }, "line": { "color": "white" } } } ], "carpet": [ { "type": "carpet", "aaxis": { "gridcolor": "#C8D4E3", "linecolor": "#C8D4E3", "endlinecolor": "#2a3f5f", "minorgridcolor": "#C8D4E3", "startlinecolor": "#2a3f5f" }, "baxis": { "gridcolor": "#C8D4E3", "linecolor": "#C8D4E3", "endlinecolor": "#2a3f5f", "minorgridcolor": "#C8D4E3", "startlinecolor": "#2a3f5f" } } ], "mesh3d": [ { "type": "mesh3d", "colorbar": { "ticks": "", "outlinewidth": 0 } } ], "contour": [ { "type": "contour", "colorbar": { "ticks": "", "outlinewidth": 0 }, "autocolorscale": true } ], "heatmap": [ { "type": "heatmap", "colorbar": { "ticks": "", "outlinewidth": 0 }, "autocolorscale": true } ], "scatter": [ { "type": "scatter", "marker": { "colorbar": { "ticks": "", "outlinewidth": 0 } } } ], "surface": [ { "type": "surface", "colorbar": { "ticks": "", "outlinewidth": 0 } } ], "heatmapgl": [ { "type": "heatmapgl", "colorbar": { "ticks": "", "outlinewidth": 0 } } ], "histogram": [ { "type": "histogram", "marker": { "colorbar": { "ticks": "", "outlinewidth": 0 } } } ], "parcoords": [ { "line": { "colorbar": { "ticks": "", "outlinewidth": 0 } }, "type": "parcoords" } ], "scatter3d": [ { "type": "scatter3d", "marker": { "colorbar": { "ticks": "", "outlinewidth": 0 } } } ], "scattergl": [ { "type": "scattergl", "marker": { "colorbar": { "ticks": "", "outlinewidth": 0 } } } ], "choropleth": [ { "type": "choropleth", "colorbar": { "ticks": "", "outlinewidth": 0 } } ], "scattergeo": [ { "type": "scattergeo", "marker": { "colorbar": { "ticks": "", "outlinewidth": 0 } } } ], "histogram2d": [ { "type": "histogram2d", "colorbar": { "ticks": "", "outlinewidth": 0 }, "autocolorscale": true } ], "scatterpolar": [ { "type": "scatterpolar", "marker": { "colorbar": { "ticks": "", "outlinewidth": 0 } } } ], "contourcarpet": [ { "type": "contourcarpet", "colorbar": { "ticks": "", "outlinewidth": 0 } } ], "scattercarpet": [ { "type": "scattercarpet", "marker": { "colorbar": { "ticks": "", "outlinewidth": 0 } } } ], "scattermapbox": [ { "type": "scattermapbox", "marker": { "colorbar": { "ticks": "", "outlinewidth": 0 } } } ], "scatterpolargl": [ { "type": "scatterpolargl", "marker": { "colorbar": { "ticks": "", "outlinewidth": 0 } } } ], "scatterternary": [ { "type": "scatterternary", "marker": { "colorbar": { "ticks": "", "outlinewidth": 0 } } } ], "histogram2dcontour": [ { "type": "histogram2dcontour", "colorbar": { "ticks": "", "outlinewidth": 0 }, "autocolorscale": true } ] }, "layout": { "geo": { "bgcolor": "white", "showland": true, "lakecolor": "white", "landcolor": "white", "showlakes": true, "subunitcolor": "#C8D4E3" }, "font": { "color": "#2a3f5f" }, "polar": { "bgcolor": "white", "radialaxis": { "ticks": "", "gridcolor": "#EBF0F8", "linecolor": "#EBF0F8" }, "angularaxis": { "ticks": "", "gridcolor": "#EBF0F8", "linecolor": "#EBF0F8" } }, "scene": { "xaxis": { "ticks": "", "gridcolor": "#DFE8F3", "gridwidth": 2, "linecolor": "#EBF0F8", "zerolinecolor": "#EBF0F8", "showbackground": true, "backgroundcolor": "white" }, "yaxis": { "ticks": "", "gridcolor": "#DFE8F3", "gridwidth": 2, "linecolor": "#EBF0F8", "zerolinecolor": "#EBF0F8", "showbackground": true, "backgroundcolor": "white" }, "zaxis": { "ticks": "", "gridcolor": "#DFE8F3", "gridwidth": 2, "linecolor": "#EBF0F8", "zerolinecolor": "#EBF0F8", "showbackground": true, "backgroundcolor": "white" } }, "title": { "x": 0.05 }, "xaxis": { "ticks": "", "gridcolor": "#EBF0F8", "linecolor": "#EBF0F8", "automargin": true, "zerolinecolor": "#EBF0F8", "zerolinewidth": 2 }, "yaxis": { "ticks": "", "gridcolor": "#EBF0F8", "linecolor": "#EBF0F8", "automargin": true, "zerolinecolor": "#EBF0F8", "zerolinewidth": 2 }, "ternary": { "aaxis": { "ticks": "", "gridcolor": "#DFE8F3", "linecolor": "#A2B1C6" }, "baxis": { "ticks": "", "gridcolor": "#DFE8F3", "linecolor": "#A2B1C6" }, "caxis": { "ticks": "", "gridcolor": "#DFE8F3", "linecolor": "#A2B1C6" }, "bgcolor": "white" }, "colorway": [ "#636efa", "#EF553B", "#00cc96", "#ab63fa", "#19d3f3", "#e763fa", "#fecb52", "#ffa15a", "#ff6692", "#b6e880" ], "hovermode": "closest", "colorscale": { "diverging": [ [ 0, "#8e0152" ], [ 0.1, "#c51b7d" ], [ 0.2, "#de77ae" ], [ 0.3, "#f1b6da" ], [ 0.4, "#fde0ef" ], [ 0.5, "#f7f7f7" ], [ 0.6, "#e6f5d0" ], [ 0.7, "#b8e186" ], [ 0.8, "#7fbc41" ], [ 0.9, "#4d9221" ], [ 1, "#276419" ] ], "sequential": [ [ 0, "#0508b8" ], [ 0.0893854748603352, "#1910d8" ], [ 0.1787709497206704, "#3c19f0" ], [ 0.2681564245810056, "#6b1cfb" ], [ 0.3575418994413408, "#981cfd" ], [ 0.44692737430167595, "#bf1cfd" ], [ 0.5363128491620112, "#dd2bfd" ], [ 0.6256983240223464, "#f246fe" ], [ 0.7150837988826816, "#fc67fd" ], [ 0.8044692737430168, "#fe88fc" ], [ 0.8938547486033519, "#fea5fd" ], [ 0.9832402234636871, "#febefe" ], [ 1, "#fec3fe" ] ], "sequentialminus": [ [ 0, "#0508b8" ], [ 0.0893854748603352, "#1910d8" ], [ 0.1787709497206704, "#3c19f0" ], [ 0.2681564245810056, "#6b1cfb" ], [ 0.3575418994413408, "#981cfd" ], [ 0.44692737430167595, "#bf1cfd" ], [ 0.5363128491620112, "#dd2bfd" ], [ 0.6256983240223464, "#f246fe" ], [ 0.7150837988826816, "#fc67fd" ], [ 0.8044692737430168, "#fe88fc" ], [ 0.8938547486033519, "#fea5fd" ], [ 0.9832402234636871, "#febefe" ], [ 1, "#fec3fe" ] ] }, "plot_bgcolor": "white", "paper_bgcolor": "white", "shapedefaults": { "line": { "width": 0 }, "opacity": 0.4, "fillcolor": "#506784" }, "annotationdefaults": { "arrowhead": 0, "arrowcolor": "#506784", "arrowwidth": 1 } }, "themeRef": "PLOTLY_WHITE" }, "showlegend": true } }, "height": null, "width": null, "user": { "profile_url": "https://chart-studio.plotly.com/~vbhvsingh595", "avatar_url": "https://storage.googleapis.com/plotly-prod-profiles/7.jpg", "background_url": "https://storage.googleapis.com/plotly-prod-profiles/bg-4.jpg", "bio": "", "nickname": "", "website": "", "stream_tokens": null, "feature_set_id": null, "csrf_token": null, "date_joined": "2024-02-25 16:27:48", "mapbox_access_tokens": null, "has_password": null, "username": "vbhvsingh595", "email": null, "is_active": null, "readonly": null, "is_dash_creator": null, "dash_created_count": null, "is_chart_creator": null, "charts_created_count": null } }, { "creation_time": "2024-04-30T17:54:20.828969Z", "comments": { "results": [], "count": 0 }, "parented": true, "embed_url": "https://chart-studio.plotly.com/~ojanejaaa/2.embed", "fid": "ojanejaaa:2", "filename": "Plot 2", "filetype": "plot", "img_url": "https://storage.googleapis.com/plotly-prod-images/ojanejaaa/2/9_7J5KG959GY9SVJXX516NUNU32LT288.png", "image_urls": { "default": "https://storage.googleapis.com/plotly-prod-images/ojanejaaa/2/2_2H9QHLXOYYBC6SAB1OY8HA2SQFLHJC.png", "block-thumb": "https://storage.googleapis.com/plotly-prod-images/ojanejaaa/2/8_L7XF9EXWUYQRHXMS0VAN50G7N0N925.png", "list-thumb": "https://storage.googleapis.com/plotly-prod-images/ojanejaaa/2/9_7J5KG959GY9SVJXX516NUNU32LT288.png" }, "api_urls": { "files": "https://api.plotly.com/v2/files/ojanejaaa:2", "plots": "https://api.plotly.com/v2/plots/ojanejaaa:2", "parent": "https://api.plotly.com/v2/folders/home?user=ojanejaaa" }, "owner": "ojanejaaa", "parent": -1, "preview": "", "referencers": [], "references": [], "title": "", "views": 1, "web_url": "https://chart-studio.plotly.com/~ojanejaaa/2/", "world_readable": true, "date_modified": "2024-04-30T17:54:20.843Z", "stars": { "results": [], "count": 0 }, "collaborators": { "results": [], "count": 0 }, "subfolder_count": null, "refresh_interval": null, "organize_view_url": "https://chart-studio.plotly.com/~ojanejaaa/2/", "current_user_permission": "read", "is_theme": null, "is_template": false, "autosize": true, "caption": "", "figure": { "data": [ { "uid": "254c15", "meta": { "columnNames": { "x": "Migration", "y": "log(y)" } }, "mode": "markers", "name": "log(y)", "type": "scatter", "xsrc": "ojanejaaa:0:806fc9", "ysrc": "ojanejaaa:0:defe59" }, { "fit": { "rms": 0.14915356996635878, "uid": "bfe48c", "corr": 0.9892050911994535, "params": [ { "err": 0.1585574968357093, "hold": false, "name": "b", "value": 3.9577039365473463 }, { "err": 0.04953117666136414, "hold": false, "name": "m", "value": -0.9457159457256846 } ], "parent": [ "254c15" ], "weight": "", "fitname": "log(y) - fit", "funcStr": "m*x + b", "ninterp": "50", "iterations": 1, "inputxrange": [ "", "" ], "outputxrange": [ "", "" ] }, "uid": "bfe48c", "line": { "color": "#1f77b4", "width": 4 }, "meta": { "columnNames": { "x": "x", "y": "y" } }, "name": "log(y) - fit", "xsrc": "ojanejaaa:1:6064fe", "ysrc": "ojanejaaa:1:bf1d11", "xaxis": "x", "yaxis": "y", "opacity": 0.5, "transforms": [ { "rms": 0.14915356996635878, "type": "fit", "inputUid": "254c15", "regressor": "x", "parameters": [ { "hold": false, "name": "b", "error": 0.5339721552912328, "value": -1.4666666666668238 }, { "hold": false, "name": "m", "error": 0.08605740497675161, "value": 1.0121212121212377 } ], "regressand": "y", "correlation": 0.9892050911994535, "fitfunction": "m*x + b", "inputxrange": [ "", "" ], "outputxrange": [ "", "" ], "interpolation": "50" } ] } ], "frames": [], "layout": { "title": { "text": "Migration vs. Log (Kilobase Pairs)" }, "width": 1332, "xaxis": { "type": "linear", "range": [ 0.46251874062968523, 10.537481259370315 ], "title": { "text": "Migration" }, "autorange": true }, "yaxis": { "type": "linear", "range": [ -1.0405822721272435, 10.680154079505908 ], "title": { "text": "ln(kb)" }, "autorange": true }, "height": 647, "autosize": true, "annotations": [ { "x": 3.5625, "y": 0.5885908798995949, "ax": 28, "ay": -136, "uid": "bfe48c", "font": { "size": 16 }, "text": "R<sup>2</sup> = 0.9785<br>f(x) = (-0.946)*x + (3.96)", "xref": "x", "yref": "y", "align": "left", "opacity": 0.8, "arrowcolor": "#636363" } ] } }, "height": 647, "width": 1332, "user": { "profile_url": "https://chart-studio.plotly.com/~ojanejaaa", "avatar_url": "https://storage.googleapis.com/plotly-prod-profiles/54.jpg", "background_url": "https://storage.googleapis.com/plotly-prod-profiles/bg-5.jpg", "bio": "", "nickname": "", "website": "", "stream_tokens": null, "feature_set_id": null, "csrf_token": null, "date_joined": "2024-04-30 17:53:27", "mapbox_access_tokens": null, "has_password": null, "username": "ojanejaaa", "email": null, "is_active": null, "readonly": null, "is_dash_creator": null, "dash_created_count": null, "is_chart_creator": null, "charts_created_count": null } }, { "creation_time": "2024-04-30T17:54:08.676103Z", "comments": { "results": [], "count": 0 }, "parented": true, "embed_url": "https://chart-studio.plotly.com/~vbhvsingh595/21.embed", "fid": "vbhvsingh595:21", "filename": "5trajs_fomo1410_intcoorsn3c4", "filetype": "plot", "img_url": "https://storage.googleapis.com/plotly-prod-images/vbhvsingh595/21/9_K38GA4UMG6KTZX54DPHZ4PNW18YW5H.png", "image_urls": { "default": "https://storage.googleapis.com/plotly-prod-images/vbhvsingh595/21/2_HK7355U927R5ZBNWBHFPMUTL1Y9K6I.png", "block-thumb": "https://storage.googleapis.com/plotly-prod-images/vbhvsingh595/21/8_SMA68ZI7HZ6XMW2LA79LEDVFLJEDC2.png", "list-thumb": "https://storage.googleapis.com/plotly-prod-images/vbhvsingh595/21/9_K38GA4UMG6KTZX54DPHZ4PNW18YW5H.png" }, "api_urls": { "files": "https://api.plotly.com/v2/files/vbhvsingh595:21", "plots": "https://api.plotly.com/v2/plots/vbhvsingh595:21", "parent": "https://api.plotly.com/v2/folders/home?user=vbhvsingh595" }, "owner": "vbhvsingh595", "parent": -1, "preview": "", "referencers": [], "references": [], "title": "", "views": 6, "web_url": "https://chart-studio.plotly.com/~vbhvsingh595/21/", "world_readable": true, "date_modified": "2024-04-30T17:54:08.685Z", "stars": { "results": [], "count": 0 }, "collaborators": { "results": [], "count": 0 }, "subfolder_count": null, "refresh_interval": null, "organize_view_url": "https://chart-studio.plotly.com/~vbhvsingh595/21/", "current_user_permission": "read", "is_theme": null, "is_template": false, "autosize": true, "caption": "", "figure": { "data": [ { "line": { "width": 4 }, "meta": { "columnNames": { "x": "A", "y": "B" } }, "mode": "markers+lines", "name": "TRAJ1", "type": "scatter", "xsrc": "vbhvsingh595:20:6e905e", "ysrc": "vbhvsingh595:20:82545a", "marker": { "size": 7, "color": "rgb(189, 189, 194)" }, "showlegend": false, "legendgroup": 1 }, { "line": { "width": 4 }, "meta": { "columnNames": { "x": "A", "y": "C" } }, "mode": "markers+lines", "name": "TRAJ2", "type": "scatter", "xsrc": "vbhvsingh595:20:6e905e", "ysrc": "vbhvsingh595:20:244609", "marker": { "size": 7, "color": "rgb(182, 176, 175)" }, "visible": true, "showlegend": false, "stackgroup": null }, { "line": { "width": 4 }, "meta": { "columnNames": { "x": "A", "y": "D" } }, "mode": "markers+lines", "name": "TRAJ3", "type": "scatter", "xsrc": "vbhvsingh595:20:6e905e", "ysrc": "vbhvsingh595:20:9af18e", "marker": { "color": "rgb(168, 176, 171)" }, "visible": true, "showlegend": false, "stackgroup": null }, { "line": { "width": 4 }, "meta": { "columnNames": { "x": "A", "y": "E" } }, "mode": "markers+lines", "name": "TRAJ4", "type": "scatter", "xsrc": "vbhvsingh595:20:6e905e", "ysrc": "vbhvsingh595:20:32a179", "marker": { "color": "rgb(167, 165, 169)" }, "visible": true, "showlegend": false, "stackgroup": null }, { "line": { "width": 4 }, "meta": { "columnNames": { "x": "A", "y": "F" } }, "mode": "markers+lines", "name": "TRAJ5", "type": "scatter", "xsrc": "vbhvsingh595:20:6e905e", "ysrc": "vbhvsingh595:20:246027", "marker": { "color": "rgb(160, 162, 162)" }, "showlegend": false, "stackgroup": null }, { "meta": { "columnNames": { "x": "H", "y": "I" } }, "mode": "markers", "name": "S2 -> S1", "type": "scatter", "xsrc": "vbhvsingh595:20:462843", "ysrc": "vbhvsingh595:20:dc1a08", "marker": { "size": 10, "color": "rgb(99, 131, 250)", "symbol": "x" }, "stackgroup": null }, { "meta": { "columnNames": { "x": "L", "y": "M" } }, "mode": "markers", "name": "S1 -> S0", "type": "scatter", "xsrc": "vbhvsingh595:20:8da0d4", "ysrc": "vbhvsingh595:20:b346b2", "marker": { "size": 9, "color": "rgb(230, 25, 21)" }, "stackgroup": null } ], "frames": [], "layout": { "font": { "size": 34 }, "title": { "x": 0.5, "text": "FOMO(14,10)_0.3" }, "xaxis": { "type": "linear", "range": [ -29.602714576093373, 507.6027145760934 ], "ticks": "outside", "title": { "text": "Time (fs)" }, "ticklen": 6, "showgrid": false, "showline": true, "autorange": true, "linecolor": "rgb(1, 7, 18)", "linewidth": 3, "tickwidth": 2 }, "yaxis": { "type": "linear", "range": [ 1.2114670954584197, 1.6190029045415804 ], "ticks": "outside", "title": { "text": "N3-C4 (Å)" }, "ticklen": 6, "showgrid": false, "showline": true, "autorange": true, "gridcolor": "rgb(1, 6, 15)", "linecolor": "rgb(1, 6, 16)", "linewidth": 3, "tickwidth": 3 }, "legend": { "x": 0.7700627701782436, "y": 1.1279322172200108, "orientation": "h" }, "autosize": true, "template": { "data": { "bar": [ { "type": "bar", "marker": { "colorbar": { "ticks": "", "outlinewidth": 0 } } } ], "table": [ { "type": "table", "cells": { "fill": { "color": "#EBF0F8" }, "line": { "color": "white" } }, "header": { "fill": { "color": "#C8D4E3" }, "line": { "color": "white" } } } ], "carpet": [ { "type": "carpet", "aaxis": { "gridcolor": "#C8D4E3", "linecolor": "#C8D4E3", "endlinecolor": "#2a3f5f", "minorgridcolor": "#C8D4E3", "startlinecolor": "#2a3f5f" }, "baxis": { "gridcolor": "#C8D4E3", "linecolor": "#C8D4E3", "endlinecolor": "#2a3f5f", "minorgridcolor": "#C8D4E3", "startlinecolor": "#2a3f5f" } } ], "mesh3d": [ { "type": "mesh3d", "colorbar": { "ticks": "", "outlinewidth": 0 } } ], "contour": [ { "type": "contour", "colorbar": { "ticks": "", "outlinewidth": 0 }, "autocolorscale": true } ], "heatmap": [ { "type": "heatmap", "colorbar": { "ticks": "", "outlinewidth": 0 }, "autocolorscale": true } ], "scatter": [ { "type": "scatter", "marker": { "colorbar": { "ticks": "", "outlinewidth": 0 } } } ], "surface": [ { "type": "surface", "colorbar": { "ticks": "", "outlinewidth": 0 } } ], "heatmapgl": [ { "type": "heatmapgl", "colorbar": { "ticks": "", "outlinewidth": 0 } } ], "histogram": [ { "type": "histogram", "marker": { "colorbar": { "ticks": "", "outlinewidth": 0 } } } ], "parcoords": [ { "line": { "colorbar": { "ticks": "", "outlinewidth": 0 } }, "type": "parcoords" } ], "scatter3d": [ { "type": "scatter3d", "marker": { "colorbar": { "ticks": "", "outlinewidth": 0 } } } ], "scattergl": [ { "type": "scattergl", "marker": { "colorbar": { "ticks": "", "outlinewidth": 0 } } } ], "choropleth": [ { "type": "choropleth", "colorbar": { "ticks": "", "outlinewidth": 0 } } ], "scattergeo": [ { "type": "scattergeo", "marker": { "colorbar": { "ticks": "", "outlinewidth": 0 } } } ], "histogram2d": [ { "type": "histogram2d", "colorbar": { "ticks": "", "outlinewidth": 0 }, "autocolorscale": true } ], "scatterpolar": [ { "type": "scatterpolar", "marker": { "colorbar": { "ticks": "", "outlinewidth": 0 } } } ], "contourcarpet": [ { "type": "contourcarpet", "colorbar": { "ticks": "", "outlinewidth": 0 } } ], "scattercarpet": [ { "type": "scattercarpet", "marker": { "colorbar": { "ticks": "", "outlinewidth": 0 } } } ], "scattermapbox": [ { "type": "scattermapbox", "marker": { "colorbar": { "ticks": "", "outlinewidth": 0 } } } ], "scatterpolargl": [ { "type": "scatterpolargl", "marker": { "colorbar": { "ticks": "", "outlinewidth": 0 } } } ], "scatterternary": [ { "type": "scatterternary", "marker": { "colorbar": { "ticks": "", "outlinewidth": 0 } } } ], "histogram2dcontour": [ { "type": "histogram2dcontour", "colorbar": { "ticks": "", "outlinewidth": 0 }, "autocolorscale": true } ] }, "layout": { "geo": { "bgcolor": "white", "showland": true, "lakecolor": "white", "landcolor": "white", "showlakes": true, "subunitcolor": "#C8D4E3" }, "font": { "color": "#2a3f5f" }, "polar": { "bgcolor": "white", "radialaxis": { "ticks": "", "gridcolor": "#EBF0F8", "linecolor": "#EBF0F8" }, "angularaxis": { "ticks": "", "gridcolor": "#EBF0F8", "linecolor": "#EBF0F8" } }, "scene": { "xaxis": { "ticks": "", "gridcolor": "#DFE8F3", "gridwidth": 2, "linecolor": "#EBF0F8", "zerolinecolor": "#EBF0F8", "showbackground": true, "backgroundcolor": "white" }, "yaxis": { "ticks": "", "gridcolor": "#DFE8F3", "gridwidth": 2, "linecolor": "#EBF0F8", "zerolinecolor": "#EBF0F8", "showbackground": true, "backgroundcolor": "white" }, "zaxis": { "ticks": "", "gridcolor": "#DFE8F3", "gridwidth": 2, "linecolor": "#EBF0F8", "zerolinecolor": "#EBF0F8", "showbackground": true, "backgroundcolor": "white" } }, "title": { "x": 0.05 }, "xaxis": { "ticks": "", "gridcolor": "#EBF0F8", "linecolor": "#EBF0F8", "automargin": true, "zerolinecolor": "#EBF0F8", "zerolinewidth": 2 }, "yaxis": { "ticks": "", "gridcolor": "#EBF0F8", "linecolor": "#EBF0F8", "automargin": true, "zerolinecolor": "#EBF0F8", "zerolinewidth": 2 }, "ternary": { "aaxis": { "ticks": "", "gridcolor": "#DFE8F3", "linecolor": "#A2B1C6" }, "baxis": { "ticks": "", "gridcolor": "#DFE8F3", "linecolor": "#A2B1C6" }, "caxis": { "ticks": "", "gridcolor": "#DFE8F3", "linecolor": "#A2B1C6" }, "bgcolor": "white" }, "colorway": [ "#636efa", "#EF553B", "#00cc96", "#ab63fa", "#19d3f3", "#e763fa", "#fecb52", "#ffa15a", "#ff6692", "#b6e880" ], "hovermode": "closest", "colorscale": { "diverging": [ [ 0, "#8e0152" ], [ 0.1, "#c51b7d" ], [ 0.2, "#de77ae" ], [ 0.3, "#f1b6da" ], [ 0.4, "#fde0ef" ], [ 0.5, "#f7f7f7" ], [ 0.6, "#e6f5d0" ], [ 0.7, "#b8e186" ], [ 0.8, "#7fbc41" ], [ 0.9, "#4d9221" ], [ 1, "#276419" ] ], "sequential": [ [ 0, "#0508b8" ], [ 0.0893854748603352, "#1910d8" ], [ 0.1787709497206704, "#3c19f0" ], [ 0.2681564245810056, "#6b1cfb" ], [ 0.3575418994413408, "#981cfd" ], [ 0.44692737430167595, "#bf1cfd" ], [ 0.5363128491620112, "#dd2bfd" ], [ 0.6256983240223464, "#f246fe" ], [ 0.7150837988826816, "#fc67fd" ], [ 0.8044692737430168, "#fe88fc" ], [ 0.8938547486033519, "#fea5fd" ], [ 0.9832402234636871, "#febefe" ], [ 1, "#fec3fe" ] ], "sequentialminus": [ [ 0, "#0508b8" ], [ 0.0893854748603352, "#1910d8" ], [ 0.1787709497206704, "#3c19f0" ], [ 0.2681564245810056, "#6b1cfb" ], [ 0.3575418994413408, "#981cfd" ], [ 0.44692737430167595, "#bf1cfd" ], [ 0.5363128491620112, "#dd2bfd" ], [ 0.6256983240223464, "#f246fe" ], [ 0.7150837988826816, "#fc67fd" ], [ 0.8044692737430168, "#fe88fc" ], [ 0.8938547486033519, "#fea5fd" ], [ 0.9832402234636871, "#febefe" ], [ 1, "#fec3fe" ] ] }, "plot_bgcolor": "white", "paper_bgcolor": "white", "shapedefaults": { "line": { "width": 0 }, "opacity": 0.4, "fillcolor": "#506784" }, "annotationdefaults": { "arrowhead": 0, "arrowcolor": "#506784", "arrowwidth": 1 } }, "themeRef": "PLOTLY_WHITE" }, "showlegend": true } }, "height": null, "width": null, "user": { "profile_url": "https://chart-studio.plotly.com/~vbhvsingh595", "avatar_url": "https://storage.googleapis.com/plotly-prod-profiles/7.jpg", "background_url": "https://storage.googleapis.com/plotly-prod-profiles/bg-4.jpg", "bio": "", "nickname": "", "website": "", "stream_tokens": null, "feature_set_id": null, "csrf_token": null, "date_joined": "2024-02-25 16:27:48", "mapbox_access_tokens": null, "has_password": null, "username": "vbhvsingh595", "email": null, "is_active": null, "readonly": null, "is_dash_creator": null, "dash_created_count": null, "is_chart_creator": null, "charts_created_count": null } }, { "creation_time": "2024-04-30T17:43:35.894496Z", "comments": { "results": [], "count": 0 }, "parented": true, "embed_url": "https://chart-studio.plotly.com/~vbhvsingh595/19.embed", "fid": "vbhvsingh595:19", "filename": "5trajs_fomo1410_intcoorsc5pyr", "filetype": "plot", "img_url": "https://storage.googleapis.com/plotly-prod-images/vbhvsingh595/19/9_9ASJEUSCNYD4CPBJ2IW5B1JKFU97PB.png", "image_urls": { "default": "https://storage.googleapis.com/plotly-prod-images/vbhvsingh595/19/2_OGJ904YOI1ZI8PGVMOJ56LYDIHEXN1.png", "block-thumb": "https://storage.googleapis.com/plotly-prod-images/vbhvsingh595/19/8_YMQ42OFEG4PVQ08I95OJGYCGLTND58.png", "list-thumb": "https://storage.googleapis.com/plotly-prod-images/vbhvsingh595/19/9_9ASJEUSCNYD4CPBJ2IW5B1JKFU97PB.png" }, "api_urls": { "files": "https://api.plotly.com/v2/files/vbhvsingh595:19", "plots": "https://api.plotly.com/v2/plots/vbhvsingh595:19", "parent": "https://api.plotly.com/v2/folders/home?user=vbhvsingh595" }, "owner": "vbhvsingh595", "parent": -1, "preview": "", "referencers": [], "references": [], "title": "", "views": 4, "web_url": "https://chart-studio.plotly.com/~vbhvsingh595/19/", "world_readable": true, "date_modified": "2024-05-06T16:05:46.733Z", "stars": { "results": [], "count": 0 }, "collaborators": { "results": [], "count": 0 }, "subfolder_count": null, "refresh_interval": null, "organize_view_url": "https://chart-studio.plotly.com/~vbhvsingh595/19/", "current_user_permission": "read", "is_theme": null, "is_template": false, "autosize": true, "caption": "", "figure": { "data": [ { "line": { "width": 4 }, "meta": { "columnNames": { "x": "A", "y": "B" } }, "mode": "markers+lines", "name": "TRAJ1", "type": "scatter", "xsrc": "vbhvsingh595:18:5f057b", "ysrc": "vbhvsingh595:18:ef5bcb", "marker": { "size": 7, "color": "rgb(189, 189, 194)" }, "showlegend": false, "legendgroup": 1 }, { "line": { "width": 4 }, "meta": { "columnNames": { "x": "A", "y": "C" } }, "mode": "markers+lines", "name": "TRAJ2", "type": "scatter", "xsrc": "vbhvsingh595:18:5f057b", "ysrc": "vbhvsingh595:18:d13ebe", "marker": { "size": 7, "color": "rgb(182, 176, 175)" }, "visible": true, "showlegend": false, "stackgroup": null }, { "line": { "width": 4 }, "meta": { "columnNames": { "x": "A", "y": "D" } }, "mode": "markers+lines", "name": "TRAJ3", "type": "scatter", "xsrc": "vbhvsingh595:18:5f057b", "ysrc": "vbhvsingh595:18:5c7b21", "marker": { "color": "rgb(168, 176, 171)" }, "visible": true, "showlegend": false, "stackgroup": null }, { "line": { "width": 4 }, "meta": { "columnNames": { "x": "A", "y": "E" } }, "mode": "markers+lines", "name": "TRAJ4", "type": "scatter", "xsrc": "vbhvsingh595:18:5f057b", "ysrc": "vbhvsingh595:18:5e4ec1", "marker": { "color": "rgb(167, 165, 169)" }, "visible": true, "showlegend": false, "stackgroup": null }, { "line": { "width": 4 }, "meta": { "columnNames": { "x": "A", "y": "F" } }, "mode": "markers+lines", "name": "TRAJ5", "type": "scatter", "xsrc": "vbhvsingh595:18:5f057b", "ysrc": "vbhvsingh595:18:e50cfa", "marker": { "color": "rgb(160, 162, 162)" }, "showlegend": false, "stackgroup": null }, { "meta": { "columnNames": { "x": "H", "y": "I" } }, "mode": "markers", "name": "S2 -> S1", "type": "scatter", "xsrc": "vbhvsingh595:18:deb04c", "ysrc": "vbhvsingh595:18:3be128", "marker": { "size": 10, "color": "rgb(99, 131, 250)", "symbol": "x" }, "stackgroup": null }, { "meta": { "columnNames": { "x": "L", "y": "M" } }, "mode": "markers", "name": "S1 -> S0", "type": "scatter", "xsrc": "vbhvsingh595:18:48865f", "ysrc": "vbhvsingh595:18:194b2b", "marker": { "size": 9, "color": "rgb(230, 25, 21)" }, "stackgroup": null } ], "frames": [], "layout": { "font": { "size": 34 }, "title": { "x": 0.5, "text": "FOMO(14,10)_0.3" }, "xaxis": { "type": "linear", "range": [ -29.570687082333095, 507.5706870823331 ], "ticks": "outside", "title": { "text": "Time (fs)" }, "ticklen": 6, "showgrid": false, "showline": true, "autorange": true, "linecolor": "rgb(1, 7, 18)", "linewidth": 3, "tickwidth": 2 }, "yaxis": { "type": "linear", "range": [ 0, 350 ], "ticks": "outside", "title": { "text": "C5 Pyr (<sup>o</sup>)" }, "ticklen": 6, "showgrid": false, "showline": true, "autorange": false, "gridcolor": "rgb(1, 6, 15)", "linecolor": "rgb(1, 6, 16)", "linewidth": 3, "tickwidth": 3 }, "legend": { "x": 0.7700627701782436, "y": 1.1279322172200108, "orientation": "h" }, "autosize": true, "template": { "data": { "bar": [ { "type": "bar", "marker": { "colorbar": { "ticks": "", "outlinewidth": 0 } } } ], "table": [ { "type": "table", "cells": { "fill": { "color": "#EBF0F8" }, "line": { "color": "white" } }, "header": { "fill": { "color": "#C8D4E3" }, "line": { "color": "white" } } } ], "carpet": [ { "type": "carpet", "aaxis": { "gridcolor": "#C8D4E3", "linecolor": "#C8D4E3", "endlinecolor": "#2a3f5f", "minorgridcolor": "#C8D4E3", "startlinecolor": "#2a3f5f" }, "baxis": { "gridcolor": "#C8D4E3", "linecolor": "#C8D4E3", "endlinecolor": "#2a3f5f", "minorgridcolor": "#C8D4E3", "startlinecolor": "#2a3f5f" } } ], "mesh3d": [ { "type": "mesh3d", "colorbar": { "ticks": "", "outlinewidth": 0 } } ], "contour": [ { "type": "contour", "colorbar": { "ticks": "", "outlinewidth": 0 }, "autocolorscale": true } ], "heatmap": [ { "type": "heatmap", "colorbar": { "ticks": "", "outlinewidth": 0 }, "autocolorscale": true } ], "scatter": [ { "type": "scatter", "marker": { "colorbar": { "ticks": "", "outlinewidth": 0 } } } ], "surface": [ { "type": "surface", "colorbar": { "ticks": "", "outlinewidth": 0 } } ], "heatmapgl": [ { "type": "heatmapgl", "colorbar": { "ticks": "", "outlinewidth": 0 } } ], "histogram": [ { "type": "histogram", "marker": { "colorbar": { "ticks": "", "outlinewidth": 0 } } } ], "parcoords": [ { "line": { "colorbar": { "ticks": "", "outlinewidth": 0 } }, "type": "parcoords" } ], "scatter3d": [ { "type": "scatter3d", "marker": { "colorbar": { "ticks": "", "outlinewidth": 0 } } } ], "scattergl": [ { "type": "scattergl", "marker": { "colorbar": { "ticks": "", "outlinewidth": 0 } } } ], "choropleth": [ { "type": "choropleth", "colorbar": { "ticks": "", "outlinewidth": 0 } } ], "scattergeo": [ { "type": "scattergeo", "marker": { "colorbar": { "ticks": "", "outlinewidth": 0 } } } ], "histogram2d": [ { "type": "histogram2d", "colorbar": { "ticks": "", "outlinewidth": 0 }, "autocolorscale": true } ], "scatterpolar": [ { "type": "scatterpolar", "marker": { "colorbar": { "ticks": "", "outlinewidth": 0 } } } ], "contourcarpet": [ { "type": "contourcarpet", "colorbar": { "ticks": "", "outlinewidth": 0 } } ], "scattercarpet": [ { "type": "scattercarpet", "marker": { "colorbar": { "ticks": "", "outlinewidth": 0 } } } ], "scattermapbox": [ { "type": "scattermapbox", "marker": { "colorbar": { "ticks": "", "outlinewidth": 0 } } } ], "scatterpolargl": [ { "type": "scatterpolargl", "marker": { "colorbar": { "ticks": "", "outlinewidth": 0 } } } ], "scatterternary": [ { "type": "scatterternary", "marker": { "colorbar": { "ticks": "", "outlinewidth": 0 } } } ], "histogram2dcontour": [ { "type": "histogram2dcontour", "colorbar": { "ticks": "", "outlinewidth": 0 }, "autocolorscale": true } ] }, "layout": { "geo": { "bgcolor": "white", "showland": true, "lakecolor": "white", "landcolor": "white", "showlakes": true, "subunitcolor": "#C8D4E3" }, "font": { "color": "#2a3f5f" }, "polar": { "bgcolor": "white", "radialaxis": { "ticks": "", "gridcolor": "#EBF0F8", "linecolor": "#EBF0F8" }, "angularaxis": { "ticks": "", "gridcolor": "#EBF0F8", "linecolor": "#EBF0F8" } }, "scene": { "xaxis": { "ticks": "", "gridcolor": "#DFE8F3", "gridwidth": 2, "linecolor": "#EBF0F8", "zerolinecolor": "#EBF0F8", "showbackground": true, "backgroundcolor": "white" }, "yaxis": { "ticks": "", "gridcolor": "#DFE8F3", "gridwidth": 2, "linecolor": "#EBF0F8", "zerolinecolor": "#EBF0F8", "showbackground": true, "backgroundcolor": "white" }, "zaxis": { "ticks": "", "gridcolor": "#DFE8F3", "gridwidth": 2, "linecolor": "#EBF0F8", "zerolinecolor": "#EBF0F8", "showbackground": true, "backgroundcolor": "white" } }, "title": { "x": 0.05 }, "xaxis": { "ticks": "", "gridcolor": "#EBF0F8", "linecolor": "#EBF0F8", "automargin": true, "zerolinecolor": "#EBF0F8", "zerolinewidth": 2 }, "yaxis": { "ticks": "", "gridcolor": "#EBF0F8", "linecolor": "#EBF0F8", "automargin": true, "zerolinecolor": "#EBF0F8", "zerolinewidth": 2 }, "ternary": { "aaxis": { "ticks": "", "gridcolor": "#DFE8F3", "linecolor": "#A2B1C6" }, "baxis": { "ticks": "", "gridcolor": "#DFE8F3", "linecolor": "#A2B1C6" }, "caxis": { "ticks": "", "gridcolor": "#DFE8F3", "linecolor": "#A2B1C6" }, "bgcolor": "white" }, "colorway": [ "#636efa", "#EF553B", "#00cc96", "#ab63fa", "#19d3f3", "#e763fa", "#fecb52", "#ffa15a", "#ff6692", "#b6e880" ], "hovermode": "closest", "colorscale": { "diverging": [ [ 0, "#8e0152" ], [ 0.1, "#c51b7d" ], [ 0.2, "#de77ae" ], [ 0.3, "#f1b6da" ], [ 0.4, "#fde0ef" ], [ 0.5, "#f7f7f7" ], [ 0.6, "#e6f5d0" ], [ 0.7, "#b8e186" ], [ 0.8, "#7fbc41" ], [ 0.9, "#4d9221" ], [ 1, "#276419" ] ], "sequential": [ [ 0, "#0508b8" ], [ 0.0893854748603352, "#1910d8" ], [ 0.1787709497206704, "#3c19f0" ], [ 0.2681564245810056, "#6b1cfb" ], [ 0.3575418994413408, "#981cfd" ], [ 0.44692737430167595, "#bf1cfd" ], [ 0.5363128491620112, "#dd2bfd" ], [ 0.6256983240223464, "#f246fe" ], [ 0.7150837988826816, "#fc67fd" ], [ 0.8044692737430168, "#fe88fc" ], [ 0.8938547486033519, "#fea5fd" ], [ 0.9832402234636871, "#febefe" ], [ 1, "#fec3fe" ] ], "sequentialminus": [ [ 0, "#0508b8" ], [ 0.0893854748603352, "#1910d8" ], [ 0.1787709497206704, "#3c19f0" ], [ 0.2681564245810056, "#6b1cfb" ], [ 0.3575418994413408, "#981cfd" ], [ 0.44692737430167595, "#bf1cfd" ], [ 0.5363128491620112, "#dd2bfd" ], [ 0.6256983240223464, "#f246fe" ], [ 0.7150837988826816, "#fc67fd" ], [ 0.8044692737430168, "#fe88fc" ], [ 0.8938547486033519, "#fea5fd" ], [ 0.9832402234636871, "#febefe" ], [ 1, "#fec3fe" ] ] }, "plot_bgcolor": "white", "paper_bgcolor": "white", "shapedefaults": { "line": { "width": 0 }, "opacity": 0.4, "fillcolor": "#506784" }, "annotationdefaults": { "arrowhead": 0, "arrowcolor": "#506784", "arrowwidth": 1 } }, "themeRef": "PLOTLY_WHITE" }, "showlegend": true } }, "height": null, "width": null, "user": { "profile_url": "https://chart-studio.plotly.com/~vbhvsingh595", "avatar_url": "https://storage.googleapis.com/plotly-prod-profiles/7.jpg", "background_url": "https://storage.googleapis.com/plotly-prod-profiles/bg-4.jpg", "bio": "", "nickname": "", "website": "", "stream_tokens": null, "feature_set_id": null, "csrf_token": null, "date_joined": "2024-02-25 16:27:48", "mapbox_access_tokens": null, "has_password": null, "username": "vbhvsingh595", "email": null, "is_active": null, "readonly": null, "is_dash_creator": null, "dash_created_count": null, "is_chart_creator": null, "charts_created_count": null } }, { "creation_time": "2024-04-30T17:42:43.848711Z", "comments": { "results": [], "count": 0 }, "parented": true, "embed_url": "https://chart-studio.plotly.com/~aigerim.khalidulliyeva/2.embed", "fid": "aigerim.khalidulliyeva:2", "filename": "1 cmc 4000 ppm", "filetype": "plot", "img_url": "https://storage.googleapis.com/plotly-prod-images/aigerim.khalidulliyeva/2/9_38X7GZUSLK69ETDPWYQ6EB7YDB3XQV.png", "image_urls": { "default": "https://storage.googleapis.com/plotly-prod-images/aigerim.khalidulliyeva/2/2_8KV7029KPFXYZBWFH3HTWZF5Z3W0C0.png", "block-thumb": "https://storage.googleapis.com/plotly-prod-images/aigerim.khalidulliyeva/2/8_NKUXS4EOBM37NAUBKYTJDNA16Z9E18.png", "list-thumb": "https://storage.googleapis.com/plotly-prod-images/aigerim.khalidulliyeva/2/9_38X7GZUSLK69ETDPWYQ6EB7YDB3XQV.png" }, "api_urls": { "files": "https://api.plotly.com/v2/files/aigerim.khalidulliyeva:2", "plots": "https://api.plotly.com/v2/plots/aigerim.khalidulliyeva:2", "parent": "https://api.plotly.com/v2/folders/home?user=aigerim.khalidulliyeva" }, "owner": "aigerim.khalidulliyeva", "parent": -1, "preview": "", "referencers": [], "references": [], "title": "", "views": 2, "web_url": "https://chart-studio.plotly.com/~aigerim.khalidulliyeva/2/", "world_readable": true, "date_modified": "2024-04-30T20:58:59.102Z", "stars": { "results": [], "count": 0 }, "collaborators": { "results": [], "count": 0 }, "subfolder_count": null, "refresh_interval": null, "organize_view_url": "https://chart-studio.plotly.com/~aigerim.khalidulliyeva/2/", "current_user_permission": "read", "is_theme": null, "is_template": false, "autosize": true, "caption": "", "figure": { "data": [ { "uid": "723fe8", "meta": { "columnNames": { "x": "A", "y": "B" } }, "mode": "markers", "name": "Mean bubble size", "type": "scatter", "xsrc": "aigerim.khalidulliyeva:1:568332", "ysrc": "aigerim.khalidulliyeva:1:318b77", "marker": { "color": "rgb(255, 127, 14)", "sizeref": 0.028149617325, "sizemode": "area" }, "error_x": { "type": "percent", "value": 10, "visible": false, "symmetric": true, "copy_ystyle": true }, "error_y": { "type": "percent", "color": "rgb(255, 127, 14)", "value": 10, "width": 4, "visible": false, "symmetric": true, "thickness": 2 }, "visible": true, "boxpoints": false }, { "uid": "225e23", "transforms": [ { "rms": 6.944880606661183, "type": "fit", "xmid": 44.500000000000014, "ymid": 130.07306043410097, "inputUid": "723fe8", "regressor": "x", "parameters": [ { "hold": false, "name": "a", "error": 0.0029443572135556015, "value": -0.02826722238443744 }, { "hold": false, "name": "b", "error": 0.2741626159364965, "value": 2.959651018017867 }, { "hold": false, "name": "c", "error": 5.161567540979102, "value": 54.34475725908813 } ], "regressand": "y", "correlation": 0.9731809227283018, "fitfunction": "a*x^2 + b*x + c", "inputxrange": [], "outputxrange": [], "interpolation": 50 } ] }, { "uid": "fa7fed", "meta": { "columnNames": { "x": "A", "y": "B" } }, "mode": "markers", "name": "1 cmc 4000 ppm<br>", "type": "scatter", "xsrc": "aigerim.khalidulliyeva:3:c8a414", "ysrc": "aigerim.khalidulliyeva:3:f7129c", "error_x": { "type": "percent", "color": "#2ca02c", "value": 10, "width": 4, "visible": false, "symmetric": true, "thickness": 2 }, "visible": true, "stackgroup": null }, { "uid": "311f19", "name": "", "visible": false, "transforms": [ { "rms": 8.07182706503963, "type": "fit", "xmid": 60.99999999999998, "ymid": 154.97990938480964, "inputUid": "fa7fed", "regressor": "x", "parameters": [ { "hold": false, "name": "a", "error": 0.0017524932938957397, "value": -0.005954642030134305 }, { "hold": false, "name": "b", "error": 0.22178707187611243, "value": 1.9731892825531117 }, { "hold": false, "name": "c", "error": 5.778572876332374, "value": 56.772586143199625 } ], "regressand": "y", "correlation": 0.9894341613386063, "fitfunction": "a*x^2 + b*x + c", "inputxrange": [], "outputxrange": [], "interpolation": 50 } ] } ], "frames": [], "layout": { "title": { "text": "1 cmc" }, "xaxis": { "type": "log", "range": [ 0.25042000230889394, 2.1926685083741533 ], "title": { "text": "Time, min" }, "showline": false, "autorange": true }, "yaxis": { "type": "linear", "range": [ 41.79590177210979, 219.24218410539243 ], "title": { "text": "Mean bubble size, µm" }, "autorange": true }, "bargap": 0.38, "legend": { "orientation": "v" }, "autosize": true, "hovermode": "closest" } }, "height": null, "width": null, "user": { "profile_url": "https://chart-studio.plotly.com/~aigerim.khalidulliyeva", "avatar_url": "https://storage.googleapis.com/plotly-prod-profiles/89.jpg", "background_url": "https://storage.googleapis.com/plotly-prod-profiles/bg-1.jpg", "bio": "", "nickname": "", "website": "", "stream_tokens": null, "feature_set_id": null, "csrf_token": null, "date_joined": "2024-04-30 17:42:19", "mapbox_access_tokens": null, "has_password": null, "username": "aigerim.khalidulliyeva", "email": null, "is_active": null, "readonly": null, "is_dash_creator": null, "dash_created_count": null, "is_chart_creator": null, "charts_created_count": null } } ] }
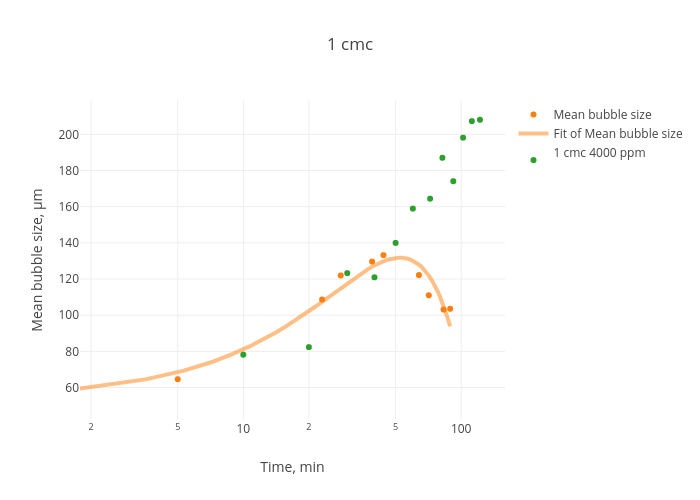