Plots List
Plots
This endpoint handles manipulation of Plotly plot files.
Reference
Authorization
Any user with or without a Plotly account may view public plots. For private plots, see authentication.
Actions
list
Listing all public plots can be done via a GET request to this endpoint.
By default, plots will be listed in order of date created. The order_by
query parameter is accepted at this endpoint. Currently, only ordering by
views is supported. It is possible to filter the plots by quality
with min_quality or max_quality as query parameter.
Example:
// GET https://api.plotly.com/v2/plots/ ---> 200

// GET https://api.plotly.com/v2/plots/?order_by=-views ---> 200

// GET https://api.plotly.com/v2/plots/?min_quality=5 ---> 200

// GET https://api.plotly.com/v2/plots/?max_quality=5 ---> 200
feed
Listing all handpicked feed plots can be done via a GET request to this endpoint. By default, plots will be listed in a random order.
Example:
// GET https://api.plotly.com/v2/plots/feed ---> 200
create
You can create new plot resources here. The only required field is 'figure'. Currently, the figure is restricted to only contain references to grid data. That is, this will fail if raw data arrays are passed in. To create and manipulate underlying grids for plots, see the grids endpoint.
Example:
// This fails because a figure field is required.
// POST https://api.plotly.com/v2/plots ---> 400 Bad Request
{}

// This fails because the figure has raw data
//POST https://api.plotly.com/v2/plots ---> 400 Bad Request
{
    "figure": {"data": [{"y": ['this', 'is', 'raw', 'data']}]}
}

// This succeeds because the figure has src keys, not raw data.
//POST https://api.plotly.com/v2/plots ---> 200 OK
{
    "figure": {"data": [{"ysrc": "sven:88:u8nd62"}]}
}
When creating a grid, you can optionally specify a source_fid to specify where a plot has come from:
- source_fid: the fid of a plot that was copied (and presumably edited) to produce this one
detail
There is a lot of meta information stored about plot files including filename, title, share_url, and content_url to name a few.
This information can only be reached with a GET to this endpoint.
Example:
// GET https://api.plotly.com/v2/plots/iheartgraphs:90
content
The contents of a plot can be downloaded via the content resource. The plot
content contains referenced grid/column data by default. If you wish to
return the raw grid/column data, the inline_data=true query must be included
in the request url. The Content-Type header will be appropriately set for the
response body.
Alternatively, you can set ?map_data=unreadable to append a mapping of
sources to data that belongs to grids which are unreadable for the
requestor. This is useful when you have read access to another users plot,
but that plot contains grid references which you don't have access to.
Examples:
// Returns referenced grid/column data
// GET https://api.plotly.com/v2/plots/iheartgraphs:90/content ---> 200 OK

// Returns full grid/column data
// GET https://api.plotly.com/v2/plots/iheartgraphs:90/content?inline_data=true ---> 200 OK

// Returns full grid/column data when requestor doesn't have permission
// to read the referenced grid.
// GET https://api.plotly.com/v2/plots/iheartgraphs:90/content?map_data=unreadable ---> 200 OK
GET /v2/plots/?cursor=cj0xJnA9MjAyNC0wNC0zMCswMCUzQTIxJTNBMjcuMDM1Mzc4JTJCMDAlM0EwMA%3D%3D&format=api
{ "next": "https://api.plot.ly/v2/plots/?cursor=cD0yMDI0LTA0LTMwKzAwJTNBMzUlM0ExMi4yOTMzOTAlMkIwMCUzQTAw&format=api", "previous": "https://api.plot.ly/v2/plots/?cursor=cj0xJnA9MjAyNC0wNC0zMCswMSUzQTExJTNBMzcuMTQ3NjA3JTJCMDAlM0EwMA%3D%3D&format=api", "results": [ { "creation_time": "2024-04-30T01:11:37.147607Z", "comments": { "results": [], "count": 0 }, "parented": true, "embed_url": "https://chart-studio.plotly.com/~pregninett/10.embed", "fid": "pregninett:10", "filename": "Plot 10", "filetype": "plot", "img_url": "https://storage.googleapis.com/plotly-prod-images/pregninett/10/9_UTR20WL5J0BRNYN422JP9BT74VE42D.png", "image_urls": { "default": "https://storage.googleapis.com/plotly-prod-images/pregninett/10/2_QYQOCX7FBXWEXGQFMVUO4NZP77QJAF.png", "block-thumb": "https://storage.googleapis.com/plotly-prod-images/pregninett/10/8_U05T22MUOVOH5M474513XIEP4CYPXR.png", "list-thumb": "https://storage.googleapis.com/plotly-prod-images/pregninett/10/9_UTR20WL5J0BRNYN422JP9BT74VE42D.png" }, "api_urls": { "files": "https://api.plotly.com/v2/files/pregninett:10", "plots": "https://api.plotly.com/v2/plots/pregninett:10", "parent": "https://api.plotly.com/v2/folders/home?user=pregninett" }, "owner": "pregninett", "parent": -1, "preview": "", "referencers": [], "references": [], "title": "", "views": 1, "web_url": "https://chart-studio.plotly.com/~pregninett/10/", "world_readable": true, "date_modified": "2024-04-30T01:11:37.158Z", "stars": { "results": [], "count": 0 }, "collaborators": { "results": [], "count": 0 }, "subfolder_count": null, "refresh_interval": null, "organize_view_url": "https://chart-studio.plotly.com/~pregninett/10/", "current_user_permission": "read", "is_theme": null, "is_template": false, "autosize": true, "caption": "", "figure": { "data": [ { "meta": { "columnNames": { "x": "Súlyossági csoportok", "y": "POEM átlag" } }, "mode": "markers", "type": "bar", "xsrc": "pregninett:9:0dbf63", "ysrc": "pregninett:9:f2da28", "orientation": "v" } ], "frames": [], "layout": { "xaxis": { "type": "linear", "range": [ 0.5, 4.5 ], "autorange": true }, "yaxis": { "type": "linear", "range": [ 0, 22.48421052631579 ], "autorange": true }, "autosize": true, "template": { "data": { "bar": [ { "type": "bar", "marker": { "colorbar": { "ticks": "", "outlinewidth": 0 } } } ], "table": [ { "type": "table", "cells": { "fill": { "color": "#EBF0F8" }, "line": { "color": "white" } }, "header": { "fill": { "color": "#C8D4E3" }, "line": { "color": "white" } } } ], "carpet": [ { "type": "carpet", "aaxis": { "gridcolor": "#C8D4E3", "linecolor": "#C8D4E3", "endlinecolor": "#2a3f5f", "minorgridcolor": "#C8D4E3", "startlinecolor": "#2a3f5f" }, "baxis": { "gridcolor": "#C8D4E3", "linecolor": "#C8D4E3", "endlinecolor": "#2a3f5f", "minorgridcolor": "#C8D4E3", "startlinecolor": "#2a3f5f" } } ], "mesh3d": [ { "type": "mesh3d", "colorbar": { "ticks": "", "outlinewidth": 0 } } ], "contour": [ { "type": "contour", "colorbar": { "ticks": "", "outlinewidth": 0 }, "autocolorscale": true } ], "heatmap": [ { "type": "heatmap", "colorbar": { "ticks": "", "outlinewidth": 0 }, "autocolorscale": true } ], "scatter": [ { "type": "scatter", "marker": { "colorbar": { "ticks": "", "outlinewidth": 0 } } } ], "surface": [ { "type": "surface", "colorbar": { "ticks": "", "outlinewidth": 0 } } ], "heatmapgl": [ { "type": "heatmapgl", "colorbar": { "ticks": "", "outlinewidth": 0 } } ], "histogram": [ { "type": "histogram", "marker": { "colorbar": { "ticks": "", "outlinewidth": 0 } } } ], "parcoords": [ { "line": { "colorbar": { "ticks": "", "outlinewidth": 0 } }, "type": "parcoords" } ], "scatter3d": [ { "type": "scatter3d", "marker": { "colorbar": { "ticks": "", "outlinewidth": 0 } } } ], "scattergl": [ { "type": "scattergl", "marker": { "colorbar": { "ticks": "", "outlinewidth": 0 } } } ], "choropleth": [ { "type": "choropleth", "colorbar": { "ticks": "", "outlinewidth": 0 } } ], "scattergeo": [ { "type": "scattergeo", "marker": { "colorbar": { "ticks": "", "outlinewidth": 0 } } } ], "histogram2d": [ { "type": "histogram2d", "colorbar": { "ticks": "", "outlinewidth": 0 }, "autocolorscale": true } ], "scatterpolar": [ { "type": "scatterpolar", "marker": { "colorbar": { "ticks": "", "outlinewidth": 0 } } } ], "contourcarpet": [ { "type": "contourcarpet", "colorbar": { "ticks": "", "outlinewidth": 0 } } ], "scattercarpet": [ { "type": "scattercarpet", "marker": { "colorbar": { "ticks": "", "outlinewidth": 0 } } } ], "scattermapbox": [ { "type": "scattermapbox", "marker": { "colorbar": { "ticks": "", "outlinewidth": 0 } } } ], "scatterpolargl": [ { "type": "scatterpolargl", "marker": { "colorbar": { "ticks": "", "outlinewidth": 0 } } } ], "scatterternary": [ { "type": "scatterternary", "marker": { "colorbar": { "ticks": "", "outlinewidth": 0 } } } ], "histogram2dcontour": [ { "type": "histogram2dcontour", "colorbar": { "ticks": "", "outlinewidth": 0 }, "autocolorscale": true } ] }, "layout": { "geo": { "bgcolor": "white", "showland": true, "lakecolor": "white", "landcolor": "white", "showlakes": true, "subunitcolor": "#C8D4E3" }, "font": { "color": "#2a3f5f" }, "polar": { "bgcolor": "white", "radialaxis": { "ticks": "", "gridcolor": "#EBF0F8", "linecolor": "#EBF0F8" }, "angularaxis": { "ticks": "", "gridcolor": "#EBF0F8", "linecolor": "#EBF0F8" } }, "scene": { "xaxis": { "ticks": "", "gridcolor": "#DFE8F3", "gridwidth": 2, "linecolor": "#EBF0F8", "zerolinecolor": "#EBF0F8", "showbackground": true, "backgroundcolor": "white" }, "yaxis": { "ticks": "", "gridcolor": "#DFE8F3", "gridwidth": 2, "linecolor": "#EBF0F8", "zerolinecolor": "#EBF0F8", "showbackground": true, "backgroundcolor": "white" }, "zaxis": { "ticks": "", "gridcolor": "#DFE8F3", "gridwidth": 2, "linecolor": "#EBF0F8", "zerolinecolor": "#EBF0F8", "showbackground": true, "backgroundcolor": "white" } }, "title": { "x": 0.05 }, "xaxis": { "ticks": "", "gridcolor": "#EBF0F8", "linecolor": "#EBF0F8", "automargin": true, "zerolinecolor": "#EBF0F8", "zerolinewidth": 2 }, "yaxis": { "ticks": "", "gridcolor": "#EBF0F8", "linecolor": "#EBF0F8", "automargin": true, "zerolinecolor": "#EBF0F8", "zerolinewidth": 2 }, "ternary": { "aaxis": { "ticks": "", "gridcolor": "#DFE8F3", "linecolor": "#A2B1C6" }, "baxis": { "ticks": "", "gridcolor": "#DFE8F3", "linecolor": "#A2B1C6" }, "caxis": { "ticks": "", "gridcolor": "#DFE8F3", "linecolor": "#A2B1C6" }, "bgcolor": "white" }, "colorway": [ "#636efa", "#EF553B", "#00cc96", "#ab63fa", "#19d3f3", "#e763fa", "#fecb52", "#ffa15a", "#ff6692", "#b6e880" ], "hovermode": "closest", "colorscale": { "diverging": [ [ 0, "#8e0152" ], [ 0.1, "#c51b7d" ], [ 0.2, "#de77ae" ], [ 0.3, "#f1b6da" ], [ 0.4, "#fde0ef" ], [ 0.5, "#f7f7f7" ], [ 0.6, "#e6f5d0" ], [ 0.7, "#b8e186" ], [ 0.8, "#7fbc41" ], [ 0.9, "#4d9221" ], [ 1, "#276419" ] ], "sequential": [ [ 0, "#0508b8" ], [ 0.0893854748603352, "#1910d8" ], [ 0.1787709497206704, "#3c19f0" ], [ 0.2681564245810056, "#6b1cfb" ], [ 0.3575418994413408, "#981cfd" ], [ 0.44692737430167595, "#bf1cfd" ], [ 0.5363128491620112, "#dd2bfd" ], [ 0.6256983240223464, "#f246fe" ], [ 0.7150837988826816, "#fc67fd" ], [ 0.8044692737430168, "#fe88fc" ], [ 0.8938547486033519, "#fea5fd" ], [ 0.9832402234636871, "#febefe" ], [ 1, "#fec3fe" ] ], "sequentialminus": [ [ 0, "#0508b8" ], [ 0.0893854748603352, "#1910d8" ], [ 0.1787709497206704, "#3c19f0" ], [ 0.2681564245810056, "#6b1cfb" ], [ 0.3575418994413408, "#981cfd" ], [ 0.44692737430167595, "#bf1cfd" ], [ 0.5363128491620112, "#dd2bfd" ], [ 0.6256983240223464, "#f246fe" ], [ 0.7150837988826816, "#fc67fd" ], [ 0.8044692737430168, "#fe88fc" ], [ 0.8938547486033519, "#fea5fd" ], [ 0.9832402234636871, "#febefe" ], [ 1, "#fec3fe" ] ] }, "plot_bgcolor": "white", "paper_bgcolor": "white", "shapedefaults": { "line": { "width": 0 }, "opacity": 0.4, "fillcolor": "#506784" }, "annotationdefaults": { "arrowhead": 0, "arrowcolor": "#506784", "arrowwidth": 1 } }, "themeRef": "PLOTLY_WHITE" } } }, "height": null, "width": null, "user": { "profile_url": "https://chart-studio.plotly.com/~pregninett", "avatar_url": "https://storage.googleapis.com/plotly-prod-profiles/21.jpg", "background_url": "https://storage.googleapis.com/plotly-prod-profiles/bg-11.jpg", "bio": "", "nickname": "", "website": "", "stream_tokens": null, "feature_set_id": null, "csrf_token": null, "date_joined": "2022-05-06 21:19:56", "mapbox_access_tokens": null, "has_password": null, "username": "pregninett", "email": null, "is_active": null, "readonly": null, "is_dash_creator": null, "dash_created_count": null, "is_chart_creator": null, "charts_created_count": null } }, { "creation_time": "2024-04-30T01:07:40.910540Z", "comments": { "results": [], "count": 0 }, "parented": true, "embed_url": "https://chart-studio.plotly.com/~UiaraMota/6.embed", "fid": "UiaraMota:6", "filename": "Plot 6", "filetype": "plot", "img_url": "https://storage.googleapis.com/plotly-prod-images/UiaraMota/6/9_8133F259JMTJA1TV06J0EDN4ZYXBL8.png", "image_urls": { "default": "https://storage.googleapis.com/plotly-prod-images/UiaraMota/6/2_1Y4GQ2HL4GSDZXF1QKI2XE7R1ZICO8.png", "block-thumb": "https://storage.googleapis.com/plotly-prod-images/UiaraMota/6/8_V9072048GL0AA2PJTXOWWYDF8Q9L4A.png", "list-thumb": "https://storage.googleapis.com/plotly-prod-images/UiaraMota/6/9_8133F259JMTJA1TV06J0EDN4ZYXBL8.png" }, "api_urls": { "files": "https://api.plotly.com/v2/files/UiaraMota:6", "plots": "https://api.plotly.com/v2/plots/UiaraMota:6", "parent": "https://api.plotly.com/v2/folders/home?user=UiaraMota" }, "owner": "UiaraMota", "parent": -1, "preview": "", "referencers": [], "references": [], "title": "", "views": 1, "web_url": "https://chart-studio.plotly.com/~UiaraMota/6/", "world_readable": true, "date_modified": "2024-04-30T01:07:40.927Z", "stars": { "results": [], "count": 0 }, "collaborators": { "results": [], "count": 0 }, "subfolder_count": null, "refresh_interval": null, "organize_view_url": "https://chart-studio.plotly.com/~UiaraMota/6/", "current_user_permission": "read", "is_theme": null, "is_template": false, "autosize": true, "caption": "", "figure": { "data": [ { "line": { "color": "rgb(235, 5, 20)" }, "meta": { "columnNames": { "x": "Ano", "y": "Passivo Total" } }, "mode": "lines", "name": "Passivo Total", "type": "scatter", "xsrc": "UiaraMota:5:9140eb", "ysrc": "UiaraMota:5:b7cefb", "error_x": { "type": "percent", "color": "rgb(235, 5, 20)", "value": 10, "width": 4, "visible": false, "symmetric": true, "thickness": 2 }, "error_y": { "type": "percent", "color": "rgb(235, 5, 20)", "value": 10, "width": 4, "visible": false, "symmetric": true, "thickness": 2 }, "hoverinfo": "x+y" }, { "line": { "color": "rgb(248, 132, 4)" }, "meta": { "columnNames": { "x": "Ano", "y": "Passivo Circulante" } }, "mode": "lines", "name": "Passivo Circulante", "type": "scatter", "xsrc": "UiaraMota:5:9140eb", "ysrc": "UiaraMota:5:6db279", "hoverinfo": "x+y", "stackgroup": null }, { "line": { "color": "rgb(175, 158, 26)" }, "meta": { "columnNames": { "x": "Ano", "y": "Passivo Não Circulante" } }, "mode": "lines", "name": "Passivo Não Circulante", "type": "scatter", "xsrc": "UiaraMota:5:9140eb", "ysrc": "UiaraMota:5:a4277f", "stackgroup": null } ], "frames": [], "layout": { "title": { "text": "Empresa X SA" }, "xaxis": { "type": "linear", "range": [ 2001, 2021 ], "title": { "text": "Exercício" }, "autorange": true }, "yaxis": { "range": [ -973924.1111111111, 18888798.111111112 ], "title": { "text": "Total" }, "autorange": true }, "autosize": true, "template": { "data": { "bar": [ { "type": "bar", "marker": { "colorbar": { "ticks": "", "outlinewidth": 0 } } } ], "table": [ { "type": "table", "cells": { "fill": { "color": "#EBF0F8" }, "line": { "color": "white" } }, "header": { "fill": { "color": "#C8D4E3" }, "line": { "color": "white" } } } ], "carpet": [ { "type": "carpet", "aaxis": { "gridcolor": "#C8D4E3", "linecolor": "#C8D4E3", "endlinecolor": "#2a3f5f", "minorgridcolor": "#C8D4E3", "startlinecolor": "#2a3f5f" }, "baxis": { "gridcolor": "#C8D4E3", "linecolor": "#C8D4E3", "endlinecolor": "#2a3f5f", "minorgridcolor": "#C8D4E3", "startlinecolor": "#2a3f5f" } } ], "mesh3d": [ { "type": "mesh3d", "colorbar": { "ticks": "", "outlinewidth": 0 } } ], "contour": [ { "type": "contour", "colorbar": { "ticks": "", "outlinewidth": 0 }, "autocolorscale": true } ], "heatmap": [ { "type": "heatmap", "colorbar": { "ticks": "", "outlinewidth": 0 }, "autocolorscale": true } ], "scatter": [ { "type": "scatter", "marker": { "colorbar": { "ticks": "", "outlinewidth": 0 } } } ], "surface": [ { "type": "surface", "colorbar": { "ticks": "", "outlinewidth": 0 } } ], "heatmapgl": [ { "type": "heatmapgl", "colorbar": { "ticks": "", "outlinewidth": 0 } } ], "histogram": [ { "type": "histogram", "marker": { "colorbar": { "ticks": "", "outlinewidth": 0 } } } ], "parcoords": [ { "line": { "colorbar": { "ticks": "", "outlinewidth": 0 } }, "type": "parcoords" } ], "scatter3d": [ { "type": "scatter3d", "marker": { "colorbar": { "ticks": "", "outlinewidth": 0 } } } ], "scattergl": [ { "type": "scattergl", "marker": { "colorbar": { "ticks": "", "outlinewidth": 0 } } } ], "choropleth": [ { "type": "choropleth", "colorbar": { "ticks": "", "outlinewidth": 0 } } ], "scattergeo": [ { "type": "scattergeo", "marker": { "colorbar": { "ticks": "", "outlinewidth": 0 } } } ], "histogram2d": [ { "type": "histogram2d", "colorbar": { "ticks": "", "outlinewidth": 0 }, "autocolorscale": true } ], "scatterpolar": [ { "type": "scatterpolar", "marker": { "colorbar": { "ticks": "", "outlinewidth": 0 } } } ], "contourcarpet": [ { "type": "contourcarpet", "colorbar": { "ticks": "", "outlinewidth": 0 } } ], "scattercarpet": [ { "type": "scattercarpet", "marker": { "colorbar": { "ticks": "", "outlinewidth": 0 } } } ], "scattermapbox": [ { "type": "scattermapbox", "marker": { "colorbar": { "ticks": "", "outlinewidth": 0 } } } ], "scatterpolargl": [ { "type": "scatterpolargl", "marker": { "colorbar": { "ticks": "", "outlinewidth": 0 } } } ], "scatterternary": [ { "type": "scatterternary", "marker": { "colorbar": { "ticks": "", "outlinewidth": 0 } } } ], "histogram2dcontour": [ { "type": "histogram2dcontour", "colorbar": { "ticks": "", "outlinewidth": 0 }, "autocolorscale": true } ] }, "layout": { "geo": { "bgcolor": "white", "showland": true, "lakecolor": "white", "landcolor": "white", "showlakes": true, "subunitcolor": "#C8D4E3" }, "font": { "color": "#2a3f5f" }, "polar": { "bgcolor": "white", "radialaxis": { "ticks": "", "gridcolor": "#EBF0F8", "linecolor": "#EBF0F8" }, "angularaxis": { "ticks": "", "gridcolor": "#EBF0F8", "linecolor": "#EBF0F8" } }, "scene": { "xaxis": { "ticks": "", "gridcolor": "#DFE8F3", "gridwidth": 2, "linecolor": "#EBF0F8", "zerolinecolor": "#EBF0F8", "showbackground": true, "backgroundcolor": "white" }, "yaxis": { "ticks": "", "gridcolor": "#DFE8F3", "gridwidth": 2, "linecolor": "#EBF0F8", "zerolinecolor": "#EBF0F8", "showbackground": true, "backgroundcolor": "white" }, "zaxis": { "ticks": "", "gridcolor": "#DFE8F3", "gridwidth": 2, "linecolor": "#EBF0F8", "zerolinecolor": "#EBF0F8", "showbackground": true, "backgroundcolor": "white" } }, "title": { "x": 0.05 }, "xaxis": { "ticks": "", "gridcolor": "#EBF0F8", "linecolor": "#EBF0F8", "automargin": true, "zerolinecolor": "#EBF0F8", "zerolinewidth": 2 }, "yaxis": { "ticks": "", "gridcolor": "#EBF0F8", "linecolor": "#EBF0F8", "automargin": true, "zerolinecolor": "#EBF0F8", "zerolinewidth": 2 }, "ternary": { "aaxis": { "ticks": "", "gridcolor": "#DFE8F3", "linecolor": "#A2B1C6" }, "baxis": { "ticks": "", "gridcolor": "#DFE8F3", "linecolor": "#A2B1C6" }, "caxis": { "ticks": "", "gridcolor": "#DFE8F3", "linecolor": "#A2B1C6" }, "bgcolor": "white" }, "colorway": [ "#636efa", "#EF553B", "#00cc96", "#ab63fa", "#19d3f3", "#e763fa", "#fecb52", "#ffa15a", "#ff6692", "#b6e880" ], "hovermode": "closest", "colorscale": { "diverging": [ [ 0, "#8e0152" ], [ 0.1, "#c51b7d" ], [ 0.2, "#de77ae" ], [ 0.3, "#f1b6da" ], [ 0.4, "#fde0ef" ], [ 0.5, "#f7f7f7" ], [ 0.6, "#e6f5d0" ], [ 0.7, "#b8e186" ], [ 0.8, "#7fbc41" ], [ 0.9, "#4d9221" ], [ 1, "#276419" ] ], "sequential": [ [ 0, "#0508b8" ], [ 0.0893854748603352, "#1910d8" ], [ 0.1787709497206704, "#3c19f0" ], [ 0.2681564245810056, "#6b1cfb" ], [ 0.3575418994413408, "#981cfd" ], [ 0.44692737430167595, "#bf1cfd" ], [ 0.5363128491620112, "#dd2bfd" ], [ 0.6256983240223464, "#f246fe" ], [ 0.7150837988826816, "#fc67fd" ], [ 0.8044692737430168, "#fe88fc" ], [ 0.8938547486033519, "#fea5fd" ], [ 0.9832402234636871, "#febefe" ], [ 1, "#fec3fe" ] ], "sequentialminus": [ [ 0, "#0508b8" ], [ 0.0893854748603352, "#1910d8" ], [ 0.1787709497206704, "#3c19f0" ], [ 0.2681564245810056, "#6b1cfb" ], [ 0.3575418994413408, "#981cfd" ], [ 0.44692737430167595, "#bf1cfd" ], [ 0.5363128491620112, "#dd2bfd" ], [ 0.6256983240223464, "#f246fe" ], [ 0.7150837988826816, "#fc67fd" ], [ 0.8044692737430168, "#fe88fc" ], [ 0.8938547486033519, "#fea5fd" ], [ 0.9832402234636871, "#febefe" ], [ 1, "#fec3fe" ] ] }, "plot_bgcolor": "white", "paper_bgcolor": "white", "shapedefaults": { "line": { "width": 0 }, "opacity": 0.4, "fillcolor": "#506784" }, "annotationdefaults": { "arrowhead": 0, "arrowcolor": "#506784", "arrowwidth": 1 } }, "themeRef": "PLOTLY_WHITE" } } }, "height": null, "width": null, "user": { "profile_url": "https://chart-studio.plotly.com/~UiaraMota", "avatar_url": "https://storage.googleapis.com/plotly-prod-profiles/43.jpg", "background_url": "https://storage.googleapis.com/plotly-prod-profiles/bg-9.jpg", "bio": "", "nickname": "", "website": "", "stream_tokens": null, "feature_set_id": null, "csrf_token": null, "date_joined": "2024-04-29 23:38:14", "mapbox_access_tokens": null, "has_password": null, "username": "UiaraMota", "email": null, "is_active": null, "readonly": null, "is_dash_creator": null, "dash_created_count": null, "is_chart_creator": null, "charts_created_count": null } }, { "creation_time": "2024-04-30T01:06:12.887933Z", "comments": { "results": [], "count": 0 }, "parented": true, "embed_url": "https://chart-studio.plotly.com/~sz.csenge21/11.embed", "fid": "sz.csenge21:11", "filename": "fogyasztási gyak", "filetype": "plot", "img_url": "https://storage.googleapis.com/plotly-prod-images/sz.csenge21/11/9_3MAPOJW8LF13FWP8PJCMQEPV778QM5.png", "image_urls": { "default": "https://storage.googleapis.com/plotly-prod-images/sz.csenge21/11/2_IYW7JLL40MWXMY1SQXDNWQJOB9DVQ8.png", "block-thumb": "https://storage.googleapis.com/plotly-prod-images/sz.csenge21/11/8_WV6NC8IX2V65NQ9CY3WNWU98XXS5CV.png", "list-thumb": "https://storage.googleapis.com/plotly-prod-images/sz.csenge21/11/9_3MAPOJW8LF13FWP8PJCMQEPV778QM5.png" }, "api_urls": { "files": "https://api.plotly.com/v2/files/sz.csenge21:11", "plots": "https://api.plotly.com/v2/plots/sz.csenge21:11", "parent": "https://api.plotly.com/v2/folders/home?user=sz.csenge21" }, "owner": "sz.csenge21", "parent": -1, "preview": "", "referencers": [], "references": [], "title": "", "views": 1, "web_url": "https://chart-studio.plotly.com/~sz.csenge21/11/", "world_readable": true, "date_modified": "2024-04-30T01:12:50.372Z", "stars": { "results": [], "count": 0 }, "collaborators": { "results": [], "count": 0 }, "subfolder_count": null, "refresh_interval": null, "organize_view_url": "https://chart-studio.plotly.com/~sz.csenge21/11/", "current_user_permission": "read", "is_theme": null, "is_template": false, "autosize": true, "caption": "", "figure": { "data": [ { "meta": { "columnNames": { "x": "A", "y": "B", "error_y": { "array": "C" } } }, "mode": "markers", "type": "bar", "xsrc": "sz.csenge21:10:233e39", "ysrc": "sz.csenge21:10:6226a1", "marker": { "color": "rgb(220, 166, 224)" }, "error_y": { "meta": { "columnNames": { "array": "C" } }, "type": "data", "visible": true, "arraysrc": "sz.csenge21:10:8ef3ef", "symmetric": true }, "orientation": "v" } ], "frames": [], "layout": { "font": { "size": 18, "color": "rgb(0, 0, 0)", "family": "Times New Roman" }, "title": { "font": { "size": 22 }, "text": "<b>1. Ábra</b><br><i>Élelmiszercsoportok fogyasztási gyakorisága</i>" }, "xaxis": { "type": "category", "range": [ -0.5, 9.5 ], "title": { "font": { "size": 20 }, "text": "Élelmiszercsoportok" }, "autorange": true }, "yaxis": { "type": "linear", "range": [ -2.0068888888888887, 16.85088888888889 ], "title": { "text": "Heti fogyasztási gyakoriság" }, "autorange": true }, "autosize": true, "template": { "data": { "bar": [ { "type": "bar", "marker": { "colorbar": { "ticks": "", "outlinewidth": 0 } } } ], "table": [ { "type": "table", "cells": { "fill": { "color": "#EBF0F8" }, "line": { "color": "white" } }, "header": { "fill": { "color": "#C8D4E3" }, "line": { "color": "white" } } } ], "carpet": [ { "type": "carpet", "aaxis": { "gridcolor": "#C8D4E3", "linecolor": "#C8D4E3", "endlinecolor": "#2a3f5f", "minorgridcolor": "#C8D4E3", "startlinecolor": "#2a3f5f" }, "baxis": { "gridcolor": "#C8D4E3", "linecolor": "#C8D4E3", "endlinecolor": "#2a3f5f", "minorgridcolor": "#C8D4E3", "startlinecolor": "#2a3f5f" } } ], "mesh3d": [ { "type": "mesh3d", "colorbar": { "ticks": "", "outlinewidth": 0 } } ], "contour": [ { "type": "contour", "colorbar": { "ticks": "", "outlinewidth": 0 }, "autocolorscale": true } ], "heatmap": [ { "type": "heatmap", "colorbar": { "ticks": "", "outlinewidth": 0 }, "autocolorscale": true } ], "scatter": [ { "type": "scatter", "marker": { "colorbar": { "ticks": "", "outlinewidth": 0 } } } ], "surface": [ { "type": "surface", "colorbar": { "ticks": "", "outlinewidth": 0 } } ], "heatmapgl": [ { "type": "heatmapgl", "colorbar": { "ticks": "", "outlinewidth": 0 } } ], "histogram": [ { "type": "histogram", "marker": { "colorbar": { "ticks": "", "outlinewidth": 0 } } } ], "parcoords": [ { "line": { "colorbar": { "ticks": "", "outlinewidth": 0 } }, "type": "parcoords" } ], "scatter3d": [ { "type": "scatter3d", "marker": { "colorbar": { "ticks": "", "outlinewidth": 0 } } } ], "scattergl": [ { "type": "scattergl", "marker": { "colorbar": { "ticks": "", "outlinewidth": 0 } } } ], "choropleth": [ { "type": "choropleth", "colorbar": { "ticks": "", "outlinewidth": 0 } } ], "scattergeo": [ { "type": "scattergeo", "marker": { "colorbar": { "ticks": "", "outlinewidth": 0 } } } ], "histogram2d": [ { "type": "histogram2d", "colorbar": { "ticks": "", "outlinewidth": 0 }, "autocolorscale": true } ], "scatterpolar": [ { "type": "scatterpolar", "marker": { "colorbar": { "ticks": "", "outlinewidth": 0 } } } ], "contourcarpet": [ { "type": "contourcarpet", "colorbar": { "ticks": "", "outlinewidth": 0 } } ], "scattercarpet": [ { "type": "scattercarpet", "marker": { "colorbar": { "ticks": "", "outlinewidth": 0 } } } ], "scattermapbox": [ { "type": "scattermapbox", "marker": { "colorbar": { "ticks": "", "outlinewidth": 0 } } } ], "scatterpolargl": [ { "type": "scatterpolargl", "marker": { "colorbar": { "ticks": "", "outlinewidth": 0 } } } ], "scatterternary": [ { "type": "scatterternary", "marker": { "colorbar": { "ticks": "", "outlinewidth": 0 } } } ], "histogram2dcontour": [ { "type": "histogram2dcontour", "colorbar": { "ticks": "", "outlinewidth": 0 }, "autocolorscale": true } ] }, "layout": { "geo": { "bgcolor": "white", "showland": true, "lakecolor": "white", "landcolor": "white", "showlakes": true, "subunitcolor": "#C8D4E3" }, "font": { "color": "#2a3f5f" }, "polar": { "bgcolor": "white", "radialaxis": { "ticks": "", "gridcolor": "#EBF0F8", "linecolor": "#EBF0F8" }, "angularaxis": { "ticks": "", "gridcolor": "#EBF0F8", "linecolor": "#EBF0F8" } }, "scene": { "xaxis": { "ticks": "", "gridcolor": "#DFE8F3", "gridwidth": 2, "linecolor": "#EBF0F8", "zerolinecolor": "#EBF0F8", "showbackground": true, "backgroundcolor": "white" }, "yaxis": { "ticks": "", "gridcolor": "#DFE8F3", "gridwidth": 2, "linecolor": "#EBF0F8", "zerolinecolor": "#EBF0F8", "showbackground": true, "backgroundcolor": "white" }, "zaxis": { "ticks": "", "gridcolor": "#DFE8F3", "gridwidth": 2, "linecolor": "#EBF0F8", "zerolinecolor": "#EBF0F8", "showbackground": true, "backgroundcolor": "white" } }, "title": { "x": 0.05 }, "xaxis": { "ticks": "", "gridcolor": "#EBF0F8", "linecolor": "#EBF0F8", "automargin": true, "zerolinecolor": "#EBF0F8", "zerolinewidth": 2 }, "yaxis": { "ticks": "", "gridcolor": "#EBF0F8", "linecolor": "#EBF0F8", "automargin": true, "zerolinecolor": "#EBF0F8", "zerolinewidth": 2 }, "ternary": { "aaxis": { "ticks": "", "gridcolor": "#DFE8F3", "linecolor": "#A2B1C6" }, "baxis": { "ticks": "", "gridcolor": "#DFE8F3", "linecolor": "#A2B1C6" }, "caxis": { "ticks": "", "gridcolor": "#DFE8F3", "linecolor": "#A2B1C6" }, "bgcolor": "white" }, "colorway": [ "#636efa", "#EF553B", "#00cc96", "#ab63fa", "#19d3f3", "#e763fa", "#fecb52", "#ffa15a", "#ff6692", "#b6e880" ], "hovermode": "closest", "colorscale": { "diverging": [ [ 0, "#8e0152" ], [ 0.1, "#c51b7d" ], [ 0.2, "#de77ae" ], [ 0.3, "#f1b6da" ], [ 0.4, "#fde0ef" ], [ 0.5, "#f7f7f7" ], [ 0.6, "#e6f5d0" ], [ 0.7, "#b8e186" ], [ 0.8, "#7fbc41" ], [ 0.9, "#4d9221" ], [ 1, "#276419" ] ], "sequential": [ [ 0, "#0508b8" ], [ 0.0893854748603352, "#1910d8" ], [ 0.1787709497206704, "#3c19f0" ], [ 0.2681564245810056, "#6b1cfb" ], [ 0.3575418994413408, "#981cfd" ], [ 0.44692737430167595, "#bf1cfd" ], [ 0.5363128491620112, "#dd2bfd" ], [ 0.6256983240223464, "#f246fe" ], [ 0.7150837988826816, "#fc67fd" ], [ 0.8044692737430168, "#fe88fc" ], [ 0.8938547486033519, "#fea5fd" ], [ 0.9832402234636871, "#febefe" ], [ 1, "#fec3fe" ] ], "sequentialminus": [ [ 0, "#0508b8" ], [ 0.0893854748603352, "#1910d8" ], [ 0.1787709497206704, "#3c19f0" ], [ 0.2681564245810056, "#6b1cfb" ], [ 0.3575418994413408, "#981cfd" ], [ 0.44692737430167595, "#bf1cfd" ], [ 0.5363128491620112, "#dd2bfd" ], [ 0.6256983240223464, "#f246fe" ], [ 0.7150837988826816, "#fc67fd" ], [ 0.8044692737430168, "#fe88fc" ], [ 0.8938547486033519, "#fea5fd" ], [ 0.9832402234636871, "#febefe" ], [ 1, "#fec3fe" ] ] }, "plot_bgcolor": "white", "paper_bgcolor": "white", "shapedefaults": { "line": { "width": 0 }, "opacity": 0.4, "fillcolor": "#506784" }, "annotationdefaults": { "arrowhead": 0, "arrowcolor": "#506784", "arrowwidth": 1 } }, "themeRef": "PLOTLY_WHITE" } } }, "height": null, "width": null, "user": { "profile_url": "https://chart-studio.plotly.com/~sz.csenge21", "avatar_url": "https://storage.googleapis.com/plotly-prod-profiles/6.jpg", "background_url": "https://storage.googleapis.com/plotly-prod-profiles/bg-3.jpg", "bio": "", "nickname": "", "website": "", "stream_tokens": null, "feature_set_id": null, "csrf_token": null, "date_joined": "2022-05-05 06:50:23", "mapbox_access_tokens": null, "has_password": null, "username": "sz.csenge21", "email": null, "is_active": null, "readonly": null, "is_dash_creator": null, "dash_created_count": null, "is_chart_creator": null, "charts_created_count": null } }, { "creation_time": "2024-04-30T01:00:30.424402Z", "comments": { "results": [], "count": 0 }, "parented": true, "embed_url": "https://chart-studio.plotly.com/~UiaraMota/4.embed", "fid": "UiaraMota:4", "filename": "Plot 4", "filetype": "plot", "img_url": "https://storage.googleapis.com/plotly-prod-images/UiaraMota/4/9_011369FJDYHDGM8OG3WJMO7MKS3WPZ.png", "image_urls": { "default": "https://storage.googleapis.com/plotly-prod-images/UiaraMota/4/2_539XGQRN5DVULVT5SGFGJA0S64IN7R.png", "block-thumb": "https://storage.googleapis.com/plotly-prod-images/UiaraMota/4/8_SL2QJ33B22V1MN3JTKSVXY7D3WRLTF.png", "list-thumb": "https://storage.googleapis.com/plotly-prod-images/UiaraMota/4/9_011369FJDYHDGM8OG3WJMO7MKS3WPZ.png" }, "api_urls": { "files": "https://api.plotly.com/v2/files/UiaraMota:4", "plots": "https://api.plotly.com/v2/plots/UiaraMota:4", "parent": "https://api.plotly.com/v2/folders/home?user=UiaraMota" }, "owner": "UiaraMota", "parent": -1, "preview": "", "referencers": [], "references": [], "title": "", "views": 1, "web_url": "https://chart-studio.plotly.com/~UiaraMota/4/", "world_readable": true, "date_modified": "2024-04-30T01:00:30.437Z", "stars": { "results": [], "count": 0 }, "collaborators": { "results": [], "count": 0 }, "subfolder_count": null, "refresh_interval": null, "organize_view_url": "https://chart-studio.plotly.com/~UiaraMota/4/", "current_user_permission": "read", "is_theme": null, "is_template": false, "autosize": true, "caption": "", "figure": { "data": [ { "meta": { "columnNames": { "x": "Ano", "y": "Ativo Total" } }, "mode": "markers", "name": "Ativo Total", "type": "bar", "xsrc": "UiaraMota:3:6455aa", "ysrc": "UiaraMota:3:418196", "marker": { "color": "rgb(17, 38, 234)" }, "hoverinfo": "x+y", "orientation": "v" }, { "meta": { "columnNames": { "x": "Ano", "y": "Ativo Circulante" } }, "name": "Ativo Circulante", "type": "bar", "xsrc": "UiaraMota:3:6455aa", "ysrc": "UiaraMota:3:2fe9a9", "marker": { "color": "rgb(59, 239, 236)" }, "hoverinfo": "x+y", "orientation": "v" }, { "meta": { "columnNames": { "x": "Ano", "y": "Ativo Não Circulante" } }, "name": "Ativo não circulante", "type": "bar", "xsrc": "UiaraMota:3:6455aa", "ysrc": "UiaraMota:3:25bdfd", "marker": { "color": "rgb(64, 130, 100)" }, "orientation": "v" } ], "frames": [], "layout": { "title": { "text": "Empresa X S.A" }, "xaxis": { "type": "linear", "range": [ 2000.5, 2021.5 ], "title": { "text": "Exercício" }, "autorange": true }, "yaxis": { "range": [ 0, 18837538.94736842 ], "title": { "text": "Total" }, "autorange": true }, "autosize": true, "template": { "data": { "bar": [ { "type": "bar", "marker": { "colorbar": { "ticks": "", "outlinewidth": 0 } } } ], "table": [ { "type": "table", "cells": { "fill": { "color": "#EBF0F8" }, "line": { "color": "white" } }, "header": { "fill": { "color": "#C8D4E3" }, "line": { "color": "white" } } } ], "carpet": [ { "type": "carpet", "aaxis": { "gridcolor": "#C8D4E3", "linecolor": "#C8D4E3", "endlinecolor": "#2a3f5f", "minorgridcolor": "#C8D4E3", "startlinecolor": "#2a3f5f" }, "baxis": { "gridcolor": "#C8D4E3", "linecolor": "#C8D4E3", "endlinecolor": "#2a3f5f", "minorgridcolor": "#C8D4E3", "startlinecolor": "#2a3f5f" } } ], "mesh3d": [ { "type": "mesh3d", "colorbar": { "ticks": "", "outlinewidth": 0 } } ], "contour": [ { "type": "contour", "colorbar": { "ticks": "", "outlinewidth": 0 }, "autocolorscale": true } ], "heatmap": [ { "type": "heatmap", "colorbar": { "ticks": "", "outlinewidth": 0 }, "autocolorscale": true } ], "scatter": [ { "type": "scatter", "marker": { "colorbar": { "ticks": "", "outlinewidth": 0 } } } ], "surface": [ { "type": "surface", "colorbar": { "ticks": "", "outlinewidth": 0 } } ], "heatmapgl": [ { "type": "heatmapgl", "colorbar": { "ticks": "", "outlinewidth": 0 } } ], "histogram": [ { "type": "histogram", "marker": { "colorbar": { "ticks": "", "outlinewidth": 0 } } } ], "parcoords": [ { "line": { "colorbar": { "ticks": "", "outlinewidth": 0 } }, "type": "parcoords" } ], "scatter3d": [ { "type": "scatter3d", "marker": { "colorbar": { "ticks": "", "outlinewidth": 0 } } } ], "scattergl": [ { "type": "scattergl", "marker": { "colorbar": { "ticks": "", "outlinewidth": 0 } } } ], "choropleth": [ { "type": "choropleth", "colorbar": { "ticks": "", "outlinewidth": 0 } } ], "scattergeo": [ { "type": "scattergeo", "marker": { "colorbar": { "ticks": "", "outlinewidth": 0 } } } ], "histogram2d": [ { "type": "histogram2d", "colorbar": { "ticks": "", "outlinewidth": 0 }, "autocolorscale": true } ], "scatterpolar": [ { "type": "scatterpolar", "marker": { "colorbar": { "ticks": "", "outlinewidth": 0 } } } ], "contourcarpet": [ { "type": "contourcarpet", "colorbar": { "ticks": "", "outlinewidth": 0 } } ], "scattercarpet": [ { "type": "scattercarpet", "marker": { "colorbar": { "ticks": "", "outlinewidth": 0 } } } ], "scattermapbox": [ { "type": "scattermapbox", "marker": { "colorbar": { "ticks": "", "outlinewidth": 0 } } } ], "scatterpolargl": [ { "type": "scatterpolargl", "marker": { "colorbar": { "ticks": "", "outlinewidth": 0 } } } ], "scatterternary": [ { "type": "scatterternary", "marker": { "colorbar": { "ticks": "", "outlinewidth": 0 } } } ], "histogram2dcontour": [ { "type": "histogram2dcontour", "colorbar": { "ticks": "", "outlinewidth": 0 }, "autocolorscale": true } ] }, "layout": { "geo": { "bgcolor": "white", "showland": true, "lakecolor": "white", "landcolor": "white", "showlakes": true, "subunitcolor": "#C8D4E3" }, "font": { "color": "#2a3f5f" }, "polar": { "bgcolor": "white", "radialaxis": { "ticks": "", "gridcolor": "#EBF0F8", "linecolor": "#EBF0F8" }, "angularaxis": { "ticks": "", "gridcolor": "#EBF0F8", "linecolor": "#EBF0F8" } }, "scene": { "xaxis": { "ticks": "", "gridcolor": "#DFE8F3", "gridwidth": 2, "linecolor": "#EBF0F8", "zerolinecolor": "#EBF0F8", "showbackground": true, "backgroundcolor": "white" }, "yaxis": { "ticks": "", "gridcolor": "#DFE8F3", "gridwidth": 2, "linecolor": "#EBF0F8", "zerolinecolor": "#EBF0F8", "showbackground": true, "backgroundcolor": "white" }, "zaxis": { "ticks": "", "gridcolor": "#DFE8F3", "gridwidth": 2, "linecolor": "#EBF0F8", "zerolinecolor": "#EBF0F8", "showbackground": true, "backgroundcolor": "white" } }, "title": { "x": 0.05 }, "xaxis": { "ticks": "", "gridcolor": "#EBF0F8", "linecolor": "#EBF0F8", "automargin": true, "zerolinecolor": "#EBF0F8", "zerolinewidth": 2 }, "yaxis": { "ticks": "", "gridcolor": "#EBF0F8", "linecolor": "#EBF0F8", "automargin": true, "zerolinecolor": "#EBF0F8", "zerolinewidth": 2 }, "ternary": { "aaxis": { "ticks": "", "gridcolor": "#DFE8F3", "linecolor": "#A2B1C6" }, "baxis": { "ticks": "", "gridcolor": "#DFE8F3", "linecolor": "#A2B1C6" }, "caxis": { "ticks": "", "gridcolor": "#DFE8F3", "linecolor": "#A2B1C6" }, "bgcolor": "white" }, "colorway": [ "#636efa", "#EF553B", "#00cc96", "#ab63fa", "#19d3f3", "#e763fa", "#fecb52", "#ffa15a", "#ff6692", "#b6e880" ], "hovermode": "closest", "colorscale": { "diverging": [ [ 0, "#8e0152" ], [ 0.1, "#c51b7d" ], [ 0.2, "#de77ae" ], [ 0.3, "#f1b6da" ], [ 0.4, "#fde0ef" ], [ 0.5, "#f7f7f7" ], [ 0.6, "#e6f5d0" ], [ 0.7, "#b8e186" ], [ 0.8, "#7fbc41" ], [ 0.9, "#4d9221" ], [ 1, "#276419" ] ], "sequential": [ [ 0, "#0508b8" ], [ 0.0893854748603352, "#1910d8" ], [ 0.1787709497206704, "#3c19f0" ], [ 0.2681564245810056, "#6b1cfb" ], [ 0.3575418994413408, "#981cfd" ], [ 0.44692737430167595, "#bf1cfd" ], [ 0.5363128491620112, "#dd2bfd" ], [ 0.6256983240223464, "#f246fe" ], [ 0.7150837988826816, "#fc67fd" ], [ 0.8044692737430168, "#fe88fc" ], [ 0.8938547486033519, "#fea5fd" ], [ 0.9832402234636871, "#febefe" ], [ 1, "#fec3fe" ] ], "sequentialminus": [ [ 0, "#0508b8" ], [ 0.0893854748603352, "#1910d8" ], [ 0.1787709497206704, "#3c19f0" ], [ 0.2681564245810056, "#6b1cfb" ], [ 0.3575418994413408, "#981cfd" ], [ 0.44692737430167595, "#bf1cfd" ], [ 0.5363128491620112, "#dd2bfd" ], [ 0.6256983240223464, "#f246fe" ], [ 0.7150837988826816, "#fc67fd" ], [ 0.8044692737430168, "#fe88fc" ], [ 0.8938547486033519, "#fea5fd" ], [ 0.9832402234636871, "#febefe" ], [ 1, "#fec3fe" ] ] }, "plot_bgcolor": "white", "paper_bgcolor": "white", "shapedefaults": { "line": { "width": 0 }, "opacity": 0.4, "fillcolor": "#506784" }, "annotationdefaults": { "arrowhead": 0, "arrowcolor": "#506784", "arrowwidth": 1 } }, "themeRef": "PLOTLY_WHITE" } } }, "height": null, "width": null, "user": { "profile_url": "https://chart-studio.plotly.com/~UiaraMota", "avatar_url": "https://storage.googleapis.com/plotly-prod-profiles/43.jpg", "background_url": "https://storage.googleapis.com/plotly-prod-profiles/bg-9.jpg", "bio": "", "nickname": "", "website": "", "stream_tokens": null, "feature_set_id": null, "csrf_token": null, "date_joined": "2024-04-29 23:38:14", "mapbox_access_tokens": null, "has_password": null, "username": "UiaraMota", "email": null, "is_active": null, "readonly": null, "is_dash_creator": null, "dash_created_count": null, "is_chart_creator": null, "charts_created_count": null } }, { "creation_time": "2024-04-30T00:55:21.452905Z", "comments": { "results": [], "count": 0 }, "parented": true, "embed_url": "https://chart-studio.plotly.com/~MarlaynaD/7.embed", "fid": "MarlaynaD:7", "filename": "Plot 7", "filetype": "plot", "img_url": "https://storage.googleapis.com/plotly-prod-images/MarlaynaD/7/9_0W4BQ7A7AORKLP7LDMJIT928GTNAEW.png", "image_urls": { "default": "https://storage.googleapis.com/plotly-prod-images/MarlaynaD/7/2_PSVT9PHS92I08P1VEUZBQBTEG2RINF.png", "block-thumb": "https://storage.googleapis.com/plotly-prod-images/MarlaynaD/7/8_0NANP7HYPWSPEMUY9G8TS1NR5O6RAJ.png", "list-thumb": "https://storage.googleapis.com/plotly-prod-images/MarlaynaD/7/9_0W4BQ7A7AORKLP7LDMJIT928GTNAEW.png" }, "api_urls": { "files": "https://api.plotly.com/v2/files/MarlaynaD:7", "plots": "https://api.plotly.com/v2/plots/MarlaynaD:7", "parent": "https://api.plotly.com/v2/folders/home?user=MarlaynaD" }, "owner": "MarlaynaD", "parent": -1, "preview": "", "referencers": [], "references": [], "title": "", "views": 1, "web_url": "https://chart-studio.plotly.com/~MarlaynaD/7/", "world_readable": true, "date_modified": "2024-04-30T00:55:21.465Z", "stars": { "results": [], "count": 0 }, "collaborators": { "results": [], "count": 0 }, "subfolder_count": null, "refresh_interval": null, "organize_view_url": "https://chart-studio.plotly.com/~MarlaynaD/7/", "current_user_permission": "read", "is_theme": null, "is_template": false, "autosize": true, "caption": "", "figure": { "data": [ { "meta": { "columnNames": { "y": "B" } }, "mode": "markers", "name": "Epilepsy", "type": "box", "ysrc": "MarlaynaD:6:3567ba", "boxmean": true, "boxpoints": "all" }, { "meta": { "columnNames": { "y": "D" } }, "name": "Tumor", "type": "box", "ysrc": "MarlaynaD:6:9f39ab", "boxmean": true, "boxpoints": "all" } ], "frames": [], "layout": { "title": { "font": { "family": "Times New Roman" }, "text": "Firing Rate Comparison for Individuals with Varying Disease States" }, "xaxis": { "type": "category", "range": [ -0.5077220077220077, 1.5 ], "title": { "font": { "family": "Times New Roman" }, "text": "Disease State" }, "autorange": true }, "yaxis": { "type": "linear", "range": [ -8.416666666666668, 181.91666666666669 ], "title": { "font": { "family": "Times New Roman" }, "text": "Firing Rate (action potentials/sec)" }, "autorange": true }, "autosize": true, "template": { "data": { "bar": [ { "type": "bar", "marker": { "colorbar": { "ticks": "", "outlinewidth": 0 } } } ], "table": [ { "type": "table", "cells": { "fill": { "color": "#EBF0F8" }, "line": { "color": "white" } }, "header": { "fill": { "color": "#C8D4E3" }, "line": { "color": "white" } } } ], "carpet": [ { "type": "carpet", "aaxis": { "gridcolor": "#C8D4E3", "linecolor": "#C8D4E3", "endlinecolor": "#2a3f5f", "minorgridcolor": "#C8D4E3", "startlinecolor": "#2a3f5f" }, "baxis": { "gridcolor": "#C8D4E3", "linecolor": "#C8D4E3", "endlinecolor": "#2a3f5f", "minorgridcolor": "#C8D4E3", "startlinecolor": "#2a3f5f" } } ], "mesh3d": [ { "type": "mesh3d", "colorbar": { "ticks": "", "outlinewidth": 0 } } ], "contour": [ { "type": "contour", "colorbar": { "ticks": "", "outlinewidth": 0 }, "autocolorscale": true } ], "heatmap": [ { "type": "heatmap", "colorbar": { "ticks": "", "outlinewidth": 0 }, "autocolorscale": true } ], "scatter": [ { "type": "scatter", "marker": { "colorbar": { "ticks": "", "outlinewidth": 0 } } } ], "surface": [ { "type": "surface", "colorbar": { "ticks": "", "outlinewidth": 0 } } ], "heatmapgl": [ { "type": "heatmapgl", "colorbar": { "ticks": "", "outlinewidth": 0 } } ], "histogram": [ { "type": "histogram", "marker": { "colorbar": { "ticks": "", "outlinewidth": 0 } } } ], "parcoords": [ { "line": { "colorbar": { "ticks": "", "outlinewidth": 0 } }, "type": "parcoords" } ], "scatter3d": [ { "type": "scatter3d", "marker": { "colorbar": { "ticks": "", "outlinewidth": 0 } } } ], "scattergl": [ { "type": "scattergl", "marker": { "colorbar": { "ticks": "", "outlinewidth": 0 } } } ], "choropleth": [ { "type": "choropleth", "colorbar": { "ticks": "", "outlinewidth": 0 } } ], "scattergeo": [ { "type": "scattergeo", "marker": { "colorbar": { "ticks": "", "outlinewidth": 0 } } } ], "histogram2d": [ { "type": "histogram2d", "colorbar": { "ticks": "", "outlinewidth": 0 }, "autocolorscale": true } ], "scatterpolar": [ { "type": "scatterpolar", "marker": { "colorbar": { "ticks": "", "outlinewidth": 0 } } } ], "contourcarpet": [ { "type": "contourcarpet", "colorbar": { "ticks": "", "outlinewidth": 0 } } ], "scattercarpet": [ { "type": "scattercarpet", "marker": { "colorbar": { "ticks": "", "outlinewidth": 0 } } } ], "scattermapbox": [ { "type": "scattermapbox", "marker": { "colorbar": { "ticks": "", "outlinewidth": 0 } } } ], "scatterpolargl": [ { "type": "scatterpolargl", "marker": { "colorbar": { "ticks": "", "outlinewidth": 0 } } } ], "scatterternary": [ { "type": "scatterternary", "marker": { "colorbar": { "ticks": "", "outlinewidth": 0 } } } ], "histogram2dcontour": [ { "type": "histogram2dcontour", "colorbar": { "ticks": "", "outlinewidth": 0 }, "autocolorscale": true } ] }, "layout": { "geo": { "bgcolor": "white", "showland": true, "lakecolor": "white", "landcolor": "white", "showlakes": true, "subunitcolor": "#C8D4E3" }, "font": { "color": "#2a3f5f" }, "polar": { "bgcolor": "white", "radialaxis": { "ticks": "", "gridcolor": "#EBF0F8", "linecolor": "#EBF0F8" }, "angularaxis": { "ticks": "", "gridcolor": "#EBF0F8", "linecolor": "#EBF0F8" } }, "scene": { "xaxis": { "ticks": "", "gridcolor": "#DFE8F3", "gridwidth": 2, "linecolor": "#EBF0F8", "zerolinecolor": "#EBF0F8", "showbackground": true, "backgroundcolor": "white" }, "yaxis": { "ticks": "", "gridcolor": "#DFE8F3", "gridwidth": 2, "linecolor": "#EBF0F8", "zerolinecolor": "#EBF0F8", "showbackground": true, "backgroundcolor": "white" }, "zaxis": { "ticks": "", "gridcolor": "#DFE8F3", "gridwidth": 2, "linecolor": "#EBF0F8", "zerolinecolor": "#EBF0F8", "showbackground": true, "backgroundcolor": "white" } }, "title": { "x": 0.05 }, "xaxis": { "ticks": "", "gridcolor": "#EBF0F8", "linecolor": "#EBF0F8", "automargin": true, "zerolinecolor": "#EBF0F8", "zerolinewidth": 2 }, "yaxis": { "ticks": "", "gridcolor": "#EBF0F8", "linecolor": "#EBF0F8", "automargin": true, "zerolinecolor": "#EBF0F8", "zerolinewidth": 2 }, "ternary": { "aaxis": { "ticks": "", "gridcolor": "#DFE8F3", "linecolor": "#A2B1C6" }, "baxis": { "ticks": "", "gridcolor": "#DFE8F3", "linecolor": "#A2B1C6" }, "caxis": { "ticks": "", "gridcolor": "#DFE8F3", "linecolor": "#A2B1C6" }, "bgcolor": "white" }, "colorway": [ "#636efa", "#EF553B", "#00cc96", "#ab63fa", "#19d3f3", "#e763fa", "#fecb52", "#ffa15a", "#ff6692", "#b6e880" ], "hovermode": "closest", "colorscale": { "diverging": [ [ 0, "#8e0152" ], [ 0.1, "#c51b7d" ], [ 0.2, "#de77ae" ], [ 0.3, "#f1b6da" ], [ 0.4, "#fde0ef" ], [ 0.5, "#f7f7f7" ], [ 0.6, "#e6f5d0" ], [ 0.7, "#b8e186" ], [ 0.8, "#7fbc41" ], [ 0.9, "#4d9221" ], [ 1, "#276419" ] ], "sequential": [ [ 0, "#0508b8" ], [ 0.0893854748603352, "#1910d8" ], [ 0.1787709497206704, "#3c19f0" ], [ 0.2681564245810056, "#6b1cfb" ], [ 0.3575418994413408, "#981cfd" ], [ 0.44692737430167595, "#bf1cfd" ], [ 0.5363128491620112, "#dd2bfd" ], [ 0.6256983240223464, "#f246fe" ], [ 0.7150837988826816, "#fc67fd" ], [ 0.8044692737430168, "#fe88fc" ], [ 0.8938547486033519, "#fea5fd" ], [ 0.9832402234636871, "#febefe" ], [ 1, "#fec3fe" ] ], "sequentialminus": [ [ 0, "#0508b8" ], [ 0.0893854748603352, "#1910d8" ], [ 0.1787709497206704, "#3c19f0" ], [ 0.2681564245810056, "#6b1cfb" ], [ 0.3575418994413408, "#981cfd" ], [ 0.44692737430167595, "#bf1cfd" ], [ 0.5363128491620112, "#dd2bfd" ], [ 0.6256983240223464, "#f246fe" ], [ 0.7150837988826816, "#fc67fd" ], [ 0.8044692737430168, "#fe88fc" ], [ 0.8938547486033519, "#fea5fd" ], [ 0.9832402234636871, "#febefe" ], [ 1, "#fec3fe" ] ] }, "plot_bgcolor": "white", "paper_bgcolor": "white", "shapedefaults": { "line": { "width": 0 }, "opacity": 0.4, "fillcolor": "#506784" }, "annotationdefaults": { "arrowhead": 0, "arrowcolor": "#506784", "arrowwidth": 1 } }, "themeRef": "PLOTLY_WHITE" } } }, "height": null, "width": null, "user": { "profile_url": "https://chart-studio.plotly.com/~MarlaynaD", "avatar_url": "https://storage.googleapis.com/plotly-prod-profiles/6.jpg", "background_url": "https://storage.googleapis.com/plotly-prod-profiles/bg-8.jpg", "bio": "", "nickname": "", "website": "", "stream_tokens": null, "feature_set_id": null, "csrf_token": null, "date_joined": "2024-02-28 18:17:26", "mapbox_access_tokens": null, "has_password": null, "username": "MarlaynaD", "email": null, "is_active": null, "readonly": null, "is_dash_creator": null, "dash_created_count": null, "is_chart_creator": null, "charts_created_count": null } }, { "creation_time": "2024-04-30T00:53:29.937706Z", "comments": { "results": [], "count": 0 }, "parented": true, "embed_url": "https://chart-studio.plotly.com/~robertsm02/7.embed", "fid": "robertsm02:7", "filename": "fullperc", "filetype": "plot", "img_url": "https://storage.googleapis.com/plotly-prod-images/robertsm02/7/9_SZBX1OKQPN0F8EEV1W5DUWCCJFOQUI.png", "image_urls": { "default": "https://storage.googleapis.com/plotly-prod-images/robertsm02/7/2_DCXW5L3LO9QX0IDFWT3DFIN82UPCPL.png", "block-thumb": "https://storage.googleapis.com/plotly-prod-images/robertsm02/7/8_SFB8ONZ22X5BGERP64DBKWEX5GLZRE.png", "list-thumb": "https://storage.googleapis.com/plotly-prod-images/robertsm02/7/9_SZBX1OKQPN0F8EEV1W5DUWCCJFOQUI.png" }, "api_urls": { "files": "https://api.plotly.com/v2/files/robertsm02:7", "plots": "https://api.plotly.com/v2/plots/robertsm02:7", "parent": "https://api.plotly.com/v2/folders/home?user=robertsm02" }, "owner": "robertsm02", "parent": -1, "preview": "", "referencers": [], "references": [], "title": "", "views": 7, "web_url": "https://chart-studio.plotly.com/~robertsm02/7/", "world_readable": true, "date_modified": "2024-09-15T00:35:55.452Z", "stars": { "results": [], "count": 0 }, "collaborators": { "results": [], "count": 0 }, "subfolder_count": null, "refresh_interval": null, "organize_view_url": "https://chart-studio.plotly.com/~robertsm02/7/", "current_user_permission": "read", "is_theme": null, "is_template": null, "autosize": true, "caption": "", "figure": { "data": [ { "base": 0, "name": "bachelor", "text": "reorder(degree, avg_gradpercent): bachelor<br />avg_gradpercent: 46.05970<br />bachelor<br />degree: bachelor", "type": "bar", "xsrc": "robertsm02:6:760046", "ysrc": "robertsm02:6:aca644", "frame": null, "width": 0.9000000000000004, "xaxis": "x", "yaxis": "y", "marker": { "line": { "color": "transparent", "width": 1.8897637795275593 }, "color": "rgba(248,118,109,1)", "autocolorscale": false }, "hoverinfo": "text", "showlegend": true, "legendgroup": "bachelor", "orientation": "h", "textposition": "none" }, { "base": 0, "name": "masters", "text": "reorder(degree, avg_gradpercent): masters<br />avg_gradpercent: 44.45714<br />masters<br />degree: masters", "type": "bar", "xsrc": "robertsm02:6:0e187c", "ysrc": "robertsm02:6:c8137d", "frame": null, "width": 0.9000000000000001, "xaxis": "x", "yaxis": "y", "marker": { "line": { "color": "transparent", "width": 1.8897637795275593 }, "color": "rgba(124,174,0,1)", "autocolorscale": false }, "hoverinfo": "text", "showlegend": true, "legendgroup": "masters", "orientation": "h", "textposition": "none" }, { "base": 0, "name": "PhD", "text": "reorder(degree, avg_gradpercent): PhD<br />avg_gradpercent: 39.44444<br />PhD<br />degree: PhD", "type": "bar", "xsrc": "robertsm02:6:85b9af", "ysrc": "robertsm02:6:6cf469", "frame": null, "width": 0.8999999999999999, "xaxis": "x", "yaxis": "y", "marker": { "line": { "color": "transparent", "width": 1.8897637795275593 }, "color": "rgba(0,191,196,1)", "autocolorscale": false }, "hoverinfo": "text", "showlegend": true, "legendgroup": "PhD", "orientation": "h", "textposition": "none" }, { "base": 0, "name": "Professional", "text": "reorder(degree, avg_gradpercent): Professional<br />avg_gradpercent: 71.00000<br />Professional<br />degree: Professional", "type": "bar", "xsrc": "robertsm02:6:143ff5", "ysrc": "robertsm02:6:4fe67e", "frame": null, "width": 0.9000000000000004, "xaxis": "x", "yaxis": "y", "marker": { "line": { "color": "transparent", "width": 1.8897637795275593 }, "color": "rgba(199,124,255,1)", "autocolorscale": false }, "hoverinfo": "text", "showlegend": true, "legendgroup": "Professional", "orientation": "h", "textposition": "none" } ], "layout": { "font": { "size": 14.611872146118724, "color": "rgba(0,0,0,1)", "family": "" }, "title": { "x": 0, "font": { "size": 17.534246575342465, "color": "rgba(0,0,0,1)", "family": "" }, "text": "The Average Percent of Graduates Who Take Out Loans by Degree", "xref": "paper" }, "xaxis": { "type": "linear", "range": [ -3.5500000000000003, 74.55 ], "ticks": "outside", "title": { "font": { "size": 14.611872146118724, "color": "rgba(0,0,0,1)", "family": "" }, "text": "Average Graduate Loan Percentage" }, "anchor": "y", "domain": [ 0, 1 ], "nticks": null, "ticklen": 3.652968036529681, "showgrid": true, "showline": false, "tickfont": { "size": 11.68949771689498, "color": "rgba(77,77,77,1)", "family": "" }, "tickmode": "array", "ticktext": [ "0", "20", "40", "60" ], "tickvals": [ 0, 20, 39.99999999999999, 60 ], "zeroline": false, "autorange": false, "gridcolor": "rgba(255,255,255,1)", "gridwidth": 0.66417600664176, "linecolor": null, "linewidth": 0, "tickangle": 0, "tickcolor": "rgba(51,51,51,1)", "tickwidth": 0.66417600664176, "automargin": true, "hoverformat": ".2f", "categoryarray": [ "0", "20", "40", "60" ], "categoryorder": "array", "showticklabels": true }, "yaxis": { "type": "linear", "range": [ 0.4, 4.6 ], "ticks": "outside", "title": { "font": { "size": 14.611872146118724, "color": "rgba(0,0,0,1)", "family": "" }, "text": "Degree" }, "anchor": "x", "domain": [ 0, 1 ], "nticks": null, "ticklen": 3.652968036529681, "showgrid": true, "showline": false, "tickfont": { "size": 0, "color": null, "family": null }, "tickmode": "array", "ticktext": [ "PhD", "masters", "bachelor", "Professional" ], "tickvals": [ 1, 2, 3, 4 ], "zeroline": false, "autorange": false, "gridcolor": "rgba(255,255,255,1)", "gridwidth": 0.66417600664176, "linecolor": null, "linewidth": 0, "tickangle": 0, "tickcolor": "rgba(51,51,51,1)", "tickwidth": 0.66417600664176, "automargin": true, "hoverformat": ".2f", "categoryarray": [ "PhD", "masters", "bachelor", "Professional" ], "categoryorder": "array", "showticklabels": false }, "legend": { "font": { "size": 11.68949771689498, "color": "rgba(0,0,0,1)", "family": "" }, "title": { "font": { "size": 14.611872146118724, "color": "rgba(0,0,0,1)", "family": "" }, "text": "Degree" }, "bgcolor": "rgba(255,255,255,1)", "bordercolor": "transparent", "borderwidth": 1.8897637795275593 }, "margin": { "b": 40.1826484018265, "l": 25.570776255707766, "r": 7.305936073059362, "t": 43.76255707762557 }, "shapes": [ { "x0": 0, "x1": 1, "y0": 0, "y1": 1, "line": { "color": null, "width": 0, "linetype": [] }, "type": "rect", "xref": "paper", "yref": "paper", "fillcolor": null } ], "barmode": "relative", "hovermode": "closest", "showlegend": true, "plot_bgcolor": "rgba(235,235,235,1)", "paper_bgcolor": "rgba(255,255,255,1)" } }, "height": null, "width": null, "user": { "profile_url": "https://chart-studio.plotly.com/~robertsm02", "avatar_url": "https://storage.googleapis.com/plotly-prod-profiles/26.jpg", "background_url": "https://storage.googleapis.com/plotly-prod-profiles/bg-10.jpg", "bio": "", "nickname": "", "website": "", "stream_tokens": null, "feature_set_id": null, "csrf_token": null, "date_joined": "2024-04-29 22:53:15", "mapbox_access_tokens": null, "has_password": null, "username": "robertsm02", "email": null, "is_active": null, "readonly": null, "is_dash_creator": null, "dash_created_count": null, "is_chart_creator": null, "charts_created_count": null } }, { "creation_time": "2024-04-30T00:53:26.343055Z", "comments": { "results": [], "count": 0 }, "parented": true, "embed_url": "https://chart-studio.plotly.com/~robertsm02/5.embed", "fid": "robertsm02:5", "filename": "fullloan", "filetype": "plot", "img_url": "https://storage.googleapis.com/plotly-prod-images/robertsm02/5/9_7NXBD9JR6FIAR8D34TPLJNK7UX5PKV.png", "image_urls": { "default": "https://storage.googleapis.com/plotly-prod-images/robertsm02/5/2_LHAB870WSH1Q9GEOC4IKWHV4OTE3K4.png", "block-thumb": "https://storage.googleapis.com/plotly-prod-images/robertsm02/5/8_2C13XL4TLUNFJ3NW0PHAJIOMZG9QYG.png", "list-thumb": "https://storage.googleapis.com/plotly-prod-images/robertsm02/5/9_7NXBD9JR6FIAR8D34TPLJNK7UX5PKV.png" }, "api_urls": { "files": "https://api.plotly.com/v2/files/robertsm02:5", "plots": "https://api.plotly.com/v2/plots/robertsm02:5", "parent": "https://api.plotly.com/v2/folders/home?user=robertsm02" }, "owner": "robertsm02", "parent": -1, "preview": "", "referencers": [], "references": [], "title": "", "views": 9, "web_url": "https://chart-studio.plotly.com/~robertsm02/5/", "world_readable": true, "date_modified": "2024-09-15T00:35:51.342Z", "stars": { "results": [], "count": 0 }, "collaborators": { "results": [], "count": 0 }, "subfolder_count": null, "refresh_interval": null, "organize_view_url": "https://chart-studio.plotly.com/~robertsm02/5/", "current_user_permission": "read", "is_theme": null, "is_template": null, "autosize": true, "caption": "", "figure": { "data": [ { "base": 0, "name": "bachelor", "text": "reorder(degree, avg_gradloan): bachelor<br />avg_gradloan: 23349.57<br />bachelor<br />degree: bachelor", "type": "bar", "xsrc": "robertsm02:4:a4e267", "ysrc": "robertsm02:4:60c1bc", "frame": null, "width": 0.8999999999999999, "xaxis": "x", "yaxis": "y", "marker": { "line": { "color": "transparent", "width": 1.8897637795275593 }, "color": "rgba(248,118,109,1)", "autocolorscale": false }, "hoverinfo": "text", "showlegend": true, "legendgroup": "bachelor", "orientation": "h", "textposition": "none" }, { "base": 0, "name": "masters", "text": "reorder(degree, avg_gradloan): masters<br />avg_gradloan: 36618.66<br />masters<br />degree: masters", "type": "bar", "xsrc": "robertsm02:4:482792", "ysrc": "robertsm02:4:1095e9", "frame": null, "width": 0.9000000000000001, "xaxis": "x", "yaxis": "y", "marker": { "line": { "color": "transparent", "width": 1.8897637795275593 }, "color": "rgba(124,174,0,1)", "autocolorscale": false }, "hoverinfo": "text", "showlegend": true, "legendgroup": "masters", "orientation": "h", "textposition": "none" }, { "base": 0, "name": "PhD", "text": "reorder(degree, avg_gradloan): PhD<br />avg_gradloan: 50023.33<br />PhD<br />degree: PhD", "type": "bar", "xsrc": "robertsm02:4:ce28ba", "ysrc": "robertsm02:4:0c89b7", "frame": null, "width": 0.9000000000000004, "xaxis": "x", "yaxis": "y", "marker": { "line": { "color": "transparent", "width": 1.8897637795275593 }, "color": "rgba(0,191,196,1)", "autocolorscale": false }, "hoverinfo": "text", "showlegend": true, "legendgroup": "PhD", "orientation": "h", "textposition": "none" }, { "base": 0, "name": "Professional", "text": "reorder(degree, avg_gradloan): Professional<br />avg_gradloan: 75495.67<br />Professional<br />degree: Professional", "type": "bar", "xsrc": "robertsm02:4:8b790a", "ysrc": "robertsm02:4:dfbc1b", "frame": null, "width": 0.9000000000000004, "xaxis": "x", "yaxis": "y", "marker": { "line": { "color": "transparent", "width": 1.8897637795275593 }, "color": "rgba(199,124,255,1)", "autocolorscale": false }, "hoverinfo": "text", "showlegend": true, "legendgroup": "Professional", "orientation": "h", "textposition": "none" } ], "layout": { "font": { "size": 14.611872146118724, "color": "rgba(0,0,0,1)", "family": "" }, "title": { "x": 0, "font": { "size": 17.534246575342465, "color": "rgba(0,0,0,1)", "family": "" }, "text": "Average Graduate Loan Amount by Degree", "xref": "paper" }, "xaxis": { "type": "linear", "range": [ -3774.7833333333338, 79270.45000000001 ], "ticks": "outside", "title": { "font": { "size": 14.611872146118724, "color": "rgba(0,0,0,1)", "family": "" }, "text": "Average Graduate Loan Amount ($)" }, "anchor": "y", "domain": [ 0, 1 ], "nticks": null, "ticklen": 3.652968036529681, "showgrid": true, "showline": false, "tickfont": { "size": 11.68949771689498, "color": "rgba(77,77,77,1)", "family": "" }, "tickmode": "array", "ticktext": [ "0", "20000", "40000", "60000" ], "tickvals": [ 0, 20000, 40000, 60000 ], "zeroline": false, "autorange": false, "gridcolor": "rgba(255,255,255,1)", "gridwidth": 0.66417600664176, "linecolor": null, "linewidth": 0, "tickangle": 0, "tickcolor": "rgba(51,51,51,1)", "tickwidth": 0.66417600664176, "automargin": true, "hoverformat": ".2f", "categoryarray": [ "0", "20000", "40000", "60000" ], "categoryorder": "array", "showticklabels": true }, "yaxis": { "type": "linear", "range": [ 0.4, 4.6 ], "ticks": "outside", "title": { "font": { "size": 14.611872146118724, "color": "rgba(0,0,0,1)", "family": "" }, "text": "Degree" }, "anchor": "x", "domain": [ 0, 1 ], "nticks": null, "ticklen": 3.652968036529681, "showgrid": true, "showline": false, "tickfont": { "size": 0, "color": null, "family": null }, "tickmode": "array", "ticktext": [ "bachelor", "masters", "PhD", "Professional" ], "tickvals": [ 1, 2, 3, 4 ], "zeroline": false, "autorange": false, "gridcolor": "rgba(255,255,255,1)", "gridwidth": 0.66417600664176, "linecolor": null, "linewidth": 0, "tickangle": 0, "tickcolor": "rgba(51,51,51,1)", "tickwidth": 0.66417600664176, "automargin": true, "hoverformat": ".2f", "categoryarray": [ "bachelor", "masters", "PhD", "Professional" ], "categoryorder": "array", "showticklabels": false }, "legend": { "font": { "size": 11.68949771689498, "color": "rgba(0,0,0,1)", "family": "" }, "title": { "font": { "size": 14.611872146118724, "color": "rgba(0,0,0,1)", "family": "" }, "text": "Degree" }, "bgcolor": "rgba(255,255,255,1)", "bordercolor": "transparent", "borderwidth": 1.8897637795275593 }, "margin": { "b": 40.1826484018265, "l": 25.570776255707766, "r": 7.305936073059362, "t": 43.76255707762557 }, "shapes": [ { "x0": 0, "x1": 1, "y0": 0, "y1": 1, "line": { "color": null, "width": 0, "linetype": [] }, "type": "rect", "xref": "paper", "yref": "paper", "fillcolor": null } ], "barmode": "relative", "hovermode": "closest", "showlegend": true, "plot_bgcolor": "rgba(235,235,235,1)", "paper_bgcolor": "rgba(255,255,255,1)" } }, "height": null, "width": null, "user": { "profile_url": "https://chart-studio.plotly.com/~robertsm02", "avatar_url": "https://storage.googleapis.com/plotly-prod-profiles/26.jpg", "background_url": "https://storage.googleapis.com/plotly-prod-profiles/bg-10.jpg", "bio": "", "nickname": "", "website": "", "stream_tokens": null, "feature_set_id": null, "csrf_token": null, "date_joined": "2024-04-29 22:53:15", "mapbox_access_tokens": null, "has_password": null, "username": "robertsm02", "email": null, "is_active": null, "readonly": null, "is_dash_creator": null, "dash_created_count": null, "is_chart_creator": null, "charts_created_count": null } }, { "creation_time": "2024-04-30T00:51:29.834670Z", "comments": { "results": [], "count": 0 }, "parented": true, "embed_url": "https://chart-studio.plotly.com/~pregninett/8.embed", "fid": "pregninett:8", "filename": "Plot 8", "filetype": "plot", "img_url": "https://storage.googleapis.com/plotly-prod-images/pregninett/8/9_WVHZMOGZJNTU6A2MPGBLF8NKKPVKGX.png", "image_urls": { "default": "https://storage.googleapis.com/plotly-prod-images/pregninett/8/2_8LV8A5DJE4DAJ2TG3W1CDE1N7NH8FI.png", "block-thumb": "https://storage.googleapis.com/plotly-prod-images/pregninett/8/8_7Q0IZW5X29IQX2EVZI0SB84DVMQ3WR.png", "list-thumb": "https://storage.googleapis.com/plotly-prod-images/pregninett/8/9_WVHZMOGZJNTU6A2MPGBLF8NKKPVKGX.png" }, "api_urls": { "files": "https://api.plotly.com/v2/files/pregninett:8", "plots": "https://api.plotly.com/v2/plots/pregninett:8", "parent": "https://api.plotly.com/v2/folders/home?user=pregninett" }, "owner": "pregninett", "parent": -1, "preview": "", "referencers": [], "references": [], "title": "", "views": 1, "web_url": "https://chart-studio.plotly.com/~pregninett/8/", "world_readable": true, "date_modified": "2024-04-30T01:07:25.387Z", "stars": { "results": [], "count": 0 }, "collaborators": { "results": [], "count": 0 }, "subfolder_count": null, "refresh_interval": null, "organize_view_url": "https://chart-studio.plotly.com/~pregninett/8/", "current_user_permission": "read", "is_theme": null, "is_template": false, "autosize": true, "caption": "", "figure": { "data": [ { "uid": "18d51c", "meta": { "columnNames": { "x": "MTT össz", "y": "GAD össz" } }, "mode": "markers", "type": "scatter", "xsrc": "pregninett:7:ffcff2", "ysrc": "pregninett:7:706637", "marker": { "size": 6 }, "showlegend": false }, { "uid": "ab1de7", "name": "<br>", "opacity": 0.8, "showlegend": false, "transforms": [ { "rms": "", "type": "fit", "inputUid": "18d51c", "regressor": "x", "parameters": [ { "hold": false, "name": "m", "error": 0.024849667702174796, "value": -0.12268573352118117 }, { "hold": false, "name": "b", "error": 1.0138273483105227, "value": 7.315051926841332 } ], "regressand": "y", "correlation": "", "fitfunction": "m*x + b", "inputxrange": [], "outputxrange": [], "interpolation": 50 } ] } ], "frames": [], "layout": { "font": { "size": 16, "color": "rgb(0, 0, 0)" }, "title": { "text": "3. Ábra, Társas támogatás és szorongás kapcsolata" }, "xaxis": { "type": "linear", "range": [ 7.634297520661157, 52.36570247933884 ], "title": { "text": "Multidimenzionális Észlelt Társas Támogatás pontszámai" }, "autorange": true }, "yaxis": { "type": "linear", "range": [ -0.3900423494153708, 6.429154430631883 ], "title": { "text": "Generalized Anxiety Disease-2 pontszámai" }, "autorange": true }, "autosize": true, "template": { "data": { "bar": [ { "type": "bar", "marker": { "colorbar": { "ticks": "", "outlinewidth": 0 } } } ], "table": [ { "type": "table", "cells": { "fill": { "color": "#EBF0F8" }, "line": { "color": "white" } }, "header": { "fill": { "color": "#C8D4E3" }, "line": { "color": "white" } } } ], "carpet": [ { "type": "carpet", "aaxis": { "gridcolor": "#C8D4E3", "linecolor": "#C8D4E3", "endlinecolor": "#2a3f5f", "minorgridcolor": "#C8D4E3", "startlinecolor": "#2a3f5f" }, "baxis": { "gridcolor": "#C8D4E3", "linecolor": "#C8D4E3", "endlinecolor": "#2a3f5f", "minorgridcolor": "#C8D4E3", "startlinecolor": "#2a3f5f" } } ], "mesh3d": [ { "type": "mesh3d", "colorbar": { "ticks": "", "outlinewidth": 0 } } ], "contour": [ { "type": "contour", "colorbar": { "ticks": "", "outlinewidth": 0 }, "autocolorscale": true } ], "heatmap": [ { "type": "heatmap", "colorbar": { "ticks": "", "outlinewidth": 0 }, "autocolorscale": true } ], "scatter": [ { "type": "scatter", "marker": { "colorbar": { "ticks": "", "outlinewidth": 0 } } } ], "surface": [ { "type": "surface", "colorbar": { "ticks": "", "outlinewidth": 0 } } ], "heatmapgl": [ { "type": "heatmapgl", "colorbar": { "ticks": "", "outlinewidth": 0 } } ], "histogram": [ { "type": "histogram", "marker": { "colorbar": { "ticks": "", "outlinewidth": 0 } } } ], "parcoords": [ { "line": { "colorbar": { "ticks": "", "outlinewidth": 0 } }, "type": "parcoords" } ], "scatter3d": [ { "type": "scatter3d", "marker": { "colorbar": { "ticks": "", "outlinewidth": 0 } } } ], "scattergl": [ { "type": "scattergl", "marker": { "colorbar": { "ticks": "", "outlinewidth": 0 } } } ], "choropleth": [ { "type": "choropleth", "colorbar": { "ticks": "", "outlinewidth": 0 } } ], "scattergeo": [ { "type": "scattergeo", "marker": { "colorbar": { "ticks": "", "outlinewidth": 0 } } } ], "histogram2d": [ { "type": "histogram2d", "colorbar": { "ticks": "", "outlinewidth": 0 }, "autocolorscale": true } ], "scatterpolar": [ { "type": "scatterpolar", "marker": { "colorbar": { "ticks": "", "outlinewidth": 0 } } } ], "contourcarpet": [ { "type": "contourcarpet", "colorbar": { "ticks": "", "outlinewidth": 0 } } ], "scattercarpet": [ { "type": "scattercarpet", "marker": { "colorbar": { "ticks": "", "outlinewidth": 0 } } } ], "scattermapbox": [ { "type": "scattermapbox", "marker": { "colorbar": { "ticks": "", "outlinewidth": 0 } } } ], "scatterpolargl": [ { "type": "scatterpolargl", "marker": { "colorbar": { "ticks": "", "outlinewidth": 0 } } } ], "scatterternary": [ { "type": "scatterternary", "marker": { "colorbar": { "ticks": "", "outlinewidth": 0 } } } ], "histogram2dcontour": [ { "type": "histogram2dcontour", "colorbar": { "ticks": "", "outlinewidth": 0 }, "autocolorscale": true } ] }, "layout": { "geo": { "bgcolor": "white", "showland": true, "lakecolor": "white", "landcolor": "white", "showlakes": true, "subunitcolor": "#C8D4E3" }, "font": { "color": "#2a3f5f" }, "polar": { "bgcolor": "white", "radialaxis": { "ticks": "", "gridcolor": "#EBF0F8", "linecolor": "#EBF0F8" }, "angularaxis": { "ticks": "", "gridcolor": "#EBF0F8", "linecolor": "#EBF0F8" } }, "scene": { "xaxis": { "ticks": "", "gridcolor": "#DFE8F3", "gridwidth": 2, "linecolor": "#EBF0F8", "zerolinecolor": "#EBF0F8", "showbackground": true, "backgroundcolor": "white" }, "yaxis": { "ticks": "", "gridcolor": "#DFE8F3", "gridwidth": 2, "linecolor": "#EBF0F8", "zerolinecolor": "#EBF0F8", "showbackground": true, "backgroundcolor": "white" }, "zaxis": { "ticks": "", "gridcolor": "#DFE8F3", "gridwidth": 2, "linecolor": "#EBF0F8", "zerolinecolor": "#EBF0F8", "showbackground": true, "backgroundcolor": "white" } }, "title": { "x": 0.05 }, "xaxis": { "ticks": "", "gridcolor": "#EBF0F8", "linecolor": "#EBF0F8", "automargin": true, "zerolinecolor": "#EBF0F8", "zerolinewidth": 2 }, "yaxis": { "ticks": "", "gridcolor": "#EBF0F8", "linecolor": "#EBF0F8", "automargin": true, "zerolinecolor": "#EBF0F8", "zerolinewidth": 2 }, "ternary": { "aaxis": { "ticks": "", "gridcolor": "#DFE8F3", "linecolor": "#A2B1C6" }, "baxis": { "ticks": "", "gridcolor": "#DFE8F3", "linecolor": "#A2B1C6" }, "caxis": { "ticks": "", "gridcolor": "#DFE8F3", "linecolor": "#A2B1C6" }, "bgcolor": "white" }, "colorway": [ "#636efa", "#EF553B", "#00cc96", "#ab63fa", "#19d3f3", "#e763fa", "#fecb52", "#ffa15a", "#ff6692", "#b6e880" ], "hovermode": "closest", "colorscale": { "diverging": [ [ 0, "#8e0152" ], [ 0.1, "#c51b7d" ], [ 0.2, "#de77ae" ], [ 0.3, "#f1b6da" ], [ 0.4, "#fde0ef" ], [ 0.5, "#f7f7f7" ], [ 0.6, "#e6f5d0" ], [ 0.7, "#b8e186" ], [ 0.8, "#7fbc41" ], [ 0.9, "#4d9221" ], [ 1, "#276419" ] ], "sequential": [ [ 0, "#0508b8" ], [ 0.0893854748603352, "#1910d8" ], [ 0.1787709497206704, "#3c19f0" ], [ 0.2681564245810056, "#6b1cfb" ], [ 0.3575418994413408, "#981cfd" ], [ 0.44692737430167595, "#bf1cfd" ], [ 0.5363128491620112, "#dd2bfd" ], [ 0.6256983240223464, "#f246fe" ], [ 0.7150837988826816, "#fc67fd" ], [ 0.8044692737430168, "#fe88fc" ], [ 0.8938547486033519, "#fea5fd" ], [ 0.9832402234636871, "#febefe" ], [ 1, "#fec3fe" ] ], "sequentialminus": [ [ 0, "#0508b8" ], [ 0.0893854748603352, "#1910d8" ], [ 0.1787709497206704, "#3c19f0" ], [ 0.2681564245810056, "#6b1cfb" ], [ 0.3575418994413408, "#981cfd" ], [ 0.44692737430167595, "#bf1cfd" ], [ 0.5363128491620112, "#dd2bfd" ], [ 0.6256983240223464, "#f246fe" ], [ 0.7150837988826816, "#fc67fd" ], [ 0.8044692737430168, "#fe88fc" ], [ 0.8938547486033519, "#fea5fd" ], [ 0.9832402234636871, "#febefe" ], [ 1, "#fec3fe" ] ] }, "plot_bgcolor": "white", "paper_bgcolor": "white", "shapedefaults": { "line": { "width": 0 }, "opacity": 0.4, "fillcolor": "#506784" }, "annotationdefaults": { "arrowhead": 0, "arrowcolor": "#506784", "arrowwidth": 1 } }, "themeRef": "PLOTLY_WHITE" } } }, "height": null, "width": null, "user": { "profile_url": "https://chart-studio.plotly.com/~pregninett", "avatar_url": "https://storage.googleapis.com/plotly-prod-profiles/21.jpg", "background_url": "https://storage.googleapis.com/plotly-prod-profiles/bg-11.jpg", "bio": "", "nickname": "", "website": "", "stream_tokens": null, "feature_set_id": null, "csrf_token": null, "date_joined": "2022-05-06 21:19:56", "mapbox_access_tokens": null, "has_password": null, "username": "pregninett", "email": null, "is_active": null, "readonly": null, "is_dash_creator": null, "dash_created_count": null, "is_chart_creator": null, "charts_created_count": null } }, { "creation_time": "2024-04-30T00:36:12.081061Z", "comments": { "results": [], "count": 0 }, "parented": true, "embed_url": "https://chart-studio.plotly.com/~pregninett/6.embed", "fid": "pregninett:6", "filename": "Plot 6", "filetype": "plot", "img_url": "https://storage.googleapis.com/plotly-prod-images/pregninett/6/9_ZSBKELQRMM8XGD1AMSKJ5VS1MUJ99M.png", "image_urls": { "default": "https://storage.googleapis.com/plotly-prod-images/pregninett/6/2_7N17O1NFP0M9TGJQ0JLHB5GCVCX7IU.png", "block-thumb": "https://storage.googleapis.com/plotly-prod-images/pregninett/6/8_DKI4ZBFJIEX9ZSH7IQYU2UYO434DOB.png", "list-thumb": "https://storage.googleapis.com/plotly-prod-images/pregninett/6/9_ZSBKELQRMM8XGD1AMSKJ5VS1MUJ99M.png" }, "api_urls": { "files": "https://api.plotly.com/v2/files/pregninett:6", "plots": "https://api.plotly.com/v2/plots/pregninett:6", "parent": "https://api.plotly.com/v2/folders/home?user=pregninett" }, "owner": "pregninett", "parent": -1, "preview": "", "referencers": [], "references": [], "title": "", "views": 2, "web_url": "https://chart-studio.plotly.com/~pregninett/6/", "world_readable": true, "date_modified": "2024-04-30T01:08:52.445Z", "stars": { "results": [], "count": 0 }, "collaborators": { "results": [], "count": 0 }, "subfolder_count": null, "refresh_interval": null, "organize_view_url": "https://chart-studio.plotly.com/~pregninett/6/", "current_user_permission": "read", "is_theme": null, "is_template": false, "autosize": true, "caption": "", "figure": { "data": [ { "uid": "285a4d", "meta": { "columnNames": { "x": "SHAI össz", "y": "DLQI össz" } }, "mode": "markers", "type": "scatter", "xsrc": "pregninett:5:ad2802", "ysrc": "pregninett:5:bc301b", "marker": { "opacity": 1 }, "opacity": 1, "showlegend": false }, { "uid": "75d0d7", "opacity": 0.8, "showlegend": false, "transforms": [ { "rms": "", "type": "fit", "inputUid": "285a4d", "regressor": "x", "parameters": [ { "hold": false, "name": "m", "error": 0.07113962166516997, "value": 0.406181713628542 }, { "hold": false, "name": "b", "error": 2.8710735653309465, "value": -9.210889879241714 } ], "regressand": "y", "correlation": "", "fitfunction": "m*x + b", "inputxrange": [], "outputxrange": [], "interpolation": 50 } ] } ], "frames": [], "layout": { "font": { "size": 16, "color": "rgb(0, 0, 0)", "family": "Times New Roman" }, "title": { "text": "2. Ábra, Bőrgyógyászati értelemben vett életminőség és egészségszorongás kapcsolata" }, "xaxis": { "side": "bottom", "type": "linear", "range": [ 17.10201446280992, 71.89798553719008 ], "ticks": "", "title": { "font": { "size": 18 }, "text": "Rövidített Egészségszorongás Kérdőív pontszámok" }, "showgrid": true, "showline": false, "tickfont": { "size": 12 }, "autorange": true, "gridcolor": "rgb(235, 239, 248)", "automargin": true }, "yaxis": { "type": "linear", "range": [ -2.6602385337992764, 28.799420008768767 ], "title": { "font": { "size": 18 }, "text": "Bőrgyógyászati Életminőség Index pontszámok" }, "autorange": true }, "autosize": true, "template": { "data": { "bar": [ { "type": "bar", "marker": { "colorbar": { "ticks": "", "outlinewidth": 0 } } } ], "table": [ { "type": "table", "cells": { "fill": { "color": "#EBF0F8" }, "line": { "color": "white" } }, "header": { "fill": { "color": "#C8D4E3" }, "line": { "color": "white" } } } ], "carpet": [ { "type": "carpet", "aaxis": { "gridcolor": "#C8D4E3", "linecolor": "#C8D4E3", "endlinecolor": "#2a3f5f", "minorgridcolor": "#C8D4E3", "startlinecolor": "#2a3f5f" }, "baxis": { "gridcolor": "#C8D4E3", "linecolor": "#C8D4E3", "endlinecolor": "#2a3f5f", "minorgridcolor": "#C8D4E3", "startlinecolor": "#2a3f5f" } } ], "mesh3d": [ { "type": "mesh3d", "colorbar": { "ticks": "", "outlinewidth": 0 } } ], "contour": [ { "type": "contour", "colorbar": { "ticks": "", "outlinewidth": 0 }, "autocolorscale": true } ], "heatmap": [ { "type": "heatmap", "colorbar": { "ticks": "", "outlinewidth": 0 }, "autocolorscale": true } ], "scatter": [ { "type": "scatter", "marker": { "colorbar": { "ticks": "", "outlinewidth": 0 } } } ], "surface": [ { "type": "surface", "colorbar": { "ticks": "", "outlinewidth": 0 } } ], "heatmapgl": [ { "type": "heatmapgl", "colorbar": { "ticks": "", "outlinewidth": 0 } } ], "histogram": [ { "type": "histogram", "marker": { "colorbar": { "ticks": "", "outlinewidth": 0 } } } ], "parcoords": [ { "line": { "colorbar": { "ticks": "", "outlinewidth": 0 } }, "type": "parcoords" } ], "scatter3d": [ { "type": "scatter3d", "marker": { "colorbar": { "ticks": "", "outlinewidth": 0 } } } ], "scattergl": [ { "type": "scattergl", "marker": { "colorbar": { "ticks": "", "outlinewidth": 0 } } } ], "choropleth": [ { "type": "choropleth", "colorbar": { "ticks": "", "outlinewidth": 0 } } ], "scattergeo": [ { "type": "scattergeo", "marker": { "colorbar": { "ticks": "", "outlinewidth": 0 } } } ], "histogram2d": [ { "type": "histogram2d", "colorbar": { "ticks": "", "outlinewidth": 0 }, "autocolorscale": true } ], "scatterpolar": [ { "type": "scatterpolar", "marker": { "colorbar": { "ticks": "", "outlinewidth": 0 } } } ], "contourcarpet": [ { "type": "contourcarpet", "colorbar": { "ticks": "", "outlinewidth": 0 } } ], "scattercarpet": [ { "type": "scattercarpet", "marker": { "colorbar": { "ticks": "", "outlinewidth": 0 } } } ], "scattermapbox": [ { "type": "scattermapbox", "marker": { "colorbar": { "ticks": "", "outlinewidth": 0 } } } ], "scatterpolargl": [ { "type": "scatterpolargl", "marker": { "colorbar": { "ticks": "", "outlinewidth": 0 } } } ], "scatterternary": [ { "type": "scatterternary", "marker": { "colorbar": { "ticks": "", "outlinewidth": 0 } } } ], "histogram2dcontour": [ { "type": "histogram2dcontour", "colorbar": { "ticks": "", "outlinewidth": 0 }, "autocolorscale": true } ] }, "layout": { "geo": { "bgcolor": "white", "showland": true, "lakecolor": "white", "landcolor": "white", "showlakes": true, "subunitcolor": "#C8D4E3" }, "font": { "color": "#2a3f5f" }, "polar": { "bgcolor": "white", "radialaxis": { "ticks": "", "gridcolor": "#EBF0F8", "linecolor": "#EBF0F8" }, "angularaxis": { "ticks": "", "gridcolor": "#EBF0F8", "linecolor": "#EBF0F8" } }, "scene": { "xaxis": { "ticks": "", "gridcolor": "#DFE8F3", "gridwidth": 2, "linecolor": "#EBF0F8", "zerolinecolor": "#EBF0F8", "showbackground": true, "backgroundcolor": "white" }, "yaxis": { "ticks": "", "gridcolor": "#DFE8F3", "gridwidth": 2, "linecolor": "#EBF0F8", "zerolinecolor": "#EBF0F8", "showbackground": true, "backgroundcolor": "white" }, "zaxis": { "ticks": "", "gridcolor": "#DFE8F3", "gridwidth": 2, "linecolor": "#EBF0F8", "zerolinecolor": "#EBF0F8", "showbackground": true, "backgroundcolor": "white" } }, "title": { "x": 0.05 }, "xaxis": { "ticks": "", "gridcolor": "#EBF0F8", "linecolor": "#EBF0F8", "automargin": true, "zerolinecolor": "#EBF0F8", "zerolinewidth": 2 }, "yaxis": { "ticks": "", "gridcolor": "#EBF0F8", "linecolor": "#EBF0F8", "automargin": true, "zerolinecolor": "#EBF0F8", "zerolinewidth": 2 }, "ternary": { "aaxis": { "ticks": "", "gridcolor": "#DFE8F3", "linecolor": "#A2B1C6" }, "baxis": { "ticks": "", "gridcolor": "#DFE8F3", "linecolor": "#A2B1C6" }, "caxis": { "ticks": "", "gridcolor": "#DFE8F3", "linecolor": "#A2B1C6" }, "bgcolor": "white" }, "colorway": [ "#636efa", "#EF553B", "#00cc96", "#ab63fa", "#19d3f3", "#e763fa", "#fecb52", "#ffa15a", "#ff6692", "#b6e880" ], "hovermode": "closest", "colorscale": { "diverging": [ [ 0, "#8e0152" ], [ 0.1, "#c51b7d" ], [ 0.2, "#de77ae" ], [ 0.3, "#f1b6da" ], [ 0.4, "#fde0ef" ], [ 0.5, "#f7f7f7" ], [ 0.6, "#e6f5d0" ], [ 0.7, "#b8e186" ], [ 0.8, "#7fbc41" ], [ 0.9, "#4d9221" ], [ 1, "#276419" ] ], "sequential": [ [ 0, "#0508b8" ], [ 0.0893854748603352, "#1910d8" ], [ 0.1787709497206704, "#3c19f0" ], [ 0.2681564245810056, "#6b1cfb" ], [ 0.3575418994413408, "#981cfd" ], [ 0.44692737430167595, "#bf1cfd" ], [ 0.5363128491620112, "#dd2bfd" ], [ 0.6256983240223464, "#f246fe" ], [ 0.7150837988826816, "#fc67fd" ], [ 0.8044692737430168, "#fe88fc" ], [ 0.8938547486033519, "#fea5fd" ], [ 0.9832402234636871, "#febefe" ], [ 1, "#fec3fe" ] ], "sequentialminus": [ [ 0, "#0508b8" ], [ 0.0893854748603352, "#1910d8" ], [ 0.1787709497206704, "#3c19f0" ], [ 0.2681564245810056, "#6b1cfb" ], [ 0.3575418994413408, "#981cfd" ], [ 0.44692737430167595, "#bf1cfd" ], [ 0.5363128491620112, "#dd2bfd" ], [ 0.6256983240223464, "#f246fe" ], [ 0.7150837988826816, "#fc67fd" ], [ 0.8044692737430168, "#fe88fc" ], [ 0.8938547486033519, "#fea5fd" ], [ 0.9832402234636871, "#febefe" ], [ 1, "#fec3fe" ] ] }, "plot_bgcolor": "white", "paper_bgcolor": "white", "shapedefaults": { "line": { "width": 0 }, "opacity": 0.4, "fillcolor": "#506784" }, "annotationdefaults": { "arrowhead": 0, "arrowcolor": "#506784", "arrowwidth": 1 } }, "themeRef": "PLOTLY_WHITE" } } }, "height": null, "width": null, "user": { "profile_url": "https://chart-studio.plotly.com/~pregninett", "avatar_url": "https://storage.googleapis.com/plotly-prod-profiles/21.jpg", "background_url": "https://storage.googleapis.com/plotly-prod-profiles/bg-11.jpg", "bio": "", "nickname": "", "website": "", "stream_tokens": null, "feature_set_id": null, "csrf_token": null, "date_joined": "2022-05-06 21:19:56", "mapbox_access_tokens": null, "has_password": null, "username": "pregninett", "email": null, "is_active": null, "readonly": null, "is_dash_creator": null, "dash_created_count": null, "is_chart_creator": null, "charts_created_count": null } }, { "creation_time": "2024-04-30T00:35:12.293390Z", "comments": { "results": [], "count": 0 }, "parented": true, "embed_url": "https://chart-studio.plotly.com/~UiaraMota/2.embed", "fid": "UiaraMota:2", "filename": "Empresa x S.A", "filetype": "plot", "img_url": "https://storage.googleapis.com/plotly-prod-images/UiaraMota/2/9_NHMBN8071TB1T895R211SOARC0LA2N.png", "image_urls": { "default": "https://storage.googleapis.com/plotly-prod-images/UiaraMota/2/2_JGA6JQUWB63T9MUC1IPSXJNW9NKEW4.png", "block-thumb": "https://storage.googleapis.com/plotly-prod-images/UiaraMota/2/8_IUO96Y5JJRU0OFDVZI8FSFPCQ7RYDD.png", "list-thumb": "https://storage.googleapis.com/plotly-prod-images/UiaraMota/2/9_NHMBN8071TB1T895R211SOARC0LA2N.png" }, "api_urls": { "files": "https://api.plotly.com/v2/files/UiaraMota:2", "plots": "https://api.plotly.com/v2/plots/UiaraMota:2", "parent": "https://api.plotly.com/v2/folders/home?user=UiaraMota" }, "owner": "UiaraMota", "parent": -1, "preview": "", "referencers": [], "references": [], "title": "", "views": 1, "web_url": "https://chart-studio.plotly.com/~UiaraMota/2/", "world_readable": true, "date_modified": "2024-04-30T00:42:37.819Z", "stars": { "results": [], "count": 0 }, "collaborators": { "results": [], "count": 0 }, "subfolder_count": null, "refresh_interval": null, "organize_view_url": "https://chart-studio.plotly.com/~UiaraMota/2/", "current_user_permission": "read", "is_theme": null, "is_template": true, "autosize": true, "caption": "", "figure": { "data": [ { "uid": "723fe8", "line": { "color": "rgb(14, 22, 255)" }, "meta": { "columnNames": { "x": "Ano", "y": "Ativo Total" } }, "mode": "lines", "name": "Ativo Total", "type": "scatter", "xsrc": "UiaraMota:1:47fec2", "ysrc": "UiaraMota:1:b93c2f", "marker": { "color": "rgb(255, 127, 14)", "sizeref": 0.028149617325, "sizemode": "area" }, "visible": true, "hoverinfo": "x+y" }, { "line": { "color": "rgb(14, 251, 255)" }, "meta": { "columnNames": { "x": "Ano", "y": "Ativo Circulante" } }, "mode": "lines", "name": "Ativo circulante", "type": "scatter", "xsrc": "UiaraMota:1:47fec2", "ysrc": "UiaraMota:1:c3a713", "visible": true, "hoverinfo": "x+y", "stackgroup": null, "connectgaps": false }, { "line": { "color": "rgb(44, 160, 135)" }, "meta": { "columnNames": { "x": "Ano", "y": "Ativo Não Circulante" } }, "mode": "lines", "name": "Ativo não circulante", "type": "scatter", "xsrc": "UiaraMota:1:47fec2", "ysrc": "UiaraMota:1:bc2e1c", "visible": true, "hoverinfo": "x+y" } ], "frames": [], "layout": { "title": { "font": { "size": 27, "family": "Times New Roman" }, "text": "Empresa X S.A" }, "xaxis": { "type": "linear", "range": [ 2001, 2021 ], "title": { "text": "Exercício" }, "autorange": true }, "yaxis": { "range": [ -786481.7222222221, 18878932.722222224 ], "title": { "text": "Total" }, "autorange": true }, "bargap": 0.38, "legend": { "font": { "family": "Arial" }, "valign": "middle" }, "autosize": true, "hovermode": "closest", "uniformtext": { "mode": false } } }, "height": null, "width": null, "user": { "profile_url": "https://chart-studio.plotly.com/~UiaraMota", "avatar_url": "https://storage.googleapis.com/plotly-prod-profiles/43.jpg", "background_url": "https://storage.googleapis.com/plotly-prod-profiles/bg-9.jpg", "bio": "", "nickname": "", "website": "", "stream_tokens": null, "feature_set_id": null, "csrf_token": null, "date_joined": "2024-04-29 23:38:14", "mapbox_access_tokens": null, "has_password": null, "username": "UiaraMota", "email": null, "is_active": null, "readonly": null, "is_dash_creator": null, "dash_created_count": null, "is_chart_creator": null, "charts_created_count": null } } ] }
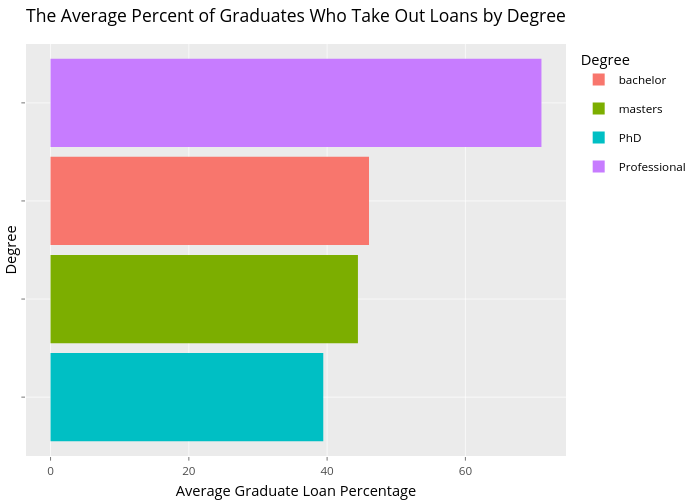