Plots List
Plots
This endpoint handles manipulation of Plotly plot files.
Reference
Authorization
Any user with or without a Plotly account may view public plots. For private plots, see authentication.
Actions
list
Listing all public plots can be done via a GET request to this endpoint.
By default, plots will be listed in order of date created. The order_by
query parameter is accepted at this endpoint. Currently, only ordering by
views is supported. It is possible to filter the plots by quality
with min_quality or max_quality as query parameter.
Example:
// GET https://api.plotly.com/v2/plots/ ---> 200

// GET https://api.plotly.com/v2/plots/?order_by=-views ---> 200

// GET https://api.plotly.com/v2/plots/?min_quality=5 ---> 200

// GET https://api.plotly.com/v2/plots/?max_quality=5 ---> 200
feed
Listing all handpicked feed plots can be done via a GET request to this endpoint. By default, plots will be listed in a random order.
Example:
// GET https://api.plotly.com/v2/plots/feed ---> 200
create
You can create new plot resources here. The only required field is 'figure'. Currently, the figure is restricted to only contain references to grid data. That is, this will fail if raw data arrays are passed in. To create and manipulate underlying grids for plots, see the grids endpoint.
Example:
// This fails because a figure field is required.
// POST https://api.plotly.com/v2/plots ---> 400 Bad Request
{}

// This fails because the figure has raw data
//POST https://api.plotly.com/v2/plots ---> 400 Bad Request
{
    "figure": {"data": [{"y": ['this', 'is', 'raw', 'data']}]}
}

// This succeeds because the figure has src keys, not raw data.
//POST https://api.plotly.com/v2/plots ---> 200 OK
{
    "figure": {"data": [{"ysrc": "sven:88:u8nd62"}]}
}
When creating a grid, you can optionally specify a source_fid to specify where a plot has come from:
- source_fid: the fid of a plot that was copied (and presumably edited) to produce this one
detail
There is a lot of meta information stored about plot files including filename, title, share_url, and content_url to name a few.
This information can only be reached with a GET to this endpoint.
Example:
// GET https://api.plotly.com/v2/plots/iheartgraphs:90
content
The contents of a plot can be downloaded via the content resource. The plot
content contains referenced grid/column data by default. If you wish to
return the raw grid/column data, the inline_data=true query must be included
in the request url. The Content-Type header will be appropriately set for the
response body.
Alternatively, you can set ?map_data=unreadable to append a mapping of
sources to data that belongs to grids which are unreadable for the
requestor. This is useful when you have read access to another users plot,
but that plot contains grid references which you don't have access to.
Examples:
// Returns referenced grid/column data
// GET https://api.plotly.com/v2/plots/iheartgraphs:90/content ---> 200 OK

// Returns full grid/column data
// GET https://api.plotly.com/v2/plots/iheartgraphs:90/content?inline_data=true ---> 200 OK

// Returns full grid/column data when requestor doesn't have permission
// to read the referenced grid.
// GET https://api.plotly.com/v2/plots/iheartgraphs:90/content?map_data=unreadable ---> 200 OK
GET /v2/plots/?cursor=cj0xJnA9MjAyNC0wNC0yMysxMyUzQTUwJTNBMzguODI4MjMxJTJCMDAlM0EwMA%3D%3D&format=api
{ "next": "https://api.plot.ly/v2/plots/?cursor=cD0yMDI0LTA0LTIzKzEzJTNBNTMlM0E0OC43OTk0ODElMkIwMCUzQTAw&format=api", "previous": "https://api.plot.ly/v2/plots/?cursor=cj0xJnA9MjAyNC0wNC0yMysxNSUzQTA3JTNBNDUuNTUzNjcwJTJCMDAlM0EwMA%3D%3D&format=api", "results": [ { "creation_time": "2024-04-23T15:07:45.553670Z", "comments": { "results": [], "count": 0 }, "parented": true, "embed_url": "https://chart-studio.plotly.com/~tlacroix/177.embed", "fid": "tlacroix:177", "filename": "FINAL - Total AutPhi Corpus Search Graph", "filetype": "plot", "img_url": "https://storage.googleapis.com/plotly-prod-images/tlacroix/177/9_AC49MUDEJ4LE4S61QWB06TVNTVQZMI.png", "image_urls": { "default": "https://storage.googleapis.com/plotly-prod-images/tlacroix/177/2_H8UY5GB15CPBUZC24IP3I7F7JQ8CAU.png", "block-thumb": "https://storage.googleapis.com/plotly-prod-images/tlacroix/177/8_39F0ST2I6ILW0UQT3Q9PSATGNJKLG2.png", "list-thumb": "https://storage.googleapis.com/plotly-prod-images/tlacroix/177/9_AC49MUDEJ4LE4S61QWB06TVNTVQZMI.png" }, "api_urls": { "files": "https://api.plotly.com/v2/files/tlacroix:177", "plots": "https://api.plotly.com/v2/plots/tlacroix:177", "parent": "https://api.plotly.com/v2/folders/home?user=tlacroix" }, "owner": "tlacroix", "parent": -1, "preview": "", "referencers": [], "references": [], "title": "", "views": 5, "web_url": "https://chart-studio.plotly.com/~tlacroix/177/", "world_readable": true, "date_modified": "2024-04-23T15:19:23.555Z", "stars": { "results": [], "count": 0 }, "collaborators": { "results": [], "count": 0 }, "subfolder_count": null, "refresh_interval": null, "organize_view_url": "https://chart-studio.plotly.com/~tlacroix/177/", "current_user_permission": "read", "is_theme": null, "is_template": false, "autosize": true, "caption": "", "figure": { "data": [ { "meta": { "columnNames": { "x": "Journal", "y": "Total Hits" } }, "mode": "markers", "name": "Search Results", "type": "bar", "xsrc": "tlacroix:176:bbce51", "ysrc": "tlacroix:176:244125", "marker": { "color": "rgb(99, 110, 250)" }, "opacity": 0.85, "orientation": "v" }, { "line": { "dash": "dot", "color": "rgb(0, 0, 0)" }, "meta": { "columnNames": { "x": "Journal", "y": "Average Result" } }, "mode": "lines", "name": "Average Hits", "type": "scatter", "xsrc": "tlacroix:176:bbce51", "ysrc": "tlacroix:176:a85d0d", "orientation": "v" } ], "frames": [], "layout": { "font": { "size": 24 }, "title": { "text": "Corpus Results (Search)" }, "xaxis": { "type": "category", "range": [ -0.5, 59.5 ], "title": { "text": "Journal" }, "tickfont": { "size": 8 }, "autorange": true, "tickangle": 45 }, "yaxis": { "type": "linear", "range": [ 0, 184.21052631578948 ], "title": { "text": "Number of Articles" }, "autorange": true }, "legend": { "x": 0.7310778195985208, "y": 0.8663217158333604 }, "barmode": "stack", "autosize": true, "template": { "data": { "bar": [ { "type": "bar", "marker": { "colorbar": { "ticks": "", "outlinewidth": 0 } } } ], "table": [ { "type": "table", "cells": { "fill": { "color": "#EBF0F8" }, "line": { "color": "white" } }, "header": { "fill": { "color": "#C8D4E3" }, "line": { "color": "white" } } } ], "carpet": [ { "type": "carpet", "aaxis": { "gridcolor": "#C8D4E3", "linecolor": "#C8D4E3", "endlinecolor": "#2a3f5f", "minorgridcolor": "#C8D4E3", "startlinecolor": "#2a3f5f" }, "baxis": { "gridcolor": "#C8D4E3", "linecolor": "#C8D4E3", "endlinecolor": "#2a3f5f", "minorgridcolor": "#C8D4E3", "startlinecolor": "#2a3f5f" } } ], "mesh3d": [ { "type": "mesh3d", "colorbar": { "ticks": "", "outlinewidth": 0 } } ], "contour": [ { "type": "contour", "colorbar": { "ticks": "", "outlinewidth": 0 }, "autocolorscale": true } ], "heatmap": [ { "type": "heatmap", "colorbar": { "ticks": "", "outlinewidth": 0 }, "autocolorscale": true } ], "scatter": [ { "type": "scatter", "marker": { "colorbar": { "ticks": "", "outlinewidth": 0 } } } ], "surface": [ { "type": "surface", "colorbar": { "ticks": "", "outlinewidth": 0 } } ], "heatmapgl": [ { "type": "heatmapgl", "colorbar": { "ticks": "", "outlinewidth": 0 } } ], "histogram": [ { "type": "histogram", "marker": { "colorbar": { "ticks": "", "outlinewidth": 0 } } } ], "parcoords": [ { "line": { "colorbar": { "ticks": "", "outlinewidth": 0 } }, "type": "parcoords" } ], "scatter3d": [ { "type": "scatter3d", "marker": { "colorbar": { "ticks": "", "outlinewidth": 0 } } } ], "scattergl": [ { "type": "scattergl", "marker": { "colorbar": { "ticks": "", "outlinewidth": 0 } } } ], "choropleth": [ { "type": "choropleth", "colorbar": { "ticks": "", "outlinewidth": 0 } } ], "scattergeo": [ { "type": "scattergeo", "marker": { "colorbar": { "ticks": "", "outlinewidth": 0 } } } ], "histogram2d": [ { "type": "histogram2d", "colorbar": { "ticks": "", "outlinewidth": 0 }, "autocolorscale": true } ], "scatterpolar": [ { "type": "scatterpolar", "marker": { "colorbar": { "ticks": "", "outlinewidth": 0 } } } ], "contourcarpet": [ { "type": "contourcarpet", "colorbar": { "ticks": "", "outlinewidth": 0 } } ], "scattercarpet": [ { "type": "scattercarpet", "marker": { "colorbar": { "ticks": "", "outlinewidth": 0 } } } ], "scattermapbox": [ { "type": "scattermapbox", "marker": { "colorbar": { "ticks": "", "outlinewidth": 0 } } } ], "scatterpolargl": [ { "type": "scatterpolargl", "marker": { "colorbar": { "ticks": "", "outlinewidth": 0 } } } ], "scatterternary": [ { "type": "scatterternary", "marker": { "colorbar": { "ticks": "", "outlinewidth": 0 } } } ], "histogram2dcontour": [ { "type": "histogram2dcontour", "colorbar": { "ticks": "", "outlinewidth": 0 }, "autocolorscale": true } ] }, "layout": { "geo": { "bgcolor": "white", "showland": true, "lakecolor": "white", "landcolor": "white", "showlakes": true, "subunitcolor": "#C8D4E3" }, "font": { "color": "#2a3f5f" }, "polar": { "bgcolor": "white", "radialaxis": { "ticks": "", "gridcolor": "#EBF0F8", "linecolor": "#EBF0F8" }, "angularaxis": { "ticks": "", "gridcolor": "#EBF0F8", "linecolor": "#EBF0F8" } }, "scene": { "xaxis": { "ticks": "", "gridcolor": "#DFE8F3", "gridwidth": 2, "linecolor": "#EBF0F8", "zerolinecolor": "#EBF0F8", "showbackground": true, "backgroundcolor": "white" }, "yaxis": { "ticks": "", "gridcolor": "#DFE8F3", "gridwidth": 2, "linecolor": "#EBF0F8", "zerolinecolor": "#EBF0F8", "showbackground": true, "backgroundcolor": "white" }, "zaxis": { "ticks": "", "gridcolor": "#DFE8F3", "gridwidth": 2, "linecolor": "#EBF0F8", "zerolinecolor": "#EBF0F8", "showbackground": true, "backgroundcolor": "white" } }, "title": { "x": 0.05 }, "xaxis": { "ticks": "", "gridcolor": "#EBF0F8", "linecolor": "#EBF0F8", "automargin": true, "zerolinecolor": "#EBF0F8", "zerolinewidth": 2 }, "yaxis": { "ticks": "", "gridcolor": "#EBF0F8", "linecolor": "#EBF0F8", "automargin": true, "zerolinecolor": "#EBF0F8", "zerolinewidth": 2 }, "ternary": { "aaxis": { "ticks": "", "gridcolor": "#DFE8F3", "linecolor": "#A2B1C6" }, "baxis": { "ticks": "", "gridcolor": "#DFE8F3", "linecolor": "#A2B1C6" }, "caxis": { "ticks": "", "gridcolor": "#DFE8F3", "linecolor": "#A2B1C6" }, "bgcolor": "white" }, "colorway": [ "#636efa", "#EF553B", "#00cc96", "#ab63fa", "#19d3f3", "#e763fa", "#fecb52", "#ffa15a", "#ff6692", "#b6e880" ], "hovermode": "closest", "colorscale": { "diverging": [ [ 0, "#8e0152" ], [ 0.1, "#c51b7d" ], [ 0.2, "#de77ae" ], [ 0.3, "#f1b6da" ], [ 0.4, "#fde0ef" ], [ 0.5, "#f7f7f7" ], [ 0.6, "#e6f5d0" ], [ 0.7, "#b8e186" ], [ 0.8, "#7fbc41" ], [ 0.9, "#4d9221" ], [ 1, "#276419" ] ], "sequential": [ [ 0, "#0508b8" ], [ 0.0893854748603352, "#1910d8" ], [ 0.1787709497206704, "#3c19f0" ], [ 0.2681564245810056, "#6b1cfb" ], [ 0.3575418994413408, "#981cfd" ], [ 0.44692737430167595, "#bf1cfd" ], [ 0.5363128491620112, "#dd2bfd" ], [ 0.6256983240223464, "#f246fe" ], [ 0.7150837988826816, "#fc67fd" ], [ 0.8044692737430168, "#fe88fc" ], [ 0.8938547486033519, "#fea5fd" ], [ 0.9832402234636871, "#febefe" ], [ 1, "#fec3fe" ] ], "sequentialminus": [ [ 0, "#0508b8" ], [ 0.0893854748603352, "#1910d8" ], [ 0.1787709497206704, "#3c19f0" ], [ 0.2681564245810056, "#6b1cfb" ], [ 0.3575418994413408, "#981cfd" ], [ 0.44692737430167595, "#bf1cfd" ], [ 0.5363128491620112, "#dd2bfd" ], [ 0.6256983240223464, "#f246fe" ], [ 0.7150837988826816, "#fc67fd" ], [ 0.8044692737430168, "#fe88fc" ], [ 0.8938547486033519, "#fea5fd" ], [ 0.9832402234636871, "#febefe" ], [ 1, "#fec3fe" ] ] }, "plot_bgcolor": "white", "paper_bgcolor": "white", "shapedefaults": { "line": { "width": 0 }, "opacity": 0.4, "fillcolor": "#506784" }, "annotationdefaults": { "arrowhead": 0, "arrowcolor": "#506784", "arrowwidth": 1 } }, "themeRef": "PLOTLY_WHITE" }, "plot_bgcolor": "rgb(250, 249, 246)", "paper_bgcolor": "rgb(250, 249, 246)" } }, "height": null, "width": null, "user": { "profile_url": "https://chart-studio.plotly.com/~tlacroix", "avatar_url": "https://storage.googleapis.com/plotly-prod-profiles/70.jpg", "background_url": "https://storage.googleapis.com/plotly-prod-profiles/bg-12.jpg", "bio": "", "nickname": "", "website": "", "stream_tokens": null, "feature_set_id": null, "csrf_token": null, "date_joined": "2019-03-29 15:30:07", "mapbox_access_tokens": null, "has_password": null, "username": "tlacroix", "email": null, "is_active": null, "readonly": null, "is_dash_creator": null, "dash_created_count": null, "is_chart_creator": null, "charts_created_count": null } }, { "creation_time": "2024-04-23T14:43:32.358896Z", "comments": { "results": [], "count": 0 }, "parented": true, "embed_url": "https://chart-studio.plotly.com/~jay.p3497/31.embed", "fid": "jay.p3497:31", "filename": "rating-distribution-by-page-desktop-LCP", "filetype": "plot", "img_url": "https://storage.googleapis.com/plotly-prod-images/jay.p3497/31/9_WN5N3JIA8OVI5L3PWWKLU61L3LKGIW.png", "image_urls": { "default": "https://storage.googleapis.com/plotly-prod-images/jay.p3497/31/2_WHSOE7FOLR9E4WP1JR4F7Q6FYEGU5P.png", "block-thumb": "https://storage.googleapis.com/plotly-prod-images/jay.p3497/31/8_2LWZ4Q4Q9YYWYYF0SM0EKD58BR68A7.png", "list-thumb": "https://storage.googleapis.com/plotly-prod-images/jay.p3497/31/9_WN5N3JIA8OVI5L3PWWKLU61L3LKGIW.png" }, "api_urls": { "files": "https://api.plotly.com/v2/files/jay.p3497:31", "plots": "https://api.plotly.com/v2/plots/jay.p3497:31", "parent": "https://api.plotly.com/v2/folders/home?user=jay.p3497" }, "owner": "jay.p3497", "parent": -1, "preview": "", "referencers": [], "references": [], "title": "Rating Distribution by Page (Desktop) with Name LCP 23 April", "views": 1, "web_url": "https://chart-studio.plotly.com/~jay.p3497/31/rating-distribution-by-page-desktop-with-name-lcp-23-april/", "world_readable": true, "date_modified": "2024-04-24T12:40:41.315Z", "stars": { "results": [], "count": 0 }, "collaborators": { "results": [], "count": 0 }, "subfolder_count": null, "refresh_interval": null, "organize_view_url": "https://chart-studio.plotly.com/~jay.p3497/31/", "current_user_permission": "read", "is_theme": null, "is_template": null, "autosize": true, "caption": "", "figure": { "data": [ { "name": "Good", "type": "bar", "xsrc": "jay.p3497:32:06e03b", "ysrc": "jay.p3497:32:ef17ed", "marker": { "color": "green" } }, { "name": "Needs Improvement", "type": "bar", "xsrc": "jay.p3497:32:06e03b", "ysrc": "jay.p3497:32:ce58fb", "marker": { "color": "orange" } }, { "name": "Poor", "type": "bar", "xsrc": "jay.p3497:32:06e03b", "ysrc": "jay.p3497:32:0d0335", "marker": { "color": "red" } } ], "layout": { "title": "Rating Distribution by Page (Desktop) with Name LCP 23 April", "xaxis": { "title": "Page" }, "yaxis": { "title": "Rating Percentage" }, "barmode": "stack" } }, "height": null, "width": null, "user": { "profile_url": "https://chart-studio.plotly.com/~jay.p3497", "avatar_url": "https://storage.googleapis.com/plotly-prod-profiles/56.jpg", "background_url": "https://storage.googleapis.com/plotly-prod-profiles/bg-0.jpg", "bio": "", "nickname": "", "website": "", "stream_tokens": null, "feature_set_id": null, "csrf_token": null, "date_joined": "2024-04-21 08:45:42", "mapbox_access_tokens": null, "has_password": null, "username": "jay.p3497", "email": null, "is_active": null, "readonly": null, "is_dash_creator": null, "dash_created_count": null, "is_chart_creator": null, "charts_created_count": null } }, { "creation_time": "2024-04-23T14:43:32.301642Z", "comments": { "results": [], "count": 0 }, "parented": true, "embed_url": "https://chart-studio.plotly.com/~jay.p3497/30.embed", "fid": "jay.p3497:30", "filename": "rating-distribution-by-page-mobile-LCP", "filetype": "plot", "img_url": "https://storage.googleapis.com/plotly-prod-images/jay.p3497/30/9_M0J63CK0T06ZRKMEN9AIMSX6XN99SV.png", "image_urls": { "default": "https://storage.googleapis.com/plotly-prod-images/jay.p3497/30/2_Y03MZ0HTIFJ03FOJMV7ZYWBKFB3UQL.png", "block-thumb": "https://storage.googleapis.com/plotly-prod-images/jay.p3497/30/8_9Q1FX6RZTAEZGWR3G0MZXPHO6S9X7H.png", "list-thumb": "https://storage.googleapis.com/plotly-prod-images/jay.p3497/30/9_M0J63CK0T06ZRKMEN9AIMSX6XN99SV.png" }, "api_urls": { "files": "https://api.plotly.com/v2/files/jay.p3497:30", "plots": "https://api.plotly.com/v2/plots/jay.p3497:30", "parent": "https://api.plotly.com/v2/folders/home?user=jay.p3497" }, "owner": "jay.p3497", "parent": -1, "preview": "", "referencers": [], "references": [], "title": "Rating Distribution by Page (Mobile) with Name LCP 23 April", "views": 1, "web_url": "https://chart-studio.plotly.com/~jay.p3497/30/rating-distribution-by-page-mobile-with-name-lcp-23-april/", "world_readable": true, "date_modified": "2024-04-24T12:40:41.261Z", "stars": { "results": [], "count": 0 }, "collaborators": { "results": [], "count": 0 }, "subfolder_count": null, "refresh_interval": null, "organize_view_url": "https://chart-studio.plotly.com/~jay.p3497/30/", "current_user_permission": "read", "is_theme": null, "is_template": null, "autosize": true, "caption": "", "figure": { "data": [ { "name": "Good", "type": "bar", "xsrc": "jay.p3497:33:a80eba", "ysrc": "jay.p3497:33:9289c4", "marker": { "color": "green" } }, { "name": "Needs Improvement", "type": "bar", "xsrc": "jay.p3497:33:a80eba", "ysrc": "jay.p3497:33:cd2b1a", "marker": { "color": "orange" } }, { "name": "Poor", "type": "bar", "xsrc": "jay.p3497:33:a80eba", "ysrc": "jay.p3497:33:b039d2", "marker": { "color": "red" } } ], "layout": { "title": "Rating Distribution by Page (Mobile) with Name LCP 23 April", "xaxis": { "title": "Page" }, "yaxis": { "title": "Rating Percentage" }, "barmode": "stack" } }, "height": null, "width": null, "user": { "profile_url": "https://chart-studio.plotly.com/~jay.p3497", "avatar_url": "https://storage.googleapis.com/plotly-prod-profiles/56.jpg", "background_url": "https://storage.googleapis.com/plotly-prod-profiles/bg-0.jpg", "bio": "", "nickname": "", "website": "", "stream_tokens": null, "feature_set_id": null, "csrf_token": null, "date_joined": "2024-04-21 08:45:42", "mapbox_access_tokens": null, "has_password": null, "username": "jay.p3497", "email": null, "is_active": null, "readonly": null, "is_dash_creator": null, "dash_created_count": null, "is_chart_creator": null, "charts_created_count": null } }, { "creation_time": "2024-04-23T14:35:21.439328Z", "comments": { "results": [], "count": 0 }, "parented": true, "embed_url": "https://chart-studio.plotly.com/~tekshrestha3/1.embed", "fid": "tekshrestha3:1", "filename": "Plot 1", "filetype": "plot", "img_url": "https://storage.googleapis.com/plotly-prod-images/tekshrestha3/1/9_MY7WHURTP2OUUS4TXNRTRY3PSKLXH9.png", "image_urls": { "default": "https://storage.googleapis.com/plotly-prod-images/tekshrestha3/1/2_TUFXG6A68I2ODMEPX6H5WFENLLYC1E.png", "block-thumb": "https://storage.googleapis.com/plotly-prod-images/tekshrestha3/1/8_L2IDZ25NIB1VJ8PF2IEMY1XCG9M75T.png", "list-thumb": "https://storage.googleapis.com/plotly-prod-images/tekshrestha3/1/9_MY7WHURTP2OUUS4TXNRTRY3PSKLXH9.png" }, "api_urls": { "files": "https://api.plotly.com/v2/files/tekshrestha3:1", "plots": "https://api.plotly.com/v2/plots/tekshrestha3:1", "parent": "https://api.plotly.com/v2/folders/home?user=tekshrestha3" }, "owner": "tekshrestha3", "parent": -1, "preview": "", "referencers": [], "references": [], "title": "", "views": 1, "web_url": "https://chart-studio.plotly.com/~tekshrestha3/1/", "world_readable": true, "date_modified": "2024-04-23T14:35:21.452Z", "stars": { "results": [], "count": 0 }, "collaborators": { "results": [], "count": 0 }, "subfolder_count": null, "refresh_interval": null, "organize_view_url": "https://chart-studio.plotly.com/~tekshrestha3/1/", "current_user_permission": "read", "is_theme": null, "is_template": false, "autosize": true, "caption": "", "figure": { "data": [ { "meta": { "columnNames": { "x": " "Sex" - "Age"", "y": " "Weight (lbs)"" } }, "mode": "markers", "type": "bar", "xsrc": "tekshrestha3:0:78a398,c3454d*", "ysrc": "tekshrestha3:0:c824d0", "orientation": "v", "selectedpoints": [ 0, 1, 2, 3, 4, 5, 6, 7, 8, 9, 10, 11, 12, 13, 14, 15, 16, 17 ] } ], "frames": [], "layout": { "title": { "text": "Gender age vs weight bar graph" }, "xaxis": { "type": "multicategory", "range": [ -0.5003809726756137, 16.061395354046695 ], "title": { "text": "Male Age Female Age" }, "autorange": false, "showspikes": false }, "yaxis": { "type": "linear", "range": [ 0, 313.6842105263158 ], "title": { "text": "weight" }, "autorange": false, "showspikes": false }, "autosize": true, "dragmode": "select", "template": { "data": { "bar": [ { "type": "bar", "marker": { "colorbar": { "ticks": "", "outlinewidth": 0 } } } ], "table": [ { "type": "table", "cells": { "fill": { "color": "#EBF0F8" }, "line": { "color": "white" } }, "header": { "fill": { "color": "#C8D4E3" }, "line": { "color": "white" } } } ], "carpet": [ { "type": "carpet", "aaxis": { "gridcolor": "#C8D4E3", "linecolor": "#C8D4E3", "endlinecolor": "#2a3f5f", "minorgridcolor": "#C8D4E3", "startlinecolor": "#2a3f5f" }, "baxis": { "gridcolor": "#C8D4E3", "linecolor": "#C8D4E3", "endlinecolor": "#2a3f5f", "minorgridcolor": "#C8D4E3", "startlinecolor": "#2a3f5f" } } ], "mesh3d": [ { "type": "mesh3d", "colorbar": { "ticks": "", "outlinewidth": 0 } } ], "contour": [ { "type": "contour", "colorbar": { "ticks": "", "outlinewidth": 0 }, "autocolorscale": true } ], "heatmap": [ { "type": "heatmap", "colorbar": { "ticks": "", "outlinewidth": 0 }, "autocolorscale": true } ], "scatter": [ { "type": "scatter", "marker": { "colorbar": { "ticks": "", "outlinewidth": 0 } } } ], "surface": [ { "type": "surface", "colorbar": { "ticks": "", "outlinewidth": 0 } } ], "heatmapgl": [ { "type": "heatmapgl", "colorbar": { "ticks": "", "outlinewidth": 0 } } ], "histogram": [ { "type": "histogram", "marker": { "colorbar": { "ticks": "", "outlinewidth": 0 } } } ], "parcoords": [ { "line": { "colorbar": { "ticks": "", "outlinewidth": 0 } }, "type": "parcoords" } ], "scatter3d": [ { "type": "scatter3d", "marker": { "colorbar": { "ticks": "", "outlinewidth": 0 } } } ], "scattergl": [ { "type": "scattergl", "marker": { "colorbar": { "ticks": "", "outlinewidth": 0 } } } ], "choropleth": [ { "type": "choropleth", "colorbar": { "ticks": "", "outlinewidth": 0 } } ], "scattergeo": [ { "type": "scattergeo", "marker": { "colorbar": { "ticks": "", "outlinewidth": 0 } } } ], "histogram2d": [ { "type": "histogram2d", "colorbar": { "ticks": "", "outlinewidth": 0 }, "autocolorscale": true } ], "scatterpolar": [ { "type": "scatterpolar", "marker": { "colorbar": { "ticks": "", "outlinewidth": 0 } } } ], "contourcarpet": [ { "type": "contourcarpet", "colorbar": { "ticks": "", "outlinewidth": 0 } } ], "scattercarpet": [ { "type": "scattercarpet", "marker": { "colorbar": { "ticks": "", "outlinewidth": 0 } } } ], "scattermapbox": [ { "type": "scattermapbox", "marker": { "colorbar": { "ticks": "", "outlinewidth": 0 } } } ], "scatterpolargl": [ { "type": "scatterpolargl", "marker": { "colorbar": { "ticks": "", "outlinewidth": 0 } } } ], "scatterternary": [ { "type": "scatterternary", "marker": { "colorbar": { "ticks": "", "outlinewidth": 0 } } } ], "histogram2dcontour": [ { "type": "histogram2dcontour", "colorbar": { "ticks": "", "outlinewidth": 0 }, "autocolorscale": true } ] }, "layout": { "geo": { "bgcolor": "white", "showland": true, "lakecolor": "white", "landcolor": "white", "showlakes": true, "subunitcolor": "#C8D4E3" }, "font": { "color": "#2a3f5f" }, "polar": { "bgcolor": "white", "radialaxis": { "ticks": "", "gridcolor": "#EBF0F8", "linecolor": "#EBF0F8" }, "angularaxis": { "ticks": "", "gridcolor": "#EBF0F8", "linecolor": "#EBF0F8" } }, "scene": { "xaxis": { "ticks": "", "gridcolor": "#DFE8F3", "gridwidth": 2, "linecolor": "#EBF0F8", "zerolinecolor": "#EBF0F8", "showbackground": true, "backgroundcolor": "white" }, "yaxis": { "ticks": "", "gridcolor": "#DFE8F3", "gridwidth": 2, "linecolor": "#EBF0F8", "zerolinecolor": "#EBF0F8", "showbackground": true, "backgroundcolor": "white" }, "zaxis": { "ticks": "", "gridcolor": "#DFE8F3", "gridwidth": 2, "linecolor": "#EBF0F8", "zerolinecolor": "#EBF0F8", "showbackground": true, "backgroundcolor": "white" } }, "title": { "x": 0.05 }, "xaxis": { "ticks": "", "gridcolor": "#EBF0F8", "linecolor": "#EBF0F8", "automargin": true, "zerolinecolor": "#EBF0F8", "zerolinewidth": 2 }, "yaxis": { "ticks": "", "gridcolor": "#EBF0F8", "linecolor": "#EBF0F8", "automargin": true, "zerolinecolor": "#EBF0F8", "zerolinewidth": 2 }, "ternary": { "aaxis": { "ticks": "", "gridcolor": "#DFE8F3", "linecolor": "#A2B1C6" }, "baxis": { "ticks": "", "gridcolor": "#DFE8F3", "linecolor": "#A2B1C6" }, "caxis": { "ticks": "", "gridcolor": "#DFE8F3", "linecolor": "#A2B1C6" }, "bgcolor": "white" }, "colorway": [ "#636efa", "#EF553B", "#00cc96", "#ab63fa", "#19d3f3", "#e763fa", "#fecb52", "#ffa15a", "#ff6692", "#b6e880" ], "hovermode": "closest", "colorscale": { "diverging": [ [ 0, "#8e0152" ], [ 0.1, "#c51b7d" ], [ 0.2, "#de77ae" ], [ 0.3, "#f1b6da" ], [ 0.4, "#fde0ef" ], [ 0.5, "#f7f7f7" ], [ 0.6, "#e6f5d0" ], [ 0.7, "#b8e186" ], [ 0.8, "#7fbc41" ], [ 0.9, "#4d9221" ], [ 1, "#276419" ] ], "sequential": [ [ 0, "#0508b8" ], [ 0.0893854748603352, "#1910d8" ], [ 0.1787709497206704, "#3c19f0" ], [ 0.2681564245810056, "#6b1cfb" ], [ 0.3575418994413408, "#981cfd" ], [ 0.44692737430167595, "#bf1cfd" ], [ 0.5363128491620112, "#dd2bfd" ], [ 0.6256983240223464, "#f246fe" ], [ 0.7150837988826816, "#fc67fd" ], [ 0.8044692737430168, "#fe88fc" ], [ 0.8938547486033519, "#fea5fd" ], [ 0.9832402234636871, "#febefe" ], [ 1, "#fec3fe" ] ], "sequentialminus": [ [ 0, "#0508b8" ], [ 0.0893854748603352, "#1910d8" ], [ 0.1787709497206704, "#3c19f0" ], [ 0.2681564245810056, "#6b1cfb" ], [ 0.3575418994413408, "#981cfd" ], [ 0.44692737430167595, "#bf1cfd" ], [ 0.5363128491620112, "#dd2bfd" ], [ 0.6256983240223464, "#f246fe" ], [ 0.7150837988826816, "#fc67fd" ], [ 0.8044692737430168, "#fe88fc" ], [ 0.8938547486033519, "#fea5fd" ], [ 0.9832402234636871, "#febefe" ], [ 1, "#fec3fe" ] ] }, "plot_bgcolor": "white", "paper_bgcolor": "white", "shapedefaults": { "line": { "width": 0 }, "opacity": 0.4, "fillcolor": "#506784" }, "annotationdefaults": { "arrowhead": 0, "arrowcolor": "#506784", "arrowwidth": 1 } }, "themeRef": "PLOTLY_WHITE" }, "hovermode": "x" } }, "height": null, "width": null, "user": { "profile_url": "https://chart-studio.plotly.com/~tekshrestha3", "avatar_url": "https://storage.googleapis.com/plotly-prod-profiles/30.jpg", "background_url": "https://storage.googleapis.com/plotly-prod-profiles/bg-4.jpg", "bio": "", "nickname": "", "website": "", "stream_tokens": null, "feature_set_id": null, "csrf_token": null, "date_joined": "2024-04-23 13:59:53", "mapbox_access_tokens": null, "has_password": null, "username": "tekshrestha3", "email": null, "is_active": null, "readonly": null, "is_dash_creator": null, "dash_created_count": null, "is_chart_creator": null, "charts_created_count": null } }, { "creation_time": "2024-04-23T14:34:19.631556Z", "comments": { "results": [], "count": 0 }, "parented": true, "embed_url": "https://chart-studio.plotly.com/~AmaurisPD/15.embed", "fid": "AmaurisPD:15", "filename": "averages_plot", "filetype": "plot", "img_url": "https://storage.googleapis.com/plotly-prod-images/AmaurisPD/15/9_18HXGQCWAP25AITTEO435BU4QRP0VE.png", "image_urls": { "default": "https://storage.googleapis.com/plotly-prod-images/AmaurisPD/15/2_8P85J4A7YYZ02AF9EJSMZQSXB7WNBD.png", "block-thumb": "https://storage.googleapis.com/plotly-prod-images/AmaurisPD/15/8_Z242HLUKKWBNP8SU8Y1JDWLLZGBROV.png", "list-thumb": "https://storage.googleapis.com/plotly-prod-images/AmaurisPD/15/9_18HXGQCWAP25AITTEO435BU4QRP0VE.png" }, "api_urls": { "files": "https://api.plotly.com/v2/files/AmaurisPD:15", "plots": "https://api.plotly.com/v2/plots/AmaurisPD:15", "parent": "https://api.plotly.com/v2/folders/home?user=AmaurisPD" }, "owner": "AmaurisPD", "parent": -1, "preview": "", "referencers": [], "references": [], "title": "", "views": 1, "web_url": "https://chart-studio.plotly.com/~AmaurisPD/15/", "world_readable": true, "date_modified": "2024-04-23T14:34:19.642Z", "stars": { "results": [], "count": 0 }, "collaborators": { "results": [], "count": 0 }, "subfolder_count": null, "refresh_interval": null, "organize_view_url": "https://chart-studio.plotly.com/~AmaurisPD/15/", "current_user_permission": "read", "is_theme": null, "is_template": false, "autosize": true, "caption": "", "figure": { "data": [ { "meta": { "columnNames": { "y": "A" } }, "mode": "markers", "type": "bar", "ysrc": "AmaurisPD:13:59d84c", "orientation": "v" }, { "meta": { "columnNames": { "x": "", "y": "B" } }, "type": "bar", "ysrc": "AmaurisPD:13:580e92", "orientation": "v" }, { "meta": { "columnNames": { "y": "C" } }, "type": "bar", "ysrc": "AmaurisPD:13:c5c0d7", "orientation": "v" }, { "meta": { "columnNames": { "y": "D" } }, "type": "bar", "ysrc": "AmaurisPD:13:53db14", "orientation": "v" }, { "meta": { "columnNames": { "y": "E" } }, "type": "bar", "ysrc": "AmaurisPD:13:b0c7bb", "orientation": "v" }, { "meta": { "columnNames": { "y": "F" } }, "type": "bar", "ysrc": "AmaurisPD:13:6c79b6", "orientation": "v" }, { "meta": { "columnNames": { "y": "G" } }, "type": "bar", "ysrc": "AmaurisPD:13:6913a4", "orientation": "v" }, { "meta": { "columnNames": { "y": "H" } }, "type": "bar", "ysrc": "AmaurisPD:13:5ed7f9", "orientation": "v" }, { "meta": { "columnNames": { "y": "I" } }, "type": "bar", "ysrc": "AmaurisPD:13:db45db", "orientation": "v" }, { "meta": { "columnNames": { "y": "J" } }, "type": "bar", "ysrc": "AmaurisPD:13:9f6e13", "orientation": "v" }, { "meta": { "columnNames": { "y": "K" } }, "type": "bar", "ysrc": "AmaurisPD:13:34ba54", "orientation": "v" }, { "meta": { "columnNames": { "y": "L" } }, "type": "bar", "ysrc": "AmaurisPD:13:f1da6b", "orientation": "v" }, { "meta": { "columnNames": { "y": "M" } }, "type": "bar", "ysrc": "AmaurisPD:13:4e9296", "orientation": "v" }, { "meta": { "columnNames": { "y": "N" } }, "type": "bar", "ysrc": "AmaurisPD:13:c37918", "orientation": "v" }, { "meta": { "columnNames": { "y": "O" } }, "type": "bar", "ysrc": "AmaurisPD:13:fbb2b6", "orientation": "v" }, { "meta": { "columnNames": { "y": "P" } }, "type": "bar", "ysrc": "AmaurisPD:13:87eb1d", "orientation": "v" }, { "meta": { "columnNames": { "y": "Q" } }, "type": "bar", "ysrc": "AmaurisPD:13:ef4b31", "orientation": "v" }, { "meta": { "columnNames": { "y": "R" } }, "type": "bar", "ysrc": "AmaurisPD:13:110781", "orientation": "v" }, { "meta": { "columnNames": { "y": "S" } }, "type": "bar", "ysrc": "AmaurisPD:13:eaff17", "orientation": "v" }, { "meta": { "columnNames": { "y": "T" } }, "type": "bar", "ysrc": "AmaurisPD:13:e4ad59", "orientation": "v" }, { "meta": { "columnNames": { "y": "U" } }, "type": "bar", "ysrc": "AmaurisPD:13:af21d6", "orientation": "v" }, { "meta": { "columnNames": { "y": "V" } }, "type": "bar", "ysrc": "AmaurisPD:13:ab2209", "orientation": "v" }, { "meta": { "columnNames": { "y": "W" } }, "type": "bar", "ysrc": "AmaurisPD:13:5ca127", "orientation": "v" }, { "meta": { "columnNames": { "y": "X" } }, "type": "bar", "ysrc": "AmaurisPD:13:c3a8bf", "orientation": "v" } ], "frames": [], "layout": { "xaxis": { "range": [ -0.5, 6.5 ], "autorange": true }, "yaxis": { "type": "linear", "range": [ 0, 188.42105263157896 ], "autorange": true }, "autosize": true, "template": { "data": { "bar": [ { "type": "bar", "marker": { "colorbar": { "ticks": "", "outlinewidth": 0 } } } ], "table": [ { "type": "table", "cells": { "fill": { "color": "#EBF0F8" }, "line": { "color": "white" } }, "header": { "fill": { "color": "#C8D4E3" }, "line": { "color": "white" } } } ], "carpet": [ { "type": "carpet", "aaxis": { "gridcolor": "#C8D4E3", "linecolor": "#C8D4E3", "endlinecolor": "#2a3f5f", "minorgridcolor": "#C8D4E3", "startlinecolor": "#2a3f5f" }, "baxis": { "gridcolor": "#C8D4E3", "linecolor": "#C8D4E3", "endlinecolor": "#2a3f5f", "minorgridcolor": "#C8D4E3", "startlinecolor": "#2a3f5f" } } ], "mesh3d": [ { "type": "mesh3d", "colorbar": { "ticks": "", "outlinewidth": 0 } } ], "contour": [ { "type": "contour", "colorbar": { "ticks": "", "outlinewidth": 0 }, "autocolorscale": true } ], "heatmap": [ { "type": "heatmap", "colorbar": { "ticks": "", "outlinewidth": 0 }, "autocolorscale": true } ], "scatter": [ { "type": "scatter", "marker": { "colorbar": { "ticks": "", "outlinewidth": 0 } } } ], "surface": [ { "type": "surface", "colorbar": { "ticks": "", "outlinewidth": 0 } } ], "heatmapgl": [ { "type": "heatmapgl", "colorbar": { "ticks": "", "outlinewidth": 0 } } ], "histogram": [ { "type": "histogram", "marker": { "colorbar": { "ticks": "", "outlinewidth": 0 } } } ], "parcoords": [ { "line": { "colorbar": { "ticks": "", "outlinewidth": 0 } }, "type": "parcoords" } ], "scatter3d": [ { "type": "scatter3d", "marker": { "colorbar": { "ticks": "", "outlinewidth": 0 } } } ], "scattergl": [ { "type": "scattergl", "marker": { "colorbar": { "ticks": "", "outlinewidth": 0 } } } ], "choropleth": [ { "type": "choropleth", "colorbar": { "ticks": "", "outlinewidth": 0 } } ], "scattergeo": [ { "type": "scattergeo", "marker": { "colorbar": { "ticks": "", "outlinewidth": 0 } } } ], "histogram2d": [ { "type": "histogram2d", "colorbar": { "ticks": "", "outlinewidth": 0 }, "autocolorscale": true } ], "scatterpolar": [ { "type": "scatterpolar", "marker": { "colorbar": { "ticks": "", "outlinewidth": 0 } } } ], "contourcarpet": [ { "type": "contourcarpet", "colorbar": { "ticks": "", "outlinewidth": 0 } } ], "scattercarpet": [ { "type": "scattercarpet", "marker": { "colorbar": { "ticks": "", "outlinewidth": 0 } } } ], "scattermapbox": [ { "type": "scattermapbox", "marker": { "colorbar": { "ticks": "", "outlinewidth": 0 } } } ], "scatterpolargl": [ { "type": "scatterpolargl", "marker": { "colorbar": { "ticks": "", "outlinewidth": 0 } } } ], "scatterternary": [ { "type": "scatterternary", "marker": { "colorbar": { "ticks": "", "outlinewidth": 0 } } } ], "histogram2dcontour": [ { "type": "histogram2dcontour", "colorbar": { "ticks": "", "outlinewidth": 0 }, "autocolorscale": true } ] }, "layout": { "geo": { "bgcolor": "white", "showland": true, "lakecolor": "white", "landcolor": "white", "showlakes": true, "subunitcolor": "#C8D4E3" }, "font": { "color": "#2a3f5f" }, "polar": { "bgcolor": "white", "radialaxis": { "ticks": "", "gridcolor": "#EBF0F8", "linecolor": "#EBF0F8" }, "angularaxis": { "ticks": "", "gridcolor": "#EBF0F8", "linecolor": "#EBF0F8" } }, "scene": { "xaxis": { "ticks": "", "gridcolor": "#DFE8F3", "gridwidth": 2, "linecolor": "#EBF0F8", "zerolinecolor": "#EBF0F8", "showbackground": true, "backgroundcolor": "white" }, "yaxis": { "ticks": "", "gridcolor": "#DFE8F3", "gridwidth": 2, "linecolor": "#EBF0F8", "zerolinecolor": "#EBF0F8", "showbackground": true, "backgroundcolor": "white" }, "zaxis": { "ticks": "", "gridcolor": "#DFE8F3", "gridwidth": 2, "linecolor": "#EBF0F8", "zerolinecolor": "#EBF0F8", "showbackground": true, "backgroundcolor": "white" } }, "title": { "x": 0.05 }, "xaxis": { "ticks": "", "gridcolor": "#EBF0F8", "linecolor": "#EBF0F8", "automargin": true, "zerolinecolor": "#EBF0F8", "zerolinewidth": 2 }, "yaxis": { "ticks": "", "gridcolor": "#EBF0F8", "linecolor": "#EBF0F8", "automargin": true, "zerolinecolor": "#EBF0F8", "zerolinewidth": 2 }, "ternary": { "aaxis": { "ticks": "", "gridcolor": "#DFE8F3", "linecolor": "#A2B1C6" }, "baxis": { "ticks": "", "gridcolor": "#DFE8F3", "linecolor": "#A2B1C6" }, "caxis": { "ticks": "", "gridcolor": "#DFE8F3", "linecolor": "#A2B1C6" }, "bgcolor": "white" }, "colorway": [ "#636efa", "#EF553B", "#00cc96", "#ab63fa", "#19d3f3", "#e763fa", "#fecb52", "#ffa15a", "#ff6692", "#b6e880" ], "hovermode": "closest", "colorscale": { "diverging": [ [ 0, "#8e0152" ], [ 0.1, "#c51b7d" ], [ 0.2, "#de77ae" ], [ 0.3, "#f1b6da" ], [ 0.4, "#fde0ef" ], [ 0.5, "#f7f7f7" ], [ 0.6, "#e6f5d0" ], [ 0.7, "#b8e186" ], [ 0.8, "#7fbc41" ], [ 0.9, "#4d9221" ], [ 1, "#276419" ] ], "sequential": [ [ 0, "#0508b8" ], [ 0.0893854748603352, "#1910d8" ], [ 0.1787709497206704, "#3c19f0" ], [ 0.2681564245810056, "#6b1cfb" ], [ 0.3575418994413408, "#981cfd" ], [ 0.44692737430167595, "#bf1cfd" ], [ 0.5363128491620112, "#dd2bfd" ], [ 0.6256983240223464, "#f246fe" ], [ 0.7150837988826816, "#fc67fd" ], [ 0.8044692737430168, "#fe88fc" ], [ 0.8938547486033519, "#fea5fd" ], [ 0.9832402234636871, "#febefe" ], [ 1, "#fec3fe" ] ], "sequentialminus": [ [ 0, "#0508b8" ], [ 0.0893854748603352, "#1910d8" ], [ 0.1787709497206704, "#3c19f0" ], [ 0.2681564245810056, "#6b1cfb" ], [ 0.3575418994413408, "#981cfd" ], [ 0.44692737430167595, "#bf1cfd" ], [ 0.5363128491620112, "#dd2bfd" ], [ 0.6256983240223464, "#f246fe" ], [ 0.7150837988826816, "#fc67fd" ], [ 0.8044692737430168, "#fe88fc" ], [ 0.8938547486033519, "#fea5fd" ], [ 0.9832402234636871, "#febefe" ], [ 1, "#fec3fe" ] ] }, "plot_bgcolor": "white", "paper_bgcolor": "white", "shapedefaults": { "line": { "width": 0 }, "opacity": 0.4, "fillcolor": "#506784" }, "annotationdefaults": { "arrowhead": 0, "arrowcolor": "#506784", "arrowwidth": 1 } }, "themeRef": "PLOTLY_WHITE" } } }, "height": null, "width": null, "user": { "profile_url": "https://chart-studio.plotly.com/~AmaurisPD", "avatar_url": "https://storage.googleapis.com/plotly-prod-profiles/89.jpg", "background_url": "https://storage.googleapis.com/plotly-prod-profiles/bg-12.jpg", "bio": "", "nickname": "", "website": "", "stream_tokens": null, "feature_set_id": null, "csrf_token": null, "date_joined": "2024-01-26 22:21:33", "mapbox_access_tokens": null, "has_password": null, "username": "AmaurisPD", "email": null, "is_active": null, "readonly": null, "is_dash_creator": null, "dash_created_count": null, "is_chart_creator": null, "charts_created_count": null } }, { "creation_time": "2024-04-23T14:31:47.307474Z", "comments": { "results": [], "count": 0 }, "parented": true, "embed_url": "https://chart-studio.plotly.com/~c.hartard/3.embed", "fid": "c.hartard:3", "filename": "Plot 3", "filetype": "plot", "img_url": "https://storage.googleapis.com/plotly-prod-images/c.hartard/3/9_H4MOV25LBJXNFEPIO2034FDDP6JU3G.png", "image_urls": { "default": "https://storage.googleapis.com/plotly-prod-images/c.hartard/3/2_1H7GBP05Z4ZWQ841CLTB2GCZQ7PO7H.png", "block-thumb": "https://storage.googleapis.com/plotly-prod-images/c.hartard/3/8_NS2HCB751RYPFK8UA9HPJ92BUUKFHN.png", "list-thumb": "https://storage.googleapis.com/plotly-prod-images/c.hartard/3/9_H4MOV25LBJXNFEPIO2034FDDP6JU3G.png" }, "api_urls": { "files": "https://api.plotly.com/v2/files/c.hartard:3", "plots": "https://api.plotly.com/v2/plots/c.hartard:3", "parent": "https://api.plotly.com/v2/folders/home?user=c.hartard" }, "owner": "c.hartard", "parent": -1, "preview": "", "referencers": [], "references": [], "title": "", "views": 1, "web_url": "https://chart-studio.plotly.com/~c.hartard/3/", "world_readable": true, "date_modified": "2024-04-23T14:31:47.324Z", "stars": { "results": [], "count": 0 }, "collaborators": { "results": [], "count": 0 }, "subfolder_count": null, "refresh_interval": null, "organize_view_url": "https://chart-studio.plotly.com/~c.hartard/3/", "current_user_permission": "read", "is_theme": null, "is_template": false, "autosize": true, "caption": "", "figure": { "data": [ { "asrc": "c.hartard:2:feb0b7", "bsrc": "c.hartard:2:aac630", "csrc": "c.hartard:2:8de823", "fill": "none", "meta": { "columnNames": { "a": "CSF/plasma", "b": "plasma/proviral DNA", "c": "proviral DNA/CSF", "marker": { "color": "D" } } }, "mode": "markers", "name": "<br>", "type": "scatterternary", "marker": { "line": { "width": 0 }, "meta": { "columnNames": { "color": "D" } }, "size": 6, "symbol": "circle", "colorsrc": "c.hartard:2:f31ef5", "maxdisplayed": 11 }, "hoveron": "points", "visible": true, "hoverinfo": "a+b+c", "hoverlabel": { "align": "left", "namelength": 15 }, "showlegend": true, "legendgroup": "" } ], "frames": [], "layout": { "title": { "text": "" }, "xaxis": { "range": [ -1, 6 ], "autorange": true }, "yaxis": { "range": [ -1, 4 ], "autorange": true }, "legend": { "x": 0.8203913894324854, "y": 1, "title": { "font": { "family": "Arial" }, "text": "<br>" }, "orientation": "v" }, "shapes": [ { "x0": 0.25, "x1": 0.75, "y0": 0.25, "y1": 0.75, "line": { "color": "#444444", "width": 0 }, "type": "circle", "opacity": 0.3, "visible": false, "fillcolor": "#7f7f7f" } ], "ternary": { "aaxis": { "min": -1, "type": "linear", "dtick": 10, "tick0": 18, "ticks": "", "title": { "text": "<b>CSF/plasma</b>" }, "nticks": 6, "showgrid": true, "showline": true, "tickfont": { "size": 14 }, "tickmode": "auto", "linecolor": "rgb(0, 0, 0)", "linewidth": 1, "tickangle": "auto", "tickformat": "", "tickprefix": "", "showexponent": "all", "exponentformat": "none", "showticklabels": true, "separatethousands": false }, "baxis": { "min": -1, "type": "linear", "dtick": 10, "tick0": 18, "ticks": "", "title": { "text": "<b>plasma/proviral DNA</b>" }, "nticks": 6, "showgrid": true, "showline": true, "tickfont": { "size": 14 }, "tickmode": "auto", "linecolor": "rgb(0, 0, 0)", "linewidth": 1, "tickangle": "auto", "tickformat": "", "tickprefix": "", "showexponent": "all", "exponentformat": "none", "separatethousands": false }, "caxis": { "min": -1, "type": "linear", "dtick": 10, "tick0": 18, "ticks": "", "title": { "font": { "size": 14, "family": "Arial" }, "text": "<b>proviral DNA/CSF</b>" }, "nticks": 6, "showgrid": true, "showline": true, "tickfont": { "size": 14 }, "tickmode": "auto", "linecolor": "rgb(0, 0, 0)", "linewidth": 1, "tickangle": "auto", "tickformat": "", "tickprefix": "", "showexponent": "all", "exponentformat": "none", "separatethousands": false } }, "autosize": true, "template": { "data": { "bar": [ { "type": "bar", "marker": { "colorbar": { "ticks": "", "outlinewidth": 0 } } } ], "table": [ { "type": "table", "cells": { "fill": { "color": "#EBF0F8" }, "line": { "color": "white" } }, "header": { "fill": { "color": "#C8D4E3" }, "line": { "color": "white" } } } ], "carpet": [ { "type": "carpet", "aaxis": { "gridcolor": "#C8D4E3", "linecolor": "#C8D4E3", "endlinecolor": "#2a3f5f", "minorgridcolor": "#C8D4E3", "startlinecolor": "#2a3f5f" }, "baxis": { "gridcolor": "#C8D4E3", "linecolor": "#C8D4E3", "endlinecolor": "#2a3f5f", "minorgridcolor": "#C8D4E3", "startlinecolor": "#2a3f5f" } } ], "mesh3d": [ { "type": "mesh3d", "colorbar": { "ticks": "", "outlinewidth": 0 } } ], "contour": [ { "type": "contour", "colorbar": { "ticks": "", "outlinewidth": 0 }, "autocolorscale": true } ], "heatmap": [ { "type": "heatmap", "colorbar": { "ticks": "", "outlinewidth": 0 }, "autocolorscale": true } ], "scatter": [ { "type": "scatter", "marker": { "colorbar": { "ticks": "", "outlinewidth": 0 } } } ], "surface": [ { "type": "surface", "colorbar": { "ticks": "", "outlinewidth": 0 } } ], "heatmapgl": [ { "type": "heatmapgl", "colorbar": { "ticks": "", "outlinewidth": 0 } } ], "histogram": [ { "type": "histogram", "marker": { "colorbar": { "ticks": "", "outlinewidth": 0 } } } ], "parcoords": [ { "line": { "colorbar": { "ticks": "", "outlinewidth": 0 } }, "type": "parcoords" } ], "scatter3d": [ { "type": "scatter3d", "marker": { "colorbar": { "ticks": "", "outlinewidth": 0 } } } ], "scattergl": [ { "type": "scattergl", "marker": { "colorbar": { "ticks": "", "outlinewidth": 0 } } } ], "choropleth": [ { "type": "choropleth", "colorbar": { "ticks": "", "outlinewidth": 0 } } ], "scattergeo": [ { "type": "scattergeo", "marker": { "colorbar": { "ticks": "", "outlinewidth": 0 } } } ], "histogram2d": [ { "type": "histogram2d", "colorbar": { "ticks": "", "outlinewidth": 0 }, "autocolorscale": true } ], "scatterpolar": [ { "type": "scatterpolar", "marker": { "colorbar": { "ticks": "", "outlinewidth": 0 } } } ], "contourcarpet": [ { "type": "contourcarpet", "colorbar": { "ticks": "", "outlinewidth": 0 } } ], "scattercarpet": [ { "type": "scattercarpet", "marker": { "colorbar": { "ticks": "", "outlinewidth": 0 } } } ], "scattermapbox": [ { "type": "scattermapbox", "marker": { "colorbar": { "ticks": "", "outlinewidth": 0 } } } ], "scatterpolargl": [ { "type": "scatterpolargl", "marker": { "colorbar": { "ticks": "", "outlinewidth": 0 } } } ], "scatterternary": [ { "type": "scatterternary", "marker": { "colorbar": { "ticks": "", "outlinewidth": 0 } } } ], "histogram2dcontour": [ { "type": "histogram2dcontour", "colorbar": { "ticks": "", "outlinewidth": 0 }, "autocolorscale": true } ] }, "layout": { "geo": { "bgcolor": "white", "showland": true, "lakecolor": "white", "landcolor": "white", "showlakes": true, "subunitcolor": "#C8D4E3" }, "font": { "color": "#2a3f5f" }, "polar": { "bgcolor": "white", "radialaxis": { "ticks": "", "gridcolor": "#EBF0F8", "linecolor": "#EBF0F8" }, "angularaxis": { "ticks": "", "gridcolor": "#EBF0F8", "linecolor": "#EBF0F8" } }, "scene": { "xaxis": { "ticks": "", "gridcolor": "#DFE8F3", "gridwidth": 2, "linecolor": "#EBF0F8", "zerolinecolor": "#EBF0F8", "showbackground": true, "backgroundcolor": "white" }, "yaxis": { "ticks": "", "gridcolor": "#DFE8F3", "gridwidth": 2, "linecolor": "#EBF0F8", "zerolinecolor": "#EBF0F8", "showbackground": true, "backgroundcolor": "white" }, "zaxis": { "ticks": "", "gridcolor": "#DFE8F3", "gridwidth": 2, "linecolor": "#EBF0F8", "zerolinecolor": "#EBF0F8", "showbackground": true, "backgroundcolor": "white" } }, "title": { "x": 0.05 }, "xaxis": { "ticks": "", "gridcolor": "#EBF0F8", "linecolor": "#EBF0F8", "automargin": true, "zerolinecolor": "#EBF0F8", "zerolinewidth": 2 }, "yaxis": { "ticks": "", "gridcolor": "#EBF0F8", "linecolor": "#EBF0F8", "automargin": true, "zerolinecolor": "#EBF0F8", "zerolinewidth": 2 }, "ternary": { "aaxis": { "ticks": "", "gridcolor": "#DFE8F3", "linecolor": "#A2B1C6" }, "baxis": { "ticks": "", "gridcolor": "#DFE8F3", "linecolor": "#A2B1C6" }, "caxis": { "ticks": "", "gridcolor": "#DFE8F3", "linecolor": "#A2B1C6" }, "bgcolor": "white" }, "colorway": [ "#636efa", "#EF553B", "#00cc96", "#ab63fa", "#19d3f3", "#e763fa", "#fecb52", "#ffa15a", "#ff6692", "#b6e880" ], "hovermode": "closest", "colorscale": { "diverging": [ [ 0, "#8e0152" ], [ 0.1, "#c51b7d" ], [ 0.2, "#de77ae" ], [ 0.3, "#f1b6da" ], [ 0.4, "#fde0ef" ], [ 0.5, "#f7f7f7" ], [ 0.6, "#e6f5d0" ], [ 0.7, "#b8e186" ], [ 0.8, "#7fbc41" ], [ 0.9, "#4d9221" ], [ 1, "#276419" ] ], "sequential": [ [ 0, "#0508b8" ], [ 0.0893854748603352, "#1910d8" ], [ 0.1787709497206704, "#3c19f0" ], [ 0.2681564245810056, "#6b1cfb" ], [ 0.3575418994413408, "#981cfd" ], [ 0.44692737430167595, "#bf1cfd" ], [ 0.5363128491620112, "#dd2bfd" ], [ 0.6256983240223464, "#f246fe" ], [ 0.7150837988826816, "#fc67fd" ], [ 0.8044692737430168, "#fe88fc" ], [ 0.8938547486033519, "#fea5fd" ], [ 0.9832402234636871, "#febefe" ], [ 1, "#fec3fe" ] ], "sequentialminus": [ [ 0, "#0508b8" ], [ 0.0893854748603352, "#1910d8" ], [ 0.1787709497206704, "#3c19f0" ], [ 0.2681564245810056, "#6b1cfb" ], [ 0.3575418994413408, "#981cfd" ], [ 0.44692737430167595, "#bf1cfd" ], [ 0.5363128491620112, "#dd2bfd" ], [ 0.6256983240223464, "#f246fe" ], [ 0.7150837988826816, "#fc67fd" ], [ 0.8044692737430168, "#fe88fc" ], [ 0.8938547486033519, "#fea5fd" ], [ 0.9832402234636871, "#febefe" ], [ 1, "#fec3fe" ] ] }, "plot_bgcolor": "white", "paper_bgcolor": "white", "shapedefaults": { "line": { "width": 0 }, "opacity": 0.4, "fillcolor": "#506784" }, "annotationdefaults": { "arrowhead": 0, "arrowcolor": "#506784", "arrowwidth": 1 } }, "themeRef": "PLOTLY_WHITE" }, "showlegend": true, "annotations": [ { "x": 0.5037771482530689, "y": 0.28747203579418346, "ax": -17, "ay": 20, "text": "P1" }, { "x": 0.5302171860245515, "y": 0.2986577181208054, "ax": 23, "ay": 11, "text": "P3" }, { "x": 0.48489140698772426, "y": 0.3523489932885906, "ax": -10, "ay": -21, "text": "P6" }, { "x": 0.5037771482530689, "y": 0.13087248322147652, "ax": 14, "ay": 25, "text": "P7" }, { "x": 0.47922568460812087, "y": 0.31208053691275167, "ax": -24, "ay": -13, "text": "P10" }, { "x": 0.5254957507082153, "y": 0.32997762863534674, "ax": 15, "ay": -29, "text": "P11" }, { "x": 0.5113314447592068, "y": 0.2829977628635347, "ax": 11, "ay": 23, "text": "P12", "align": "center", "xanchor": "center", "arrowsize": 1, "showarrow": true, "textangle": 0, "arrowwidth": 1 } ] } }, "height": null, "width": null, "user": { "profile_url": "https://chart-studio.plotly.com/~c.hartard", "avatar_url": "https://storage.googleapis.com/plotly-prod-profiles/85.jpg", "background_url": "https://storage.googleapis.com/plotly-prod-profiles/bg-6.jpg", "bio": "", "nickname": "", "website": "", "stream_tokens": null, "feature_set_id": null, "csrf_token": null, "date_joined": "2023-05-12 09:41:48", "mapbox_access_tokens": null, "has_password": null, "username": "c.hartard", "email": null, "is_active": null, "readonly": null, "is_dash_creator": null, "dash_created_count": null, "is_chart_creator": null, "charts_created_count": null } }, { "creation_time": "2024-04-23T14:12:38.389936Z", "comments": { "results": [], "count": 0 }, "parented": true, "embed_url": "https://chart-studio.plotly.com/~esc1/15.embed", "fid": "esc1:15", "filename": "MUCW_nf", "filetype": "plot", "img_url": "https://storage.googleapis.com/plotly-prod-images/esc1/15/9_MGZFMNPKCKFP38G0WQ6WNXSC85Z99J.png", "image_urls": { "default": "https://storage.googleapis.com/plotly-prod-images/esc1/15/2_Q90KUKG9OGVD2VC4SUPNYDN25XI9ML.png", "block-thumb": "https://storage.googleapis.com/plotly-prod-images/esc1/15/8_9VTNI3MHC3IFJH9TAN7VEGCSIEVACE.png", "list-thumb": "https://storage.googleapis.com/plotly-prod-images/esc1/15/9_MGZFMNPKCKFP38G0WQ6WNXSC85Z99J.png" }, "api_urls": { "files": "https://api.plotly.com/v2/files/esc1:15", "plots": "https://api.plotly.com/v2/plots/esc1:15", "parent": "https://api.plotly.com/v2/folders/home?user=esc1" }, "owner": "esc1", "parent": -1, "preview": "", "referencers": [], "references": [], "title": "", "views": 7, "web_url": "https://chart-studio.plotly.com/~esc1/15/", "world_readable": true, "date_modified": "2024-04-23T14:12:38.400Z", "stars": { "results": [], "count": 0 }, "collaborators": { "results": [], "count": 0 }, "subfolder_count": null, "refresh_interval": null, "organize_view_url": "https://chart-studio.plotly.com/~esc1/15/", "current_user_permission": "read", "is_theme": null, "is_template": null, "autosize": true, "caption": "", "figure": { "data": [ { "line": { "dash": "solid", "color": "rgba(0,0,0,1)", "width": 5.669291338582678 }, "mode": "lines", "text": "yintercept: 0", "type": "scatter", "xsrc": "esc1:14:f64683", "ysrc": "esc1:14:c53408", "frame": null, "xaxis": "x", "yaxis": "y", "hoveron": "points", "hoverinfo": "text", "showlegend": false }, { "line": { "dash": "solid", "color": "rgba(190,190,190,1)", "width": 1.8897637795275593 }, "mode": "lines", "type": "scatter", "xsrc": "esc1:14:9ee8e5", "ysrc": "esc1:14:4cddec", "frame": null, "xaxis": "x", "yaxis": "y", "hoveron": "points", "textsrc": "esc1:14:15c7d8", "hoverinfo": "text", "showlegend": false }, { "line": { "dash": "solid", "color": "rgba(190,190,190,1)", "width": 1.8897637795275593 }, "mode": "lines", "type": "scatter", "xsrc": "esc1:14:a02a45", "ysrc": "esc1:14:192f70", "frame": null, "xaxis": "x", "yaxis": "y", "hoveron": "points", "textsrc": "esc1:14:bbb371", "hoverinfo": "text", "showlegend": false }, { "line": { "dash": "solid", "color": "rgba(165,0,38,1)", "width": 3.7795275590551185 }, "mode": "lines", "name": "2017", "type": "scatter", "xsrc": "esc1:14:f5f05e", "ysrc": "esc1:14:fd8f07", "frame": null, "xaxis": "x", "yaxis": "y", "hoveron": "points", "textsrc": "esc1:14:2465a1", "hoverinfo": "text", "showlegend": true, "legendgroup": "2017" }, { "line": { "dash": "solid", "color": "rgba(244,109,67,1)", "width": 3.7795275590551185 }, "mode": "lines", "name": "2018", "type": "scatter", "xsrc": "esc1:14:3007dc", "ysrc": "esc1:14:f537e6", "frame": null, "xaxis": "x", "yaxis": "y", "hoveron": "points", "textsrc": "esc1:14:b8130e", "hoverinfo": "text", "showlegend": true, "legendgroup": "2018" }, { "line": { "dash": "solid", "color": "rgba(253,174,97,1)", "width": 3.7795275590551185 }, "mode": "lines", "name": "2019", "type": "scatter", "xsrc": "esc1:14:0d18d5", "ysrc": "esc1:14:e790bb", "frame": null, "xaxis": "x", "yaxis": "y", "hoveron": "points", "textsrc": "esc1:14:318a64", "hoverinfo": "text", "showlegend": true, "legendgroup": "2019" }, { "line": { "dash": "solid", "color": "rgba(217,239,139,1)", "width": 3.7795275590551185 }, "mode": "lines", "name": "2020", "type": "scatter", "xsrc": "esc1:14:11087d", "ysrc": "esc1:14:d7b37d", "frame": null, "xaxis": "x", "yaxis": "y", "hoveron": "points", "textsrc": "esc1:14:8a2fb5", "hoverinfo": "text", "showlegend": true, "legendgroup": "2020" }, { "line": { "dash": "solid", "color": "rgba(102,189,99,1)", "width": 3.7795275590551185 }, "mode": "lines", "name": "2021", "type": "scatter", "xsrc": "esc1:14:66f73c", "ysrc": "esc1:14:5f1032", "frame": null, "xaxis": "x", "yaxis": "y", "hoveron": "points", "textsrc": "esc1:14:bc12e0", "hoverinfo": "text", "showlegend": true, "legendgroup": "2021" }, { "line": { "dash": "solid", "color": "rgba(0,104,55,1)", "width": 3.7795275590551185 }, "mode": "lines", "name": "2022", "type": "scatter", "xsrc": "esc1:14:b19854", "ysrc": "esc1:14:66d998", "frame": null, "xaxis": "x", "yaxis": "y", "hoveron": "points", "textsrc": "esc1:14:e3f4be", "hoverinfo": "text", "showlegend": true, "legendgroup": "2022" } ], "layout": { "font": { "size": 20, "color": "black", "family": "Arial" }, "xaxis": { "type": "linear", "range": [ 145, 255 ], "ticks": "outside", "title": "River Mile", "anchor": "y", "domain": [ 0, 1 ], "nticks": null, "ticklen": 3.652968036529681, "showgrid": false, "showline": true, "tickfont": { "size": 16, "color": "black", "family": "" }, "tickmode": "array", "ticktext": [ "150", "175", "200", "225", "250" ], "tickvals": [ 150, 175, 200, 225, 250 ], "zeroline": false, "autorange": "reversed", "gridcolor": null, "gridwidth": 0, "linecolor": "rgba(0,0,0,1)", "linewidth": 0.66417600664176, "tickangle": 0, "tickcolor": "rgba(51,51,51,1)", "tickwidth": 0.66417600664176, "automargin": true, "hoverformat": ".2f", "categoryarray": [ "150", "175", "200", "225", "250" ], "categoryorder": "array", "showticklabels": true }, "yaxis": { "type": "linear", "range": [ -90, 1890 ], "ticks": "outside", "title": " MUCW (ft) <br /> ", "anchor": "x", "domain": [ 0, 1 ], "nticks": null, "ticklen": 3.652968036529681, "showgrid": false, "showline": true, "tickfont": { "size": 16, "color": "black", "family": "" }, "tickmode": "array", "ticktext": [ "0", "500", "1000", "1500" ], "tickvals": [ 0, 500, 1000, 1500 ], "zeroline": false, "autorange": false, "gridcolor": null, "gridwidth": 0, "linecolor": "rgba(0,0,0,1)", "linewidth": 0.66417600664176, "tickangle": 0, "tickcolor": "rgba(51,51,51,1)", "tickwidth": 0.66417600664176, "automargin": true, "hoverformat": ".2f", "categoryarray": [ "0", "500", "1000", "1500" ], "categoryorder": "array", "showticklabels": true }, "legend": { "font": { "size": 15, "color": "rgba(0,0,0,1)", "family": "" }, "title": { "font": { "size": 14.611872146118724, "color": "rgba(0,0,0,1)", "family": "" }, "text": "Year" }, "bgcolor": "rgba(255,255,255,1)", "bordercolor": "transparent", "borderwidth": 1.8897637795275593 }, "margin": { "b": 100, "l": 150, "r": 100, "t": 70, "pad": 10 }, "shapes": [ { "x0": 0, "x1": 1, "y0": 0, "y1": 1, "line": { "color": null, "width": 0, "linetype": [] }, "type": "rect", "xref": "paper", "yref": "paper", "fillcolor": null } ], "barmode": "relative", "hovermode": "closest", "showlegend": true, "annotations": [ { "x": 162.5, "y": 1500, "font": { "size": 20, "color": "black", "family": "Arial" }, "text": "Chapman", "showarrow": false, "textangle": 270 }, { "x": 181.5, "y": 1500, "font": { "size": 20, "color": "black", "family": "Arial" }, "text": "Crane Trust", "showarrow": false, "textangle": 270 }, { "x": 190.5, "y": 1500, "font": { "size": 20, "color": "black", "family": "Arial" }, "text": "Uridil Tract", "showarrow": false, "textangle": 270 }, { "x": 200, "y": 1500, "font": { "size": 20, "color": "black", "family": "Arial" }, "text": "Dippel", "showarrow": false, "textangle": 270 }, { "x": 206, "y": 1500, "font": { "size": 20, "color": "black", "family": "Arial" }, "text": "Rowe", "showarrow": false, "textangle": 270 }, { "x": 212, "y": 1500, "font": { "size": 20, "color": "black", "family": "Arial" }, "text": "Ft. Kearny", "showarrow": false, "textangle": 270 }, { "x": 219.5, "y": 1500, "font": { "size": 20, "color": "black", "family": "Arial" }, "text": "Pawnee", "showarrow": false, "textangle": 270 }, { "x": 231.5, "y": 1500, "font": { "size": 20, "color": "black", "family": "Arial" }, "text": "Elm Creek", "showarrow": false, "textangle": 270 }, { "x": 237, "y": 1500, "font": { "size": 20, "color": "black", "family": "Arial" }, "text": "Cottonwood Ranch", "showarrow": false, "textangle": 270 } ], "plot_bgcolor": "rgba(255,255,255,1)", "paper_bgcolor": "rgba(255,255,255,1)" } }, "height": null, "width": null, "user": { "profile_url": "https://chart-studio.plotly.com/~esc1", "avatar_url": "https://storage.googleapis.com/plotly-prod-profiles/85.jpg", "background_url": "https://storage.googleapis.com/plotly-prod-profiles/bg-2.jpg", "bio": "", "nickname": "", "website": "", "stream_tokens": null, "feature_set_id": null, "csrf_token": null, "date_joined": "2023-07-10 20:22:51", "mapbox_access_tokens": null, "has_password": null, "username": "esc1", "email": null, "is_active": null, "readonly": null, "is_dash_creator": null, "dash_created_count": null, "is_chart_creator": null, "charts_created_count": null } }, { "creation_time": "2024-04-23T14:11:13.274673Z", "comments": { "results": [], "count": 0 }, "parented": true, "embed_url": "https://chart-studio.plotly.com/~rainshower19/1.embed", "fid": "rainshower19:1", "filename": "Arbeitsweg_2024_USA", "filetype": "plot", "img_url": "https://storage.googleapis.com/plotly-prod-images/rainshower19/1/9_CXKCPIC153T0ZUYCQSKZ0JY0YG20VJ.png", "image_urls": { "default": "https://storage.googleapis.com/plotly-prod-images/rainshower19/1/2_ML06K1AR90P8QFQ0P9U5RMQF9VC04P.png", "block-thumb": "https://storage.googleapis.com/plotly-prod-images/rainshower19/1/8_1JUL139Q1SWHO83QI3CRJJENGTBPUN.png", "list-thumb": "https://storage.googleapis.com/plotly-prod-images/rainshower19/1/9_CXKCPIC153T0ZUYCQSKZ0JY0YG20VJ.png" }, "api_urls": { "files": "https://api.plotly.com/v2/files/rainshower19:1", "plots": "https://api.plotly.com/v2/plots/rainshower19:1", "parent": "https://api.plotly.com/v2/folders/home?user=rainshower19" }, "owner": "rainshower19", "parent": -1, "preview": "", "referencers": [], "references": [], "title": "", "views": 2166, "web_url": "https://chart-studio.plotly.com/~rainshower19/1/", "world_readable": true, "date_modified": "2024-04-25T12:15:56.192Z", "stars": { "results": [], "count": 0 }, "collaborators": { "results": [], "count": 0 }, "subfolder_count": null, "refresh_interval": null, "organize_view_url": "https://chart-studio.plotly.com/~rainshower19/1/", "current_user_permission": "read", "is_theme": null, "is_template": true, "autosize": true, "caption": "", "figure": { "data": [ { "asrc": "rainshower19:0:454c07", "bsrc": "rainshower19:0:b26515", "csrc": "rainshower19:0:b8c704", "meta": { "columnNames": { "a": "Aktiv", "b": "ÖV", "c": "Auto", "text": "Stadt", "marker": { "size": "Bevölkerung", "color": "" } } }, "mode": "markers", "type": "scatterternary", "marker": { "line": { "color": "rgb(255, 255, 255)", "width": 1 }, "meta": { "columnNames": { "size": "Bevölkerung", "color": "Land" } }, "color": "rgb(216, 105, 189)", "symbol": "circle", "opacity": 1, "sizemin": 5, "sizeref": 50032.45611122686, "sizesrc": "rainshower19:0:40bead", "sizemode": "area", "maxdisplayed": 0, "reversescale": true }, "hoveron": "points", "opacity": 1, "textsrc": "rainshower19:0:b61ee7", "hoverinfo": "a+b+c+text", "cliponaxis": true, "hoverlabel": { "align": "left", "namelength": 0 }, "showlegend": false, "hovertemplate": "<b>%{text}</b><br><span style=\"font-size:80%;\"><b>Aktiv:</b> %{a:.2f}%</span><br><span style=\"font-size:80%;\"><b>ÖV:</b> %{b:.2f}%</span><br><span style=\"font-size:80%;\"><b>Auto:</b> %{c:.2f}%</span>", "autocolorscale": false } ], "frames": [], "layout": { "font": { "family": "Open Sans" }, "title": { "font": { "size": 30 }, "text": "<b>USA und Kanada</b>" }, "legend": { "orientation": "v" }, "ternary": { "sum": 100, "aaxis": { "min": 0, "type": "multicategory", "ticks": "outside", "title": { "font": { "size": 20, "color": "rgb(171, 16, 244)", "family": "Open Sans" }, "text": "<b>Aktiv</b>" }, "nticks": 11, "ticklen": 5, "showgrid": true, "showline": true, "tickfont": { "size": 12, "color": "rgb(68, 68, 68)", "family": "Open Sans" }, "tickmode": "auto", "gridcolor": "rgba(115, 115, 115, 0.3)", "gridwidth": 1, "linecolor": "rgb(99, 99, 99)", "linewidth": 2, "tickangle": "auto", "tickcolor": "rgba(0, 0, 0, 0)", "ticksuffix": "%" }, "baxis": { "min": 0, "type": "multicategory", "ticks": "outside", "title": { "font": { "size": 20, "color": "rgb(0, 193, 246)", "family": "Open Sans" }, "text": "<br><b>ÖV</b>" }, "nticks": 11, "ticklen": 5, "showgrid": true, "showline": true, "tickfont": { "size": 12, "family": "Open Sans" }, "tickmode": "auto", "gridcolor": "rgba(115, 115, 115, 0.3)", "gridwidth": 1, "linecolor": "rgb(99, 99, 99)", "linewidth": 2, "tickangle": "auto", "tickcolor": "rgba(0, 0, 0, 0)", "ticksuffix": "%" }, "caxis": { "min": 0, "type": "multicategory", "ticks": "outside", "title": { "font": { "size": 20, "color": "rgb(16, 244, 121)", "family": "Open Sans" }, "text": "<br><b>Auto</b>" }, "nticks": 11, "ticklen": 5, "showgrid": true, "showline": true, "tickfont": { "size": 12, "family": "Open Sans" }, "tickmode": "auto", "gridcolor": "rgba(115, 115, 115, 0.3)", "gridwidth": 1, "linecolor": "rgb(99, 99, 99)", "linewidth": 2, "tickangle": "auto", "tickcolor": "rgba(0, 0, 0, 0)", "ticksuffix": "%" } }, "autosize": true, "dragmode": "zoom", "clickmode": "event", "hoverlabel": { "font": { "size": 15, "color": "rgb(0, 0, 0)", "family": "Open Sans" }, "bgcolor": "rgb(255, 255, 255)", "bordercolor": "rgb(244, 15, 151)" }, "showlegend": true, "annotations": [ { "x": 0.5, "y": 1.3, "font": { "size": 15 }, "text": "", "showarrow": false } ] } }, "height": null, "width": null, "user": { "profile_url": "https://chart-studio.plotly.com/~rainshower19", "avatar_url": "https://storage.googleapis.com/plotly-prod-profiles/65.jpg", "background_url": "https://storage.googleapis.com/plotly-prod-profiles/bg-10.jpg", "bio": "", "nickname": "", "website": "", "stream_tokens": null, "feature_set_id": null, "csrf_token": null, "date_joined": "2024-04-23 08:41:18", "mapbox_access_tokens": null, "has_password": null, "username": "rainshower19", "email": null, "is_active": null, "readonly": null, "is_dash_creator": null, "dash_created_count": null, "is_chart_creator": null, "charts_created_count": null } }, { "creation_time": "2024-04-23T13:58:13.748758Z", "comments": { "results": [], "count": 0 }, "parented": true, "embed_url": "https://chart-studio.plotly.com/~rbgo/7.embed", "fid": "rbgo:7", "filename": "Plot 7", "filetype": "plot", "img_url": "https://storage.googleapis.com/plotly-prod-images/rbgo/7/9_L8IDTTKIAYYDDTXROSZB44B7NE1U6P.png", "image_urls": { "default": "https://storage.googleapis.com/plotly-prod-images/rbgo/7/2_QAOJGZLI44IT15E7KMBR836G8L3DBM.png", "block-thumb": "https://storage.googleapis.com/plotly-prod-images/rbgo/7/8_XKT8YGSA5ZSW06XZXP2HVN0BROCYA8.png", "list-thumb": "https://storage.googleapis.com/plotly-prod-images/rbgo/7/9_L8IDTTKIAYYDDTXROSZB44B7NE1U6P.png" }, "api_urls": { "files": "https://api.plotly.com/v2/files/rbgo:7", "plots": "https://api.plotly.com/v2/plots/rbgo:7", "parent": "https://api.plotly.com/v2/folders/home?user=rbgo" }, "owner": "rbgo", "parent": -1, "preview": "", "referencers": [], "references": [], "title": "", "views": 1, "web_url": "https://chart-studio.plotly.com/~rbgo/7/", "world_readable": true, "date_modified": "2024-04-23T14:05:46.984Z", "stars": { "results": [], "count": 0 }, "collaborators": { "results": [], "count": 0 }, "subfolder_count": null, "refresh_interval": null, "organize_view_url": "https://chart-studio.plotly.com/~rbgo/7/", "current_user_permission": "read", "is_theme": null, "is_template": false, "autosize": true, "caption": "", "figure": { "data": [ { "meta": { "columnNames": { "x": "B", "y": "A" } }, "mode": "markers", "name": "vLLM", "type": "scatter", "xsrc": "rbgo:2:661f53", "ysrc": "rbgo:2:b918e5" }, { "meta": { "columnNames": { "x": "B", "y": "A" } }, "mode": "markers", "name": "Deepspeed-mii", "type": "scatter", "xsrc": "rbgo:3:b88b9f", "ysrc": "rbgo:3:730126" }, { "meta": { "columnNames": { "x": "B", "y": "A" } }, "mode": "markers", "name": "TGI", "type": "scatter", "xsrc": "rbgo:4:556bff", "ysrc": "rbgo:4:b81c55", "stackgroup": null }, { "meta": { "columnNames": { "x": "B", "y": "A" } }, "mode": "markers", "name": "CTranslate2", "type": "scatter", "xsrc": "rbgo:5:cb4f47", "ysrc": "rbgo:5:680452", "stackgroup": null }, { "meta": { "columnNames": { "x": "B", "y": "A" } }, "mode": "markers", "name": "Triton+vLLM Backend", "type": "scatter", "xsrc": "rbgo:6:3eb3bc", "ysrc": "rbgo:6:75d830", "stackgroup": null } ], "frames": [], "layout": { "title": { "x": 0.16, "font": { "size": 22 }, "text": "Time to First Token" }, "xaxis": { "type": "linear", "range": [ -40.75647788534, 1060.75647788534 ], "title": { "text": "Input Tokens Length" }, "anchor": "y", "domain": [ 0, 0.375 ], "zeroline": false, "autorange": true, "zerolinecolor": "rgb(49, 42, 42)", "zerolinewidth": 2 }, "yaxis": { "type": "linear", "range": [ 0.008761129457782674, 0.2493489495422173 ], "title": { "text": "Time (sec)" }, "domain": [ 0.5, 1 ], "autorange": true }, "legend": { "x": 0.28000000000000025, "y": 0.6000000000000001, "font": { "family": "Times New Roman" }, "bordercolor": "rgb(232, 232, 232)", "borderwidth": 1 }, "modebar": { "orientation": "h" }, "autosize": true, "template": { "data": { "bar": [ { "type": "bar", "marker": { "colorbar": { "len": 0.2, "ticks": "inside", "ticklen": 6, "tickcolor": "rgb(237,237,237)", "outlinewidth": 0 } } } ], "table": [ { "type": "table", "cells": { "fill": { "color": "rgb(237,237,237)" }, "line": { "color": "white" } }, "header": { "fill": { "color": "rgb(217,217,217)" }, "line": { "color": "white" } } } ], "carpet": [ { "type": "carpet", "aaxis": { "gridcolor": "white", "linecolor": "white", "endlinecolor": "rgb(51,51,51)", "minorgridcolor": "white", "startlinecolor": "rgb(51,51,51)" }, "baxis": { "gridcolor": "white", "linecolor": "white", "endlinecolor": "rgb(51,51,51)", "minorgridcolor": "white", "startlinecolor": "rgb(51,51,51)" } } ], "mesh3d": [ { "type": "mesh3d", "colorbar": { "len": 0.2, "ticks": "inside", "ticklen": 6, "tickcolor": "rgb(237,237,237)", "outlinewidth": 0 } } ], "contour": [ { "type": "contour", "colorbar": { "len": 0.2, "ticks": "inside", "ticklen": 6, "tickcolor": "rgb(237,237,237)", "outlinewidth": 0 }, "autocolorscale": true } ], "heatmap": [ { "type": "heatmap", "colorbar": { "len": 0.2, "ticks": "inside", "ticklen": 6, "tickcolor": "rgb(237,237,237)", "outlinewidth": 0 }, "autocolorscale": true } ], "scatter": [ { "type": "scatter", "marker": { "colorbar": { "len": 0.2, "ticks": "inside", "ticklen": 6, "tickcolor": "rgb(237,237,237)", "outlinewidth": 0 } } } ], "surface": [ { "type": "surface", "colorbar": { "len": 0.2, "ticks": "inside", "ticklen": 6, "tickcolor": "rgb(237,237,237)", "outlinewidth": 0 } } ], "heatmapgl": [ { "type": "heatmapgl", "colorbar": { "len": 0.2, "ticks": "inside", "ticklen": 6, "tickcolor": "rgb(237,237,237)", "outlinewidth": 0 } } ], "histogram": [ { "type": "histogram", "marker": { "colorbar": { "len": 0.2, "ticks": "inside", "ticklen": 6, "tickcolor": "rgb(237,237,237)", "outlinewidth": 0 } } } ], "parcoords": [ { "line": { "colorbar": { "len": 0.2, "ticks": "inside", "ticklen": 6, "tickcolor": "rgb(237,237,237)", "outlinewidth": 0 } }, "type": "parcoords" } ], "scatter3d": [ { "type": "scatter3d", "marker": { "colorbar": { "len": 0.2, "ticks": "inside", "ticklen": 6, "tickcolor": "rgb(237,237,237)", "outlinewidth": 0 } } } ], "scattergl": [ { "type": "scattergl", "marker": { "colorbar": { "len": 0.2, "ticks": "inside", "ticklen": 6, "tickcolor": "rgb(237,237,237)", "outlinewidth": 0 } } } ], "choropleth": [ { "type": "choropleth", "colorbar": { "len": 0.2, "ticks": "inside", "ticklen": 6, "tickcolor": "rgb(237,237,237)", "outlinewidth": 0 } } ], "scattergeo": [ { "type": "scattergeo", "marker": { "colorbar": { "len": 0.2, "ticks": "inside", "ticklen": 6, "tickcolor": "rgb(237,237,237)", "outlinewidth": 0 } } } ], "histogram2d": [ { "type": "histogram2d", "colorbar": { "len": 0.2, "ticks": "inside", "ticklen": 6, "tickcolor": "rgb(237,237,237)", "outlinewidth": 0 }, "autocolorscale": true } ], "scatterpolar": [ { "type": "scatterpolar", "marker": { "colorbar": { "len": 0.2, "ticks": "inside", "ticklen": 6, "tickcolor": "rgb(237,237,237)", "outlinewidth": 0 } } } ], "contourcarpet": [ { "type": "contourcarpet", "colorbar": { "len": 0.2, "ticks": "inside", "ticklen": 6, "tickcolor": "rgb(237,237,237)", "outlinewidth": 0 } } ], "scattercarpet": [ { "type": "scattercarpet", "marker": { "colorbar": { "len": 0.2, "ticks": "inside", "ticklen": 6, "tickcolor": "rgb(237,237,237)", "outlinewidth": 0 } } } ], "scattermapbox": [ { "type": "scattermapbox", "marker": { "colorbar": { "len": 0.2, "ticks": "inside", "ticklen": 6, "tickcolor": "rgb(237,237,237)", "outlinewidth": 0 } } } ], "scatterpolargl": [ { "type": "scatterpolargl", "marker": { "colorbar": { "len": 0.2, "ticks": "inside", "ticklen": 6, "tickcolor": "rgb(237,237,237)", "outlinewidth": 0 } } } ], "scatterternary": [ { "type": "scatterternary", "marker": { "colorbar": { "len": 0.2, "ticks": "inside", "ticklen": 6, "tickcolor": "rgb(237,237,237)", "outlinewidth": 0 } } } ], "histogram2dcontour": [ { "type": "histogram2dcontour", "colorbar": { "len": 0.2, "ticks": "inside", "ticklen": 6, "tickcolor": "rgb(237,237,237)", "outlinewidth": 0 }, "autocolorscale": true } ] }, "layout": { "geo": { "bgcolor": "white", "showland": true, "lakecolor": "white", "landcolor": "rgb(237,237,237)", "showlakes": true, "subunitcolor": "white" }, "font": { "color": "rgb(51,51,51)" }, "polar": { "bgcolor": "rgb(237,237,237)", "radialaxis": { "ticks": "outside", "showgrid": true, "gridcolor": "white", "linecolor": "white", "tickcolor": "rgb(51,51,51)" }, "angularaxis": { "ticks": "outside", "showgrid": true, "gridcolor": "white", "linecolor": "white", "tickcolor": "rgb(51,51,51)" } }, "scene": { "xaxis": { "ticks": "outside", "showgrid": true, "gridcolor": "white", "gridwidth": 2, "linecolor": "white", "tickcolor": "rgb(51,51,51)", "zerolinecolor": "white", "showbackground": true, "backgroundcolor": "rgb(237,237,237)" }, "yaxis": { "ticks": "outside", "showgrid": true, "gridcolor": "white", "gridwidth": 2, "linecolor": "white", "tickcolor": "rgb(51,51,51)", "zerolinecolor": "white", "showbackground": true, "backgroundcolor": "rgb(237,237,237)" }, "zaxis": { "ticks": "outside", "showgrid": true, "gridcolor": "white", "gridwidth": 2, "linecolor": "white", "tickcolor": "rgb(51,51,51)", "zerolinecolor": "white", "showbackground": true, "backgroundcolor": "rgb(237,237,237)" } }, "xaxis": { "ticks": "outside", "showgrid": true, "gridcolor": "white", "linecolor": "white", "tickcolor": "rgb(51,51,51)", "automargin": true, "zerolinecolor": "white" }, "yaxis": { "ticks": "outside", "showgrid": true, "gridcolor": "white", "linecolor": "white", "tickcolor": "rgb(51,51,51)", "automargin": true, "zerolinecolor": "white" }, "ternary": { "aaxis": { "ticks": "outside", "showgrid": true, "gridcolor": "white", "linecolor": "white", "tickcolor": "rgb(51,51,51)" }, "baxis": { "ticks": "outside", "showgrid": true, "gridcolor": "white", "linecolor": "white", "tickcolor": "rgb(51,51,51)" }, "caxis": { "ticks": "outside", "showgrid": true, "gridcolor": "white", "linecolor": "white", "tickcolor": "rgb(51,51,51)" }, "bgcolor": "rgb(237,237,237)" }, "colorway": [ "#F8766D", "#A3A500", "#00BF7D", "#00B0F6", "#E76BF3" ], "hovermode": "closest", "colorscale": { "diverging": [ [ 0, "#40004b" ], [ 0.1, "#762a83" ], [ 0.2, "#9970ab" ], [ 0.3, "#c2a5cf" ], [ 0.4, "#e7d4e8" ], [ 0.5, "#f7f7f7" ], [ 0.6, "#d9f0d3" ], [ 0.7, "#a6dba0" ], [ 0.8, "#5aae61" ], [ 0.9, "#1b7837" ], [ 1, "#00441b" ] ], "sequential": [ [ 0, "rgb(20,44,66)" ], [ 1, "rgb(90,179,244)" ] ], "sequentialminus": [ [ 0, "rgb(20,44,66)" ], [ 1, "rgb(90,179,244)" ] ] }, "plot_bgcolor": "rgb(237,237,237)", "paper_bgcolor": "white", "shapedefaults": { "line": { "width": 0 }, "opacity": 0.3, "fillcolor": "black" }, "annotationdefaults": { "arrowhead": 0, "arrowwidth": 1 } }, "themeRef": "GGPLOT2" } } }, "height": null, "width": null, "user": { "profile_url": "https://chart-studio.plotly.com/~rbgo", "avatar_url": "https://storage.googleapis.com/plotly-prod-profiles/0.jpg", "background_url": "https://storage.googleapis.com/plotly-prod-profiles/bg-14.jpg", "bio": "", "nickname": "", "website": "", "stream_tokens": null, "feature_set_id": null, "csrf_token": null, "date_joined": "2024-04-09 19:22:24", "mapbox_access_tokens": null, "has_password": null, "username": "rbgo", "email": null, "is_active": null, "readonly": null, "is_dash_creator": null, "dash_created_count": null, "is_chart_creator": null, "charts_created_count": null } }, { "creation_time": "2024-04-23T13:53:48.799481Z", "comments": { "results": [], "count": 0 }, "parented": true, "embed_url": "https://chart-studio.plotly.com/~clinhares/20.embed", "fid": "clinhares:20", "filename": "Programas Grafico 1.5.1 MESTRES copy", "filetype": "plot", "img_url": "https://storage.googleapis.com/plotly-prod-images/clinhares/20/9_O7J6R2RD57SYO62R4RWPB89D4Y877E.png", "image_urls": { "default": "https://storage.googleapis.com/plotly-prod-images/clinhares/20/2_WH5E3SB8UWYR4ITPBZTQDYYZBXSDK5.png", "block-thumb": "https://storage.googleapis.com/plotly-prod-images/clinhares/20/8_NMGOGDLFA3YJBTR3XRJKUNT19X9GAP.png", "list-thumb": "https://storage.googleapis.com/plotly-prod-images/clinhares/20/9_O7J6R2RD57SYO62R4RWPB89D4Y877E.png" }, "api_urls": { "files": "https://api.plotly.com/v2/files/clinhares:20", "plots": "https://api.plotly.com/v2/plots/clinhares:20", "parent": "https://api.plotly.com/v2/folders/home?user=clinhares" }, "owner": "clinhares", "parent": -1, "preview": "", "referencers": [], "references": [], "title": "", "views": 152, "web_url": "https://chart-studio.plotly.com/~clinhares/20/", "world_readable": true, "date_modified": "2024-04-23T13:53:49.165Z", "stars": { "results": [], "count": 0 }, "collaborators": { "results": [], "count": 0 }, "subfolder_count": null, "refresh_interval": null, "organize_view_url": "https://chart-studio.plotly.com/~clinhares/20/", "current_user_permission": "read", "is_theme": null, "is_template": false, "autosize": false, "caption": "", "figure": { "data": [ { "meta": { "columnNames": { "x": "Ano", "y": "B", "text": "K" } }, "mode": "markers+lines", "name": "Agrárias", "type": "scatter", "xsrc": "clinhares:19:89be9a", "ysrc": "clinhares:19:b285e2", "marker": { "color": "rgb(255, 160, 122)" }, "textsrc": "clinhares:19:81a25a", "hoverinfo": "text", "hoverlabel": { "align": "left" } }, { "meta": { "columnNames": { "x": "Ano", "y": "C", "text": "L" } }, "mode": "markers+lines", "name": "Biológicas", "type": "scatter", "xsrc": "clinhares:19:89be9a", "ysrc": "clinhares:19:58627c", "marker": { "color": "rgb(255, 99, 71)" }, "textsrc": "clinhares:19:a4dcd7", "hoverinfo": "text", "hoverlabel": { "align": "left" }, "stackgroup": null }, { "meta": { "columnNames": { "x": "Ano", "y": "D", "text": "M" } }, "mode": "markers+lines", "name": "Saúde", "type": "scatter", "xsrc": "clinhares:19:89be9a", "ysrc": "clinhares:19:ed2db9", "marker": { "color": "rgb(255, 215, 0)" }, "textsrc": "clinhares:19:81541f", "hoverinfo": "text", "hoverlabel": { "align": "left" }, "stackgroup": null }, { "meta": { "columnNames": { "x": "Ano", "y": "E", "text": "N" } }, "mode": "markers+lines", "name": "Exatas e da terra", "type": "scatter", "xsrc": "clinhares:19:89be9a", "ysrc": "clinhares:19:d5ac2d", "marker": { "color": "rgb(50, 205, 50)" }, "textsrc": "clinhares:19:4ad850", "hoverinfo": "text", "hoverlabel": { "align": "left" }, "stackgroup": null }, { "meta": { "columnNames": { "x": "Ano", "y": "F", "text": "O" } }, "mode": "markers+lines", "name": "Humanas", "type": "scatter", "xsrc": "clinhares:19:89be9a", "ysrc": "clinhares:19:7448dd", "marker": { "color": "rgb(119, 136, 153)" }, "textsrc": "clinhares:19:4f40a2", "hoverinfo": "text", "hoverlabel": { "align": "left" }, "stackgroup": null }, { "meta": { "columnNames": { "x": "Ano", "y": "G", "text": "P" } }, "mode": "markers+lines", "name": "Sociais aplicadas", "type": "scatter", "xsrc": "clinhares:19:89be9a", "ysrc": "clinhares:19:8ebd06", "marker": { "color": "rgb(135, 206, 235)" }, "textsrc": "clinhares:19:ea2d00", "hoverinfo": "text", "hoverlabel": { "align": "left" }, "stackgroup": null }, { "meta": { "columnNames": { "x": "Ano", "y": "H", "text": "Q" } }, "mode": "markers+lines", "name": "Engenharias", "type": "scatter", "xsrc": "clinhares:19:89be9a", "ysrc": "clinhares:19:bea2eb", "marker": { "color": "rgb(0, 206, 209)" }, "textsrc": "clinhares:19:b8255f", "hoverinfo": "text", "hoverlabel": { "align": "left" }, "stackgroup": null }, { "meta": { "columnNames": { "x": "Ano", "y": "I", "text": "R" } }, "mode": "markers+lines", "name": "Ling., letras e artes", "type": "scatter", "xsrc": "clinhares:19:89be9a", "ysrc": "clinhares:19:609d57", "marker": { "color": "rgb(147, 112, 219)" }, "textsrc": "clinhares:19:608fd8", "hoverinfo": "text", "hoverlabel": { "align": "left" }, "stackgroup": null }, { "meta": { "columnNames": { "x": "Ano", "y": "J", "text": "S" } }, "mode": "markers+lines", "name": "Multidisciplinar", "type": "scatter", "xsrc": "clinhares:19:89be9a", "ysrc": "clinhares:19:13f785", "marker": { "color": "rgb(255, 20, 147)" }, "textsrc": "clinhares:19:4e2f5c", "hoverinfo": "text", "hoverlabel": { "align": "left" }, "stackgroup": null } ], "frames": [], "layout": { "font": { "family": "Roboto" }, "title": { "x": 0.5, "font": { "size": 15 }, "text": "" }, "width": 600, "xaxis": { "type": "linear", "dtick": 1, "range": [ 1995.3, 2021.5 ], "title": { "font": { "size": 13, "family": "Roboto" }, "text": "<b>Ano</b>" }, "tickfont": { "size": 13 }, "tickmode": "linear", "autorange": false, "tickangle": 45, "exponentformat": "none" }, "yaxis": { "type": "linear", "dtick": 0, "range": [ -22.082853855005744, 800 ], "title": { "font": { "size": 13 }, "text": "<b>Número de cursos<br><br>\n</b>" }, "tickmode": "auto", "autorange": false, "exponentformat": "none", "showticklabels": true }, "height": 450, "legend": { "x": 0.48, "y": -0.2, "font": { "size": 13 }, "valign": "middle", "xanchor": "center", "yanchor": "top", "orientation": "h" }, "margin": { "r": 0, "t": 25 }, "autosize": false, "template": { "data": { "bar": [ { "type": "bar", "marker": { "colorbar": { "ticks": "", "outlinewidth": 0 } } } ], "table": [ { "type": "table", "cells": { "fill": { "color": "#EBF0F8" }, "line": { "color": "white" } }, "header": { "fill": { "color": "#C8D4E3" }, "line": { "color": "white" } } } ], "carpet": [ { "type": "carpet", "aaxis": { "gridcolor": "#C8D4E3", "linecolor": "#C8D4E3", "endlinecolor": "#2a3f5f", "minorgridcolor": "#C8D4E3", "startlinecolor": "#2a3f5f" }, "baxis": { "gridcolor": "#C8D4E3", "linecolor": "#C8D4E3", "endlinecolor": "#2a3f5f", "minorgridcolor": "#C8D4E3", "startlinecolor": "#2a3f5f" } } ], "mesh3d": [ { "type": "mesh3d", "colorbar": { "ticks": "", "outlinewidth": 0 } } ], "contour": [ { "type": "contour", "colorbar": { "ticks": "", "outlinewidth": 0 }, "autocolorscale": true } ], "heatmap": [ { "type": "heatmap", "colorbar": { "ticks": "", "outlinewidth": 0 }, "autocolorscale": true } ], "scatter": [ { "type": "scatter", "marker": { "colorbar": { "ticks": "", "outlinewidth": 0 } } } ], "surface": [ { "type": "surface", "colorbar": { "ticks": "", "outlinewidth": 0 } } ], "heatmapgl": [ { "type": "heatmapgl", "colorbar": { "ticks": "", "outlinewidth": 0 } } ], "histogram": [ { "type": "histogram", "marker": { "colorbar": { "ticks": "", "outlinewidth": 0 } } } ], "parcoords": [ { "line": { "colorbar": { "ticks": "", "outlinewidth": 0 } }, "type": "parcoords" } ], "scatter3d": [ { "type": "scatter3d", "marker": { "colorbar": { "ticks": "", "outlinewidth": 0 } } } ], "scattergl": [ { "type": "scattergl", "marker": { "colorbar": { "ticks": "", "outlinewidth": 0 } } } ], "choropleth": [ { "type": "choropleth", "colorbar": { "ticks": "", "outlinewidth": 0 } } ], "scattergeo": [ { "type": "scattergeo", "marker": { "colorbar": { "ticks": "", "outlinewidth": 0 } } } ], "histogram2d": [ { "type": "histogram2d", "colorbar": { "ticks": "", "outlinewidth": 0 }, "autocolorscale": true } ], "scatterpolar": [ { "type": "scatterpolar", "marker": { "colorbar": { "ticks": "", "outlinewidth": 0 } } } ], "contourcarpet": [ { "type": "contourcarpet", "colorbar": { "ticks": "", "outlinewidth": 0 } } ], "scattercarpet": [ { "type": "scattercarpet", "marker": { "colorbar": { "ticks": "", "outlinewidth": 0 } } } ], "scattermapbox": [ { "type": "scattermapbox", "marker": { "colorbar": { "ticks": "", "outlinewidth": 0 } } } ], "scatterpolargl": [ { "type": "scatterpolargl", "marker": { "colorbar": { "ticks": "", "outlinewidth": 0 } } } ], "scatterternary": [ { "type": "scatterternary", "marker": { "colorbar": { "ticks": "", "outlinewidth": 0 } } } ], "histogram2dcontour": [ { "type": "histogram2dcontour", "colorbar": { "ticks": "", "outlinewidth": 0 }, "autocolorscale": true } ] }, "layout": { "geo": { "bgcolor": "white", "showland": true, "lakecolor": "white", "landcolor": "white", "showlakes": true, "subunitcolor": "#C8D4E3" }, "font": { "color": "#2a3f5f" }, "polar": { "bgcolor": "white", "radialaxis": { "ticks": "", "gridcolor": "#EBF0F8", "linecolor": "#EBF0F8" }, "angularaxis": { "ticks": "", "gridcolor": "#EBF0F8", "linecolor": "#EBF0F8" } }, "scene": { "xaxis": { "ticks": "", "gridcolor": "#DFE8F3", "gridwidth": 2, "linecolor": "#EBF0F8", "zerolinecolor": "#EBF0F8", "showbackground": true, "backgroundcolor": "white" }, "yaxis": { "ticks": "", "gridcolor": "#DFE8F3", "gridwidth": 2, "linecolor": "#EBF0F8", "zerolinecolor": "#EBF0F8", "showbackground": true, "backgroundcolor": "white" }, "zaxis": { "ticks": "", "gridcolor": "#DFE8F3", "gridwidth": 2, "linecolor": "#EBF0F8", "zerolinecolor": "#EBF0F8", "showbackground": true, "backgroundcolor": "white" } }, "title": { "x": 0.05 }, "xaxis": { "ticks": "", "gridcolor": "#EBF0F8", "linecolor": "#EBF0F8", "automargin": true, "zerolinecolor": "#EBF0F8", "zerolinewidth": 2 }, "yaxis": { "ticks": "", "gridcolor": "#EBF0F8", "linecolor": "#EBF0F8", "automargin": true, "zerolinecolor": "#EBF0F8", "zerolinewidth": 2 }, "ternary": { "aaxis": { "ticks": "", "gridcolor": "#DFE8F3", "linecolor": "#A2B1C6" }, "baxis": { "ticks": "", "gridcolor": "#DFE8F3", "linecolor": "#A2B1C6" }, "caxis": { "ticks": "", "gridcolor": "#DFE8F3", "linecolor": "#A2B1C6" }, "bgcolor": "white" }, "colorway": [ "#636efa", "#EF553B", "#00cc96", "#ab63fa", "#19d3f3", "#e763fa", "#fecb52", "#ffa15a", "#ff6692", "#b6e880" ], "hovermode": "closest", "colorscale": { "diverging": [ [ 0, "#8e0152" ], [ 0.1, "#c51b7d" ], [ 0.2, "#de77ae" ], [ 0.3, "#f1b6da" ], [ 0.4, "#fde0ef" ], [ 0.5, "#f7f7f7" ], [ 0.6, "#e6f5d0" ], [ 0.7, "#b8e186" ], [ 0.8, "#7fbc41" ], [ 0.9, "#4d9221" ], [ 1, "#276419" ] ], "sequential": [ [ 0, "#0508b8" ], [ 0.0893854748603352, "#1910d8" ], [ 0.1787709497206704, "#3c19f0" ], [ 0.2681564245810056, "#6b1cfb" ], [ 0.3575418994413408, "#981cfd" ], [ 0.44692737430167595, "#bf1cfd" ], [ 0.5363128491620112, "#dd2bfd" ], [ 0.6256983240223464, "#f246fe" ], [ 0.7150837988826816, "#fc67fd" ], [ 0.8044692737430168, "#fe88fc" ], [ 0.8938547486033519, "#fea5fd" ], [ 0.9832402234636871, "#febefe" ], [ 1, "#fec3fe" ] ], "sequentialminus": [ [ 0, "#0508b8" ], [ 0.0893854748603352, "#1910d8" ], [ 0.1787709497206704, "#3c19f0" ], [ 0.2681564245810056, "#6b1cfb" ], [ 0.3575418994413408, "#981cfd" ], [ 0.44692737430167595, "#bf1cfd" ], [ 0.5363128491620112, "#dd2bfd" ], [ 0.6256983240223464, "#f246fe" ], [ 0.7150837988826816, "#fc67fd" ], [ 0.8044692737430168, "#fe88fc" ], [ 0.8938547486033519, "#fea5fd" ], [ 0.9832402234636871, "#febefe" ], [ 1, "#fec3fe" ] ] }, "plot_bgcolor": "white", "paper_bgcolor": "white", "shapedefaults": { "line": { "width": 0 }, "opacity": 0.4, "fillcolor": "#506784" }, "annotationdefaults": { "arrowhead": 0, "arrowcolor": "#506784", "arrowwidth": 1 } }, "themeRef": "PLOTLY_WHITE" }, "hovermode": "closest", "hoverlabel": { "font": { "family": "Roboto" } } } }, "height": 450, "width": 600, "user": { "profile_url": "https://chart-studio.plotly.com/~clinhares", "avatar_url": "https://storage.googleapis.com/plotly-prod-profiles/42.jpg", "background_url": "https://storage.googleapis.com/plotly-prod-profiles/bg-6.jpg", "bio": "", "nickname": "", "website": "", "stream_tokens": null, "feature_set_id": null, "csrf_token": null, "date_joined": "2024-04-22 17:32:30", "mapbox_access_tokens": null, "has_password": null, "username": "clinhares", "email": null, "is_active": null, "readonly": null, "is_dash_creator": null, "dash_created_count": null, "is_chart_creator": null, "charts_created_count": null } } ] }
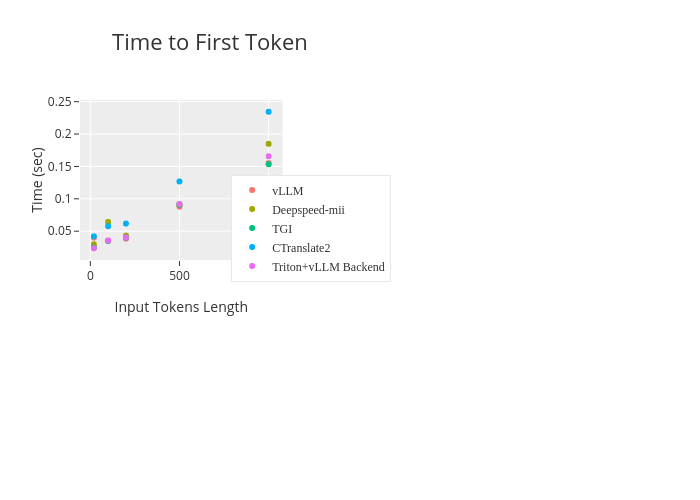