Plots List
Plots
This endpoint handles manipulation of Plotly plot files.
Reference
Authorization
Any user with or without a Plotly account may view public plots. For private plots, see authentication.
Actions
list
Listing all public plots can be done via a GET request to this endpoint.
By default, plots will be listed in order of date created. The order_by
query parameter is accepted at this endpoint. Currently, only ordering by
views is supported. It is possible to filter the plots by quality
with min_quality or max_quality as query parameter.
Example:
// GET https://api.plotly.com/v2/plots/ ---> 200

// GET https://api.plotly.com/v2/plots/?order_by=-views ---> 200

// GET https://api.plotly.com/v2/plots/?min_quality=5 ---> 200

// GET https://api.plotly.com/v2/plots/?max_quality=5 ---> 200
feed
Listing all handpicked feed plots can be done via a GET request to this endpoint. By default, plots will be listed in a random order.
Example:
// GET https://api.plotly.com/v2/plots/feed ---> 200
create
You can create new plot resources here. The only required field is 'figure'. Currently, the figure is restricted to only contain references to grid data. That is, this will fail if raw data arrays are passed in. To create and manipulate underlying grids for plots, see the grids endpoint.
Example:
// This fails because a figure field is required.
// POST https://api.plotly.com/v2/plots ---> 400 Bad Request
{}

// This fails because the figure has raw data
//POST https://api.plotly.com/v2/plots ---> 400 Bad Request
{
    "figure": {"data": [{"y": ['this', 'is', 'raw', 'data']}]}
}

// This succeeds because the figure has src keys, not raw data.
//POST https://api.plotly.com/v2/plots ---> 200 OK
{
    "figure": {"data": [{"ysrc": "sven:88:u8nd62"}]}
}
When creating a grid, you can optionally specify a source_fid to specify where a plot has come from:
- source_fid: the fid of a plot that was copied (and presumably edited) to produce this one
detail
There is a lot of meta information stored about plot files including filename, title, share_url, and content_url to name a few.
This information can only be reached with a GET to this endpoint.
Example:
// GET https://api.plotly.com/v2/plots/iheartgraphs:90
content
The contents of a plot can be downloaded via the content resource. The plot
content contains referenced grid/column data by default. If you wish to
return the raw grid/column data, the inline_data=true query must be included
in the request url. The Content-Type header will be appropriately set for the
response body.
Alternatively, you can set ?map_data=unreadable to append a mapping of
sources to data that belongs to grids which are unreadable for the
requestor. This is useful when you have read access to another users plot,
but that plot contains grid references which you don't have access to.
Examples:
// Returns referenced grid/column data
// GET https://api.plotly.com/v2/plots/iheartgraphs:90/content ---> 200 OK

// Returns full grid/column data
// GET https://api.plotly.com/v2/plots/iheartgraphs:90/content?inline_data=true ---> 200 OK

// Returns full grid/column data when requestor doesn't have permission
// to read the referenced grid.
// GET https://api.plotly.com/v2/plots/iheartgraphs:90/content?map_data=unreadable ---> 200 OK
GET /v2/plots/?cursor=cD0yMDI1LTA3LTE5KzE2JTNBMzclM0E1NC4yODU2NjYlMkIwMCUzQTAw&format=api
{ "next": "https://api.plot.ly/v2/plots/?cursor=cD0yMDI1LTA3LTE5KzExJTNBMTMlM0EzNS44NzM3MjklMkIwMCUzQTAw&format=api", "previous": "https://api.plot.ly/v2/plots/?cursor=cj0xJnA9MjAyNS0wNy0xOSsxNiUzQTMwJTNBMzguODY2MjcwJTJCMDAlM0EwMA%3D%3D&format=api", "results": [ { "creation_time": "2025-07-19T16:30:38.866270Z", "comments": { "results": [], "count": 0 }, "parented": true, "embed_url": "https://chart-studio.plotly.com/~raf99/21.embed", "fid": "raf99:21", "filename": "Plot 21", "filetype": "plot", "img_url": "https://storage.googleapis.com/plotly-prod-images/raf99/21/9_2AA3L3KS8QL65JSVVTVQVEU2Z3A39X.png", "image_urls": { "default": "https://storage.googleapis.com/plotly-prod-images/raf99/21/2_09CT9WSJ5LQ6I4RO6KQG4I3YBNBCUJ.png", "block-thumb": "https://storage.googleapis.com/plotly-prod-images/raf99/21/8_8S034QL9969BX2FBEKJH3463RXHJLG.png", "list-thumb": "https://storage.googleapis.com/plotly-prod-images/raf99/21/9_2AA3L3KS8QL65JSVVTVQVEU2Z3A39X.png" }, "api_urls": { "files": "https://api.plotly.com/v2/files/raf99:21", "plots": "https://api.plotly.com/v2/plots/raf99:21", "parent": "https://api.plotly.com/v2/folders/home?user=raf99" }, "owner": "raf99", "parent": -1, "preview": "", "referencers": [], "references": [], "title": "", "views": 0, "web_url": "https://chart-studio.plotly.com/~raf99/21/", "world_readable": true, "date_modified": "2025-07-19T16:30:38.876Z", "stars": { "results": [], "count": 0 }, "collaborators": { "results": [], "count": 0 }, "subfolder_count": null, "refresh_interval": null, "organize_view_url": "https://chart-studio.plotly.com/~raf99/21/", "current_user_permission": "read", "is_theme": null, "is_template": false, "autosize": true, "caption": "", "figure": { "data": [ { "meta": { "columnNames": { "x": "time", "y": "dco %" } }, "mode": "lines", "type": "scatter", "xsrc": "raf99:20:6f6b8c", "ysrc": "raf99:20:a42baf" } ], "frames": [], "layout": { "xaxis": { "type": "linear", "range": [ 0, 35 ], "title": { "text": "Time (MIN)" }, "autorange": true }, "yaxis": { "type": "linear", "range": [ -5.485555555555555, 104.22555555555554 ], "title": { "text": "DCO (%)" }, "autorange": true }, "autosize": true, "template": { "data": { "bar": [ { "type": "bar", "marker": { "colorbar": { "ticks": "", "outlinewidth": 0 } } } ], "table": [ { "type": "table", "cells": { "fill": { "color": "#EBF0F8" }, "line": { "color": "white" } }, "header": { "fill": { "color": "#C8D4E3" }, "line": { "color": "white" } } } ], "carpet": [ { "type": "carpet", "aaxis": { "gridcolor": "#C8D4E3", "linecolor": "#C8D4E3", "endlinecolor": "#2a3f5f", "minorgridcolor": "#C8D4E3", "startlinecolor": "#2a3f5f" }, "baxis": { "gridcolor": "#C8D4E3", "linecolor": "#C8D4E3", "endlinecolor": "#2a3f5f", "minorgridcolor": "#C8D4E3", "startlinecolor": "#2a3f5f" } } ], "mesh3d": [ { "type": "mesh3d", "colorbar": { "ticks": "", "outlinewidth": 0 } } ], "contour": [ { "type": "contour", "colorbar": { "ticks": "", "outlinewidth": 0 }, "autocolorscale": true } ], "heatmap": [ { "type": "heatmap", "colorbar": { "ticks": "", "outlinewidth": 0 }, "autocolorscale": true } ], "scatter": [ { "type": "scatter", "marker": { "colorbar": { "ticks": "", "outlinewidth": 0 } } } ], "surface": [ { "type": "surface", "colorbar": { "ticks": "", "outlinewidth": 0 } } ], "heatmapgl": [ { "type": "heatmapgl", "colorbar": { "ticks": "", "outlinewidth": 0 } } ], "histogram": [ { "type": "histogram", "marker": { "colorbar": { "ticks": "", "outlinewidth": 0 } } } ], "parcoords": [ { "line": { "colorbar": { "ticks": "", "outlinewidth": 0 } }, "type": "parcoords" } ], "scatter3d": [ { "type": "scatter3d", "marker": { "colorbar": { "ticks": "", "outlinewidth": 0 } } } ], "scattergl": [ { "type": "scattergl", "marker": { "colorbar": { "ticks": "", "outlinewidth": 0 } } } ], "choropleth": [ { "type": "choropleth", "colorbar": { "ticks": "", "outlinewidth": 0 } } ], "scattergeo": [ { "type": "scattergeo", "marker": { "colorbar": { "ticks": "", "outlinewidth": 0 } } } ], "histogram2d": [ { "type": "histogram2d", "colorbar": { "ticks": "", "outlinewidth": 0 }, "autocolorscale": true } ], "scatterpolar": [ { "type": "scatterpolar", "marker": { "colorbar": { "ticks": "", "outlinewidth": 0 } } } ], "contourcarpet": [ { "type": "contourcarpet", "colorbar": { "ticks": "", "outlinewidth": 0 } } ], "scattercarpet": [ { "type": "scattercarpet", "marker": { "colorbar": { "ticks": "", "outlinewidth": 0 } } } ], "scattermapbox": [ { "type": "scattermapbox", "marker": { "colorbar": { "ticks": "", "outlinewidth": 0 } } } ], "scatterpolargl": [ { "type": "scatterpolargl", "marker": { "colorbar": { "ticks": "", "outlinewidth": 0 } } } ], "scatterternary": [ { "type": "scatterternary", "marker": { "colorbar": { "ticks": "", "outlinewidth": 0 } } } ], "histogram2dcontour": [ { "type": "histogram2dcontour", "colorbar": { "ticks": "", "outlinewidth": 0 }, "autocolorscale": true } ] }, "layout": { "geo": { "bgcolor": "white", "showland": true, "lakecolor": "white", "landcolor": "white", "showlakes": true, "subunitcolor": "#C8D4E3" }, "font": { "color": "#2a3f5f" }, "polar": { "bgcolor": "white", "radialaxis": { "ticks": "", "gridcolor": "#EBF0F8", "linecolor": "#EBF0F8" }, "angularaxis": { "ticks": "", "gridcolor": "#EBF0F8", "linecolor": "#EBF0F8" } }, "scene": { "xaxis": { "ticks": "", "gridcolor": "#DFE8F3", "gridwidth": 2, "linecolor": "#EBF0F8", "zerolinecolor": "#EBF0F8", "showbackground": true, "backgroundcolor": "white" }, "yaxis": { "ticks": "", "gridcolor": "#DFE8F3", "gridwidth": 2, "linecolor": "#EBF0F8", "zerolinecolor": "#EBF0F8", "showbackground": true, "backgroundcolor": "white" }, "zaxis": { "ticks": "", "gridcolor": "#DFE8F3", "gridwidth": 2, "linecolor": "#EBF0F8", "zerolinecolor": "#EBF0F8", "showbackground": true, "backgroundcolor": "white" } }, "title": { "x": 0.05 }, "xaxis": { "ticks": "", "gridcolor": "#EBF0F8", "linecolor": "#EBF0F8", "automargin": true, "zerolinecolor": "#EBF0F8", "zerolinewidth": 2 }, "yaxis": { "ticks": "", "gridcolor": "#EBF0F8", "linecolor": "#EBF0F8", "automargin": true, "zerolinecolor": "#EBF0F8", "zerolinewidth": 2 }, "ternary": { "aaxis": { "ticks": "", "gridcolor": "#DFE8F3", "linecolor": "#A2B1C6" }, "baxis": { "ticks": "", "gridcolor": "#DFE8F3", "linecolor": "#A2B1C6" }, "caxis": { "ticks": "", "gridcolor": "#DFE8F3", "linecolor": "#A2B1C6" }, "bgcolor": "white" }, "colorway": [ "#636efa", "#EF553B", "#00cc96", "#ab63fa", "#19d3f3", "#e763fa", "#fecb52", "#ffa15a", "#ff6692", "#b6e880" ], "hovermode": "closest", "colorscale": { "diverging": [ [ 0, "#8e0152" ], [ 0.1, "#c51b7d" ], [ 0.2, "#de77ae" ], [ 0.3, "#f1b6da" ], [ 0.4, "#fde0ef" ], [ 0.5, "#f7f7f7" ], [ 0.6, "#e6f5d0" ], [ 0.7, "#b8e186" ], [ 0.8, "#7fbc41" ], [ 0.9, "#4d9221" ], [ 1, "#276419" ] ], "sequential": [ [ 0, "#0508b8" ], [ 0.0893854748603352, "#1910d8" ], [ 0.1787709497206704, "#3c19f0" ], [ 0.2681564245810056, "#6b1cfb" ], [ 0.3575418994413408, "#981cfd" ], [ 0.44692737430167595, "#bf1cfd" ], [ 0.5363128491620112, "#dd2bfd" ], [ 0.6256983240223464, "#f246fe" ], [ 0.7150837988826816, "#fc67fd" ], [ 0.8044692737430168, "#fe88fc" ], [ 0.8938547486033519, "#fea5fd" ], [ 0.9832402234636871, "#febefe" ], [ 1, "#fec3fe" ] ], "sequentialminus": [ [ 0, "#0508b8" ], [ 0.0893854748603352, "#1910d8" ], [ 0.1787709497206704, "#3c19f0" ], [ 0.2681564245810056, "#6b1cfb" ], [ 0.3575418994413408, "#981cfd" ], [ 0.44692737430167595, "#bf1cfd" ], [ 0.5363128491620112, "#dd2bfd" ], [ 0.6256983240223464, "#f246fe" ], [ 0.7150837988826816, "#fc67fd" ], [ 0.8044692737430168, "#fe88fc" ], [ 0.8938547486033519, "#fea5fd" ], [ 0.9832402234636871, "#febefe" ], [ 1, "#fec3fe" ] ] }, "plot_bgcolor": "white", "paper_bgcolor": "white", "shapedefaults": { "line": { "width": 0 }, "opacity": 0.4, "fillcolor": "#506784" }, "annotationdefaults": { "arrowhead": 0, "arrowcolor": "#506784", "arrowwidth": 1 } }, "themeRef": "PLOTLY_WHITE" } } }, "height": null, "width": null, "user": { "profile_url": "https://chart-studio.plotly.com/~raf99", "avatar_url": "https://storage.googleapis.com/plotly-prod-profiles/96.jpg", "background_url": "https://storage.googleapis.com/plotly-prod-profiles/bg-6.jpg", "bio": "", "nickname": "", "website": "", "stream_tokens": null, "feature_set_id": null, "csrf_token": null, "date_joined": "2025-07-18 14:07:03", "mapbox_access_tokens": null, "has_password": null, "username": "raf99", "email": null, "is_active": null, "readonly": null, "is_dash_creator": null, "dash_created_count": null, "is_chart_creator": null, "charts_created_count": null } }, { "creation_time": "2025-07-19T16:11:34.347329Z", "comments": { "results": [], "count": 0 }, "parented": true, "embed_url": "https://chart-studio.plotly.com/~raf99/19.embed", "fid": "raf99:19", "filename": "Plot 19", "filetype": "plot", "img_url": "https://storage.googleapis.com/plotly-prod-images/raf99/19/9_DM3H4Z7W015OYZZLLLC3R4WSFSAPBG.png", "image_urls": { "default": "https://storage.googleapis.com/plotly-prod-images/raf99/19/2_TNFURWQNU3P1OT5S01CDKBBMU0ZTA7.png", "block-thumb": "https://storage.googleapis.com/plotly-prod-images/raf99/19/8_9JF2F45UDRZKS9IKI8ZMUZ9JEKKGCQ.png", "list-thumb": "https://storage.googleapis.com/plotly-prod-images/raf99/19/9_DM3H4Z7W015OYZZLLLC3R4WSFSAPBG.png" }, "api_urls": { "files": "https://api.plotly.com/v2/files/raf99:19", "plots": "https://api.plotly.com/v2/plots/raf99:19", "parent": "https://api.plotly.com/v2/folders/home?user=raf99" }, "owner": "raf99", "parent": -1, "preview": "", "referencers": [], "references": [], "title": "", "views": 0, "web_url": "https://chart-studio.plotly.com/~raf99/19/", "world_readable": true, "date_modified": "2025-07-19T16:11:34.358Z", "stars": { "results": [], "count": 0 }, "collaborators": { "results": [], "count": 0 }, "subfolder_count": null, "refresh_interval": null, "organize_view_url": "https://chart-studio.plotly.com/~raf99/19/", "current_user_permission": "read", "is_theme": null, "is_template": false, "autosize": true, "caption": "", "figure": { "data": [ { "meta": { "columnNames": { "x": "time min", "y": "na2so4 wh" } }, "mode": "lines", "name": "Na2So4", "type": "scatter", "xsrc": "raf99:18:48a76b", "ysrc": "raf99:18:c7c82d" }, { "meta": { "columnNames": { "x": "time min", "y": "nacl wh" } }, "mode": "lines", "name": "NaCl", "type": "scatter", "xsrc": "raf99:18:48a76b", "ysrc": "raf99:18:34908e", "stackgroup": null } ], "frames": [], "layout": { "xaxis": { "type": "linear", "range": [ 0, 120 ], "title": { "text": "Time (MIN)" }, "autorange": true }, "yaxis": { "type": "linear", "range": [ -0.6955555555555555, 13.215555555555556 ], "title": { "text": "consumed energy (WH)" }, "autorange": true }, "autosize": true, "template": { "data": { "bar": [ { "type": "bar", "marker": { "colorbar": { "ticks": "", "outlinewidth": 0 } } } ], "table": [ { "type": "table", "cells": { "fill": { "color": "#EBF0F8" }, "line": { "color": "white" } }, "header": { "fill": { "color": "#C8D4E3" }, "line": { "color": "white" } } } ], "carpet": [ { "type": "carpet", "aaxis": { "gridcolor": "#C8D4E3", "linecolor": "#C8D4E3", "endlinecolor": "#2a3f5f", "minorgridcolor": "#C8D4E3", "startlinecolor": "#2a3f5f" }, "baxis": { "gridcolor": "#C8D4E3", "linecolor": "#C8D4E3", "endlinecolor": "#2a3f5f", "minorgridcolor": "#C8D4E3", "startlinecolor": "#2a3f5f" } } ], "mesh3d": [ { "type": "mesh3d", "colorbar": { "ticks": "", "outlinewidth": 0 } } ], "contour": [ { "type": "contour", "colorbar": { "ticks": "", "outlinewidth": 0 }, "autocolorscale": true } ], "heatmap": [ { "type": "heatmap", "colorbar": { "ticks": "", "outlinewidth": 0 }, "autocolorscale": true } ], "scatter": [ { "type": "scatter", "marker": { "colorbar": { "ticks": "", "outlinewidth": 0 } } } ], "surface": [ { "type": "surface", "colorbar": { "ticks": "", "outlinewidth": 0 } } ], "heatmapgl": [ { "type": "heatmapgl", "colorbar": { "ticks": "", "outlinewidth": 0 } } ], "histogram": [ { "type": "histogram", "marker": { "colorbar": { "ticks": "", "outlinewidth": 0 } } } ], "parcoords": [ { "line": { "colorbar": { "ticks": "", "outlinewidth": 0 } }, "type": "parcoords" } ], "scatter3d": [ { "type": "scatter3d", "marker": { "colorbar": { "ticks": "", "outlinewidth": 0 } } } ], "scattergl": [ { "type": "scattergl", "marker": { "colorbar": { "ticks": "", "outlinewidth": 0 } } } ], "choropleth": [ { "type": "choropleth", "colorbar": { "ticks": "", "outlinewidth": 0 } } ], "scattergeo": [ { "type": "scattergeo", "marker": { "colorbar": { "ticks": "", "outlinewidth": 0 } } } ], "histogram2d": [ { "type": "histogram2d", "colorbar": { "ticks": "", "outlinewidth": 0 }, "autocolorscale": true } ], "scatterpolar": [ { "type": "scatterpolar", "marker": { "colorbar": { "ticks": "", "outlinewidth": 0 } } } ], "contourcarpet": [ { "type": "contourcarpet", "colorbar": { "ticks": "", "outlinewidth": 0 } } ], "scattercarpet": [ { "type": "scattercarpet", "marker": { "colorbar": { "ticks": "", "outlinewidth": 0 } } } ], "scattermapbox": [ { "type": "scattermapbox", "marker": { "colorbar": { "ticks": "", "outlinewidth": 0 } } } ], "scatterpolargl": [ { "type": "scatterpolargl", "marker": { "colorbar": { "ticks": "", "outlinewidth": 0 } } } ], "scatterternary": [ { "type": "scatterternary", "marker": { "colorbar": { "ticks": "", "outlinewidth": 0 } } } ], "histogram2dcontour": [ { "type": "histogram2dcontour", "colorbar": { "ticks": "", "outlinewidth": 0 }, "autocolorscale": true } ] }, "layout": { "geo": { "bgcolor": "white", "showland": true, "lakecolor": "white", "landcolor": "white", "showlakes": true, "subunitcolor": "#C8D4E3" }, "font": { "color": "#2a3f5f" }, "polar": { "bgcolor": "white", "radialaxis": { "ticks": "", "gridcolor": "#EBF0F8", "linecolor": "#EBF0F8" }, "angularaxis": { "ticks": "", "gridcolor": "#EBF0F8", "linecolor": "#EBF0F8" } }, "scene": { "xaxis": { "ticks": "", "gridcolor": "#DFE8F3", "gridwidth": 2, "linecolor": "#EBF0F8", "zerolinecolor": "#EBF0F8", "showbackground": true, "backgroundcolor": "white" }, "yaxis": { "ticks": "", "gridcolor": "#DFE8F3", "gridwidth": 2, "linecolor": "#EBF0F8", "zerolinecolor": "#EBF0F8", "showbackground": true, "backgroundcolor": "white" }, "zaxis": { "ticks": "", "gridcolor": "#DFE8F3", "gridwidth": 2, "linecolor": "#EBF0F8", "zerolinecolor": "#EBF0F8", "showbackground": true, "backgroundcolor": "white" } }, "title": { "x": 0.05 }, "xaxis": { "ticks": "", "gridcolor": "#EBF0F8", "linecolor": "#EBF0F8", "automargin": true, "zerolinecolor": "#EBF0F8", "zerolinewidth": 2 }, "yaxis": { "ticks": "", "gridcolor": "#EBF0F8", "linecolor": "#EBF0F8", "automargin": true, "zerolinecolor": "#EBF0F8", "zerolinewidth": 2 }, "ternary": { "aaxis": { "ticks": "", "gridcolor": "#DFE8F3", "linecolor": "#A2B1C6" }, "baxis": { "ticks": "", "gridcolor": "#DFE8F3", "linecolor": "#A2B1C6" }, "caxis": { "ticks": "", "gridcolor": "#DFE8F3", "linecolor": "#A2B1C6" }, "bgcolor": "white" }, "colorway": [ "#636efa", "#EF553B", "#00cc96", "#ab63fa", "#19d3f3", "#e763fa", "#fecb52", "#ffa15a", "#ff6692", "#b6e880" ], "hovermode": "closest", "colorscale": { "diverging": [ [ 0, "#8e0152" ], [ 0.1, "#c51b7d" ], [ 0.2, "#de77ae" ], [ 0.3, "#f1b6da" ], [ 0.4, "#fde0ef" ], [ 0.5, "#f7f7f7" ], [ 0.6, "#e6f5d0" ], [ 0.7, "#b8e186" ], [ 0.8, "#7fbc41" ], [ 0.9, "#4d9221" ], [ 1, "#276419" ] ], "sequential": [ [ 0, "#0508b8" ], [ 0.0893854748603352, "#1910d8" ], [ 0.1787709497206704, "#3c19f0" ], [ 0.2681564245810056, "#6b1cfb" ], [ 0.3575418994413408, "#981cfd" ], [ 0.44692737430167595, "#bf1cfd" ], [ 0.5363128491620112, "#dd2bfd" ], [ 0.6256983240223464, "#f246fe" ], [ 0.7150837988826816, "#fc67fd" ], [ 0.8044692737430168, "#fe88fc" ], [ 0.8938547486033519, "#fea5fd" ], [ 0.9832402234636871, "#febefe" ], [ 1, "#fec3fe" ] ], "sequentialminus": [ [ 0, "#0508b8" ], [ 0.0893854748603352, "#1910d8" ], [ 0.1787709497206704, "#3c19f0" ], [ 0.2681564245810056, "#6b1cfb" ], [ 0.3575418994413408, "#981cfd" ], [ 0.44692737430167595, "#bf1cfd" ], [ 0.5363128491620112, "#dd2bfd" ], [ 0.6256983240223464, "#f246fe" ], [ 0.7150837988826816, "#fc67fd" ], [ 0.8044692737430168, "#fe88fc" ], [ 0.8938547486033519, "#fea5fd" ], [ 0.9832402234636871, "#febefe" ], [ 1, "#fec3fe" ] ] }, "plot_bgcolor": "white", "paper_bgcolor": "white", "shapedefaults": { "line": { "width": 0 }, "opacity": 0.4, "fillcolor": "#506784" }, "annotationdefaults": { "arrowhead": 0, "arrowcolor": "#506784", "arrowwidth": 1 } }, "themeRef": "PLOTLY_WHITE" } } }, "height": null, "width": null, "user": { "profile_url": "https://chart-studio.plotly.com/~raf99", "avatar_url": "https://storage.googleapis.com/plotly-prod-profiles/96.jpg", "background_url": "https://storage.googleapis.com/plotly-prod-profiles/bg-6.jpg", "bio": "", "nickname": "", "website": "", "stream_tokens": null, "feature_set_id": null, "csrf_token": null, "date_joined": "2025-07-18 14:07:03", "mapbox_access_tokens": null, "has_password": null, "username": "raf99", "email": null, "is_active": null, "readonly": null, "is_dash_creator": null, "dash_created_count": null, "is_chart_creator": null, "charts_created_count": null } }, { "creation_time": "2025-07-19T16:00:59.344667Z", "comments": { "results": [], "count": 0 }, "parented": true, "embed_url": "https://chart-studio.plotly.com/~raf99/17.embed", "fid": "raf99:17", "filename": "Plot 17", "filetype": "plot", "img_url": "https://storage.googleapis.com/plotly-prod-images/raf99/17/9_IVK2AFL1P9Y2BKRGG8FLY40FL114LL.png", "image_urls": { "default": "https://storage.googleapis.com/plotly-prod-images/raf99/17/2_6TUQ91SGS3BX9XCZ1T30VTQQ8TAFLG.png", "block-thumb": "https://storage.googleapis.com/plotly-prod-images/raf99/17/8_CLVLJWD76O57FYQ7NMR8VL0ECW8RKW.png", "list-thumb": "https://storage.googleapis.com/plotly-prod-images/raf99/17/9_IVK2AFL1P9Y2BKRGG8FLY40FL114LL.png" }, "api_urls": { "files": "https://api.plotly.com/v2/files/raf99:17", "plots": "https://api.plotly.com/v2/plots/raf99:17", "parent": "https://api.plotly.com/v2/folders/home?user=raf99" }, "owner": "raf99", "parent": -1, "preview": "", "referencers": [], "references": [], "title": "", "views": 1, "web_url": "https://chart-studio.plotly.com/~raf99/17/", "world_readable": true, "date_modified": "2025-07-19T16:00:59.355Z", "stars": { "results": [], "count": 0 }, "collaborators": { "results": [], "count": 0 }, "subfolder_count": null, "refresh_interval": null, "organize_view_url": "https://chart-studio.plotly.com/~raf99/17/", "current_user_permission": "read", "is_theme": null, "is_template": false, "autosize": true, "caption": "", "figure": { "data": [ { "meta": { "columnNames": { "x": "time MIN", "y": "na2so4 WH" } }, "mode": "lines", "name": "Na2So4", "type": "scatter", "xsrc": "raf99:16:602eed", "ysrc": "raf99:16:3243f2", "visible": true }, { "meta": { "columnNames": { "x": "time MIN", "y": "nacl WH" } }, "mode": "lines", "name": "NaCl", "type": "scatter", "xsrc": "raf99:16:602eed", "ysrc": "raf99:16:cd2d0c", "stackgroup": null } ], "frames": [], "layout": { "xaxis": { "type": "linear", "range": [ 0, 120 ], "title": { "text": "Time (Min)" }, "autorange": true }, "yaxis": { "type": "linear", "range": [ 0.011111111111111113, 1.7888888888888888 ], "title": { "text": "Turbidity (NTU)" }, "autorange": true }, "autosize": true, "template": { "data": { "bar": [ { "type": "bar", "marker": { "colorbar": { "ticks": "", "outlinewidth": 0 } } } ], "table": [ { "type": "table", "cells": { "fill": { "color": "#EBF0F8" }, "line": { "color": "white" } }, "header": { "fill": { "color": "#C8D4E3" }, "line": { "color": "white" } } } ], "carpet": [ { "type": "carpet", "aaxis": { "gridcolor": "#C8D4E3", "linecolor": "#C8D4E3", "endlinecolor": "#2a3f5f", "minorgridcolor": "#C8D4E3", "startlinecolor": "#2a3f5f" }, "baxis": { "gridcolor": "#C8D4E3", "linecolor": "#C8D4E3", "endlinecolor": "#2a3f5f", "minorgridcolor": "#C8D4E3", "startlinecolor": "#2a3f5f" } } ], "mesh3d": [ { "type": "mesh3d", "colorbar": { "ticks": "", "outlinewidth": 0 } } ], "contour": [ { "type": "contour", "colorbar": { "ticks": "", "outlinewidth": 0 }, "autocolorscale": true } ], "heatmap": [ { "type": "heatmap", "colorbar": { "ticks": "", "outlinewidth": 0 }, "autocolorscale": true } ], "scatter": [ { "type": "scatter", "marker": { "colorbar": { "ticks": "", "outlinewidth": 0 } } } ], "surface": [ { "type": "surface", "colorbar": { "ticks": "", "outlinewidth": 0 } } ], "heatmapgl": [ { "type": "heatmapgl", "colorbar": { "ticks": "", "outlinewidth": 0 } } ], "histogram": [ { "type": "histogram", "marker": { "colorbar": { "ticks": "", "outlinewidth": 0 } } } ], "parcoords": [ { "line": { "colorbar": { "ticks": "", "outlinewidth": 0 } }, "type": "parcoords" } ], "scatter3d": [ { "type": "scatter3d", "marker": { "colorbar": { "ticks": "", "outlinewidth": 0 } } } ], "scattergl": [ { "type": "scattergl", "marker": { "colorbar": { "ticks": "", "outlinewidth": 0 } } } ], "choropleth": [ { "type": "choropleth", "colorbar": { "ticks": "", "outlinewidth": 0 } } ], "scattergeo": [ { "type": "scattergeo", "marker": { "colorbar": { "ticks": "", "outlinewidth": 0 } } } ], "histogram2d": [ { "type": "histogram2d", "colorbar": { "ticks": "", "outlinewidth": 0 }, "autocolorscale": true } ], "scatterpolar": [ { "type": "scatterpolar", "marker": { "colorbar": { "ticks": "", "outlinewidth": 0 } } } ], "contourcarpet": [ { "type": "contourcarpet", "colorbar": { "ticks": "", "outlinewidth": 0 } } ], "scattercarpet": [ { "type": "scattercarpet", "marker": { "colorbar": { "ticks": "", "outlinewidth": 0 } } } ], "scattermapbox": [ { "type": "scattermapbox", "marker": { "colorbar": { "ticks": "", "outlinewidth": 0 } } } ], "scatterpolargl": [ { "type": "scatterpolargl", "marker": { "colorbar": { "ticks": "", "outlinewidth": 0 } } } ], "scatterternary": [ { "type": "scatterternary", "marker": { "colorbar": { "ticks": "", "outlinewidth": 0 } } } ], "histogram2dcontour": [ { "type": "histogram2dcontour", "colorbar": { "ticks": "", "outlinewidth": 0 }, "autocolorscale": true } ] }, "layout": { "geo": { "bgcolor": "white", "showland": true, "lakecolor": "white", "landcolor": "white", "showlakes": true, "subunitcolor": "#C8D4E3" }, "font": { "color": "#2a3f5f" }, "polar": { "bgcolor": "white", "radialaxis": { "ticks": "", "gridcolor": "#EBF0F8", "linecolor": "#EBF0F8" }, "angularaxis": { "ticks": "", "gridcolor": "#EBF0F8", "linecolor": "#EBF0F8" } }, "scene": { "xaxis": { "ticks": "", "gridcolor": "#DFE8F3", "gridwidth": 2, "linecolor": "#EBF0F8", "zerolinecolor": "#EBF0F8", "showbackground": true, "backgroundcolor": "white" }, "yaxis": { "ticks": "", "gridcolor": "#DFE8F3", "gridwidth": 2, "linecolor": "#EBF0F8", "zerolinecolor": "#EBF0F8", "showbackground": true, "backgroundcolor": "white" }, "zaxis": { "ticks": "", "gridcolor": "#DFE8F3", "gridwidth": 2, "linecolor": "#EBF0F8", "zerolinecolor": "#EBF0F8", "showbackground": true, "backgroundcolor": "white" } }, "title": { "x": 0.05 }, "xaxis": { "ticks": "", "gridcolor": "#EBF0F8", "linecolor": "#EBF0F8", "automargin": true, "zerolinecolor": "#EBF0F8", "zerolinewidth": 2 }, "yaxis": { "ticks": "", "gridcolor": "#EBF0F8", "linecolor": "#EBF0F8", "automargin": true, "zerolinecolor": "#EBF0F8", "zerolinewidth": 2 }, "ternary": { "aaxis": { "ticks": "", "gridcolor": "#DFE8F3", "linecolor": "#A2B1C6" }, "baxis": { "ticks": "", "gridcolor": "#DFE8F3", "linecolor": "#A2B1C6" }, "caxis": { "ticks": "", "gridcolor": "#DFE8F3", "linecolor": "#A2B1C6" }, "bgcolor": "white" }, "colorway": [ "#636efa", "#EF553B", "#00cc96", "#ab63fa", "#19d3f3", "#e763fa", "#fecb52", "#ffa15a", "#ff6692", "#b6e880" ], "hovermode": "closest", "colorscale": { "diverging": [ [ 0, "#8e0152" ], [ 0.1, "#c51b7d" ], [ 0.2, "#de77ae" ], [ 0.3, "#f1b6da" ], [ 0.4, "#fde0ef" ], [ 0.5, "#f7f7f7" ], [ 0.6, "#e6f5d0" ], [ 0.7, "#b8e186" ], [ 0.8, "#7fbc41" ], [ 0.9, "#4d9221" ], [ 1, "#276419" ] ], "sequential": [ [ 0, "#0508b8" ], [ 0.0893854748603352, "#1910d8" ], [ 0.1787709497206704, "#3c19f0" ], [ 0.2681564245810056, "#6b1cfb" ], [ 0.3575418994413408, "#981cfd" ], [ 0.44692737430167595, "#bf1cfd" ], [ 0.5363128491620112, "#dd2bfd" ], [ 0.6256983240223464, "#f246fe" ], [ 0.7150837988826816, "#fc67fd" ], [ 0.8044692737430168, "#fe88fc" ], [ 0.8938547486033519, "#fea5fd" ], [ 0.9832402234636871, "#febefe" ], [ 1, "#fec3fe" ] ], "sequentialminus": [ [ 0, "#0508b8" ], [ 0.0893854748603352, "#1910d8" ], [ 0.1787709497206704, "#3c19f0" ], [ 0.2681564245810056, "#6b1cfb" ], [ 0.3575418994413408, "#981cfd" ], [ 0.44692737430167595, "#bf1cfd" ], [ 0.5363128491620112, "#dd2bfd" ], [ 0.6256983240223464, "#f246fe" ], [ 0.7150837988826816, "#fc67fd" ], [ 0.8044692737430168, "#fe88fc" ], [ 0.8938547486033519, "#fea5fd" ], [ 0.9832402234636871, "#febefe" ], [ 1, "#fec3fe" ] ] }, "plot_bgcolor": "white", "paper_bgcolor": "white", "shapedefaults": { "line": { "width": 0 }, "opacity": 0.4, "fillcolor": "#506784" }, "annotationdefaults": { "arrowhead": 0, "arrowcolor": "#506784", "arrowwidth": 1 } }, "themeRef": "PLOTLY_WHITE" } } }, "height": null, "width": null, "user": { "profile_url": "https://chart-studio.plotly.com/~raf99", "avatar_url": "https://storage.googleapis.com/plotly-prod-profiles/96.jpg", "background_url": "https://storage.googleapis.com/plotly-prod-profiles/bg-6.jpg", "bio": "", "nickname": "", "website": "", "stream_tokens": null, "feature_set_id": null, "csrf_token": null, "date_joined": "2025-07-18 14:07:03", "mapbox_access_tokens": null, "has_password": null, "username": "raf99", "email": null, "is_active": null, "readonly": null, "is_dash_creator": null, "dash_created_count": null, "is_chart_creator": null, "charts_created_count": null } }, { "creation_time": "2025-07-19T15:59:29.177122Z", "comments": { "results": [], "count": 0 }, "parented": true, "embed_url": "https://chart-studio.plotly.com/~marlonjr/19.embed", "fid": "marlonjr:19", "filename": "Plot 19", "filetype": "plot", "img_url": "https://storage.googleapis.com/plotly-prod-images/marlonjr/19/9_B9PU9ULA0SQE9568G8SJB7FPVL6V9O.png", "image_urls": { "default": "https://storage.googleapis.com/plotly-prod-images/marlonjr/19/2_RU756E1P4KV2R5UZ2X7MM787G4Y9IC.png", "block-thumb": "https://storage.googleapis.com/plotly-prod-images/marlonjr/19/8_286UZIULJJO0P2NWNHIYPOMRGJBC2Z.png", "list-thumb": "https://storage.googleapis.com/plotly-prod-images/marlonjr/19/9_B9PU9ULA0SQE9568G8SJB7FPVL6V9O.png" }, "api_urls": { "files": "https://api.plotly.com/v2/files/marlonjr:19", "plots": "https://api.plotly.com/v2/plots/marlonjr:19", "parent": "https://api.plotly.com/v2/folders/home?user=marlonjr" }, "owner": "marlonjr", "parent": -1, "preview": "", "referencers": [], "references": [], "title": "", "views": 0, "web_url": "https://chart-studio.plotly.com/~marlonjr/19/", "world_readable": true, "date_modified": "2025-07-19T15:59:29.190Z", "stars": { "results": [], "count": 0 }, "collaborators": { "results": [], "count": 0 }, "subfolder_count": null, "refresh_interval": null, "organize_view_url": "https://chart-studio.plotly.com/~marlonjr/19/", "current_user_permission": "read", "is_theme": null, "is_template": false, "autosize": true, "caption": "", "figure": { "data": [ { "meta": { "columnNames": { "x": "A", "y": "B" } }, "mode": "markers", "name": "160 ºC", "type": "scatter", "xsrc": "marlonjr:18:169eed", "ysrc": "marlonjr:18:e542f2", "marker": { "size": 4, "color": "rgb(8, 25, 248)" } }, { "meta": { "columnNames": { "x": "C", "y": "D" } }, "mode": "markers", "name": "120 ºC", "type": "scatter", "xsrc": "marlonjr:18:57e84b", "ysrc": "marlonjr:18:aa678b", "marker": { "size": 4, "color": "rgb(247, 69, 39)" }, "stackgroup": null }, { "meta": { "columnNames": { "x": "E", "y": "F" } }, "mode": "markers", "name": "200 ºC", "type": "scatter", "xsrc": "marlonjr:18:858d15", "ysrc": "marlonjr:18:da3e25", "marker": { "size": 4, "color": "rgb(255, 240, 0)" }, "stackgroup": null } ], "frames": [], "layout": { "xaxis": { "type": "linear", "dtick": 0.1, "range": [ 0, 0.9 ], "ticks": "inside", "title": { "font": { "size": 16, "family": "Times New Roman" }, "text": "Distance [m]" }, "mirror": "ticks", "showgrid": true, "showline": true, "tickmode": "linear", "autorange": false, "gridcolor": "rgb(235, 240, 240)", "linecolor": "rgb(2, 2, 2)" }, "yaxis": { "type": "linear", "dtick": 5, "range": [ -15, 25 ], "ticks": "inside", "title": { "font": { "size": 16, "family": "Balto" }, "text": "Temperature [ºC]" }, "mirror": "ticks", "showline": true, "tickmode": "linear", "autorange": false, "linecolor": "rgb(9, 9, 9)", "zerolinecolor": "rgb(4, 4, 4)", "zerolinewidth": 1 }, "legend": { "x": 0.8, "y": 0.9, "font": { "size": 14 } }, "autosize": true, "template": { "data": { "bar": [ { "type": "bar", "marker": { "colorbar": { "ticks": "", "outlinewidth": 0 } } } ], "table": [ { "type": "table", "cells": { "fill": { "color": "#EBF0F8" }, "line": { "color": "white" } }, "header": { "fill": { "color": "#C8D4E3" }, "line": { "color": "white" } } } ], "carpet": [ { "type": "carpet", "aaxis": { "gridcolor": "#C8D4E3", "linecolor": "#C8D4E3", "endlinecolor": "#2a3f5f", "minorgridcolor": "#C8D4E3", "startlinecolor": "#2a3f5f" }, "baxis": { "gridcolor": "#C8D4E3", "linecolor": "#C8D4E3", "endlinecolor": "#2a3f5f", "minorgridcolor": "#C8D4E3", "startlinecolor": "#2a3f5f" } } ], "mesh3d": [ { "type": "mesh3d", "colorbar": { "ticks": "", "outlinewidth": 0 } } ], "contour": [ { "type": "contour", "colorbar": { "ticks": "", "outlinewidth": 0 }, "autocolorscale": true } ], "heatmap": [ { "type": "heatmap", "colorbar": { "ticks": "", "outlinewidth": 0 }, "autocolorscale": true } ], "scatter": [ { "type": "scatter", "marker": { "colorbar": { "ticks": "", "outlinewidth": 0 } } } ], "surface": [ { "type": "surface", "colorbar": { "ticks": "", "outlinewidth": 0 } } ], "heatmapgl": [ { "type": "heatmapgl", "colorbar": { "ticks": "", "outlinewidth": 0 } } ], "histogram": [ { "type": "histogram", "marker": { "colorbar": { "ticks": "", "outlinewidth": 0 } } } ], "parcoords": [ { "line": { "colorbar": { "ticks": "", "outlinewidth": 0 } }, "type": "parcoords" } ], "scatter3d": [ { "type": "scatter3d", "marker": { "colorbar": { "ticks": "", "outlinewidth": 0 } } } ], "scattergl": [ { "type": "scattergl", "marker": { "colorbar": { "ticks": "", "outlinewidth": 0 } } } ], "choropleth": [ { "type": "choropleth", "colorbar": { "ticks": "", "outlinewidth": 0 } } ], "scattergeo": [ { "type": "scattergeo", "marker": { "colorbar": { "ticks": "", "outlinewidth": 0 } } } ], "histogram2d": [ { "type": "histogram2d", "colorbar": { "ticks": "", "outlinewidth": 0 }, "autocolorscale": true } ], "scatterpolar": [ { "type": "scatterpolar", "marker": { "colorbar": { "ticks": "", "outlinewidth": 0 } } } ], "contourcarpet": [ { "type": "contourcarpet", "colorbar": { "ticks": "", "outlinewidth": 0 } } ], "scattercarpet": [ { "type": "scattercarpet", "marker": { "colorbar": { "ticks": "", "outlinewidth": 0 } } } ], "scattermapbox": [ { "type": "scattermapbox", "marker": { "colorbar": { "ticks": "", "outlinewidth": 0 } } } ], "scatterpolargl": [ { "type": "scatterpolargl", "marker": { "colorbar": { "ticks": "", "outlinewidth": 0 } } } ], "scatterternary": [ { "type": "scatterternary", "marker": { "colorbar": { "ticks": "", "outlinewidth": 0 } } } ], "histogram2dcontour": [ { "type": "histogram2dcontour", "colorbar": { "ticks": "", "outlinewidth": 0 }, "autocolorscale": true } ] }, "layout": { "geo": { "bgcolor": "white", "showland": true, "lakecolor": "white", "landcolor": "white", "showlakes": true, "subunitcolor": "#C8D4E3" }, "font": { "color": "#2a3f5f" }, "polar": { "bgcolor": "white", "radialaxis": { "ticks": "", "gridcolor": "#EBF0F8", "linecolor": "#EBF0F8" }, "angularaxis": { "ticks": "", "gridcolor": "#EBF0F8", "linecolor": "#EBF0F8" } }, "scene": { "xaxis": { "ticks": "", "gridcolor": "#DFE8F3", "gridwidth": 2, "linecolor": "#EBF0F8", "zerolinecolor": "#EBF0F8", "showbackground": true, "backgroundcolor": "white" }, "yaxis": { "ticks": "", "gridcolor": "#DFE8F3", "gridwidth": 2, "linecolor": "#EBF0F8", "zerolinecolor": "#EBF0F8", "showbackground": true, "backgroundcolor": "white" }, "zaxis": { "ticks": "", "gridcolor": "#DFE8F3", "gridwidth": 2, "linecolor": "#EBF0F8", "zerolinecolor": "#EBF0F8", "showbackground": true, "backgroundcolor": "white" } }, "title": { "x": 0.05 }, "xaxis": { "ticks": "", "gridcolor": "#EBF0F8", "linecolor": "#EBF0F8", "automargin": true, "zerolinecolor": "#EBF0F8", "zerolinewidth": 2 }, "yaxis": { "ticks": "", "gridcolor": "#EBF0F8", "linecolor": "#EBF0F8", "automargin": true, "zerolinecolor": "#EBF0F8", "zerolinewidth": 2 }, "ternary": { "aaxis": { "ticks": "", "gridcolor": "#DFE8F3", "linecolor": "#A2B1C6" }, "baxis": { "ticks": "", "gridcolor": "#DFE8F3", "linecolor": "#A2B1C6" }, "caxis": { "ticks": "", "gridcolor": "#DFE8F3", "linecolor": "#A2B1C6" }, "bgcolor": "white" }, "colorway": [ "#636efa", "#EF553B", "#00cc96", "#ab63fa", "#19d3f3", "#e763fa", "#fecb52", "#ffa15a", "#ff6692", "#b6e880" ], "hovermode": "closest", "colorscale": { "diverging": [ [ 0, "#8e0152" ], [ 0.1, "#c51b7d" ], [ 0.2, "#de77ae" ], [ 0.3, "#f1b6da" ], [ 0.4, "#fde0ef" ], [ 0.5, "#f7f7f7" ], [ 0.6, "#e6f5d0" ], [ 0.7, "#b8e186" ], [ 0.8, "#7fbc41" ], [ 0.9, "#4d9221" ], [ 1, "#276419" ] ], "sequential": [ [ 0, "#0508b8" ], [ 0.0893854748603352, "#1910d8" ], [ 0.1787709497206704, "#3c19f0" ], [ 0.2681564245810056, "#6b1cfb" ], [ 0.3575418994413408, "#981cfd" ], [ 0.44692737430167595, "#bf1cfd" ], [ 0.5363128491620112, "#dd2bfd" ], [ 0.6256983240223464, "#f246fe" ], [ 0.7150837988826816, "#fc67fd" ], [ 0.8044692737430168, "#fe88fc" ], [ 0.8938547486033519, "#fea5fd" ], [ 0.9832402234636871, "#febefe" ], [ 1, "#fec3fe" ] ], "sequentialminus": [ [ 0, "#0508b8" ], [ 0.0893854748603352, "#1910d8" ], [ 0.1787709497206704, "#3c19f0" ], [ 0.2681564245810056, "#6b1cfb" ], [ 0.3575418994413408, "#981cfd" ], [ 0.44692737430167595, "#bf1cfd" ], [ 0.5363128491620112, "#dd2bfd" ], [ 0.6256983240223464, "#f246fe" ], [ 0.7150837988826816, "#fc67fd" ], [ 0.8044692737430168, "#fe88fc" ], [ 0.8938547486033519, "#fea5fd" ], [ 0.9832402234636871, "#febefe" ], [ 1, "#fec3fe" ] ] }, "plot_bgcolor": "white", "paper_bgcolor": "white", "shapedefaults": { "line": { "width": 0 }, "opacity": 0.4, "fillcolor": "#506784" }, "annotationdefaults": { "arrowhead": 0, "arrowcolor": "#506784", "arrowwidth": 1 } }, "themeRef": "PLOTLY_WHITE" } } }, "height": null, "width": null, "user": { "profile_url": "https://chart-studio.plotly.com/~marlonjr", "avatar_url": "https://storage.googleapis.com/plotly-prod-profiles/64.jpg", "background_url": "https://storage.googleapis.com/plotly-prod-profiles/bg-11.jpg", "bio": "", "nickname": "", "website": "", "stream_tokens": null, "feature_set_id": null, "csrf_token": null, "date_joined": "2025-04-03 18:25:38", "mapbox_access_tokens": null, "has_password": null, "username": "marlonjr", "email": null, "is_active": null, "readonly": null, "is_dash_creator": null, "dash_created_count": null, "is_chart_creator": null, "charts_created_count": null } }, { "creation_time": "2025-07-19T15:29:08.615669Z", "comments": { "results": [], "count": 0 }, "parented": true, "embed_url": "https://chart-studio.plotly.com/~marlonjr/17.embed", "fid": "marlonjr:17", "filename": "Plot 17", "filetype": "plot", "img_url": "https://storage.googleapis.com/plotly-prod-images/marlonjr/17/9_Z67TFM3DU2D3ERV02YDQQIY1GXLX73.png", "image_urls": { "default": "https://storage.googleapis.com/plotly-prod-images/marlonjr/17/2_F7X3BGD7E5X4N8RYBAM8JZZX3VPQGG.png", "block-thumb": "https://storage.googleapis.com/plotly-prod-images/marlonjr/17/8_KRCMECDD9DUAHOC165BCWW572SK8NV.png", "list-thumb": "https://storage.googleapis.com/plotly-prod-images/marlonjr/17/9_Z67TFM3DU2D3ERV02YDQQIY1GXLX73.png" }, "api_urls": { "files": "https://api.plotly.com/v2/files/marlonjr:17", "plots": "https://api.plotly.com/v2/plots/marlonjr:17", "parent": "https://api.plotly.com/v2/folders/home?user=marlonjr" }, "owner": "marlonjr", "parent": -1, "preview": "", "referencers": [], "references": [], "title": "", "views": 0, "web_url": "https://chart-studio.plotly.com/~marlonjr/17/", "world_readable": true, "date_modified": "2025-07-19T15:29:08.626Z", "stars": { "results": [], "count": 0 }, "collaborators": { "results": [], "count": 0 }, "subfolder_count": null, "refresh_interval": null, "organize_view_url": "https://chart-studio.plotly.com/~marlonjr/17/", "current_user_permission": "read", "is_theme": null, "is_template": false, "autosize": true, "caption": "", "figure": { "data": [ { "meta": { "columnNames": { "x": "A", "y": "B" } }, "mode": "markers", "name": "8.1 g/s", "type": "scatter", "xsrc": "marlonjr:16:733ae8", "ysrc": "marlonjr:16:51f13e", "marker": { "size": 4, "color": "rgb(0, 18, 252)" } }, { "meta": { "columnNames": { "x": "C", "y": "D" } }, "mode": "markers", "name": "4 g/s", "type": "scatter", "xsrc": "marlonjr:16:63b4d7", "ysrc": "marlonjr:16:955171", "marker": { "size": 4, "color": "rgb(237, 44, 12)" }, "stackgroup": null }, { "meta": { "columnNames": { "x": "E", "y": "F" } }, "mode": "markers", "name": "12 g/s", "type": "scatter", "xsrc": "marlonjr:16:7563dd", "ysrc": "marlonjr:16:0f0f89", "marker": { "size": 4, "color": "rgb(255, 240, 0)" }, "stackgroup": null } ], "frames": [], "layout": { "xaxis": { "type": "linear", "dtick": 0.1, "range": [ 0, 0.9 ], "ticks": "inside", "title": { "font": { "size": 15, "family": "Times New Roman" }, "text": "Distance [m]" }, "mirror": "ticks", "showline": true, "tickmode": "linear", "zeroline": true, "autorange": false, "linecolor": "rgb(0, 0, 0)", "zerolinecolor": "rgb(19, 19, 19)" }, "yaxis": { "type": "linear", "dtick": 5, "range": [ -15, 20 ], "ticks": "inside", "title": { "font": { "size": 14 }, "text": "Temperature [ºC]" }, "mirror": "ticks", "showline": true, "tickmode": "linear", "autorange": false, "gridcolor": "rgb(235, 240, 248)", "linecolor": "rgb(0, 0, 0)", "zerolinecolor": "rgb(22, 22, 22)", "zerolinewidth": 1 }, "legend": { "x": 0.8, "y": 0.9, "font": { "size": 14 } }, "autosize": true, "template": { "data": { "bar": [ { "type": "bar", "marker": { "colorbar": { "ticks": "", "outlinewidth": 0 } } } ], "table": [ { "type": "table", "cells": { "fill": { "color": "#EBF0F8" }, "line": { "color": "white" } }, "header": { "fill": { "color": "#C8D4E3" }, "line": { "color": "white" } } } ], "carpet": [ { "type": "carpet", "aaxis": { "gridcolor": "#C8D4E3", "linecolor": "#C8D4E3", "endlinecolor": "#2a3f5f", "minorgridcolor": "#C8D4E3", "startlinecolor": "#2a3f5f" }, "baxis": { "gridcolor": "#C8D4E3", "linecolor": "#C8D4E3", "endlinecolor": "#2a3f5f", "minorgridcolor": "#C8D4E3", "startlinecolor": "#2a3f5f" } } ], "mesh3d": [ { "type": "mesh3d", "colorbar": { "ticks": "", "outlinewidth": 0 } } ], "contour": [ { "type": "contour", "colorbar": { "ticks": "", "outlinewidth": 0 }, "autocolorscale": true } ], "heatmap": [ { "type": "heatmap", "colorbar": { "ticks": "", "outlinewidth": 0 }, "autocolorscale": true } ], "scatter": [ { "type": "scatter", "marker": { "colorbar": { "ticks": "", "outlinewidth": 0 } } } ], "surface": [ { "type": "surface", "colorbar": { "ticks": "", "outlinewidth": 0 } } ], "heatmapgl": [ { "type": "heatmapgl", "colorbar": { "ticks": "", "outlinewidth": 0 } } ], "histogram": [ { "type": "histogram", "marker": { "colorbar": { "ticks": "", "outlinewidth": 0 } } } ], "parcoords": [ { "line": { "colorbar": { "ticks": "", "outlinewidth": 0 } }, "type": "parcoords" } ], "scatter3d": [ { "type": "scatter3d", "marker": { "colorbar": { "ticks": "", "outlinewidth": 0 } } } ], "scattergl": [ { "type": "scattergl", "marker": { "colorbar": { "ticks": "", "outlinewidth": 0 } } } ], "choropleth": [ { "type": "choropleth", "colorbar": { "ticks": "", "outlinewidth": 0 } } ], "scattergeo": [ { "type": "scattergeo", "marker": { "colorbar": { "ticks": "", "outlinewidth": 0 } } } ], "histogram2d": [ { "type": "histogram2d", "colorbar": { "ticks": "", "outlinewidth": 0 }, "autocolorscale": true } ], "scatterpolar": [ { "type": "scatterpolar", "marker": { "colorbar": { "ticks": "", "outlinewidth": 0 } } } ], "contourcarpet": [ { "type": "contourcarpet", "colorbar": { "ticks": "", "outlinewidth": 0 } } ], "scattercarpet": [ { "type": "scattercarpet", "marker": { "colorbar": { "ticks": "", "outlinewidth": 0 } } } ], "scattermapbox": [ { "type": "scattermapbox", "marker": { "colorbar": { "ticks": "", "outlinewidth": 0 } } } ], "scatterpolargl": [ { "type": "scatterpolargl", "marker": { "colorbar": { "ticks": "", "outlinewidth": 0 } } } ], "scatterternary": [ { "type": "scatterternary", "marker": { "colorbar": { "ticks": "", "outlinewidth": 0 } } } ], "histogram2dcontour": [ { "type": "histogram2dcontour", "colorbar": { "ticks": "", "outlinewidth": 0 }, "autocolorscale": true } ] }, "layout": { "geo": { "bgcolor": "white", "showland": true, "lakecolor": "white", "landcolor": "white", "showlakes": true, "subunitcolor": "#C8D4E3" }, "font": { "color": "#2a3f5f" }, "polar": { "bgcolor": "white", "radialaxis": { "ticks": "", "gridcolor": "#EBF0F8", "linecolor": "#EBF0F8" }, "angularaxis": { "ticks": "", "gridcolor": "#EBF0F8", "linecolor": "#EBF0F8" } }, "scene": { "xaxis": { "ticks": "", "gridcolor": "#DFE8F3", "gridwidth": 2, "linecolor": "#EBF0F8", "zerolinecolor": "#EBF0F8", "showbackground": true, "backgroundcolor": "white" }, "yaxis": { "ticks": "", "gridcolor": "#DFE8F3", "gridwidth": 2, "linecolor": "#EBF0F8", "zerolinecolor": "#EBF0F8", "showbackground": true, "backgroundcolor": "white" }, "zaxis": { "ticks": "", "gridcolor": "#DFE8F3", "gridwidth": 2, "linecolor": "#EBF0F8", "zerolinecolor": "#EBF0F8", "showbackground": true, "backgroundcolor": "white" } }, "title": { "x": 0.05 }, "xaxis": { "ticks": "", "gridcolor": "#EBF0F8", "linecolor": "#EBF0F8", "automargin": true, "zerolinecolor": "#EBF0F8", "zerolinewidth": 2 }, "yaxis": { "ticks": "", "gridcolor": "#EBF0F8", "linecolor": "#EBF0F8", "automargin": true, "zerolinecolor": "#EBF0F8", "zerolinewidth": 2 }, "ternary": { "aaxis": { "ticks": "", "gridcolor": "#DFE8F3", "linecolor": "#A2B1C6" }, "baxis": { "ticks": "", "gridcolor": "#DFE8F3", "linecolor": "#A2B1C6" }, "caxis": { "ticks": "", "gridcolor": "#DFE8F3", "linecolor": "#A2B1C6" }, "bgcolor": "white" }, "colorway": [ "#636efa", "#EF553B", "#00cc96", "#ab63fa", "#19d3f3", "#e763fa", "#fecb52", "#ffa15a", "#ff6692", "#b6e880" ], "hovermode": "closest", "colorscale": { "diverging": [ [ 0, "#8e0152" ], [ 0.1, "#c51b7d" ], [ 0.2, "#de77ae" ], [ 0.3, "#f1b6da" ], [ 0.4, "#fde0ef" ], [ 0.5, "#f7f7f7" ], [ 0.6, "#e6f5d0" ], [ 0.7, "#b8e186" ], [ 0.8, "#7fbc41" ], [ 0.9, "#4d9221" ], [ 1, "#276419" ] ], "sequential": [ [ 0, "#0508b8" ], [ 0.0893854748603352, "#1910d8" ], [ 0.1787709497206704, "#3c19f0" ], [ 0.2681564245810056, "#6b1cfb" ], [ 0.3575418994413408, "#981cfd" ], [ 0.44692737430167595, "#bf1cfd" ], [ 0.5363128491620112, "#dd2bfd" ], [ 0.6256983240223464, "#f246fe" ], [ 0.7150837988826816, "#fc67fd" ], [ 0.8044692737430168, "#fe88fc" ], [ 0.8938547486033519, "#fea5fd" ], [ 0.9832402234636871, "#febefe" ], [ 1, "#fec3fe" ] ], "sequentialminus": [ [ 0, "#0508b8" ], [ 0.0893854748603352, "#1910d8" ], [ 0.1787709497206704, "#3c19f0" ], [ 0.2681564245810056, "#6b1cfb" ], [ 0.3575418994413408, "#981cfd" ], [ 0.44692737430167595, "#bf1cfd" ], [ 0.5363128491620112, "#dd2bfd" ], [ 0.6256983240223464, "#f246fe" ], [ 0.7150837988826816, "#fc67fd" ], [ 0.8044692737430168, "#fe88fc" ], [ 0.8938547486033519, "#fea5fd" ], [ 0.9832402234636871, "#febefe" ], [ 1, "#fec3fe" ] ] }, "plot_bgcolor": "white", "paper_bgcolor": "white", "shapedefaults": { "line": { "width": 0 }, "opacity": 0.4, "fillcolor": "#506784" }, "annotationdefaults": { "arrowhead": 0, "arrowcolor": "#506784", "arrowwidth": 1 } }, "themeRef": "PLOTLY_WHITE" } } }, "height": null, "width": null, "user": { "profile_url": "https://chart-studio.plotly.com/~marlonjr", "avatar_url": "https://storage.googleapis.com/plotly-prod-profiles/64.jpg", "background_url": "https://storage.googleapis.com/plotly-prod-profiles/bg-11.jpg", "bio": "", "nickname": "", "website": "", "stream_tokens": null, "feature_set_id": null, "csrf_token": null, "date_joined": "2025-04-03 18:25:38", "mapbox_access_tokens": null, "has_password": null, "username": "marlonjr", "email": null, "is_active": null, "readonly": null, "is_dash_creator": null, "dash_created_count": null, "is_chart_creator": null, "charts_created_count": null } }, { "creation_time": "2025-07-19T13:34:35.237807Z", "comments": { "results": [], "count": 0 }, "parented": true, "embed_url": "https://chart-studio.plotly.com/~aryan069/1.embed", "fid": "aryan069:1", "filename": "global_esg_momentum_map", "filetype": "plot", "img_url": "https://storage.googleapis.com/plotly-prod-images/aryan069/1/9_R9Q7DQ5VEBLX26L37UULGTVL1QHGYW.png", "image_urls": { "default": "https://storage.googleapis.com/plotly-prod-images/aryan069/1/2_DMJLK0QWZDYVJG2Z2M32PCIE5G2U4P.png", "block-thumb": "https://storage.googleapis.com/plotly-prod-images/aryan069/1/8_9WOB7A0IJTFUV0PZYAZZDWB048L65G.png", "list-thumb": "https://storage.googleapis.com/plotly-prod-images/aryan069/1/9_R9Q7DQ5VEBLX26L37UULGTVL1QHGYW.png" }, "api_urls": { "files": "https://api.plotly.com/v2/files/aryan069:1", "plots": "https://api.plotly.com/v2/plots/aryan069:1", "parent": "https://api.plotly.com/v2/folders/home?user=aryan069" }, "owner": "aryan069", "parent": -1, "preview": "", "referencers": [], "references": [], "title": "", "views": 13, "web_url": "https://chart-studio.plotly.com/~aryan069/1/", "world_readable": true, "date_modified": "2025-07-19T13:34:35.248Z", "stars": { "results": [], "count": 0 }, "collaborators": { "results": [], "count": 0 }, "subfolder_count": null, "refresh_interval": null, "organize_view_url": "https://chart-studio.plotly.com/~aryan069/1/", "current_user_permission": "read", "is_theme": null, "is_template": null, "autosize": true, "caption": "", "figure": { "data": [ { "geo": "geo", "name": "", "type": "choropleth", "zsrc": "aryan069:0:42ca91", "coloraxis": "coloraxis", "hovertextsrc": "aryan069:0:2866c6", "locationssrc": "aryan069:0:24a41a", "hovertemplate": "<b>%{hovertext}</b><br><br>Country Code=%{location}<br>Overall_ESG_Momentum=%{z}<extra></extra>" } ], "layout": { "geo": { "center": {}, "domain": { "x": [ 0.0, 1.0 ], "y": [ 0.0, 1.0 ] } }, "title": { "text": "World Map of Overall ESG Momentum" }, "legend": { "tracegroupgap": 0 }, "template": { "data": { "bar": [ { "type": "bar", "marker": { "line": { "color": "#E5ECF6", "width": 0.5 }, "pattern": { "size": 10, "fillmode": "overlay", "solidity": 0.2 } }, "error_x": { "color": "#2a3f5f" }, "error_y": { "color": "#2a3f5f" } } ], "pie": [ { "type": "pie", "automargin": true } ], "table": [ { "type": "table", "cells": { "fill": { "color": "#EBF0F8" }, "line": { "color": "white" } }, "header": { "fill": { "color": "#C8D4E3" }, "line": { "color": "white" } } } ], "carpet": [ { "type": "carpet", "aaxis": { "gridcolor": "white", "linecolor": "white", "endlinecolor": "#2a3f5f", "minorgridcolor": "white", "startlinecolor": "#2a3f5f" }, "baxis": { "gridcolor": "white", "linecolor": "white", "endlinecolor": "#2a3f5f", "minorgridcolor": "white", "startlinecolor": "#2a3f5f" } } ], "mesh3d": [ { "type": "mesh3d", "colorbar": { "ticks": "", "outlinewidth": 0 } } ], "contour": [ { "type": "contour", "colorbar": { "ticks": "", "outlinewidth": 0 }, "colorscale": [ [ 0.0, "#0d0887" ], [ 0.1111111111111111, "#46039f" ], [ 0.2222222222222222, "#7201a8" ], [ 0.3333333333333333, "#9c179e" ], [ 0.4444444444444444, "#bd3786" ], [ 0.5555555555555556, "#d8576b" ], [ 0.6666666666666666, "#ed7953" ], [ 0.7777777777777778, "#fb9f3a" ], [ 0.8888888888888888, "#fdca26" ], [ 1.0, "#f0f921" ] ] } ], "heatmap": [ { "type": "heatmap", "colorbar": { "ticks": "", "outlinewidth": 0 }, "colorscale": [ [ 0.0, "#0d0887" ], [ 0.1111111111111111, "#46039f" ], [ 0.2222222222222222, "#7201a8" ], [ 0.3333333333333333, "#9c179e" ], [ 0.4444444444444444, "#bd3786" ], [ 0.5555555555555556, "#d8576b" ], [ 0.6666666666666666, "#ed7953" ], [ 0.7777777777777778, "#fb9f3a" ], [ 0.8888888888888888, "#fdca26" ], [ 1.0, "#f0f921" ] ] } ], "scatter": [ { "type": "scatter", "fillpattern": { "size": 10, "fillmode": "overlay", "solidity": 0.2 } } ], "surface": [ { "type": "surface", "colorbar": { "ticks": "", "outlinewidth": 0 }, "colorscale": [ [ 0.0, "#0d0887" ], [ 0.1111111111111111, "#46039f" ], [ 0.2222222222222222, "#7201a8" ], [ 0.3333333333333333, "#9c179e" ], [ 0.4444444444444444, "#bd3786" ], [ 0.5555555555555556, "#d8576b" ], [ 0.6666666666666666, "#ed7953" ], [ 0.7777777777777778, "#fb9f3a" ], [ 0.8888888888888888, "#fdca26" ], [ 1.0, "#f0f921" ] ] } ], "barpolar": [ { "type": "barpolar", "marker": { "line": { "color": "#E5ECF6", "width": 0.5 }, "pattern": { "size": 10, "fillmode": "overlay", "solidity": 0.2 } } } ], "heatmapgl": [ { "type": "heatmapgl", "colorbar": { "ticks": "", "outlinewidth": 0 }, "colorscale": [ [ 0.0, "#0d0887" ], [ 0.1111111111111111, "#46039f" ], [ 0.2222222222222222, "#7201a8" ], [ 0.3333333333333333, "#9c179e" ], [ 0.4444444444444444, "#bd3786" ], [ 0.5555555555555556, "#d8576b" ], [ 0.6666666666666666, "#ed7953" ], [ 0.7777777777777778, "#fb9f3a" ], [ 0.8888888888888888, "#fdca26" ], [ 1.0, "#f0f921" ] ] } ], "histogram": [ { "type": "histogram", "marker": { "pattern": { "size": 10, "fillmode": "overlay", "solidity": 0.2 } } } ], "parcoords": [ { "line": { "colorbar": { "ticks": "", "outlinewidth": 0 } }, "type": "parcoords" } ], "scatter3d": [ { "line": { "colorbar": { "ticks": "", "outlinewidth": 0 } }, "type": "scatter3d", "marker": { "colorbar": { "ticks": "", "outlinewidth": 0 } } } ], "scattergl": [ { "type": "scattergl", "marker": { "colorbar": { "ticks": "", "outlinewidth": 0 } } } ], "choropleth": [ { "type": "choropleth", "colorbar": { "ticks": "", "outlinewidth": 0 } } ], "scattergeo": [ { "type": "scattergeo", "marker": { "colorbar": { "ticks": "", "outlinewidth": 0 } } } ], "histogram2d": [ { "type": "histogram2d", "colorbar": { "ticks": "", "outlinewidth": 0 }, "colorscale": [ [ 0.0, "#0d0887" ], [ 0.1111111111111111, "#46039f" ], [ 0.2222222222222222, "#7201a8" ], [ 0.3333333333333333, "#9c179e" ], [ 0.4444444444444444, "#bd3786" ], [ 0.5555555555555556, "#d8576b" ], [ 0.6666666666666666, "#ed7953" ], [ 0.7777777777777778, "#fb9f3a" ], [ 0.8888888888888888, "#fdca26" ], [ 1.0, "#f0f921" ] ] } ], "scatterpolar": [ { "type": "scatterpolar", "marker": { "colorbar": { "ticks": "", "outlinewidth": 0 } } } ], "contourcarpet": [ { "type": "contourcarpet", "colorbar": { "ticks": "", "outlinewidth": 0 } } ], "scattercarpet": [ { "type": "scattercarpet", "marker": { "colorbar": { "ticks": "", "outlinewidth": 0 } } } ], "scattermapbox": [ { "type": "scattermapbox", "marker": { "colorbar": { "ticks": "", "outlinewidth": 0 } } } ], "scatterpolargl": [ { "type": "scatterpolargl", "marker": { "colorbar": { "ticks": "", "outlinewidth": 0 } } } ], "scatterternary": [ { "type": "scatterternary", "marker": { "colorbar": { "ticks": "", "outlinewidth": 0 } } } ], "histogram2dcontour": [ { "type": "histogram2dcontour", "colorbar": { "ticks": "", "outlinewidth": 0 }, "colorscale": [ [ 0.0, "#0d0887" ], [ 0.1111111111111111, "#46039f" ], [ 0.2222222222222222, "#7201a8" ], [ 0.3333333333333333, "#9c179e" ], [ 0.4444444444444444, "#bd3786" ], [ 0.5555555555555556, "#d8576b" ], [ 0.6666666666666666, "#ed7953" ], [ 0.7777777777777778, "#fb9f3a" ], [ 0.8888888888888888, "#fdca26" ], [ 1.0, "#f0f921" ] ] } ] }, "layout": { "geo": { "bgcolor": "white", "showland": true, "lakecolor": "white", "landcolor": "#E5ECF6", "showlakes": true, "subunitcolor": "white" }, "font": { "color": "#2a3f5f" }, "polar": { "bgcolor": "#E5ECF6", "radialaxis": { "ticks": "", "gridcolor": "white", "linecolor": "white" }, "angularaxis": { "ticks": "", "gridcolor": "white", "linecolor": "white" } }, "scene": { "xaxis": { "ticks": "", "gridcolor": "white", "gridwidth": 2, "linecolor": "white", "zerolinecolor": "white", "showbackground": true, "backgroundcolor": "#E5ECF6" }, "yaxis": { "ticks": "", "gridcolor": "white", "gridwidth": 2, "linecolor": "white", "zerolinecolor": "white", "showbackground": true, "backgroundcolor": "#E5ECF6" }, "zaxis": { "ticks": "", "gridcolor": "white", "gridwidth": 2, "linecolor": "white", "zerolinecolor": "white", "showbackground": true, "backgroundcolor": "#E5ECF6" } }, "title": { "x": 0.05 }, "xaxis": { "ticks": "", "title": { "standoff": 15 }, "gridcolor": "white", "linecolor": "white", "automargin": true, "zerolinecolor": "white", "zerolinewidth": 2 }, "yaxis": { "ticks": "", "title": { "standoff": 15 }, "gridcolor": "white", "linecolor": "white", "automargin": true, "zerolinecolor": "white", "zerolinewidth": 2 }, "mapbox": { "style": "light" }, "ternary": { "aaxis": { "ticks": "", "gridcolor": "white", "linecolor": "white" }, "baxis": { "ticks": "", "gridcolor": "white", "linecolor": "white" }, "caxis": { "ticks": "", "gridcolor": "white", "linecolor": "white" }, "bgcolor": "#E5ECF6" }, "colorway": [ "#636efa", "#EF553B", "#00cc96", "#ab63fa", "#FFA15A", "#19d3f3", "#FF6692", "#B6E880", "#FF97FF", "#FECB52" ], "coloraxis": { "colorbar": { "ticks": "", "outlinewidth": 0 } }, "hovermode": "closest", "colorscale": { "diverging": [ [ 0, "#8e0152" ], [ 0.1, "#c51b7d" ], [ 0.2, "#de77ae" ], [ 0.3, "#f1b6da" ], [ 0.4, "#fde0ef" ], [ 0.5, "#f7f7f7" ], [ 0.6, "#e6f5d0" ], [ 0.7, "#b8e186" ], [ 0.8, "#7fbc41" ], [ 0.9, "#4d9221" ], [ 1, "#276419" ] ], "sequential": [ [ 0.0, "#0d0887" ], [ 0.1111111111111111, "#46039f" ], [ 0.2222222222222222, "#7201a8" ], [ 0.3333333333333333, "#9c179e" ], [ 0.4444444444444444, "#bd3786" ], [ 0.5555555555555556, "#d8576b" ], [ 0.6666666666666666, "#ed7953" ], [ 0.7777777777777778, "#fb9f3a" ], [ 0.8888888888888888, "#fdca26" ], [ 1.0, "#f0f921" ] ], "sequentialminus": [ [ 0.0, "#0d0887" ], [ 0.1111111111111111, "#46039f" ], [ 0.2222222222222222, "#7201a8" ], [ 0.3333333333333333, "#9c179e" ], [ 0.4444444444444444, "#bd3786" ], [ 0.5555555555555556, "#d8576b" ], [ 0.6666666666666666, "#ed7953" ], [ 0.7777777777777778, "#fb9f3a" ], [ 0.8888888888888888, "#fdca26" ], [ 1.0, "#f0f921" ] ] }, "hoverlabel": { "align": "left" }, "plot_bgcolor": "#E5ECF6", "paper_bgcolor": "white", "shapedefaults": { "line": { "color": "#2a3f5f" } }, "autotypenumbers": "strict", "annotationdefaults": { "arrowhead": 0, "arrowcolor": "#2a3f5f", "arrowwidth": 1 } } }, "coloraxis": { "colorbar": { "title": { "text": "Overall_ESG_Momentum" } }, "colorscale": [ [ 0.0, "#0d0887" ], [ 0.1111111111111111, "#46039f" ], [ 0.2222222222222222, "#7201a8" ], [ 0.3333333333333333, "#9c179e" ], [ 0.4444444444444444, "#bd3786" ], [ 0.5555555555555556, "#d8576b" ], [ 0.6666666666666666, "#ed7953" ], [ 0.7777777777777778, "#fb9f3a" ], [ 0.8888888888888888, "#fdca26" ], [ 1.0, "#f0f921" ] ] } } }, "height": null, "width": null, "user": { "profile_url": "https://chart-studio.plotly.com/~aryan069", "avatar_url": "https://storage.googleapis.com/plotly-prod-profiles/13.jpg", "background_url": "https://storage.googleapis.com/plotly-prod-profiles/bg-7.jpg", "bio": "", "nickname": "", "website": "", "stream_tokens": null, "feature_set_id": null, "csrf_token": null, "date_joined": "2025-07-19 13:04:39", "mapbox_access_tokens": null, "has_password": null, "username": "aryan069", "email": null, "is_active": null, "readonly": null, "is_dash_creator": null, "dash_created_count": null, "is_chart_creator": null, "charts_created_count": null } }, { "creation_time": "2025-07-19T12:01:58.765188Z", "comments": { "results": [], "count": 0 }, "parented": true, "embed_url": "https://chart-studio.plotly.com/~andiniprasti/1.embed", "fid": "andiniprasti:1", "filename": "BMI", "filetype": "plot", "img_url": "https://storage.googleapis.com/plotly-prod-images/andiniprasti/1/9_J0AVHBSKJ62ELAF0TJH0VGY2BD2HS1.png", "image_urls": { "default": "https://storage.googleapis.com/plotly-prod-images/andiniprasti/1/2_ZQJQZ8YER3UTPKJRNUB62C0AV6HPA2.png", "block-thumb": "https://storage.googleapis.com/plotly-prod-images/andiniprasti/1/8_NH84GHKB14H2CKY5SIBZWYS7NW3BR9.png", "list-thumb": "https://storage.googleapis.com/plotly-prod-images/andiniprasti/1/9_J0AVHBSKJ62ELAF0TJH0VGY2BD2HS1.png" }, "api_urls": { "files": "https://api.plotly.com/v2/files/andiniprasti:1", "plots": "https://api.plotly.com/v2/plots/andiniprasti:1", "parent": "https://api.plotly.com/v2/folders/home?user=andiniprasti" }, "owner": "andiniprasti", "parent": -1, "preview": "", "referencers": [], "references": [], "title": "", "views": 0, "web_url": "https://chart-studio.plotly.com/~andiniprasti/1/", "world_readable": true, "date_modified": "2025-07-19T12:01:58.776Z", "stars": { "results": [], "count": 0 }, "collaborators": { "results": [], "count": 0 }, "subfolder_count": null, "refresh_interval": null, "organize_view_url": "https://chart-studio.plotly.com/~andiniprasti/1/", "current_user_permission": "read", "is_theme": null, "is_template": false, "autosize": true, "caption": "", "figure": { "data": [ { "meta": { "columnNames": { "x": "BMI Delta", "y": "Tanaman", "z": "BMI Delta" } }, "mode": "markers", "type": "scatter", "xsrc": "andiniprasti:0:220339", "ysrc": "andiniprasti:0:76f6a4", "zsrc": "andiniprasti:0:220339", "contours": { "end": 0.9, "size": 0.1, "start": 0.1 }, "bandwidth": 0, "autocontour": true, "orientation": "h", "autocolorscale": true } ], "frames": [], "layout": { "polar": { "radialaxis": { "range": [ 0.4246872074897743, 0.5363331596133321 ], "autorange": false }, "angularaxis": {} }, "scene": { "aspectmode": "auto", "aspectratio": { "x": 1, "y": 1, "z": 1 } }, "xaxis": { "type": "linear", "range": [ -0.5771812080536913, 2.6362416107382547 ], "anchor": "y", "autorange": false }, "yaxis": { "type": "category", "range": [ -1, 3.101758793969849 ], "autorange": false }, "mapbox": {}, "ternary": {}, "autosize": true, "template": { "data": { "bar": [ { "type": "bar", "marker": { "colorbar": { "len": 0.2, "ticks": "inside", "ticklen": 6, "tickcolor": "rgb(237,237,237)", "outlinewidth": 0 } } } ], "table": [ { "type": "table", "cells": { "fill": { "color": "rgb(237,237,237)" }, "line": { "color": "white" } }, "header": { "fill": { "color": "rgb(217,217,217)" }, "line": { "color": "white" } } } ], "carpet": [ { "type": "carpet", "aaxis": { "gridcolor": "white", "linecolor": "white", "endlinecolor": "rgb(51,51,51)", "minorgridcolor": "white", "startlinecolor": "rgb(51,51,51)" }, "baxis": { "gridcolor": "white", "linecolor": "white", "endlinecolor": "rgb(51,51,51)", "minorgridcolor": "white", "startlinecolor": "rgb(51,51,51)" } } ], "mesh3d": [ { "type": "mesh3d", "colorbar": { "len": 0.2, "ticks": "inside", "ticklen": 6, "tickcolor": "rgb(237,237,237)", "outlinewidth": 0 } } ], "contour": [ { "type": "contour", "colorbar": { "len": 0.2, "ticks": "inside", "ticklen": 6, "tickcolor": "rgb(237,237,237)", "outlinewidth": 0 }, "autocolorscale": true } ], "heatmap": [ { "type": "heatmap", "colorbar": { "len": 0.2, "ticks": "inside", "ticklen": 6, "tickcolor": "rgb(237,237,237)", "outlinewidth": 0 }, "autocolorscale": true } ], "scatter": [ { "type": "scatter", "marker": { "colorbar": { "len": 0.2, "ticks": "inside", "ticklen": 6, "tickcolor": "rgb(237,237,237)", "outlinewidth": 0 } } } ], "surface": [ { "type": "surface", "colorbar": { "len": 0.2, "ticks": "inside", "ticklen": 6, "tickcolor": "rgb(237,237,237)", "outlinewidth": 0 } } ], "heatmapgl": [ { "type": "heatmapgl", "colorbar": { "len": 0.2, "ticks": "inside", "ticklen": 6, "tickcolor": "rgb(237,237,237)", "outlinewidth": 0 } } ], "histogram": [ { "type": "histogram", "marker": { "colorbar": { "len": 0.2, "ticks": "inside", "ticklen": 6, "tickcolor": "rgb(237,237,237)", "outlinewidth": 0 } } } ], "parcoords": [ { "line": { "colorbar": { "len": 0.2, "ticks": "inside", "ticklen": 6, "tickcolor": "rgb(237,237,237)", "outlinewidth": 0 } }, "type": "parcoords" } ], "scatter3d": [ { "type": "scatter3d", "marker": { "colorbar": { "len": 0.2, "ticks": "inside", "ticklen": 6, "tickcolor": "rgb(237,237,237)", "outlinewidth": 0 } } } ], "scattergl": [ { "type": "scattergl", "marker": { "colorbar": { "len": 0.2, "ticks": "inside", "ticklen": 6, "tickcolor": "rgb(237,237,237)", "outlinewidth": 0 } } } ], "choropleth": [ { "type": "choropleth", "colorbar": { "len": 0.2, "ticks": "inside", "ticklen": 6, "tickcolor": "rgb(237,237,237)", "outlinewidth": 0 } } ], "scattergeo": [ { "type": "scattergeo", "marker": { "colorbar": { "len": 0.2, "ticks": "inside", "ticklen": 6, "tickcolor": "rgb(237,237,237)", "outlinewidth": 0 } } } ], "histogram2d": [ { "type": "histogram2d", "colorbar": { "len": 0.2, "ticks": "inside", "ticklen": 6, "tickcolor": "rgb(237,237,237)", "outlinewidth": 0 }, "autocolorscale": true } ], "scatterpolar": [ { "type": "scatterpolar", "marker": { "colorbar": { "len": 0.2, "ticks": "inside", "ticklen": 6, "tickcolor": "rgb(237,237,237)", "outlinewidth": 0 } } } ], "contourcarpet": [ { "type": "contourcarpet", "colorbar": { "len": 0.2, "ticks": "inside", "ticklen": 6, "tickcolor": "rgb(237,237,237)", "outlinewidth": 0 } } ], "scattercarpet": [ { "type": "scattercarpet", "marker": { "colorbar": { "len": 0.2, "ticks": "inside", "ticklen": 6, "tickcolor": "rgb(237,237,237)", "outlinewidth": 0 } } } ], "scattermapbox": [ { "type": "scattermapbox", "marker": { "colorbar": { "len": 0.2, "ticks": "inside", "ticklen": 6, "tickcolor": "rgb(237,237,237)", "outlinewidth": 0 } } } ], "scatterpolargl": [ { "type": "scatterpolargl", "marker": { "colorbar": { "len": 0.2, "ticks": "inside", "ticklen": 6, "tickcolor": "rgb(237,237,237)", "outlinewidth": 0 } } } ], "scatterternary": [ { "type": "scatterternary", "marker": { "colorbar": { "len": 0.2, "ticks": "inside", "ticklen": 6, "tickcolor": "rgb(237,237,237)", "outlinewidth": 0 } } } ], "histogram2dcontour": [ { "type": "histogram2dcontour", "colorbar": { "len": 0.2, "ticks": "inside", "ticklen": 6, "tickcolor": "rgb(237,237,237)", "outlinewidth": 0 }, "autocolorscale": true } ] }, "layout": { "geo": { "bgcolor": "white", "showland": true, "lakecolor": "white", "landcolor": "rgb(237,237,237)", "showlakes": true, "subunitcolor": "white" }, "font": { "color": "rgb(51,51,51)" }, "polar": { "bgcolor": "rgb(237,237,237)", "radialaxis": { "ticks": "outside", "showgrid": true, "gridcolor": "white", "linecolor": "white", "tickcolor": "rgb(51,51,51)" }, "angularaxis": { "ticks": "outside", "showgrid": true, "gridcolor": "white", "linecolor": "white", "tickcolor": "rgb(51,51,51)" } }, "scene": { "xaxis": { "ticks": "outside", "showgrid": true, "gridcolor": "white", "gridwidth": 2, "linecolor": "white", "tickcolor": "rgb(51,51,51)", "zerolinecolor": "white", "showbackground": true, "backgroundcolor": "rgb(237,237,237)" }, "yaxis": { "ticks": "outside", "showgrid": true, "gridcolor": "white", "gridwidth": 2, "linecolor": "white", "tickcolor": "rgb(51,51,51)", "zerolinecolor": "white", "showbackground": true, "backgroundcolor": "rgb(237,237,237)" }, "zaxis": { "ticks": "outside", "showgrid": true, "gridcolor": "white", "gridwidth": 2, "linecolor": "white", "tickcolor": "rgb(51,51,51)", "zerolinecolor": "white", "showbackground": true, "backgroundcolor": "rgb(237,237,237)" } }, "xaxis": { "ticks": "outside", "showgrid": true, "gridcolor": "white", "linecolor": "white", "tickcolor": "rgb(51,51,51)", "automargin": true, "zerolinecolor": "white" }, "yaxis": { "ticks": "outside", "showgrid": true, "gridcolor": "white", "linecolor": "white", "tickcolor": "rgb(51,51,51)", "automargin": true, "zerolinecolor": "white" }, "ternary": { "aaxis": { "ticks": "outside", "showgrid": true, "gridcolor": "white", "linecolor": "white", "tickcolor": "rgb(51,51,51)" }, "baxis": { "ticks": "outside", "showgrid": true, "gridcolor": "white", "linecolor": "white", "tickcolor": "rgb(51,51,51)" }, "caxis": { "ticks": "outside", "showgrid": true, "gridcolor": "white", "linecolor": "white", "tickcolor": "rgb(51,51,51)" }, "bgcolor": "rgb(237,237,237)" }, "colorway": [ "#F8766D", "#A3A500", "#00BF7D", "#00B0F6", "#E76BF3" ], "hovermode": "closest", "colorscale": { "diverging": [ [ 0, "#40004b" ], [ 0.1, "#762a83" ], [ 0.2, "#9970ab" ], [ 0.3, "#c2a5cf" ], [ 0.4, "#e7d4e8" ], [ 0.5, "#f7f7f7" ], [ 0.6, "#d9f0d3" ], [ 0.7, "#a6dba0" ], [ 0.8, "#5aae61" ], [ 0.9, "#1b7837" ], [ 1, "#00441b" ] ], "sequential": [ [ 0, "rgb(20,44,66)" ], [ 1, "rgb(90,179,244)" ] ], "sequentialminus": [ [ 0, "rgb(20,44,66)" ], [ 1, "rgb(90,179,244)" ] ] }, "plot_bgcolor": "rgb(237,237,237)", "paper_bgcolor": "white", "shapedefaults": { "line": { "width": 0 }, "opacity": 0.3, "fillcolor": "black" }, "annotationdefaults": { "arrowhead": 0, "arrowwidth": 1 } }, "themeRef": "GGPLOT2" }, "showlegend": false } }, "height": null, "width": null, "user": { "profile_url": "https://chart-studio.plotly.com/~andiniprasti", "avatar_url": "https://storage.googleapis.com/plotly-prod-profiles/7.jpg", "background_url": "https://storage.googleapis.com/plotly-prod-profiles/bg-0.jpg", "bio": "", "nickname": "", "website": "", "stream_tokens": null, "feature_set_id": null, "csrf_token": null, "date_joined": "2025-07-19 11:52:15", "mapbox_access_tokens": null, "has_password": null, "username": "andiniprasti", "email": null, "is_active": null, "readonly": null, "is_dash_creator": null, "dash_created_count": null, "is_chart_creator": null, "charts_created_count": null } }, { "creation_time": "2025-07-19T11:25:03.936264Z", "comments": { "results": [], "count": 0 }, "parented": true, "embed_url": "https://chart-studio.plotly.com/~ChJus/22.embed", "fid": "ChJus:22", "filename": "MNIST-Parameter-Accuracy-All", "filetype": "plot", "img_url": "https://storage.googleapis.com/plotly-prod-images/ChJus/22/9_GXR7L0P393ME3O6IBQRGCWYYCMWYVC.png", "image_urls": { "default": "https://storage.googleapis.com/plotly-prod-images/ChJus/22/2_J9W9Y62ZRTAUJ010R23S29A5MKF7T9.png", "block-thumb": "https://storage.googleapis.com/plotly-prod-images/ChJus/22/8_4DV08PF6J6HGWDF5UV1NPPSSJEZ5G0.png", "list-thumb": "https://storage.googleapis.com/plotly-prod-images/ChJus/22/9_GXR7L0P393ME3O6IBQRGCWYYCMWYVC.png" }, "api_urls": { "files": "https://api.plotly.com/v2/files/ChJus:22", "plots": "https://api.plotly.com/v2/plots/ChJus:22", "parent": "https://api.plotly.com/v2/folders/home?user=ChJus" }, "owner": "ChJus", "parent": -1, "preview": "", "referencers": [], "references": [], "title": "", "views": 1, "web_url": "https://chart-studio.plotly.com/~ChJus/22/", "world_readable": true, "date_modified": "2025-07-22T03:13:45.115Z", "stars": { "results": [], "count": 0 }, "collaborators": { "results": [], "count": 0 }, "subfolder_count": null, "refresh_interval": null, "organize_view_url": "https://chart-studio.plotly.com/~ChJus/22/", "current_user_permission": "read", "is_theme": null, "is_template": false, "autosize": true, "caption": "", "figure": { "data": [ { "line": { "dash": "solid" }, "meta": { "columnNames": { "x": "U", "y": "Z" } }, "mode": "markers+lines", "name": "No fine-tuning (Large)", "type": "scatter", "xsrc": "ChJus:3:e9b136", "ysrc": "ChJus:3:fee585", "marker": { "size": 6, "color": "rgb(65, 89, 240)", "symbol": "circle-open" }, "visible": true, "showlegend": true }, { "line": { "dash": "solid" }, "meta": { "columnNames": { "x": "U", "y": "AA" } }, "mode": "markers+lines", "name": "Fine-tuned (Large)", "type": "scatter", "xsrc": "ChJus:3:e9b136", "ysrc": "ChJus:3:20198c", "marker": { "color": "rgb(65, 89, 240)", "symbol": "circle" }, "error_x": { "type": "percent", "color": "rgb(84, 134, 76)", "value": 10, "width": 4, "visible": false, "symmetric": true, "thickness": 2 }, "error_y": { "type": "percent", "color": "rgb(84, 134, 76)", "value": 10, "width": 4, "visible": false, "symmetric": true, "thickness": 2 }, "visible": true, "cliponaxis": true }, { "line": { "dash": "solid", "color": "rgb(84, 134, 76)" }, "meta": { "columnNames": { "x": "K", "y": "P" } }, "mode": "markers+lines", "name": "No fine-tuning (Medium)", "type": "scatter", "xsrc": "ChJus:3:1b47f7", "ysrc": "ChJus:3:abe8de", "marker": { "color": "rgb(57, 153, 67)", "symbol": "circle-open" }, "stackgroup": null }, { "line": { "dash": "solid" }, "meta": { "columnNames": { "x": "K", "y": "Q" } }, "mode": "markers+lines", "name": "Fine-tuned (Medium)", "type": "scatter", "xsrc": "ChJus:3:1b47f7", "ysrc": "ChJus:3:3558c0", "marker": { "color": "rgb(84, 134, 76)", "symbol": "circle" }, "stackgroup": null }, { "meta": { "columnNames": { "x": "A", "y": "F" } }, "mode": "markers+lines", "name": "No fine-tuning (Small)", "type": "scatter", "xsrc": "ChJus:3:0f9449", "ysrc": "ChJus:3:e64161", "marker": { "color": "rgb(237, 93, 107)", "symbol": "circle-open" }, "stackgroup": null }, { "meta": { "columnNames": { "x": "A", "y": "G" } }, "mode": "markers+lines", "name": "Fine-tuned (Small)", "type": "scatter", "xsrc": "ChJus:3:0f9449", "ysrc": "ChJus:3:30c633", "marker": { "color": "rgb(237, 93, 107)", "opacity": 1 }, "visible": true, "stackgroup": null } ], "frames": [], "layout": { "font": { "color": "rgb(46, 46, 46)", "family": "Balto" }, "title": { "x": 0.5, "text": "<b>Model compression effect on test accuracy (MNIST)</b>" }, "xaxis": { "range": [ -64383.17249698432, 1099483.1724969842 ], "title": { "text": "Parameter count" }, "autorange": true, "showspikes": false, "tickformat": "", "exponentformat": "none", "separatethousands": false }, "yaxis": { "range": [ -0.25462962962962965, 110.25462962962963 ], "title": { "text": "Relative test accuracy (%)" }, "autorange": true, "showspikes": false }, "legend": { "x": 1, "y": 0.01, "font": { "color": "rgb(20, 20, 20)" }, "title": { "text": "<b>Model Performance</b>" }, "valign": "top", "xanchor": "right", "yanchor": "bottom", "traceorder": "normal", "borderwidth": 0, "orientation": "v" }, "margin": { "b": 50, "l": 50, "r": 50, "t": 50, "pad": 0 }, "shapes": [ { "x0": 0, "x1": 50000, "y0": 0, "y1": 110, "line": { "color": "#444444", "width": 1 }, "type": "rect", "opacity": 0.12, "fillcolor": "#7f7f7f" } ], "autosize": true, "template": { "data": { "bar": [ { "type": "bar", "marker": { "colorbar": { "ticks": "", "outlinewidth": 0 } } } ], "table": [ { "type": "table", "cells": { "fill": { "color": "#EBF0F8" }, "line": { "color": "white" } }, "header": { "fill": { "color": "#C8D4E3" }, "line": { "color": "white" } } } ], "carpet": [ { "type": "carpet", "aaxis": { "gridcolor": "#C8D4E3", "linecolor": "#C8D4E3", "endlinecolor": "#2a3f5f", "minorgridcolor": "#C8D4E3", "startlinecolor": "#2a3f5f" }, "baxis": { "gridcolor": "#C8D4E3", "linecolor": "#C8D4E3", "endlinecolor": "#2a3f5f", "minorgridcolor": "#C8D4E3", "startlinecolor": "#2a3f5f" } } ], "mesh3d": [ { "type": "mesh3d", "colorbar": { "ticks": "", "outlinewidth": 0 } } ], "contour": [ { "type": "contour", "colorbar": { "ticks": "", "outlinewidth": 0 }, "autocolorscale": true } ], "heatmap": [ { "type": "heatmap", "colorbar": { "ticks": "", "outlinewidth": 0 }, "autocolorscale": true } ], "scatter": [ { "type": "scatter", "marker": { "colorbar": { "ticks": "", "outlinewidth": 0 } } } ], "surface": [ { "type": "surface", "colorbar": { "ticks": "", "outlinewidth": 0 } } ], "heatmapgl": [ { "type": "heatmapgl", "colorbar": { "ticks": "", "outlinewidth": 0 } } ], "histogram": [ { "type": "histogram", "marker": { "colorbar": { "ticks": "", "outlinewidth": 0 } } } ], "parcoords": [ { "line": { "colorbar": { "ticks": "", "outlinewidth": 0 } }, "type": "parcoords" } ], "scatter3d": [ { "type": "scatter3d", "marker": { "colorbar": { "ticks": "", "outlinewidth": 0 } } } ], "scattergl": [ { "type": "scattergl", "marker": { "colorbar": { "ticks": "", "outlinewidth": 0 } } } ], "choropleth": [ { "type": "choropleth", "colorbar": { "ticks": "", "outlinewidth": 0 } } ], "scattergeo": [ { "type": "scattergeo", "marker": { "colorbar": { "ticks": "", "outlinewidth": 0 } } } ], "histogram2d": [ { "type": "histogram2d", "colorbar": { "ticks": "", "outlinewidth": 0 }, "autocolorscale": true } ], "scatterpolar": [ { "type": "scatterpolar", "marker": { "colorbar": { "ticks": "", "outlinewidth": 0 } } } ], "contourcarpet": [ { "type": "contourcarpet", "colorbar": { "ticks": "", "outlinewidth": 0 } } ], "scattercarpet": [ { "type": "scattercarpet", "marker": { "colorbar": { "ticks": "", "outlinewidth": 0 } } } ], "scattermapbox": [ { "type": "scattermapbox", "marker": { "colorbar": { "ticks": "", "outlinewidth": 0 } } } ], "scatterpolargl": [ { "type": "scatterpolargl", "marker": { "colorbar": { "ticks": "", "outlinewidth": 0 } } } ], "scatterternary": [ { "type": "scatterternary", "marker": { "colorbar": { "ticks": "", "outlinewidth": 0 } } } ], "histogram2dcontour": [ { "type": "histogram2dcontour", "colorbar": { "ticks": "", "outlinewidth": 0 }, "autocolorscale": true } ] }, "layout": { "geo": { "bgcolor": "white", "showland": true, "lakecolor": "white", "landcolor": "white", "showlakes": true, "subunitcolor": "#C8D4E3" }, "font": { "color": "#2a3f5f" }, "polar": { "bgcolor": "white", "radialaxis": { "ticks": "", "gridcolor": "#EBF0F8", "linecolor": "#EBF0F8" }, "angularaxis": { "ticks": "", "gridcolor": "#EBF0F8", "linecolor": "#EBF0F8" } }, "scene": { "xaxis": { "ticks": "", "gridcolor": "#DFE8F3", "gridwidth": 2, "linecolor": "#EBF0F8", "zerolinecolor": "#EBF0F8", "showbackground": true, "backgroundcolor": "white" }, "yaxis": { "ticks": "", "gridcolor": "#DFE8F3", "gridwidth": 2, "linecolor": "#EBF0F8", "zerolinecolor": "#EBF0F8", "showbackground": true, "backgroundcolor": "white" }, "zaxis": { "ticks": "", "gridcolor": "#DFE8F3", "gridwidth": 2, "linecolor": "#EBF0F8", "zerolinecolor": "#EBF0F8", "showbackground": true, "backgroundcolor": "white" } }, "title": { "x": 0.05 }, "xaxis": { "ticks": "", "gridcolor": "#EBF0F8", "linecolor": "#EBF0F8", "automargin": true, "zerolinecolor": "#EBF0F8", "zerolinewidth": 2 }, "yaxis": { "ticks": "", "gridcolor": "#EBF0F8", "linecolor": "#EBF0F8", "automargin": true, "zerolinecolor": "#EBF0F8", "zerolinewidth": 2 }, "ternary": { "aaxis": { "ticks": "", "gridcolor": "#DFE8F3", "linecolor": "#A2B1C6" }, "baxis": { "ticks": "", "gridcolor": "#DFE8F3", "linecolor": "#A2B1C6" }, "caxis": { "ticks": "", "gridcolor": "#DFE8F3", "linecolor": "#A2B1C6" }, "bgcolor": "white" }, "colorway": [ "#636efa", "#EF553B", "#00cc96", "#ab63fa", "#19d3f3", "#e763fa", "#fecb52", "#ffa15a", "#ff6692", "#b6e880" ], "hovermode": "closest", "colorscale": { "diverging": [ [ 0, "#8e0152" ], [ 0.1, "#c51b7d" ], [ 0.2, "#de77ae" ], [ 0.3, "#f1b6da" ], [ 0.4, "#fde0ef" ], [ 0.5, "#f7f7f7" ], [ 0.6, "#e6f5d0" ], [ 0.7, "#b8e186" ], [ 0.8, "#7fbc41" ], [ 0.9, "#4d9221" ], [ 1, "#276419" ] ], "sequential": [ [ 0, "#0508b8" ], [ 0.0893854748603352, "#1910d8" ], [ 0.1787709497206704, "#3c19f0" ], [ 0.2681564245810056, "#6b1cfb" ], [ 0.3575418994413408, "#981cfd" ], [ 0.44692737430167595, "#bf1cfd" ], [ 0.5363128491620112, "#dd2bfd" ], [ 0.6256983240223464, "#f246fe" ], [ 0.7150837988826816, "#fc67fd" ], [ 0.8044692737430168, "#fe88fc" ], [ 0.8938547486033519, "#fea5fd" ], [ 0.9832402234636871, "#febefe" ], [ 1, "#fec3fe" ] ], "sequentialminus": [ [ 0, "#0508b8" ], [ 0.0893854748603352, "#1910d8" ], [ 0.1787709497206704, "#3c19f0" ], [ 0.2681564245810056, "#6b1cfb" ], [ 0.3575418994413408, "#981cfd" ], [ 0.44692737430167595, "#bf1cfd" ], [ 0.5363128491620112, "#dd2bfd" ], [ 0.6256983240223464, "#f246fe" ], [ 0.7150837988826816, "#fc67fd" ], [ 0.8044692737430168, "#fe88fc" ], [ 0.8938547486033519, "#fea5fd" ], [ 0.9832402234636871, "#febefe" ], [ 1, "#fec3fe" ] ] }, "plot_bgcolor": "white", "paper_bgcolor": "white", "shapedefaults": { "line": { "width": 0 }, "opacity": 0.4, "fillcolor": "#506784" }, "annotationdefaults": { "arrowhead": 0, "arrowcolor": "#506784", "arrowwidth": 1 } }, "themeRef": "PLOTLY_WHITE" }, "hovermode": "x", "showlegend": true, "annotations": [ { "x": 70000, "y": 2, "ax": -99, "ay": 105, "text": "More than number<br>of training examples", "align": "left", "xanchor": "left", "yanchor": "bottom", "showarrow": false } ] } }, "height": null, "width": null, "user": { "profile_url": "https://chart-studio.plotly.com/~ChJus", "avatar_url": "https://storage.googleapis.com/plotly-prod-profiles/13.jpg", "background_url": "https://storage.googleapis.com/plotly-prod-profiles/bg-3.jpg", "bio": "", "nickname": "", "website": "", "stream_tokens": null, "feature_set_id": null, "csrf_token": null, "date_joined": "2025-06-19 06:35:53", "mapbox_access_tokens": null, "has_password": null, "username": "ChJus", "email": null, "is_active": null, "readonly": null, "is_dash_creator": null, "dash_created_count": null, "is_chart_creator": null, "charts_created_count": null } }, { "creation_time": "2025-07-19T11:21:39.046677Z", "comments": { "results": [], "count": 0 }, "parented": true, "embed_url": "https://chart-studio.plotly.com/~ChJus/21.embed", "fid": "ChJus:21", "filename": "CIFAR-10-Parameter-Accuracy-All", "filetype": "plot", "img_url": "https://storage.googleapis.com/plotly-prod-images/ChJus/21/9_C4ORW2OCK6R1UUT46BQM5E1QL6RKAI.png", "image_urls": { "default": "https://storage.googleapis.com/plotly-prod-images/ChJus/21/2_UJ1A5FJFPTHJU0EINR9R2TEF19YO5D.png", "block-thumb": "https://storage.googleapis.com/plotly-prod-images/ChJus/21/8_ZK2XJCX24QACBP7JUTVXBZATGZDTPU.png", "list-thumb": "https://storage.googleapis.com/plotly-prod-images/ChJus/21/9_C4ORW2OCK6R1UUT46BQM5E1QL6RKAI.png" }, "api_urls": { "files": "https://api.plotly.com/v2/files/ChJus:21", "plots": "https://api.plotly.com/v2/plots/ChJus:21", "parent": "https://api.plotly.com/v2/folders/home?user=ChJus" }, "owner": "ChJus", "parent": -1, "preview": "", "referencers": [], "references": [], "title": "", "views": 1, "web_url": "https://chart-studio.plotly.com/~ChJus/21/", "world_readable": true, "date_modified": "2025-07-22T03:15:59.582Z", "stars": { "results": [], "count": 0 }, "collaborators": { "results": [], "count": 0 }, "subfolder_count": null, "refresh_interval": null, "organize_view_url": "https://chart-studio.plotly.com/~ChJus/21/", "current_user_permission": "read", "is_theme": null, "is_template": false, "autosize": true, "caption": "", "figure": { "data": [ { "line": { "dash": "solid" }, "meta": { "columnNames": { "x": "W", "y": "AB" } }, "mode": "markers+lines", "name": "No fine-tuning (Large)", "type": "scatter", "xsrc": "ChJus:7:7c26ce", "ysrc": "ChJus:7:4542a3", "marker": { "color": "rgb(65, 89, 240)", "symbol": "circle-open" }, "visible": true, "showlegend": true }, { "line": { "dash": "solid" }, "meta": { "columnNames": { "x": "W", "y": "AC" } }, "mode": "markers+lines", "name": "Fine-tuned (Large)", "type": "scatter", "xsrc": "ChJus:7:7c26ce", "ysrc": "ChJus:7:e92840", "marker": { "size": 6, "color": "rgb(65, 89, 240)", "symbol": "circle" }, "error_x": { "type": "percent", "color": "rgb(84, 134, 76)", "value": 10, "width": 4, "visible": false, "symmetric": true, "thickness": 2 }, "error_y": { "type": "percent", "color": "rgb(84, 134, 76)", "value": 10, "width": 4, "visible": false, "symmetric": true, "thickness": 2 }, "visible": true, "cliponaxis": true }, { "line": { "dash": "solid" }, "meta": { "columnNames": { "x": "L", "y": "Q" } }, "mode": "markers+lines", "name": "No fine-tuning (Medium)", "type": "scatter", "xsrc": "ChJus:7:42f167", "ysrc": "ChJus:7:e55caa", "marker": { "color": "rgb(84, 134, 76)", "symbol": "circle-open" }, "stackgroup": null }, { "line": { "dash": "solid" }, "meta": { "columnNames": { "x": "L", "y": "R" } }, "mode": "markers+lines", "name": "Fine-tuned (Medium)", "type": "scatter", "xsrc": "ChJus:7:42f167", "ysrc": "ChJus:7:03f982", "marker": { "color": "rgb(84, 134, 76)", "symbol": "circle" }, "stackgroup": null }, { "meta": { "columnNames": { "x": "A", "y": "F" } }, "mode": "markers+lines", "name": "No fine-tuning (Small)", "type": "scatter", "xsrc": "ChJus:7:095ee1", "ysrc": "ChJus:7:bcd707", "marker": { "color": "rgb(237, 93, 107)", "symbol": "circle-open" }, "stackgroup": null }, { "meta": { "columnNames": { "x": "A", "y": "G" } }, "mode": "markers+lines", "name": "Fine-tuned (Small)", "type": "scatter", "xsrc": "ChJus:7:095ee1", "ysrc": "ChJus:7:32834c", "marker": { "color": "rgb(237, 93, 107)", "opacity": 1 }, "visible": true, "stackgroup": null } ], "frames": [], "layout": { "font": { "color": "rgb(46, 46, 46)", "family": "Balto" }, "title": { "x": 0.5, "text": "<b>Model compression effect on test accuracy (CIFAR-10)</b>" }, "xaxis": { "range": [ -151225.71531966224, 2625401.7153196624 ], "title": { "text": "Parameter count" }, "autorange": true, "showspikes": false, "tickformat": "", "exponentformat": "none", "separatethousands": false }, "yaxis": { "range": [ -0.2546310054482417, 110.25522535908866 ], "title": { "text": "Relative test accuracy (%)" }, "autorange": true, "showspikes": false }, "legend": { "x": 1, "y": 0.01, "font": { "color": "rgb(20, 20, 20)" }, "title": { "text": "<b>Model Performance</b>" }, "valign": "top", "xanchor": "right", "yanchor": "bottom", "traceorder": "normal", "borderwidth": 0, "orientation": "v" }, "margin": { "b": 50, "l": 50, "r": 50, "t": 50, "pad": 0 }, "shapes": [ { "x0": 0, "x1": 50000, "y0": 0, "y1": 110, "line": { "color": "#444444", "width": 1 }, "type": "rect", "opacity": 0.12, "fillcolor": "#7f7f7f" } ], "autosize": true, "template": { "data": { "bar": [ { "type": "bar", "marker": { "colorbar": { "ticks": "", "outlinewidth": 0 } } } ], "table": [ { "type": "table", "cells": { "fill": { "color": "#EBF0F8" }, "line": { "color": "white" } }, "header": { "fill": { "color": "#C8D4E3" }, "line": { "color": "white" } } } ], "carpet": [ { "type": "carpet", "aaxis": { "gridcolor": "#C8D4E3", "linecolor": "#C8D4E3", "endlinecolor": "#2a3f5f", "minorgridcolor": "#C8D4E3", "startlinecolor": "#2a3f5f" }, "baxis": { "gridcolor": "#C8D4E3", "linecolor": "#C8D4E3", "endlinecolor": "#2a3f5f", "minorgridcolor": "#C8D4E3", "startlinecolor": "#2a3f5f" } } ], "mesh3d": [ { "type": "mesh3d", "colorbar": { "ticks": "", "outlinewidth": 0 } } ], "contour": [ { "type": "contour", "colorbar": { "ticks": "", "outlinewidth": 0 }, "autocolorscale": true } ], "heatmap": [ { "type": "heatmap", "colorbar": { "ticks": "", "outlinewidth": 0 }, "autocolorscale": true } ], "scatter": [ { "type": "scatter", "marker": { "colorbar": { "ticks": "", "outlinewidth": 0 } } } ], "surface": [ { "type": "surface", "colorbar": { "ticks": "", "outlinewidth": 0 } } ], "heatmapgl": [ { "type": "heatmapgl", "colorbar": { "ticks": "", "outlinewidth": 0 } } ], "histogram": [ { "type": "histogram", "marker": { "colorbar": { "ticks": "", "outlinewidth": 0 } } } ], "parcoords": [ { "line": { "colorbar": { "ticks": "", "outlinewidth": 0 } }, "type": "parcoords" } ], "scatter3d": [ { "type": "scatter3d", "marker": { "colorbar": { "ticks": "", "outlinewidth": 0 } } } ], "scattergl": [ { "type": "scattergl", "marker": { "colorbar": { "ticks": "", "outlinewidth": 0 } } } ], "choropleth": [ { "type": "choropleth", "colorbar": { "ticks": "", "outlinewidth": 0 } } ], "scattergeo": [ { "type": "scattergeo", "marker": { "colorbar": { "ticks": "", "outlinewidth": 0 } } } ], "histogram2d": [ { "type": "histogram2d", "colorbar": { "ticks": "", "outlinewidth": 0 }, "autocolorscale": true } ], "scatterpolar": [ { "type": "scatterpolar", "marker": { "colorbar": { "ticks": "", "outlinewidth": 0 } } } ], "contourcarpet": [ { "type": "contourcarpet", "colorbar": { "ticks": "", "outlinewidth": 0 } } ], "scattercarpet": [ { "type": "scattercarpet", "marker": { "colorbar": { "ticks": "", "outlinewidth": 0 } } } ], "scattermapbox": [ { "type": "scattermapbox", "marker": { "colorbar": { "ticks": "", "outlinewidth": 0 } } } ], "scatterpolargl": [ { "type": "scatterpolargl", "marker": { "colorbar": { "ticks": "", "outlinewidth": 0 } } } ], "scatterternary": [ { "type": "scatterternary", "marker": { "colorbar": { "ticks": "", "outlinewidth": 0 } } } ], "histogram2dcontour": [ { "type": "histogram2dcontour", "colorbar": { "ticks": "", "outlinewidth": 0 }, "autocolorscale": true } ] }, "layout": { "geo": { "bgcolor": "white", "showland": true, "lakecolor": "white", "landcolor": "white", "showlakes": true, "subunitcolor": "#C8D4E3" }, "font": { "color": "#2a3f5f" }, "polar": { "bgcolor": "white", "radialaxis": { "ticks": "", "gridcolor": "#EBF0F8", "linecolor": "#EBF0F8" }, "angularaxis": { "ticks": "", "gridcolor": "#EBF0F8", "linecolor": "#EBF0F8" } }, "scene": { "xaxis": { "ticks": "", "gridcolor": "#DFE8F3", "gridwidth": 2, "linecolor": "#EBF0F8", "zerolinecolor": "#EBF0F8", "showbackground": true, "backgroundcolor": "white" }, "yaxis": { "ticks": "", "gridcolor": "#DFE8F3", "gridwidth": 2, "linecolor": "#EBF0F8", "zerolinecolor": "#EBF0F8", "showbackground": true, "backgroundcolor": "white" }, "zaxis": { "ticks": "", "gridcolor": "#DFE8F3", "gridwidth": 2, "linecolor": "#EBF0F8", "zerolinecolor": "#EBF0F8", "showbackground": true, "backgroundcolor": "white" } }, "title": { "x": 0.05 }, "xaxis": { "ticks": "", "gridcolor": "#EBF0F8", "linecolor": "#EBF0F8", "automargin": true, "zerolinecolor": "#EBF0F8", "zerolinewidth": 2 }, "yaxis": { "ticks": "", "gridcolor": "#EBF0F8", "linecolor": "#EBF0F8", "automargin": true, "zerolinecolor": "#EBF0F8", "zerolinewidth": 2 }, "ternary": { "aaxis": { "ticks": "", "gridcolor": "#DFE8F3", "linecolor": "#A2B1C6" }, "baxis": { "ticks": "", "gridcolor": "#DFE8F3", "linecolor": "#A2B1C6" }, "caxis": { "ticks": "", "gridcolor": "#DFE8F3", "linecolor": "#A2B1C6" }, "bgcolor": "white" }, "colorway": [ "#636efa", "#EF553B", "#00cc96", "#ab63fa", "#19d3f3", "#e763fa", "#fecb52", "#ffa15a", "#ff6692", "#b6e880" ], "hovermode": "closest", "colorscale": { "diverging": [ [ 0, "#8e0152" ], [ 0.1, "#c51b7d" ], [ 0.2, "#de77ae" ], [ 0.3, "#f1b6da" ], [ 0.4, "#fde0ef" ], [ 0.5, "#f7f7f7" ], [ 0.6, "#e6f5d0" ], [ 0.7, "#b8e186" ], [ 0.8, "#7fbc41" ], [ 0.9, "#4d9221" ], [ 1, "#276419" ] ], "sequential": [ [ 0, "#0508b8" ], [ 0.0893854748603352, "#1910d8" ], [ 0.1787709497206704, "#3c19f0" ], [ 0.2681564245810056, "#6b1cfb" ], [ 0.3575418994413408, "#981cfd" ], [ 0.44692737430167595, "#bf1cfd" ], [ 0.5363128491620112, "#dd2bfd" ], [ 0.6256983240223464, "#f246fe" ], [ 0.7150837988826816, "#fc67fd" ], [ 0.8044692737430168, "#fe88fc" ], [ 0.8938547486033519, "#fea5fd" ], [ 0.9832402234636871, "#febefe" ], [ 1, "#fec3fe" ] ], "sequentialminus": [ [ 0, "#0508b8" ], [ 0.0893854748603352, "#1910d8" ], [ 0.1787709497206704, "#3c19f0" ], [ 0.2681564245810056, "#6b1cfb" ], [ 0.3575418994413408, "#981cfd" ], [ 0.44692737430167595, "#bf1cfd" ], [ 0.5363128491620112, "#dd2bfd" ], [ 0.6256983240223464, "#f246fe" ], [ 0.7150837988826816, "#fc67fd" ], [ 0.8044692737430168, "#fe88fc" ], [ 0.8938547486033519, "#fea5fd" ], [ 0.9832402234636871, "#febefe" ], [ 1, "#fec3fe" ] ] }, "plot_bgcolor": "white", "paper_bgcolor": "white", "shapedefaults": { "line": { "width": 0 }, "opacity": 0.4, "fillcolor": "#506784" }, "annotationdefaults": { "arrowhead": 0, "arrowcolor": "#506784", "arrowwidth": 1 } }, "themeRef": "PLOTLY_WHITE" }, "hovermode": "x", "showlegend": true, "annotations": [ { "x": 70000, "y": 2, "ax": -99, "ay": 105, "text": "More than number<br>of training examples", "align": "left", "xanchor": "left", "yanchor": "bottom", "showarrow": false } ] } }, "height": null, "width": null, "user": { "profile_url": "https://chart-studio.plotly.com/~ChJus", "avatar_url": "https://storage.googleapis.com/plotly-prod-profiles/13.jpg", "background_url": "https://storage.googleapis.com/plotly-prod-profiles/bg-3.jpg", "bio": "", "nickname": "", "website": "", "stream_tokens": null, "feature_set_id": null, "csrf_token": null, "date_joined": "2025-06-19 06:35:53", "mapbox_access_tokens": null, "has_password": null, "username": "ChJus", "email": null, "is_active": null, "readonly": null, "is_dash_creator": null, "dash_created_count": null, "is_chart_creator": null, "charts_created_count": null } }, { "creation_time": "2025-07-19T11:13:35.873729Z", "comments": { "results": [], "count": 0 }, "parented": true, "embed_url": "https://chart-studio.plotly.com/~ChJus/20.embed", "fid": "ChJus:20", "filename": "CIFAR-100-Parameter-Accuracy-All", "filetype": "plot", "img_url": "https://storage.googleapis.com/plotly-prod-images/ChJus/20/9_S6YY8NHM7PRW0C38AKFPAD2LBMGYJH.png", "image_urls": { "default": "https://storage.googleapis.com/plotly-prod-images/ChJus/20/2_RZOS9CP765UBIFLFPP48J0VYO28XK5.png", "block-thumb": "https://storage.googleapis.com/plotly-prod-images/ChJus/20/8_1PZBFTLMAX46G5V12CFF0TYAG68XKQ.png", "list-thumb": "https://storage.googleapis.com/plotly-prod-images/ChJus/20/9_S6YY8NHM7PRW0C38AKFPAD2LBMGYJH.png" }, "api_urls": { "files": "https://api.plotly.com/v2/files/ChJus:20", "plots": "https://api.plotly.com/v2/plots/ChJus:20", "parent": "https://api.plotly.com/v2/folders/home?user=ChJus" }, "owner": "ChJus", "parent": -1, "preview": "", "referencers": [], "references": [], "title": "", "views": 1, "web_url": "https://chart-studio.plotly.com/~ChJus/20/", "world_readable": true, "date_modified": "2025-07-22T03:17:42.927Z", "stars": { "results": [], "count": 0 }, "collaborators": { "results": [], "count": 0 }, "subfolder_count": null, "refresh_interval": null, "organize_view_url": "https://chart-studio.plotly.com/~ChJus/20/", "current_user_permission": "read", "is_theme": null, "is_template": false, "autosize": true, "caption": "", "figure": { "data": [ { "line": { "dash": "solid" }, "meta": { "columnNames": { "x": "W", "y": "AB" } }, "mode": "markers+lines", "name": "No fine-tuning (Large)", "type": "scatter", "xsrc": "ChJus:13:8374f3", "ysrc": "ChJus:13:a0663a", "marker": { "color": "rgb(65, 89, 240)", "symbol": "circle-open" }, "visible": true, "showlegend": true }, { "line": { "dash": "solid" }, "meta": { "columnNames": { "x": "W", "y": "AC" } }, "mode": "markers+lines", "name": "Fine-tuned (Large)", "type": "scatter", "xsrc": "ChJus:13:8374f3", "ysrc": "ChJus:13:2e4ebd", "marker": { "color": "rgb(65, 89, 240)", "symbol": "circle" }, "error_x": { "type": "percent", "color": "rgb(84, 134, 76)", "value": 10, "width": 4, "visible": false, "symmetric": true, "thickness": 2 }, "error_y": { "type": "percent", "color": "rgb(84, 134, 76)", "value": 10, "width": 4, "visible": false, "symmetric": true, "thickness": 2 }, "visible": true, "cliponaxis": true }, { "line": { "dash": "solid" }, "meta": { "columnNames": { "x": "L", "y": "Q" } }, "mode": "markers+lines", "name": "No fine-tuning (Medium)", "type": "scatter", "xsrc": "ChJus:13:ada5a7", "ysrc": "ChJus:13:b87662", "marker": { "color": "rgb(84, 134, 76)", "symbol": "circle-open" }, "stackgroup": null }, { "line": { "dash": "solid" }, "meta": { "columnNames": { "x": "L", "y": "R" } }, "mode": "markers+lines", "name": "Fine-tuned (Medium)", "type": "scatter", "xsrc": "ChJus:13:ada5a7", "ysrc": "ChJus:13:97ed1e", "marker": { "color": "rgb(84, 134, 76)", "symbol": "circle" }, "stackgroup": null }, { "meta": { "columnNames": { "x": "A", "y": "F" } }, "mode": "markers+lines", "name": "No fine-tuning (Small)", "type": "scatter", "xsrc": "ChJus:13:57bc75", "ysrc": "ChJus:13:54bda6", "marker": { "size": 6, "color": "rgb(237, 93, 107)", "symbol": "circle-open" }, "stackgroup": null }, { "meta": { "columnNames": { "x": "A", "y": "G" } }, "mode": "markers+lines", "name": "Fine-tuned (Small)", "type": "scatter", "xsrc": "ChJus:13:57bc75", "ysrc": "ChJus:13:c6c511", "marker": { "color": "rgb(237, 93, 107)", "opacity": 1 }, "visible": true, "stackgroup": null } ], "frames": [], "layout": { "font": { "color": "rgb(46, 46, 46)", "family": "Balto" }, "title": { "x": 0.5, "text": "<b>Model compression effect on test accuracy (CIFAR-100)</b>" }, "xaxis": { "range": [ -138368.28950542823, 2411752.289505428 ], "title": { "text": "Parameter count" }, "autorange": true, "showspikes": false, "tickformat": "", "exponentformat": "none", "separatethousands": false }, "yaxis": { "range": [ -0.2629767211490837, 113.86892025755324 ], "title": { "text": "Relative test accuracy (%)" }, "autorange": true, "showspikes": false }, "legend": { "x": 1, "y": 0.01, "font": { "color": "rgb(20, 20, 20)" }, "title": { "text": "<b>Model Performance</b>" }, "valign": "top", "xanchor": "right", "yanchor": "bottom", "traceorder": "normal", "borderwidth": 0, "orientation": "v" }, "margin": { "b": 50, "l": 50, "r": 50, "t": 50, "pad": 0 }, "shapes": [ { "x0": 0, "x1": 50000, "y0": 0, "y1": 110, "line": { "color": "#444444", "width": 1 }, "type": "rect", "opacity": 0.12, "fillcolor": "#7f7f7f" } ], "autosize": true, "template": { "data": { "bar": [ { "type": "bar", "marker": { "colorbar": { "ticks": "", "outlinewidth": 0 } } } ], "table": [ { "type": "table", "cells": { "fill": { "color": "#EBF0F8" }, "line": { "color": "white" } }, "header": { "fill": { "color": "#C8D4E3" }, "line": { "color": "white" } } } ], "carpet": [ { "type": "carpet", "aaxis": { "gridcolor": "#C8D4E3", "linecolor": "#C8D4E3", "endlinecolor": "#2a3f5f", "minorgridcolor": "#C8D4E3", "startlinecolor": "#2a3f5f" }, "baxis": { "gridcolor": "#C8D4E3", "linecolor": "#C8D4E3", "endlinecolor": "#2a3f5f", "minorgridcolor": "#C8D4E3", "startlinecolor": "#2a3f5f" } } ], "mesh3d": [ { "type": "mesh3d", "colorbar": { "ticks": "", "outlinewidth": 0 } } ], "contour": [ { "type": "contour", "colorbar": { "ticks": "", "outlinewidth": 0 }, "autocolorscale": true } ], "heatmap": [ { "type": "heatmap", "colorbar": { "ticks": "", "outlinewidth": 0 }, "autocolorscale": true } ], "scatter": [ { "type": "scatter", "marker": { "colorbar": { "ticks": "", "outlinewidth": 0 } } } ], "surface": [ { "type": "surface", "colorbar": { "ticks": "", "outlinewidth": 0 } } ], "heatmapgl": [ { "type": "heatmapgl", "colorbar": { "ticks": "", "outlinewidth": 0 } } ], "histogram": [ { "type": "histogram", "marker": { "colorbar": { "ticks": "", "outlinewidth": 0 } } } ], "parcoords": [ { "line": { "colorbar": { "ticks": "", "outlinewidth": 0 } }, "type": "parcoords" } ], "scatter3d": [ { "type": "scatter3d", "marker": { "colorbar": { "ticks": "", "outlinewidth": 0 } } } ], "scattergl": [ { "type": "scattergl", "marker": { "colorbar": { "ticks": "", "outlinewidth": 0 } } } ], "choropleth": [ { "type": "choropleth", "colorbar": { "ticks": "", "outlinewidth": 0 } } ], "scattergeo": [ { "type": "scattergeo", "marker": { "colorbar": { "ticks": "", "outlinewidth": 0 } } } ], "histogram2d": [ { "type": "histogram2d", "colorbar": { "ticks": "", "outlinewidth": 0 }, "autocolorscale": true } ], "scatterpolar": [ { "type": "scatterpolar", "marker": { "colorbar": { "ticks": "", "outlinewidth": 0 } } } ], "contourcarpet": [ { "type": "contourcarpet", "colorbar": { "ticks": "", "outlinewidth": 0 } } ], "scattercarpet": [ { "type": "scattercarpet", "marker": { "colorbar": { "ticks": "", "outlinewidth": 0 } } } ], "scattermapbox": [ { "type": "scattermapbox", "marker": { "colorbar": { "ticks": "", "outlinewidth": 0 } } } ], "scatterpolargl": [ { "type": "scatterpolargl", "marker": { "colorbar": { "ticks": "", "outlinewidth": 0 } } } ], "scatterternary": [ { "type": "scatterternary", "marker": { "colorbar": { "ticks": "", "outlinewidth": 0 } } } ], "histogram2dcontour": [ { "type": "histogram2dcontour", "colorbar": { "ticks": "", "outlinewidth": 0 }, "autocolorscale": true } ] }, "layout": { "geo": { "bgcolor": "white", "showland": true, "lakecolor": "white", "landcolor": "white", "showlakes": true, "subunitcolor": "#C8D4E3" }, "font": { "color": "#2a3f5f" }, "polar": { "bgcolor": "white", "radialaxis": { "ticks": "", "gridcolor": "#EBF0F8", "linecolor": "#EBF0F8" }, "angularaxis": { "ticks": "", "gridcolor": "#EBF0F8", "linecolor": "#EBF0F8" } }, "scene": { "xaxis": { "ticks": "", "gridcolor": "#DFE8F3", "gridwidth": 2, "linecolor": "#EBF0F8", "zerolinecolor": "#EBF0F8", "showbackground": true, "backgroundcolor": "white" }, "yaxis": { "ticks": "", "gridcolor": "#DFE8F3", "gridwidth": 2, "linecolor": "#EBF0F8", "zerolinecolor": "#EBF0F8", "showbackground": true, "backgroundcolor": "white" }, "zaxis": { "ticks": "", "gridcolor": "#DFE8F3", "gridwidth": 2, "linecolor": "#EBF0F8", "zerolinecolor": "#EBF0F8", "showbackground": true, "backgroundcolor": "white" } }, "title": { "x": 0.05 }, "xaxis": { "ticks": "", "gridcolor": "#EBF0F8", "linecolor": "#EBF0F8", "automargin": true, "zerolinecolor": "#EBF0F8", "zerolinewidth": 2 }, "yaxis": { "ticks": "", "gridcolor": "#EBF0F8", "linecolor": "#EBF0F8", "automargin": true, "zerolinecolor": "#EBF0F8", "zerolinewidth": 2 }, "ternary": { "aaxis": { "ticks": "", "gridcolor": "#DFE8F3", "linecolor": "#A2B1C6" }, "baxis": { "ticks": "", "gridcolor": "#DFE8F3", "linecolor": "#A2B1C6" }, "caxis": { "ticks": "", "gridcolor": "#DFE8F3", "linecolor": "#A2B1C6" }, "bgcolor": "white" }, "colorway": [ "#636efa", "#EF553B", "#00cc96", "#ab63fa", "#19d3f3", "#e763fa", "#fecb52", "#ffa15a", "#ff6692", "#b6e880" ], "hovermode": "closest", "colorscale": { "diverging": [ [ 0, "#8e0152" ], [ 0.1, "#c51b7d" ], [ 0.2, "#de77ae" ], [ 0.3, "#f1b6da" ], [ 0.4, "#fde0ef" ], [ 0.5, "#f7f7f7" ], [ 0.6, "#e6f5d0" ], [ 0.7, "#b8e186" ], [ 0.8, "#7fbc41" ], [ 0.9, "#4d9221" ], [ 1, "#276419" ] ], "sequential": [ [ 0, "#0508b8" ], [ 0.0893854748603352, "#1910d8" ], [ 0.1787709497206704, "#3c19f0" ], [ 0.2681564245810056, "#6b1cfb" ], [ 0.3575418994413408, "#981cfd" ], [ 0.44692737430167595, "#bf1cfd" ], [ 0.5363128491620112, "#dd2bfd" ], [ 0.6256983240223464, "#f246fe" ], [ 0.7150837988826816, "#fc67fd" ], [ 0.8044692737430168, "#fe88fc" ], [ 0.8938547486033519, "#fea5fd" ], [ 0.9832402234636871, "#febefe" ], [ 1, "#fec3fe" ] ], "sequentialminus": [ [ 0, "#0508b8" ], [ 0.0893854748603352, "#1910d8" ], [ 0.1787709497206704, "#3c19f0" ], [ 0.2681564245810056, "#6b1cfb" ], [ 0.3575418994413408, "#981cfd" ], [ 0.44692737430167595, "#bf1cfd" ], [ 0.5363128491620112, "#dd2bfd" ], [ 0.6256983240223464, "#f246fe" ], [ 0.7150837988826816, "#fc67fd" ], [ 0.8044692737430168, "#fe88fc" ], [ 0.8938547486033519, "#fea5fd" ], [ 0.9832402234636871, "#febefe" ], [ 1, "#fec3fe" ] ] }, "plot_bgcolor": "white", "paper_bgcolor": "white", "shapedefaults": { "line": { "width": 0 }, "opacity": 0.4, "fillcolor": "#506784" }, "annotationdefaults": { "arrowhead": 0, "arrowcolor": "#506784", "arrowwidth": 1 } }, "themeRef": "PLOTLY_WHITE" }, "hovermode": "x", "showlegend": true, "annotations": [ { "x": 70000, "y": 2, "ax": -99, "ay": 105, "text": "More than number of training examples", "align": "left", "xanchor": "left", "yanchor": "bottom", "showarrow": false } ] } }, "height": null, "width": null, "user": { "profile_url": "https://chart-studio.plotly.com/~ChJus", "avatar_url": "https://storage.googleapis.com/plotly-prod-profiles/13.jpg", "background_url": "https://storage.googleapis.com/plotly-prod-profiles/bg-3.jpg", "bio": "", "nickname": "", "website": "", "stream_tokens": null, "feature_set_id": null, "csrf_token": null, "date_joined": "2025-06-19 06:35:53", "mapbox_access_tokens": null, "has_password": null, "username": "ChJus", "email": null, "is_active": null, "readonly": null, "is_dash_creator": null, "dash_created_count": null, "is_chart_creator": null, "charts_created_count": null } } ] }
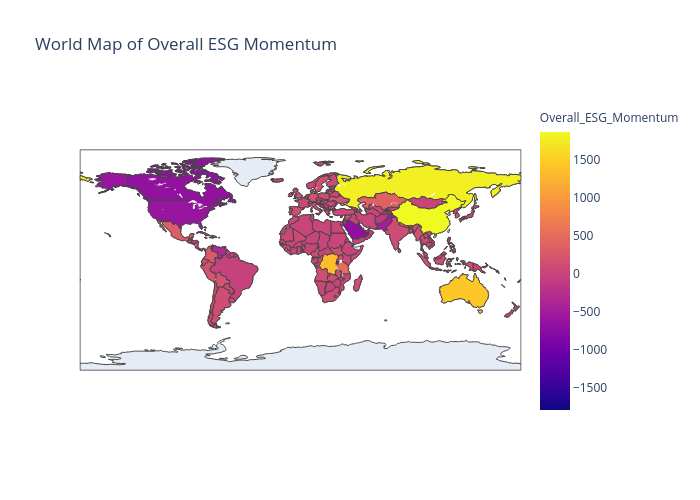