Plots List
Plots
This endpoint handles manipulation of Plotly plot files.
Reference
Authorization
Any user with or without a Plotly account may view public plots. For private plots, see authentication.
Actions
list
Listing all public plots can be done via a GET request to this endpoint.
By default, plots will be listed in order of date created. The order_by
query parameter is accepted at this endpoint. Currently, only ordering by
views is supported. It is possible to filter the plots by quality
with min_quality or max_quality as query parameter.
Example:
// GET https://api.plotly.com/v2/plots/ ---> 200

// GET https://api.plotly.com/v2/plots/?order_by=-views ---> 200

// GET https://api.plotly.com/v2/plots/?min_quality=5 ---> 200

// GET https://api.plotly.com/v2/plots/?max_quality=5 ---> 200
feed
Listing all handpicked feed plots can be done via a GET request to this endpoint. By default, plots will be listed in a random order.
Example:
// GET https://api.plotly.com/v2/plots/feed ---> 200
create
You can create new plot resources here. The only required field is 'figure'. Currently, the figure is restricted to only contain references to grid data. That is, this will fail if raw data arrays are passed in. To create and manipulate underlying grids for plots, see the grids endpoint.
Example:
// This fails because a figure field is required.
// POST https://api.plotly.com/v2/plots ---> 400 Bad Request
{}

// This fails because the figure has raw data
//POST https://api.plotly.com/v2/plots ---> 400 Bad Request
{
    "figure": {"data": [{"y": ['this', 'is', 'raw', 'data']}]}
}

// This succeeds because the figure has src keys, not raw data.
//POST https://api.plotly.com/v2/plots ---> 200 OK
{
    "figure": {"data": [{"ysrc": "sven:88:u8nd62"}]}
}
When creating a grid, you can optionally specify a source_fid to specify where a plot has come from:
- source_fid: the fid of a plot that was copied (and presumably edited) to produce this one
detail
There is a lot of meta information stored about plot files including filename, title, share_url, and content_url to name a few.
This information can only be reached with a GET to this endpoint.
Example:
// GET https://api.plotly.com/v2/plots/iheartgraphs:90
content
The contents of a plot can be downloaded via the content resource. The plot
content contains referenced grid/column data by default. If you wish to
return the raw grid/column data, the inline_data=true query must be included
in the request url. The Content-Type header will be appropriately set for the
response body.
Alternatively, you can set ?map_data=unreadable to append a mapping of
sources to data that belongs to grids which are unreadable for the
requestor. This is useful when you have read access to another users plot,
but that plot contains grid references which you don't have access to.
Examples:
// Returns referenced grid/column data
// GET https://api.plotly.com/v2/plots/iheartgraphs:90/content ---> 200 OK

// Returns full grid/column data
// GET https://api.plotly.com/v2/plots/iheartgraphs:90/content?inline_data=true ---> 200 OK

// Returns full grid/column data when requestor doesn't have permission
// to read the referenced grid.
// GET https://api.plotly.com/v2/plots/iheartgraphs:90/content?map_data=unreadable ---> 200 OK
GET /v2/plots/?cursor=cD0yMDI1LTA2LTE4KzAyJTNBMTglM0ExNy43NDU3MjIlMkIwMCUzQTAw&format=api
{ "next": "https://api.plot.ly/v2/plots/?cursor=cD0yMDI1LTA2LTE3KzE5JTNBMzIlM0EwNC4xNTM1NzAlMkIwMCUzQTAw&format=api", "previous": "https://api.plot.ly/v2/plots/?cursor=cj0xJnA9MjAyNS0wNi0xOCswMSUzQTQxJTNBMzIuNDUwMjI5JTJCMDAlM0EwMA%3D%3D&format=api", "results": [ { "creation_time": "2025-06-18T01:41:32.450229Z", "comments": { "results": [], "count": 0 }, "parented": true, "embed_url": "https://chart-studio.plotly.com/~emileyr1/13.embed", "fid": "emileyr1:13", "filename": "Plot 13", "filetype": "plot", "img_url": "https://api.plotly.com/v2/files/emileyr1:13/image?image_name=list-thumb", "image_urls": { "default": "https://api.plotly.com/v2/files/emileyr1:13/image?image_name=default", "block-thumb": "https://storage.googleapis.com/plotly-prod-images/emileyr1/13/8_PXMSF16DXMY8TN4XTZH8L1T05C91US.png", "list-thumb": "https://api.plotly.com/v2/files/emileyr1:13/image?image_name=list-thumb" }, "api_urls": { "files": "https://api.plotly.com/v2/files/emileyr1:13", "plots": "https://api.plotly.com/v2/plots/emileyr1:13", "parent": "https://api.plotly.com/v2/folders/home?user=emileyr1" }, "owner": "emileyr1", "parent": -1, "preview": "", "referencers": [], "references": [], "title": "", "views": 0, "web_url": "https://chart-studio.plotly.com/~emileyr1/13/", "world_readable": true, "date_modified": "2025-06-18T01:41:32.464Z", "stars": { "results": [], "count": 0 }, "collaborators": { "results": [], "count": 0 }, "subfolder_count": null, "refresh_interval": null, "organize_view_url": "https://chart-studio.plotly.com/~emileyr1/13/", "current_user_permission": "read", "is_theme": null, "is_template": false, "autosize": true, "caption": "", "figure": { "data": [ { "uid": "17c205", "meta": { "columnNames": { "x": "nm", "y": "A" } }, "mode": "lines", "name": "A", "type": "scatter", "xsrc": "emileyr1:12:f355e0", "ysrc": "emileyr1:12:f53bbb" }, { "uid": "e44e62", "meta": { "columnNames": { "x": "nm", "y": "B" } }, "mode": "lines", "name": "B", "type": "scatter", "xsrc": "emileyr1:12:f355e0", "ysrc": "emileyr1:12:62c484", "stackgroup": null }, { "uid": "1e31cc", "meta": { "columnNames": { "x": "nm", "y": "C" } }, "mode": "lines", "name": "C", "type": "scatter", "xsrc": "emileyr1:12:f355e0", "ysrc": "emileyr1:12:3c0b74", "stackgroup": null } ], "frames": [], "layout": { "title": { "text": "Photosynthesis Plotting and Interpretation" }, "xaxis": { "type": "linear", "range": [ 400, 700 ], "title": { "text": "Wavelength(nm)" }, "autorange": true }, "yaxis": { "type": "linear", "range": [ 34.55555555555556, 103.44444444444444 ], "title": { "text": "% Reflectance" }, "autorange": true }, "autosize": true, "template": { "data": { "bar": [ { "type": "bar", "marker": { "colorbar": { "ticks": "", "outlinewidth": 0 } } } ], "table": [ { "type": "table", "cells": { "fill": { "color": "#EBF0F8" }, "line": { "color": "white" } }, "header": { "fill": { "color": "#C8D4E3" }, "line": { "color": "white" } } } ], "carpet": [ { "type": "carpet", "aaxis": { "gridcolor": "#C8D4E3", "linecolor": "#C8D4E3", "endlinecolor": "#2a3f5f", "minorgridcolor": "#C8D4E3", "startlinecolor": "#2a3f5f" }, "baxis": { "gridcolor": "#C8D4E3", "linecolor": "#C8D4E3", "endlinecolor": "#2a3f5f", "minorgridcolor": "#C8D4E3", "startlinecolor": "#2a3f5f" } } ], "mesh3d": [ { "type": "mesh3d", "colorbar": { "ticks": "", "outlinewidth": 0 } } ], "contour": [ { "type": "contour", "colorbar": { "ticks": "", "outlinewidth": 0 }, "autocolorscale": true } ], "heatmap": [ { "type": "heatmap", "colorbar": { "ticks": "", "outlinewidth": 0 }, "autocolorscale": true } ], "scatter": [ { "type": "scatter", "marker": { "colorbar": { "ticks": "", "outlinewidth": 0 } } } ], "surface": [ { "type": "surface", "colorbar": { "ticks": "", "outlinewidth": 0 } } ], "heatmapgl": [ { "type": "heatmapgl", "colorbar": { "ticks": "", "outlinewidth": 0 } } ], "histogram": [ { "type": "histogram", "marker": { "colorbar": { "ticks": "", "outlinewidth": 0 } } } ], "parcoords": [ { "line": { "colorbar": { "ticks": "", "outlinewidth": 0 } }, "type": "parcoords" } ], "scatter3d": [ { "type": "scatter3d", "marker": { "colorbar": { "ticks": "", "outlinewidth": 0 } } } ], "scattergl": [ { "type": "scattergl", "marker": { "colorbar": { "ticks": "", "outlinewidth": 0 } } } ], "choropleth": [ { "type": "choropleth", "colorbar": { "ticks": "", "outlinewidth": 0 } } ], "scattergeo": [ { "type": "scattergeo", "marker": { "colorbar": { "ticks": "", "outlinewidth": 0 } } } ], "histogram2d": [ { "type": "histogram2d", "colorbar": { "ticks": "", "outlinewidth": 0 }, "autocolorscale": true } ], "scatterpolar": [ { "type": "scatterpolar", "marker": { "colorbar": { "ticks": "", "outlinewidth": 0 } } } ], "contourcarpet": [ { "type": "contourcarpet", "colorbar": { "ticks": "", "outlinewidth": 0 } } ], "scattercarpet": [ { "type": "scattercarpet", "marker": { "colorbar": { "ticks": "", "outlinewidth": 0 } } } ], "scattermapbox": [ { "type": "scattermapbox", "marker": { "colorbar": { "ticks": "", "outlinewidth": 0 } } } ], "scatterpolargl": [ { "type": "scatterpolargl", "marker": { "colorbar": { "ticks": "", "outlinewidth": 0 } } } ], "scatterternary": [ { "type": "scatterternary", "marker": { "colorbar": { "ticks": "", "outlinewidth": 0 } } } ], "histogram2dcontour": [ { "type": "histogram2dcontour", "colorbar": { "ticks": "", "outlinewidth": 0 }, "autocolorscale": true } ] }, "layout": { "geo": { "bgcolor": "white", "showland": true, "lakecolor": "white", "landcolor": "white", "showlakes": true, "subunitcolor": "#C8D4E3" }, "font": { "color": "#2a3f5f" }, "polar": { "bgcolor": "white", "radialaxis": { "ticks": "", "gridcolor": "#EBF0F8", "linecolor": "#EBF0F8" }, "angularaxis": { "ticks": "", "gridcolor": "#EBF0F8", "linecolor": "#EBF0F8" } }, "scene": { "xaxis": { "ticks": "", "gridcolor": "#DFE8F3", "gridwidth": 2, "linecolor": "#EBF0F8", "zerolinecolor": "#EBF0F8", "showbackground": true, "backgroundcolor": "white" }, "yaxis": { "ticks": "", "gridcolor": "#DFE8F3", "gridwidth": 2, "linecolor": "#EBF0F8", "zerolinecolor": "#EBF0F8", "showbackground": true, "backgroundcolor": "white" }, "zaxis": { "ticks": "", "gridcolor": "#DFE8F3", "gridwidth": 2, "linecolor": "#EBF0F8", "zerolinecolor": "#EBF0F8", "showbackground": true, "backgroundcolor": "white" } }, "title": { "x": 0.05 }, "xaxis": { "ticks": "", "gridcolor": "#EBF0F8", "linecolor": "#EBF0F8", "automargin": true, "zerolinecolor": "#EBF0F8", "zerolinewidth": 2 }, "yaxis": { "ticks": "", "gridcolor": "#EBF0F8", "linecolor": "#EBF0F8", "automargin": true, "zerolinecolor": "#EBF0F8", "zerolinewidth": 2 }, "ternary": { "aaxis": { "ticks": "", "gridcolor": "#DFE8F3", "linecolor": "#A2B1C6" }, "baxis": { "ticks": "", "gridcolor": "#DFE8F3", "linecolor": "#A2B1C6" }, "caxis": { "ticks": "", "gridcolor": "#DFE8F3", "linecolor": "#A2B1C6" }, "bgcolor": "white" }, "colorway": [ "#636efa", "#EF553B", "#00cc96", "#ab63fa", "#19d3f3", "#e763fa", "#fecb52", "#ffa15a", "#ff6692", "#b6e880" ], "hovermode": "closest", "colorscale": { "diverging": [ [ 0, "#8e0152" ], [ 0.1, "#c51b7d" ], [ 0.2, "#de77ae" ], [ 0.3, "#f1b6da" ], [ 0.4, "#fde0ef" ], [ 0.5, "#f7f7f7" ], [ 0.6, "#e6f5d0" ], [ 0.7, "#b8e186" ], [ 0.8, "#7fbc41" ], [ 0.9, "#4d9221" ], [ 1, "#276419" ] ], "sequential": [ [ 0, "#0508b8" ], [ 0.0893854748603352, "#1910d8" ], [ 0.1787709497206704, "#3c19f0" ], [ 0.2681564245810056, "#6b1cfb" ], [ 0.3575418994413408, "#981cfd" ], [ 0.44692737430167595, "#bf1cfd" ], [ 0.5363128491620112, "#dd2bfd" ], [ 0.6256983240223464, "#f246fe" ], [ 0.7150837988826816, "#fc67fd" ], [ 0.8044692737430168, "#fe88fc" ], [ 0.8938547486033519, "#fea5fd" ], [ 0.9832402234636871, "#febefe" ], [ 1, "#fec3fe" ] ], "sequentialminus": [ [ 0, "#0508b8" ], [ 0.0893854748603352, "#1910d8" ], [ 0.1787709497206704, "#3c19f0" ], [ 0.2681564245810056, "#6b1cfb" ], [ 0.3575418994413408, "#981cfd" ], [ 0.44692737430167595, "#bf1cfd" ], [ 0.5363128491620112, "#dd2bfd" ], [ 0.6256983240223464, "#f246fe" ], [ 0.7150837988826816, "#fc67fd" ], [ 0.8044692737430168, "#fe88fc" ], [ 0.8938547486033519, "#fea5fd" ], [ 0.9832402234636871, "#febefe" ], [ 1, "#fec3fe" ] ] }, "plot_bgcolor": "white", "paper_bgcolor": "white", "shapedefaults": { "line": { "width": 0 }, "opacity": 0.4, "fillcolor": "#506784" }, "annotationdefaults": { "arrowhead": 0, "arrowcolor": "#506784", "arrowwidth": 1 } }, "themeRef": "PLOTLY_WHITE" } } }, "height": null, "width": null, "user": { "profile_url": "https://chart-studio.plotly.com/~emileyr1", "avatar_url": "https://storage.googleapis.com/plotly-prod-profiles/82.jpg", "background_url": "https://storage.googleapis.com/plotly-prod-profiles/bg-11.jpg", "bio": "", "nickname": "", "website": "", "stream_tokens": null, "feature_set_id": null, "csrf_token": null, "date_joined": "2025-06-11 01:22:34", "mapbox_access_tokens": null, "has_password": null, "username": "emileyr1", "email": null, "is_active": null, "readonly": null, "is_dash_creator": null, "dash_created_count": null, "is_chart_creator": null, "charts_created_count": null } }, { "creation_time": "2025-06-18T00:52:39.672874Z", "comments": { "results": [], "count": 0 }, "parented": true, "embed_url": "https://chart-studio.plotly.com/~KamranIqbal/1.embed", "fid": "KamranIqbal:1", "filename": "Plot 1", "filetype": "plot", "img_url": "https://api.plotly.com/v2/files/KamranIqbal:1/image?image_name=list-thumb", "image_urls": { "default": "https://storage.googleapis.com/plotly-prod-images/KamranIqbal/1/2_KUOJEYATWGHBEW0235PXTTZGYP9MFU.png", "block-thumb": "https://storage.googleapis.com/plotly-prod-images/KamranIqbal/1/8_SK10ROSS8TQ4ZRLQZWBY6NK5INL3FY.png", "list-thumb": "https://api.plotly.com/v2/files/KamranIqbal:1/image?image_name=list-thumb" }, "api_urls": { "files": "https://api.plotly.com/v2/files/KamranIqbal:1", "plots": "https://api.plotly.com/v2/plots/KamranIqbal:1", "parent": "https://api.plotly.com/v2/folders/home?user=KamranIqbal" }, "owner": "KamranIqbal", "parent": -1, "preview": "", "referencers": [], "references": [], "title": "", "views": 0, "web_url": "https://chart-studio.plotly.com/~KamranIqbal/1/", "world_readable": true, "date_modified": "2025-06-18T00:52:39.684Z", "stars": { "results": [], "count": 0 }, "collaborators": { "results": [], "count": 0 }, "subfolder_count": null, "refresh_interval": null, "organize_view_url": "https://chart-studio.plotly.com/~KamranIqbal/1/", "current_user_permission": "read", "is_theme": null, "is_template": false, "autosize": true, "caption": "", "figure": { "data": [ { "uid": "0c411d", "meta": { "columnNames": { "x": "x", "y": "y" } }, "mode": "lines", "name": "Sum = 50", "type": "scatter", "xsrc": "KamranIqbal:0:e6f499", "ysrc": "KamranIqbal:0:e3e3e5" }, { "uid": "7f6b79", "transforms": [ { "rms": "", "type": "fit", "inputUid": "0c411d", "regressor": "x", "parameters": [ { "hold": false, "name": "a", "error": 0.00017363698510221154, "value": -0.0017054812223777915 }, { "hold": false, "name": "b", "error": 0.017944187408689898, "value": 0.22837060336136572 }, { "hold": false, "name": "c", "error": 0.3882575015508063, "value": 26.17819826252767 } ], "regressand": "y", "correlation": "", "fitfunction": "a*x^2 + b*x + c", "inputxrange": [], "outputxrange": [], "interpolation": 50 } ] } ], "frames": [], "layout": { "font": { "size": 14 }, "line": { "shape": "spline" }, "mode": "lines", "type": "scatter", "title": { "text": "" }, "xaxis": { "type": "linear", "range": [ 0, 100 ], "title": { "text": "k<sub>su</sub> (kPa/m)" }, "autorange": true }, "yaxis": { "type": "linear", "range": [ 34.665558650794594, 17.786023228905666 ], "title": { "text": "z<sub>f</sub>(m)" }, "autorange": true }, "legend": { "x": 1, "y": 1, "font": { "size": 14 }, "bgcolor": "#00000000", "xanchor": "left" }, "autosize": true, "showlegend": true } }, "height": null, "width": null, "user": { "profile_url": "https://chart-studio.plotly.com/~KamranIqbal", "avatar_url": "https://storage.googleapis.com/plotly-prod-profiles/73.jpg", "background_url": "https://storage.googleapis.com/plotly-prod-profiles/bg-2.jpg", "bio": "", "nickname": "", "website": "", "stream_tokens": null, "feature_set_id": null, "csrf_token": null, "date_joined": "2025-06-18 00:48:23", "mapbox_access_tokens": null, "has_password": null, "username": "KamranIqbal", "email": null, "is_active": null, "readonly": null, "is_dash_creator": null, "dash_created_count": null, "is_chart_creator": null, "charts_created_count": null } }, { "creation_time": "2025-06-18T00:26:53.922488Z", "comments": { "results": [], "count": 0 }, "parented": true, "embed_url": "https://chart-studio.plotly.com/~Roneel/1.embed", "fid": "Roneel:1", "filename": "Plot 1", "filetype": "plot", "img_url": "https://api.plotly.com/v2/files/Roneel:1/image?image_name=list-thumb", "image_urls": { "default": "https://storage.googleapis.com/plotly-prod-images/Roneel/1/2_W1ENMKIG6JHSW5U6NO9INW01DH8JQB.png", "block-thumb": "https://storage.googleapis.com/plotly-prod-images/Roneel/1/8_18S3FP5KMDPLTZ5UMUZUZ8JZJIA279.png", "list-thumb": "https://api.plotly.com/v2/files/Roneel:1/image?image_name=list-thumb" }, "api_urls": { "files": "https://api.plotly.com/v2/files/Roneel:1", "plots": "https://api.plotly.com/v2/plots/Roneel:1", "parent": "https://api.plotly.com/v2/folders/home?user=Roneel" }, "owner": "Roneel", "parent": -1, "preview": "", "referencers": [], "references": [], "title": "", "views": 0, "web_url": "https://chart-studio.plotly.com/~Roneel/1/", "world_readable": true, "date_modified": "2025-06-18T00:30:48.982Z", "stars": { "results": [], "count": 0 }, "collaborators": { "results": [], "count": 0 }, "subfolder_count": null, "refresh_interval": null, "organize_view_url": "https://chart-studio.plotly.com/~Roneel/1/", "current_user_permission": "read", "is_theme": null, "is_template": false, "autosize": true, "caption": "", "figure": { "data": [ { "meta": { "columnNames": { "x": "Year", "y": "SHem", "z": "Glob" } }, "mode": "markers", "type": "bar", "xsrc": "Roneel:0:ea6b16", "ysrc": "Roneel:0:a35259", "zsrc": "Roneel:0:74279f", "contours": { "end": 70, "size": 10, "start": -40 }, "autocontour": true, "orientation": "v", "autocolorscale": true } ], "frames": [], "layout": { "title": { "text": "Southern Hemisphere Temperatures from 1880 - 2014" }, "xaxis": { "type": "linear", "range": [ 1879.5, 2014.5 ], "title": { "text": "Year " }, "autorange": true }, "yaxis": { "type": "linear", "range": [ -52.888888888888886, 64.88888888888889 ], "title": { "text": "SHem temperature data" }, "autorange": true }, "autosize": true, "dragmode": "select", "template": { "data": { "bar": [ { "type": "bar", "marker": { "colorbar": { "ticks": "", "outlinewidth": 0 } } } ], "table": [ { "type": "table", "cells": { "fill": { "color": "#EBF0F8" }, "line": { "color": "white" } }, "header": { "fill": { "color": "#C8D4E3" }, "line": { "color": "white" } } } ], "carpet": [ { "type": "carpet", "aaxis": { "gridcolor": "#C8D4E3", "linecolor": "#C8D4E3", "endlinecolor": "#2a3f5f", "minorgridcolor": "#C8D4E3", "startlinecolor": "#2a3f5f" }, "baxis": { "gridcolor": "#C8D4E3", "linecolor": "#C8D4E3", "endlinecolor": "#2a3f5f", "minorgridcolor": "#C8D4E3", "startlinecolor": "#2a3f5f" } } ], "mesh3d": [ { "type": "mesh3d", "colorbar": { "ticks": "", "outlinewidth": 0 } } ], "contour": [ { "type": "contour", "colorbar": { "ticks": "", "outlinewidth": 0 }, "autocolorscale": true } ], "heatmap": [ { "type": "heatmap", "colorbar": { "ticks": "", "outlinewidth": 0 }, "autocolorscale": true } ], "scatter": [ { "type": "scatter", "marker": { "colorbar": { "ticks": "", "outlinewidth": 0 } } } ], "surface": [ { "type": "surface", "colorbar": { "ticks": "", "outlinewidth": 0 } } ], "heatmapgl": [ { "type": "heatmapgl", "colorbar": { "ticks": "", "outlinewidth": 0 } } ], "histogram": [ { "type": "histogram", "marker": { "colorbar": { "ticks": "", "outlinewidth": 0 } } } ], "parcoords": [ { "line": { "colorbar": { "ticks": "", "outlinewidth": 0 } }, "type": "parcoords" } ], "scatter3d": [ { "type": "scatter3d", "marker": { "colorbar": { "ticks": "", "outlinewidth": 0 } } } ], "scattergl": [ { "type": "scattergl", "marker": { "colorbar": { "ticks": "", "outlinewidth": 0 } } } ], "choropleth": [ { "type": "choropleth", "colorbar": { "ticks": "", "outlinewidth": 0 } } ], "scattergeo": [ { "type": "scattergeo", "marker": { "colorbar": { "ticks": "", "outlinewidth": 0 } } } ], "histogram2d": [ { "type": "histogram2d", "colorbar": { "ticks": "", "outlinewidth": 0 }, "autocolorscale": true } ], "scatterpolar": [ { "type": "scatterpolar", "marker": { "colorbar": { "ticks": "", "outlinewidth": 0 } } } ], "contourcarpet": [ { "type": "contourcarpet", "colorbar": { "ticks": "", "outlinewidth": 0 } } ], "scattercarpet": [ { "type": "scattercarpet", "marker": { "colorbar": { "ticks": "", "outlinewidth": 0 } } } ], "scattermapbox": [ { "type": "scattermapbox", "marker": { "colorbar": { "ticks": "", "outlinewidth": 0 } } } ], "scatterpolargl": [ { "type": "scatterpolargl", "marker": { "colorbar": { "ticks": "", "outlinewidth": 0 } } } ], "scatterternary": [ { "type": "scatterternary", "marker": { "colorbar": { "ticks": "", "outlinewidth": 0 } } } ], "histogram2dcontour": [ { "type": "histogram2dcontour", "colorbar": { "ticks": "", "outlinewidth": 0 }, "autocolorscale": true } ] }, "layout": { "geo": { "bgcolor": "white", "showland": true, "lakecolor": "white", "landcolor": "white", "showlakes": true, "subunitcolor": "#C8D4E3" }, "font": { "color": "#2a3f5f" }, "polar": { "bgcolor": "white", "radialaxis": { "ticks": "", "gridcolor": "#EBF0F8", "linecolor": "#EBF0F8" }, "angularaxis": { "ticks": "", "gridcolor": "#EBF0F8", "linecolor": "#EBF0F8" } }, "scene": { "xaxis": { "ticks": "", "gridcolor": "#DFE8F3", "gridwidth": 2, "linecolor": "#EBF0F8", "zerolinecolor": "#EBF0F8", "showbackground": true, "backgroundcolor": "white" }, "yaxis": { "ticks": "", "gridcolor": "#DFE8F3", "gridwidth": 2, "linecolor": "#EBF0F8", "zerolinecolor": "#EBF0F8", "showbackground": true, "backgroundcolor": "white" }, "zaxis": { "ticks": "", "gridcolor": "#DFE8F3", "gridwidth": 2, "linecolor": "#EBF0F8", "zerolinecolor": "#EBF0F8", "showbackground": true, "backgroundcolor": "white" } }, "title": { "x": 0.05 }, "xaxis": { "ticks": "", "gridcolor": "#EBF0F8", "linecolor": "#EBF0F8", "automargin": true, "zerolinecolor": "#EBF0F8", "zerolinewidth": 2 }, "yaxis": { "ticks": "", "gridcolor": "#EBF0F8", "linecolor": "#EBF0F8", "automargin": true, "zerolinecolor": "#EBF0F8", "zerolinewidth": 2 }, "ternary": { "aaxis": { "ticks": "", "gridcolor": "#DFE8F3", "linecolor": "#A2B1C6" }, "baxis": { "ticks": "", "gridcolor": "#DFE8F3", "linecolor": "#A2B1C6" }, "caxis": { "ticks": "", "gridcolor": "#DFE8F3", "linecolor": "#A2B1C6" }, "bgcolor": "white" }, "colorway": [ "#636efa", "#EF553B", "#00cc96", "#ab63fa", "#19d3f3", "#e763fa", "#fecb52", "#ffa15a", "#ff6692", "#b6e880" ], "hovermode": "closest", "colorscale": { "diverging": [ [ 0, "#8e0152" ], [ 0.1, "#c51b7d" ], [ 0.2, "#de77ae" ], [ 0.3, "#f1b6da" ], [ 0.4, "#fde0ef" ], [ 0.5, "#f7f7f7" ], [ 0.6, "#e6f5d0" ], [ 0.7, "#b8e186" ], [ 0.8, "#7fbc41" ], [ 0.9, "#4d9221" ], [ 1, "#276419" ] ], "sequential": [ [ 0, "#0508b8" ], [ 0.0893854748603352, "#1910d8" ], [ 0.1787709497206704, "#3c19f0" ], [ 0.2681564245810056, "#6b1cfb" ], [ 0.3575418994413408, "#981cfd" ], [ 0.44692737430167595, "#bf1cfd" ], [ 0.5363128491620112, "#dd2bfd" ], [ 0.6256983240223464, "#f246fe" ], [ 0.7150837988826816, "#fc67fd" ], [ 0.8044692737430168, "#fe88fc" ], [ 0.8938547486033519, "#fea5fd" ], [ 0.9832402234636871, "#febefe" ], [ 1, "#fec3fe" ] ], "sequentialminus": [ [ 0, "#0508b8" ], [ 0.0893854748603352, "#1910d8" ], [ 0.1787709497206704, "#3c19f0" ], [ 0.2681564245810056, "#6b1cfb" ], [ 0.3575418994413408, "#981cfd" ], [ 0.44692737430167595, "#bf1cfd" ], [ 0.5363128491620112, "#dd2bfd" ], [ 0.6256983240223464, "#f246fe" ], [ 0.7150837988826816, "#fc67fd" ], [ 0.8044692737430168, "#fe88fc" ], [ 0.8938547486033519, "#fea5fd" ], [ 0.9832402234636871, "#febefe" ], [ 1, "#fec3fe" ] ] }, "plot_bgcolor": "white", "paper_bgcolor": "white", "shapedefaults": { "line": { "width": 0 }, "opacity": 0.4, "fillcolor": "#506784" }, "annotationdefaults": { "arrowhead": 0, "arrowcolor": "#506784", "arrowwidth": 1 } }, "themeRef": "PLOTLY_WHITE" } } }, "height": null, "width": null, "user": { "profile_url": "https://chart-studio.plotly.com/~Roneel", "avatar_url": "https://storage.googleapis.com/plotly-prod-profiles/61.jpg", "background_url": "https://storage.googleapis.com/plotly-prod-profiles/bg-11.jpg", "bio": "", "nickname": "", "website": "", "stream_tokens": null, "feature_set_id": null, "csrf_token": null, "date_joined": "2025-06-17 22:59:38", "mapbox_access_tokens": null, "has_password": null, "username": "Roneel", "email": null, "is_active": null, "readonly": null, "is_dash_creator": null, "dash_created_count": null, "is_chart_creator": null, "charts_created_count": null } }, { "creation_time": "2025-06-18T00:13:55.224566Z", "comments": { "results": [], "count": 0 }, "parented": true, "embed_url": "https://chart-studio.plotly.com/~sriverardh/15.embed", "fid": "sriverardh:15", "filename": "Plot 15", "filetype": "plot", "img_url": "https://api.plotly.com/v2/files/sriverardh:15/image?image_name=list-thumb", "image_urls": { "default": "https://storage.googleapis.com/plotly-prod-images/sriverardh/15/2_6FTW8H8I538YR3O2PH2ZM6CBC4QCRC.png", "block-thumb": "https://storage.googleapis.com/plotly-prod-images/sriverardh/15/8_K5IR9V1RIX9BN30ON03UF1HZRLUUDA.png", "list-thumb": "https://api.plotly.com/v2/files/sriverardh:15/image?image_name=list-thumb" }, "api_urls": { "files": "https://api.plotly.com/v2/files/sriverardh:15", "plots": "https://api.plotly.com/v2/plots/sriverardh:15", "parent": "https://api.plotly.com/v2/folders/home?user=sriverardh" }, "owner": "sriverardh", "parent": -1, "preview": "", "referencers": [], "references": [], "title": "", "views": 0, "web_url": "https://chart-studio.plotly.com/~sriverardh/15/", "world_readable": true, "date_modified": "2025-06-18T00:18:24.785Z", "stars": { "results": [], "count": 0 }, "collaborators": { "results": [], "count": 0 }, "subfolder_count": null, "refresh_interval": null, "organize_view_url": "https://chart-studio.plotly.com/~sriverardh/15/", "current_user_permission": "read", "is_theme": null, "is_template": false, "autosize": true, "caption": "", "figure": { "data": [ { "meta": { "columnNames": { "x": "A", "y": "B" } }, "mode": "lines", "name": "Pigment A", "type": "scatter", "xsrc": "sriverardh:14:0feee4", "ysrc": "sriverardh:14:6cd4e3" }, { "meta": { "columnNames": { "x": "A", "y": "C" } }, "mode": "lines", "name": "Pigment B", "type": "scatter", "xsrc": "sriverardh:14:0feee4", "ysrc": "sriverardh:14:b85870", "stackgroup": null }, { "meta": { "columnNames": { "x": "A", "y": "D" } }, "mode": "lines", "name": "Pigment C", "type": "scatter", "xsrc": "sriverardh:14:0feee4", "ysrc": "sriverardh:14:ee7790", "stackgroup": null } ], "frames": [], "layout": { "title": { "text": "% Light Reflectance across visible Wavelengths (nm)" }, "xaxis": { "type": "linear", "range": [ 400, 700 ], "title": { "text": "Wavelength (nm)" }, "autorange": true }, "yaxis": { "type": "linear", "range": [ 34.55555555555556, 103.44444444444444 ], "title": { "text": "% Reflectance" }, "autorange": true }, "autosize": true, "template": { "data": { "bar": [ { "type": "bar", "marker": { "colorbar": { "ticks": "", "outlinewidth": 0 } } } ], "table": [ { "type": "table", "cells": { "fill": { "color": "#EBF0F8" }, "line": { "color": "white" } }, "header": { "fill": { "color": "#C8D4E3" }, "line": { "color": "white" } } } ], "carpet": [ { "type": "carpet", "aaxis": { "gridcolor": "#C8D4E3", "linecolor": "#C8D4E3", "endlinecolor": "#2a3f5f", "minorgridcolor": "#C8D4E3", "startlinecolor": "#2a3f5f" }, "baxis": { "gridcolor": "#C8D4E3", "linecolor": "#C8D4E3", "endlinecolor": "#2a3f5f", "minorgridcolor": "#C8D4E3", "startlinecolor": "#2a3f5f" } } ], "mesh3d": [ { "type": "mesh3d", "colorbar": { "ticks": "", "outlinewidth": 0 } } ], "contour": [ { "type": "contour", "colorbar": { "ticks": "", "outlinewidth": 0 }, "autocolorscale": true } ], "heatmap": [ { "type": "heatmap", "colorbar": { "ticks": "", "outlinewidth": 0 }, "autocolorscale": true } ], "scatter": [ { "type": "scatter", "marker": { "colorbar": { "ticks": "", "outlinewidth": 0 } } } ], "surface": [ { "type": "surface", "colorbar": { "ticks": "", "outlinewidth": 0 } } ], "heatmapgl": [ { "type": "heatmapgl", "colorbar": { "ticks": "", "outlinewidth": 0 } } ], "histogram": [ { "type": "histogram", "marker": { "colorbar": { "ticks": "", "outlinewidth": 0 } } } ], "parcoords": [ { "line": { "colorbar": { "ticks": "", "outlinewidth": 0 } }, "type": "parcoords" } ], "scatter3d": [ { "type": "scatter3d", "marker": { "colorbar": { "ticks": "", "outlinewidth": 0 } } } ], "scattergl": [ { "type": "scattergl", "marker": { "colorbar": { "ticks": "", "outlinewidth": 0 } } } ], "choropleth": [ { "type": "choropleth", "colorbar": { "ticks": "", "outlinewidth": 0 } } ], "scattergeo": [ { "type": "scattergeo", "marker": { "colorbar": { "ticks": "", "outlinewidth": 0 } } } ], "histogram2d": [ { "type": "histogram2d", "colorbar": { "ticks": "", "outlinewidth": 0 }, "autocolorscale": true } ], "scatterpolar": [ { "type": "scatterpolar", "marker": { "colorbar": { "ticks": "", "outlinewidth": 0 } } } ], "contourcarpet": [ { "type": "contourcarpet", "colorbar": { "ticks": "", "outlinewidth": 0 } } ], "scattercarpet": [ { "type": "scattercarpet", "marker": { "colorbar": { "ticks": "", "outlinewidth": 0 } } } ], "scattermapbox": [ { "type": "scattermapbox", "marker": { "colorbar": { "ticks": "", "outlinewidth": 0 } } } ], "scatterpolargl": [ { "type": "scatterpolargl", "marker": { "colorbar": { "ticks": "", "outlinewidth": 0 } } } ], "scatterternary": [ { "type": "scatterternary", "marker": { "colorbar": { "ticks": "", "outlinewidth": 0 } } } ], "histogram2dcontour": [ { "type": "histogram2dcontour", "colorbar": { "ticks": "", "outlinewidth": 0 }, "autocolorscale": true } ] }, "layout": { "geo": { "bgcolor": "white", "showland": true, "lakecolor": "white", "landcolor": "white", "showlakes": true, "subunitcolor": "#C8D4E3" }, "font": { "color": "#2a3f5f" }, "polar": { "bgcolor": "white", "radialaxis": { "ticks": "", "gridcolor": "#EBF0F8", "linecolor": "#EBF0F8" }, "angularaxis": { "ticks": "", "gridcolor": "#EBF0F8", "linecolor": "#EBF0F8" } }, "scene": { "xaxis": { "ticks": "", "gridcolor": "#DFE8F3", "gridwidth": 2, "linecolor": "#EBF0F8", "zerolinecolor": "#EBF0F8", "showbackground": true, "backgroundcolor": "white" }, "yaxis": { "ticks": "", "gridcolor": "#DFE8F3", "gridwidth": 2, "linecolor": "#EBF0F8", "zerolinecolor": "#EBF0F8", "showbackground": true, "backgroundcolor": "white" }, "zaxis": { "ticks": "", "gridcolor": "#DFE8F3", "gridwidth": 2, "linecolor": "#EBF0F8", "zerolinecolor": "#EBF0F8", "showbackground": true, "backgroundcolor": "white" } }, "title": { "x": 0.05 }, "xaxis": { "ticks": "", "gridcolor": "#EBF0F8", "linecolor": "#EBF0F8", "automargin": true, "zerolinecolor": "#EBF0F8", "zerolinewidth": 2 }, "yaxis": { "ticks": "", "gridcolor": "#EBF0F8", "linecolor": "#EBF0F8", "automargin": true, "zerolinecolor": "#EBF0F8", "zerolinewidth": 2 }, "ternary": { "aaxis": { "ticks": "", "gridcolor": "#DFE8F3", "linecolor": "#A2B1C6" }, "baxis": { "ticks": "", "gridcolor": "#DFE8F3", "linecolor": "#A2B1C6" }, "caxis": { "ticks": "", "gridcolor": "#DFE8F3", "linecolor": "#A2B1C6" }, "bgcolor": "white" }, "colorway": [ "#636efa", "#EF553B", "#00cc96", "#ab63fa", "#19d3f3", "#e763fa", "#fecb52", "#ffa15a", "#ff6692", "#b6e880" ], "hovermode": "closest", "colorscale": { "diverging": [ [ 0, "#8e0152" ], [ 0.1, "#c51b7d" ], [ 0.2, "#de77ae" ], [ 0.3, "#f1b6da" ], [ 0.4, "#fde0ef" ], [ 0.5, "#f7f7f7" ], [ 0.6, "#e6f5d0" ], [ 0.7, "#b8e186" ], [ 0.8, "#7fbc41" ], [ 0.9, "#4d9221" ], [ 1, "#276419" ] ], "sequential": [ [ 0, "#0508b8" ], [ 0.0893854748603352, "#1910d8" ], [ 0.1787709497206704, "#3c19f0" ], [ 0.2681564245810056, "#6b1cfb" ], [ 0.3575418994413408, "#981cfd" ], [ 0.44692737430167595, "#bf1cfd" ], [ 0.5363128491620112, "#dd2bfd" ], [ 0.6256983240223464, "#f246fe" ], [ 0.7150837988826816, "#fc67fd" ], [ 0.8044692737430168, "#fe88fc" ], [ 0.8938547486033519, "#fea5fd" ], [ 0.9832402234636871, "#febefe" ], [ 1, "#fec3fe" ] ], "sequentialminus": [ [ 0, "#0508b8" ], [ 0.0893854748603352, "#1910d8" ], [ 0.1787709497206704, "#3c19f0" ], [ 0.2681564245810056, "#6b1cfb" ], [ 0.3575418994413408, "#981cfd" ], [ 0.44692737430167595, "#bf1cfd" ], [ 0.5363128491620112, "#dd2bfd" ], [ 0.6256983240223464, "#f246fe" ], [ 0.7150837988826816, "#fc67fd" ], [ 0.8044692737430168, "#fe88fc" ], [ 0.8938547486033519, "#fea5fd" ], [ 0.9832402234636871, "#febefe" ], [ 1, "#fec3fe" ] ] }, "plot_bgcolor": "white", "paper_bgcolor": "white", "shapedefaults": { "line": { "width": 0 }, "opacity": 0.4, "fillcolor": "#506784" }, "annotationdefaults": { "arrowhead": 0, "arrowcolor": "#506784", "arrowwidth": 1 } }, "themeRef": "PLOTLY_WHITE" } } }, "height": null, "width": null, "user": { "profile_url": "https://chart-studio.plotly.com/~sriverardh", "avatar_url": "https://storage.googleapis.com/plotly-prod-profiles/58.jpg", "background_url": "https://storage.googleapis.com/plotly-prod-profiles/bg-0.jpg", "bio": "", "nickname": "", "website": "", "stream_tokens": null, "feature_set_id": null, "csrf_token": null, "date_joined": "2025-06-11 03:28:43", "mapbox_access_tokens": null, "has_password": null, "username": "sriverardh", "email": null, "is_active": null, "readonly": null, "is_dash_creator": null, "dash_created_count": null, "is_chart_creator": null, "charts_created_count": null } }, { "creation_time": "2025-06-18T00:07:11.416939Z", "comments": { "results": [], "count": 0 }, "parented": true, "embed_url": "https://chart-studio.plotly.com/~sriverardh/13.embed", "fid": "sriverardh:13", "filename": "Plot 13", "filetype": "plot", "img_url": "https://api.plotly.com/v2/files/sriverardh:13/image?image_name=list-thumb", "image_urls": { "default": "https://storage.googleapis.com/plotly-prod-images/sriverardh/13/2_VR44DZA7YSJV4RUOW77DFAOL54U61T.png", "block-thumb": "https://storage.googleapis.com/plotly-prod-images/sriverardh/13/8_EF0OCO5HMO2S1X4JT6NEQCO6TGOKWJ.png", "list-thumb": "https://api.plotly.com/v2/files/sriverardh:13/image?image_name=list-thumb" }, "api_urls": { "files": "https://api.plotly.com/v2/files/sriverardh:13", "plots": "https://api.plotly.com/v2/plots/sriverardh:13", "parent": "https://api.plotly.com/v2/folders/home?user=sriverardh" }, "owner": "sriverardh", "parent": -1, "preview": "", "referencers": [], "references": [], "title": "", "views": 0, "web_url": "https://chart-studio.plotly.com/~sriverardh/13/", "world_readable": true, "date_modified": "2025-06-18T00:07:11.430Z", "stars": { "results": [], "count": 0 }, "collaborators": { "results": [], "count": 0 }, "subfolder_count": null, "refresh_interval": null, "organize_view_url": "https://chart-studio.plotly.com/~sriverardh/13/", "current_user_permission": "read", "is_theme": null, "is_template": false, "autosize": true, "caption": "", "figure": { "data": [ { "meta": { "columnNames": { "x": "A", "y": "B" } }, "mode": "lines", "type": "scatter", "xsrc": "sriverardh:12:53cdc3", "ysrc": "sriverardh:12:8b0a3e" }, { "meta": { "columnNames": { "x": "A", "y": "C" } }, "mode": "lines", "type": "scatter", "xsrc": "sriverardh:12:53cdc3", "ysrc": "sriverardh:12:da0814", "stackgroup": null }, { "meta": { "columnNames": { "x": "A", "y": "D" } }, "mode": "lines", "type": "scatter", "xsrc": "sriverardh:12:53cdc3", "ysrc": "sriverardh:12:d83003", "stackgroup": null } ], "frames": [], "layout": { "title": { "text": "% Light Reflectance at various Wavelengths (nm)" }, "xaxis": { "type": "linear", "range": [ 250, 850 ], "title": { "text": "Wavelength (nm)" }, "autorange": false }, "yaxis": { "type": "linear", "range": [ 0.11111111111112848, 137.88888888888886 ], "title": { "text": "% Reflectance" }, "autorange": false }, "autosize": true, "dragmode": "zoom", "template": { "data": { "bar": [ { "type": "bar", "marker": { "colorbar": { "ticks": "", "outlinewidth": 0 } } } ], "table": [ { "type": "table", "cells": { "fill": { "color": "#EBF0F8" }, "line": { "color": "white" } }, "header": { "fill": { "color": "#C8D4E3" }, "line": { "color": "white" } } } ], "carpet": [ { "type": "carpet", "aaxis": { "gridcolor": "#C8D4E3", "linecolor": "#C8D4E3", "endlinecolor": "#2a3f5f", "minorgridcolor": "#C8D4E3", "startlinecolor": "#2a3f5f" }, "baxis": { "gridcolor": "#C8D4E3", "linecolor": "#C8D4E3", "endlinecolor": "#2a3f5f", "minorgridcolor": "#C8D4E3", "startlinecolor": "#2a3f5f" } } ], "mesh3d": [ { "type": "mesh3d", "colorbar": { "ticks": "", "outlinewidth": 0 } } ], "contour": [ { "type": "contour", "colorbar": { "ticks": "", "outlinewidth": 0 }, "autocolorscale": true } ], "heatmap": [ { "type": "heatmap", "colorbar": { "ticks": "", "outlinewidth": 0 }, "autocolorscale": true } ], "scatter": [ { "type": "scatter", "marker": { "colorbar": { "ticks": "", "outlinewidth": 0 } } } ], "surface": [ { "type": "surface", "colorbar": { "ticks": "", "outlinewidth": 0 } } ], "heatmapgl": [ { "type": "heatmapgl", "colorbar": { "ticks": "", "outlinewidth": 0 } } ], "histogram": [ { "type": "histogram", "marker": { "colorbar": { "ticks": "", "outlinewidth": 0 } } } ], "parcoords": [ { "line": { "colorbar": { "ticks": "", "outlinewidth": 0 } }, "type": "parcoords" } ], "scatter3d": [ { "type": "scatter3d", "marker": { "colorbar": { "ticks": "", "outlinewidth": 0 } } } ], "scattergl": [ { "type": "scattergl", "marker": { "colorbar": { "ticks": "", "outlinewidth": 0 } } } ], "choropleth": [ { "type": "choropleth", "colorbar": { "ticks": "", "outlinewidth": 0 } } ], "scattergeo": [ { "type": "scattergeo", "marker": { "colorbar": { "ticks": "", "outlinewidth": 0 } } } ], "histogram2d": [ { "type": "histogram2d", "colorbar": { "ticks": "", "outlinewidth": 0 }, "autocolorscale": true } ], "scatterpolar": [ { "type": "scatterpolar", "marker": { "colorbar": { "ticks": "", "outlinewidth": 0 } } } ], "contourcarpet": [ { "type": "contourcarpet", "colorbar": { "ticks": "", "outlinewidth": 0 } } ], "scattercarpet": [ { "type": "scattercarpet", "marker": { "colorbar": { "ticks": "", "outlinewidth": 0 } } } ], "scattermapbox": [ { "type": "scattermapbox", "marker": { "colorbar": { "ticks": "", "outlinewidth": 0 } } } ], "scatterpolargl": [ { "type": "scatterpolargl", "marker": { "colorbar": { "ticks": "", "outlinewidth": 0 } } } ], "scatterternary": [ { "type": "scatterternary", "marker": { "colorbar": { "ticks": "", "outlinewidth": 0 } } } ], "histogram2dcontour": [ { "type": "histogram2dcontour", "colorbar": { "ticks": "", "outlinewidth": 0 }, "autocolorscale": true } ] }, "layout": { "geo": { "bgcolor": "white", "showland": true, "lakecolor": "white", "landcolor": "white", "showlakes": true, "subunitcolor": "#C8D4E3" }, "font": { "color": "#2a3f5f" }, "polar": { "bgcolor": "white", "radialaxis": { "ticks": "", "gridcolor": "#EBF0F8", "linecolor": "#EBF0F8" }, "angularaxis": { "ticks": "", "gridcolor": "#EBF0F8", "linecolor": "#EBF0F8" } }, "scene": { "xaxis": { "ticks": "", "gridcolor": "#DFE8F3", "gridwidth": 2, "linecolor": "#EBF0F8", "zerolinecolor": "#EBF0F8", "showbackground": true, "backgroundcolor": "white" }, "yaxis": { "ticks": "", "gridcolor": "#DFE8F3", "gridwidth": 2, "linecolor": "#EBF0F8", "zerolinecolor": "#EBF0F8", "showbackground": true, "backgroundcolor": "white" }, "zaxis": { "ticks": "", "gridcolor": "#DFE8F3", "gridwidth": 2, "linecolor": "#EBF0F8", "zerolinecolor": "#EBF0F8", "showbackground": true, "backgroundcolor": "white" } }, "title": { "x": 0.05 }, "xaxis": { "ticks": "", "gridcolor": "#EBF0F8", "linecolor": "#EBF0F8", "automargin": true, "zerolinecolor": "#EBF0F8", "zerolinewidth": 2 }, "yaxis": { "ticks": "", "gridcolor": "#EBF0F8", "linecolor": "#EBF0F8", "automargin": true, "zerolinecolor": "#EBF0F8", "zerolinewidth": 2 }, "ternary": { "aaxis": { "ticks": "", "gridcolor": "#DFE8F3", "linecolor": "#A2B1C6" }, "baxis": { "ticks": "", "gridcolor": "#DFE8F3", "linecolor": "#A2B1C6" }, "caxis": { "ticks": "", "gridcolor": "#DFE8F3", "linecolor": "#A2B1C6" }, "bgcolor": "white" }, "colorway": [ "#636efa", "#EF553B", "#00cc96", "#ab63fa", "#19d3f3", "#e763fa", "#fecb52", "#ffa15a", "#ff6692", "#b6e880" ], "hovermode": "closest", "colorscale": { "diverging": [ [ 0, "#8e0152" ], [ 0.1, "#c51b7d" ], [ 0.2, "#de77ae" ], [ 0.3, "#f1b6da" ], [ 0.4, "#fde0ef" ], [ 0.5, "#f7f7f7" ], [ 0.6, "#e6f5d0" ], [ 0.7, "#b8e186" ], [ 0.8, "#7fbc41" ], [ 0.9, "#4d9221" ], [ 1, "#276419" ] ], "sequential": [ [ 0, "#0508b8" ], [ 0.0893854748603352, "#1910d8" ], [ 0.1787709497206704, "#3c19f0" ], [ 0.2681564245810056, "#6b1cfb" ], [ 0.3575418994413408, "#981cfd" ], [ 0.44692737430167595, "#bf1cfd" ], [ 0.5363128491620112, "#dd2bfd" ], [ 0.6256983240223464, "#f246fe" ], [ 0.7150837988826816, "#fc67fd" ], [ 0.8044692737430168, "#fe88fc" ], [ 0.8938547486033519, "#fea5fd" ], [ 0.9832402234636871, "#febefe" ], [ 1, "#fec3fe" ] ], "sequentialminus": [ [ 0, "#0508b8" ], [ 0.0893854748603352, "#1910d8" ], [ 0.1787709497206704, "#3c19f0" ], [ 0.2681564245810056, "#6b1cfb" ], [ 0.3575418994413408, "#981cfd" ], [ 0.44692737430167595, "#bf1cfd" ], [ 0.5363128491620112, "#dd2bfd" ], [ 0.6256983240223464, "#f246fe" ], [ 0.7150837988826816, "#fc67fd" ], [ 0.8044692737430168, "#fe88fc" ], [ 0.8938547486033519, "#fea5fd" ], [ 0.9832402234636871, "#febefe" ], [ 1, "#fec3fe" ] ] }, "plot_bgcolor": "white", "paper_bgcolor": "white", "shapedefaults": { "line": { "width": 0 }, "opacity": 0.4, "fillcolor": "#506784" }, "annotationdefaults": { "arrowhead": 0, "arrowcolor": "#506784", "arrowwidth": 1 } }, "themeRef": "PLOTLY_WHITE" } } }, "height": null, "width": null, "user": { "profile_url": "https://chart-studio.plotly.com/~sriverardh", "avatar_url": "https://storage.googleapis.com/plotly-prod-profiles/58.jpg", "background_url": "https://storage.googleapis.com/plotly-prod-profiles/bg-0.jpg", "bio": "", "nickname": "", "website": "", "stream_tokens": null, "feature_set_id": null, "csrf_token": null, "date_joined": "2025-06-11 03:28:43", "mapbox_access_tokens": null, "has_password": null, "username": "sriverardh", "email": null, "is_active": null, "readonly": null, "is_dash_creator": null, "dash_created_count": null, "is_chart_creator": null, "charts_created_count": null } }, { "creation_time": "2025-06-17T23:24:07.907061Z", "comments": { "results": [], "count": 0 }, "parented": true, "embed_url": "https://chart-studio.plotly.com/~maricaplotly/1.embed", "fid": "maricaplotly:1", "filename": "Plot 1", "filetype": "plot", "img_url": "https://api.plotly.com/v2/files/maricaplotly:1/image?image_name=list-thumb", "image_urls": { "default": "https://storage.googleapis.com/plotly-prod-images/maricaplotly/1/2_1UJKVLQ0ZRRWO8OXPJUJIB9DJ7V04X.png", "block-thumb": "https://storage.googleapis.com/plotly-prod-images/maricaplotly/1/8_VGO3EZWO1NRF7Z8NJ4FDYFAKT04Z9Y.png", "list-thumb": "https://api.plotly.com/v2/files/maricaplotly:1/image?image_name=list-thumb" }, "api_urls": { "files": "https://api.plotly.com/v2/files/maricaplotly:1", "plots": "https://api.plotly.com/v2/plots/maricaplotly:1", "parent": "https://api.plotly.com/v2/folders/home?user=maricaplotly" }, "owner": "maricaplotly", "parent": -1, "preview": "", "referencers": [], "references": [], "title": "", "views": 0, "web_url": "https://chart-studio.plotly.com/~maricaplotly/1/", "world_readable": true, "date_modified": "2025-06-17T23:24:07.918Z", "stars": { "results": [], "count": 0 }, "collaborators": { "results": [], "count": 0 }, "subfolder_count": null, "refresh_interval": null, "organize_view_url": "https://chart-studio.plotly.com/~maricaplotly/1/", "current_user_permission": "read", "is_theme": null, "is_template": false, "autosize": true, "caption": "", "figure": { "data": [ { "meta": { "columnNames": { "x": "Year", "y": "Glob - NHem - SHem - 24N-90N - 24S-24N - 90S-24S - 64N-90N - 44N-64N - 24N-44N - EQU-24N - 24S-EQU - 44S-24S - 64S-44S - 90S-64S" } }, "mode": "markers", "type": "scatter", "xsrc": "maricaplotly:0:11f9e4", "ysrc": "maricaplotly:0:6411c9,0f8078,b8cb67,7b3326,5b6f43,ea1007,f5734c,80dfea,f39510,6305e8,dc74f2,c31200,499ab4,8004b0*", "orientation": "v" } ], "frames": [], "layout": { "title": { "text": "ExcelFormattedGISTEMPData2CSV- s11160172" }, "xaxis": { "type": "linear", "range": [ 1872.0748966942149, 2021.9251033057851 ], "title": { "text": "Year" }, "autorange": true }, "yaxis": { "type": "multicategory", "range": [ -8.539473684210527, 140.53947368421052 ], "title": { "text": "ExcelFormattedGISTEMPData2CSV" }, "autorange": true }, "autosize": true, "template": { "data": { "bar": [ { "type": "bar", "marker": { "colorbar": { "ticks": "", "outlinewidth": 0 } } } ], "table": [ { "type": "table", "cells": { "fill": { "color": "#EBF0F8" }, "line": { "color": "white" } }, "header": { "fill": { "color": "#C8D4E3" }, "line": { "color": "white" } } } ], "carpet": [ { "type": "carpet", "aaxis": { "gridcolor": "#C8D4E3", "linecolor": "#C8D4E3", "endlinecolor": "#2a3f5f", "minorgridcolor": "#C8D4E3", "startlinecolor": "#2a3f5f" }, "baxis": { "gridcolor": "#C8D4E3", "linecolor": "#C8D4E3", "endlinecolor": "#2a3f5f", "minorgridcolor": "#C8D4E3", "startlinecolor": "#2a3f5f" } } ], "mesh3d": [ { "type": "mesh3d", "colorbar": { "ticks": "", "outlinewidth": 0 } } ], "contour": [ { "type": "contour", "colorbar": { "ticks": "", "outlinewidth": 0 }, "autocolorscale": true } ], "heatmap": [ { "type": "heatmap", "colorbar": { "ticks": "", "outlinewidth": 0 }, "autocolorscale": true } ], "scatter": [ { "type": "scatter", "marker": { "colorbar": { "ticks": "", "outlinewidth": 0 } } } ], "surface": [ { "type": "surface", "colorbar": { "ticks": "", "outlinewidth": 0 } } ], "heatmapgl": [ { "type": "heatmapgl", "colorbar": { "ticks": "", "outlinewidth": 0 } } ], "histogram": [ { "type": "histogram", "marker": { "colorbar": { "ticks": "", "outlinewidth": 0 } } } ], "parcoords": [ { "line": { "colorbar": { "ticks": "", "outlinewidth": 0 } }, "type": "parcoords" } ], "scatter3d": [ { "type": "scatter3d", "marker": { "colorbar": { "ticks": "", "outlinewidth": 0 } } } ], "scattergl": [ { "type": "scattergl", "marker": { "colorbar": { "ticks": "", "outlinewidth": 0 } } } ], "choropleth": [ { "type": "choropleth", "colorbar": { "ticks": "", "outlinewidth": 0 } } ], "scattergeo": [ { "type": "scattergeo", "marker": { "colorbar": { "ticks": "", "outlinewidth": 0 } } } ], "histogram2d": [ { "type": "histogram2d", "colorbar": { "ticks": "", "outlinewidth": 0 }, "autocolorscale": true } ], "scatterpolar": [ { "type": "scatterpolar", "marker": { "colorbar": { "ticks": "", "outlinewidth": 0 } } } ], "contourcarpet": [ { "type": "contourcarpet", "colorbar": { "ticks": "", "outlinewidth": 0 } } ], "scattercarpet": [ { "type": "scattercarpet", "marker": { "colorbar": { "ticks": "", "outlinewidth": 0 } } } ], "scattermapbox": [ { "type": "scattermapbox", "marker": { "colorbar": { "ticks": "", "outlinewidth": 0 } } } ], "scatterpolargl": [ { "type": "scatterpolargl", "marker": { "colorbar": { "ticks": "", "outlinewidth": 0 } } } ], "scatterternary": [ { "type": "scatterternary", "marker": { "colorbar": { "ticks": "", "outlinewidth": 0 } } } ], "histogram2dcontour": [ { "type": "histogram2dcontour", "colorbar": { "ticks": "", "outlinewidth": 0 }, "autocolorscale": true } ] }, "layout": { "geo": { "bgcolor": "white", "showland": true, "lakecolor": "white", "landcolor": "white", "showlakes": true, "subunitcolor": "#C8D4E3" }, "font": { "color": "#2a3f5f" }, "polar": { "bgcolor": "white", "radialaxis": { "ticks": "", "gridcolor": "#EBF0F8", "linecolor": "#EBF0F8" }, "angularaxis": { "ticks": "", "gridcolor": "#EBF0F8", "linecolor": "#EBF0F8" } }, "scene": { "xaxis": { "ticks": "", "gridcolor": "#DFE8F3", "gridwidth": 2, "linecolor": "#EBF0F8", "zerolinecolor": "#EBF0F8", "showbackground": true, "backgroundcolor": "white" }, "yaxis": { "ticks": "", "gridcolor": "#DFE8F3", "gridwidth": 2, "linecolor": "#EBF0F8", "zerolinecolor": "#EBF0F8", "showbackground": true, "backgroundcolor": "white" }, "zaxis": { "ticks": "", "gridcolor": "#DFE8F3", "gridwidth": 2, "linecolor": "#EBF0F8", "zerolinecolor": "#EBF0F8", "showbackground": true, "backgroundcolor": "white" } }, "title": { "x": 0.05 }, "xaxis": { "ticks": "", "gridcolor": "#EBF0F8", "linecolor": "#EBF0F8", "automargin": true, "zerolinecolor": "#EBF0F8", "zerolinewidth": 2 }, "yaxis": { "ticks": "", "gridcolor": "#EBF0F8", "linecolor": "#EBF0F8", "automargin": true, "zerolinecolor": "#EBF0F8", "zerolinewidth": 2 }, "ternary": { "aaxis": { "ticks": "", "gridcolor": "#DFE8F3", "linecolor": "#A2B1C6" }, "baxis": { "ticks": "", "gridcolor": "#DFE8F3", "linecolor": "#A2B1C6" }, "caxis": { "ticks": "", "gridcolor": "#DFE8F3", "linecolor": "#A2B1C6" }, "bgcolor": "white" }, "colorway": [ "#636efa", "#EF553B", "#00cc96", "#ab63fa", "#19d3f3", "#e763fa", "#fecb52", "#ffa15a", "#ff6692", "#b6e880" ], "hovermode": "closest", "colorscale": { "diverging": [ [ 0, "#8e0152" ], [ 0.1, "#c51b7d" ], [ 0.2, "#de77ae" ], [ 0.3, "#f1b6da" ], [ 0.4, "#fde0ef" ], [ 0.5, "#f7f7f7" ], [ 0.6, "#e6f5d0" ], [ 0.7, "#b8e186" ], [ 0.8, "#7fbc41" ], [ 0.9, "#4d9221" ], [ 1, "#276419" ] ], "sequential": [ [ 0, "#0508b8" ], [ 0.0893854748603352, "#1910d8" ], [ 0.1787709497206704, "#3c19f0" ], [ 0.2681564245810056, "#6b1cfb" ], [ 0.3575418994413408, "#981cfd" ], [ 0.44692737430167595, "#bf1cfd" ], [ 0.5363128491620112, "#dd2bfd" ], [ 0.6256983240223464, "#f246fe" ], [ 0.7150837988826816, "#fc67fd" ], [ 0.8044692737430168, "#fe88fc" ], [ 0.8938547486033519, "#fea5fd" ], [ 0.9832402234636871, "#febefe" ], [ 1, "#fec3fe" ] ], "sequentialminus": [ [ 0, "#0508b8" ], [ 0.0893854748603352, "#1910d8" ], [ 0.1787709497206704, "#3c19f0" ], [ 0.2681564245810056, "#6b1cfb" ], [ 0.3575418994413408, "#981cfd" ], [ 0.44692737430167595, "#bf1cfd" ], [ 0.5363128491620112, "#dd2bfd" ], [ 0.6256983240223464, "#f246fe" ], [ 0.7150837988826816, "#fc67fd" ], [ 0.8044692737430168, "#fe88fc" ], [ 0.8938547486033519, "#fea5fd" ], [ 0.9832402234636871, "#febefe" ], [ 1, "#fec3fe" ] ] }, "plot_bgcolor": "white", "paper_bgcolor": "white", "shapedefaults": { "line": { "width": 0 }, "opacity": 0.4, "fillcolor": "#506784" }, "annotationdefaults": { "arrowhead": 0, "arrowcolor": "#506784", "arrowwidth": 1 } }, "themeRef": "PLOTLY_WHITE" } } }, "height": null, "width": null, "user": { "profile_url": "https://chart-studio.plotly.com/~maricaplotly", "avatar_url": "https://storage.googleapis.com/plotly-prod-profiles/80.jpg", "background_url": "https://storage.googleapis.com/plotly-prod-profiles/bg-12.jpg", "bio": "", "nickname": "", "website": "", "stream_tokens": null, "feature_set_id": null, "csrf_token": null, "date_joined": "2025-06-17 23:04:42", "mapbox_access_tokens": null, "has_password": null, "username": "maricaplotly", "email": null, "is_active": null, "readonly": null, "is_dash_creator": null, "dash_created_count": null, "is_chart_creator": null, "charts_created_count": null } }, { "creation_time": "2025-06-17T22:54:02.247176Z", "comments": { "results": [], "count": 0 }, "parented": true, "embed_url": "https://chart-studio.plotly.com/~miasuresh17/1.embed", "fid": "miasuresh17:1", "filename": "Plot 1", "filetype": "plot", "img_url": "https://api.plotly.com/v2/files/miasuresh17:1/image?image_name=list-thumb", "image_urls": { "default": "https://storage.googleapis.com/plotly-prod-images/miasuresh17/1/2_QOHYLBHX4JYDW6A0R9S32KZLR4DH77.png", "block-thumb": "https://storage.googleapis.com/plotly-prod-images/miasuresh17/1/8_XELY38ZGCNCLT6VA43FHLJTVWH0UKM.png", "list-thumb": "https://api.plotly.com/v2/files/miasuresh17:1/image?image_name=list-thumb" }, "api_urls": { "files": "https://api.plotly.com/v2/files/miasuresh17:1", "plots": "https://api.plotly.com/v2/plots/miasuresh17:1", "parent": "https://api.plotly.com/v2/folders/home?user=miasuresh17" }, "owner": "miasuresh17", "parent": -1, "preview": "", "referencers": [], "references": [], "title": "", "views": 0, "web_url": "https://chart-studio.plotly.com/~miasuresh17/1/", "world_readable": true, "date_modified": "2025-06-17T22:54:02.262Z", "stars": { "results": [], "count": 0 }, "collaborators": { "results": [], "count": 0 }, "subfolder_count": null, "refresh_interval": null, "organize_view_url": "https://chart-studio.plotly.com/~miasuresh17/1/", "current_user_permission": "read", "is_theme": null, "is_template": false, "autosize": true, "caption": "", "figure": { "data": [ { "meta": { "columnNames": { "x": "Outliers, x", "y": "Outliers, y", "z": "Outliers, z", "ids": "Outliers, ids", "text": "Outliers, text" } }, "mode": "markers", "name": "Outliers", "type": "scatter3d", "xsrc": "miasuresh17:0:44f864", "ysrc": "miasuresh17:0:6cd085", "zsrc": "miasuresh17:0:6c95eb", "idssrc": "miasuresh17:0:0d1335", "marker": { "size": 4, "color": "rgba(40,40,40,0.2)", "opacity": 1 }, "textsrc": "miasuresh17:0:214dfe", "trace_id": "0", "hovertemplate": "<b>ID:</b> %{id}<br><b>Cluster:</b> Outliers<br><b>Text:</b> %{text}<extra></extra>" }, { "meta": { "columnNames": { "x": "Cluster #1 - Critical Analysis of the role of ChatGPT in Education, x", "y": "Cluster #1 - Critical Analysis of the role of ChatGPT in Education, y", "z": "Cluster #1 - Critical Analysis of the role of ChatGPT in Education, z", "ids": "Cluster #1 - Critical Analysis of the role of ChatGPT in Education, ids", "text": "Cluster #1 - Critical Analysis of the role of ChatGPT in Education, text" } }, "mode": "markers", "name": "Cluster #1 - Critical Analysis of the role of ChatGPT in Education", "type": "scatter3d", "xsrc": "miasuresh17:0:685168", "ysrc": "miasuresh17:0:2383f9", "zsrc": "miasuresh17:0:dedfa9", "idssrc": "miasuresh17:0:554222", "marker": { "size": 4, "opacity": 1 }, "textsrc": "miasuresh17:0:34a7ba", "trace_id": "1", "hovertemplate": "<b>ID:</b> %{id}<br><b>Cluster:</b> Cluster #1 - Critical Analysis of the role of ChatGPT in Education<br><b>Text:</b> %{text}<extra></extra>" }, { "meta": { "columnNames": { "x": "Cluster #2 -AI in Education: Critical Thinking vs. Automation , x", "y": "Cluster #2 -AI in Education: Critical Thinking vs. Automation , y", "z": "Cluster #2 -AI in Education: Critical Thinking vs. Automation , z", "ids": "Cluster #2 -AI in Education: Critical Thinking vs. Automation , ids", "text": "Cluster #2 -AI in Education: Critical Thinking vs. Automation , text" } }, "mode": "markers", "name": "Cluster #2 -AI in Education: Critical Thinking vs. Automation ", "type": "scatter3d", "xsrc": "miasuresh17:0:5d98f9", "ysrc": "miasuresh17:0:f1e271", "zsrc": "miasuresh17:0:f4beaa", "idssrc": "miasuresh17:0:d36cda", "marker": { "size": 4, "opacity": 1 }, "textsrc": "miasuresh17:0:bd66bd", "trace_id": "2", "hovertemplate": "<b>ID:</b> %{id}<br><b>Cluster:</b> Cluster #2 -AI in Education: Critical Thinking vs. Automation <br><b>Text:</b> %{text}<extra></extra>" }, { "meta": { "columnNames": { "x": "Cluster #3 - AI in Education: Grades vs. Growth, x", "y": "Cluster #3 - AI in Education: Grades vs. Growth, y", "z": "Cluster #3 - AI in Education: Grades vs. Growth, z", "ids": "Cluster #3 - AI in Education: Grades vs. Growth, ids", "text": "Cluster #3 - AI in Education: Grades vs. Growth, text" } }, "mode": "markers", "name": "Cluster #3 - AI in Education: Grades vs. Growth", "type": "scatter3d", "xsrc": "miasuresh17:0:4e09b1", "ysrc": "miasuresh17:0:84dc0c", "zsrc": "miasuresh17:0:27ecc5", "idssrc": "miasuresh17:0:ff616e", "marker": { "size": 4, "opacity": 1 }, "textsrc": "miasuresh17:0:336191", "trace_id": "3", "hovertemplate": "<b>ID:</b> %{id}<br><b>Cluster:</b> Cluster #3 - AI in Education: Grades vs. Growth<br><b>Text:</b> %{text}<extra></extra>" }, { "meta": { "columnNames": { "x": "Cluster #4 - Educator and Student Endorsements of Critical Dialogue, x", "y": "Cluster #4 - Educator and Student Endorsements of Critical Dialogue, y", "z": "Cluster #4 - Educator and Student Endorsements of Critical Dialogue, z", "ids": "Cluster #4 - Educator and Student Endorsements of Critical Dialogue, ids", "text": "Cluster #4 - Educator and Student Endorsements of Critical Dialogue, text" } }, "mode": "markers", "name": "Cluster #4 - Educator and Student Endorsements of Critical Dialogue", "type": "scatter3d", "xsrc": "miasuresh17:0:424e2a", "ysrc": "miasuresh17:0:c021f7", "zsrc": "miasuresh17:0:bfd003", "idssrc": "miasuresh17:0:7cd4c6", "marker": { "size": 4, "opacity": 1 }, "textsrc": "miasuresh17:0:e34ef2", "trace_id": "4", "hovertemplate": "<b>ID:</b> %{id}<br><b>Cluster:</b> Cluster #4 - Educator and Student Endorsements of Critical Dialogue<br><b>Text:</b> %{text}<extra></extra>" }, { "meta": { "columnNames": { "x": "Cluster #5 - Abolish Homework Movement, x", "y": "Cluster #5 - Abolish Homework Movement, y", "z": "Cluster #5 - Abolish Homework Movement, z", "ids": "Cluster #5 - Abolish Homework Movement, ids", "text": "Cluster #5 - Abolish Homework Movement, text" } }, "mode": "markers", "name": "Cluster #5 - Abolish Homework Movement", "type": "scatter3d", "xsrc": "miasuresh17:0:d082a0", "ysrc": "miasuresh17:0:73714b", "zsrc": "miasuresh17:0:f08c48", "idssrc": "miasuresh17:0:9b8bff", "marker": { "size": 4, "opacity": 1 }, "textsrc": "miasuresh17:0:83fec9", "trace_id": "5", "hovertemplate": "<b>ID:</b> %{id}<br><b>Cluster:</b> Cluster #5 - Abolish Homework Movement<br><b>Text:</b> %{text}<extra></extra>" }, { "meta": { "columnNames": { "x": "Cluster #6 - Alternative Assessment Methods, x", "y": "Cluster #6 - Alternative Assessment Methods, y", "z": "Cluster #6 - Alternative Assessment Methods, z", "ids": "Cluster #6 - Alternative Assessment Methods, ids", "text": "Cluster #6 - Alternative Assessment Methods, text" } }, "mode": "markers", "name": "Cluster #6 - Alternative Assessment Methods", "type": "scatter3d", "xsrc": "miasuresh17:0:670505", "ysrc": "miasuresh17:0:0b3474", "zsrc": "miasuresh17:0:36ab4c", "idssrc": "miasuresh17:0:66a3e7", "marker": { "size": 4, "opacity": 1 }, "textsrc": "miasuresh17:0:9e348a", "trace_id": "6", "hovertemplate": "<b>ID:</b> %{id}<br><b>Cluster:</b> Cluster #6 - Alternative Assessment Methods<br><b>Text:</b> %{text}<extra></extra>" }, { "meta": { "columnNames": { "x": "Cluster #7 - Criticism of AI Detection Tools, x", "y": "Cluster #7 - Criticism of AI Detection Tools, y", "z": "Cluster #7 - Criticism of AI Detection Tools, z", "ids": "Cluster #7 - Criticism of AI Detection Tools, ids", "text": "Cluster #7 - Criticism of AI Detection Tools, text" } }, "mode": "markers", "name": "Cluster #7 - Criticism of AI Detection Tools", "type": "scatter3d", "xsrc": "miasuresh17:0:416a9e", "ysrc": "miasuresh17:0:d05942", "zsrc": "miasuresh17:0:4b84df", "idssrc": "miasuresh17:0:00f990", "marker": { "size": 4, "opacity": 1 }, "textsrc": "miasuresh17:0:d170e7", "trace_id": "7", "hovertemplate": "<b>ID:</b> %{id}<br><b>Cluster:</b> Cluster #7 - Criticism of AI Detection Tools<br><b>Text:</b> %{text}<extra></extra>" }, { "meta": { "columnNames": { "x": "Cluster #8 - Cynicism Toward Technological Gatekeeping, x", "y": "Cluster #8 - Cynicism Toward Technological Gatekeeping, y", "z": "Cluster #8 - Cynicism Toward Technological Gatekeeping, z", "ids": "Cluster #8 - Cynicism Toward Technological Gatekeeping, ids", "text": "Cluster #8 - Cynicism Toward Technological Gatekeeping, text" } }, "mode": "markers", "name": "Cluster #8 - Cynicism Toward Technological Gatekeeping", "type": "scatter3d", "xsrc": "miasuresh17:0:71a838", "ysrc": "miasuresh17:0:336df5", "zsrc": "miasuresh17:0:2b24a3", "idssrc": "miasuresh17:0:57a7ae", "marker": { "size": 4, "opacity": 1 }, "textsrc": "miasuresh17:0:fa79c2", "trace_id": "8", "hovertemplate": "<b>ID:</b> %{id}<br><b>Cluster:</b> Cluster #8 - Cynicism Toward Technological Gatekeeping<br><b>Text:</b> %{text}<extra></extra>" }, { "meta": { "columnNames": { "x": "Cluster #9 - Critique of Punitive Education Systems, x", "y": "Cluster #9 - Critique of Punitive Education Systems, y", "z": "Cluster #9 - Critique of Punitive Education Systems, z", "ids": "Cluster #9 - Critique of Punitive Education Systems, ids", "text": "Cluster #9 - Critique of Punitive Education Systems, text" } }, "mode": "markers", "name": "Cluster #9 - Critique of Punitive Education Systems", "type": "scatter3d", "xsrc": "miasuresh17:0:cfa318", "ysrc": "miasuresh17:0:4913ff", "zsrc": "miasuresh17:0:924fa4", "idssrc": "miasuresh17:0:fb271a", "marker": { "size": 4, "opacity": 1 }, "textsrc": "miasuresh17:0:0a83aa", "trace_id": "9", "hovertemplate": "<b>ID:</b> %{id}<br><b>Cluster:</b> Cluster #9 - Critique of Punitive Education Systems<br><b>Text:</b> %{text}<extra></extra>" }, { "meta": { "columnNames": { "x": "Cluster #10 - Automation and Job Displacement Anxiety related to AI, x", "y": "Cluster #10 - Automation and Job Displacement Anxiety related to AI, y", "z": "Cluster #10 - Automation and Job Displacement Anxiety related to AI, z", "ids": "Cluster #10 - Automation and Job Displacement Anxiety related to AI, ids", "text": "Cluster #10 - Automation and Job Displacement Anxiety related to AI, text" } }, "mode": "markers", "name": "Cluster #10 - Automation and Job Displacement Anxiety related to AI", "type": "scatter3d", "xsrc": "miasuresh17:0:de126f", "ysrc": "miasuresh17:0:4282f0", "zsrc": "miasuresh17:0:10401e", "idssrc": "miasuresh17:0:8cb789", "marker": { "size": 4, "opacity": 1 }, "textsrc": "miasuresh17:0:3908c8", "trace_id": "10", "hovertemplate": "<b>ID:</b> %{id}<br><b>Cluster:</b> Cluster #10 - Automation and Job Displacement Anxiety related to AI<br><b>Text:</b> %{text}<extra></extra>" }, { "meta": { "columnNames": { "x": "Cluster #11 - Historical Parallels with Calculators and AI, x", "y": "Cluster #11 - Historical Parallels with Calculators and AI, y", "z": "Cluster #11 - Historical Parallels with Calculators and AI, z", "ids": "Cluster #11 - Historical Parallels with Calculators and AI, ids", "text": "Cluster #11 - Historical Parallels with Calculators and AI, text" } }, "mode": "markers", "name": "Cluster #11 - Historical Parallels with Calculators and AI", "type": "scatter3d", "xsrc": "miasuresh17:0:c1d9d3", "ysrc": "miasuresh17:0:f07d4a", "zsrc": "miasuresh17:0:cfea93", "idssrc": "miasuresh17:0:61280e", "marker": { "size": 4, "opacity": 1 }, "textsrc": "miasuresh17:0:f18be5", "trace_id": "11", "hovertemplate": "<b>ID:</b> %{id}<br><b>Cluster:</b> Cluster #11 - Historical Parallels with Calculators and AI<br><b>Text:</b> %{text}<extra></extra>" }, { "meta": { "columnNames": { "x": "Cluster #12 - Systemic Failure of Traditional Education, x", "y": "Cluster #12 - Systemic Failure of Traditional Education, y", "z": "Cluster #12 - Systemic Failure of Traditional Education, z", "ids": "Cluster #12 - Systemic Failure of Traditional Education, ids", "text": "Cluster #12 - Systemic Failure of Traditional Education, text" } }, "mode": "markers", "name": "Cluster #12 - Systemic Failure of Traditional Education", "type": "scatter3d", "xsrc": "miasuresh17:0:acb95b", "ysrc": "miasuresh17:0:4ee69b", "zsrc": "miasuresh17:0:deddaf", "idssrc": "miasuresh17:0:64e646", "marker": { "size": 4, "opacity": 1 }, "textsrc": "miasuresh17:0:b15064", "trace_id": "12", "hovertemplate": "<b>ID:</b> %{id}<br><b>Cluster:</b> Cluster #12 - Systemic Failure of Traditional Education<br><b>Text:</b> %{text}<extra></extra>" }, { "meta": { "columnNames": { "x": "Trace 13, x", "y": "Trace 13, y", "z": "Trace 13, z", "text": "Trace 13, text" } }, "mode": "text", "type": "scatter3d", "xsrc": "miasuresh17:0:eaf224", "ysrc": "miasuresh17:0:28eb4a", "zsrc": "miasuresh17:0:f9ab09", "layout": { "title": { "x": 0.5, "y": 0.9, "font": { "size": 14 }, "text": "Dataset Name: VOX Video | Platform: File | # Records: 568 | # Clusters: 12 | # Outliers: 120<br>Clustering Algorithm: HDBScan (parameters: min cluster size: 10 | min samples: 5 | epsilon: 0.4) Clustering Quality: Davies-Bouldin Index=0.672 (Lower=Better)", "xanchor": "center", "yanchor": "top" }, "titlefont": { "size": 20 } }, "marker": { "size": 0 }, "textsrc": "miasuresh17:0:a38575", "textfont": { "meta": { "columnNames": { "size": "size", "color": "color" } }, "sizesrc": "miasuresh17:0:68f73b", "colorsrc": "miasuresh17:0:1b468e" }, "hoverinfo": "skip", "showlegend": false, "textposition": "middle center" } ], "frames": [], "layout": { "scene": { "xaxis": { "type": "linear", "showticklabels": false }, "yaxis": { "type": "linear", "showticklabels": false }, "zaxis": { "type": "linear", "showticklabels": false }, "camera": { "up": { "x": 0, "y": 0, "z": 1 }, "eye": { "x": 1.917311407722027, "y": 1.4239172954257084, "z": 0.7536784502015521 }, "center": { "x": 0.0063779724830861735, "y": -0.010845698821920638, "z": -0.012166714214830855 } }, "dragmode": "turntable", "aspectratio": { "x": 1, "y": 1, "z": 1 } }, "title": { "x": 0.5, "y": 0.9, "font": { "size": 14 }, "text": "Dataset Name: VOX Video | Platform: File | # Records: 568 | # Clusters: 12 | # Outliers: 120<br>Clustering Algorithm: HDBScan (parameters: min cluster size: 10 | min samples: 5 | epsilon: 0.4) Clustering Quality: Davies-Bouldin Index=0.672 (Lower=Better)", "xanchor": "center", "yanchor": "top" }, "images": [ { "x": 1, "y": 0.9, "xref": "paper", "yref": "paper", "sizex": 1, "sizey": 1.4, "source": "https://edu.communalytic.org/static/media/img/topborder.png", "xanchor": "right", "yanchor": "bottom" }, { "x": 1, "y": 0.825, "xref": "paper", "yref": "paper", "sizex": 1, "sizey": 1, "source": "https://edu.communalytic.org/static/media/img/semantic_similarity_title.png", "xanchor": "right", "yanchor": "bottom" } ], "margin": { "b": 0, "l": 0, "r": 0, "t": 0 }, "autosize": true, "titlefont": { "size": 20 }, "showlegend": false } }, "height": null, "width": null, "user": { "profile_url": "https://chart-studio.plotly.com/~miasuresh17", "avatar_url": "https://storage.googleapis.com/plotly-prod-profiles/84.jpg", "background_url": "https://storage.googleapis.com/plotly-prod-profiles/bg-0.jpg", "bio": "", "nickname": "", "website": "", "stream_tokens": null, "feature_set_id": null, "csrf_token": null, "date_joined": "2025-06-17 22:52:29", "mapbox_access_tokens": null, "has_password": null, "username": "miasuresh17", "email": null, "is_active": null, "readonly": null, "is_dash_creator": null, "dash_created_count": null, "is_chart_creator": null, "charts_created_count": null } }, { "creation_time": "2025-06-17T20:14:09.954086Z", "comments": { "results": [], "count": 0 }, "parented": true, "embed_url": "https://chart-studio.plotly.com/~Margherita.25/1.embed", "fid": "Margherita.25:1", "filename": "Plot 1", "filetype": "plot", "img_url": "https://storage.googleapis.com/plotly-prod-images/Margherita.25/1/9_OSA4GZWACUM05FKRAOX34YTKJ71O2R.png", "image_urls": { "default": "https://storage.googleapis.com/plotly-prod-images/Margherita.25/1/2_Q4M1R7OZDLEXOS7LXWQZNPTIFAGZ7X.png", "block-thumb": "https://storage.googleapis.com/plotly-prod-images/Margherita.25/1/8_IA36GMZJ8W6K6QQT7CCK80NT087DCF.png", "list-thumb": "https://storage.googleapis.com/plotly-prod-images/Margherita.25/1/9_OSA4GZWACUM05FKRAOX34YTKJ71O2R.png" }, "api_urls": { "files": "https://api.plotly.com/v2/files/Margherita.25:1", "plots": "https://api.plotly.com/v2/plots/Margherita.25:1", "parent": "https://api.plotly.com/v2/folders/home?user=Margherita.25" }, "owner": "Margherita.25", "parent": -1, "preview": "", "referencers": [], "references": [], "title": "", "views": 0, "web_url": "https://chart-studio.plotly.com/~Margherita.25/1/", "world_readable": true, "date_modified": "2025-06-17T20:14:09.967Z", "stars": { "results": [], "count": 0 }, "collaborators": { "results": [], "count": 0 }, "subfolder_count": null, "refresh_interval": null, "organize_view_url": "https://chart-studio.plotly.com/~Margherita.25/1/", "current_user_permission": "read", "is_theme": null, "is_template": false, "autosize": true, "caption": "", "figure": { "data": [ { "meta": { "columnNames": { "x": "BJD - 2454833", "y": " Corrected Flux" } }, "mode": "markers", "type": "scatter", "xsrc": "Margherita.25:0:8a676c", "ysrc": "Margherita.25:0:75bba2" } ], "frames": [], "layout": { "title": { "text": "test plot" }, "xaxis": { "type": "linear", "range": [ 2480.7582989301527, 2556.924331385316 ], "title": { "text": "BJD - 2454833" }, "autorange": false }, "yaxis": { "type": "linear", "range": [ 0.4764591306258225, 1.555462202994243 ], "title": { "text": "Corrected flux" }, "autorange": false }, "autosize": true, "dragmode": "zoom", "template": { "data": { "bar": [ { "type": "bar", "marker": { "colorbar": { "ticks": "", "outlinewidth": 0 } } } ], "table": [ { "type": "table", "cells": { "fill": { "color": "#EBF0F8" }, "line": { "color": "white" } }, "header": { "fill": { "color": "#C8D4E3" }, "line": { "color": "white" } } } ], "carpet": [ { "type": "carpet", "aaxis": { "gridcolor": "#C8D4E3", "linecolor": "#C8D4E3", "endlinecolor": "#2a3f5f", "minorgridcolor": "#C8D4E3", "startlinecolor": "#2a3f5f" }, "baxis": { "gridcolor": "#C8D4E3", "linecolor": "#C8D4E3", "endlinecolor": "#2a3f5f", "minorgridcolor": "#C8D4E3", "startlinecolor": "#2a3f5f" } } ], "mesh3d": [ { "type": "mesh3d", "colorbar": { "ticks": "", "outlinewidth": 0 } } ], "contour": [ { "type": "contour", "colorbar": { "ticks": "", "outlinewidth": 0 }, "autocolorscale": true } ], "heatmap": [ { "type": "heatmap", "colorbar": { "ticks": "", "outlinewidth": 0 }, "autocolorscale": true } ], "scatter": [ { "type": "scatter", "marker": { "colorbar": { "ticks": "", "outlinewidth": 0 } } } ], "surface": [ { "type": "surface", "colorbar": { "ticks": "", "outlinewidth": 0 } } ], "heatmapgl": [ { "type": "heatmapgl", "colorbar": { "ticks": "", "outlinewidth": 0 } } ], "histogram": [ { "type": "histogram", "marker": { "colorbar": { "ticks": "", "outlinewidth": 0 } } } ], "parcoords": [ { "line": { "colorbar": { "ticks": "", "outlinewidth": 0 } }, "type": "parcoords" } ], "scatter3d": [ { "type": "scatter3d", "marker": { "colorbar": { "ticks": "", "outlinewidth": 0 } } } ], "scattergl": [ { "type": "scattergl", "marker": { "colorbar": { "ticks": "", "outlinewidth": 0 } } } ], "choropleth": [ { "type": "choropleth", "colorbar": { "ticks": "", "outlinewidth": 0 } } ], "scattergeo": [ { "type": "scattergeo", "marker": { "colorbar": { "ticks": "", "outlinewidth": 0 } } } ], "histogram2d": [ { "type": "histogram2d", "colorbar": { "ticks": "", "outlinewidth": 0 }, "autocolorscale": true } ], "scatterpolar": [ { "type": "scatterpolar", "marker": { "colorbar": { "ticks": "", "outlinewidth": 0 } } } ], "contourcarpet": [ { "type": "contourcarpet", "colorbar": { "ticks": "", "outlinewidth": 0 } } ], "scattercarpet": [ { "type": "scattercarpet", "marker": { "colorbar": { "ticks": "", "outlinewidth": 0 } } } ], "scattermapbox": [ { "type": "scattermapbox", "marker": { "colorbar": { "ticks": "", "outlinewidth": 0 } } } ], "scatterpolargl": [ { "type": "scatterpolargl", "marker": { "colorbar": { "ticks": "", "outlinewidth": 0 } } } ], "scatterternary": [ { "type": "scatterternary", "marker": { "colorbar": { "ticks": "", "outlinewidth": 0 } } } ], "histogram2dcontour": [ { "type": "histogram2dcontour", "colorbar": { "ticks": "", "outlinewidth": 0 }, "autocolorscale": true } ] }, "layout": { "geo": { "bgcolor": "white", "showland": true, "lakecolor": "white", "landcolor": "white", "showlakes": true, "subunitcolor": "#C8D4E3" }, "font": { "color": "#2a3f5f" }, "polar": { "bgcolor": "white", "radialaxis": { "ticks": "", "gridcolor": "#EBF0F8", "linecolor": "#EBF0F8" }, "angularaxis": { "ticks": "", "gridcolor": "#EBF0F8", "linecolor": "#EBF0F8" } }, "scene": { "xaxis": { "ticks": "", "gridcolor": "#DFE8F3", "gridwidth": 2, "linecolor": "#EBF0F8", "zerolinecolor": "#EBF0F8", "showbackground": true, "backgroundcolor": "white" }, "yaxis": { "ticks": "", "gridcolor": "#DFE8F3", "gridwidth": 2, "linecolor": "#EBF0F8", "zerolinecolor": "#EBF0F8", "showbackground": true, "backgroundcolor": "white" }, "zaxis": { "ticks": "", "gridcolor": "#DFE8F3", "gridwidth": 2, "linecolor": "#EBF0F8", "zerolinecolor": "#EBF0F8", "showbackground": true, "backgroundcolor": "white" } }, "title": { "x": 0.05 }, "xaxis": { "ticks": "", "gridcolor": "#EBF0F8", "linecolor": "#EBF0F8", "automargin": true, "zerolinecolor": "#EBF0F8", "zerolinewidth": 2 }, "yaxis": { "ticks": "", "gridcolor": "#EBF0F8", "linecolor": "#EBF0F8", "automargin": true, "zerolinecolor": "#EBF0F8", "zerolinewidth": 2 }, "ternary": { "aaxis": { "ticks": "", "gridcolor": "#DFE8F3", "linecolor": "#A2B1C6" }, "baxis": { "ticks": "", "gridcolor": "#DFE8F3", "linecolor": "#A2B1C6" }, "caxis": { "ticks": "", "gridcolor": "#DFE8F3", "linecolor": "#A2B1C6" }, "bgcolor": "white" }, "colorway": [ "#636efa", "#EF553B", "#00cc96", "#ab63fa", "#19d3f3", "#e763fa", "#fecb52", "#ffa15a", "#ff6692", "#b6e880" ], "hovermode": "closest", "colorscale": { "diverging": [ [ 0, "#8e0152" ], [ 0.1, "#c51b7d" ], [ 0.2, "#de77ae" ], [ 0.3, "#f1b6da" ], [ 0.4, "#fde0ef" ], [ 0.5, "#f7f7f7" ], [ 0.6, "#e6f5d0" ], [ 0.7, "#b8e186" ], [ 0.8, "#7fbc41" ], [ 0.9, "#4d9221" ], [ 1, "#276419" ] ], "sequential": [ [ 0, "#0508b8" ], [ 0.0893854748603352, "#1910d8" ], [ 0.1787709497206704, "#3c19f0" ], [ 0.2681564245810056, "#6b1cfb" ], [ 0.3575418994413408, "#981cfd" ], [ 0.44692737430167595, "#bf1cfd" ], [ 0.5363128491620112, "#dd2bfd" ], [ 0.6256983240223464, "#f246fe" ], [ 0.7150837988826816, "#fc67fd" ], [ 0.8044692737430168, "#fe88fc" ], [ 0.8938547486033519, "#fea5fd" ], [ 0.9832402234636871, "#febefe" ], [ 1, "#fec3fe" ] ], "sequentialminus": [ [ 0, "#0508b8" ], [ 0.0893854748603352, "#1910d8" ], [ 0.1787709497206704, "#3c19f0" ], [ 0.2681564245810056, "#6b1cfb" ], [ 0.3575418994413408, "#981cfd" ], [ 0.44692737430167595, "#bf1cfd" ], [ 0.5363128491620112, "#dd2bfd" ], [ 0.6256983240223464, "#f246fe" ], [ 0.7150837988826816, "#fc67fd" ], [ 0.8044692737430168, "#fe88fc" ], [ 0.8938547486033519, "#fea5fd" ], [ 0.9832402234636871, "#febefe" ], [ 1, "#fec3fe" ] ] }, "plot_bgcolor": "white", "paper_bgcolor": "white", "shapedefaults": { "line": { "width": 0 }, "opacity": 0.4, "fillcolor": "#506784" }, "annotationdefaults": { "arrowhead": 0, "arrowcolor": "#506784", "arrowwidth": 1 } }, "themeRef": "PLOTLY_WHITE" } } }, "height": null, "width": null, "user": { "profile_url": "https://chart-studio.plotly.com/~Margherita.25", "avatar_url": "https://storage.googleapis.com/plotly-prod-profiles/62.jpg", "background_url": "https://storage.googleapis.com/plotly-prod-profiles/bg-4.jpg", "bio": "", "nickname": "", "website": "", "stream_tokens": null, "feature_set_id": null, "csrf_token": null, "date_joined": "2025-06-17 19:36:22", "mapbox_access_tokens": null, "has_password": null, "username": "Margherita.25", "email": null, "is_active": null, "readonly": null, "is_dash_creator": null, "dash_created_count": null, "is_chart_creator": null, "charts_created_count": null } }, { "creation_time": "2025-06-17T19:50:58.320677Z", "comments": { "results": [], "count": 0 }, "parented": true, "embed_url": "https://chart-studio.plotly.com/~laschumacher/64.embed", "fid": "laschumacher:64", "filename": "Pooled Taus_peeled_transferredahead", "filetype": "plot", "img_url": "https://api.plotly.com/v2/files/laschumacher:64/image?image_name=list-thumb", "image_urls": { "default": "https://api.plotly.com/v2/files/laschumacher:64/image?image_name=default", "block-thumb": "https://storage.googleapis.com/plotly-prod-images/laschumacher/64/8_5EIGY5FLQJ5VXHB0YFIP1LRG88NLB9.png", "list-thumb": "https://api.plotly.com/v2/files/laschumacher:64/image?image_name=list-thumb" }, "api_urls": { "files": "https://api.plotly.com/v2/files/laschumacher:64", "plots": "https://api.plotly.com/v2/plots/laschumacher:64", "parent": "https://api.plotly.com/v2/folders/home?user=laschumacher" }, "owner": "laschumacher", "parent": -1, "preview": "", "referencers": [], "references": [], "title": "", "views": 0, "web_url": "https://chart-studio.plotly.com/~laschumacher/64/", "world_readable": true, "date_modified": "2025-07-15T17:30:31.407Z", "stars": { "results": [], "count": 0 }, "collaborators": { "results": [], "count": 0 }, "subfolder_count": null, "refresh_interval": null, "organize_view_url": "https://chart-studio.plotly.com/~laschumacher/64/", "current_user_permission": "read", "is_theme": null, "is_template": false, "autosize": true, "caption": "", "figure": { "data": [ { "meta": { "columnNames": { "y": "A" } }, "mode": "markers", "name": "Spot1", "type": "box", "ysrc": "laschumacher:63:759155", "jitter": 1, "pointpos": 0, "boxpoints": "all", "showlegend": true }, { "meta": { "columnNames": { "y": "B" } }, "name": "1Headless", "type": "box", "ysrc": "laschumacher:63:648206", "jitter": 1, "pointpos": 0, "boxpoints": "all" }, { "line": { "color": "rgb(25, 211, 243)" }, "meta": { "columnNames": { "y": "C" } }, "name": "Spot2", "type": "box", "ysrc": "laschumacher:63:830cac", "jitter": 1, "marker": { "color": "rgb(25, 211, 243)" }, "pointpos": 0, "boxpoints": "all" }, { "line": { "color": "rgb(255, 102, 146)" }, "meta": { "columnNames": { "y": "D" } }, "name": "2Headless", "type": "box", "ysrc": "laschumacher:63:dac552", "jitter": 1, "pointpos": 0, "boxpoints": "all" }, { "line": { "color": "rgb(182, 232, 128)" }, "meta": { "columnNames": { "y": "E" } }, "name": "Spot3", "type": "box", "ysrc": "laschumacher:63:0260cd", "jitter": 1, "pointpos": 0, "boxpoints": "all" }, { "meta": { "columnNames": { "y": "F" } }, "name": "3Headless", "type": "box", "ysrc": "laschumacher:63:c44fd4", "jitter": 1, "pointpos": 0, "boxpoints": "all" } ], "frames": [], "layout": { "xaxis": { "type": "category", "range": [ -0.5, 5.5 ], "title": { "font": { "size": 22 } }, "tickfont": { "size": 21 }, "autorange": true }, "yaxis": { "type": "linear", "range": [ 0.6248643333333332, 2.8045576666666667 ], "title": { "font": { "size": 20 }, "text": "Mean τ, Amplitude Weighted ns" }, "tickfont": { "size": 20 }, "autorange": true }, "legend": { "font": { "size": 16 } }, "autosize": true, "template": { "data": { "bar": [ { "type": "bar", "marker": { "colorbar": { "ticks": "", "outlinewidth": 0 } } } ], "table": [ { "type": "table", "cells": { "fill": { "color": "#EBF0F8" }, "line": { "color": "white" } }, "header": { "fill": { "color": "#C8D4E3" }, "line": { "color": "white" } } } ], "carpet": [ { "type": "carpet", "aaxis": { "gridcolor": "#C8D4E3", "linecolor": "#C8D4E3", "endlinecolor": "#2a3f5f", "minorgridcolor": "#C8D4E3", "startlinecolor": "#2a3f5f" }, "baxis": { "gridcolor": "#C8D4E3", "linecolor": "#C8D4E3", "endlinecolor": "#2a3f5f", "minorgridcolor": "#C8D4E3", "startlinecolor": "#2a3f5f" } } ], "mesh3d": [ { "type": "mesh3d", "colorbar": { "ticks": "", "outlinewidth": 0 } } ], "contour": [ { "type": "contour", "colorbar": { "ticks": "", "outlinewidth": 0 }, "autocolorscale": true } ], "heatmap": [ { "type": "heatmap", "colorbar": { "ticks": "", "outlinewidth": 0 }, "autocolorscale": true } ], "scatter": [ { "type": "scatter", "marker": { "colorbar": { "ticks": "", "outlinewidth": 0 } } } ], "surface": [ { "type": "surface", "colorbar": { "ticks": "", "outlinewidth": 0 } } ], "heatmapgl": [ { "type": "heatmapgl", "colorbar": { "ticks": "", "outlinewidth": 0 } } ], "histogram": [ { "type": "histogram", "marker": { "colorbar": { "ticks": "", "outlinewidth": 0 } } } ], "parcoords": [ { "line": { "colorbar": { "ticks": "", "outlinewidth": 0 } }, "type": "parcoords" } ], "scatter3d": [ { "type": "scatter3d", "marker": { "colorbar": { "ticks": "", "outlinewidth": 0 } } } ], "scattergl": [ { "type": "scattergl", "marker": { "colorbar": { "ticks": "", "outlinewidth": 0 } } } ], "choropleth": [ { "type": "choropleth", "colorbar": { "ticks": "", "outlinewidth": 0 } } ], "scattergeo": [ { "type": "scattergeo", "marker": { "colorbar": { "ticks": "", "outlinewidth": 0 } } } ], "histogram2d": [ { "type": "histogram2d", "colorbar": { "ticks": "", "outlinewidth": 0 }, "autocolorscale": true } ], "scatterpolar": [ { "type": "scatterpolar", "marker": { "colorbar": { "ticks": "", "outlinewidth": 0 } } } ], "contourcarpet": [ { "type": "contourcarpet", "colorbar": { "ticks": "", "outlinewidth": 0 } } ], "scattercarpet": [ { "type": "scattercarpet", "marker": { "colorbar": { "ticks": "", "outlinewidth": 0 } } } ], "scattermapbox": [ { "type": "scattermapbox", "marker": { "colorbar": { "ticks": "", "outlinewidth": 0 } } } ], "scatterpolargl": [ { "type": "scatterpolargl", "marker": { "colorbar": { "ticks": "", "outlinewidth": 0 } } } ], "scatterternary": [ { "type": "scatterternary", "marker": { "colorbar": { "ticks": "", "outlinewidth": 0 } } } ], "histogram2dcontour": [ { "type": "histogram2dcontour", "colorbar": { "ticks": "", "outlinewidth": 0 }, "autocolorscale": true } ] }, "layout": { "geo": { "bgcolor": "white", "showland": true, "lakecolor": "white", "landcolor": "white", "showlakes": true, "subunitcolor": "#C8D4E3" }, "font": { "color": "#2a3f5f" }, "polar": { "bgcolor": "white", "radialaxis": { "ticks": "", "gridcolor": "#EBF0F8", "linecolor": "#EBF0F8" }, "angularaxis": { "ticks": "", "gridcolor": "#EBF0F8", "linecolor": "#EBF0F8" } }, "scene": { "xaxis": { "ticks": "", "gridcolor": "#DFE8F3", "gridwidth": 2, "linecolor": "#EBF0F8", "zerolinecolor": "#EBF0F8", "showbackground": true, "backgroundcolor": "white" }, "yaxis": { "ticks": "", "gridcolor": "#DFE8F3", "gridwidth": 2, "linecolor": "#EBF0F8", "zerolinecolor": "#EBF0F8", "showbackground": true, "backgroundcolor": "white" }, "zaxis": { "ticks": "", "gridcolor": "#DFE8F3", "gridwidth": 2, "linecolor": "#EBF0F8", "zerolinecolor": "#EBF0F8", "showbackground": true, "backgroundcolor": "white" } }, "title": { "x": 0.05 }, "xaxis": { "ticks": "", "gridcolor": "#EBF0F8", "linecolor": "#EBF0F8", "automargin": true, "zerolinecolor": "#EBF0F8", "zerolinewidth": 2 }, "yaxis": { "ticks": "", "gridcolor": "#EBF0F8", "linecolor": "#EBF0F8", "automargin": true, "zerolinecolor": "#EBF0F8", "zerolinewidth": 2 }, "ternary": { "aaxis": { "ticks": "", "gridcolor": "#DFE8F3", "linecolor": "#A2B1C6" }, "baxis": { "ticks": "", "gridcolor": "#DFE8F3", "linecolor": "#A2B1C6" }, "caxis": { "ticks": "", "gridcolor": "#DFE8F3", "linecolor": "#A2B1C6" }, "bgcolor": "white" }, "colorway": [ "#636efa", "#EF553B", "#00cc96", "#ab63fa", "#19d3f3", "#e763fa", "#fecb52", "#ffa15a", "#ff6692", "#b6e880" ], "hovermode": "closest", "colorscale": { "diverging": [ [ 0, "#8e0152" ], [ 0.1, "#c51b7d" ], [ 0.2, "#de77ae" ], [ 0.3, "#f1b6da" ], [ 0.4, "#fde0ef" ], [ 0.5, "#f7f7f7" ], [ 0.6, "#e6f5d0" ], [ 0.7, "#b8e186" ], [ 0.8, "#7fbc41" ], [ 0.9, "#4d9221" ], [ 1, "#276419" ] ], "sequential": [ [ 0, "#0508b8" ], [ 0.0893854748603352, "#1910d8" ], [ 0.1787709497206704, "#3c19f0" ], [ 0.2681564245810056, "#6b1cfb" ], [ 0.3575418994413408, "#981cfd" ], [ 0.44692737430167595, "#bf1cfd" ], [ 0.5363128491620112, "#dd2bfd" ], [ 0.6256983240223464, "#f246fe" ], [ 0.7150837988826816, "#fc67fd" ], [ 0.8044692737430168, "#fe88fc" ], [ 0.8938547486033519, "#fea5fd" ], [ 0.9832402234636871, "#febefe" ], [ 1, "#fec3fe" ] ], "sequentialminus": [ [ 0, "#0508b8" ], [ 0.0893854748603352, "#1910d8" ], [ 0.1787709497206704, "#3c19f0" ], [ 0.2681564245810056, "#6b1cfb" ], [ 0.3575418994413408, "#981cfd" ], [ 0.44692737430167595, "#bf1cfd" ], [ 0.5363128491620112, "#dd2bfd" ], [ 0.6256983240223464, "#f246fe" ], [ 0.7150837988826816, "#fc67fd" ], [ 0.8044692737430168, "#fe88fc" ], [ 0.8938547486033519, "#fea5fd" ], [ 0.9832402234636871, "#febefe" ], [ 1, "#fec3fe" ] ] }, "plot_bgcolor": "white", "paper_bgcolor": "white", "shapedefaults": { "line": { "width": 0 }, "opacity": 0.4, "fillcolor": "#506784" }, "annotationdefaults": { "arrowhead": 0, "arrowcolor": "#506784", "arrowwidth": 1 } }, "themeRef": "PLOTLY_WHITE" } } }, "height": null, "width": null, "user": { "profile_url": "https://chart-studio.plotly.com/~laschumacher", "avatar_url": "https://storage.googleapis.com/plotly-prod-profiles/68.jpg", "background_url": "https://storage.googleapis.com/plotly-prod-profiles/bg-13.jpg", "bio": "", "nickname": "", "website": "", "stream_tokens": null, "feature_set_id": null, "csrf_token": null, "date_joined": "2020-09-17 18:48:25", "mapbox_access_tokens": null, "has_password": null, "username": "laschumacher", "email": null, "is_active": null, "readonly": null, "is_dash_creator": null, "dash_created_count": null, "is_chart_creator": null, "charts_created_count": null } }, { "creation_time": "2025-06-17T19:32:04.153570Z", "comments": { "results": [], "count": 0 }, "parented": true, "embed_url": "https://chart-studio.plotly.com/~ngraddon/3.embed", "fid": "ngraddon:3", "filename": "Plot 3", "filetype": "plot", "img_url": "https://api.plotly.com/v2/files/ngraddon:3/image?image_name=list-thumb", "image_urls": { "default": "https://storage.googleapis.com/plotly-prod-images/ngraddon/3/2_7KD3VFPXEP4ANKSFV7DILQ0PIBCE96.png", "block-thumb": "https://storage.googleapis.com/plotly-prod-images/ngraddon/3/8_FJI29LK8YMVB8FL8EKEW3IDCJI4MF3.png", "list-thumb": "https://api.plotly.com/v2/files/ngraddon:3/image?image_name=list-thumb" }, "api_urls": { "files": "https://api.plotly.com/v2/files/ngraddon:3", "plots": "https://api.plotly.com/v2/plots/ngraddon:3", "parent": "https://api.plotly.com/v2/folders/home?user=ngraddon" }, "owner": "ngraddon", "parent": -1, "preview": "", "referencers": [], "references": [], "title": "", "views": 0, "web_url": "https://chart-studio.plotly.com/~ngraddon/3/", "world_readable": true, "date_modified": "2025-06-17T19:33:36.713Z", "stars": { "results": [], "count": 0 }, "collaborators": { "results": [], "count": 0 }, "subfolder_count": null, "refresh_interval": null, "organize_view_url": "https://chart-studio.plotly.com/~ngraddon/3/", "current_user_permission": "read", "is_theme": null, "is_template": false, "autosize": true, "caption": "", "figure": { "data": [ { "line": { "color": "rgb(255, 0, 5)" }, "meta": { "columnNames": { "x": "A", "y": "B" } }, "mode": "markers+lines", "name": "Hopper Broadcast (GBps)", "type": "scatter", "xsrc": "ngraddon:2:c7ad66", "ysrc": "ngraddon:2:ac0a7d" }, { "line": { "dash": "dot", "color": "rgb(255, 37, 0)", "shape": "spline" }, "meta": { "columnNames": { "x": "A", "y": "C" } }, "mode": "markers+lines", "name": "Hopper Divergent (GBps)", "type": "scatter", "xsrc": "ngraddon:2:c7ad66", "ysrc": "ngraddon:2:a389db", "stackgroup": null }, { "line": { "color": "rgb(0, 237, 255)", "shape": "spline" }, "meta": { "columnNames": { "x": "A", "y": "D" } }, "mode": "markers+lines", "name": "Blackwell Broadcast (GBps)", "type": "scatter", "xsrc": "ngraddon:2:c7ad66", "ysrc": "ngraddon:2:e5d9c4", "stackgroup": null }, { "line": { "dash": "dot", "color": "rgb(75, 219, 255)", "shape": "spline" }, "meta": { "columnNames": { "x": "A", "y": "E" } }, "mode": "markers+lines", "name": "Blackwell Divergent (GBps)", "type": "scatter", "xsrc": "ngraddon:2:c7ad66", "ysrc": "ngraddon:2:ac11e3", "stackgroup": null } ], "frames": [], "layout": { "title": { "x": 0.12, "font": { "size": 20 }, "text": "<b>Warp Count vs. Throughput for Blackwell vs. Hopper GPUs</b>" }, "xaxis": { "type": "linear", "range": [ -2.886484098939929, 67.88648409893993 ], "title": { "text": "Warp Count" }, "autorange": true }, "yaxis": { "type": "linear", "range": [ -401.7394772661455, 6360.629477266145 ], "title": { "text": "Average Throughput (GBps)" }, "autorange": true }, "autosize": true, "template": { "data": { "bar": [ { "type": "bar", "marker": { "colorbar": { "ticks": "", "outlinewidth": 0 } } } ], "table": [ { "type": "table", "cells": { "fill": { "color": "#EBF0F8" }, "line": { "color": "white" } }, "header": { "fill": { "color": "#C8D4E3" }, "line": { "color": "white" } } } ], "carpet": [ { "type": "carpet", "aaxis": { "gridcolor": "#C8D4E3", "linecolor": "#C8D4E3", "endlinecolor": "#2a3f5f", "minorgridcolor": "#C8D4E3", "startlinecolor": "#2a3f5f" }, "baxis": { "gridcolor": "#C8D4E3", "linecolor": "#C8D4E3", "endlinecolor": "#2a3f5f", "minorgridcolor": "#C8D4E3", "startlinecolor": "#2a3f5f" } } ], "mesh3d": [ { "type": "mesh3d", "colorbar": { "ticks": "", "outlinewidth": 0 } } ], "contour": [ { "type": "contour", "colorbar": { "ticks": "", "outlinewidth": 0 }, "autocolorscale": true } ], "heatmap": [ { "type": "heatmap", "colorbar": { "ticks": "", "outlinewidth": 0 }, "autocolorscale": true } ], "scatter": [ { "type": "scatter", "marker": { "colorbar": { "ticks": "", "outlinewidth": 0 } } } ], "surface": [ { "type": "surface", "colorbar": { "ticks": "", "outlinewidth": 0 } } ], "heatmapgl": [ { "type": "heatmapgl", "colorbar": { "ticks": "", "outlinewidth": 0 } } ], "histogram": [ { "type": "histogram", "marker": { "colorbar": { "ticks": "", "outlinewidth": 0 } } } ], "parcoords": [ { "line": { "colorbar": { "ticks": "", "outlinewidth": 0 } }, "type": "parcoords" } ], "scatter3d": [ { "type": "scatter3d", "marker": { "colorbar": { "ticks": "", "outlinewidth": 0 } } } ], "scattergl": [ { "type": "scattergl", "marker": { "colorbar": { "ticks": "", "outlinewidth": 0 } } } ], "choropleth": [ { "type": "choropleth", "colorbar": { "ticks": "", "outlinewidth": 0 } } ], "scattergeo": [ { "type": "scattergeo", "marker": { "colorbar": { "ticks": "", "outlinewidth": 0 } } } ], "histogram2d": [ { "type": "histogram2d", "colorbar": { "ticks": "", "outlinewidth": 0 }, "autocolorscale": true } ], "scatterpolar": [ { "type": "scatterpolar", "marker": { "colorbar": { "ticks": "", "outlinewidth": 0 } } } ], "contourcarpet": [ { "type": "contourcarpet", "colorbar": { "ticks": "", "outlinewidth": 0 } } ], "scattercarpet": [ { "type": "scattercarpet", "marker": { "colorbar": { "ticks": "", "outlinewidth": 0 } } } ], "scattermapbox": [ { "type": "scattermapbox", "marker": { "colorbar": { "ticks": "", "outlinewidth": 0 } } } ], "scatterpolargl": [ { "type": "scatterpolargl", "marker": { "colorbar": { "ticks": "", "outlinewidth": 0 } } } ], "scatterternary": [ { "type": "scatterternary", "marker": { "colorbar": { "ticks": "", "outlinewidth": 0 } } } ], "histogram2dcontour": [ { "type": "histogram2dcontour", "colorbar": { "ticks": "", "outlinewidth": 0 }, "autocolorscale": true } ] }, "layout": { "geo": { "bgcolor": "white", "showland": true, "lakecolor": "white", "landcolor": "white", "showlakes": true, "subunitcolor": "#C8D4E3" }, "font": { "color": "#2a3f5f" }, "polar": { "bgcolor": "white", "radialaxis": { "ticks": "", "gridcolor": "#EBF0F8", "linecolor": "#EBF0F8" }, "angularaxis": { "ticks": "", "gridcolor": "#EBF0F8", "linecolor": "#EBF0F8" } }, "scene": { "xaxis": { "ticks": "", "gridcolor": "#DFE8F3", "gridwidth": 2, "linecolor": "#EBF0F8", "zerolinecolor": "#EBF0F8", "showbackground": true, "backgroundcolor": "white" }, "yaxis": { "ticks": "", "gridcolor": "#DFE8F3", "gridwidth": 2, "linecolor": "#EBF0F8", "zerolinecolor": "#EBF0F8", "showbackground": true, "backgroundcolor": "white" }, "zaxis": { "ticks": "", "gridcolor": "#DFE8F3", "gridwidth": 2, "linecolor": "#EBF0F8", "zerolinecolor": "#EBF0F8", "showbackground": true, "backgroundcolor": "white" } }, "title": { "x": 0.05 }, "xaxis": { "ticks": "", "gridcolor": "#EBF0F8", "linecolor": "#EBF0F8", "automargin": true, "zerolinecolor": "#EBF0F8", "zerolinewidth": 2 }, "yaxis": { "ticks": "", "gridcolor": "#EBF0F8", "linecolor": "#EBF0F8", "automargin": true, "zerolinecolor": "#EBF0F8", "zerolinewidth": 2 }, "ternary": { "aaxis": { "ticks": "", "gridcolor": "#DFE8F3", "linecolor": "#A2B1C6" }, "baxis": { "ticks": "", "gridcolor": "#DFE8F3", "linecolor": "#A2B1C6" }, "caxis": { "ticks": "", "gridcolor": "#DFE8F3", "linecolor": "#A2B1C6" }, "bgcolor": "white" }, "colorway": [ "#636efa", "#EF553B", "#00cc96", "#ab63fa", "#19d3f3", "#e763fa", "#fecb52", "#ffa15a", "#ff6692", "#b6e880" ], "hovermode": "closest", "colorscale": { "diverging": [ [ 0, "#8e0152" ], [ 0.1, "#c51b7d" ], [ 0.2, "#de77ae" ], [ 0.3, "#f1b6da" ], [ 0.4, "#fde0ef" ], [ 0.5, "#f7f7f7" ], [ 0.6, "#e6f5d0" ], [ 0.7, "#b8e186" ], [ 0.8, "#7fbc41" ], [ 0.9, "#4d9221" ], [ 1, "#276419" ] ], "sequential": [ [ 0, "#0508b8" ], [ 0.0893854748603352, "#1910d8" ], [ 0.1787709497206704, "#3c19f0" ], [ 0.2681564245810056, "#6b1cfb" ], [ 0.3575418994413408, "#981cfd" ], [ 0.44692737430167595, "#bf1cfd" ], [ 0.5363128491620112, "#dd2bfd" ], [ 0.6256983240223464, "#f246fe" ], [ 0.7150837988826816, "#fc67fd" ], [ 0.8044692737430168, "#fe88fc" ], [ 0.8938547486033519, "#fea5fd" ], [ 0.9832402234636871, "#febefe" ], [ 1, "#fec3fe" ] ], "sequentialminus": [ [ 0, "#0508b8" ], [ 0.0893854748603352, "#1910d8" ], [ 0.1787709497206704, "#3c19f0" ], [ 0.2681564245810056, "#6b1cfb" ], [ 0.3575418994413408, "#981cfd" ], [ 0.44692737430167595, "#bf1cfd" ], [ 0.5363128491620112, "#dd2bfd" ], [ 0.6256983240223464, "#f246fe" ], [ 0.7150837988826816, "#fc67fd" ], [ 0.8044692737430168, "#fe88fc" ], [ 0.8938547486033519, "#fea5fd" ], [ 0.9832402234636871, "#febefe" ], [ 1, "#fec3fe" ] ] }, "plot_bgcolor": "white", "paper_bgcolor": "white", "shapedefaults": { "line": { "width": 0 }, "opacity": 0.4, "fillcolor": "#506784" }, "annotationdefaults": { "arrowhead": 0, "arrowcolor": "#506784", "arrowwidth": 1 } }, "themeRef": "PLOTLY_WHITE" } } }, "height": null, "width": null, "user": { "profile_url": "https://chart-studio.plotly.com/~ngraddon", "avatar_url": "https://storage.googleapis.com/plotly-prod-profiles/64.jpg", "background_url": "https://storage.googleapis.com/plotly-prod-profiles/bg-14.jpg", "bio": "", "nickname": "", "website": "", "stream_tokens": null, "feature_set_id": null, "csrf_token": null, "date_joined": "2025-06-17 17:25:04", "mapbox_access_tokens": null, "has_password": null, "username": "ngraddon", "email": null, "is_active": null, "readonly": null, "is_dash_creator": null, "dash_created_count": null, "is_chart_creator": null, "charts_created_count": null } } ] }
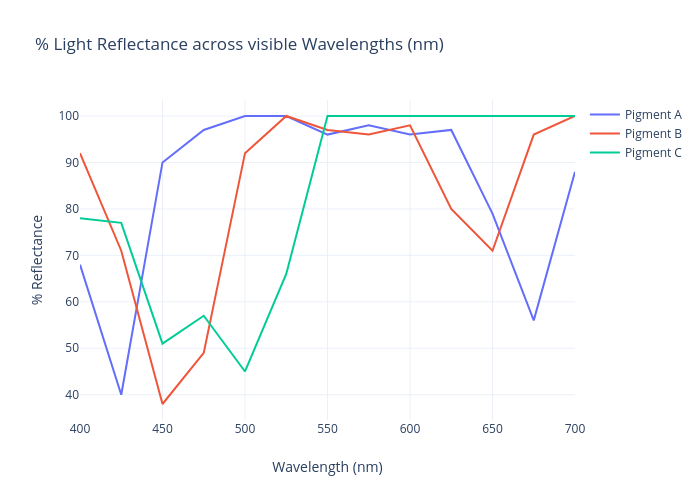
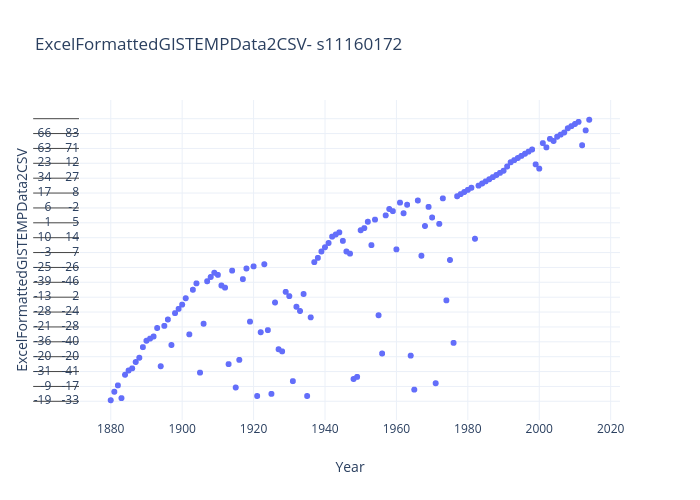