Plots List
Plots
This endpoint handles manipulation of Plotly plot files.
Reference
Authorization
Any user with or without a Plotly account may view public plots. For private plots, see authentication.
Actions
list
Listing all public plots can be done via a GET request to this endpoint.
By default, plots will be listed in order of date created. The order_by
query parameter is accepted at this endpoint. Currently, only ordering by
views is supported. It is possible to filter the plots by quality
with min_quality or max_quality as query parameter.
Example:
// GET https://api.plotly.com/v2/plots/ ---> 200

// GET https://api.plotly.com/v2/plots/?order_by=-views ---> 200

// GET https://api.plotly.com/v2/plots/?min_quality=5 ---> 200

// GET https://api.plotly.com/v2/plots/?max_quality=5 ---> 200
feed
Listing all handpicked feed plots can be done via a GET request to this endpoint. By default, plots will be listed in a random order.
Example:
// GET https://api.plotly.com/v2/plots/feed ---> 200
create
You can create new plot resources here. The only required field is 'figure'. Currently, the figure is restricted to only contain references to grid data. That is, this will fail if raw data arrays are passed in. To create and manipulate underlying grids for plots, see the grids endpoint.
Example:
// This fails because a figure field is required.
// POST https://api.plotly.com/v2/plots ---> 400 Bad Request
{}

// This fails because the figure has raw data
//POST https://api.plotly.com/v2/plots ---> 400 Bad Request
{
    "figure": {"data": [{"y": ['this', 'is', 'raw', 'data']}]}
}

// This succeeds because the figure has src keys, not raw data.
//POST https://api.plotly.com/v2/plots ---> 200 OK
{
    "figure": {"data": [{"ysrc": "sven:88:u8nd62"}]}
}
When creating a grid, you can optionally specify a source_fid to specify where a plot has come from:
- source_fid: the fid of a plot that was copied (and presumably edited) to produce this one
detail
There is a lot of meta information stored about plot files including filename, title, share_url, and content_url to name a few.
This information can only be reached with a GET to this endpoint.
Example:
// GET https://api.plotly.com/v2/plots/iheartgraphs:90
content
The contents of a plot can be downloaded via the content resource. The plot
content contains referenced grid/column data by default. If you wish to
return the raw grid/column data, the inline_data=true query must be included
in the request url. The Content-Type header will be appropriately set for the
response body.
Alternatively, you can set ?map_data=unreadable to append a mapping of
sources to data that belongs to grids which are unreadable for the
requestor. This is useful when you have read access to another users plot,
but that plot contains grid references which you don't have access to.
Examples:
// Returns referenced grid/column data
// GET https://api.plotly.com/v2/plots/iheartgraphs:90/content ---> 200 OK

// Returns full grid/column data
// GET https://api.plotly.com/v2/plots/iheartgraphs:90/content?inline_data=true ---> 200 OK

// Returns full grid/column data when requestor doesn't have permission
// to read the referenced grid.
// GET https://api.plotly.com/v2/plots/iheartgraphs:90/content?map_data=unreadable ---> 200 OK
GET /v2/plots/?cursor=cD0yMDI1LTA2LTE3KzE3JTNBMjglM0E1MC45NTI3NTYlMkIwMCUzQTAw&format=api
{ "next": "https://api.plot.ly/v2/plots/?cursor=cD0yMDI1LTA2LTE3KzE1JTNBNTYlM0EzNS40MzY4MDUlMkIwMCUzQTAw&format=api", "previous": "https://api.plot.ly/v2/plots/?cursor=cj0xJnA9MjAyNS0wNi0xNysxNyUzQTI2JTNBNTMuMTkwMDI2JTJCMDAlM0EwMA%3D%3D&format=api", "results": [ { "creation_time": "2025-06-17T17:26:53.190026Z", "comments": { "results": [], "count": 0 }, "parented": true, "embed_url": "https://chart-studio.plotly.com/~ngraddon/1.embed", "fid": "ngraddon:1", "filename": "Plot 1", "filetype": "plot", "img_url": "https://api.plotly.com/v2/files/ngraddon:1/image?image_name=list-thumb", "image_urls": { "default": "https://storage.googleapis.com/plotly-prod-images/ngraddon/1/2_8X2S62KY2S9MNRU4D1RBS5JC95C0UG.png", "block-thumb": "https://storage.googleapis.com/plotly-prod-images/ngraddon/1/8_PRDTHHJZIX87GWA3679Y5J8YZW9A3K.png", "list-thumb": "https://api.plotly.com/v2/files/ngraddon:1/image?image_name=list-thumb" }, "api_urls": { "files": "https://api.plotly.com/v2/files/ngraddon:1", "plots": "https://api.plotly.com/v2/plots/ngraddon:1", "parent": "https://api.plotly.com/v2/folders/home?user=ngraddon" }, "owner": "ngraddon", "parent": -1, "preview": "", "referencers": [], "references": [], "title": "", "views": 0, "web_url": "https://chart-studio.plotly.com/~ngraddon/1/", "world_readable": true, "date_modified": "2025-06-17T17:42:08.084Z", "stars": { "results": [], "count": 0 }, "collaborators": { "results": [], "count": 0 }, "subfolder_count": null, "refresh_interval": null, "organize_view_url": "https://chart-studio.plotly.com/~ngraddon/1/", "current_user_permission": "read", "is_theme": null, "is_template": false, "autosize": true, "caption": "", "figure": { "data": [ { "fill": "none", "line": { "color": "rgb(0, 20, 255)", "shape": "spline" }, "meta": { "columnNames": { "x": "C", "y": "A", "text": "A", "marker": { "color": "A" } } }, "mode": "markers+lines", "name": "Blackwell", "type": "scatter", "xsrc": "ngraddon:0:42094b", "ysrc": "ngraddon:0:d615bd", "marker": { "meta": { "columnNames": { "color": "A" } }, "colorsrc": "ngraddon:0:d615bd", "showscale": false, "colorscale": [ [ 0, "#0508b8" ], [ 0.08333333333333333, "#1910d8" ], [ 0.16666666666666666, "#3c19f0" ], [ 0.25, "#6b1cfb" ], [ 0.3333333333333333, "#981cfd" ], [ 0.4166666666666667, "#bf1cfd" ], [ 0.5, "#dd2bfd" ], [ 0.5833333333333334, "#f246fe" ], [ 0.6666666666666666, "#fc67fd" ], [ 0.75, "#fe88fc" ], [ 0.8333333333333334, "#fea5fd" ], [ 0.9166666666666666, "#febefe" ], [ 1, "#fec3fe" ] ], "reversescale": true }, "textsrc": "ngraddon:0:d615bd", "cliponaxis": true, "connectgaps": false, "autocolorscale": false }, { "line": { "color": "rgb(11, 155, 43)", "shape": "spline" }, "meta": { "columnNames": { "x": "C", "y": "B", "marker": { "color": "B" } } }, "mode": "markers+lines", "name": "Hopper", "type": "scatter", "xsrc": "ngraddon:0:42094b", "ysrc": "ngraddon:0:7c7e7d", "marker": { "meta": { "columnNames": { "color": "B" } }, "size": 6, "symbol": "circle", "colorsrc": "ngraddon:0:7c7e7d", "colorscale": [ [ 0, "#0d0887" ], [ 0.1111111111111111, "#46039f" ], [ 0.2222222222222222, "#7201a8" ], [ 0.3333333333333333, "#9c179e" ], [ 0.4444444444444444, "#bd3786" ], [ 0.5555555555555556, "#d8576b" ], [ 0.6666666666666666, "#ed7953" ], [ 0.7777777777777778, "#fb9f3a" ], [ 0.8888888888888888, "#fdca26" ], [ 1, "#f0f921" ] ], "reversescale": true }, "error_x": { "type": "percent", "color": "rgb(11, 155, 43)", "value": 10, "width": 4, "visible": false, "symmetric": false, "thickness": 2, "valueminus": 10 }, "stackgroup": null, "autocolorscale": false } ], "frames": [], "layout": { "font": { "size": 15 }, "title": { "x": 0.14, "font": { "size": 21 }, "text": "<b>Thread Count vs. Throughput for Blackwell vs Hopper GPUs</b>" }, "xaxis": { "type": "linear", "range": [ 0, 270 ], "title": { "font": { "size": 18 }, "text": "Number of Threads" }, "showgrid": true, "autorange": false, "gridcolor": "rgb(215, 215, 217)", "fixedrange": true, "showspikes": false, "rangeslider": { "range": [ 0, 140 ], "yaxis": {}, "visible": false, "autorange": true }, "zerolinecolor": "rgb(212, 212, 214)", "zerolinewidth": 1 }, "yaxis": { "type": "linear", "range": [ 0, 3000 ], "title": { "font": { "size": 18 }, "text": "Average Throughput (GBps)" }, "autorange": false, "gridcolor": "rgb(204, 204, 207)", "fixedrange": true, "showspikes": false }, "autosize": true, "dragmode": "zoom", "template": { "data": { "bar": [ { "type": "bar", "marker": { "colorbar": { "ticks": "", "outlinewidth": 0 } } } ], "table": [ { "type": "table", "cells": { "fill": { "color": "#EBF0F8" }, "line": { "color": "white" } }, "header": { "fill": { "color": "#C8D4E3" }, "line": { "color": "white" } } } ], "carpet": [ { "type": "carpet", "aaxis": { "gridcolor": "#C8D4E3", "linecolor": "#C8D4E3", "endlinecolor": "#2a3f5f", "minorgridcolor": "#C8D4E3", "startlinecolor": "#2a3f5f" }, "baxis": { "gridcolor": "#C8D4E3", "linecolor": "#C8D4E3", "endlinecolor": "#2a3f5f", "minorgridcolor": "#C8D4E3", "startlinecolor": "#2a3f5f" } } ], "mesh3d": [ { "type": "mesh3d", "colorbar": { "ticks": "", "outlinewidth": 0 } } ], "contour": [ { "type": "contour", "colorbar": { "ticks": "", "outlinewidth": 0 }, "autocolorscale": true } ], "heatmap": [ { "type": "heatmap", "colorbar": { "ticks": "", "outlinewidth": 0 }, "autocolorscale": true } ], "scatter": [ { "type": "scatter", "marker": { "colorbar": { "ticks": "", "outlinewidth": 0 } } } ], "surface": [ { "type": "surface", "colorbar": { "ticks": "", "outlinewidth": 0 } } ], "heatmapgl": [ { "type": "heatmapgl", "colorbar": { "ticks": "", "outlinewidth": 0 } } ], "histogram": [ { "type": "histogram", "marker": { "colorbar": { "ticks": "", "outlinewidth": 0 } } } ], "parcoords": [ { "line": { "colorbar": { "ticks": "", "outlinewidth": 0 } }, "type": "parcoords" } ], "scatter3d": [ { "type": "scatter3d", "marker": { "colorbar": { "ticks": "", "outlinewidth": 0 } } } ], "scattergl": [ { "type": "scattergl", "marker": { "colorbar": { "ticks": "", "outlinewidth": 0 } } } ], "choropleth": [ { "type": "choropleth", "colorbar": { "ticks": "", "outlinewidth": 0 } } ], "scattergeo": [ { "type": "scattergeo", "marker": { "colorbar": { "ticks": "", "outlinewidth": 0 } } } ], "histogram2d": [ { "type": "histogram2d", "colorbar": { "ticks": "", "outlinewidth": 0 }, "autocolorscale": true } ], "scatterpolar": [ { "type": "scatterpolar", "marker": { "colorbar": { "ticks": "", "outlinewidth": 0 } } } ], "contourcarpet": [ { "type": "contourcarpet", "colorbar": { "ticks": "", "outlinewidth": 0 } } ], "scattercarpet": [ { "type": "scattercarpet", "marker": { "colorbar": { "ticks": "", "outlinewidth": 0 } } } ], "scattermapbox": [ { "type": "scattermapbox", "marker": { "colorbar": { "ticks": "", "outlinewidth": 0 } } } ], "scatterpolargl": [ { "type": "scatterpolargl", "marker": { "colorbar": { "ticks": "", "outlinewidth": 0 } } } ], "scatterternary": [ { "type": "scatterternary", "marker": { "colorbar": { "ticks": "", "outlinewidth": 0 } } } ], "histogram2dcontour": [ { "type": "histogram2dcontour", "colorbar": { "ticks": "", "outlinewidth": 0 }, "autocolorscale": true } ] }, "layout": { "geo": { "bgcolor": "white", "showland": true, "lakecolor": "white", "landcolor": "white", "showlakes": true, "subunitcolor": "#C8D4E3" }, "font": { "color": "#2a3f5f" }, "polar": { "bgcolor": "white", "radialaxis": { "ticks": "", "gridcolor": "#EBF0F8", "linecolor": "#EBF0F8" }, "angularaxis": { "ticks": "", "gridcolor": "#EBF0F8", "linecolor": "#EBF0F8" } }, "scene": { "xaxis": { "ticks": "", "gridcolor": "#DFE8F3", "gridwidth": 2, "linecolor": "#EBF0F8", "zerolinecolor": "#EBF0F8", "showbackground": true, "backgroundcolor": "white" }, "yaxis": { "ticks": "", "gridcolor": "#DFE8F3", "gridwidth": 2, "linecolor": "#EBF0F8", "zerolinecolor": "#EBF0F8", "showbackground": true, "backgroundcolor": "white" }, "zaxis": { "ticks": "", "gridcolor": "#DFE8F3", "gridwidth": 2, "linecolor": "#EBF0F8", "zerolinecolor": "#EBF0F8", "showbackground": true, "backgroundcolor": "white" } }, "title": { "x": 0.05 }, "xaxis": { "ticks": "", "gridcolor": "#EBF0F8", "linecolor": "#EBF0F8", "automargin": true, "zerolinecolor": "#EBF0F8", "zerolinewidth": 2 }, "yaxis": { "ticks": "", "gridcolor": "#EBF0F8", "linecolor": "#EBF0F8", "automargin": true, "zerolinecolor": "#EBF0F8", "zerolinewidth": 2 }, "ternary": { "aaxis": { "ticks": "", "gridcolor": "#DFE8F3", "linecolor": "#A2B1C6" }, "baxis": { "ticks": "", "gridcolor": "#DFE8F3", "linecolor": "#A2B1C6" }, "caxis": { "ticks": "", "gridcolor": "#DFE8F3", "linecolor": "#A2B1C6" }, "bgcolor": "white" }, "colorway": [ "#636efa", "#EF553B", "#00cc96", "#ab63fa", "#19d3f3", "#e763fa", "#fecb52", "#ffa15a", "#ff6692", "#b6e880" ], "hovermode": "closest", "colorscale": { "diverging": [ [ 0, "#8e0152" ], [ 0.1, "#c51b7d" ], [ 0.2, "#de77ae" ], [ 0.3, "#f1b6da" ], [ 0.4, "#fde0ef" ], [ 0.5, "#f7f7f7" ], [ 0.6, "#e6f5d0" ], [ 0.7, "#b8e186" ], [ 0.8, "#7fbc41" ], [ 0.9, "#4d9221" ], [ 1, "#276419" ] ], "sequential": [ [ 0, "#0508b8" ], [ 0.0893854748603352, "#1910d8" ], [ 0.1787709497206704, "#3c19f0" ], [ 0.2681564245810056, "#6b1cfb" ], [ 0.3575418994413408, "#981cfd" ], [ 0.44692737430167595, "#bf1cfd" ], [ 0.5363128491620112, "#dd2bfd" ], [ 0.6256983240223464, "#f246fe" ], [ 0.7150837988826816, "#fc67fd" ], [ 0.8044692737430168, "#fe88fc" ], [ 0.8938547486033519, "#fea5fd" ], [ 0.9832402234636871, "#febefe" ], [ 1, "#fec3fe" ] ], "sequentialminus": [ [ 0, "#0508b8" ], [ 0.0893854748603352, "#1910d8" ], [ 0.1787709497206704, "#3c19f0" ], [ 0.2681564245810056, "#6b1cfb" ], [ 0.3575418994413408, "#981cfd" ], [ 0.44692737430167595, "#bf1cfd" ], [ 0.5363128491620112, "#dd2bfd" ], [ 0.6256983240223464, "#f246fe" ], [ 0.7150837988826816, "#fc67fd" ], [ 0.8044692737430168, "#fe88fc" ], [ 0.8938547486033519, "#fea5fd" ], [ 0.9832402234636871, "#febefe" ], [ 1, "#fec3fe" ] ] }, "plot_bgcolor": "white", "paper_bgcolor": "white", "shapedefaults": { "line": { "width": 0 }, "opacity": 0.4, "fillcolor": "#506784" }, "annotationdefaults": { "arrowhead": 0, "arrowcolor": "#506784", "arrowwidth": 1 } }, "themeRef": "PLOTLY_WHITE" }, "plot_bgcolor": "rgb(255, 255, 255)" } }, "height": null, "width": null, "user": { "profile_url": "https://chart-studio.plotly.com/~ngraddon", "avatar_url": "https://storage.googleapis.com/plotly-prod-profiles/64.jpg", "background_url": "https://storage.googleapis.com/plotly-prod-profiles/bg-14.jpg", "bio": "", "nickname": "", "website": "", "stream_tokens": null, "feature_set_id": null, "csrf_token": null, "date_joined": "2025-06-17 17:25:04", "mapbox_access_tokens": null, "has_password": null, "username": "ngraddon", "email": null, "is_active": null, "readonly": null, "is_dash_creator": null, "dash_created_count": null, "is_chart_creator": null, "charts_created_count": null } }, { "creation_time": "2025-06-17T17:22:03.259984Z", "comments": { "results": [], "count": 0 }, "parented": true, "embed_url": "https://chart-studio.plotly.com/~sindhu0908/5.embed", "fid": "sindhu0908:5", "filename": "Plot 3 copy", "filetype": "plot", "img_url": "https://api.plotly.com/v2/files/sindhu0908:5/image?image_name=list-thumb", "image_urls": { "default": "https://storage.googleapis.com/plotly-prod-images/sindhu0908/5/2_LX7H19D9Y32VY661PA2QCAVW7DSN52.png", "block-thumb": "https://storage.googleapis.com/plotly-prod-images/sindhu0908/5/8_LXS4KSCTT6QGCIY6GPUOMKSWRWFCYV.png", "list-thumb": "https://api.plotly.com/v2/files/sindhu0908:5/image?image_name=list-thumb" }, "api_urls": { "files": "https://api.plotly.com/v2/files/sindhu0908:5", "plots": "https://api.plotly.com/v2/plots/sindhu0908:5", "parent": "https://api.plotly.com/v2/folders/home?user=sindhu0908" }, "owner": "sindhu0908", "parent": -1, "preview": "", "referencers": [], "references": [], "title": "", "views": 0, "web_url": "https://chart-studio.plotly.com/~sindhu0908/5/", "world_readable": true, "date_modified": "2025-06-17T17:22:03.601Z", "stars": { "results": [], "count": 0 }, "collaborators": { "results": [], "count": 0 }, "subfolder_count": null, "refresh_interval": null, "organize_view_url": "https://chart-studio.plotly.com/~sindhu0908/5/", "current_user_permission": "read", "is_theme": null, "is_template": true, "autosize": true, "caption": "", "figure": { "data": [ { "meta": { "columnNames": { "x": "A", "y": "B" } }, "mode": "lines", "name": "TRAIN ACCURACY", "type": "scatter", "xsrc": "sindhu0908:4:6a9dcf", "ysrc": "sindhu0908:4:9d2c20" }, { "meta": { "columnNames": { "x": "A", "y": "B" } }, "mode": "markers", "name": "ACCURACY POINTS", "type": "scatter", "xsrc": "sindhu0908:4:6a9dcf", "ysrc": "sindhu0908:4:9d2c20" }, { "meta": { "columnNames": { "x": "A", "y": "C" } }, "mode": "lines", "name": "TRAIN LOSS", "type": "scatter", "xsrc": "sindhu0908:4:6a9dcf", "ysrc": "sindhu0908:4:9a5702", "xaxis": "x2", "yaxis": "y2" }, { "meta": { "columnNames": { "x": "A", "y": "C" } }, "mode": "markers", "name": "LOSS POINT", "type": "scatter", "xsrc": "sindhu0908:4:6a9dcf", "ysrc": "sindhu0908:4:9a5702", "xaxis": "x2", "yaxis": "y2" } ], "frames": [], "layout": { "title": { "font": { "family": "PT Sans Narrow" }, "text": "<b>COLLSION PREDICTION MODEL - ACCURACY AND LOSS</b>" }, "xaxis": { "side": "bottom", "type": "linear", "range": [ -0.6876702781473736, 31.687670278147372 ], "ticks": "inside", "title": { "font": { "color": "rgb(0, 0, 0)", "family": "PT Sans Narrow" }, "text": "<b>EPOCHS (X)</b>" }, "nticks": 0, "showgrid": true, "showline": true, "autorange": true, "linewidth": 1, "showspikes": false, "rangeslider": { "range": [ -0.6876702781473736, 31.687670278147372 ], "yaxis": {}, "yaxis2": {}, "visible": false, "autorange": true }, "showexponent": "all", "zerolinewidth": 1, "exponentformat": "none" }, "yaxis": { "type": "linear", "range": [ 51.11611111111112, 82.79388888888889 ], "ticks": "inside", "title": { "font": { "color": "rgb(0, 0, 0)", "family": "PT Sans Narrow" }, "text": "<b>TRAIN ACCURACY(Y)</b>" }, "nticks": 0, "showgrid": true, "autorange": false, "linewidth": 1, "showspikes": false, "rangeslider": { "visible": false }, "zerolinewidth": 1 }, "legend": { "x": 1.02, "y": 1.3318385650224216 }, "xaxis2": { "side": "top", "type": "linear", "range": [ -0.6876702781473736, 31.687670278147372 ], "ticks": "inside", "title": { "font": { "color": "rgb(5, 5, 5)", "family": "PT Sans Narrow" }, "text": "<b>EPOCH (X2)</b>" }, "nticks": 0, "showgrid": true, "autorange": true, "gridcolor": "rgb(236, 236, 242)", "linewidth": 1, "overlaying": "x", "showspikes": false, "rangeslider": { "range": [ -0.6876702781473736, 31.687670278147372 ], "visible": false, "autorange": true }, "zerolinewidth": 1 }, "yaxis2": { "side": "right", "type": "linear", "range": [ 0.457579917184265, 0.707820082815735 ], "ticks": "inside", "title": { "font": { "color": "rgb(0, 0, 0)", "family": "PT Sans Narrow" }, "text": "<b>TRAIN LOSS (Y2)</b>" }, "nticks": 0, "showgrid": true, "autorange": true, "linewidth": 1, "overlaying": "y", "showspikes": false, "rangeslider": { "visible": false }, "zerolinewidth": 1 }, "autosize": true, "template": { "data": { "bar": [ { "type": "bar", "marker": { "colorbar": { "ticks": "", "outlinewidth": 0 } } } ], "table": [ { "type": "table", "cells": { "fill": { "color": "#EBF0F8" }, "line": { "color": "white" } }, "header": { "fill": { "color": "#C8D4E3" }, "line": { "color": "white" } } } ], "carpet": [ { "type": "carpet", "aaxis": { "gridcolor": "#C8D4E3", "linecolor": "#C8D4E3", "endlinecolor": "#2a3f5f", "minorgridcolor": "#C8D4E3", "startlinecolor": "#2a3f5f" }, "baxis": { "gridcolor": "#C8D4E3", "linecolor": "#C8D4E3", "endlinecolor": "#2a3f5f", "minorgridcolor": "#C8D4E3", "startlinecolor": "#2a3f5f" } } ], "mesh3d": [ { "type": "mesh3d", "colorbar": { "ticks": "", "outlinewidth": 0 } } ], "contour": [ { "type": "contour", "colorbar": { "ticks": "", "outlinewidth": 0 }, "autocolorscale": true } ], "heatmap": [ { "type": "heatmap", "colorbar": { "ticks": "", "outlinewidth": 0 }, "autocolorscale": true } ], "scatter": [ { "type": "scatter", "marker": { "colorbar": { "ticks": "", "outlinewidth": 0 } } } ], "surface": [ { "type": "surface", "colorbar": { "ticks": "", "outlinewidth": 0 } } ], "heatmapgl": [ { "type": "heatmapgl", "colorbar": { "ticks": "", "outlinewidth": 0 } } ], "histogram": [ { "type": "histogram", "marker": { "colorbar": { "ticks": "", "outlinewidth": 0 } } } ], "parcoords": [ { "line": { "colorbar": { "ticks": "", "outlinewidth": 0 } }, "type": "parcoords" } ], "scatter3d": [ { "type": "scatter3d", "marker": { "colorbar": { "ticks": "", "outlinewidth": 0 } } } ], "scattergl": [ { "type": "scattergl", "marker": { "colorbar": { "ticks": "", "outlinewidth": 0 } } } ], "choropleth": [ { "type": "choropleth", "colorbar": { "ticks": "", "outlinewidth": 0 } } ], "scattergeo": [ { "type": "scattergeo", "marker": { "colorbar": { "ticks": "", "outlinewidth": 0 } } } ], "histogram2d": [ { "type": "histogram2d", "colorbar": { "ticks": "", "outlinewidth": 0 }, "autocolorscale": true } ], "scatterpolar": [ { "type": "scatterpolar", "marker": { "colorbar": { "ticks": "", "outlinewidth": 0 } } } ], "contourcarpet": [ { "type": "contourcarpet", "colorbar": { "ticks": "", "outlinewidth": 0 } } ], "scattercarpet": [ { "type": "scattercarpet", "marker": { "colorbar": { "ticks": "", "outlinewidth": 0 } } } ], "scattermapbox": [ { "type": "scattermapbox", "marker": { "colorbar": { "ticks": "", "outlinewidth": 0 } } } ], "scatterpolargl": [ { "type": "scatterpolargl", "marker": { "colorbar": { "ticks": "", "outlinewidth": 0 } } } ], "scatterternary": [ { "type": "scatterternary", "marker": { "colorbar": { "ticks": "", "outlinewidth": 0 } } } ], "histogram2dcontour": [ { "type": "histogram2dcontour", "colorbar": { "ticks": "", "outlinewidth": 0 }, "autocolorscale": true } ] }, "layout": { "geo": { "bgcolor": "white", "showland": true, "lakecolor": "white", "landcolor": "white", "showlakes": true, "subunitcolor": "#C8D4E3" }, "font": { "color": "#2a3f5f" }, "polar": { "bgcolor": "white", "radialaxis": { "ticks": "", "gridcolor": "#EBF0F8", "linecolor": "#EBF0F8" }, "angularaxis": { "ticks": "", "gridcolor": "#EBF0F8", "linecolor": "#EBF0F8" } }, "scene": { "xaxis": { "ticks": "", "gridcolor": "#DFE8F3", "gridwidth": 2, "linecolor": "#EBF0F8", "zerolinecolor": "#EBF0F8", "showbackground": true, "backgroundcolor": "white" }, "yaxis": { "ticks": "", "gridcolor": "#DFE8F3", "gridwidth": 2, "linecolor": "#EBF0F8", "zerolinecolor": "#EBF0F8", "showbackground": true, "backgroundcolor": "white" }, "zaxis": { "ticks": "", "gridcolor": "#DFE8F3", "gridwidth": 2, "linecolor": "#EBF0F8", "zerolinecolor": "#EBF0F8", "showbackground": true, "backgroundcolor": "white" } }, "title": { "x": 0.05 }, "xaxis": { "ticks": "", "gridcolor": "#EBF0F8", "linecolor": "#EBF0F8", "automargin": true, "zerolinecolor": "#EBF0F8", "zerolinewidth": 2 }, "yaxis": { "ticks": "", "gridcolor": "#EBF0F8", "linecolor": "#EBF0F8", "automargin": true, "zerolinecolor": "#EBF0F8", "zerolinewidth": 2 }, "ternary": { "aaxis": { "ticks": "", "gridcolor": "#DFE8F3", "linecolor": "#A2B1C6" }, "baxis": { "ticks": "", "gridcolor": "#DFE8F3", "linecolor": "#A2B1C6" }, "caxis": { "ticks": "", "gridcolor": "#DFE8F3", "linecolor": "#A2B1C6" }, "bgcolor": "white" }, "colorway": [ "#636efa", "#EF553B", "#00cc96", "#ab63fa", "#19d3f3", "#e763fa", "#fecb52", "#ffa15a", "#ff6692", "#b6e880" ], "hovermode": "closest", "colorscale": { "diverging": [ [ 0, "#8e0152" ], [ 0.1, "#c51b7d" ], [ 0.2, "#de77ae" ], [ 0.3, "#f1b6da" ], [ 0.4, "#fde0ef" ], [ 0.5, "#f7f7f7" ], [ 0.6, "#e6f5d0" ], [ 0.7, "#b8e186" ], [ 0.8, "#7fbc41" ], [ 0.9, "#4d9221" ], [ 1, "#276419" ] ], "sequential": [ [ 0, "#0508b8" ], [ 0.0893854748603352, "#1910d8" ], [ 0.1787709497206704, "#3c19f0" ], [ 0.2681564245810056, "#6b1cfb" ], [ 0.3575418994413408, "#981cfd" ], [ 0.44692737430167595, "#bf1cfd" ], [ 0.5363128491620112, "#dd2bfd" ], [ 0.6256983240223464, "#f246fe" ], [ 0.7150837988826816, "#fc67fd" ], [ 0.8044692737430168, "#fe88fc" ], [ 0.8938547486033519, "#fea5fd" ], [ 0.9832402234636871, "#febefe" ], [ 1, "#fec3fe" ] ], "sequentialminus": [ [ 0, "#0508b8" ], [ 0.0893854748603352, "#1910d8" ], [ 0.1787709497206704, "#3c19f0" ], [ 0.2681564245810056, "#6b1cfb" ], [ 0.3575418994413408, "#981cfd" ], [ 0.44692737430167595, "#bf1cfd" ], [ 0.5363128491620112, "#dd2bfd" ], [ 0.6256983240223464, "#f246fe" ], [ 0.7150837988826816, "#fc67fd" ], [ 0.8044692737430168, "#fe88fc" ], [ 0.8938547486033519, "#fea5fd" ], [ 0.9832402234636871, "#febefe" ], [ 1, "#fec3fe" ] ] }, "plot_bgcolor": "white", "paper_bgcolor": "white", "shapedefaults": { "line": { "width": 0 }, "opacity": 0.4, "fillcolor": "#506784" }, "annotationdefaults": { "arrowhead": 0, "arrowcolor": "#506784", "arrowwidth": 1 } }, "themeRef": "PLOTLY_WHITE" }, "hoverlabel": { "bgcolor": "rgb(234, 231, 231)" } } }, "height": null, "width": null, "user": { "profile_url": "https://chart-studio.plotly.com/~sindhu0908", "avatar_url": "https://storage.googleapis.com/plotly-prod-profiles/46.jpg", "background_url": "https://storage.googleapis.com/plotly-prod-profiles/bg-11.jpg", "bio": "", "nickname": "", "website": "", "stream_tokens": null, "feature_set_id": null, "csrf_token": null, "date_joined": "2025-06-17 16:37:46", "mapbox_access_tokens": null, "has_password": null, "username": "sindhu0908", "email": null, "is_active": null, "readonly": null, "is_dash_creator": null, "dash_created_count": null, "is_chart_creator": null, "charts_created_count": null } }, { "creation_time": "2025-06-17T17:18:32.072363Z", "comments": { "results": [], "count": 0 }, "parented": true, "embed_url": "https://chart-studio.plotly.com/~sindhu0908/3.embed", "fid": "sindhu0908:3", "filename": "Plot 3", "filetype": "plot", "img_url": "https://api.plotly.com/v2/files/sindhu0908:3/image?image_name=list-thumb", "image_urls": { "default": "https://storage.googleapis.com/plotly-prod-images/sindhu0908/3/2_HHGX9IQC3F92AYIN7VEEM2OS3UHS8R.png", "block-thumb": "https://storage.googleapis.com/plotly-prod-images/sindhu0908/3/8_7LLWKUQHC0I1BK0TQJBPOF72PZVJV9.png", "list-thumb": "https://api.plotly.com/v2/files/sindhu0908:3/image?image_name=list-thumb" }, "api_urls": { "files": "https://api.plotly.com/v2/files/sindhu0908:3", "plots": "https://api.plotly.com/v2/plots/sindhu0908:3", "parent": "https://api.plotly.com/v2/folders/home?user=sindhu0908" }, "owner": "sindhu0908", "parent": -1, "preview": "", "referencers": [], "references": [], "title": "", "views": 0, "web_url": "https://chart-studio.plotly.com/~sindhu0908/3/", "world_readable": true, "date_modified": "2025-06-17T17:18:32.086Z", "stars": { "results": [], "count": 0 }, "collaborators": { "results": [], "count": 0 }, "subfolder_count": null, "refresh_interval": null, "organize_view_url": "https://chart-studio.plotly.com/~sindhu0908/3/", "current_user_permission": "read", "is_theme": null, "is_template": true, "autosize": true, "caption": "", "figure": { "data": [ { "meta": { "columnNames": { "x": "A", "y": "B" } }, "mode": "lines", "name": "TRAIN ACCURACY", "type": "scatter", "xsrc": "sindhu0908:2:6a9dcf", "ysrc": "sindhu0908:2:9d2c20" }, { "meta": { "columnNames": { "x": "A", "y": "B" } }, "mode": "markers", "name": "ACCURACY POINTS", "type": "scatter", "xsrc": "sindhu0908:2:6a9dcf", "ysrc": "sindhu0908:2:9d2c20" }, { "meta": { "columnNames": { "x": "A", "y": "C" } }, "mode": "lines", "name": "TRAIN LOSS", "type": "scatter", "xsrc": "sindhu0908:2:6a9dcf", "ysrc": "sindhu0908:2:9a5702", "xaxis": "x2", "yaxis": "y2" }, { "meta": { "columnNames": { "x": "A", "y": "C" } }, "mode": "markers", "name": "LOSS POINT", "type": "scatter", "xsrc": "sindhu0908:2:6a9dcf", "ysrc": "sindhu0908:2:9a5702", "xaxis": "x2", "yaxis": "y2" } ], "frames": [], "layout": { "title": { "font": { "family": "PT Sans Narrow" }, "text": "<b>COLLSION PREDICTION MODEL - ACCURACY AND LOSS</b>" }, "xaxis": { "side": "bottom", "type": "linear", "range": [ -0.6876702781473736, 31.687670278147372 ], "ticks": "inside", "title": { "font": { "color": "rgb(0, 0, 0)", "family": "PT Sans Narrow" }, "text": "<b>EPOCHS (X)</b>" }, "nticks": 0, "showgrid": true, "showline": true, "autorange": true, "linewidth": 1, "showspikes": false, "rangeslider": { "range": [ -0.6876702781473736, 31.687670278147372 ], "yaxis": {}, "yaxis2": {}, "visible": false, "autorange": true }, "showexponent": "all", "zerolinewidth": 1, "exponentformat": "none" }, "yaxis": { "type": "linear", "range": [ 51.11611111111112, 82.79388888888889 ], "ticks": "inside", "title": { "font": { "color": "rgb(0, 0, 0)", "family": "PT Sans Narrow" }, "text": "<b>TRAIN ACCURACY(Y)</b>" }, "nticks": 0, "showgrid": true, "autorange": false, "linewidth": 1, "showspikes": false, "rangeslider": { "visible": false }, "zerolinewidth": 1 }, "legend": { "x": 1.02, "y": 1.3318385650224216 }, "xaxis2": { "side": "top", "type": "linear", "range": [ -0.6876702781473736, 31.687670278147372 ], "ticks": "inside", "title": { "font": { "color": "rgb(5, 5, 5)", "family": "PT Sans Narrow" }, "text": "<b>EPOCH (X2)</b>" }, "nticks": 0, "showgrid": true, "autorange": true, "gridcolor": "rgb(236, 236, 242)", "linewidth": 1, "overlaying": "x", "showspikes": false, "rangeslider": { "range": [ -0.6876702781473736, 31.687670278147372 ], "visible": false, "autorange": true }, "zerolinewidth": 1 }, "yaxis2": { "side": "right", "type": "linear", "range": [ 0.457579917184265, 0.707820082815735 ], "ticks": "inside", "title": { "font": { "color": "rgb(0, 0, 0)", "family": "PT Sans Narrow" }, "text": "<b>TRAIN LOSS (Y2)</b>" }, "nticks": 0, "showgrid": true, "autorange": true, "linewidth": 1, "overlaying": "y", "showspikes": false, "rangeslider": { "visible": false }, "zerolinewidth": 1 }, "autosize": true, "template": { "data": { "bar": [ { "type": "bar", "marker": { "colorbar": { "ticks": "", "outlinewidth": 0 } } } ], "table": [ { "type": "table", "cells": { "fill": { "color": "#EBF0F8" }, "line": { "color": "white" } }, "header": { "fill": { "color": "#C8D4E3" }, "line": { "color": "white" } } } ], "carpet": [ { "type": "carpet", "aaxis": { "gridcolor": "#C8D4E3", "linecolor": "#C8D4E3", "endlinecolor": "#2a3f5f", "minorgridcolor": "#C8D4E3", "startlinecolor": "#2a3f5f" }, "baxis": { "gridcolor": "#C8D4E3", "linecolor": "#C8D4E3", "endlinecolor": "#2a3f5f", "minorgridcolor": "#C8D4E3", "startlinecolor": "#2a3f5f" } } ], "mesh3d": [ { "type": "mesh3d", "colorbar": { "ticks": "", "outlinewidth": 0 } } ], "contour": [ { "type": "contour", "colorbar": { "ticks": "", "outlinewidth": 0 }, "autocolorscale": true } ], "heatmap": [ { "type": "heatmap", "colorbar": { "ticks": "", "outlinewidth": 0 }, "autocolorscale": true } ], "scatter": [ { "type": "scatter", "marker": { "colorbar": { "ticks": "", "outlinewidth": 0 } } } ], "surface": [ { "type": "surface", "colorbar": { "ticks": "", "outlinewidth": 0 } } ], "heatmapgl": [ { "type": "heatmapgl", "colorbar": { "ticks": "", "outlinewidth": 0 } } ], "histogram": [ { "type": "histogram", "marker": { "colorbar": { "ticks": "", "outlinewidth": 0 } } } ], "parcoords": [ { "line": { "colorbar": { "ticks": "", "outlinewidth": 0 } }, "type": "parcoords" } ], "scatter3d": [ { "type": "scatter3d", "marker": { "colorbar": { "ticks": "", "outlinewidth": 0 } } } ], "scattergl": [ { "type": "scattergl", "marker": { "colorbar": { "ticks": "", "outlinewidth": 0 } } } ], "choropleth": [ { "type": "choropleth", "colorbar": { "ticks": "", "outlinewidth": 0 } } ], "scattergeo": [ { "type": "scattergeo", "marker": { "colorbar": { "ticks": "", "outlinewidth": 0 } } } ], "histogram2d": [ { "type": "histogram2d", "colorbar": { "ticks": "", "outlinewidth": 0 }, "autocolorscale": true } ], "scatterpolar": [ { "type": "scatterpolar", "marker": { "colorbar": { "ticks": "", "outlinewidth": 0 } } } ], "contourcarpet": [ { "type": "contourcarpet", "colorbar": { "ticks": "", "outlinewidth": 0 } } ], "scattercarpet": [ { "type": "scattercarpet", "marker": { "colorbar": { "ticks": "", "outlinewidth": 0 } } } ], "scattermapbox": [ { "type": "scattermapbox", "marker": { "colorbar": { "ticks": "", "outlinewidth": 0 } } } ], "scatterpolargl": [ { "type": "scatterpolargl", "marker": { "colorbar": { "ticks": "", "outlinewidth": 0 } } } ], "scatterternary": [ { "type": "scatterternary", "marker": { "colorbar": { "ticks": "", "outlinewidth": 0 } } } ], "histogram2dcontour": [ { "type": "histogram2dcontour", "colorbar": { "ticks": "", "outlinewidth": 0 }, "autocolorscale": true } ] }, "layout": { "geo": { "bgcolor": "white", "showland": true, "lakecolor": "white", "landcolor": "white", "showlakes": true, "subunitcolor": "#C8D4E3" }, "font": { "color": "#2a3f5f" }, "polar": { "bgcolor": "white", "radialaxis": { "ticks": "", "gridcolor": "#EBF0F8", "linecolor": "#EBF0F8" }, "angularaxis": { "ticks": "", "gridcolor": "#EBF0F8", "linecolor": "#EBF0F8" } }, "scene": { "xaxis": { "ticks": "", "gridcolor": "#DFE8F3", "gridwidth": 2, "linecolor": "#EBF0F8", "zerolinecolor": "#EBF0F8", "showbackground": true, "backgroundcolor": "white" }, "yaxis": { "ticks": "", "gridcolor": "#DFE8F3", "gridwidth": 2, "linecolor": "#EBF0F8", "zerolinecolor": "#EBF0F8", "showbackground": true, "backgroundcolor": "white" }, "zaxis": { "ticks": "", "gridcolor": "#DFE8F3", "gridwidth": 2, "linecolor": "#EBF0F8", "zerolinecolor": "#EBF0F8", "showbackground": true, "backgroundcolor": "white" } }, "title": { "x": 0.05 }, "xaxis": { "ticks": "", "gridcolor": "#EBF0F8", "linecolor": "#EBF0F8", "automargin": true, "zerolinecolor": "#EBF0F8", "zerolinewidth": 2 }, "yaxis": { "ticks": "", "gridcolor": "#EBF0F8", "linecolor": "#EBF0F8", "automargin": true, "zerolinecolor": "#EBF0F8", "zerolinewidth": 2 }, "ternary": { "aaxis": { "ticks": "", "gridcolor": "#DFE8F3", "linecolor": "#A2B1C6" }, "baxis": { "ticks": "", "gridcolor": "#DFE8F3", "linecolor": "#A2B1C6" }, "caxis": { "ticks": "", "gridcolor": "#DFE8F3", "linecolor": "#A2B1C6" }, "bgcolor": "white" }, "colorway": [ "#636efa", "#EF553B", "#00cc96", "#ab63fa", "#19d3f3", "#e763fa", "#fecb52", "#ffa15a", "#ff6692", "#b6e880" ], "hovermode": "closest", "colorscale": { "diverging": [ [ 0, "#8e0152" ], [ 0.1, "#c51b7d" ], [ 0.2, "#de77ae" ], [ 0.3, "#f1b6da" ], [ 0.4, "#fde0ef" ], [ 0.5, "#f7f7f7" ], [ 0.6, "#e6f5d0" ], [ 0.7, "#b8e186" ], [ 0.8, "#7fbc41" ], [ 0.9, "#4d9221" ], [ 1, "#276419" ] ], "sequential": [ [ 0, "#0508b8" ], [ 0.0893854748603352, "#1910d8" ], [ 0.1787709497206704, "#3c19f0" ], [ 0.2681564245810056, "#6b1cfb" ], [ 0.3575418994413408, "#981cfd" ], [ 0.44692737430167595, "#bf1cfd" ], [ 0.5363128491620112, "#dd2bfd" ], [ 0.6256983240223464, "#f246fe" ], [ 0.7150837988826816, "#fc67fd" ], [ 0.8044692737430168, "#fe88fc" ], [ 0.8938547486033519, "#fea5fd" ], [ 0.9832402234636871, "#febefe" ], [ 1, "#fec3fe" ] ], "sequentialminus": [ [ 0, "#0508b8" ], [ 0.0893854748603352, "#1910d8" ], [ 0.1787709497206704, "#3c19f0" ], [ 0.2681564245810056, "#6b1cfb" ], [ 0.3575418994413408, "#981cfd" ], [ 0.44692737430167595, "#bf1cfd" ], [ 0.5363128491620112, "#dd2bfd" ], [ 0.6256983240223464, "#f246fe" ], [ 0.7150837988826816, "#fc67fd" ], [ 0.8044692737430168, "#fe88fc" ], [ 0.8938547486033519, "#fea5fd" ], [ 0.9832402234636871, "#febefe" ], [ 1, "#fec3fe" ] ] }, "plot_bgcolor": "white", "paper_bgcolor": "white", "shapedefaults": { "line": { "width": 0 }, "opacity": 0.4, "fillcolor": "#506784" }, "annotationdefaults": { "arrowhead": 0, "arrowcolor": "#506784", "arrowwidth": 1 } }, "themeRef": "PLOTLY_WHITE" }, "hoverlabel": { "bgcolor": "rgb(234, 231, 231)" } } }, "height": null, "width": null, "user": { "profile_url": "https://chart-studio.plotly.com/~sindhu0908", "avatar_url": "https://storage.googleapis.com/plotly-prod-profiles/46.jpg", "background_url": "https://storage.googleapis.com/plotly-prod-profiles/bg-11.jpg", "bio": "", "nickname": "", "website": "", "stream_tokens": null, "feature_set_id": null, "csrf_token": null, "date_joined": "2025-06-17 16:37:46", "mapbox_access_tokens": null, "has_password": null, "username": "sindhu0908", "email": null, "is_active": null, "readonly": null, "is_dash_creator": null, "dash_created_count": null, "is_chart_creator": null, "charts_created_count": null } }, { "creation_time": "2025-06-17T17:09:36.728896Z", "comments": { "results": [], "count": 0 }, "parented": true, "embed_url": "https://chart-studio.plotly.com/~fermza/83.embed", "fid": "fermza:83", "filename": "id mean vs species_REVERSE", "filetype": "plot", "img_url": "https://api.plotly.com/v2/files/fermza:83/image?image_name=list-thumb", "image_urls": { "default": "https://api.plotly.com/v2/files/fermza:83/image?image_name=default", "block-thumb": "https://api.plotly.com/v2/files/fermza:83/image?image_name=block-thumb", "list-thumb": "https://api.plotly.com/v2/files/fermza:83/image?image_name=list-thumb" }, "api_urls": { "files": "https://api.plotly.com/v2/files/fermza:83", "plots": "https://api.plotly.com/v2/plots/fermza:83", "parent": "https://api.plotly.com/v2/folders/home?user=fermza" }, "owner": "fermza", "parent": -1, "preview": "", "referencers": [], "references": [], "title": "", "views": 0, "web_url": "https://chart-studio.plotly.com/~fermza/83/", "world_readable": true, "date_modified": "2025-06-18T17:01:07.527Z", "stars": { "results": [], "count": 0 }, "collaborators": { "results": [], "count": 0 }, "subfolder_count": null, "refresh_interval": null, "organize_view_url": "https://chart-studio.plotly.com/~fermza/83/", "current_user_permission": "read", "is_theme": null, "is_template": false, "autosize": true, "caption": "", "figure": { "data": [ { "meta": { "columnNames": { "x": "species", "y": "Mean", "text": "Subgroup", "marker": { "size": "group_size", "color": "seq/species" } } }, "mode": "markers", "type": "scatter", "xsrc": "fermza:61:f6e06a", "ysrc": "fermza:61:74cdc2", "marker": { "cmax": 20, "cmin": 1, "line": { "color": "rgb(0, 0, 0)", "width": 2 }, "meta": { "columnNames": { "size": "group_size", "color": "seq/species" } }, "cauto": false, "opacity": 0.85, "sizemin": 2, "sizeref": 0.2518518518518518, "sizesrc": "fermza:61:577a11", "colorbar": { "x": 1, "y": 0.5, "len": 0.75, "ticks": "outside", "title": { "side": "top", "text": "sequences / species" }, "xanchor": "left", "yanchor": "middle", "tickmode": "auto", "thickness": 30, "thicknessmode": "pixels" }, "colorsrc": "fermza:61:1f687a", "sizemode": "area", "showscale": true, "colorscale": [ [ 0, "#0d0887" ], [ 0.1111111111111111, "#46039f" ], [ 0.2222222222222222, "#7201a8" ], [ 0.3333333333333333, "#9c179e" ], [ 0.4444444444444444, "#bd3786" ], [ 0.5555555555555556, "#d8576b" ], [ 0.6666666666666666, "#ed7953" ], [ 0.7777777777777778, "#fb9f3a" ], [ 0.8888888888888888, "#fdca26" ], [ 1, "#f0f921" ] ], "reversescale": true }, "textsrc": "fermza:61:c14730", "autocolorscale": false }, { "meta": { "columnNames": { "x": "species_L0", "y": "Mean_L0", "marker": { "size": "group_size_L0", "color": "seq/species_L0" } } }, "mode": "markers", "type": "scatter", "xsrc": "fermza:61:db401b", "ysrc": "fermza:61:520233", "marker": { "cmax": 20, "cmin": 1, "line": { "color": "rgb(255, 0, 0)", "width": 2.5 }, "meta": { "columnNames": { "size": "group_size_L0", "color": "seq/species_L0" } }, "cauto": false, "opacity": 0.6, "sizeref": 0.2518518518518518, "sizesrc": "fermza:61:4dc918", "colorbar": { "len": 0.5, "ticks": "outside", "lenmode": "fraction", "yanchor": "top" }, "colorsrc": "fermza:61:b7be2c", "sizemode": "area", "showscale": false, "colorscale": [ [ 0, "#0d0887" ], [ 0.1111111111111111, "#46039f" ], [ 0.2222222222222222, "#7201a8" ], [ 0.3333333333333333, "#9c179e" ], [ 0.4444444444444444, "#bd3786" ], [ 0.5555555555555556, "#d8576b" ], [ 0.6666666666666666, "#ed7953" ], [ 0.7777777777777778, "#fb9f3a" ], [ 0.8888888888888888, "#fdca26" ], [ 1, "#f0f921" ] ], "reversescale": true }, "stackgroup": null, "autocolorscale": false } ], "frames": [], "layout": { "font": { "family": "Roboto" }, "title": { "font": { "color": "rgb(0, 0, 0)" }, "text": "G2<br><br>" }, "xaxis": { "side": "bottom", "type": "linear", "dtick": 10, "range": [ -6, 225 ], "tick0": 0, "ticks": "outside", "title": { "font": { "size": 17, "color": "rgb(0, 0, 0)", "family": "Roboto" }, "text": "species" }, "domain": [ 0, 1 ], "mirror": "ticks", "ticklen": 8, "showgrid": true, "showline": true, "tickfont": { "size": 16, "color": "rgb(0, 0, 0)", "family": "Balto" }, "tickmode": "linear", "autorange": false, "gridcolor": "rgb(210, 213, 216)", "linecolor": "rgb(0, 0, 0)", "linewidth": 3, "tickcolor": "rgb(0, 0, 0)", "tickwidth": 3, "showspikes": false, "rangeslider": { "range": [ -12.266060224762832, 225 ], "yaxis": {}, "visible": false, "autorange": true }, "zerolinecolor": "rgb(210, 213, 216)", "showticklabels": true }, "yaxis": { "type": "linear", "range": [ 30, 90 ], "ticks": "outside", "title": { "font": { "size": 17, "color": "rgb(0, 0, 0)", "family": "Roboto" }, "text": "ID% (subgroup mean)" }, "domain": [ 0, 1 ], "mirror": "ticks", "ticklen": 8, "showgrid": true, "showline": true, "tickfont": { "size": 16, "color": "rgb(0, 0, 0)", "family": "Balto" }, "autorange": false, "linecolor": "rgb(0, 0, 0)", "linewidth": 3, "tickcolor": "rgb(0, 0, 0)", "tickwidth": 3, "showticklabels": true }, "legend": { "x": 1.0237664783427496, "y": 1.1804511278195489, "itemsizing": "trace" }, "margin": { "b": 100, "l": 120, "r": 900, "t": 100 }, "autosize": true, "template": { "data": { "bar": [ { "type": "bar", "marker": { "colorbar": { "ticks": "", "outlinewidth": 0 } } } ], "table": [ { "type": "table", "cells": { "fill": { "color": "#EBF0F8" }, "line": { "color": "white" } }, "header": { "fill": { "color": "#C8D4E3" }, "line": { "color": "white" } } } ], "carpet": [ { "type": "carpet", "aaxis": { "gridcolor": "#C8D4E3", "linecolor": "#C8D4E3", "endlinecolor": "#2a3f5f", "minorgridcolor": "#C8D4E3", "startlinecolor": "#2a3f5f" }, "baxis": { "gridcolor": "#C8D4E3", "linecolor": "#C8D4E3", "endlinecolor": "#2a3f5f", "minorgridcolor": "#C8D4E3", "startlinecolor": "#2a3f5f" } } ], "mesh3d": [ { "type": "mesh3d", "colorbar": { "ticks": "", "outlinewidth": 0 } } ], "contour": [ { "type": "contour", "colorbar": { "ticks": "", "outlinewidth": 0 }, "autocolorscale": true } ], "heatmap": [ { "type": "heatmap", "colorbar": { "ticks": "", "outlinewidth": 0 }, "autocolorscale": true } ], "scatter": [ { "type": "scatter", "marker": { "colorbar": { "ticks": "", "outlinewidth": 0 } } } ], "surface": [ { "type": "surface", "colorbar": { "ticks": "", "outlinewidth": 0 } } ], "heatmapgl": [ { "type": "heatmapgl", "colorbar": { "ticks": "", "outlinewidth": 0 } } ], "histogram": [ { "type": "histogram", "marker": { "colorbar": { "ticks": "", "outlinewidth": 0 } } } ], "parcoords": [ { "line": { "colorbar": { "ticks": "", "outlinewidth": 0 } }, "type": "parcoords" } ], "scatter3d": [ { "type": "scatter3d", "marker": { "colorbar": { "ticks": "", "outlinewidth": 0 } } } ], "scattergl": [ { "type": "scattergl", "marker": { "colorbar": { "ticks": "", "outlinewidth": 0 } } } ], "choropleth": [ { "type": "choropleth", "colorbar": { "ticks": "", "outlinewidth": 0 } } ], "scattergeo": [ { "type": "scattergeo", "marker": { "colorbar": { "ticks": "", "outlinewidth": 0 } } } ], "histogram2d": [ { "type": "histogram2d", "colorbar": { "ticks": "", "outlinewidth": 0 }, "autocolorscale": true } ], "scatterpolar": [ { "type": "scatterpolar", "marker": { "colorbar": { "ticks": "", "outlinewidth": 0 } } } ], "contourcarpet": [ { "type": "contourcarpet", "colorbar": { "ticks": "", "outlinewidth": 0 } } ], "scattercarpet": [ { "type": "scattercarpet", "marker": { "colorbar": { "ticks": "", "outlinewidth": 0 } } } ], "scattermapbox": [ { "type": "scattermapbox", "marker": { "colorbar": { "ticks": "", "outlinewidth": 0 } } } ], "scatterpolargl": [ { "type": "scatterpolargl", "marker": { "colorbar": { "ticks": "", "outlinewidth": 0 } } } ], "scatterternary": [ { "type": "scatterternary", "marker": { "colorbar": { "ticks": "", "outlinewidth": 0 } } } ], "histogram2dcontour": [ { "type": "histogram2dcontour", "colorbar": { "ticks": "", "outlinewidth": 0 }, "autocolorscale": true } ] }, "layout": { "geo": { "bgcolor": "white", "showland": true, "lakecolor": "white", "landcolor": "white", "showlakes": true, "subunitcolor": "#C8D4E3" }, "font": { "color": "#2a3f5f" }, "polar": { "bgcolor": "white", "radialaxis": { "ticks": "", "gridcolor": "#EBF0F8", "linecolor": "#EBF0F8" }, "angularaxis": { "ticks": "", "gridcolor": "#EBF0F8", "linecolor": "#EBF0F8" } }, "scene": { "xaxis": { "ticks": "", "gridcolor": "#DFE8F3", "gridwidth": 2, "linecolor": "#EBF0F8", "zerolinecolor": "#EBF0F8", "showbackground": true, "backgroundcolor": "white" }, "yaxis": { "ticks": "", "gridcolor": "#DFE8F3", "gridwidth": 2, "linecolor": "#EBF0F8", "zerolinecolor": "#EBF0F8", "showbackground": true, "backgroundcolor": "white" }, "zaxis": { "ticks": "", "gridcolor": "#DFE8F3", "gridwidth": 2, "linecolor": "#EBF0F8", "zerolinecolor": "#EBF0F8", "showbackground": true, "backgroundcolor": "white" } }, "title": { "x": 0.05 }, "xaxis": { "ticks": "", "gridcolor": "#EBF0F8", "linecolor": "#EBF0F8", "automargin": true, "zerolinecolor": "#EBF0F8", "zerolinewidth": 2 }, "yaxis": { "ticks": "", "gridcolor": "#EBF0F8", "linecolor": "#EBF0F8", "automargin": true, "zerolinecolor": "#EBF0F8", "zerolinewidth": 2 }, "ternary": { "aaxis": { "ticks": "", "gridcolor": "#DFE8F3", "linecolor": "#A2B1C6" }, "baxis": { "ticks": "", "gridcolor": "#DFE8F3", "linecolor": "#A2B1C6" }, "caxis": { "ticks": "", "gridcolor": "#DFE8F3", "linecolor": "#A2B1C6" }, "bgcolor": "white" }, "colorway": [ "#636efa", "#EF553B", "#00cc96", "#ab63fa", "#19d3f3", "#e763fa", "#fecb52", "#ffa15a", "#ff6692", "#b6e880" ], "hovermode": "closest", "colorscale": { "diverging": [ [ 0, "#8e0152" ], [ 0.1, "#c51b7d" ], [ 0.2, "#de77ae" ], [ 0.3, "#f1b6da" ], [ 0.4, "#fde0ef" ], [ 0.5, "#f7f7f7" ], [ 0.6, "#e6f5d0" ], [ 0.7, "#b8e186" ], [ 0.8, "#7fbc41" ], [ 0.9, "#4d9221" ], [ 1, "#276419" ] ], "sequential": [ [ 0, "#0508b8" ], [ 0.0893854748603352, "#1910d8" ], [ 0.1787709497206704, "#3c19f0" ], [ 0.2681564245810056, "#6b1cfb" ], [ 0.3575418994413408, "#981cfd" ], [ 0.44692737430167595, "#bf1cfd" ], [ 0.5363128491620112, "#dd2bfd" ], [ 0.6256983240223464, "#f246fe" ], [ 0.7150837988826816, "#fc67fd" ], [ 0.8044692737430168, "#fe88fc" ], [ 0.8938547486033519, "#fea5fd" ], [ 0.9832402234636871, "#febefe" ], [ 1, "#fec3fe" ] ], "sequentialminus": [ [ 0, "#0508b8" ], [ 0.0893854748603352, "#1910d8" ], [ 0.1787709497206704, "#3c19f0" ], [ 0.2681564245810056, "#6b1cfb" ], [ 0.3575418994413408, "#981cfd" ], [ 0.44692737430167595, "#bf1cfd" ], [ 0.5363128491620112, "#dd2bfd" ], [ 0.6256983240223464, "#f246fe" ], [ 0.7150837988826816, "#fc67fd" ], [ 0.8044692737430168, "#fe88fc" ], [ 0.8938547486033519, "#fea5fd" ], [ 0.9832402234636871, "#febefe" ], [ 1, "#fec3fe" ] ] }, "plot_bgcolor": "white", "paper_bgcolor": "white", "shapedefaults": { "line": { "width": 0 }, "opacity": 0.4, "fillcolor": "#506784" }, "annotationdefaults": { "arrowhead": 0, "arrowcolor": "#506784", "arrowwidth": 1 } }, "themeRef": "PLOTLY_WHITE" }, "showlegend": false, "annotations": [ { "x": 0, "y": 90, "ax": -50, "ay": -250, "text": "Reversed: color bar is nowseqs/species. Ball size is group size (opacity is lower for L0)", "xanchor": "left", "yanchor": "top", "showarrow": false, "arrowwidth": 0.1 } ] } }, "height": null, "width": null, "user": { "profile_url": "https://chart-studio.plotly.com/~fermza", "avatar_url": "https://storage.googleapis.com/plotly-prod-profiles/78.jpg", "background_url": "https://storage.googleapis.com/plotly-prod-profiles/bg-0.jpg", "bio": "", "nickname": "", "website": "", "stream_tokens": null, "feature_set_id": null, "csrf_token": null, "date_joined": "2019-12-12 14:24:13", "mapbox_access_tokens": null, "has_password": null, "username": "fermza", "email": null, "is_active": null, "readonly": null, "is_dash_creator": null, "dash_created_count": null, "is_chart_creator": null, "charts_created_count": null } }, { "creation_time": "2025-06-17T16:58:07.463835Z", "comments": { "results": [], "count": 0 }, "parented": true, "embed_url": "https://chart-studio.plotly.com/~sindhu0908/1.embed", "fid": "sindhu0908:1", "filename": "Plot 1", "filetype": "plot", "img_url": "https://api.plotly.com/v2/files/sindhu0908:1/image?image_name=list-thumb", "image_urls": { "default": "https://api.plotly.com/v2/files/sindhu0908:1/image?image_name=default", "block-thumb": "https://storage.googleapis.com/plotly-prod-images/sindhu0908/1/8_7RQ49Z3BWU1I2IOCZPYB0WL80Z2SUF.png", "list-thumb": "https://api.plotly.com/v2/files/sindhu0908:1/image?image_name=list-thumb" }, "api_urls": { "files": "https://api.plotly.com/v2/files/sindhu0908:1", "plots": "https://api.plotly.com/v2/plots/sindhu0908:1", "parent": "https://api.plotly.com/v2/folders/home?user=sindhu0908" }, "owner": "sindhu0908", "parent": -1, "preview": "", "referencers": [], "references": [], "title": "", "views": 0, "web_url": "https://chart-studio.plotly.com/~sindhu0908/1/", "world_readable": true, "date_modified": "2025-06-17T16:58:07.475Z", "stars": { "results": [], "count": 0 }, "collaborators": { "results": [], "count": 0 }, "subfolder_count": null, "refresh_interval": null, "organize_view_url": "https://chart-studio.plotly.com/~sindhu0908/1/", "current_user_permission": "read", "is_theme": null, "is_template": true, "autosize": true, "caption": "", "figure": { "data": [ { "meta": { "columnNames": { "x": "A", "y": "B" } }, "mode": "lines", "type": "scatter", "xsrc": "sindhu0908:0:874afa", "ysrc": "sindhu0908:0:cee90b" } ], "frames": [], "layout": { "title": { "text": "Collision Prediction Model – Accuracy" }, "xaxis": { "type": "linear", "range": [ 1, 30 ], "title": { "text": "EPOCHS (X)" }, "autorange": false }, "yaxis": { "type": "linear", "range": [ 51.11611111111112, 82.79388888888889 ], "title": { "text": "TRAIN ACCURACY(Y)" }, "autorange": false }, "autosize": true, "template": { "data": { "bar": [ { "type": "bar", "marker": { "colorbar": { "ticks": "", "outlinewidth": 0 } } } ], "table": [ { "type": "table", "cells": { "fill": { "color": "#EBF0F8" }, "line": { "color": "white" } }, "header": { "fill": { "color": "#C8D4E3" }, "line": { "color": "white" } } } ], "carpet": [ { "type": "carpet", "aaxis": { "gridcolor": "#C8D4E3", "linecolor": "#C8D4E3", "endlinecolor": "#2a3f5f", "minorgridcolor": "#C8D4E3", "startlinecolor": "#2a3f5f" }, "baxis": { "gridcolor": "#C8D4E3", "linecolor": "#C8D4E3", "endlinecolor": "#2a3f5f", "minorgridcolor": "#C8D4E3", "startlinecolor": "#2a3f5f" } } ], "mesh3d": [ { "type": "mesh3d", "colorbar": { "ticks": "", "outlinewidth": 0 } } ], "contour": [ { "type": "contour", "colorbar": { "ticks": "", "outlinewidth": 0 }, "autocolorscale": true } ], "heatmap": [ { "type": "heatmap", "colorbar": { "ticks": "", "outlinewidth": 0 }, "autocolorscale": true } ], "scatter": [ { "type": "scatter", "marker": { "colorbar": { "ticks": "", "outlinewidth": 0 } } } ], "surface": [ { "type": "surface", "colorbar": { "ticks": "", "outlinewidth": 0 } } ], "heatmapgl": [ { "type": "heatmapgl", "colorbar": { "ticks": "", "outlinewidth": 0 } } ], "histogram": [ { "type": "histogram", "marker": { "colorbar": { "ticks": "", "outlinewidth": 0 } } } ], "parcoords": [ { "line": { "colorbar": { "ticks": "", "outlinewidth": 0 } }, "type": "parcoords" } ], "scatter3d": [ { "type": "scatter3d", "marker": { "colorbar": { "ticks": "", "outlinewidth": 0 } } } ], "scattergl": [ { "type": "scattergl", "marker": { "colorbar": { "ticks": "", "outlinewidth": 0 } } } ], "choropleth": [ { "type": "choropleth", "colorbar": { "ticks": "", "outlinewidth": 0 } } ], "scattergeo": [ { "type": "scattergeo", "marker": { "colorbar": { "ticks": "", "outlinewidth": 0 } } } ], "histogram2d": [ { "type": "histogram2d", "colorbar": { "ticks": "", "outlinewidth": 0 }, "autocolorscale": true } ], "scatterpolar": [ { "type": "scatterpolar", "marker": { "colorbar": { "ticks": "", "outlinewidth": 0 } } } ], "contourcarpet": [ { "type": "contourcarpet", "colorbar": { "ticks": "", "outlinewidth": 0 } } ], "scattercarpet": [ { "type": "scattercarpet", "marker": { "colorbar": { "ticks": "", "outlinewidth": 0 } } } ], "scattermapbox": [ { "type": "scattermapbox", "marker": { "colorbar": { "ticks": "", "outlinewidth": 0 } } } ], "scatterpolargl": [ { "type": "scatterpolargl", "marker": { "colorbar": { "ticks": "", "outlinewidth": 0 } } } ], "scatterternary": [ { "type": "scatterternary", "marker": { "colorbar": { "ticks": "", "outlinewidth": 0 } } } ], "histogram2dcontour": [ { "type": "histogram2dcontour", "colorbar": { "ticks": "", "outlinewidth": 0 }, "autocolorscale": true } ] }, "layout": { "geo": { "bgcolor": "white", "showland": true, "lakecolor": "white", "landcolor": "white", "showlakes": true, "subunitcolor": "#C8D4E3" }, "font": { "color": "#2a3f5f" }, "polar": { "bgcolor": "white", "radialaxis": { "ticks": "", "gridcolor": "#EBF0F8", "linecolor": "#EBF0F8" }, "angularaxis": { "ticks": "", "gridcolor": "#EBF0F8", "linecolor": "#EBF0F8" } }, "scene": { "xaxis": { "ticks": "", "gridcolor": "#DFE8F3", "gridwidth": 2, "linecolor": "#EBF0F8", "zerolinecolor": "#EBF0F8", "showbackground": true, "backgroundcolor": "white" }, "yaxis": { "ticks": "", "gridcolor": "#DFE8F3", "gridwidth": 2, "linecolor": "#EBF0F8", "zerolinecolor": "#EBF0F8", "showbackground": true, "backgroundcolor": "white" }, "zaxis": { "ticks": "", "gridcolor": "#DFE8F3", "gridwidth": 2, "linecolor": "#EBF0F8", "zerolinecolor": "#EBF0F8", "showbackground": true, "backgroundcolor": "white" } }, "title": { "x": 0.05 }, "xaxis": { "ticks": "", "gridcolor": "#EBF0F8", "linecolor": "#EBF0F8", "automargin": true, "zerolinecolor": "#EBF0F8", "zerolinewidth": 2 }, "yaxis": { "ticks": "", "gridcolor": "#EBF0F8", "linecolor": "#EBF0F8", "automargin": true, "zerolinecolor": "#EBF0F8", "zerolinewidth": 2 }, "ternary": { "aaxis": { "ticks": "", "gridcolor": "#DFE8F3", "linecolor": "#A2B1C6" }, "baxis": { "ticks": "", "gridcolor": "#DFE8F3", "linecolor": "#A2B1C6" }, "caxis": { "ticks": "", "gridcolor": "#DFE8F3", "linecolor": "#A2B1C6" }, "bgcolor": "white" }, "colorway": [ "#636efa", "#EF553B", "#00cc96", "#ab63fa", "#19d3f3", "#e763fa", "#fecb52", "#ffa15a", "#ff6692", "#b6e880" ], "hovermode": "closest", "colorscale": { "diverging": [ [ 0, "#8e0152" ], [ 0.1, "#c51b7d" ], [ 0.2, "#de77ae" ], [ 0.3, "#f1b6da" ], [ 0.4, "#fde0ef" ], [ 0.5, "#f7f7f7" ], [ 0.6, "#e6f5d0" ], [ 0.7, "#b8e186" ], [ 0.8, "#7fbc41" ], [ 0.9, "#4d9221" ], [ 1, "#276419" ] ], "sequential": [ [ 0, "#0508b8" ], [ 0.0893854748603352, "#1910d8" ], [ 0.1787709497206704, "#3c19f0" ], [ 0.2681564245810056, "#6b1cfb" ], [ 0.3575418994413408, "#981cfd" ], [ 0.44692737430167595, "#bf1cfd" ], [ 0.5363128491620112, "#dd2bfd" ], [ 0.6256983240223464, "#f246fe" ], [ 0.7150837988826816, "#fc67fd" ], [ 0.8044692737430168, "#fe88fc" ], [ 0.8938547486033519, "#fea5fd" ], [ 0.9832402234636871, "#febefe" ], [ 1, "#fec3fe" ] ], "sequentialminus": [ [ 0, "#0508b8" ], [ 0.0893854748603352, "#1910d8" ], [ 0.1787709497206704, "#3c19f0" ], [ 0.2681564245810056, "#6b1cfb" ], [ 0.3575418994413408, "#981cfd" ], [ 0.44692737430167595, "#bf1cfd" ], [ 0.5363128491620112, "#dd2bfd" ], [ 0.6256983240223464, "#f246fe" ], [ 0.7150837988826816, "#fc67fd" ], [ 0.8044692737430168, "#fe88fc" ], [ 0.8938547486033519, "#fea5fd" ], [ 0.9832402234636871, "#febefe" ], [ 1, "#fec3fe" ] ] }, "plot_bgcolor": "white", "paper_bgcolor": "white", "shapedefaults": { "line": { "width": 0 }, "opacity": 0.4, "fillcolor": "#506784" }, "annotationdefaults": { "arrowhead": 0, "arrowcolor": "#506784", "arrowwidth": 1 } }, "themeRef": "PLOTLY_WHITE" } } }, "height": null, "width": null, "user": { "profile_url": "https://chart-studio.plotly.com/~sindhu0908", "avatar_url": "https://storage.googleapis.com/plotly-prod-profiles/46.jpg", "background_url": "https://storage.googleapis.com/plotly-prod-profiles/bg-11.jpg", "bio": "", "nickname": "", "website": "", "stream_tokens": null, "feature_set_id": null, "csrf_token": null, "date_joined": "2025-06-17 16:37:46", "mapbox_access_tokens": null, "has_password": null, "username": "sindhu0908", "email": null, "is_active": null, "readonly": null, "is_dash_creator": null, "dash_created_count": null, "is_chart_creator": null, "charts_created_count": null } }, { "creation_time": "2025-06-17T16:50:35.103997Z", "comments": { "results": [], "count": 0 }, "parented": true, "embed_url": "https://chart-studio.plotly.com/~Sereneee/5.embed", "fid": "Sereneee:5", "filename": "Plot 5", "filetype": "plot", "img_url": "https://api.plotly.com/v2/files/Sereneee:5/image?image_name=list-thumb", "image_urls": { "default": "https://api.plotly.com/v2/files/Sereneee:5/image?image_name=default", "block-thumb": "https://storage.googleapis.com/plotly-prod-images/Sereneee/5/8_YXAV4YRILUMFY42HLRJZWQA2MSIMO1.png", "list-thumb": "https://api.plotly.com/v2/files/Sereneee:5/image?image_name=list-thumb" }, "api_urls": { "files": "https://api.plotly.com/v2/files/Sereneee:5", "plots": "https://api.plotly.com/v2/plots/Sereneee:5", "parent": "https://api.plotly.com/v2/folders/home?user=Sereneee" }, "owner": "Sereneee", "parent": -1, "preview": "", "referencers": [], "references": [], "title": "", "views": 0, "web_url": "https://chart-studio.plotly.com/~Sereneee/5/", "world_readable": true, "date_modified": "2025-06-17T16:50:44.173Z", "stars": { "results": [], "count": 0 }, "collaborators": { "results": [], "count": 0 }, "subfolder_count": null, "refresh_interval": null, "organize_view_url": "https://chart-studio.plotly.com/~Sereneee/5/", "current_user_permission": "read", "is_theme": null, "is_template": false, "autosize": true, "caption": "", "figure": { "data": [ { "meta": { "columnNames": { "x": "A", "y": "B", "text": "B" } }, "mode": "markers", "type": "bar", "xsrc": "Sereneee:4:155960", "ysrc": "Sereneee:4:1736ca", "textsrc": "Sereneee:4:1736ca", "textfont": { "family": "Times New Roman" }, "hoverinfo": "x+y+text", "orientation": "v", "textposition": "inside" } ], "frames": [], "layout": { "title": { "x": 0.3, "font": { "size": 16, "family": "Times New Roman" }, "text": "<b>Degradation Rate of MB vs. Initial Concentration (H₂O₂ Only)</b>" }, "xaxis": { "type": "linear", "range": [ 2.5, 27.5 ], "title": { "font": { "family": "Times New Roman" }, "text": "<b>Initial Concentration / mgL</b><sup><b>-1</b></sup>" }, "autorange": true }, "yaxis": { "range": [ 0, 5.189473684210526 ], "title": { "font": { "family": "Times New Roman" }, "text": "<b>Removal Rate of MB / %min</b><sup><b>-1</b></sup>" }, "autorange": true }, "autosize": true, "template": { "data": { "bar": [ { "type": "bar", "marker": { "colorbar": { "ticks": "", "outlinewidth": 0 } } } ], "table": [ { "type": "table", "cells": { "fill": { "color": "#EBF0F8" }, "line": { "color": "white" } }, "header": { "fill": { "color": "#C8D4E3" }, "line": { "color": "white" } } } ], "carpet": [ { "type": "carpet", "aaxis": { "gridcolor": "#C8D4E3", "linecolor": "#C8D4E3", "endlinecolor": "#2a3f5f", "minorgridcolor": "#C8D4E3", "startlinecolor": "#2a3f5f" }, "baxis": { "gridcolor": "#C8D4E3", "linecolor": "#C8D4E3", "endlinecolor": "#2a3f5f", "minorgridcolor": "#C8D4E3", "startlinecolor": "#2a3f5f" } } ], "mesh3d": [ { "type": "mesh3d", "colorbar": { "ticks": "", "outlinewidth": 0 } } ], "contour": [ { "type": "contour", "colorbar": { "ticks": "", "outlinewidth": 0 }, "autocolorscale": true } ], "heatmap": [ { "type": "heatmap", "colorbar": { "ticks": "", "outlinewidth": 0 }, "autocolorscale": true } ], "scatter": [ { "type": "scatter", "marker": { "colorbar": { "ticks": "", "outlinewidth": 0 } } } ], "surface": [ { "type": "surface", "colorbar": { "ticks": "", "outlinewidth": 0 } } ], "heatmapgl": [ { "type": "heatmapgl", "colorbar": { "ticks": "", "outlinewidth": 0 } } ], "histogram": [ { "type": "histogram", "marker": { "colorbar": { "ticks": "", "outlinewidth": 0 } } } ], "parcoords": [ { "line": { "colorbar": { "ticks": "", "outlinewidth": 0 } }, "type": "parcoords" } ], "scatter3d": [ { "type": "scatter3d", "marker": { "colorbar": { "ticks": "", "outlinewidth": 0 } } } ], "scattergl": [ { "type": "scattergl", "marker": { "colorbar": { "ticks": "", "outlinewidth": 0 } } } ], "choropleth": [ { "type": "choropleth", "colorbar": { "ticks": "", "outlinewidth": 0 } } ], "scattergeo": [ { "type": "scattergeo", "marker": { "colorbar": { "ticks": "", "outlinewidth": 0 } } } ], "histogram2d": [ { "type": "histogram2d", "colorbar": { "ticks": "", "outlinewidth": 0 }, "autocolorscale": true } ], "scatterpolar": [ { "type": "scatterpolar", "marker": { "colorbar": { "ticks": "", "outlinewidth": 0 } } } ], "contourcarpet": [ { "type": "contourcarpet", "colorbar": { "ticks": "", "outlinewidth": 0 } } ], "scattercarpet": [ { "type": "scattercarpet", "marker": { "colorbar": { "ticks": "", "outlinewidth": 0 } } } ], "scattermapbox": [ { "type": "scattermapbox", "marker": { "colorbar": { "ticks": "", "outlinewidth": 0 } } } ], "scatterpolargl": [ { "type": "scatterpolargl", "marker": { "colorbar": { "ticks": "", "outlinewidth": 0 } } } ], "scatterternary": [ { "type": "scatterternary", "marker": { "colorbar": { "ticks": "", "outlinewidth": 0 } } } ], "histogram2dcontour": [ { "type": "histogram2dcontour", "colorbar": { "ticks": "", "outlinewidth": 0 }, "autocolorscale": true } ] }, "layout": { "geo": { "bgcolor": "white", "showland": true, "lakecolor": "white", "landcolor": "white", "showlakes": true, "subunitcolor": "#C8D4E3" }, "font": { "color": "#2a3f5f" }, "polar": { "bgcolor": "white", "radialaxis": { "ticks": "", "gridcolor": "#EBF0F8", "linecolor": "#EBF0F8" }, "angularaxis": { "ticks": "", "gridcolor": "#EBF0F8", "linecolor": "#EBF0F8" } }, "scene": { "xaxis": { "ticks": "", "gridcolor": "#DFE8F3", "gridwidth": 2, "linecolor": "#EBF0F8", "zerolinecolor": "#EBF0F8", "showbackground": true, "backgroundcolor": "white" }, "yaxis": { "ticks": "", "gridcolor": "#DFE8F3", "gridwidth": 2, "linecolor": "#EBF0F8", "zerolinecolor": "#EBF0F8", "showbackground": true, "backgroundcolor": "white" }, "zaxis": { "ticks": "", "gridcolor": "#DFE8F3", "gridwidth": 2, "linecolor": "#EBF0F8", "zerolinecolor": "#EBF0F8", "showbackground": true, "backgroundcolor": "white" } }, "title": { "x": 0.05 }, "xaxis": { "ticks": "", "gridcolor": "#EBF0F8", "linecolor": "#EBF0F8", "automargin": true, "zerolinecolor": "#EBF0F8", "zerolinewidth": 2 }, "yaxis": { "ticks": "", "gridcolor": "#EBF0F8", "linecolor": "#EBF0F8", "automargin": true, "zerolinecolor": "#EBF0F8", "zerolinewidth": 2 }, "ternary": { "aaxis": { "ticks": "", "gridcolor": "#DFE8F3", "linecolor": "#A2B1C6" }, "baxis": { "ticks": "", "gridcolor": "#DFE8F3", "linecolor": "#A2B1C6" }, "caxis": { "ticks": "", "gridcolor": "#DFE8F3", "linecolor": "#A2B1C6" }, "bgcolor": "white" }, "colorway": [ "#636efa", "#EF553B", "#00cc96", "#ab63fa", "#19d3f3", "#e763fa", "#fecb52", "#ffa15a", "#ff6692", "#b6e880" ], "hovermode": "closest", "colorscale": { "diverging": [ [ 0, "#8e0152" ], [ 0.1, "#c51b7d" ], [ 0.2, "#de77ae" ], [ 0.3, "#f1b6da" ], [ 0.4, "#fde0ef" ], [ 0.5, "#f7f7f7" ], [ 0.6, "#e6f5d0" ], [ 0.7, "#b8e186" ], [ 0.8, "#7fbc41" ], [ 0.9, "#4d9221" ], [ 1, "#276419" ] ], "sequential": [ [ 0, "#0508b8" ], [ 0.0893854748603352, "#1910d8" ], [ 0.1787709497206704, "#3c19f0" ], [ 0.2681564245810056, "#6b1cfb" ], [ 0.3575418994413408, "#981cfd" ], [ 0.44692737430167595, "#bf1cfd" ], [ 0.5363128491620112, "#dd2bfd" ], [ 0.6256983240223464, "#f246fe" ], [ 0.7150837988826816, "#fc67fd" ], [ 0.8044692737430168, "#fe88fc" ], [ 0.8938547486033519, "#fea5fd" ], [ 0.9832402234636871, "#febefe" ], [ 1, "#fec3fe" ] ], "sequentialminus": [ [ 0, "#0508b8" ], [ 0.0893854748603352, "#1910d8" ], [ 0.1787709497206704, "#3c19f0" ], [ 0.2681564245810056, "#6b1cfb" ], [ 0.3575418994413408, "#981cfd" ], [ 0.44692737430167595, "#bf1cfd" ], [ 0.5363128491620112, "#dd2bfd" ], [ 0.6256983240223464, "#f246fe" ], [ 0.7150837988826816, "#fc67fd" ], [ 0.8044692737430168, "#fe88fc" ], [ 0.8938547486033519, "#fea5fd" ], [ 0.9832402234636871, "#febefe" ], [ 1, "#fec3fe" ] ] }, "plot_bgcolor": "white", "paper_bgcolor": "white", "shapedefaults": { "line": { "width": 0 }, "opacity": 0.4, "fillcolor": "#506784" }, "annotationdefaults": { "arrowhead": 0, "arrowcolor": "#506784", "arrowwidth": 1 } }, "themeRef": "PLOTLY_WHITE" } } }, "height": null, "width": null, "user": { "profile_url": "https://chart-studio.plotly.com/~Sereneee", "avatar_url": "https://storage.googleapis.com/plotly-prod-profiles/69.jpg", "background_url": "https://storage.googleapis.com/plotly-prod-profiles/bg-4.jpg", "bio": "", "nickname": "", "website": "", "stream_tokens": null, "feature_set_id": null, "csrf_token": null, "date_joined": "2025-05-01 04:11:39", "mapbox_access_tokens": null, "has_password": null, "username": "Sereneee", "email": null, "is_active": null, "readonly": null, "is_dash_creator": null, "dash_created_count": null, "is_chart_creator": null, "charts_created_count": null } }, { "creation_time": "2025-06-17T16:44:20.864759Z", "comments": { "results": [], "count": 0 }, "parented": true, "embed_url": "https://chart-studio.plotly.com/~RaviD/18.embed", "fid": "RaviD:18", "filename": "Change in Weight of Bags over Time Graph Showing", "filetype": "plot", "img_url": "https://api.plotly.com/v2/files/RaviD:18/image?image_name=list-thumb", "image_urls": { "default": "https://api.plotly.com/v2/files/RaviD:18/image?image_name=default", "block-thumb": "https://storage.googleapis.com/plotly-prod-images/RaviD/18/8_QQVSRRSGWOX72Q8R7GR5R9MQORF4IB.png", "list-thumb": "https://api.plotly.com/v2/files/RaviD:18/image?image_name=list-thumb" }, "api_urls": { "files": "https://api.plotly.com/v2/files/RaviD:18", "plots": "https://api.plotly.com/v2/plots/RaviD:18", "parent": "https://api.plotly.com/v2/folders/home?user=RaviD" }, "owner": "RaviD", "parent": -1, "preview": "", "referencers": [], "references": [], "title": "", "views": 0, "web_url": "https://chart-studio.plotly.com/~RaviD/18/", "world_readable": true, "date_modified": "2025-06-17T16:44:20.875Z", "stars": { "results": [], "count": 0 }, "collaborators": { "results": [], "count": 0 }, "subfolder_count": null, "refresh_interval": null, "organize_view_url": "https://chart-studio.plotly.com/~RaviD/18/", "current_user_permission": "read", "is_theme": null, "is_template": false, "autosize": true, "caption": "", "figure": { "data": [ { "uid": "410fcc", "meta": { "columnNames": { "x": "A", "y": "B" } }, "mode": "markers", "name": "Bag A", "type": "scatter", "xsrc": "RaviD:17:2f86e1", "ysrc": "RaviD:17:3750c3" }, { "uid": "969c56", "meta": { "columnNames": { "x": "A", "y": "C" } }, "mode": "markers", "name": "Bag B", "type": "scatter", "xsrc": "RaviD:17:2f86e1", "ysrc": "RaviD:17:991510", "stackgroup": null }, { "uid": "7f3551", "meta": { "columnNames": { "x": "A", "y": "D" } }, "mode": "markers", "name": "Bag C", "type": "scatter", "xsrc": "RaviD:17:2f86e1", "ysrc": "RaviD:17:a785aa", "stackgroup": null }, { "uid": "cc4133", "meta": { "columnNames": { "x": "A", "y": "E" } }, "mode": "markers", "name": "Bag D", "type": "scatter", "xsrc": "RaviD:17:2f86e1", "ysrc": "RaviD:17:575e2e", "stackgroup": null }, { "uid": "c4d39f", "transforms": [ { "rms": "", "type": "fit", "inputUid": "410fcc", "regressor": "x", "parameters": [ { "hold": false, "name": "m", "error": 0.0024178334035575887, "value": -0.0705 }, { "hold": false, "name": "b", "error": 0.08717622312051686, "value": -0.14214285714285735 } ], "regressand": "y", "correlation": "", "fitfunction": "m*x + b", "inputxrange": [], "outputxrange": [], "interpolation": 50 } ] }, { "uid": "2f552e", "transforms": [ { "rms": "", "type": "fit", "inputUid": "7f3551", "regressor": "x", "parameters": [ { "hold": false, "name": "m", "error": 0.0004862916736254174, "value": 0.010249999999999182 }, { "hold": false, "name": "b", "error": 0.01753349564086798, "value": -0.0189285714285359 } ], "regressand": "y", "correlation": "", "fitfunction": "m*x + b", "inputxrange": [], "outputxrange": [], "interpolation": 50 } ] }, { "uid": "c391e8", "transforms": [ { "rms": "", "type": "fit", "inputUid": "969c56", "regressor": "x", "parameters": [ { "hold": false, "name": "m", "error": 0.000427379294332996, "value": 0.0007857142857142861 }, { "hold": false, "name": "b", "error": 0.015409379597890556, "value": 0.017857142857142842 } ], "regressand": "y", "correlation": "", "fitfunction": "m*x + b", "inputxrange": [], "outputxrange": [], "interpolation": 50 } ] }, { "uid": "4f157e", "transforms": [ { "rms": "", "type": "fit", "inputUid": "cc4133", "regressor": "x", "parameters": [ { "hold": false, "name": "m", "error": 0.0046515029390347285, "value": 0.04589285714285635 }, { "hold": false, "name": "b", "error": 0.16771232354656365, "value": 0.3403571428571769 } ], "regressand": "y", "correlation": "", "fitfunction": "m*x + b", "inputxrange": [], "outputxrange": [], "interpolation": 50 } ] } ], "frames": [], "layout": { "title": { "text": "Plot Showing the Change in Weight of Dialysis Bags over Time" }, "xaxis": { "type": "linear", "range": [ -3.91123439667129, 63.91123439667129 ], "title": { "text": "Time (s)" }, "autorange": true }, "yaxis": { "type": "linear", "range": [ -4.786924603174607, 3.508710317460306 ], "title": { "text": "Change in Weight (g)" }, "autorange": true }, "autosize": true, "template": { "data": { "bar": [ { "type": "bar", "marker": { "colorbar": { "ticks": "", "outlinewidth": 0 } } } ], "table": [ { "type": "table", "cells": { "fill": { "color": "#EBF0F8" }, "line": { "color": "white" } }, "header": { "fill": { "color": "#C8D4E3" }, "line": { "color": "white" } } } ], "carpet": [ { "type": "carpet", "aaxis": { "gridcolor": "#C8D4E3", "linecolor": "#C8D4E3", "endlinecolor": "#2a3f5f", "minorgridcolor": "#C8D4E3", "startlinecolor": "#2a3f5f" }, "baxis": { "gridcolor": "#C8D4E3", "linecolor": "#C8D4E3", "endlinecolor": "#2a3f5f", "minorgridcolor": "#C8D4E3", "startlinecolor": "#2a3f5f" } } ], "mesh3d": [ { "type": "mesh3d", "colorbar": { "ticks": "", "outlinewidth": 0 } } ], "contour": [ { "type": "contour", "colorbar": { "ticks": "", "outlinewidth": 0 }, "autocolorscale": true } ], "heatmap": [ { "type": "heatmap", "colorbar": { "ticks": "", "outlinewidth": 0 }, "autocolorscale": true } ], "scatter": [ { "type": "scatter", "marker": { "colorbar": { "ticks": "", "outlinewidth": 0 } } } ], "surface": [ { "type": "surface", "colorbar": { "ticks": "", "outlinewidth": 0 } } ], "heatmapgl": [ { "type": "heatmapgl", "colorbar": { "ticks": "", "outlinewidth": 0 } } ], "histogram": [ { "type": "histogram", "marker": { "colorbar": { "ticks": "", "outlinewidth": 0 } } } ], "parcoords": [ { "line": { "colorbar": { "ticks": "", "outlinewidth": 0 } }, "type": "parcoords" } ], "scatter3d": [ { "type": "scatter3d", "marker": { "colorbar": { "ticks": "", "outlinewidth": 0 } } } ], "scattergl": [ { "type": "scattergl", "marker": { "colorbar": { "ticks": "", "outlinewidth": 0 } } } ], "choropleth": [ { "type": "choropleth", "colorbar": { "ticks": "", "outlinewidth": 0 } } ], "scattergeo": [ { "type": "scattergeo", "marker": { "colorbar": { "ticks": "", "outlinewidth": 0 } } } ], "histogram2d": [ { "type": "histogram2d", "colorbar": { "ticks": "", "outlinewidth": 0 }, "autocolorscale": true } ], "scatterpolar": [ { "type": "scatterpolar", "marker": { "colorbar": { "ticks": "", "outlinewidth": 0 } } } ], "contourcarpet": [ { "type": "contourcarpet", "colorbar": { "ticks": "", "outlinewidth": 0 } } ], "scattercarpet": [ { "type": "scattercarpet", "marker": { "colorbar": { "ticks": "", "outlinewidth": 0 } } } ], "scattermapbox": [ { "type": "scattermapbox", "marker": { "colorbar": { "ticks": "", "outlinewidth": 0 } } } ], "scatterpolargl": [ { "type": "scatterpolargl", "marker": { "colorbar": { "ticks": "", "outlinewidth": 0 } } } ], "scatterternary": [ { "type": "scatterternary", "marker": { "colorbar": { "ticks": "", "outlinewidth": 0 } } } ], "histogram2dcontour": [ { "type": "histogram2dcontour", "colorbar": { "ticks": "", "outlinewidth": 0 }, "autocolorscale": true } ] }, "layout": { "geo": { "bgcolor": "white", "showland": true, "lakecolor": "white", "landcolor": "white", "showlakes": true, "subunitcolor": "#C8D4E3" }, "font": { "color": "#2a3f5f" }, "polar": { "bgcolor": "white", "radialaxis": { "ticks": "", "gridcolor": "#EBF0F8", "linecolor": "#EBF0F8" }, "angularaxis": { "ticks": "", "gridcolor": "#EBF0F8", "linecolor": "#EBF0F8" } }, "scene": { "xaxis": { "ticks": "", "gridcolor": "#DFE8F3", "gridwidth": 2, "linecolor": "#EBF0F8", "zerolinecolor": "#EBF0F8", "showbackground": true, "backgroundcolor": "white" }, "yaxis": { "ticks": "", "gridcolor": "#DFE8F3", "gridwidth": 2, "linecolor": "#EBF0F8", "zerolinecolor": "#EBF0F8", "showbackground": true, "backgroundcolor": "white" }, "zaxis": { "ticks": "", "gridcolor": "#DFE8F3", "gridwidth": 2, "linecolor": "#EBF0F8", "zerolinecolor": "#EBF0F8", "showbackground": true, "backgroundcolor": "white" } }, "title": { "x": 0.05 }, "xaxis": { "ticks": "", "gridcolor": "#EBF0F8", "linecolor": "#EBF0F8", "automargin": true, "zerolinecolor": "#EBF0F8", "zerolinewidth": 2 }, "yaxis": { "ticks": "", "gridcolor": "#EBF0F8", "linecolor": "#EBF0F8", "automargin": true, "zerolinecolor": "#EBF0F8", "zerolinewidth": 2 }, "ternary": { "aaxis": { "ticks": "", "gridcolor": "#DFE8F3", "linecolor": "#A2B1C6" }, "baxis": { "ticks": "", "gridcolor": "#DFE8F3", "linecolor": "#A2B1C6" }, "caxis": { "ticks": "", "gridcolor": "#DFE8F3", "linecolor": "#A2B1C6" }, "bgcolor": "white" }, "colorway": [ "#636efa", "#EF553B", "#00cc96", "#ab63fa", "#19d3f3", "#e763fa", "#fecb52", "#ffa15a", "#ff6692", "#b6e880" ], "hovermode": "closest", "colorscale": { "diverging": [ [ 0, "#8e0152" ], [ 0.1, "#c51b7d" ], [ 0.2, "#de77ae" ], [ 0.3, "#f1b6da" ], [ 0.4, "#fde0ef" ], [ 0.5, "#f7f7f7" ], [ 0.6, "#e6f5d0" ], [ 0.7, "#b8e186" ], [ 0.8, "#7fbc41" ], [ 0.9, "#4d9221" ], [ 1, "#276419" ] ], "sequential": [ [ 0, "#0508b8" ], [ 0.0893854748603352, "#1910d8" ], [ 0.1787709497206704, "#3c19f0" ], [ 0.2681564245810056, "#6b1cfb" ], [ 0.3575418994413408, "#981cfd" ], [ 0.44692737430167595, "#bf1cfd" ], [ 0.5363128491620112, "#dd2bfd" ], [ 0.6256983240223464, "#f246fe" ], [ 0.7150837988826816, "#fc67fd" ], [ 0.8044692737430168, "#fe88fc" ], [ 0.8938547486033519, "#fea5fd" ], [ 0.9832402234636871, "#febefe" ], [ 1, "#fec3fe" ] ], "sequentialminus": [ [ 0, "#0508b8" ], [ 0.0893854748603352, "#1910d8" ], [ 0.1787709497206704, "#3c19f0" ], [ 0.2681564245810056, "#6b1cfb" ], [ 0.3575418994413408, "#981cfd" ], [ 0.44692737430167595, "#bf1cfd" ], [ 0.5363128491620112, "#dd2bfd" ], [ 0.6256983240223464, "#f246fe" ], [ 0.7150837988826816, "#fc67fd" ], [ 0.8044692737430168, "#fe88fc" ], [ 0.8938547486033519, "#fea5fd" ], [ 0.9832402234636871, "#febefe" ], [ 1, "#fec3fe" ] ] }, "plot_bgcolor": "white", "paper_bgcolor": "white", "shapedefaults": { "line": { "width": 0 }, "opacity": 0.4, "fillcolor": "#506784" }, "annotationdefaults": { "arrowhead": 0, "arrowcolor": "#506784", "arrowwidth": 1 } }, "themeRef": "PLOTLY_WHITE" }, "annotations": [ { "x": 33.32594235033258, "y": 1.8894162358749937, "ax": 98, "ay": -12, "text": "y=0.0458x+0.3403" }, { "x": 37.095343680709526, "y": 0.36537474732411185, "ax": 79, "ay": -51, "text": "y=0.0102x+0.0189" }, { "x": 42.86031042128602, "y": 0.019001681744365992, "ax": 51, "ay": 29, "text": "y=0.0008x+0.0179" }, { "x": 34.45471890813994, "y": -2.578796310103728, "ax": 92, "ay": -14, "text": "y=-0.0705x+-0.1421" } ] } }, "height": null, "width": null, "user": { "profile_url": "https://chart-studio.plotly.com/~RaviD", "avatar_url": "https://storage.googleapis.com/plotly-prod-profiles/92.jpg", "background_url": "https://storage.googleapis.com/plotly-prod-profiles/bg-9.jpg", "bio": "", "nickname": "", "website": "", "stream_tokens": null, "feature_set_id": null, "csrf_token": null, "date_joined": "2025-06-10 04:11:18", "mapbox_access_tokens": null, "has_password": null, "username": "RaviD", "email": null, "is_active": null, "readonly": null, "is_dash_creator": null, "dash_created_count": null, "is_chart_creator": null, "charts_created_count": null } }, { "creation_time": "2025-06-17T16:19:27.190410Z", "comments": { "results": [], "count": 0 }, "parented": true, "embed_url": "https://chart-studio.plotly.com/~BJJGKJ/2.embed", "fid": "BJJGKJ:2", "filename": "Plot 2", "filetype": "plot", "img_url": "https://api.plotly.com/v2/files/BJJGKJ:2/image?image_name=list-thumb", "image_urls": { "default": "https://api.plotly.com/v2/files/BJJGKJ:2/image?image_name=default", "block-thumb": "https://api.plotly.com/v2/files/BJJGKJ:2/image?image_name=block-thumb", "list-thumb": "https://api.plotly.com/v2/files/BJJGKJ:2/image?image_name=list-thumb" }, "api_urls": { "files": "https://api.plotly.com/v2/files/BJJGKJ:2", "plots": "https://api.plotly.com/v2/plots/BJJGKJ:2", "parent": "https://api.plotly.com/v2/folders/home?user=BJJGKJ" }, "owner": "BJJGKJ", "parent": -1, "preview": "", "referencers": [], "references": [], "title": "", "views": 0, "web_url": "https://chart-studio.plotly.com/~BJJGKJ/2/", "world_readable": true, "date_modified": "2025-06-17T16:19:27.204Z", "stars": { "results": [], "count": 0 }, "collaborators": { "results": [], "count": 0 }, "subfolder_count": null, "refresh_interval": null, "organize_view_url": "https://chart-studio.plotly.com/~BJJGKJ/2/", "current_user_permission": "read", "is_theme": null, "is_template": false, "autosize": true, "caption": "", "figure": { "data": [ { "box": { "visible": true }, "line": { "color": "rgba(31,119,180,1)", "fillcolor": "rgba(31,119,180,1)" }, "meta": { "columnNames": { "x": "data.1.x", "y": "data.1.y" } }, "name": "Fri", "type": "violin", "xsrc": "BJJGKJ:0:9abece", "ysrc": "BJJGKJ:0:2f61b9", "frame": null, "xaxis": "x", "yaxis": "y", "meanline": { "visible": true } }, { "box": { "visible": true }, "line": { "color": "rgba(255,127,14,1)", "fillcolor": "rgba(255,127,14,1)" }, "meta": { "columnNames": { "x": "data.2.x", "y": "data.2.y" } }, "name": "Sat", "type": "violin", "xsrc": "BJJGKJ:0:89a3c6", "ysrc": "BJJGKJ:0:405d99", "frame": null, "xaxis": "x", "yaxis": "y", "meanline": { "visible": true } }, { "box": { "visible": true }, "line": { "color": "rgba(44,160,44,1)", "fillcolor": "rgba(44,160,44,1)" }, "meta": { "columnNames": { "x": "data.3.x", "y": "data.3.y" } }, "name": "Sun", "type": "violin", "xsrc": "BJJGKJ:0:9345a1", "ysrc": "BJJGKJ:0:89c1ff", "frame": null, "xaxis": "x", "yaxis": "y", "meanline": { "visible": true } }, { "box": { "visible": true }, "line": { "color": "rgba(214,39,40,1)", "fillcolor": "rgba(214,39,40,1)" }, "meta": { "columnNames": { "x": "data.4.x", "y": "data.4.y" } }, "name": "Thur", "type": "violin", "xsrc": "BJJGKJ:0:e8ebf6", "ysrc": "BJJGKJ:0:2664df", "frame": null, "xaxis": "x", "yaxis": "y", "meanline": { "visible": true } } ], "frames": [], "layout": { "xaxis": { "type": "category", "range": [ 0.5, 4.5 ], "title": { "text": "Day" }, "domain": [ 0, 1 ], "autorange": true, "categoryorder": "array", "categoryarraysrc": "RPlotBot:5243:493a01" }, "yaxis": { "type": "linear", "range": [ -8.138018372768045, 62.01801837276804 ], "title": { "text": "Total Bill" }, "domain": [ 0, 1 ], "zeroline": false, "autorange": true }, "margin": { "b": 40, "l": 60, "r": 10, "t": 25 }, "hovermode": "closest", "showlegend": true } }, "height": null, "width": null, "user": { "profile_url": "https://chart-studio.plotly.com/~BJJGKJ", "avatar_url": "https://storage.googleapis.com/plotly-prod-profiles/19.jpg", "background_url": "https://storage.googleapis.com/plotly-prod-profiles/bg-0.jpg", "bio": "", "nickname": "", "website": "", "stream_tokens": null, "feature_set_id": null, "csrf_token": null, "date_joined": "2025-06-17 15:53:17", "mapbox_access_tokens": null, "has_password": null, "username": "BJJGKJ", "email": null, "is_active": null, "readonly": null, "is_dash_creator": null, "dash_created_count": null, "is_chart_creator": null, "charts_created_count": null } }, { "creation_time": "2025-06-17T16:04:31.575842Z", "comments": { "results": [], "count": 0 }, "parented": true, "embed_url": "https://chart-studio.plotly.com/~RaviD/16.embed", "fid": "RaviD:16", "filename": "Substrate Plot", "filetype": "plot", "img_url": "https://api.plotly.com/v2/files/RaviD:16/image?image_name=list-thumb", "image_urls": { "default": "https://api.plotly.com/v2/files/RaviD:16/image?image_name=default", "block-thumb": "https://storage.googleapis.com/plotly-prod-images/RaviD/16/8_PG4W4OEWR7RJXUQU7MO3E5HKYS8T8K.png", "list-thumb": "https://api.plotly.com/v2/files/RaviD:16/image?image_name=list-thumb" }, "api_urls": { "files": "https://api.plotly.com/v2/files/RaviD:16", "plots": "https://api.plotly.com/v2/plots/RaviD:16", "parent": "https://api.plotly.com/v2/folders/home?user=RaviD" }, "owner": "RaviD", "parent": -1, "preview": "", "referencers": [], "references": [], "title": "", "views": 0, "web_url": "https://chart-studio.plotly.com/~RaviD/16/", "world_readable": true, "date_modified": "2025-06-17T16:12:28.469Z", "stars": { "results": [], "count": 0 }, "collaborators": { "results": [], "count": 0 }, "subfolder_count": null, "refresh_interval": null, "organize_view_url": "https://chart-studio.plotly.com/~RaviD/16/", "current_user_permission": "read", "is_theme": null, "is_template": false, "autosize": true, "caption": "", "figure": { "data": [ { "uid": "25eb48", "meta": { "columnNames": { "x": "A", "y": "B" } }, "mode": "markers", "name": ".2x ", "type": "scatter", "xsrc": "RaviD:15:70b322", "ysrc": "RaviD:15:173abd" }, { "uid": "340dce", "meta": { "columnNames": { "x": "A", "y": "C" } }, "mode": "markers", "name": "1x", "type": "scatter", "xsrc": "RaviD:15:70b322", "ysrc": "RaviD:15:f6f3fd", "stackgroup": null }, { "uid": "6deed3", "meta": { "columnNames": { "x": "A", "y": "D" } }, "mode": "markers", "name": "2x", "type": "scatter", "xsrc": "RaviD:15:70b322", "ysrc": "RaviD:15:7e0435", "stackgroup": null }, { "uid": "f32f5b", "meta": { "columnNames": { "x": "A", "y": "E" } }, "mode": "markers", "name": "3x", "type": "scatter", "xsrc": "RaviD:15:70b322", "ysrc": "RaviD:15:bd3a82", "stackgroup": null }, { "uid": "cea4a4", "transforms": [ { "rms": "", "type": "fit", "inputUid": "f32f5b", "regressor": "x", "parameters": [ { "hold": false, "name": "m", "error": 0.00013902221161483707, "value": 0.004318468258590574 }, { "hold": false, "name": "b", "error": 0.016092984475185656, "value": 0.4062719860221218 } ], "regressand": "y", "correlation": "", "fitfunction": "m*x + b", "inputxrange": [], "outputxrange": [], "interpolation": 50 } ] }, { "uid": "6c304a", "transforms": [ { "rms": "", "type": "fit", "inputUid": "6deed3", "regressor": "x", "parameters": [ { "hold": false, "name": "m", "error": 0.00021088986694424655, "value": 0.005995043680838797 }, { "hold": false, "name": "b", "error": 0.0244122670419762, "value": 0.6548619685498188 } ], "regressand": "y", "correlation": "", "fitfunction": "m*x + b", "inputxrange": [], "outputxrange": [], "interpolation": 50 } ] }, { "uid": "a9b9e3", "transforms": [ { "rms": "", "type": "fit", "inputUid": "340dce", "regressor": "x", "parameters": [ { "hold": false, "name": "m", "error": 0.00016828325948968007, "value": 0.006577711124053708 }, { "hold": false, "name": "b", "error": 0.019480195653223856, "value": 0.45713977868374395 } ], "regressand": "y", "correlation": "", "fitfunction": "m*x + b", "inputxrange": [], "outputxrange": [], "interpolation": 50 } ] }, { "uid": "77feb6", "transforms": [ { "rms": "", "type": "fit", "inputUid": "25eb48", "regressor": "x", "parameters": [ { "hold": false, "name": "m", "error": 9.668436558347048e-05, "value": 0.004527903319743742 }, { "hold": false, "name": "b", "error": 0.01119202447043833, "value": 0.26466511357018 } ], "regressand": "y", "correlation": "", "fitfunction": "m*x + b", "inputxrange": [], "outputxrange": [], "interpolation": 50 } ] } ], "frames": [], "layout": { "title": { "text": "Plot Showing the Effect of Susbtrate Concentration on Enzyme Activity" }, "xaxis": { "type": "linear", "range": [ -12.606716733254379, 223.7165183499924 ], "title": { "text": "Time (s)" }, "autorange": true }, "yaxis": { "type": "linear", "range": [ -0.04019000694872581, 1.9535581105947522 ], "title": { "text": "Absorbance (AU)" }, "autorange": true }, "autosize": true, "template": { "data": { "bar": [ { "type": "bar", "marker": { "colorbar": { "ticks": "", "outlinewidth": 0 } } } ], "table": [ { "type": "table", "cells": { "fill": { "color": "#EBF0F8" }, "line": { "color": "white" } }, "header": { "fill": { "color": "#C8D4E3" }, "line": { "color": "white" } } } ], "carpet": [ { "type": "carpet", "aaxis": { "gridcolor": "#C8D4E3", "linecolor": "#C8D4E3", "endlinecolor": "#2a3f5f", "minorgridcolor": "#C8D4E3", "startlinecolor": "#2a3f5f" }, "baxis": { "gridcolor": "#C8D4E3", "linecolor": "#C8D4E3", "endlinecolor": "#2a3f5f", "minorgridcolor": "#C8D4E3", "startlinecolor": "#2a3f5f" } } ], "mesh3d": [ { "type": "mesh3d", "colorbar": { "ticks": "", "outlinewidth": 0 } } ], "contour": [ { "type": "contour", "colorbar": { "ticks": "", "outlinewidth": 0 }, "autocolorscale": true } ], "heatmap": [ { "type": "heatmap", "colorbar": { "ticks": "", "outlinewidth": 0 }, "autocolorscale": true } ], "scatter": [ { "type": "scatter", "marker": { "colorbar": { "ticks": "", "outlinewidth": 0 } } } ], "surface": [ { "type": "surface", "colorbar": { "ticks": "", "outlinewidth": 0 } } ], "heatmapgl": [ { "type": "heatmapgl", "colorbar": { "ticks": "", "outlinewidth": 0 } } ], "histogram": [ { "type": "histogram", "marker": { "colorbar": { "ticks": "", "outlinewidth": 0 } } } ], "parcoords": [ { "line": { "colorbar": { "ticks": "", "outlinewidth": 0 } }, "type": "parcoords" } ], "scatter3d": [ { "type": "scatter3d", "marker": { "colorbar": { "ticks": "", "outlinewidth": 0 } } } ], "scattergl": [ { "type": "scattergl", "marker": { "colorbar": { "ticks": "", "outlinewidth": 0 } } } ], "choropleth": [ { "type": "choropleth", "colorbar": { "ticks": "", "outlinewidth": 0 } } ], "scattergeo": [ { "type": "scattergeo", "marker": { "colorbar": { "ticks": "", "outlinewidth": 0 } } } ], "histogram2d": [ { "type": "histogram2d", "colorbar": { "ticks": "", "outlinewidth": 0 }, "autocolorscale": true } ], "scatterpolar": [ { "type": "scatterpolar", "marker": { "colorbar": { "ticks": "", "outlinewidth": 0 } } } ], "contourcarpet": [ { "type": "contourcarpet", "colorbar": { "ticks": "", "outlinewidth": 0 } } ], "scattercarpet": [ { "type": "scattercarpet", "marker": { "colorbar": { "ticks": "", "outlinewidth": 0 } } } ], "scattermapbox": [ { "type": "scattermapbox", "marker": { "colorbar": { "ticks": "", "outlinewidth": 0 } } } ], "scatterpolargl": [ { "type": "scatterpolargl", "marker": { "colorbar": { "ticks": "", "outlinewidth": 0 } } } ], "scatterternary": [ { "type": "scatterternary", "marker": { "colorbar": { "ticks": "", "outlinewidth": 0 } } } ], "histogram2dcontour": [ { "type": "histogram2dcontour", "colorbar": { "ticks": "", "outlinewidth": 0 }, "autocolorscale": true } ] }, "layout": { "geo": { "bgcolor": "white", "showland": true, "lakecolor": "white", "landcolor": "white", "showlakes": true, "subunitcolor": "#C8D4E3" }, "font": { "color": "#2a3f5f" }, "polar": { "bgcolor": "white", "radialaxis": { "ticks": "", "gridcolor": "#EBF0F8", "linecolor": "#EBF0F8" }, "angularaxis": { "ticks": "", "gridcolor": "#EBF0F8", "linecolor": "#EBF0F8" } }, "scene": { "xaxis": { "ticks": "", "gridcolor": "#DFE8F3", "gridwidth": 2, "linecolor": "#EBF0F8", "zerolinecolor": "#EBF0F8", "showbackground": true, "backgroundcolor": "white" }, "yaxis": { "ticks": "", "gridcolor": "#DFE8F3", "gridwidth": 2, "linecolor": "#EBF0F8", "zerolinecolor": "#EBF0F8", "showbackground": true, "backgroundcolor": "white" }, "zaxis": { "ticks": "", "gridcolor": "#DFE8F3", "gridwidth": 2, "linecolor": "#EBF0F8", "zerolinecolor": "#EBF0F8", "showbackground": true, "backgroundcolor": "white" } }, "title": { "x": 0.05 }, "xaxis": { "ticks": "", "gridcolor": "#EBF0F8", "linecolor": "#EBF0F8", "automargin": true, "zerolinecolor": "#EBF0F8", "zerolinewidth": 2 }, "yaxis": { "ticks": "", "gridcolor": "#EBF0F8", "linecolor": "#EBF0F8", "automargin": true, "zerolinecolor": "#EBF0F8", "zerolinewidth": 2 }, "ternary": { "aaxis": { "ticks": "", "gridcolor": "#DFE8F3", "linecolor": "#A2B1C6" }, "baxis": { "ticks": "", "gridcolor": "#DFE8F3", "linecolor": "#A2B1C6" }, "caxis": { "ticks": "", "gridcolor": "#DFE8F3", "linecolor": "#A2B1C6" }, "bgcolor": "white" }, "colorway": [ "#636efa", "#EF553B", "#00cc96", "#ab63fa", "#19d3f3", "#e763fa", "#fecb52", "#ffa15a", "#ff6692", "#b6e880" ], "hovermode": "closest", "colorscale": { "diverging": [ [ 0, "#8e0152" ], [ 0.1, "#c51b7d" ], [ 0.2, "#de77ae" ], [ 0.3, "#f1b6da" ], [ 0.4, "#fde0ef" ], [ 0.5, "#f7f7f7" ], [ 0.6, "#e6f5d0" ], [ 0.7, "#b8e186" ], [ 0.8, "#7fbc41" ], [ 0.9, "#4d9221" ], [ 1, "#276419" ] ], "sequential": [ [ 0, "#0508b8" ], [ 0.0893854748603352, "#1910d8" ], [ 0.1787709497206704, "#3c19f0" ], [ 0.2681564245810056, "#6b1cfb" ], [ 0.3575418994413408, "#981cfd" ], [ 0.44692737430167595, "#bf1cfd" ], [ 0.5363128491620112, "#dd2bfd" ], [ 0.6256983240223464, "#f246fe" ], [ 0.7150837988826816, "#fc67fd" ], [ 0.8044692737430168, "#fe88fc" ], [ 0.8938547486033519, "#fea5fd" ], [ 0.9832402234636871, "#febefe" ], [ 1, "#fec3fe" ] ], "sequentialminus": [ [ 0, "#0508b8" ], [ 0.0893854748603352, "#1910d8" ], [ 0.1787709497206704, "#3c19f0" ], [ 0.2681564245810056, "#6b1cfb" ], [ 0.3575418994413408, "#981cfd" ], [ 0.44692737430167595, "#bf1cfd" ], [ 0.5363128491620112, "#dd2bfd" ], [ 0.6256983240223464, "#f246fe" ], [ 0.7150837988826816, "#fc67fd" ], [ 0.8044692737430168, "#fe88fc" ], [ 0.8938547486033519, "#fea5fd" ], [ 0.9832402234636871, "#febefe" ], [ 1, "#fec3fe" ] ] }, "plot_bgcolor": "white", "paper_bgcolor": "white", "shapedefaults": { "line": { "width": 0 }, "opacity": 0.4, "fillcolor": "#506784" }, "annotationdefaults": { "arrowhead": 0, "arrowcolor": "#506784", "arrowwidth": 1 } }, "themeRef": "PLOTLY_WHITE" }, "annotations": [ { "x": 131.8083357953182, "y": 0.9718205341869723, "ax": 372, "ay": -1, "text": "y=0.00432x+0.40627" }, { "x": 150.98546526617523, "y": 1.559942888592774, "ax": 283, "ay": -1, "text": "y=0.006x+0.65486" }, { "x": 141.69385338835198, "y": 1.3890406670120405, "ax": 328, "ay": 0, "text": "y=0.00658x+0.45714" }, { "x": 109.033342716374, "y": 0.7567757957562793, "ax": 481, "ay": 2, "text": "y=0.00453x+0.264667" } ] } }, "height": null, "width": null, "user": { "profile_url": "https://chart-studio.plotly.com/~RaviD", "avatar_url": "https://storage.googleapis.com/plotly-prod-profiles/92.jpg", "background_url": "https://storage.googleapis.com/plotly-prod-profiles/bg-9.jpg", "bio": "", "nickname": "", "website": "", "stream_tokens": null, "feature_set_id": null, "csrf_token": null, "date_joined": "2025-06-10 04:11:18", "mapbox_access_tokens": null, "has_password": null, "username": "RaviD", "email": null, "is_active": null, "readonly": null, "is_dash_creator": null, "dash_created_count": null, "is_chart_creator": null, "charts_created_count": null } }, { "creation_time": "2025-06-17T15:56:35.436805Z", "comments": { "results": [], "count": 0 }, "parented": true, "embed_url": "https://chart-studio.plotly.com/~mrtnrey/44.embed", "fid": "mrtnrey:44", "filename": "Plot 44", "filetype": "plot", "img_url": "https://api.plotly.com/v2/files/mrtnrey:44/image?image_name=list-thumb", "image_urls": { "default": "https://api.plotly.com/v2/files/mrtnrey:44/image?image_name=default", "block-thumb": "https://storage.googleapis.com/plotly-prod-images/mrtnrey/44/8_VEM60P18ACBZPWE0KITV5ZU62SR8K3.png", "list-thumb": "https://api.plotly.com/v2/files/mrtnrey:44/image?image_name=list-thumb" }, "api_urls": { "files": "https://api.plotly.com/v2/files/mrtnrey:44", "plots": "https://api.plotly.com/v2/plots/mrtnrey:44", "parent": "https://api.plotly.com/v2/folders/home?user=mrtnrey" }, "owner": "mrtnrey", "parent": -1, "preview": "", "referencers": [], "references": [], "title": "", "views": 0, "web_url": "https://chart-studio.plotly.com/~mrtnrey/44/", "world_readable": true, "date_modified": "2025-06-17T15:56:35.451Z", "stars": { "results": [], "count": 0 }, "collaborators": { "results": [], "count": 0 }, "subfolder_count": null, "refresh_interval": null, "organize_view_url": "https://chart-studio.plotly.com/~mrtnrey/44/", "current_user_permission": "read", "is_theme": null, "is_template": false, "autosize": true, "caption": "", "figure": { "data": [ { "meta": { "columnNames": { "x": "B", "y": "C" } }, "mode": "markers", "type": "bar", "xsrc": "mrtnrey:43:023d81", "ysrc": "mrtnrey:43:230540", "orientation": "v" } ], "frames": [], "layout": { "xaxis": { "side": "bottom", "type": "linear", "dtick": 10, "range": [ 0, 105 ], "tick0": 0, "title": { "font": { "size": 36 }, "text": "User reputation score" }, "tickfont": { "size": 32 }, "tickmode": "linear", "autorange": true, "automargin": true, "tickformat": "", "tickprefix": "", "showticklabels": true }, "yaxis": { "type": "linear", "range": [ 0, 239189.47368421053 ], "title": { "font": { "size": 36 }, "text": "Number of users per score bin" }, "tickfont": { "size": 28 }, "autorange": true }, "autosize": true, "template": { "data": { "bar": [ { "type": "bar", "marker": { "colorbar": { "ticks": "", "outlinewidth": 0 } } } ], "table": [ { "type": "table", "cells": { "fill": { "color": "#EBF0F8" }, "line": { "color": "white" } }, "header": { "fill": { "color": "#C8D4E3" }, "line": { "color": "white" } } } ], "carpet": [ { "type": "carpet", "aaxis": { "gridcolor": "#C8D4E3", "linecolor": "#C8D4E3", "endlinecolor": "#2a3f5f", "minorgridcolor": "#C8D4E3", "startlinecolor": "#2a3f5f" }, "baxis": { "gridcolor": "#C8D4E3", "linecolor": "#C8D4E3", "endlinecolor": "#2a3f5f", "minorgridcolor": "#C8D4E3", "startlinecolor": "#2a3f5f" } } ], "mesh3d": [ { "type": "mesh3d", "colorbar": { "ticks": "", "outlinewidth": 0 } } ], "contour": [ { "type": "contour", "colorbar": { "ticks": "", "outlinewidth": 0 }, "autocolorscale": true } ], "heatmap": [ { "type": "heatmap", "colorbar": { "ticks": "", "outlinewidth": 0 }, "autocolorscale": true } ], "scatter": [ { "type": "scatter", "marker": { "colorbar": { "ticks": "", "outlinewidth": 0 } } } ], "surface": [ { "type": "surface", "colorbar": { "ticks": "", "outlinewidth": 0 } } ], "heatmapgl": [ { "type": "heatmapgl", "colorbar": { "ticks": "", "outlinewidth": 0 } } ], "histogram": [ { "type": "histogram", "marker": { "colorbar": { "ticks": "", "outlinewidth": 0 } } } ], "parcoords": [ { "line": { "colorbar": { "ticks": "", "outlinewidth": 0 } }, "type": "parcoords" } ], "scatter3d": [ { "type": "scatter3d", "marker": { "colorbar": { "ticks": "", "outlinewidth": 0 } } } ], "scattergl": [ { "type": "scattergl", "marker": { "colorbar": { "ticks": "", "outlinewidth": 0 } } } ], "choropleth": [ { "type": "choropleth", "colorbar": { "ticks": "", "outlinewidth": 0 } } ], "scattergeo": [ { "type": "scattergeo", "marker": { "colorbar": { "ticks": "", "outlinewidth": 0 } } } ], "histogram2d": [ { "type": "histogram2d", "colorbar": { "ticks": "", "outlinewidth": 0 }, "autocolorscale": true } ], "scatterpolar": [ { "type": "scatterpolar", "marker": { "colorbar": { "ticks": "", "outlinewidth": 0 } } } ], "contourcarpet": [ { "type": "contourcarpet", "colorbar": { "ticks": "", "outlinewidth": 0 } } ], "scattercarpet": [ { "type": "scattercarpet", "marker": { "colorbar": { "ticks": "", "outlinewidth": 0 } } } ], "scattermapbox": [ { "type": "scattermapbox", "marker": { "colorbar": { "ticks": "", "outlinewidth": 0 } } } ], "scatterpolargl": [ { "type": "scatterpolargl", "marker": { "colorbar": { "ticks": "", "outlinewidth": 0 } } } ], "scatterternary": [ { "type": "scatterternary", "marker": { "colorbar": { "ticks": "", "outlinewidth": 0 } } } ], "histogram2dcontour": [ { "type": "histogram2dcontour", "colorbar": { "ticks": "", "outlinewidth": 0 }, "autocolorscale": true } ] }, "layout": { "geo": { "bgcolor": "white", "showland": true, "lakecolor": "white", "landcolor": "white", "showlakes": true, "subunitcolor": "#C8D4E3" }, "font": { "color": "#2a3f5f" }, "polar": { "bgcolor": "white", "radialaxis": { "ticks": "", "gridcolor": "#EBF0F8", "linecolor": "#EBF0F8" }, "angularaxis": { "ticks": "", "gridcolor": "#EBF0F8", "linecolor": "#EBF0F8" } }, "scene": { "xaxis": { "ticks": "", "gridcolor": "#DFE8F3", "gridwidth": 2, "linecolor": "#EBF0F8", "zerolinecolor": "#EBF0F8", "showbackground": true, "backgroundcolor": "white" }, "yaxis": { "ticks": "", "gridcolor": "#DFE8F3", "gridwidth": 2, "linecolor": "#EBF0F8", "zerolinecolor": "#EBF0F8", "showbackground": true, "backgroundcolor": "white" }, "zaxis": { "ticks": "", "gridcolor": "#DFE8F3", "gridwidth": 2, "linecolor": "#EBF0F8", "zerolinecolor": "#EBF0F8", "showbackground": true, "backgroundcolor": "white" } }, "title": { "x": 0.05 }, "xaxis": { "ticks": "", "gridcolor": "#EBF0F8", "linecolor": "#EBF0F8", "automargin": true, "zerolinecolor": "#EBF0F8", "zerolinewidth": 2 }, "yaxis": { "ticks": "", "gridcolor": "#EBF0F8", "linecolor": "#EBF0F8", "automargin": true, "zerolinecolor": "#EBF0F8", "zerolinewidth": 2 }, "ternary": { "aaxis": { "ticks": "", "gridcolor": "#DFE8F3", "linecolor": "#A2B1C6" }, "baxis": { "ticks": "", "gridcolor": "#DFE8F3", "linecolor": "#A2B1C6" }, "caxis": { "ticks": "", "gridcolor": "#DFE8F3", "linecolor": "#A2B1C6" }, "bgcolor": "white" }, "colorway": [ "#636efa", "#EF553B", "#00cc96", "#ab63fa", "#19d3f3", "#e763fa", "#fecb52", "#ffa15a", "#ff6692", "#b6e880" ], "hovermode": "closest", "colorscale": { "diverging": [ [ 0, "#8e0152" ], [ 0.1, "#c51b7d" ], [ 0.2, "#de77ae" ], [ 0.3, "#f1b6da" ], [ 0.4, "#fde0ef" ], [ 0.5, "#f7f7f7" ], [ 0.6, "#e6f5d0" ], [ 0.7, "#b8e186" ], [ 0.8, "#7fbc41" ], [ 0.9, "#4d9221" ], [ 1, "#276419" ] ], "sequential": [ [ 0, "#0508b8" ], [ 0.0893854748603352, "#1910d8" ], [ 0.1787709497206704, "#3c19f0" ], [ 0.2681564245810056, "#6b1cfb" ], [ 0.3575418994413408, "#981cfd" ], [ 0.44692737430167595, "#bf1cfd" ], [ 0.5363128491620112, "#dd2bfd" ], [ 0.6256983240223464, "#f246fe" ], [ 0.7150837988826816, "#fc67fd" ], [ 0.8044692737430168, "#fe88fc" ], [ 0.8938547486033519, "#fea5fd" ], [ 0.9832402234636871, "#febefe" ], [ 1, "#fec3fe" ] ], "sequentialminus": [ [ 0, "#0508b8" ], [ 0.0893854748603352, "#1910d8" ], [ 0.1787709497206704, "#3c19f0" ], [ 0.2681564245810056, "#6b1cfb" ], [ 0.3575418994413408, "#981cfd" ], [ 0.44692737430167595, "#bf1cfd" ], [ 0.5363128491620112, "#dd2bfd" ], [ 0.6256983240223464, "#f246fe" ], [ 0.7150837988826816, "#fc67fd" ], [ 0.8044692737430168, "#fe88fc" ], [ 0.8938547486033519, "#fea5fd" ], [ 0.9832402234636871, "#febefe" ], [ 1, "#fec3fe" ] ] }, "plot_bgcolor": "white", "paper_bgcolor": "white", "shapedefaults": { "line": { "width": 0 }, "opacity": 0.4, "fillcolor": "#506784" }, "annotationdefaults": { "arrowhead": 0, "arrowcolor": "#506784", "arrowwidth": 1 } }, "themeRef": "PLOTLY_WHITE" }, "showlegend": false } }, "height": null, "width": null, "user": { "profile_url": "https://chart-studio.plotly.com/~mrtnrey", "avatar_url": "https://storage.googleapis.com/plotly-prod-profiles/23.jpg", "background_url": "https://storage.googleapis.com/plotly-prod-profiles/bg-13.jpg", "bio": "", "nickname": "", "website": "", "stream_tokens": null, "feature_set_id": null, "csrf_token": null, "date_joined": "2020-02-17 15:15:47", "mapbox_access_tokens": null, "has_password": null, "username": "mrtnrey", "email": null, "is_active": null, "readonly": null, "is_dash_creator": null, "dash_created_count": null, "is_chart_creator": null, "charts_created_count": null } } ] }
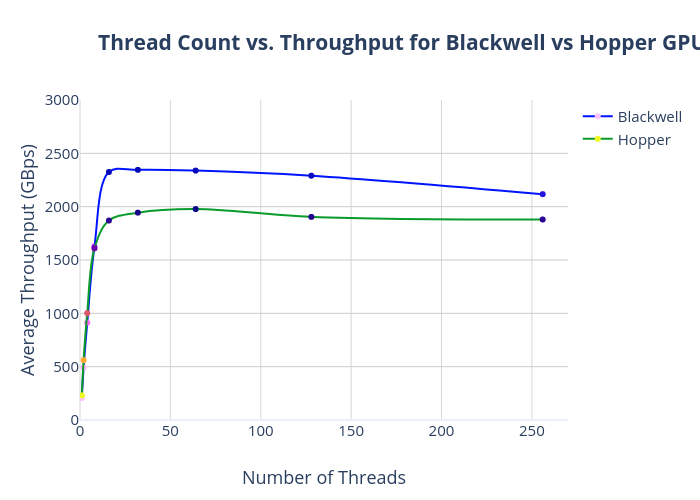