Plots List
Plots
This endpoint handles manipulation of Plotly plot files.
Reference
Authorization
Any user with or without a Plotly account may view public plots. For private plots, see authentication.
Actions
list
Listing all public plots can be done via a GET request to this endpoint.
By default, plots will be listed in order of date created. The order_by
query parameter is accepted at this endpoint. Currently, only ordering by
views is supported. It is possible to filter the plots by quality
with min_quality or max_quality as query parameter.
Example:
// GET https://api.plotly.com/v2/plots/ ---> 200

// GET https://api.plotly.com/v2/plots/?order_by=-views ---> 200

// GET https://api.plotly.com/v2/plots/?min_quality=5 ---> 200

// GET https://api.plotly.com/v2/plots/?max_quality=5 ---> 200
feed
Listing all handpicked feed plots can be done via a GET request to this endpoint. By default, plots will be listed in a random order.
Example:
// GET https://api.plotly.com/v2/plots/feed ---> 200
create
You can create new plot resources here. The only required field is 'figure'. Currently, the figure is restricted to only contain references to grid data. That is, this will fail if raw data arrays are passed in. To create and manipulate underlying grids for plots, see the grids endpoint.
Example:
// This fails because a figure field is required.
// POST https://api.plotly.com/v2/plots ---> 400 Bad Request
{}

// This fails because the figure has raw data
//POST https://api.plotly.com/v2/plots ---> 400 Bad Request
{
    "figure": {"data": [{"y": ['this', 'is', 'raw', 'data']}]}
}

// This succeeds because the figure has src keys, not raw data.
//POST https://api.plotly.com/v2/plots ---> 200 OK
{
    "figure": {"data": [{"ysrc": "sven:88:u8nd62"}]}
}
When creating a grid, you can optionally specify a source_fid to specify where a plot has come from:
- source_fid: the fid of a plot that was copied (and presumably edited) to produce this one
detail
There is a lot of meta information stored about plot files including filename, title, share_url, and content_url to name a few.
This information can only be reached with a GET to this endpoint.
Example:
// GET https://api.plotly.com/v2/plots/iheartgraphs:90
content
The contents of a plot can be downloaded via the content resource. The plot
content contains referenced grid/column data by default. If you wish to
return the raw grid/column data, the inline_data=true query must be included
in the request url. The Content-Type header will be appropriately set for the
response body.
Alternatively, you can set ?map_data=unreadable to append a mapping of
sources to data that belongs to grids which are unreadable for the
requestor. This is useful when you have read access to another users plot,
but that plot contains grid references which you don't have access to.
Examples:
// Returns referenced grid/column data
// GET https://api.plotly.com/v2/plots/iheartgraphs:90/content ---> 200 OK

// Returns full grid/column data
// GET https://api.plotly.com/v2/plots/iheartgraphs:90/content?inline_data=true ---> 200 OK

// Returns full grid/column data when requestor doesn't have permission
// to read the referenced grid.
// GET https://api.plotly.com/v2/plots/iheartgraphs:90/content?map_data=unreadable ---> 200 OK
GET /v2/plots/?cursor=cD0yMDI0LTA0LTIzKzE3JTNBNDglM0EwNi42ODEyOTMlMkIwMCUzQTAw&format=api
{ "next": "https://api.plot.ly/v2/plots/?cursor=cD0yMDI0LTA0LTIzKzE2JTNBMzQlM0ExMy43MzMyOTAlMkIwMCUzQTAw&format=api", "previous": "https://api.plot.ly/v2/plots/?cursor=cj0xJnA9MjAyNC0wNC0yMysxNyUzQTM4JTNBMDUuNDMwMDQ1JTJCMDAlM0EwMA%3D%3D&format=api", "results": [ { "creation_time": "2024-04-23T17:38:05.430045Z", "comments": { "results": [], "count": 0 }, "parented": true, "embed_url": "https://chart-studio.plotly.com/~markfs33/124.embed", "fid": "markfs33:124", "filename": "band heater rotation", "filetype": "plot", "img_url": "https://api.plotly.com/v2/files/markfs33:124/image?image_name=list-thumb", "image_urls": { "default": "https://api.plotly.com/v2/files/markfs33:124/image?image_name=default", "block-thumb": "https://api.plotly.com/v2/files/markfs33:124/image?image_name=block-thumb", "list-thumb": "https://api.plotly.com/v2/files/markfs33:124/image?image_name=list-thumb" }, "api_urls": { "files": "https://api.plotly.com/v2/files/markfs33:124", "plots": "https://api.plotly.com/v2/plots/markfs33:124", "parent": "https://api.plotly.com/v2/folders/home?user=markfs33" }, "owner": "markfs33", "parent": -1, "preview": "", "referencers": [], "references": [], "title": "", "views": 1, "web_url": "https://chart-studio.plotly.com/~markfs33/124/", "world_readable": true, "date_modified": "2024-05-02T23:20:27.611Z", "stars": { "results": [], "count": 0 }, "collaborators": { "results": [], "count": 0 }, "subfolder_count": null, "refresh_interval": null, "organize_view_url": "https://chart-studio.plotly.com/~markfs33/124/", "current_user_permission": "read", "is_theme": null, "is_template": false, "autosize": true, "caption": "", "figure": { "data": [ { "meta": { "columnNames": { "y": "External_Temperature" } }, "mode": "lines", "name": "-90", "type": "scatter", "ysrc": "markfs33:122:9c4649", "visible": "legendonly", "stackgroup": null }, { "meta": { "columnNames": { "y": "External_Temperature" } }, "mode": "lines", "name": "90", "type": "scatter", "ysrc": "markfs33:123:a4761b", "visible": "legendonly", "stackgroup": null }, { "meta": { "columnNames": { "y": "External_Temperature" } }, "mode": "lines", "name": "og", "type": "scatter", "ysrc": "markfs33:121:04c058", "visible": "legendonly", "stackgroup": null }, { "meta": { "columnNames": { "y": "External_Temperature1" } }, "mode": "lines", "name": "Ext1 CW", "type": "scatter", "ysrc": "markfs33:123:5db242", "visible": true, "stackgroup": null }, { "meta": { "columnNames": { "y": "External_Temperature2" } }, "mode": "lines", "name": "Ext2 CW", "type": "scatter", "ysrc": "markfs33:123:cbb6f3", "visible": true, "stackgroup": null }, { "meta": { "columnNames": { "y": "External_Temperature1" } }, "mode": "lines", "name": "Ext1 - og", "type": "scatter", "ysrc": "markfs33:121:9ba709", "visible": true, "stackgroup": null }, { "meta": { "columnNames": { "y": "External_Temperature2" } }, "mode": "lines", "name": "Ext 2 -og", "type": "scatter", "ysrc": "markfs33:121:d4163b", "visible": true, "stackgroup": null }, { "meta": { "columnNames": { "y": "External_Temperature1" } }, "mode": "lines", "name": "Ext1 CCW", "type": "scatter", "ysrc": "markfs33:122:663fb5", "visible": true, "stackgroup": null }, { "meta": { "columnNames": { "y": "External_Temperature2" } }, "mode": "lines", "name": "Ext2 CCW", "type": "scatter", "ysrc": "markfs33:122:7236bf", "visible": true, "stackgroup": null }, { "meta": { "columnNames": { "y": "Heater_PID_Output" } }, "mode": "lines", "name": "%{meta.columnNames.y}", "type": "scatter", "ysrc": "markfs33:121:d715ac", "yaxis": "y2", "stackgroup": null } ], "frames": [], "layout": { "title": { "text": "New Cylinder, 200°C, 160Sec, 90° Comparation" }, "xaxis": { "range": [ 0, 3003.8979475484607 ], "title": { "text": "Time (100ms)" }, "autorange": false }, "yaxis": { "type": "linear", "range": [ 4.967303921568629, 180 ], "title": { "text": "Temperature" }, "autorange": false }, "yaxis2": { "side": "right", "type": "linear", "range": [ -5.555555555555556, 105.55555555555556 ], "title": { "text": "Power %" }, "autorange": true, "overlaying": "y" }, "autosize": true, "template": { "data": { "bar": [ { "type": "bar", "marker": { "colorbar": { "ticks": "", "outlinewidth": 0 } } } ], "table": [ { "type": "table", "cells": { "fill": { "color": "#EBF0F8" }, "line": { "color": "white" } }, "header": { "fill": { "color": "#C8D4E3" }, "line": { "color": "white" } } } ], "carpet": [ { "type": "carpet", "aaxis": { "gridcolor": "#C8D4E3", "linecolor": "#C8D4E3", "endlinecolor": "#2a3f5f", "minorgridcolor": "#C8D4E3", "startlinecolor": "#2a3f5f" }, "baxis": { "gridcolor": "#C8D4E3", "linecolor": "#C8D4E3", "endlinecolor": "#2a3f5f", "minorgridcolor": "#C8D4E3", "startlinecolor": "#2a3f5f" } } ], "mesh3d": [ { "type": "mesh3d", "colorbar": { "ticks": "", "outlinewidth": 0 } } ], "contour": [ { "type": "contour", "colorbar": { "ticks": "", "outlinewidth": 0 }, "autocolorscale": true } ], "heatmap": [ { "type": "heatmap", "colorbar": { "ticks": "", "outlinewidth": 0 }, "autocolorscale": true } ], "scatter": [ { "type": "scatter", "marker": { "colorbar": { "ticks": "", "outlinewidth": 0 } } } ], "surface": [ { "type": "surface", "colorbar": { "ticks": "", "outlinewidth": 0 } } ], "heatmapgl": [ { "type": "heatmapgl", "colorbar": { "ticks": "", "outlinewidth": 0 } } ], "histogram": [ { "type": "histogram", "marker": { "colorbar": { "ticks": "", "outlinewidth": 0 } } } ], "parcoords": [ { "line": { "colorbar": { "ticks": "", "outlinewidth": 0 } }, "type": "parcoords" } ], "scatter3d": [ { "type": "scatter3d", "marker": { "colorbar": { "ticks": "", "outlinewidth": 0 } } } ], "scattergl": [ { "type": "scattergl", "marker": { "colorbar": { "ticks": "", "outlinewidth": 0 } } } ], "choropleth": [ { "type": "choropleth", "colorbar": { "ticks": "", "outlinewidth": 0 } } ], "scattergeo": [ { "type": "scattergeo", "marker": { "colorbar": { "ticks": "", "outlinewidth": 0 } } } ], "histogram2d": [ { "type": "histogram2d", "colorbar": { "ticks": "", "outlinewidth": 0 }, "autocolorscale": true } ], "scatterpolar": [ { "type": "scatterpolar", "marker": { "colorbar": { "ticks": "", "outlinewidth": 0 } } } ], "contourcarpet": [ { "type": "contourcarpet", "colorbar": { "ticks": "", "outlinewidth": 0 } } ], "scattercarpet": [ { "type": "scattercarpet", "marker": { "colorbar": { "ticks": "", "outlinewidth": 0 } } } ], "scattermapbox": [ { "type": "scattermapbox", "marker": { "colorbar": { "ticks": "", "outlinewidth": 0 } } } ], "scatterpolargl": [ { "type": "scatterpolargl", "marker": { "colorbar": { "ticks": "", "outlinewidth": 0 } } } ], "scatterternary": [ { "type": "scatterternary", "marker": { "colorbar": { "ticks": "", "outlinewidth": 0 } } } ], "histogram2dcontour": [ { "type": "histogram2dcontour", "colorbar": { "ticks": "", "outlinewidth": 0 }, "autocolorscale": true } ] }, "layout": { "geo": { "bgcolor": "white", "showland": true, "lakecolor": "white", "landcolor": "white", "showlakes": true, "subunitcolor": "#C8D4E3" }, "font": { "color": "#2a3f5f" }, "polar": { "bgcolor": "white", "radialaxis": { "ticks": "", "gridcolor": "#EBF0F8", "linecolor": "#EBF0F8" }, "angularaxis": { "ticks": "", "gridcolor": "#EBF0F8", "linecolor": "#EBF0F8" } }, "scene": { "xaxis": { "ticks": "", "gridcolor": "#DFE8F3", "gridwidth": 2, "linecolor": "#EBF0F8", "zerolinecolor": "#EBF0F8", "showbackground": true, "backgroundcolor": "white" }, "yaxis": { "ticks": "", "gridcolor": "#DFE8F3", "gridwidth": 2, "linecolor": "#EBF0F8", "zerolinecolor": "#EBF0F8", "showbackground": true, "backgroundcolor": "white" }, "zaxis": { "ticks": "", "gridcolor": "#DFE8F3", "gridwidth": 2, "linecolor": "#EBF0F8", "zerolinecolor": "#EBF0F8", "showbackground": true, "backgroundcolor": "white" } }, "title": { "x": 0.05 }, "xaxis": { "ticks": "", "gridcolor": "#EBF0F8", "linecolor": "#EBF0F8", "automargin": true, "zerolinecolor": "#EBF0F8", "zerolinewidth": 2 }, "yaxis": { "ticks": "", "gridcolor": "#EBF0F8", "linecolor": "#EBF0F8", "automargin": true, "zerolinecolor": "#EBF0F8", "zerolinewidth": 2 }, "ternary": { "aaxis": { "ticks": "", "gridcolor": "#DFE8F3", "linecolor": "#A2B1C6" }, "baxis": { "ticks": "", "gridcolor": "#DFE8F3", "linecolor": "#A2B1C6" }, "caxis": { "ticks": "", "gridcolor": "#DFE8F3", "linecolor": "#A2B1C6" }, "bgcolor": "white" }, "colorway": [ "#636efa", "#EF553B", "#00cc96", "#ab63fa", "#19d3f3", "#e763fa", "#fecb52", "#ffa15a", "#ff6692", "#b6e880" ], "hovermode": "closest", "colorscale": { "diverging": [ [ 0, "#8e0152" ], [ 0.1, "#c51b7d" ], [ 0.2, "#de77ae" ], [ 0.3, "#f1b6da" ], [ 0.4, "#fde0ef" ], [ 0.5, "#f7f7f7" ], [ 0.6, "#e6f5d0" ], [ 0.7, "#b8e186" ], [ 0.8, "#7fbc41" ], [ 0.9, "#4d9221" ], [ 1, "#276419" ] ], "sequential": [ [ 0, "#0508b8" ], [ 0.0893854748603352, "#1910d8" ], [ 0.1787709497206704, "#3c19f0" ], [ 0.2681564245810056, "#6b1cfb" ], [ 0.3575418994413408, "#981cfd" ], [ 0.44692737430167595, "#bf1cfd" ], [ 0.5363128491620112, "#dd2bfd" ], [ 0.6256983240223464, "#f246fe" ], [ 0.7150837988826816, "#fc67fd" ], [ 0.8044692737430168, "#fe88fc" ], [ 0.8938547486033519, "#fea5fd" ], [ 0.9832402234636871, "#febefe" ], [ 1, "#fec3fe" ] ], "sequentialminus": [ [ 0, "#0508b8" ], [ 0.0893854748603352, "#1910d8" ], [ 0.1787709497206704, "#3c19f0" ], [ 0.2681564245810056, "#6b1cfb" ], [ 0.3575418994413408, "#981cfd" ], [ 0.44692737430167595, "#bf1cfd" ], [ 0.5363128491620112, "#dd2bfd" ], [ 0.6256983240223464, "#f246fe" ], [ 0.7150837988826816, "#fc67fd" ], [ 0.8044692737430168, "#fe88fc" ], [ 0.8938547486033519, "#fea5fd" ], [ 0.9832402234636871, "#febefe" ], [ 1, "#fec3fe" ] ] }, "plot_bgcolor": "white", "paper_bgcolor": "white", "shapedefaults": { "line": { "width": 0 }, "opacity": 0.4, "fillcolor": "#506784" }, "annotationdefaults": { "arrowhead": 0, "arrowcolor": "#506784", "arrowwidth": 1 } }, "themeRef": "PLOTLY_WHITE" }, "hovermode": "x" } }, "height": null, "width": null, "user": { "profile_url": "https://chart-studio.plotly.com/~markfs33", "avatar_url": "https://storage.googleapis.com/plotly-prod-profiles/96.jpg", "background_url": "https://storage.googleapis.com/plotly-prod-profiles/bg-7.jpg", "bio": "", "nickname": "", "website": "", "stream_tokens": null, "feature_set_id": null, "csrf_token": null, "date_joined": "2024-02-12 16:55:11", "mapbox_access_tokens": null, "has_password": null, "username": "markfs33", "email": null, "is_active": null, "readonly": null, "is_dash_creator": null, "dash_created_count": null, "is_chart_creator": null, "charts_created_count": null } }, { "creation_time": "2024-04-23T17:32:15.489117Z", "comments": { "results": [], "count": 0 }, "parented": true, "embed_url": "https://chart-studio.plotly.com/~Yohan.asante/1.embed", "fid": "Yohan.asante:1", "filename": "Plot 1", "filetype": "plot", "img_url": "https://storage.googleapis.com/plotly-prod-images/Yohan.asante/1/9_5DOLVOIHEVHRLD9K65BKXZ30Y48PTR.png", "image_urls": { "default": "https://storage.googleapis.com/plotly-prod-images/Yohan.asante/1/2_54WXIZ7HBZWHXDVYUXW3J9YFGF8KXI.png", "block-thumb": "https://storage.googleapis.com/plotly-prod-images/Yohan.asante/1/8_XVZUIM2POOK0ZOIG9IY516MQG85RSE.png", "list-thumb": "https://storage.googleapis.com/plotly-prod-images/Yohan.asante/1/9_5DOLVOIHEVHRLD9K65BKXZ30Y48PTR.png" }, "api_urls": { "files": "https://api.plotly.com/v2/files/Yohan.asante:1", "plots": "https://api.plotly.com/v2/plots/Yohan.asante:1", "parent": "https://api.plotly.com/v2/folders/home?user=Yohan.asante" }, "owner": "Yohan.asante", "parent": -1, "preview": "", "referencers": [], "references": [], "title": "", "views": 1, "web_url": "https://chart-studio.plotly.com/~Yohan.asante/1/", "world_readable": true, "date_modified": "2024-04-23T17:32:15.501Z", "stars": { "results": [], "count": 0 }, "collaborators": { "results": [], "count": 0 }, "subfolder_count": null, "refresh_interval": null, "organize_view_url": "https://chart-studio.plotly.com/~Yohan.asante/1/", "current_user_permission": "read", "is_theme": null, "is_template": false, "autosize": true, "caption": "", "figure": { "data": [ { "meta": { "columnNames": { "x": "A", "y": "B" } }, "mode": "markers", "type": "bar", "xsrc": "Yohan.asante:0:548c48", "ysrc": "Yohan.asante:0:ebb333", "orientation": "v" } ], "frames": [], "layout": { "xaxis": { "type": "linear", "range": [ 631.5, 1098.5 ], "title": { "text": "m/z" }, "autorange": true }, "yaxis": { "type": "linear", "range": [ 0, 9024.21052631579 ], "title": { "text": "[M + zH]" }, "autorange": true }, "autosize": true, "template": { "data": { "bar": [ { "type": "bar", "marker": { "colorbar": { "ticks": "", "outlinewidth": 0 } } } ], "table": [ { "type": "table", "cells": { "fill": { "color": "#EBF0F8" }, "line": { "color": "white" } }, "header": { "fill": { "color": "#C8D4E3" }, "line": { "color": "white" } } } ], "carpet": [ { "type": "carpet", "aaxis": { "gridcolor": "#C8D4E3", "linecolor": "#C8D4E3", "endlinecolor": "#2a3f5f", "minorgridcolor": "#C8D4E3", "startlinecolor": "#2a3f5f" }, "baxis": { "gridcolor": "#C8D4E3", "linecolor": "#C8D4E3", "endlinecolor": "#2a3f5f", "minorgridcolor": "#C8D4E3", "startlinecolor": "#2a3f5f" } } ], "mesh3d": [ { "type": "mesh3d", "colorbar": { "ticks": "", "outlinewidth": 0 } } ], "contour": [ { "type": "contour", "colorbar": { "ticks": "", "outlinewidth": 0 }, "autocolorscale": true } ], "heatmap": [ { "type": "heatmap", "colorbar": { "ticks": "", "outlinewidth": 0 }, "autocolorscale": true } ], "scatter": [ { "type": "scatter", "marker": { "colorbar": { "ticks": "", "outlinewidth": 0 } } } ], "surface": [ { "type": "surface", "colorbar": { "ticks": "", "outlinewidth": 0 } } ], "heatmapgl": [ { "type": "heatmapgl", "colorbar": { "ticks": "", "outlinewidth": 0 } } ], "histogram": [ { "type": "histogram", "marker": { "colorbar": { "ticks": "", "outlinewidth": 0 } } } ], "parcoords": [ { "line": { "colorbar": { "ticks": "", "outlinewidth": 0 } }, "type": "parcoords" } ], "scatter3d": [ { "type": "scatter3d", "marker": { "colorbar": { "ticks": "", "outlinewidth": 0 } } } ], "scattergl": [ { "type": "scattergl", "marker": { "colorbar": { "ticks": "", "outlinewidth": 0 } } } ], "choropleth": [ { "type": "choropleth", "colorbar": { "ticks": "", "outlinewidth": 0 } } ], "scattergeo": [ { "type": "scattergeo", "marker": { "colorbar": { "ticks": "", "outlinewidth": 0 } } } ], "histogram2d": [ { "type": "histogram2d", "colorbar": { "ticks": "", "outlinewidth": 0 }, "autocolorscale": true } ], "scatterpolar": [ { "type": "scatterpolar", "marker": { "colorbar": { "ticks": "", "outlinewidth": 0 } } } ], "contourcarpet": [ { "type": "contourcarpet", "colorbar": { "ticks": "", "outlinewidth": 0 } } ], "scattercarpet": [ { "type": "scattercarpet", "marker": { "colorbar": { "ticks": "", "outlinewidth": 0 } } } ], "scattermapbox": [ { "type": "scattermapbox", "marker": { "colorbar": { "ticks": "", "outlinewidth": 0 } } } ], "scatterpolargl": [ { "type": "scatterpolargl", "marker": { "colorbar": { "ticks": "", "outlinewidth": 0 } } } ], "scatterternary": [ { "type": "scatterternary", "marker": { "colorbar": { "ticks": "", "outlinewidth": 0 } } } ], "histogram2dcontour": [ { "type": "histogram2dcontour", "colorbar": { "ticks": "", "outlinewidth": 0 }, "autocolorscale": true } ] }, "layout": { "geo": { "bgcolor": "white", "showland": true, "lakecolor": "white", "landcolor": "white", "showlakes": true, "subunitcolor": "#C8D4E3" }, "font": { "color": "#2a3f5f" }, "polar": { "bgcolor": "white", "radialaxis": { "ticks": "", "gridcolor": "#EBF0F8", "linecolor": "#EBF0F8" }, "angularaxis": { "ticks": "", "gridcolor": "#EBF0F8", "linecolor": "#EBF0F8" } }, "scene": { "xaxis": { "ticks": "", "gridcolor": "#DFE8F3", "gridwidth": 2, "linecolor": "#EBF0F8", "zerolinecolor": "#EBF0F8", "showbackground": true, "backgroundcolor": "white" }, "yaxis": { "ticks": "", "gridcolor": "#DFE8F3", "gridwidth": 2, "linecolor": "#EBF0F8", "zerolinecolor": "#EBF0F8", "showbackground": true, "backgroundcolor": "white" }, "zaxis": { "ticks": "", "gridcolor": "#DFE8F3", "gridwidth": 2, "linecolor": "#EBF0F8", "zerolinecolor": "#EBF0F8", "showbackground": true, "backgroundcolor": "white" } }, "title": { "x": 0.05 }, "xaxis": { "ticks": "", "gridcolor": "#EBF0F8", "linecolor": "#EBF0F8", "automargin": true, "zerolinecolor": "#EBF0F8", "zerolinewidth": 2 }, "yaxis": { "ticks": "", "gridcolor": "#EBF0F8", "linecolor": "#EBF0F8", "automargin": true, "zerolinecolor": "#EBF0F8", "zerolinewidth": 2 }, "ternary": { "aaxis": { "ticks": "", "gridcolor": "#DFE8F3", "linecolor": "#A2B1C6" }, "baxis": { "ticks": "", "gridcolor": "#DFE8F3", "linecolor": "#A2B1C6" }, "caxis": { "ticks": "", "gridcolor": "#DFE8F3", "linecolor": "#A2B1C6" }, "bgcolor": "white" }, "colorway": [ "#636efa", "#EF553B", "#00cc96", "#ab63fa", "#19d3f3", "#e763fa", "#fecb52", "#ffa15a", "#ff6692", "#b6e880" ], "hovermode": "closest", "colorscale": { "diverging": [ [ 0, "#8e0152" ], [ 0.1, "#c51b7d" ], [ 0.2, "#de77ae" ], [ 0.3, "#f1b6da" ], [ 0.4, "#fde0ef" ], [ 0.5, "#f7f7f7" ], [ 0.6, "#e6f5d0" ], [ 0.7, "#b8e186" ], [ 0.8, "#7fbc41" ], [ 0.9, "#4d9221" ], [ 1, "#276419" ] ], "sequential": [ [ 0, "#0508b8" ], [ 0.0893854748603352, "#1910d8" ], [ 0.1787709497206704, "#3c19f0" ], [ 0.2681564245810056, "#6b1cfb" ], [ 0.3575418994413408, "#981cfd" ], [ 0.44692737430167595, "#bf1cfd" ], [ 0.5363128491620112, "#dd2bfd" ], [ 0.6256983240223464, "#f246fe" ], [ 0.7150837988826816, "#fc67fd" ], [ 0.8044692737430168, "#fe88fc" ], [ 0.8938547486033519, "#fea5fd" ], [ 0.9832402234636871, "#febefe" ], [ 1, "#fec3fe" ] ], "sequentialminus": [ [ 0, "#0508b8" ], [ 0.0893854748603352, "#1910d8" ], [ 0.1787709497206704, "#3c19f0" ], [ 0.2681564245810056, "#6b1cfb" ], [ 0.3575418994413408, "#981cfd" ], [ 0.44692737430167595, "#bf1cfd" ], [ 0.5363128491620112, "#dd2bfd" ], [ 0.6256983240223464, "#f246fe" ], [ 0.7150837988826816, "#fc67fd" ], [ 0.8044692737430168, "#fe88fc" ], [ 0.8938547486033519, "#fea5fd" ], [ 0.9832402234636871, "#febefe" ], [ 1, "#fec3fe" ] ] }, "plot_bgcolor": "white", "paper_bgcolor": "white", "shapedefaults": { "line": { "width": 0 }, "opacity": 0.4, "fillcolor": "#506784" }, "annotationdefaults": { "arrowhead": 0, "arrowcolor": "#506784", "arrowwidth": 1 } }, "themeRef": "PLOTLY_WHITE" } } }, "height": null, "width": null, "user": { "profile_url": "https://chart-studio.plotly.com/~Yohan.asante", "avatar_url": "https://storage.googleapis.com/plotly-prod-profiles/1.jpg", "background_url": "https://storage.googleapis.com/plotly-prod-profiles/bg-6.jpg", "bio": "", "nickname": "", "website": "", "stream_tokens": null, "feature_set_id": null, "csrf_token": null, "date_joined": "2024-04-23 17:31:54", "mapbox_access_tokens": null, "has_password": null, "username": "Yohan.asante", "email": null, "is_active": null, "readonly": null, "is_dash_creator": null, "dash_created_count": null, "is_chart_creator": null, "charts_created_count": null } }, { "creation_time": "2024-04-23T17:27:33.342156Z", "comments": { "results": [], "count": 0 }, "parented": true, "embed_url": "https://chart-studio.plotly.com/~volosplotly/247.embed", "fid": "volosplotly:247", "filename": "Plot 247", "filetype": "plot", "img_url": "https://storage.googleapis.com/plotly-prod-images/volosplotly/247/9_SN2948F15VSIAII23MA1YO5UQOLI49.png", "image_urls": { "default": "https://storage.googleapis.com/plotly-prod-images/volosplotly/247/2_ATWJ9T6N7FES72FESL4XUP2NFHP3Y0.png", "block-thumb": "https://storage.googleapis.com/plotly-prod-images/volosplotly/247/8_S2QDTEO6MF3HZYW4NG7W4PG1LM3LND.png", "list-thumb": "https://storage.googleapis.com/plotly-prod-images/volosplotly/247/9_SN2948F15VSIAII23MA1YO5UQOLI49.png" }, "api_urls": { "files": "https://api.plotly.com/v2/files/volosplotly:247", "plots": "https://api.plotly.com/v2/plots/volosplotly:247", "parent": "https://api.plotly.com/v2/folders/home?user=volosplotly" }, "owner": "volosplotly", "parent": -1, "preview": "", "referencers": [], "references": [], "title": "", "views": 4, "web_url": "https://chart-studio.plotly.com/~volosplotly/247/", "world_readable": true, "date_modified": "2024-04-23T17:27:33.354Z", "stars": { "results": [], "count": 0 }, "collaborators": { "results": [], "count": 0 }, "subfolder_count": null, "refresh_interval": null, "organize_view_url": "https://chart-studio.plotly.com/~volosplotly/247/", "current_user_permission": "read", "is_theme": null, "is_template": null, "autosize": true, "caption": "", "figure": { "data": [ { "line": { "color": "#1f77b4" }, "meta": { "columnNames": { "x": "TLT 91 Day 10dc Implied Strike, x; TLT 91 Day 20dc Implied Strike, x; TLT 91 Day 30dc Implied Strike, x; TLT 91 Day 40dc Implied Strike, x; TLT 91 Day 50dc Implied Strike, x; TLT 91 Day 50dp Implied Strike, x; TLT 91 Day 40dp Implied Strike, x; TLT 91 Day 30dp Implied Strike, x; TLT 91 Day 20dp Implied Strike, x; TLT 91 Day 10dp Implied Strike, x; TLT Spot Price, x", "y": "TLT 91 Day 10dc Implied Strike, y" } }, "mode": "lines", "name": "TLT 91 Day 10dc Implied Strike", "type": "scatter", "xsrc": "volosplotly:246:84cb86", "ysrc": "volosplotly:246:5a98dc", "xaxis": "x", "yaxis": "y", "hoverinfo": "x+y", "showlegend": false } ], "layout": { "font": { "color": "black" }, "title": { "font": { "size": 24, "color": "black" } }, "xaxis": { "type": "date", "range": [ "2016-01-04", "2027-04-17 22:31:25.5055" ], "autorange": false }, "yaxis": { "type": "linear", "range": [ 60.29742685953776, 260.2000249226888 ], "title": { "text": "" }, "autorange": true }, "legend": { "orientation": "h" }, "margin": { "b": 30, "l": 100, "r": 50, "t": 0, "pad": 0 }, "yaxis2": { "side": "right", "title": { "text": "" }, "overlaying": "y" }, "autosize": true, "template": { "data": { "bar": [ { "type": "bar", "marker": { "line": { "color": "#E5ECF6", "width": 0.5 }, "pattern": { "size": 10, "fillmode": "overlay", "solidity": 0.2 } }, "error_x": { "color": "#2a3f5f" }, "error_y": { "color": "#2a3f5f" } } ], "pie": [ { "type": "pie", "automargin": true } ], "table": [ { "type": "table", "cells": { "fill": { "color": "#EBF0F8" }, "line": { "color": "white" } }, "header": { "fill": { "color": "#C8D4E3" }, "line": { "color": "white" } } } ], "carpet": [ { "type": "carpet", "aaxis": { "gridcolor": "white", "linecolor": "white", "endlinecolor": "#2a3f5f", "minorgridcolor": "white", "startlinecolor": "#2a3f5f" }, "baxis": { "gridcolor": "white", "linecolor": "white", "endlinecolor": "#2a3f5f", "minorgridcolor": "white", "startlinecolor": "#2a3f5f" } } ], "mesh3d": [ { "type": "mesh3d", "colorbar": { "ticks": "", "outlinewidth": 0 } } ], "contour": [ { "type": "contour", "colorbar": { "ticks": "", "outlinewidth": 0 }, "colorscale": [ [ 0.0, "#0d0887" ], [ 0.1111111111111111, "#46039f" ], [ 0.2222222222222222, "#7201a8" ], [ 0.3333333333333333, "#9c179e" ], [ 0.4444444444444444, "#bd3786" ], [ 0.5555555555555556, "#d8576b" ], [ 0.6666666666666666, "#ed7953" ], [ 0.7777777777777778, "#fb9f3a" ], [ 0.8888888888888888, "#fdca26" ], [ 1.0, "#f0f921" ] ] } ], "heatmap": [ { "type": "heatmap", "colorbar": { "ticks": "", "outlinewidth": 0 }, "colorscale": [ [ 0.0, "#0d0887" ], [ 0.1111111111111111, "#46039f" ], [ 0.2222222222222222, "#7201a8" ], [ 0.3333333333333333, "#9c179e" ], [ 0.4444444444444444, "#bd3786" ], [ 0.5555555555555556, "#d8576b" ], [ 0.6666666666666666, "#ed7953" ], [ 0.7777777777777778, "#fb9f3a" ], [ 0.8888888888888888, "#fdca26" ], [ 1.0, "#f0f921" ] ] } ], "scatter": [ { "type": "scatter", "marker": { "colorbar": { "ticks": "", "outlinewidth": 0 } } } ], "surface": [ { "type": "surface", "colorbar": { "ticks": "", "outlinewidth": 0 }, "colorscale": [ [ 0.0, "#0d0887" ], [ 0.1111111111111111, "#46039f" ], [ 0.2222222222222222, "#7201a8" ], [ 0.3333333333333333, "#9c179e" ], [ 0.4444444444444444, "#bd3786" ], [ 0.5555555555555556, "#d8576b" ], [ 0.6666666666666666, "#ed7953" ], [ 0.7777777777777778, "#fb9f3a" ], [ 0.8888888888888888, "#fdca26" ], [ 1.0, "#f0f921" ] ] } ], "barpolar": [ { "type": "barpolar", "marker": { "line": { "color": "#E5ECF6", "width": 0.5 }, "pattern": { "size": 10, "fillmode": "overlay", "solidity": 0.2 } } } ], "heatmapgl": [ { "type": "heatmapgl", "colorbar": { "ticks": "", "outlinewidth": 0 }, "colorscale": [ [ 0.0, "#0d0887" ], [ 0.1111111111111111, "#46039f" ], [ 0.2222222222222222, "#7201a8" ], [ 0.3333333333333333, "#9c179e" ], [ 0.4444444444444444, "#bd3786" ], [ 0.5555555555555556, "#d8576b" ], [ 0.6666666666666666, "#ed7953" ], [ 0.7777777777777778, "#fb9f3a" ], [ 0.8888888888888888, "#fdca26" ], [ 1.0, "#f0f921" ] ] } ], "histogram": [ { "type": "histogram", "marker": { "pattern": { "size": 10, "fillmode": "overlay", "solidity": 0.2 } } } ], "parcoords": [ { "line": { "colorbar": { "ticks": "", "outlinewidth": 0 } }, "type": "parcoords" } ], "scatter3d": [ { "line": { "colorbar": { "ticks": "", "outlinewidth": 0 } }, "type": "scatter3d", "marker": { "colorbar": { "ticks": "", "outlinewidth": 0 } } } ], "scattergl": [ { "type": "scattergl", "marker": { "colorbar": { "ticks": "", "outlinewidth": 0 } } } ], "choropleth": [ { "type": "choropleth", "colorbar": { "ticks": "", "outlinewidth": 0 } } ], "scattergeo": [ { "type": "scattergeo", "marker": { "colorbar": { "ticks": "", "outlinewidth": 0 } } } ], "histogram2d": [ { "type": "histogram2d", "colorbar": { "ticks": "", "outlinewidth": 0 }, "colorscale": [ [ 0.0, "#0d0887" ], [ 0.1111111111111111, "#46039f" ], [ 0.2222222222222222, "#7201a8" ], [ 0.3333333333333333, "#9c179e" ], [ 0.4444444444444444, "#bd3786" ], [ 0.5555555555555556, "#d8576b" ], [ 0.6666666666666666, "#ed7953" ], [ 0.7777777777777778, "#fb9f3a" ], [ 0.8888888888888888, "#fdca26" ], [ 1.0, "#f0f921" ] ] } ], "scatterpolar": [ { "type": "scatterpolar", "marker": { "colorbar": { "ticks": "", "outlinewidth": 0 } } } ], "contourcarpet": [ { "type": "contourcarpet", "colorbar": { "ticks": "", "outlinewidth": 0 } } ], "scattercarpet": [ { "type": "scattercarpet", "marker": { "colorbar": { "ticks": "", "outlinewidth": 0 } } } ], "scattermapbox": [ { "type": "scattermapbox", "marker": { "colorbar": { "ticks": "", "outlinewidth": 0 } } } ], "scatterpolargl": [ { "type": "scatterpolargl", "marker": { "colorbar": { "ticks": "", "outlinewidth": 0 } } } ], "scatterternary": [ { "type": "scatterternary", "marker": { "colorbar": { "ticks": "", "outlinewidth": 0 } } } ], "histogram2dcontour": [ { "type": "histogram2dcontour", "colorbar": { "ticks": "", "outlinewidth": 0 }, "colorscale": [ [ 0.0, "#0d0887" ], [ 0.1111111111111111, "#46039f" ], [ 0.2222222222222222, "#7201a8" ], [ 0.3333333333333333, "#9c179e" ], [ 0.4444444444444444, "#bd3786" ], [ 0.5555555555555556, "#d8576b" ], [ 0.6666666666666666, "#ed7953" ], [ 0.7777777777777778, "#fb9f3a" ], [ 0.8888888888888888, "#fdca26" ], [ 1.0, "#f0f921" ] ] } ] }, "layout": { "geo": { "bgcolor": "white", "showland": true, "lakecolor": "white", "landcolor": "#E5ECF6", "showlakes": true, "subunitcolor": "white" }, "font": { "color": "#2a3f5f" }, "polar": { "bgcolor": "#E5ECF6", "radialaxis": { "ticks": "", "gridcolor": "white", "linecolor": "white" }, "angularaxis": { "ticks": "", "gridcolor": "white", "linecolor": "white" } }, "scene": { "xaxis": { "ticks": "", "gridcolor": "white", "gridwidth": 2, "linecolor": "white", "zerolinecolor": "white", "showbackground": true, "backgroundcolor": "#E5ECF6" }, "yaxis": { "ticks": "", "gridcolor": "white", "gridwidth": 2, "linecolor": "white", "zerolinecolor": "white", "showbackground": true, "backgroundcolor": "#E5ECF6" }, "zaxis": { "ticks": "", "gridcolor": "white", "gridwidth": 2, "linecolor": "white", "zerolinecolor": "white", "showbackground": true, "backgroundcolor": "#E5ECF6" } }, "title": { "x": 0.05 }, "xaxis": { "ticks": "", "title": { "standoff": 15 }, "gridcolor": "white", "linecolor": "white", "automargin": true, "zerolinecolor": "white", "zerolinewidth": 2 }, "yaxis": { "ticks": "", "title": { "standoff": 15 }, "gridcolor": "white", "linecolor": "white", "automargin": true, "zerolinecolor": "white", "zerolinewidth": 2 }, "mapbox": { "style": "light" }, "ternary": { "aaxis": { "ticks": "", "gridcolor": "white", "linecolor": "white" }, "baxis": { "ticks": "", "gridcolor": "white", "linecolor": "white" }, "caxis": { "ticks": "", "gridcolor": "white", "linecolor": "white" }, "bgcolor": "#E5ECF6" }, "colorway": [ "#636efa", "#EF553B", "#00cc96", "#ab63fa", "#FFA15A", "#19d3f3", "#FF6692", "#B6E880", "#FF97FF", "#FECB52" ], "coloraxis": { "colorbar": { "ticks": "", "outlinewidth": 0 } }, "hovermode": "closest", "colorscale": { "diverging": [ [ 0, "#8e0152" ], [ 0.1, "#c51b7d" ], [ 0.2, "#de77ae" ], [ 0.3, "#f1b6da" ], [ 0.4, "#fde0ef" ], [ 0.5, "#f7f7f7" ], [ 0.6, "#e6f5d0" ], [ 0.7, "#b8e186" ], [ 0.8, "#7fbc41" ], [ 0.9, "#4d9221" ], [ 1, "#276419" ] ], "sequential": [ [ 0.0, "#0d0887" ], [ 0.1111111111111111, "#46039f" ], [ 0.2222222222222222, "#7201a8" ], [ 0.3333333333333333, "#9c179e" ], [ 0.4444444444444444, "#bd3786" ], [ 0.5555555555555556, "#d8576b" ], [ 0.6666666666666666, "#ed7953" ], [ 0.7777777777777778, "#fb9f3a" ], [ 0.8888888888888888, "#fdca26" ], [ 1.0, "#f0f921" ] ], "sequentialminus": [ [ 0.0, "#0d0887" ], [ 0.1111111111111111, "#46039f" ], [ 0.2222222222222222, "#7201a8" ], [ 0.3333333333333333, "#9c179e" ], [ 0.4444444444444444, "#bd3786" ], [ 0.5555555555555556, "#d8576b" ], [ 0.6666666666666666, "#ed7953" ], [ 0.7777777777777778, "#fb9f3a" ], [ 0.8888888888888888, "#fdca26" ], [ 1.0, "#f0f921" ] ] }, "hoverlabel": { "align": "left" }, "plot_bgcolor": "#E5ECF6", "paper_bgcolor": "white", "shapedefaults": { "line": { "color": "#2a3f5f" } }, "autotypenumbers": "strict", "annotationdefaults": { "arrowhead": 0, "arrowcolor": "#2a3f5f", "arrowwidth": 1 } } }, "showlegend": true, "plot_bgcolor": "white", "paper_bgcolor": "white" } }, "height": null, "width": null, "user": { "profile_url": "https://chart-studio.plotly.com/~volosplotly", "avatar_url": "https://storage.googleapis.com/plotly-prod-profiles/13.jpg", "background_url": "https://storage.googleapis.com/plotly-prod-profiles/bg-8.jpg", "bio": "", "nickname": "", "website": "", "stream_tokens": null, "feature_set_id": null, "csrf_token": null, "date_joined": "2017-07-15 02:05:50", "mapbox_access_tokens": null, "has_password": null, "username": "volosplotly", "email": null, "is_active": null, "readonly": null, "is_dash_creator": null, "dash_created_count": null, "is_chart_creator": null, "charts_created_count": null } }, { "creation_time": "2024-04-23T17:19:55.462236Z", "comments": { "results": [], "count": 0 }, "parented": true, "embed_url": "https://chart-studio.plotly.com/~rnarofah/2.embed", "fid": "rnarofah:2", "filename": "Plot 2", "filetype": "plot", "img_url": "https://storage.googleapis.com/plotly-prod-images/rnarofah/2/9_A4FGI3L73NBS9929TWDS5ZSUPAAERO.png", "image_urls": { "default": "https://storage.googleapis.com/plotly-prod-images/rnarofah/2/2_2062AE06MAFRFS4AXDC7GTB49D5IZF.png", "block-thumb": "https://storage.googleapis.com/plotly-prod-images/rnarofah/2/8_JBSC98TZ9CRIKK8SYOXH9O0FGELW5P.png", "list-thumb": "https://storage.googleapis.com/plotly-prod-images/rnarofah/2/9_A4FGI3L73NBS9929TWDS5ZSUPAAERO.png" }, "api_urls": { "files": "https://api.plotly.com/v2/files/rnarofah:2", "plots": "https://api.plotly.com/v2/plots/rnarofah:2", "parent": "https://api.plotly.com/v2/folders/home?user=rnarofah" }, "owner": "rnarofah", "parent": -1, "preview": "", "referencers": [], "references": [], "title": "", "views": 2, "web_url": "https://chart-studio.plotly.com/~rnarofah/2/", "world_readable": true, "date_modified": "2024-04-23T18:10:09.899Z", "stars": { "results": [], "count": 0 }, "collaborators": { "results": [], "count": 0 }, "subfolder_count": null, "refresh_interval": null, "organize_view_url": "https://chart-studio.plotly.com/~rnarofah/2/", "current_user_permission": "read", "is_theme": null, "is_template": false, "autosize": true, "caption": "", "figure": { "data": [ { "meta": { "columnNames": { "lat": "A", "lon": "B", "marker": { "size": "D", "color": "D" } } }, "mode": "markers", "type": "scattermapbox", "latsrc": "rnarofah:3:9a670d", "lonsrc": "rnarofah:3:e7a027", "marker": { "meta": { "columnNames": { "size": "D", "color": "D" } }, "sizeref": 1111.5777777777778, "sizesrc": "rnarofah:3:bc3293", "colorsrc": "rnarofah:3:bc3293", "sizemode": "area", "showscale": false, "colorscale": [ [ 0, "#0508b8" ], [ 0.08333333333333333, "#1910d8" ], [ 0.16666666666666666, "#3c19f0" ], [ 0.25, "#6b1cfb" ], [ 0.3333333333333333, "#981cfd" ], [ 0.4166666666666667, "#bf1cfd" ], [ 0.5, "#dd2bfd" ], [ 0.5833333333333334, "#f246fe" ], [ 0.6666666666666666, "#fc67fd" ], [ 0.75, "#fe88fc" ], [ 0.8333333333333334, "#fea5fd" ], [ 0.9166666666666666, "#febefe" ], [ 1, "#fec3fe" ] ], "reversescale": false }, "autocolorscale": false } ], "frames": [], "layout": { "geo": { "scope": "usa", "center": { "lat": 34.32175151176762, "lon": -86.32915842188669 }, "projection": { "scale": 0.8312378961427876 } }, "font": { "size": 9, "color": "rgb(196, 200, 205)", "family": "Arial" }, "title": { "x": 0.12, "font": { "size": 20, "family": "Arial" }, "text": "" }, "width": 1022, "xaxis": { "range": [ -1, 6 ], "autorange": true }, "yaxis": { "range": [ -1, 4 ], "autorange": true }, "height": 771, "mapbox": { "zoom": 4.136456333983789, "pitch": 0, "center": { "lat": -2.8141683047679606, "lon": 109.25291062477481 }, "bearing": 0 }, "autosize": true, "colorway": [ "#AA0DFE", "#3283FE", "#85660D", "#782AB6", "#565656", "#1C8356", "#16FF32", "#F7E1A0", "#E2E2E2", "#1CBE4F", "#C4451C", "#DEA0FD", "#FE00FA", "#325A9B", "#FEAF16", "#F8A19F", "#90AD1C", "#F6222E", "#1CFFCE", "#2ED9FF", "#B10DA1", "#C075A6", "#FC1CBF", "#B00068", "#FBE426", "#FA0087" ], "dragmode": "pan", "template": { "data": { "bar": [ { "type": "bar", "marker": { "colorbar": { "ticks": "", "outlinewidth": 0 } } } ], "table": [ { "type": "table", "cells": { "fill": { "color": "#EBF0F8" }, "line": { "color": "white" } }, "header": { "fill": { "color": "#C8D4E3" }, "line": { "color": "white" } } } ], "carpet": [ { "type": "carpet", "aaxis": { "gridcolor": "#C8D4E3", "linecolor": "#C8D4E3", "endlinecolor": "#2a3f5f", "minorgridcolor": "#C8D4E3", "startlinecolor": "#2a3f5f" }, "baxis": { "gridcolor": "#C8D4E3", "linecolor": "#C8D4E3", "endlinecolor": "#2a3f5f", "minorgridcolor": "#C8D4E3", "startlinecolor": "#2a3f5f" } } ], "mesh3d": [ { "type": "mesh3d", "colorbar": { "ticks": "", "outlinewidth": 0 } } ], "contour": [ { "type": "contour", "colorbar": { "ticks": "", "outlinewidth": 0 }, "autocolorscale": true } ], "heatmap": [ { "type": "heatmap", "colorbar": { "ticks": "", "outlinewidth": 0 }, "autocolorscale": true } ], "scatter": [ { "type": "scatter", "marker": { "colorbar": { "ticks": "", "outlinewidth": 0 } } } ], "surface": [ { "type": "surface", "colorbar": { "ticks": "", "outlinewidth": 0 } } ], "heatmapgl": [ { "type": "heatmapgl", "colorbar": { "ticks": "", "outlinewidth": 0 } } ], "histogram": [ { "type": "histogram", "marker": { "colorbar": { "ticks": "", "outlinewidth": 0 } } } ], "parcoords": [ { "line": { "colorbar": { "ticks": "", "outlinewidth": 0 } }, "type": "parcoords" } ], "scatter3d": [ { "type": "scatter3d", "marker": { "colorbar": { "ticks": "", "outlinewidth": 0 } } } ], "scattergl": [ { "type": "scattergl", "marker": { "colorbar": { "ticks": "", "outlinewidth": 0 } } } ], "choropleth": [ { "type": "choropleth", "colorbar": { "ticks": "", "outlinewidth": 0 } } ], "scattergeo": [ { "type": "scattergeo", "marker": { "colorbar": { "ticks": "", "outlinewidth": 0 } } } ], "histogram2d": [ { "type": "histogram2d", "colorbar": { "ticks": "", "outlinewidth": 0 }, "autocolorscale": true } ], "scatterpolar": [ { "type": "scatterpolar", "marker": { "colorbar": { "ticks": "", "outlinewidth": 0 } } } ], "contourcarpet": [ { "type": "contourcarpet", "colorbar": { "ticks": "", "outlinewidth": 0 } } ], "scattercarpet": [ { "type": "scattercarpet", "marker": { "colorbar": { "ticks": "", "outlinewidth": 0 } } } ], "scattermapbox": [ { "type": "scattermapbox", "marker": { "colorbar": { "ticks": "", "outlinewidth": 0 } } } ], "scatterpolargl": [ { "type": "scatterpolargl", "marker": { "colorbar": { "ticks": "", "outlinewidth": 0 } } } ], "scatterternary": [ { "type": "scatterternary", "marker": { "colorbar": { "ticks": "", "outlinewidth": 0 } } } ], "histogram2dcontour": [ { "type": "histogram2dcontour", "colorbar": { "ticks": "", "outlinewidth": 0 }, "autocolorscale": true } ] }, "layout": { "geo": { "bgcolor": "white", "showland": true, "lakecolor": "white", "landcolor": "white", "showlakes": true, "subunitcolor": "#C8D4E3" }, "font": { "color": "#2a3f5f" }, "polar": { "bgcolor": "white", "radialaxis": { "ticks": "", "gridcolor": "#EBF0F8", "linecolor": "#EBF0F8" }, "angularaxis": { "ticks": "", "gridcolor": "#EBF0F8", "linecolor": "#EBF0F8" } }, "scene": { "xaxis": { "ticks": "", "gridcolor": "#DFE8F3", "gridwidth": 2, "linecolor": "#EBF0F8", "zerolinecolor": "#EBF0F8", "showbackground": true, "backgroundcolor": "white" }, "yaxis": { "ticks": "", "gridcolor": "#DFE8F3", "gridwidth": 2, "linecolor": "#EBF0F8", "zerolinecolor": "#EBF0F8", "showbackground": true, "backgroundcolor": "white" }, "zaxis": { "ticks": "", "gridcolor": "#DFE8F3", "gridwidth": 2, "linecolor": "#EBF0F8", "zerolinecolor": "#EBF0F8", "showbackground": true, "backgroundcolor": "white" } }, "title": { "x": 0.05 }, "xaxis": { "ticks": "", "gridcolor": "#EBF0F8", "linecolor": "#EBF0F8", "automargin": true, "zerolinecolor": "#EBF0F8", "zerolinewidth": 2 }, "yaxis": { "ticks": "", "gridcolor": "#EBF0F8", "linecolor": "#EBF0F8", "automargin": true, "zerolinecolor": "#EBF0F8", "zerolinewidth": 2 }, "ternary": { "aaxis": { "ticks": "", "gridcolor": "#DFE8F3", "linecolor": "#A2B1C6" }, "baxis": { "ticks": "", "gridcolor": "#DFE8F3", "linecolor": "#A2B1C6" }, "caxis": { "ticks": "", "gridcolor": "#DFE8F3", "linecolor": "#A2B1C6" }, "bgcolor": "white" }, "colorway": [ "#636efa", "#EF553B", "#00cc96", "#ab63fa", "#19d3f3", "#e763fa", "#fecb52", "#ffa15a", "#ff6692", "#b6e880" ], "hovermode": "closest", "colorscale": { "diverging": [ [ 0, "#8e0152" ], [ 0.1, "#c51b7d" ], [ 0.2, "#de77ae" ], [ 0.3, "#f1b6da" ], [ 0.4, "#fde0ef" ], [ 0.5, "#f7f7f7" ], [ 0.6, "#e6f5d0" ], [ 0.7, "#b8e186" ], [ 0.8, "#7fbc41" ], [ 0.9, "#4d9221" ], [ 1, "#276419" ] ], "sequential": [ [ 0, "#0508b8" ], [ 0.0893854748603352, "#1910d8" ], [ 0.1787709497206704, "#3c19f0" ], [ 0.2681564245810056, "#6b1cfb" ], [ 0.3575418994413408, "#981cfd" ], [ 0.44692737430167595, "#bf1cfd" ], [ 0.5363128491620112, "#dd2bfd" ], [ 0.6256983240223464, "#f246fe" ], [ 0.7150837988826816, "#fc67fd" ], [ 0.8044692737430168, "#fe88fc" ], [ 0.8938547486033519, "#fea5fd" ], [ 0.9832402234636871, "#febefe" ], [ 1, "#fec3fe" ] ], "sequentialminus": [ [ 0, "#0508b8" ], [ 0.0893854748603352, "#1910d8" ], [ 0.1787709497206704, "#3c19f0" ], [ 0.2681564245810056, "#6b1cfb" ], [ 0.3575418994413408, "#981cfd" ], [ 0.44692737430167595, "#bf1cfd" ], [ 0.5363128491620112, "#dd2bfd" ], [ 0.6256983240223464, "#f246fe" ], [ 0.7150837988826816, "#fc67fd" ], [ 0.8044692737430168, "#fe88fc" ], [ 0.8938547486033519, "#fea5fd" ], [ 0.9832402234636871, "#febefe" ], [ 1, "#fec3fe" ] ] }, "plot_bgcolor": "white", "paper_bgcolor": "white", "shapedefaults": { "line": { "width": 0 }, "opacity": 0.4, "fillcolor": "#506784" }, "annotationdefaults": { "arrowhead": 0, "arrowcolor": "#506784", "arrowwidth": 1 } }, "themeRef": "PLOTLY_WHITE" }, "clickmode": "event", "hovermode": false, "colorscale": { "sequential": [ [ 0, "#0508b8" ], [ 0.08333333333333333, "#1910d8" ], [ 0.16666666666666666, "#3c19f0" ], [ 0.25, "#6b1cfb" ], [ 0.3333333333333333, "#981cfd" ], [ 0.4166666666666667, "#bf1cfd" ], [ 0.5, "#dd2bfd" ], [ 0.5833333333333334, "#f246fe" ], [ 0.6666666666666666, "#fc67fd" ], [ 0.75, "#fe88fc" ], [ 0.8333333333333334, "#fea5fd" ], [ 0.9166666666666666, "#febefe" ], [ 1, "#fec3fe" ] ] }, "separators": ".,", "showlegend": false, "uniformtext": { "mode": false }, "paper_bgcolor": "rgb(255, 255, 255)" } }, "height": 771, "width": 1022, "user": { "profile_url": "https://chart-studio.plotly.com/~rnarofah", "avatar_url": "https://storage.googleapis.com/plotly-prod-profiles/79.jpg", "background_url": "https://storage.googleapis.com/plotly-prod-profiles/bg-6.jpg", "bio": "", "nickname": "", "website": "", "stream_tokens": null, "feature_set_id": null, "csrf_token": null, "date_joined": "2024-04-23 16:45:07", "mapbox_access_tokens": null, "has_password": null, "username": "rnarofah", "email": null, "is_active": null, "readonly": null, "is_dash_creator": null, "dash_created_count": null, "is_chart_creator": null, "charts_created_count": null } }, { "creation_time": "2024-04-23T17:08:03.461257Z", "comments": { "results": [], "count": 0 }, "parented": true, "embed_url": "https://chart-studio.plotly.com/~joshgnanaraj/1.embed", "fid": "joshgnanaraj:1", "filename": "hd pm", "filetype": "plot", "img_url": "https://storage.googleapis.com/plotly-prod-images/joshgnanaraj/1/9_5QOUL3Q3S7SFBYL77GJHFP2CBISOGU.png", "image_urls": { "default": "https://storage.googleapis.com/plotly-prod-images/joshgnanaraj/1/2_3E02WU9UZOKY70IUCO7PSXLFIM72SP.png", "block-thumb": "https://storage.googleapis.com/plotly-prod-images/joshgnanaraj/1/8_SOG4BBQEIGKYQF0EJVGCDF4GHW8AZS.png", "list-thumb": "https://storage.googleapis.com/plotly-prod-images/joshgnanaraj/1/9_5QOUL3Q3S7SFBYL77GJHFP2CBISOGU.png" }, "api_urls": { "files": "https://api.plotly.com/v2/files/joshgnanaraj:1", "plots": "https://api.plotly.com/v2/plots/joshgnanaraj:1", "parent": "https://api.plotly.com/v2/folders/home?user=joshgnanaraj" }, "owner": "joshgnanaraj", "parent": -1, "preview": "", "referencers": [], "references": [], "title": "", "views": 1, "web_url": "https://chart-studio.plotly.com/~joshgnanaraj/1/", "world_readable": true, "date_modified": "2024-04-24T06:04:05.199Z", "stars": { "results": [], "count": 0 }, "collaborators": { "results": [], "count": 0 }, "subfolder_count": null, "refresh_interval": null, "organize_view_url": "https://chart-studio.plotly.com/~joshgnanaraj/1/", "current_user_permission": "read", "is_theme": null, "is_template": false, "autosize": true, "caption": "", "figure": { "data": [ { "meta": { "columnNames": { "x": "A", "y": "B" } }, "mode": "lines", "name": "DMIPv6", "type": "scatter", "xsrc": "joshgnanaraj:0:792f46", "ysrc": "joshgnanaraj:0:56c6bb" }, { "line": { "color": "rgb(239, 37, 4)" }, "meta": { "columnNames": { "x": "A", "y": "C" } }, "mode": "lines", "name": "PMIPv6", "type": "scatter", "xsrc": "joshgnanaraj:0:792f46", "ysrc": "joshgnanaraj:0:577027", "stackgroup": null }, { "meta": { "columnNames": { "x": "A", "y": "D" } }, "mode": "lines", "name": "SDN-DMM", "type": "scatter", "xsrc": "joshgnanaraj:0:792f46", "ysrc": "joshgnanaraj:0:f3bd60", "xaxis": "x", "stackgroup": null } ], "frames": [], "layout": { "title": { "text": "" }, "xaxis": { "type": "linear", "range": [ 0.1, 0.9 ], "ticks": "", "title": { "font": { "family": "Times New Roman" }, "text": "Probability of Movement (Pm)" }, "showgrid": true, "showline": true, "autorange": true, "linecolor": "rgb(0, 0, 10)", "linewidth": 2, "showspikes": false }, "yaxis": { "type": "linear", "range": [ -1.1483333333333339, 44.818333333333335 ], "title": { "font": { "family": "Times New Roman" }, "text": "Handoff Delay (ms)" }, "showgrid": false, "showline": true, "autorange": true, "gridcolor": "rgb(1, 4, 10)", "gridwidth": 2, "linecolor": "rgb(1, 7, 18)", "linewidth": 2 }, "legend": { "title": { "text": "<br>" } }, "autosize": true, "template": { "data": { "bar": [ { "type": "bar", "marker": { "colorbar": { "ticks": "", "outlinewidth": 0 } } } ], "table": [ { "type": "table", "cells": { "fill": { "color": "#EBF0F8" }, "line": { "color": "white" } }, "header": { "fill": { "color": "#C8D4E3" }, "line": { "color": "white" } } } ], "carpet": [ { "type": "carpet", "aaxis": { "gridcolor": "#C8D4E3", "linecolor": "#C8D4E3", "endlinecolor": "#2a3f5f", "minorgridcolor": "#C8D4E3", "startlinecolor": "#2a3f5f" }, "baxis": { "gridcolor": "#C8D4E3", "linecolor": "#C8D4E3", "endlinecolor": "#2a3f5f", "minorgridcolor": "#C8D4E3", "startlinecolor": "#2a3f5f" } } ], "mesh3d": [ { "type": "mesh3d", "colorbar": { "ticks": "", "outlinewidth": 0 } } ], "contour": [ { "type": "contour", "colorbar": { "ticks": "", "outlinewidth": 0 }, "autocolorscale": true } ], "heatmap": [ { "type": "heatmap", "colorbar": { "ticks": "", "outlinewidth": 0 }, "autocolorscale": true } ], "scatter": [ { "type": "scatter", "marker": { "colorbar": { "ticks": "", "outlinewidth": 0 } } } ], "surface": [ { "type": "surface", "colorbar": { "ticks": "", "outlinewidth": 0 } } ], "heatmapgl": [ { "type": "heatmapgl", "colorbar": { "ticks": "", "outlinewidth": 0 } } ], "histogram": [ { "type": "histogram", "marker": { "colorbar": { "ticks": "", "outlinewidth": 0 } } } ], "parcoords": [ { "line": { "colorbar": { "ticks": "", "outlinewidth": 0 } }, "type": "parcoords" } ], "scatter3d": [ { "type": "scatter3d", "marker": { "colorbar": { "ticks": "", "outlinewidth": 0 } } } ], "scattergl": [ { "type": "scattergl", "marker": { "colorbar": { "ticks": "", "outlinewidth": 0 } } } ], "choropleth": [ { "type": "choropleth", "colorbar": { "ticks": "", "outlinewidth": 0 } } ], "scattergeo": [ { "type": "scattergeo", "marker": { "colorbar": { "ticks": "", "outlinewidth": 0 } } } ], "histogram2d": [ { "type": "histogram2d", "colorbar": { "ticks": "", "outlinewidth": 0 }, "autocolorscale": true } ], "scatterpolar": [ { "type": "scatterpolar", "marker": { "colorbar": { "ticks": "", "outlinewidth": 0 } } } ], "contourcarpet": [ { "type": "contourcarpet", "colorbar": { "ticks": "", "outlinewidth": 0 } } ], "scattercarpet": [ { "type": "scattercarpet", "marker": { "colorbar": { "ticks": "", "outlinewidth": 0 } } } ], "scattermapbox": [ { "type": "scattermapbox", "marker": { "colorbar": { "ticks": "", "outlinewidth": 0 } } } ], "scatterpolargl": [ { "type": "scatterpolargl", "marker": { "colorbar": { "ticks": "", "outlinewidth": 0 } } } ], "scatterternary": [ { "type": "scatterternary", "marker": { "colorbar": { "ticks": "", "outlinewidth": 0 } } } ], "histogram2dcontour": [ { "type": "histogram2dcontour", "colorbar": { "ticks": "", "outlinewidth": 0 }, "autocolorscale": true } ] }, "layout": { "geo": { "bgcolor": "white", "showland": true, "lakecolor": "white", "landcolor": "white", "showlakes": true, "subunitcolor": "#C8D4E3" }, "font": { "color": "#2a3f5f" }, "polar": { "bgcolor": "white", "radialaxis": { "ticks": "", "gridcolor": "#EBF0F8", "linecolor": "#EBF0F8" }, "angularaxis": { "ticks": "", "gridcolor": "#EBF0F8", "linecolor": "#EBF0F8" } }, "scene": { "xaxis": { "ticks": "", "gridcolor": "#DFE8F3", "gridwidth": 2, "linecolor": "#EBF0F8", "zerolinecolor": "#EBF0F8", "showbackground": true, "backgroundcolor": "white" }, "yaxis": { "ticks": "", "gridcolor": "#DFE8F3", "gridwidth": 2, "linecolor": "#EBF0F8", "zerolinecolor": "#EBF0F8", "showbackground": true, "backgroundcolor": "white" }, "zaxis": { "ticks": "", "gridcolor": "#DFE8F3", "gridwidth": 2, "linecolor": "#EBF0F8", "zerolinecolor": "#EBF0F8", "showbackground": true, "backgroundcolor": "white" } }, "title": { "x": 0.05 }, "xaxis": { "ticks": "", "gridcolor": "#EBF0F8", "linecolor": "#EBF0F8", "automargin": true, "zerolinecolor": "#EBF0F8", "zerolinewidth": 2 }, "yaxis": { "ticks": "", "gridcolor": "#EBF0F8", "linecolor": "#EBF0F8", "automargin": true, "zerolinecolor": "#EBF0F8", "zerolinewidth": 2 }, "ternary": { "aaxis": { "ticks": "", "gridcolor": "#DFE8F3", "linecolor": "#A2B1C6" }, "baxis": { "ticks": "", "gridcolor": "#DFE8F3", "linecolor": "#A2B1C6" }, "caxis": { "ticks": "", "gridcolor": "#DFE8F3", "linecolor": "#A2B1C6" }, "bgcolor": "white" }, "colorway": [ "#636efa", "#EF553B", "#00cc96", "#ab63fa", "#19d3f3", "#e763fa", "#fecb52", "#ffa15a", "#ff6692", "#b6e880" ], "hovermode": "closest", "colorscale": { "diverging": [ [ 0, "#8e0152" ], [ 0.1, "#c51b7d" ], [ 0.2, "#de77ae" ], [ 0.3, "#f1b6da" ], [ 0.4, "#fde0ef" ], [ 0.5, "#f7f7f7" ], [ 0.6, "#e6f5d0" ], [ 0.7, "#b8e186" ], [ 0.8, "#7fbc41" ], [ 0.9, "#4d9221" ], [ 1, "#276419" ] ], "sequential": [ [ 0, "#0508b8" ], [ 0.0893854748603352, "#1910d8" ], [ 0.1787709497206704, "#3c19f0" ], [ 0.2681564245810056, "#6b1cfb" ], [ 0.3575418994413408, "#981cfd" ], [ 0.44692737430167595, "#bf1cfd" ], [ 0.5363128491620112, "#dd2bfd" ], [ 0.6256983240223464, "#f246fe" ], [ 0.7150837988826816, "#fc67fd" ], [ 0.8044692737430168, "#fe88fc" ], [ 0.8938547486033519, "#fea5fd" ], [ 0.9832402234636871, "#febefe" ], [ 1, "#fec3fe" ] ], "sequentialminus": [ [ 0, "#0508b8" ], [ 0.0893854748603352, "#1910d8" ], [ 0.1787709497206704, "#3c19f0" ], [ 0.2681564245810056, "#6b1cfb" ], [ 0.3575418994413408, "#981cfd" ], [ 0.44692737430167595, "#bf1cfd" ], [ 0.5363128491620112, "#dd2bfd" ], [ 0.6256983240223464, "#f246fe" ], [ 0.7150837988826816, "#fc67fd" ], [ 0.8044692737430168, "#fe88fc" ], [ 0.8938547486033519, "#fea5fd" ], [ 0.9832402234636871, "#febefe" ], [ 1, "#fec3fe" ] ] }, "plot_bgcolor": "white", "paper_bgcolor": "white", "shapedefaults": { "line": { "width": 0 }, "opacity": 0.4, "fillcolor": "#506784" }, "annotationdefaults": { "arrowhead": 0, "arrowcolor": "#506784", "arrowwidth": 1 } }, "themeRef": "PLOTLY_WHITE" } } }, "height": null, "width": null, "user": { "profile_url": "https://chart-studio.plotly.com/~joshgnanaraj", "avatar_url": "https://storage.googleapis.com/plotly-prod-profiles/61.jpg", "background_url": "https://storage.googleapis.com/plotly-prod-profiles/bg-2.jpg", "bio": "", "nickname": "", "website": "", "stream_tokens": null, "feature_set_id": null, "csrf_token": null, "date_joined": "2024-04-23 17:07:27", "mapbox_access_tokens": null, "has_password": null, "username": "joshgnanaraj", "email": null, "is_active": null, "readonly": null, "is_dash_creator": null, "dash_created_count": null, "is_chart_creator": null, "charts_created_count": null } }, { "creation_time": "2024-04-23T17:07:54.784627Z", "comments": { "results": [], "count": 0 }, "parented": true, "embed_url": "https://chart-studio.plotly.com/~volosplotly/245.embed", "fid": "volosplotly:245", "filename": "TLTs", "filetype": "plot", "img_url": "https://storage.googleapis.com/plotly-prod-images/volosplotly/245/9_BZZ3FRK0NYVGNWPM7G4GV7PT7PJP9N.png", "image_urls": { "default": "https://storage.googleapis.com/plotly-prod-images/volosplotly/245/2_FNCUXUHCR7QEB7BAW8XDTZH50R9QPT.png", "block-thumb": "https://storage.googleapis.com/plotly-prod-images/volosplotly/245/8_6P34SKEO28428SA9MMRFFK2JOL3G4Z.png", "list-thumb": "https://storage.googleapis.com/plotly-prod-images/volosplotly/245/9_BZZ3FRK0NYVGNWPM7G4GV7PT7PJP9N.png" }, "api_urls": { "files": "https://api.plotly.com/v2/files/volosplotly:245", "plots": "https://api.plotly.com/v2/plots/volosplotly:245", "parent": "https://api.plotly.com/v2/folders/home?user=volosplotly" }, "owner": "volosplotly", "parent": -1, "preview": "", "referencers": [], "references": [], "title": "", "views": 2, "web_url": "https://chart-studio.plotly.com/~volosplotly/245/", "world_readable": true, "date_modified": "2024-04-23T17:07:54.801Z", "stars": { "results": [], "count": 0 }, "collaborators": { "results": [], "count": 0 }, "subfolder_count": null, "refresh_interval": null, "organize_view_url": "https://chart-studio.plotly.com/~volosplotly/245/", "current_user_permission": "read", "is_theme": null, "is_template": false, "autosize": true, "caption": "", "figure": { "data": [ { "line": { "color": "#1f77b4" }, "meta": { "columnNames": { "x": "TLT 91 Day 10dc Implied Strike, x; TLT 91 Day 20dc Implied Strike, x; TLT 91 Day 30dc Implied Strike, x; TLT 91 Day 40dc Implied Strike, x; TLT 91 Day 50dc Implied Strike, x; TLT 91 Day 50dp Implied Strike, x; TLT 91 Day 40dp Implied Strike, x; TLT 91 Day 30dp Implied Strike, x; TLT 91 Day 20dp Implied Strike, x; TLT 91 Day 10dp Implied Strike, x; TLT Spot Price, x", "y": "TLT 91 Day 10dc Implied Strike, y" } }, "mode": "lines", "name": "TLT 91 Day 10dc Implied Strike", "type": "scatter", "xsrc": "volosplotly:244:3afc29", "ysrc": "volosplotly:244:8b7c58", "xaxis": "x", "yaxis": "y", "hoverinfo": "x+y", "showlegend": "false" }, { "line": { "color": "#ff7f0e" }, "meta": { "columnNames": { "x": "TLT 91 Day 10dc Implied Strike, x; TLT 91 Day 20dc Implied Strike, x; TLT 91 Day 30dc Implied Strike, x; TLT 91 Day 40dc Implied Strike, x; TLT 91 Day 50dc Implied Strike, x; TLT 91 Day 50dp Implied Strike, x; TLT 91 Day 40dp Implied Strike, x; TLT 91 Day 30dp Implied Strike, x; TLT 91 Day 20dp Implied Strike, x; TLT 91 Day 10dp Implied Strike, x; TLT Spot Price, x", "y": "TLT 91 Day 20dc Implied Strike, y" } }, "mode": "lines", "name": "TLT 91 Day 20dc Implied Strike", "type": "scatter", "xsrc": "volosplotly:244:3afc29", "ysrc": "volosplotly:244:e5678f", "xaxis": "x", "yaxis": "y", "hoverinfo": "x+y", "showlegend": "false" }, { "line": { "color": "#2ca02c" }, "meta": { "columnNames": { "x": "TLT 91 Day 10dc Implied Strike, x; TLT 91 Day 20dc Implied Strike, x; TLT 91 Day 30dc Implied Strike, x; TLT 91 Day 40dc Implied Strike, x; TLT 91 Day 50dc Implied Strike, x; TLT 91 Day 50dp Implied Strike, x; TLT 91 Day 40dp Implied Strike, x; TLT 91 Day 30dp Implied Strike, x; TLT 91 Day 20dp Implied Strike, x; TLT 91 Day 10dp Implied Strike, x; TLT Spot Price, x", "y": "TLT 91 Day 30dc Implied Strike, y" } }, "mode": "lines", "name": "TLT 91 Day 30dc Implied Strike", "type": "scatter", "xsrc": "volosplotly:244:3afc29", "ysrc": "volosplotly:244:d3efd4", "xaxis": "x", "yaxis": "y", "hoverinfo": "x+y", "showlegend": "false" }, { "line": { "color": "#d62728" }, "meta": { "columnNames": { "x": "TLT 91 Day 10dc Implied Strike, x; TLT 91 Day 20dc Implied Strike, x; TLT 91 Day 30dc Implied Strike, x; TLT 91 Day 40dc Implied Strike, x; TLT 91 Day 50dc Implied Strike, x; TLT 91 Day 50dp Implied Strike, x; TLT 91 Day 40dp Implied Strike, x; TLT 91 Day 30dp Implied Strike, x; TLT 91 Day 20dp Implied Strike, x; TLT 91 Day 10dp Implied Strike, x; TLT Spot Price, x", "y": "TLT 91 Day 40dc Implied Strike, y" } }, "mode": "lines", "name": "TLT 91 Day 40dc Implied Strike", "type": "scatter", "xsrc": "volosplotly:244:3afc29", "ysrc": "volosplotly:244:598c3d", "xaxis": "x", "yaxis": "y", "hoverinfo": "x+y", "showlegend": "false" }, { "line": { "color": "#9467bd" }, "meta": { "columnNames": { "x": "TLT 91 Day 10dc Implied Strike, x; TLT 91 Day 20dc Implied Strike, x; TLT 91 Day 30dc Implied Strike, x; TLT 91 Day 40dc Implied Strike, x; TLT 91 Day 50dc Implied Strike, x; TLT 91 Day 50dp Implied Strike, x; TLT 91 Day 40dp Implied Strike, x; TLT 91 Day 30dp Implied Strike, x; TLT 91 Day 20dp Implied Strike, x; TLT 91 Day 10dp Implied Strike, x; TLT Spot Price, x", "y": "TLT 91 Day 50dc Implied Strike, y" } }, "mode": "lines", "name": "TLT 91 Day 50dc Implied Strike", "type": "scatter", "xsrc": "volosplotly:244:3afc29", "ysrc": "volosplotly:244:537165", "xaxis": "x", "yaxis": "y", "hoverinfo": "x+y", "showlegend": "false" }, { "line": { "color": "#8c564b" }, "meta": { "columnNames": { "x": "TLT 91 Day 10dc Implied Strike, x; TLT 91 Day 20dc Implied Strike, x; TLT 91 Day 30dc Implied Strike, x; TLT 91 Day 40dc Implied Strike, x; TLT 91 Day 50dc Implied Strike, x; TLT 91 Day 50dp Implied Strike, x; TLT 91 Day 40dp Implied Strike, x; TLT 91 Day 30dp Implied Strike, x; TLT 91 Day 20dp Implied Strike, x; TLT 91 Day 10dp Implied Strike, x; TLT Spot Price, x", "y": "TLT 91 Day 50dp Implied Strike, y" } }, "mode": "lines", "name": "TLT 91 Day 50dp Implied Strike", "type": "scatter", "xsrc": "volosplotly:244:3afc29", "ysrc": "volosplotly:244:71ab17", "xaxis": "x", "yaxis": "y", "hoverinfo": "x+y", "showlegend": "false" }, { "line": { "color": "#e377c2" }, "meta": { "columnNames": { "x": "TLT 91 Day 10dc Implied Strike, x; TLT 91 Day 20dc Implied Strike, x; TLT 91 Day 30dc Implied Strike, x; TLT 91 Day 40dc Implied Strike, x; TLT 91 Day 50dc Implied Strike, x; TLT 91 Day 50dp Implied Strike, x; TLT 91 Day 40dp Implied Strike, x; TLT 91 Day 30dp Implied Strike, x; TLT 91 Day 20dp Implied Strike, x; TLT 91 Day 10dp Implied Strike, x; TLT Spot Price, x", "y": "TLT 91 Day 40dp Implied Strike, y" } }, "mode": "lines", "name": "TLT 91 Day 40dp Implied Strike", "type": "scatter", "xsrc": "volosplotly:244:3afc29", "ysrc": "volosplotly:244:918c29", "xaxis": "x", "yaxis": "y", "hoverinfo": "x+y", "showlegend": "false" }, { "line": { "color": "#7f7f7f" }, "meta": { "columnNames": { "x": "TLT 91 Day 10dc Implied Strike, x; TLT 91 Day 20dc Implied Strike, x; TLT 91 Day 30dc Implied Strike, x; TLT 91 Day 40dc Implied Strike, x; TLT 91 Day 50dc Implied Strike, x; TLT 91 Day 50dp Implied Strike, x; TLT 91 Day 40dp Implied Strike, x; TLT 91 Day 30dp Implied Strike, x; TLT 91 Day 20dp Implied Strike, x; TLT 91 Day 10dp Implied Strike, x; TLT Spot Price, x", "y": "TLT 91 Day 30dp Implied Strike, y" } }, "mode": "lines", "name": "TLT 91 Day 30dp Implied Strike", "type": "scatter", "xsrc": "volosplotly:244:3afc29", "ysrc": "volosplotly:244:5fc0b7", "xaxis": "x", "yaxis": "y", "hoverinfo": "x+y", "showlegend": "false" }, { "line": { "color": "#bcbd22" }, "meta": { "columnNames": { "x": "TLT 91 Day 10dc Implied Strike, x; TLT 91 Day 20dc Implied Strike, x; TLT 91 Day 30dc Implied Strike, x; TLT 91 Day 40dc Implied Strike, x; TLT 91 Day 50dc Implied Strike, x; TLT 91 Day 50dp Implied Strike, x; TLT 91 Day 40dp Implied Strike, x; TLT 91 Day 30dp Implied Strike, x; TLT 91 Day 20dp Implied Strike, x; TLT 91 Day 10dp Implied Strike, x; TLT Spot Price, x", "y": "TLT 91 Day 20dp Implied Strike, y" } }, "mode": "lines", "name": "TLT 91 Day 20dp Implied Strike", "type": "scatter", "xsrc": "volosplotly:244:3afc29", "ysrc": "volosplotly:244:970420", "xaxis": "x", "yaxis": "y", "hoverinfo": "x+y", "showlegend": "false" }, { "line": { "color": "#17becf" }, "meta": { "columnNames": { "x": "TLT 91 Day 10dc Implied Strike, x; TLT 91 Day 20dc Implied Strike, x; TLT 91 Day 30dc Implied Strike, x; TLT 91 Day 40dc Implied Strike, x; TLT 91 Day 50dc Implied Strike, x; TLT 91 Day 50dp Implied Strike, x; TLT 91 Day 40dp Implied Strike, x; TLT 91 Day 30dp Implied Strike, x; TLT 91 Day 20dp Implied Strike, x; TLT 91 Day 10dp Implied Strike, x; TLT Spot Price, x", "y": "TLT 91 Day 10dp Implied Strike, y" } }, "mode": "lines", "name": "TLT 91 Day 10dp Implied Strike", "type": "scatter", "xsrc": "volosplotly:244:3afc29", "ysrc": "volosplotly:244:2238a6", "xaxis": "x", "yaxis": "y", "hoverinfo": "x+y", "showlegend": "false" }, { "line": { "color": "#1f77b4" }, "meta": { "columnNames": { "x": "TLT 91 Day 10dc Implied Strike, x; TLT 91 Day 20dc Implied Strike, x; TLT 91 Day 30dc Implied Strike, x; TLT 91 Day 40dc Implied Strike, x; TLT 91 Day 50dc Implied Strike, x; TLT 91 Day 50dp Implied Strike, x; TLT 91 Day 40dp Implied Strike, x; TLT 91 Day 30dp Implied Strike, x; TLT 91 Day 20dp Implied Strike, x; TLT 91 Day 10dp Implied Strike, x; TLT Spot Price, x", "y": "TLT Spot Price, y" } }, "mode": "lines", "name": "TLT Spot Price", "type": "scatter", "xsrc": "volosplotly:244:3afc29", "ysrc": "volosplotly:244:1c0716", "xaxis": "x", "yaxis": "y", "hoverinfo": "x+y", "showlegend": "false" } ], "frames": [], "layout": { "font": { "color": "black" }, "title": { "font": { "size": 24, "color": "black" } }, "xaxis": { "type": "date", "range": [ "2016-01-04", "2027-04-17 22:31:25.5055" ], "autorange": false }, "yaxis": { "type": "linear", "range": [ 60.29742685953776, 260.2000249226888 ], "title": { "text": "" }, "autorange": true }, "legend": { "orientation": "h" }, "margin": { "b": 30, "l": 100, "r": 50, "t": 0, "pad": 0 }, "yaxis2": { "side": "right", "title": { "text": "" }, "overlaying": "y" }, "autosize": true, "showlegend": true, "plot_bgcolor": "white", "paper_bgcolor": "white" } }, "height": null, "width": null, "user": { "profile_url": "https://chart-studio.plotly.com/~volosplotly", "avatar_url": "https://storage.googleapis.com/plotly-prod-profiles/13.jpg", "background_url": "https://storage.googleapis.com/plotly-prod-profiles/bg-8.jpg", "bio": "", "nickname": "", "website": "", "stream_tokens": null, "feature_set_id": null, "csrf_token": null, "date_joined": "2017-07-15 02:05:50", "mapbox_access_tokens": null, "has_password": null, "username": "volosplotly", "email": null, "is_active": null, "readonly": null, "is_dash_creator": null, "dash_created_count": null, "is_chart_creator": null, "charts_created_count": null } }, { "creation_time": "2024-04-23T17:06:54.138847Z", "comments": { "results": [], "count": 0 }, "parented": true, "embed_url": "https://chart-studio.plotly.com/~melanie.gilbert/297.embed", "fid": "melanie.gilbert:297", "filename": "CI vs NH Music Training v04", "filetype": "plot", "img_url": "https://storage.googleapis.com/plotly-prod-images/melanie.gilbert/297/9_MRAIQCE2YQJ71054BROSFP04Y0NA8N.png", "image_urls": { "default": "https://storage.googleapis.com/plotly-prod-images/melanie.gilbert/297/2_UM6AL641KCV97B76RQLPF536JDCEHJ.png", "block-thumb": "https://storage.googleapis.com/plotly-prod-images/melanie.gilbert/297/8_A2Q7HMP4C1WKPXY9G5ZO5A0N5XAAAO.png", "list-thumb": "https://storage.googleapis.com/plotly-prod-images/melanie.gilbert/297/9_MRAIQCE2YQJ71054BROSFP04Y0NA8N.png" }, "api_urls": { "files": "https://api.plotly.com/v2/files/melanie.gilbert:297", "plots": "https://api.plotly.com/v2/plots/melanie.gilbert:297", "parent": "https://api.plotly.com/v2/folders/home?user=melanie.gilbert" }, "owner": "melanie.gilbert", "parent": -1, "preview": "", "referencers": [], "references": [], "title": "", "views": 2, "web_url": "https://chart-studio.plotly.com/~melanie.gilbert/297/", "world_readable": true, "date_modified": "2024-05-01T20:41:05.853Z", "stars": { "results": [], "count": 0 }, "collaborators": { "results": [], "count": 0 }, "subfolder_count": null, "refresh_interval": null, "organize_view_url": "https://chart-studio.plotly.com/~melanie.gilbert/297/", "current_user_permission": "read", "is_theme": null, "is_template": false, "autosize": false, "caption": "", "figure": { "data": [ { "uid": "90e618", "meta": { "columnNames": { "x": "YrsMusicalTraining", "y": "Slope" } }, "mode": "markers", "name": "NH", "type": "scatter", "xsrc": "melanie.gilbert:294:187acb", "ysrc": "melanie.gilbert:294:11d68a", "width": 1, "marker": { "line": { "color": "rgb(0, 0, 0)", "width": 1 }, "size": 8, "color": "rgba(0, 0, 0, 0.7)", "symbol": "circle" }, "opacity": 1, "showlegend": true, "stackgroup": "", "transforms": [ { "meta": { "columnNames": { "target": "NH or CI" } }, "type": "filter", "value": "NH", "targetsrc": "melanie.gilbert:294:d58ab8" } ] }, { "uid": "d655a8", "meta": { "columnNames": { "x": "YrsMusicalTraining", "y": "Slope" } }, "mode": "none", "type": "scatter", "xsrc": "melanie.gilbert:296:0f24e4", "ysrc": "melanie.gilbert:296:4d6f7a", "width": 1, "marker": { "line": { "width": 1 }, "size": 8 }, "showlegend": false, "stackgroup": null }, { "uid": "d2181a", "meta": { "columnNames": { "x": "YrsMusicalTraining", "y": "Slope" } }, "mode": "markers", "name": "CI", "type": "scatter", "xsrc": "melanie.gilbert:294:187acb", "ysrc": "melanie.gilbert:294:11d68a", "width": 1, "marker": { "line": { "color": "rgb(0, 0, 0)", "width": 1 }, "size": 8, "color": "rgba(0, 0, 0, 0.3)", "symbol": "square" }, "opacity": 1, "showlegend": true, "stackgroup": "", "transforms": [ { "meta": { "columnNames": { "target": "NH or CI" } }, "type": "filter", "value": "CI", "targetsrc": "melanie.gilbert:294:d58ab8" } ] }, { "uid": "e669d6", "meta": { "columnNames": { "x": "YrsMusicalTraining", "y": "Slope" } }, "mode": "none", "type": "scatter", "xsrc": "melanie.gilbert:295:802217", "ysrc": "melanie.gilbert:295:038337", "width": 1, "marker": { "line": { "width": 1 }, "size": 8 }, "showlegend": false, "stackgroup": null }, { "uid": "0e5e90", "line": { "color": "rgba(0, 0, 0, 0.7)" }, "name": "Fit of NH", "width": 1, "opacity": 1, "showlegend": false, "transforms": [ { "rms": "", "type": "fit", "inputUid": "d655a8", "regressor": "x", "parameters": [ { "hold": false, "name": "m", "error": 0.013174745305908866, "value": 0.023971706723451388 }, { "hold": false, "name": "b", "error": 0.11174288983832974, "value": 0.5291550045634644 } ], "regressand": "y", "correlation": "", "fitfunction": "m*x + b", "inputxrange": [], "outputxrange": [], "interpolation": 50 } ] }, { "uid": "e7451e", "line": { "dash": "solid", "color": "rgba(0, 0, 0, 0.3)" }, "name": "Fit of CI", "width": 1, "opacity": 1, "showlegend": false, "transforms": [ { "rms": "", "type": "fit", "inputUid": "e669d6", "regressor": "x", "parameters": [ { "hold": false, "name": "m", "error": 0.0038615412593396535, "value": 0.007747851909915903 }, { "hold": false, "name": "b", "error": 0.06002915750700402, "value": 0.11094242364858818 } ], "regressand": "y", "correlation": "", "fitfunction": "m*x + b", "inputxrange": [], "outputxrange": [], "interpolation": 50 } ] }, { "line": { "color": "rgb(0, 0, 0)" }, "meta": { "columnNames": { "y": "Slope" } }, "mode": "markers", "name": "NH<br>Mus.", "type": "box", "ysrc": "melanie.gilbert:296:4d6f7a", "width": 0.5, "xaxis": "x2", "jitter": 0.56, "marker": { "line": { "color": "rgb(0, 0, 0)", "width": 2 }, "size": 8, "color": "rgba(0, 0, 0, 0.7)", "symbol": "circle" }, "boxmean": true, "hoveron": "points+fills", "pointpos": -1.7, "boxpoints": false, "fillcolor": "rgba(0, 0, 0, 0.7)", "showlegend": false, "stackgroup": null, "transforms": [ { "meta": { "columnNames": { "target": "YrsMusicalTraining" } }, "type": "filter", "value": "7", "operation": ">=", "targetsrc": "melanie.gilbert:296:0f24e4" } ], "whiskerwidth": 0.5 }, { "line": { "color": "rgb(0, 0, 0)" }, "meta": { "columnNames": { "y": "Slope" } }, "name": "NH<br>Non-<br>\nMus.", "type": "box", "ysrc": "melanie.gilbert:296:4d6f7a", "width": 0.5, "xaxis": "x2", "jitter": 0.56, "marker": { "line": { "color": "rgb(0, 0, 0)", "width": 2 }, "size": 8, "color": "rgba(0, 0, 0, 0.7)", "symbol": "circle" }, "boxmean": true, "hoveron": "points+fills", "pointpos": -1.6, "boxpoints": false, "fillcolor": "rgba(0, 0, 0, 0.7)", "showlegend": false, "transforms": [ { "meta": { "columnNames": { "target": "YrsMusicalTraining" } }, "type": "filter", "value": "7", "operation": "<", "targetsrc": "melanie.gilbert:296:0f24e4" } ], "whiskerwidth": 0.5 }, { "line": { "color": "rgb(0, 0, 0)" }, "meta": { "columnNames": { "y": "Slope" } }, "name": "CI<br>Mus.", "type": "box", "ysrc": "melanie.gilbert:295:038337", "width": 0.5, "xaxis": "x2", "jitter": 0.56, "marker": { "line": { "color": "rgb(0, 0, 0)", "width": 2 }, "size": 8, "color": "rgba(0, 0, 0, 0.3)", "symbol": "square" }, "boxmean": true, "hoveron": "points+fills", "pointpos": -1.7, "boxpoints": false, "fillcolor": "rgba(0, 0, 0, 0.3)", "showlegend": false, "transforms": [ { "meta": { "columnNames": { "target": "YrsMusicalTraining" } }, "type": "filter", "value": "7", "operation": ">=", "targetsrc": "melanie.gilbert:295:802217" } ], "whiskerwidth": 0.5 }, { "line": { "color": "rgb(0, 0, 0)" }, "meta": { "columnNames": { "y": "Slope" } }, "name": "CI<br>Non-<br>\nMus.", "type": "box", "ysrc": "melanie.gilbert:295:038337", "width": 0.5, "xaxis": "x2", "jitter": 0.56, "marker": { "line": { "color": "rgb(0, 0, 0)", "width": 2 }, "size": 8, "color": "rgba(0, 0, 0, 0.3)", "symbol": "square" }, "boxmean": true, "hoveron": "points+fills", "pointpos": -1.7, "boxpoints": false, "fillcolor": "rgba(0, 0, 0, 0.3)", "showlegend": false, "transforms": [ { "meta": { "columnNames": { "target": "YrsMusicalTraining" } }, "type": "filter", "value": "7", "operation": "<", "targetsrc": "melanie.gilbert:295:802217" } ], "orientation": "v", "whiskerwidth": 0.5 } ], "frames": [], "layout": { "font": { "size": 20, "color": "rgb(0, 0, 0)", "family": "Arial" }, "title": { "font": { "size": 26 } }, "width": 700, "xaxis": { "type": "linear", "range": [ -0.7014204086551681, 15.481088867672273 ], "ticks": "", "title": { "font": { "size": 20 }, "text": "Formal Music Training (years)" }, "domain": [ 0, 0.5 ], "showline": false, "tickfont": { "size": 20 }, "tickmode": "auto", "autorange": false, "automargin": false }, "yaxis": { "type": "linear", "range": [ -0.2260460926961425, 1.248678772814114 ], "title": { "font": { "size": 20 }, "text": "Slope" }, "anchor": "x", "domain": [ 0, 1 ], "tickfont": { "size": 20 }, "autorange": false }, "boxgap": 0.5, "height": 401, "legend": { "x": 0.27600000000000025, "y": 0.9888272290048095, "font": { "size": 20 }, "xanchor": "left", "yanchor": "top", "itemsizing": "constant", "borderwidth": 1, "orientation": "h" }, "margin": { "b": 77, "l": 65, "r": 10, "t": 0, "pad": 3 }, "xaxis2": { "side": "bottom", "type": "category", "range": [ -0.3145419880291209, 3.326364060379561 ], "ticks": "", "title": { "font": { "size": 20 }, "text": "<br>" }, "domain": [ 0.55, 1 ], "tickfont": { "size": 20 }, "autorange": false, "tickangle": "auto", "automargin": false, "overlaying": false, "showticklabels": true }, "boxmode": "overlay", "autosize": false, "annotations": [ { "x": 13.64604368878206, "y": 0.7347371571837895, "ax": 157, "ay": -73, "text": "NH<br>r<sup>2</sup> = 0.26", "showarrow": false }, { "x": 13.602890330711855, "y": 0.09505355963834049, "text": "CI<br>r<sup>2</sup> = 0.34", "showarrow": false } ], "boxgroupgap": 0 } }, "height": 401, "width": 700, "user": { "profile_url": "https://chart-studio.plotly.com/~melanie.gilbert", "avatar_url": "https://storage.googleapis.com/plotly-prod-profiles/97.jpg", "background_url": "https://storage.googleapis.com/plotly-prod-profiles/bg-11.jpg", "bio": "", "nickname": "", "website": "", "stream_tokens": null, "feature_set_id": null, "csrf_token": null, "date_joined": "2019-07-05 18:03:59", "mapbox_access_tokens": null, "has_password": null, "username": "melanie.gilbert", "email": null, "is_active": null, "readonly": null, "is_dash_creator": null, "dash_created_count": null, "is_chart_creator": null, "charts_created_count": null } }, { "creation_time": "2024-04-23T16:51:12.913207Z", "comments": { "results": [], "count": 0 }, "parented": true, "embed_url": "https://chart-studio.plotly.com/~NaHoi/1.embed", "fid": "NaHoi:1", "filename": "Plot 1", "filetype": "plot", "img_url": "https://storage.googleapis.com/plotly-prod-images/NaHoi/1/9_FC5DRZSIA74IELG0TDKEPNJPN10YK2.png", "image_urls": { "default": "https://storage.googleapis.com/plotly-prod-images/NaHoi/1/2_WE89XWB1ZZ3CMBYH4TWCYIKKA29EK0.png", "block-thumb": "https://storage.googleapis.com/plotly-prod-images/NaHoi/1/8_IRWI7N1HETZ89NVIJ6X0R6T7WWL4TG.png", "list-thumb": "https://storage.googleapis.com/plotly-prod-images/NaHoi/1/9_FC5DRZSIA74IELG0TDKEPNJPN10YK2.png" }, "api_urls": { "files": "https://api.plotly.com/v2/files/NaHoi:1", "plots": "https://api.plotly.com/v2/plots/NaHoi:1", "parent": "https://api.plotly.com/v2/folders/home?user=NaHoi" }, "owner": "NaHoi", "parent": -1, "preview": "", "referencers": [], "references": [], "title": "", "views": 1, "web_url": "https://chart-studio.plotly.com/~NaHoi/1/", "world_readable": true, "date_modified": "2024-04-23T16:51:41.149Z", "stars": { "results": [], "count": 0 }, "collaborators": { "results": [], "count": 0 }, "subfolder_count": null, "refresh_interval": null, "organize_view_url": "https://chart-studio.plotly.com/~NaHoi/1/", "current_user_permission": "read", "is_theme": null, "is_template": true, "autosize": true, "caption": "", "figure": { "data": [ { "meta": { "columnNames": { "x": "A", "y": "B" } }, "mode": "lines", "type": "scatter", "xsrc": "NaHoi:0:4c01e9", "ysrc": "NaHoi:0:7a5cec" } ], "frames": [], "layout": { "xaxis": { "type": "linear", "range": [ 0, 3569 ], "title": { "text": "Click to enter X axis title" }, "autorange": true }, "yaxis": { "type": "linear", "range": [ -0.07222222222222223, 1.3722222222222222 ], "autorange": true }, "autosize": true, "dragmode": "pan", "template": { "data": { "bar": [ { "type": "bar", "marker": { "colorbar": { "ticks": "", "outlinewidth": 0 } } } ], "table": [ { "type": "table", "cells": { "fill": { "color": "#EBF0F8" }, "line": { "color": "white" } }, "header": { "fill": { "color": "#C8D4E3" }, "line": { "color": "white" } } } ], "carpet": [ { "type": "carpet", "aaxis": { "gridcolor": "#C8D4E3", "linecolor": "#C8D4E3", "endlinecolor": "#2a3f5f", "minorgridcolor": "#C8D4E3", "startlinecolor": "#2a3f5f" }, "baxis": { "gridcolor": "#C8D4E3", "linecolor": "#C8D4E3", "endlinecolor": "#2a3f5f", "minorgridcolor": "#C8D4E3", "startlinecolor": "#2a3f5f" } } ], "mesh3d": [ { "type": "mesh3d", "colorbar": { "ticks": "", "outlinewidth": 0 } } ], "contour": [ { "type": "contour", "colorbar": { "ticks": "", "outlinewidth": 0 }, "autocolorscale": true } ], "heatmap": [ { "type": "heatmap", "colorbar": { "ticks": "", "outlinewidth": 0 }, "autocolorscale": true } ], "scatter": [ { "type": "scatter", "marker": { "colorbar": { "ticks": "", "outlinewidth": 0 } } } ], "surface": [ { "type": "surface", "colorbar": { "ticks": "", "outlinewidth": 0 } } ], "heatmapgl": [ { "type": "heatmapgl", "colorbar": { "ticks": "", "outlinewidth": 0 } } ], "histogram": [ { "type": "histogram", "marker": { "colorbar": { "ticks": "", "outlinewidth": 0 } } } ], "parcoords": [ { "line": { "colorbar": { "ticks": "", "outlinewidth": 0 } }, "type": "parcoords" } ], "scatter3d": [ { "type": "scatter3d", "marker": { "colorbar": { "ticks": "", "outlinewidth": 0 } } } ], "scattergl": [ { "type": "scattergl", "marker": { "colorbar": { "ticks": "", "outlinewidth": 0 } } } ], "choropleth": [ { "type": "choropleth", "colorbar": { "ticks": "", "outlinewidth": 0 } } ], "scattergeo": [ { "type": "scattergeo", "marker": { "colorbar": { "ticks": "", "outlinewidth": 0 } } } ], "histogram2d": [ { "type": "histogram2d", "colorbar": { "ticks": "", "outlinewidth": 0 }, "autocolorscale": true } ], "scatterpolar": [ { "type": "scatterpolar", "marker": { "colorbar": { "ticks": "", "outlinewidth": 0 } } } ], "contourcarpet": [ { "type": "contourcarpet", "colorbar": { "ticks": "", "outlinewidth": 0 } } ], "scattercarpet": [ { "type": "scattercarpet", "marker": { "colorbar": { "ticks": "", "outlinewidth": 0 } } } ], "scattermapbox": [ { "type": "scattermapbox", "marker": { "colorbar": { "ticks": "", "outlinewidth": 0 } } } ], "scatterpolargl": [ { "type": "scatterpolargl", "marker": { "colorbar": { "ticks": "", "outlinewidth": 0 } } } ], "scatterternary": [ { "type": "scatterternary", "marker": { "colorbar": { "ticks": "", "outlinewidth": 0 } } } ], "histogram2dcontour": [ { "type": "histogram2dcontour", "colorbar": { "ticks": "", "outlinewidth": 0 }, "autocolorscale": true } ] }, "layout": { "geo": { "bgcolor": "white", "showland": true, "lakecolor": "white", "landcolor": "white", "showlakes": true, "subunitcolor": "#C8D4E3" }, "font": { "color": "#2a3f5f" }, "polar": { "bgcolor": "white", "radialaxis": { "ticks": "", "gridcolor": "#EBF0F8", "linecolor": "#EBF0F8" }, "angularaxis": { "ticks": "", "gridcolor": "#EBF0F8", "linecolor": "#EBF0F8" } }, "scene": { "xaxis": { "ticks": "", "gridcolor": "#DFE8F3", "gridwidth": 2, "linecolor": "#EBF0F8", "zerolinecolor": "#EBF0F8", "showbackground": true, "backgroundcolor": "white" }, "yaxis": { "ticks": "", "gridcolor": "#DFE8F3", "gridwidth": 2, "linecolor": "#EBF0F8", "zerolinecolor": "#EBF0F8", "showbackground": true, "backgroundcolor": "white" }, "zaxis": { "ticks": "", "gridcolor": "#DFE8F3", "gridwidth": 2, "linecolor": "#EBF0F8", "zerolinecolor": "#EBF0F8", "showbackground": true, "backgroundcolor": "white" } }, "title": { "x": 0.05 }, "xaxis": { "ticks": "", "gridcolor": "#EBF0F8", "linecolor": "#EBF0F8", "automargin": true, "zerolinecolor": "#EBF0F8", "zerolinewidth": 2 }, "yaxis": { "ticks": "", "gridcolor": "#EBF0F8", "linecolor": "#EBF0F8", "automargin": true, "zerolinecolor": "#EBF0F8", "zerolinewidth": 2 }, "ternary": { "aaxis": { "ticks": "", "gridcolor": "#DFE8F3", "linecolor": "#A2B1C6" }, "baxis": { "ticks": "", "gridcolor": "#DFE8F3", "linecolor": "#A2B1C6" }, "caxis": { "ticks": "", "gridcolor": "#DFE8F3", "linecolor": "#A2B1C6" }, "bgcolor": "white" }, "colorway": [ "#636efa", "#EF553B", "#00cc96", "#ab63fa", "#19d3f3", "#e763fa", "#fecb52", "#ffa15a", "#ff6692", "#b6e880" ], "hovermode": "closest", "colorscale": { "diverging": [ [ 0, "#8e0152" ], [ 0.1, "#c51b7d" ], [ 0.2, "#de77ae" ], [ 0.3, "#f1b6da" ], [ 0.4, "#fde0ef" ], [ 0.5, "#f7f7f7" ], [ 0.6, "#e6f5d0" ], [ 0.7, "#b8e186" ], [ 0.8, "#7fbc41" ], [ 0.9, "#4d9221" ], [ 1, "#276419" ] ], "sequential": [ [ 0, "#0508b8" ], [ 0.0893854748603352, "#1910d8" ], [ 0.1787709497206704, "#3c19f0" ], [ 0.2681564245810056, "#6b1cfb" ], [ 0.3575418994413408, "#981cfd" ], [ 0.44692737430167595, "#bf1cfd" ], [ 0.5363128491620112, "#dd2bfd" ], [ 0.6256983240223464, "#f246fe" ], [ 0.7150837988826816, "#fc67fd" ], [ 0.8044692737430168, "#fe88fc" ], [ 0.8938547486033519, "#fea5fd" ], [ 0.9832402234636871, "#febefe" ], [ 1, "#fec3fe" ] ], "sequentialminus": [ [ 0, "#0508b8" ], [ 0.0893854748603352, "#1910d8" ], [ 0.1787709497206704, "#3c19f0" ], [ 0.2681564245810056, "#6b1cfb" ], [ 0.3575418994413408, "#981cfd" ], [ 0.44692737430167595, "#bf1cfd" ], [ 0.5363128491620112, "#dd2bfd" ], [ 0.6256983240223464, "#f246fe" ], [ 0.7150837988826816, "#fc67fd" ], [ 0.8044692737430168, "#fe88fc" ], [ 0.8938547486033519, "#fea5fd" ], [ 0.9832402234636871, "#febefe" ], [ 1, "#fec3fe" ] ] }, "plot_bgcolor": "white", "paper_bgcolor": "white", "shapedefaults": { "line": { "width": 0 }, "opacity": 0.4, "fillcolor": "#506784" }, "annotationdefaults": { "arrowhead": 0, "arrowcolor": "#506784", "arrowwidth": 1 } }, "themeRef": "PLOTLY_WHITE" }, "hovermode": "x" } }, "height": null, "width": null, "user": { "profile_url": "https://chart-studio.plotly.com/~NaHoi", "avatar_url": "https://storage.googleapis.com/plotly-prod-profiles/67.jpg", "background_url": "https://storage.googleapis.com/plotly-prod-profiles/bg-2.jpg", "bio": "", "nickname": "", "website": "", "stream_tokens": null, "feature_set_id": null, "csrf_token": null, "date_joined": "2024-04-23 16:50:17", "mapbox_access_tokens": null, "has_password": null, "username": "NaHoi", "email": null, "is_active": null, "readonly": null, "is_dash_creator": null, "dash_created_count": null, "is_chart_creator": null, "charts_created_count": null } }, { "creation_time": "2024-04-23T16:39:30.631726Z", "comments": { "results": [], "count": 0 }, "parented": true, "embed_url": "https://chart-studio.plotly.com/~hinojosa.silvia/73.embed", "fid": "hinojosa.silvia:73", "filename": "Plot 73", "filetype": "plot", "img_url": "https://storage.googleapis.com/plotly-prod-images/hinojosa.silvia/73/9_4G6R6ZR9VX9UQG2L4IVSB11K1OUV1C.png", "image_urls": { "default": "https://storage.googleapis.com/plotly-prod-images/hinojosa.silvia/73/2_1SO90S3UGL978ALPQYXI70BR1184SH.png", "block-thumb": "https://storage.googleapis.com/plotly-prod-images/hinojosa.silvia/73/8_NDCRN3LZ0JW8D7SQ162JRMBHW7UXYB.png", "list-thumb": "https://storage.googleapis.com/plotly-prod-images/hinojosa.silvia/73/9_4G6R6ZR9VX9UQG2L4IVSB11K1OUV1C.png" }, "api_urls": { "files": "https://api.plotly.com/v2/files/hinojosa.silvia:73", "plots": "https://api.plotly.com/v2/plots/hinojosa.silvia:73", "parent": "https://api.plotly.com/v2/folders/home?user=hinojosa.silvia" }, "owner": "hinojosa.silvia", "parent": -1, "preview": "", "referencers": [], "references": [], "title": "", "views": 1, "web_url": "https://chart-studio.plotly.com/~hinojosa.silvia/73/", "world_readable": true, "date_modified": "2024-04-23T16:45:16.938Z", "stars": { "results": [], "count": 0 }, "collaborators": { "results": [], "count": 0 }, "subfolder_count": null, "refresh_interval": null, "organize_view_url": "https://chart-studio.plotly.com/~hinojosa.silvia/73/", "current_user_permission": "read", "is_theme": null, "is_template": false, "autosize": true, "caption": "", "figure": { "data": [ { "line": { "color": "rgb(92, 238, 255)" }, "meta": { "columnNames": { "x": "Sample", "y": "ATRX", "text": "Sample", "labels": "Sample", "marker": { "color": "ATRX" }, "values": "ATRX" } }, "mode": "lines", "type": "scatter", "xsrc": "hinojosa.silvia:72:a25ec5", "ysrc": "hinojosa.silvia:72:dbbdc5", "marker": { "meta": { "columnNames": { "color": "ATRX" } }, "cauto": true, "colorsrc": "hinojosa.silvia:72:dbbdc5", "showscale": true, "colorscale": [ [ 0, "#9e0142" ], [ 0.1, "#d53e4f" ], [ 0.2, "#f46d43" ], [ 0.3, "#fdae61" ], [ 0.4, "#fee08b" ], [ 0.5, "#ffffbf" ], [ 0.6, "#e6f598" ], [ 0.7, "#abdda4" ], [ 0.8, "#66c2a5" ], [ 0.9, "#3288bd" ], [ 1, "#5e4fa2" ] ], "reversescale": false }, "hoveron": "fills", "textsrc": "hinojosa.silvia:72:a25ec5", "bandwidth": 0, "fillcolor": "rgba(64, 152, 229, 0.5)", "labelssrc": "hinojosa.silvia:72:a25ec5", "valuessrc": "hinojosa.silvia:72:dbbdc5", "stackgroup": 1, "connectgaps": true, "orientation": "v", "textposition": "middle center", "autocolorscale": false } ], "frames": [], "layout": { "font": { "size": 15 }, "title": { "x": 0.02, "font": { "size": 18 }, "text": "ATRX" }, "xaxis": { "type": "category", "range": [ 0, 3 ], "showgrid": false, "tickfont": { "size": 17 }, "autorange": true, "exponentformat": "none", "showticklabels": true, "separatethousands": true }, "yaxis": { "type": "linear", "range": [ 0, 10108.863402105264 ], "showgrid": false, "autorange": true, "exponentformat": "none", "showticklabels": true, "separatethousands": true }, "bargap": 0.38, "barmode": "group", "barnorm": "", "autosize": true, "template": { "data": { "bar": [ { "type": "bar", "marker": { "colorbar": { "ticks": "", "outlinewidth": 0 } } } ], "table": [ { "type": "table", "cells": { "fill": { "color": "#EBF0F8" }, "line": { "color": "white" } }, "header": { "fill": { "color": "#C8D4E3" }, "line": { "color": "white" } } } ], "carpet": [ { "type": "carpet", "aaxis": { "gridcolor": "#C8D4E3", "linecolor": "#C8D4E3", "endlinecolor": "#2a3f5f", "minorgridcolor": "#C8D4E3", "startlinecolor": "#2a3f5f" }, "baxis": { "gridcolor": "#C8D4E3", "linecolor": "#C8D4E3", "endlinecolor": "#2a3f5f", "minorgridcolor": "#C8D4E3", "startlinecolor": "#2a3f5f" } } ], "mesh3d": [ { "type": "mesh3d", "colorbar": { "ticks": "", "outlinewidth": 0 } } ], "contour": [ { "type": "contour", "colorbar": { "ticks": "", "outlinewidth": 0 }, "autocolorscale": true } ], "heatmap": [ { "type": "heatmap", "colorbar": { "ticks": "", "outlinewidth": 0 }, "autocolorscale": true } ], "scatter": [ { "type": "scatter", "marker": { "colorbar": { "ticks": "", "outlinewidth": 0 } } } ], "surface": [ { "type": "surface", "colorbar": { "ticks": "", "outlinewidth": 0 } } ], "heatmapgl": [ { "type": "heatmapgl", "colorbar": { "ticks": "", "outlinewidth": 0 } } ], "histogram": [ { "type": "histogram", "marker": { "colorbar": { "ticks": "", "outlinewidth": 0 } } } ], "parcoords": [ { "line": { "colorbar": { "ticks": "", "outlinewidth": 0 } }, "type": "parcoords" } ], "scatter3d": [ { "type": "scatter3d", "marker": { "colorbar": { "ticks": "", "outlinewidth": 0 } } } ], "scattergl": [ { "type": "scattergl", "marker": { "colorbar": { "ticks": "", "outlinewidth": 0 } } } ], "choropleth": [ { "type": "choropleth", "colorbar": { "ticks": "", "outlinewidth": 0 } } ], "scattergeo": [ { "type": "scattergeo", "marker": { "colorbar": { "ticks": "", "outlinewidth": 0 } } } ], "histogram2d": [ { "type": "histogram2d", "colorbar": { "ticks": "", "outlinewidth": 0 }, "autocolorscale": true } ], "scatterpolar": [ { "type": "scatterpolar", "marker": { "colorbar": { "ticks": "", "outlinewidth": 0 } } } ], "contourcarpet": [ { "type": "contourcarpet", "colorbar": { "ticks": "", "outlinewidth": 0 } } ], "scattercarpet": [ { "type": "scattercarpet", "marker": { "colorbar": { "ticks": "", "outlinewidth": 0 } } } ], "scattermapbox": [ { "type": "scattermapbox", "marker": { "colorbar": { "ticks": "", "outlinewidth": 0 } } } ], "scatterpolargl": [ { "type": "scatterpolargl", "marker": { "colorbar": { "ticks": "", "outlinewidth": 0 } } } ], "scatterternary": [ { "type": "scatterternary", "marker": { "colorbar": { "ticks": "", "outlinewidth": 0 } } } ], "histogram2dcontour": [ { "type": "histogram2dcontour", "colorbar": { "ticks": "", "outlinewidth": 0 }, "autocolorscale": true } ] }, "layout": { "geo": { "bgcolor": "white", "showland": true, "lakecolor": "white", "landcolor": "white", "showlakes": true, "subunitcolor": "#C8D4E3" }, "font": { "color": "#2a3f5f" }, "polar": { "bgcolor": "white", "radialaxis": { "ticks": "", "gridcolor": "#EBF0F8", "linecolor": "#EBF0F8" }, "angularaxis": { "ticks": "", "gridcolor": "#EBF0F8", "linecolor": "#EBF0F8" } }, "scene": { "xaxis": { "ticks": "", "gridcolor": "#DFE8F3", "gridwidth": 2, "linecolor": "#EBF0F8", "zerolinecolor": "#EBF0F8", "showbackground": true, "backgroundcolor": "white" }, "yaxis": { "ticks": "", "gridcolor": "#DFE8F3", "gridwidth": 2, "linecolor": "#EBF0F8", "zerolinecolor": "#EBF0F8", "showbackground": true, "backgroundcolor": "white" }, "zaxis": { "ticks": "", "gridcolor": "#DFE8F3", "gridwidth": 2, "linecolor": "#EBF0F8", "zerolinecolor": "#EBF0F8", "showbackground": true, "backgroundcolor": "white" } }, "title": { "x": 0.05 }, "xaxis": { "ticks": "", "gridcolor": "#EBF0F8", "linecolor": "#EBF0F8", "automargin": true, "zerolinecolor": "#EBF0F8", "zerolinewidth": 2 }, "yaxis": { "ticks": "", "gridcolor": "#EBF0F8", "linecolor": "#EBF0F8", "automargin": true, "zerolinecolor": "#EBF0F8", "zerolinewidth": 2 }, "ternary": { "aaxis": { "ticks": "", "gridcolor": "#DFE8F3", "linecolor": "#A2B1C6" }, "baxis": { "ticks": "", "gridcolor": "#DFE8F3", "linecolor": "#A2B1C6" }, "caxis": { "ticks": "", "gridcolor": "#DFE8F3", "linecolor": "#A2B1C6" }, "bgcolor": "white" }, "colorway": [ "#636efa", "#EF553B", "#00cc96", "#ab63fa", "#19d3f3", "#e763fa", "#fecb52", "#ffa15a", "#ff6692", "#b6e880" ], "hovermode": "closest", "colorscale": { "diverging": [ [ 0, "#8e0152" ], [ 0.1, "#c51b7d" ], [ 0.2, "#de77ae" ], [ 0.3, "#f1b6da" ], [ 0.4, "#fde0ef" ], [ 0.5, "#f7f7f7" ], [ 0.6, "#e6f5d0" ], [ 0.7, "#b8e186" ], [ 0.8, "#7fbc41" ], [ 0.9, "#4d9221" ], [ 1, "#276419" ] ], "sequential": [ [ 0, "#0508b8" ], [ 0.0893854748603352, "#1910d8" ], [ 0.1787709497206704, "#3c19f0" ], [ 0.2681564245810056, "#6b1cfb" ], [ 0.3575418994413408, "#981cfd" ], [ 0.44692737430167595, "#bf1cfd" ], [ 0.5363128491620112, "#dd2bfd" ], [ 0.6256983240223464, "#f246fe" ], [ 0.7150837988826816, "#fc67fd" ], [ 0.8044692737430168, "#fe88fc" ], [ 0.8938547486033519, "#fea5fd" ], [ 0.9832402234636871, "#febefe" ], [ 1, "#fec3fe" ] ], "sequentialminus": [ [ 0, "#0508b8" ], [ 0.0893854748603352, "#1910d8" ], [ 0.1787709497206704, "#3c19f0" ], [ 0.2681564245810056, "#6b1cfb" ], [ 0.3575418994413408, "#981cfd" ], [ 0.44692737430167595, "#bf1cfd" ], [ 0.5363128491620112, "#dd2bfd" ], [ 0.6256983240223464, "#f246fe" ], [ 0.7150837988826816, "#fc67fd" ], [ 0.8044692737430168, "#fe88fc" ], [ 0.8938547486033519, "#fea5fd" ], [ 0.9832402234636871, "#febefe" ], [ 1, "#fec3fe" ] ] }, "plot_bgcolor": "white", "paper_bgcolor": "white", "shapedefaults": { "line": { "width": 0 }, "opacity": 0.4, "fillcolor": "#506784" }, "annotationdefaults": { "arrowhead": 0, "arrowcolor": "#506784", "arrowwidth": 1 } }, "themeRef": "PLOTLY_WHITE" }, "colorscale": { "diverging": [ [ 0, "#8e0152" ], [ 0.1, "#c51b7d" ], [ 0.2, "#de77ae" ], [ 0.3, "#f1b6da" ], [ 0.4, "#fde0ef" ], [ 0.5, "#f7f7f7" ], [ 0.6, "#e6f5d0" ], [ 0.7, "#b8e186" ], [ 0.8, "#7fbc41" ], [ 0.9, "#4d9221" ], [ 1, "#276419" ] ], "sequentialminus": [ [ 0, "#440154" ], [ 0.1111111111111111, "#482878" ], [ 0.2222222222222222, "#3e4989" ], [ 0.3333333333333333, "#31688e" ], [ 0.4444444444444444, "#26828e" ], [ 0.5555555555555556, "#1f9e89" ], [ 0.6666666666666666, "#35b779" ], [ 0.7777777777777778, "#6ece58" ], [ 0.8888888888888888, "#b5de2b" ], [ 1, "#fde725" ] ] }, "showlegend": false, "bargroupgap": 0.26 } }, "height": null, "width": null, "user": { "profile_url": "https://chart-studio.plotly.com/~hinojosa.silvia", "avatar_url": "https://storage.googleapis.com/plotly-prod-profiles/80.jpg", "background_url": "https://storage.googleapis.com/plotly-prod-profiles/bg-7.jpg", "bio": "", "nickname": "", "website": "", "stream_tokens": null, "feature_set_id": null, "csrf_token": null, "date_joined": "2021-11-19 20:54:03", "mapbox_access_tokens": null, "has_password": null, "username": "hinojosa.silvia", "email": null, "is_active": null, "readonly": null, "is_dash_creator": null, "dash_created_count": null, "is_chart_creator": null, "charts_created_count": null } }, { "creation_time": "2024-04-23T16:34:13.733290Z", "comments": { "results": [], "count": 0 }, "parented": true, "embed_url": "https://chart-studio.plotly.com/~jeonyl1009/5.embed", "fid": "jeonyl1009:5", "filename": "two_features_el_model_plot", "filetype": "plot", "img_url": "https://storage.googleapis.com/plotly-prod-images/jeonyl1009/5/9_YI45L9A511227C1MQ1WFHNQ8ASSBH8.png", "image_urls": { "default": "https://storage.googleapis.com/plotly-prod-images/jeonyl1009/5/2_DBZQQO4AEQ1MFZQRC5IE1LGBYRZJR5.png", "block-thumb": "https://storage.googleapis.com/plotly-prod-images/jeonyl1009/5/8_E1GL4BW6YJI5NA7TUUJA11N2CBHP3E.png", "list-thumb": "https://storage.googleapis.com/plotly-prod-images/jeonyl1009/5/9_YI45L9A511227C1MQ1WFHNQ8ASSBH8.png" }, "api_urls": { "files": "https://api.plotly.com/v2/files/jeonyl1009:5", "plots": "https://api.plotly.com/v2/plots/jeonyl1009:5", "parent": "https://api.plotly.com/v2/folders/home?user=jeonyl1009" }, "owner": "jeonyl1009", "parent": -1, "preview": "", "referencers": [], "references": [], "title": "", "views": 3, "web_url": "https://chart-studio.plotly.com/~jeonyl1009/5/", "world_readable": true, "date_modified": "2024-04-23T16:38:00.269Z", "stars": { "results": [], "count": 0 }, "collaborators": { "results": [], "count": 0 }, "subfolder_count": null, "refresh_interval": null, "organize_view_url": "https://chart-studio.plotly.com/~jeonyl1009/5/", "current_user_permission": "read", "is_theme": null, "is_template": null, "autosize": true, "caption": "", "figure": { "data": [ { "type": "surface", "xsrc": "jeonyl1009:11:1aa7da", "ysrc": "jeonyl1009:11:de42b5", "zsrc": "jeonyl1009:11:980812", "scene": "scene", "opacity": 0.8, "showscale": false, "colorscale": [ [ 0.0, "rgb(255,255,204)" ], [ 0.125, "rgb(255,237,160)" ], [ 0.25, "rgb(254,217,118)" ], [ 0.375, "rgb(254,178,76)" ], [ 0.5, "rgb(253,141,60)" ], [ 0.625, "rgb(252,78,42)" ], [ 0.75, "rgb(227,26,28)" ], [ 0.875, "rgb(189,0,38)" ], [ 1.0, "rgb(128,0,38)" ] ] }, { "mode": "markers", "type": "scatter3d", "xsrc": "jeonyl1009:11:2522db", "ysrc": "jeonyl1009:11:e92891", "zsrc": "jeonyl1009:11:89c4ef", "scene": "scene", "marker": { "size": 2, "color": "blue" } } ], "layout": { "scene": { "xaxis": { "title": { "text": "X1" } }, "yaxis": { "title": { "text": "X2" } }, "zaxis": { "title": { "text": "Predicted Y" } }, "domain": { "x": [ 0.0, 1.0 ], "y": [ 0.0, 1.0 ] } }, "title": { "text": "Linear Regression(e.g. Elastic-net)" }, "template": { "data": { "bar": [ { "type": "bar", "marker": { "line": { "color": "white", "width": 0.5 }, "pattern": { "size": 10, "fillmode": "overlay", "solidity": 0.2 } }, "error_x": { "color": "rgb(36,36,36)" }, "error_y": { "color": "rgb(36,36,36)" } } ], "pie": [ { "type": "pie", "automargin": true } ], "table": [ { "type": "table", "cells": { "fill": { "color": "rgb(237,237,237)" }, "line": { "color": "white" } }, "header": { "fill": { "color": "rgb(217,217,217)" }, "line": { "color": "white" } } } ], "carpet": [ { "type": "carpet", "aaxis": { "gridcolor": "white", "linecolor": "white", "endlinecolor": "rgb(36,36,36)", "minorgridcolor": "white", "startlinecolor": "rgb(36,36,36)" }, "baxis": { "gridcolor": "white", "linecolor": "white", "endlinecolor": "rgb(36,36,36)", "minorgridcolor": "white", "startlinecolor": "rgb(36,36,36)" } } ], "mesh3d": [ { "type": "mesh3d", "colorbar": { "ticks": "outside", "tickcolor": "rgb(36,36,36)", "outlinewidth": 1 } } ], "contour": [ { "type": "contour", "colorbar": { "ticks": "outside", "tickcolor": "rgb(36,36,36)", "outlinewidth": 1 }, "colorscale": [ [ 0.0, "#440154" ], [ 0.1111111111111111, "#482878" ], [ 0.2222222222222222, "#3e4989" ], [ 0.3333333333333333, "#31688e" ], [ 0.4444444444444444, "#26828e" ], [ 0.5555555555555556, "#1f9e89" ], [ 0.6666666666666666, "#35b779" ], [ 0.7777777777777778, "#6ece58" ], [ 0.8888888888888888, "#b5de2b" ], [ 1.0, "#fde725" ] ] } ], "heatmap": [ { "type": "heatmap", "colorbar": { "ticks": "outside", "tickcolor": "rgb(36,36,36)", "outlinewidth": 1 }, "colorscale": [ [ 0.0, "#440154" ], [ 0.1111111111111111, "#482878" ], [ 0.2222222222222222, "#3e4989" ], [ 0.3333333333333333, "#31688e" ], [ 0.4444444444444444, "#26828e" ], [ 0.5555555555555556, "#1f9e89" ], [ 0.6666666666666666, "#35b779" ], [ 0.7777777777777778, "#6ece58" ], [ 0.8888888888888888, "#b5de2b" ], [ 1.0, "#fde725" ] ] } ], "scatter": [ { "type": "scatter", "fillpattern": { "size": 10, "fillmode": "overlay", "solidity": 0.2 } } ], "surface": [ { "type": "surface", "colorbar": { "ticks": "outside", "tickcolor": "rgb(36,36,36)", "outlinewidth": 1 }, "colorscale": [ [ 0.0, "#440154" ], [ 0.1111111111111111, "#482878" ], [ 0.2222222222222222, "#3e4989" ], [ 0.3333333333333333, "#31688e" ], [ 0.4444444444444444, "#26828e" ], [ 0.5555555555555556, "#1f9e89" ], [ 0.6666666666666666, "#35b779" ], [ 0.7777777777777778, "#6ece58" ], [ 0.8888888888888888, "#b5de2b" ], [ 1.0, "#fde725" ] ] } ], "barpolar": [ { "type": "barpolar", "marker": { "line": { "color": "white", "width": 0.5 }, "pattern": { "size": 10, "fillmode": "overlay", "solidity": 0.2 } } } ], "heatmapgl": [ { "type": "heatmapgl", "colorbar": { "ticks": "outside", "tickcolor": "rgb(36,36,36)", "outlinewidth": 1 }, "colorscale": [ [ 0.0, "#440154" ], [ 0.1111111111111111, "#482878" ], [ 0.2222222222222222, "#3e4989" ], [ 0.3333333333333333, "#31688e" ], [ 0.4444444444444444, "#26828e" ], [ 0.5555555555555556, "#1f9e89" ], [ 0.6666666666666666, "#35b779" ], [ 0.7777777777777778, "#6ece58" ], [ 0.8888888888888888, "#b5de2b" ], [ 1.0, "#fde725" ] ] } ], "histogram": [ { "type": "histogram", "marker": { "line": { "color": "white", "width": 0.6 } } } ], "parcoords": [ { "line": { "colorbar": { "ticks": "outside", "tickcolor": "rgb(36,36,36)", "outlinewidth": 1 } }, "type": "parcoords" } ], "scatter3d": [ { "line": { "colorbar": { "ticks": "outside", "tickcolor": "rgb(36,36,36)", "outlinewidth": 1 } }, "type": "scatter3d", "marker": { "colorbar": { "ticks": "outside", "tickcolor": "rgb(36,36,36)", "outlinewidth": 1 } } } ], "scattergl": [ { "type": "scattergl", "marker": { "colorbar": { "ticks": "outside", "tickcolor": "rgb(36,36,36)", "outlinewidth": 1 } } } ], "choropleth": [ { "type": "choropleth", "colorbar": { "ticks": "outside", "tickcolor": "rgb(36,36,36)", "outlinewidth": 1 } } ], "scattergeo": [ { "type": "scattergeo", "marker": { "colorbar": { "ticks": "outside", "tickcolor": "rgb(36,36,36)", "outlinewidth": 1 } } } ], "histogram2d": [ { "type": "histogram2d", "colorbar": { "ticks": "outside", "tickcolor": "rgb(36,36,36)", "outlinewidth": 1 }, "colorscale": [ [ 0.0, "#440154" ], [ 0.1111111111111111, "#482878" ], [ 0.2222222222222222, "#3e4989" ], [ 0.3333333333333333, "#31688e" ], [ 0.4444444444444444, "#26828e" ], [ 0.5555555555555556, "#1f9e89" ], [ 0.6666666666666666, "#35b779" ], [ 0.7777777777777778, "#6ece58" ], [ 0.8888888888888888, "#b5de2b" ], [ 1.0, "#fde725" ] ] } ], "scatterpolar": [ { "type": "scatterpolar", "marker": { "colorbar": { "ticks": "outside", "tickcolor": "rgb(36,36,36)", "outlinewidth": 1 } } } ], "contourcarpet": [ { "type": "contourcarpet", "colorbar": { "ticks": "outside", "tickcolor": "rgb(36,36,36)", "outlinewidth": 1 } } ], "scattercarpet": [ { "type": "scattercarpet", "marker": { "colorbar": { "ticks": "outside", "tickcolor": "rgb(36,36,36)", "outlinewidth": 1 } } } ], "scattermapbox": [ { "type": "scattermapbox", "marker": { "colorbar": { "ticks": "outside", "tickcolor": "rgb(36,36,36)", "outlinewidth": 1 } } } ], "scatterpolargl": [ { "type": "scatterpolargl", "marker": { "colorbar": { "ticks": "outside", "tickcolor": "rgb(36,36,36)", "outlinewidth": 1 } } } ], "scatterternary": [ { "type": "scatterternary", "marker": { "colorbar": { "ticks": "outside", "tickcolor": "rgb(36,36,36)", "outlinewidth": 1 } } } ], "histogram2dcontour": [ { "type": "histogram2dcontour", "colorbar": { "ticks": "outside", "tickcolor": "rgb(36,36,36)", "outlinewidth": 1 }, "colorscale": [ [ 0.0, "#440154" ], [ 0.1111111111111111, "#482878" ], [ 0.2222222222222222, "#3e4989" ], [ 0.3333333333333333, "#31688e" ], [ 0.4444444444444444, "#26828e" ], [ 0.5555555555555556, "#1f9e89" ], [ 0.6666666666666666, "#35b779" ], [ 0.7777777777777778, "#6ece58" ], [ 0.8888888888888888, "#b5de2b" ], [ 1.0, "#fde725" ] ] } ] }, "layout": { "geo": { "bgcolor": "white", "showland": true, "lakecolor": "white", "landcolor": "white", "showlakes": true, "subunitcolor": "white" }, "font": { "color": "rgb(36,36,36)" }, "polar": { "bgcolor": "white", "radialaxis": { "ticks": "outside", "showgrid": false, "showline": true, "gridcolor": "rgb(232,232,232)", "linecolor": "rgb(36,36,36)" }, "angularaxis": { "ticks": "outside", "showgrid": false, "showline": true, "gridcolor": "rgb(232,232,232)", "linecolor": "rgb(36,36,36)" } }, "scene": { "xaxis": { "ticks": "outside", "showgrid": false, "showline": true, "zeroline": false, "gridcolor": "rgb(232,232,232)", "gridwidth": 2, "linecolor": "rgb(36,36,36)", "zerolinecolor": "rgb(36,36,36)", "showbackground": true, "backgroundcolor": "white" }, "yaxis": { "ticks": "outside", "showgrid": false, "showline": true, "zeroline": false, "gridcolor": "rgb(232,232,232)", "gridwidth": 2, "linecolor": "rgb(36,36,36)", "zerolinecolor": "rgb(36,36,36)", "showbackground": true, "backgroundcolor": "white" }, "zaxis": { "ticks": "outside", "showgrid": false, "showline": true, "zeroline": false, "gridcolor": "rgb(232,232,232)", "gridwidth": 2, "linecolor": "rgb(36,36,36)", "zerolinecolor": "rgb(36,36,36)", "showbackground": true, "backgroundcolor": "white" } }, "title": { "x": 0.05 }, "xaxis": { "ticks": "outside", "title": { "standoff": 15 }, "showgrid": false, "showline": true, "zeroline": false, "gridcolor": "rgb(232,232,232)", "linecolor": "rgb(36,36,36)", "automargin": true, "zerolinecolor": "rgb(36,36,36)" }, "yaxis": { "ticks": "outside", "title": { "standoff": 15 }, "showgrid": false, "showline": true, "zeroline": false, "gridcolor": "rgb(232,232,232)", "linecolor": "rgb(36,36,36)", "automargin": true, "zerolinecolor": "rgb(36,36,36)" }, "mapbox": { "style": "light" }, "ternary": { "aaxis": { "ticks": "outside", "showgrid": false, "showline": true, "gridcolor": "rgb(232,232,232)", "linecolor": "rgb(36,36,36)" }, "baxis": { "ticks": "outside", "showgrid": false, "showline": true, "gridcolor": "rgb(232,232,232)", "linecolor": "rgb(36,36,36)" }, "caxis": { "ticks": "outside", "showgrid": false, "showline": true, "gridcolor": "rgb(232,232,232)", "linecolor": "rgb(36,36,36)" }, "bgcolor": "white" }, "colorway": [ "#1F77B4", "#FF7F0E", "#2CA02C", "#D62728", "#9467BD", "#8C564B", "#E377C2", "#7F7F7F", "#BCBD22", "#17BECF" ], "coloraxis": { "colorbar": { "ticks": "outside", "tickcolor": "rgb(36,36,36)", "outlinewidth": 1 } }, "hovermode": "closest", "colorscale": { "diverging": [ [ 0.0, "rgb(103,0,31)" ], [ 0.1, "rgb(178,24,43)" ], [ 0.2, "rgb(214,96,77)" ], [ 0.3, "rgb(244,165,130)" ], [ 0.4, "rgb(253,219,199)" ], [ 0.5, "rgb(247,247,247)" ], [ 0.6, "rgb(209,229,240)" ], [ 0.7, "rgb(146,197,222)" ], [ 0.8, "rgb(67,147,195)" ], [ 0.9, "rgb(33,102,172)" ], [ 1.0, "rgb(5,48,97)" ] ], "sequential": [ [ 0.0, "#440154" ], [ 0.1111111111111111, "#482878" ], [ 0.2222222222222222, "#3e4989" ], [ 0.3333333333333333, "#31688e" ], [ 0.4444444444444444, "#26828e" ], [ 0.5555555555555556, "#1f9e89" ], [ 0.6666666666666666, "#35b779" ], [ 0.7777777777777778, "#6ece58" ], [ 0.8888888888888888, "#b5de2b" ], [ 1.0, "#fde725" ] ], "sequentialminus": [ [ 0.0, "#440154" ], [ 0.1111111111111111, "#482878" ], [ 0.2222222222222222, "#3e4989" ], [ 0.3333333333333333, "#31688e" ], [ 0.4444444444444444, "#26828e" ], [ 0.5555555555555556, "#1f9e89" ], [ 0.6666666666666666, "#35b779" ], [ 0.7777777777777778, "#6ece58" ], [ 0.8888888888888888, "#b5de2b" ], [ 1.0, "#fde725" ] ] }, "hoverlabel": { "align": "left" }, "plot_bgcolor": "white", "paper_bgcolor": "white", "shapedefaults": { "line": { "width": 0 }, "opacity": 0.3, "fillcolor": "black" }, "autotypenumbers": "strict", "annotationdefaults": { "arrowhead": 0, "arrowwidth": 1 } } }, "showlegend": false } }, "height": null, "width": null, "user": { "profile_url": "https://chart-studio.plotly.com/~jeonyl1009", "avatar_url": "https://storage.googleapis.com/plotly-prod-profiles/38.jpg", "background_url": "https://storage.googleapis.com/plotly-prod-profiles/bg-11.jpg", "bio": "", "nickname": "", "website": "", "stream_tokens": null, "feature_set_id": null, "csrf_token": null, "date_joined": "2024-04-23 16:31:18", "mapbox_access_tokens": null, "has_password": null, "username": "jeonyl1009", "email": null, "is_active": null, "readonly": null, "is_dash_creator": null, "dash_created_count": null, "is_chart_creator": null, "charts_created_count": null } } ] }
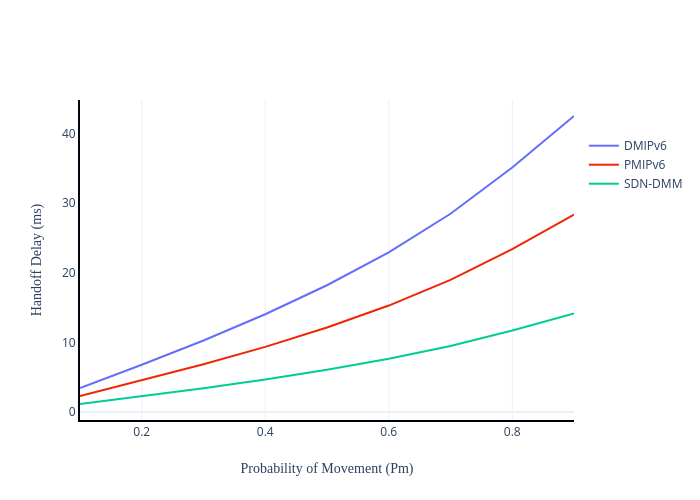