Plots


Jump to API response

This endpoint handles manipulation of Plotly plot files.

Reference

Authorization


Any user with or without a Plotly account may view public plots. For private plots, see authentication.

Actions


list

Listing all public plots can be done via a GET request to this endpoint. By default, plots will be listed in order of date created. The order_by query parameter is accepted at this endpoint. Currently, only ordering by views is supported. It is possible to filter the plots by quality with min_quality or max_quality as query parameter.

Example:

// GET https://api.plotly.com/v2/plots/ ---> 200

// GET https://api.plotly.com/v2/plots/?order_by=-views ---> 200

// GET https://api.plotly.com/v2/plots/?min_quality=5 ---> 200

// GET https://api.plotly.com/v2/plots/?max_quality=5 ---> 200

feed

Listing all handpicked feed plots can be done via a GET request to this endpoint. By default, plots will be listed in a random order.

Example:

// GET https://api.plotly.com/v2/plots/feed ---> 200

create

You can create new plot resources here. The only required field is 'figure'. Currently, the figure is restricted to only contain references to grid data. That is, this will fail if raw data arrays are passed in. To create and manipulate underlying grids for plots, see the grids endpoint.

Example:

// This fails because a figure field is required.
// POST https://api.plotly.com/v2/plots ---> 400 Bad Request
{}

// This fails because the figure has raw data
//POST https://api.plotly.com/v2/plots ---> 400 Bad Request
{
    "figure": {"data": [{"y": ['this', 'is', 'raw', 'data']}]}
}

// This succeeds because the figure has src keys, not raw data.
//POST https://api.plotly.com/v2/plots ---> 200 OK
{
    "figure": {"data": [{"ysrc": "sven:88:u8nd62"}]}
}

When creating a grid, you can optionally specify a source_fid to specify where a plot has come from:

  • source_fid: the fid of a plot that was copied (and presumably edited) to produce this one

detail

There is a lot of meta information stored about plot files including filename, title, share_url, and content_url to name a few.

This information can only be reached with a GET to this endpoint.

Example:

// GET https://api.plotly.com/v2/plots/iheartgraphs:90

content

The contents of a plot can be downloaded via the content resource. The plot content contains referenced grid/column data by default. If you wish to return the raw grid/column data, the inline_data=true query must be included in the request url. The Content-Type header will be appropriately set for the response body.

Alternatively, you can set ?map_data=unreadable to append a mapping of sources to data that belongs to grids which are unreadable for the requestor. This is useful when you have read access to another users plot, but that plot contains grid references which you don't have access to.

Examples:

// Returns referenced grid/column data
// GET https://api.plotly.com/v2/plots/iheartgraphs:90/content ---> 200 OK

// Returns full grid/column data
// GET https://api.plotly.com/v2/plots/iheartgraphs:90/content?inline_data=true ---> 200 OK

// Returns full grid/column data when requestor doesn't have permission
// to read the referenced grid.
// GET https://api.plotly.com/v2/plots/iheartgraphs:90/content?map_data=unreadable ---> 200 OK

GET /v2/plots/?cursor=cD0yMDI0LTA0LTI4KzE4JTNBNTMlM0EyMS41OTgzODklMkIwMCUzQTAw&format=api
HTTP 200 OK
Allow: GET, POST, HEAD, OPTIONS
Content-Type: application/json
Vary: Accept

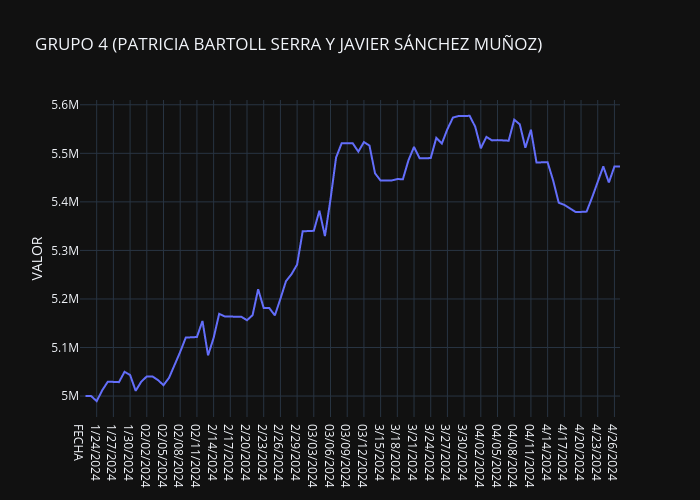
{
    "next": "https://api.plot.ly/v2/plots/?cursor=cD0yMDI0LTA0LTI4KzE2JTNBMDglM0ExNy4xNTg0NzglMkIwMCUzQTAw&format=api",
    "previous": "https://api.plot.ly/v2/plots/?cursor=cj0xJnA9MjAyNC0wNC0yOCsxOCUzQTUzJTNBMTIuNjkzMjA2JTJCMDAlM0EwMA%3D%3D&format=api",
    "results": [
        {
            "creation_time": "2024-04-28T18:53:12.693206Z",
            "comments": {
                "results": [],
                "count": 0
            },
            "parented": true,
            "embed_url": "https://chart-studio.plotly.com/~Kevinmb/1.embed",
            "fid": "Kevinmb:1",
            "filename": "Curva de crecimiento SL3261 (BHI)",
            "filetype": "plot",
            "img_url": "https://storage.googleapis.com/plotly-prod-images/Kevinmb/1/9_OGF3GAU1Z4SVNR65W04SSO52TJE22E.png",
            "image_urls": {
                "default": "https://storage.googleapis.com/plotly-prod-images/Kevinmb/1/2_1PMYC87O539GD148KFF5WB0WIUC2BY.png",
                "block-thumb": "https://storage.googleapis.com/plotly-prod-images/Kevinmb/1/8_NXV2NDY09DG4NWMGAWK7EMSCA4GK6F.png",
                "list-thumb": "https://storage.googleapis.com/plotly-prod-images/Kevinmb/1/9_OGF3GAU1Z4SVNR65W04SSO52TJE22E.png"
            },
            "api_urls": {
                "files": "https://api.plotly.com/v2/files/Kevinmb:1",
                "plots": "https://api.plotly.com/v2/plots/Kevinmb:1",
                "parent": "https://api.plotly.com/v2/folders/home?user=Kevinmb"
            },
            "owner": "Kevinmb",
            "parent": -1,
            "preview": "",
            "referencers": [],
            "references": [],
            "title": "",
            "views": 2,
            "web_url": "https://chart-studio.plotly.com/~Kevinmb/1/",
            "world_readable": true,
            "date_modified": "2024-07-14T19:11:15.297Z",
            "stars": {
                "results": [],
                "count": 0
            },
            "collaborators": {
                "results": [],
                "count": 0
            },
            "subfolder_count": null,
            "refresh_interval": null,
            "organize_view_url": "https://chart-studio.plotly.com/~Kevinmb/1/",
            "current_user_permission": "read",
            "is_theme": null,
            "is_template": true,
            "autosize": true,
            "caption": "",
            "figure": {
                "data": [
                    {
                        "line": {
                            "shape": "spline"
                        },
                        "meta": {
                            "columnNames": {
                                "x": "A",
                                "y": "SL3261"
                            }
                        },
                        "mode": "markers+lines",
                        "name": "SL3261",
                        "type": "scatter",
                        "xsrc": "Kevinmb:0:5fc814",
                        "ysrc": "Kevinmb:0:ec28f0",
                        "marker": {
                            "color": "rgb(76,114,176)"
                        },
                        "error_x": {
                            "type": "percent",
                            "color": "rgb(76,114,176)",
                            "value": 10,
                            "width": 4,
                            "visible": false,
                            "symmetric": true,
                            "thickness": 2
                        },
                        "error_y": {
                            "type": "percent",
                            "color": "rgb(76,114,176)",
                            "value": 10,
                            "width": 4,
                            "visible": false,
                            "symmetric": true,
                            "thickness": 2
                        },
                        "opacity": 1,
                        "visible": true,
                        "stackgroup": null
                    },
                    {
                        "line": {
                            "shape": "spline"
                        },
                        "meta": {
                            "columnNames": {
                                "x": "A",
                                "y": "pENP C1"
                            }
                        },
                        "mode": "markers+lines",
                        "name": "pENP",
                        "type": "scatter",
                        "xsrc": "Kevinmb:0:5fc814",
                        "ysrc": "Kevinmb:0:21560a",
                        "visible": true,
                        "stackgroup": null
                    },
                    {
                        "line": {
                            "shape": "spline"
                        },
                        "meta": {
                            "columnNames": {
                                "x": "A",
                                "y": "ShdA100 C1"
                            }
                        },
                        "mode": "markers+lines",
                        "name": "ShdA100",
                        "type": "scatter",
                        "xsrc": "Kevinmb:0:5fc814",
                        "ysrc": "Kevinmb:0:8e73b5",
                        "visible": true,
                        "stackgroup": null
                    },
                    {
                        "line": {
                            "shape": "spline"
                        },
                        "meta": {
                            "columnNames": {
                                "x": "A",
                                "y": "ScFv C1"
                            }
                        },
                        "mode": "markers+lines",
                        "name": "ScFv",
                        "type": "scatter",
                        "xsrc": "Kevinmb:0:5fc814",
                        "ysrc": "Kevinmb:0:2463a0",
                        "stackgroup": null
                    },
                    {
                        "line": {
                            "shape": "spline"
                        },
                        "meta": {
                            "columnNames": {
                                "x": "A",
                                "y": "ScFv ShdaA C4"
                            }
                        },
                        "mode": "markers+lines",
                        "name": "ShdA30 ScFv",
                        "type": "scatter",
                        "xsrc": "Kevinmb:0:5fc814",
                        "ysrc": "Kevinmb:0:5f6ef4",
                        "stackgroup": null
                    },
                    {
                        "line": {
                            "shape": "spline"
                        },
                        "meta": {
                            "columnNames": {
                                "x": "A",
                                "y": "ScFv ShdaA100 C3"
                            }
                        },
                        "mode": "markers+lines",
                        "name": "ShdA100 ScFv",
                        "type": "scatter",
                        "xsrc": "Kevinmb:0:5fc814",
                        "ysrc": "Kevinmb:0:f21339",
                        "stackgroup": null
                    }
                ],
                "frames": [],
                "layout": {
                    "font": {
                        "size": 13,
                        "family": "Open Sans"
                    },
                    "title": {
                        "x": 0.5,
                        "text": "Curva de crecimiento en BHI SL3261"
                    },
                    "xaxis": {
                        "type": "linear",
                        "range": [
                            -0.9895786135024922,
                            16.98957861350249
                        ],
                        "title": {
                            "text": "Tiempo (H)"
                        },
                        "autorange": true
                    },
                    "yaxis": {
                        "type": "linear",
                        "range": [
                            -0.12084315503173167,
                            2.0608431550317317
                        ],
                        "title": {
                            "text": "OD (540 nm)"
                        },
                        "autorange": true
                    },
                    "autosize": true,
                    "colorway": [
                        "rgb(76,114,176)",
                        "rgb(221,132,82)",
                        "rgb(85,168,104)",
                        "rgb(196,78,82)",
                        "rgb(129,114,179)",
                        "rgb(147,120,96)",
                        "rgb(218,139,195)",
                        "rgb(140,140,140)",
                        "rgb(204,185,116)",
                        "rgb(100,181,205)"
                    ],
                    "dragmode": "pan",
                    "template": {
                        "data": {
                            "bar": [
                                {
                                    "type": "bar",
                                    "marker": {
                                        "colorbar": {
                                            "ticks": "outside",
                                            "ticklen": 8,
                                            "tickcolor": "rgb(36,36,36)",
                                            "tickwidth": 2,
                                            "outlinewidth": 0
                                        }
                                    }
                                }
                            ],
                            "table": [
                                {
                                    "type": "table",
                                    "cells": {
                                        "fill": {
                                            "color": "rgb(231,231,240)"
                                        },
                                        "line": {
                                            "color": "white"
                                        }
                                    },
                                    "header": {
                                        "fill": {
                                            "color": "rgb(183,183,191)"
                                        },
                                        "line": {
                                            "color": "white"
                                        }
                                    }
                                }
                            ],
                            "carpet": [
                                {
                                    "type": "carpet",
                                    "aaxis": {
                                        "gridcolor": "white",
                                        "linecolor": "white",
                                        "endlinecolor": "rgb(36,36,36)",
                                        "minorgridcolor": "white",
                                        "startlinecolor": "rgb(36,36,36)"
                                    },
                                    "baxis": {
                                        "gridcolor": "white",
                                        "linecolor": "white",
                                        "endlinecolor": "rgb(36,36,36)",
                                        "minorgridcolor": "white",
                                        "startlinecolor": "rgb(36,36,36)"
                                    }
                                }
                            ],
                            "mesh3d": [
                                {
                                    "type": "mesh3d",
                                    "colorbar": {
                                        "ticks": "outside",
                                        "ticklen": 8,
                                        "tickcolor": "rgb(36,36,36)",
                                        "tickwidth": 2,
                                        "outlinewidth": 0
                                    }
                                }
                            ],
                            "contour": [
                                {
                                    "type": "contour",
                                    "colorbar": {
                                        "ticks": "outside",
                                        "ticklen": 8,
                                        "tickcolor": "rgb(36,36,36)",
                                        "tickwidth": 2,
                                        "outlinewidth": 0
                                    },
                                    "autocolorscale": true
                                }
                            ],
                            "heatmap": [
                                {
                                    "type": "heatmap",
                                    "colorbar": {
                                        "ticks": "outside",
                                        "ticklen": 8,
                                        "tickcolor": "rgb(36,36,36)",
                                        "tickwidth": 2,
                                        "outlinewidth": 0
                                    },
                                    "autocolorscale": true
                                }
                            ],
                            "scatter": [
                                {
                                    "type": "scatter",
                                    "marker": {
                                        "colorbar": {
                                            "ticks": "outside",
                                            "ticklen": 8,
                                            "tickcolor": "rgb(36,36,36)",
                                            "tickwidth": 2,
                                            "outlinewidth": 0
                                        }
                                    }
                                }
                            ],
                            "surface": [
                                {
                                    "type": "surface",
                                    "colorbar": {
                                        "ticks": "outside",
                                        "ticklen": 8,
                                        "tickcolor": "rgb(36,36,36)",
                                        "tickwidth": 2,
                                        "outlinewidth": 0
                                    }
                                }
                            ],
                            "heatmapgl": [
                                {
                                    "type": "heatmapgl",
                                    "colorbar": {
                                        "ticks": "outside",
                                        "ticklen": 8,
                                        "tickcolor": "rgb(36,36,36)",
                                        "tickwidth": 2,
                                        "outlinewidth": 0
                                    }
                                }
                            ],
                            "histogram": [
                                {
                                    "type": "histogram",
                                    "marker": {
                                        "colorbar": {
                                            "ticks": "outside",
                                            "ticklen": 8,
                                            "tickcolor": "rgb(36,36,36)",
                                            "tickwidth": 2,
                                            "outlinewidth": 0
                                        }
                                    }
                                }
                            ],
                            "parcoords": [
                                {
                                    "line": {
                                        "colorbar": {
                                            "ticks": "outside",
                                            "ticklen": 8,
                                            "tickcolor": "rgb(36,36,36)",
                                            "tickwidth": 2,
                                            "outlinewidth": 0
                                        }
                                    },
                                    "type": "parcoords"
                                }
                            ],
                            "scatter3d": [
                                {
                                    "type": "scatter3d",
                                    "marker": {
                                        "colorbar": {
                                            "ticks": "outside",
                                            "ticklen": 8,
                                            "tickcolor": "rgb(36,36,36)",
                                            "tickwidth": 2,
                                            "outlinewidth": 0
                                        }
                                    }
                                }
                            ],
                            "scattergl": [
                                {
                                    "type": "scattergl",
                                    "marker": {
                                        "colorbar": {
                                            "ticks": "outside",
                                            "ticklen": 8,
                                            "tickcolor": "rgb(36,36,36)",
                                            "tickwidth": 2,
                                            "outlinewidth": 0
                                        }
                                    }
                                }
                            ],
                            "choropleth": [
                                {
                                    "type": "choropleth",
                                    "colorbar": {
                                        "ticks": "outside",
                                        "ticklen": 8,
                                        "tickcolor": "rgb(36,36,36)",
                                        "tickwidth": 2,
                                        "outlinewidth": 0
                                    }
                                }
                            ],
                            "scattergeo": [
                                {
                                    "type": "scattergeo",
                                    "marker": {
                                        "colorbar": {
                                            "ticks": "outside",
                                            "ticklen": 8,
                                            "tickcolor": "rgb(36,36,36)",
                                            "tickwidth": 2,
                                            "outlinewidth": 0
                                        }
                                    }
                                }
                            ],
                            "histogram2d": [
                                {
                                    "type": "histogram2d",
                                    "colorbar": {
                                        "ticks": "outside",
                                        "ticklen": 8,
                                        "tickcolor": "rgb(36,36,36)",
                                        "tickwidth": 2,
                                        "outlinewidth": 0
                                    },
                                    "autocolorscale": true
                                }
                            ],
                            "scatterpolar": [
                                {
                                    "type": "scatterpolar",
                                    "marker": {
                                        "colorbar": {
                                            "ticks": "outside",
                                            "ticklen": 8,
                                            "tickcolor": "rgb(36,36,36)",
                                            "tickwidth": 2,
                                            "outlinewidth": 0
                                        }
                                    }
                                }
                            ],
                            "contourcarpet": [
                                {
                                    "type": "contourcarpet",
                                    "colorbar": {
                                        "ticks": "outside",
                                        "ticklen": 8,
                                        "tickcolor": "rgb(36,36,36)",
                                        "tickwidth": 2,
                                        "outlinewidth": 0
                                    }
                                }
                            ],
                            "scattercarpet": [
                                {
                                    "type": "scattercarpet",
                                    "marker": {
                                        "colorbar": {
                                            "ticks": "outside",
                                            "ticklen": 8,
                                            "tickcolor": "rgb(36,36,36)",
                                            "tickwidth": 2,
                                            "outlinewidth": 0
                                        }
                                    }
                                }
                            ],
                            "scattermapbox": [
                                {
                                    "type": "scattermapbox",
                                    "marker": {
                                        "colorbar": {
                                            "ticks": "outside",
                                            "ticklen": 8,
                                            "tickcolor": "rgb(36,36,36)",
                                            "tickwidth": 2,
                                            "outlinewidth": 0
                                        }
                                    }
                                }
                            ],
                            "scatterpolargl": [
                                {
                                    "type": "scatterpolargl",
                                    "marker": {
                                        "colorbar": {
                                            "ticks": "outside",
                                            "ticklen": 8,
                                            "tickcolor": "rgb(36,36,36)",
                                            "tickwidth": 2,
                                            "outlinewidth": 0
                                        }
                                    }
                                }
                            ],
                            "scatterternary": [
                                {
                                    "type": "scatterternary",
                                    "marker": {
                                        "colorbar": {
                                            "ticks": "outside",
                                            "ticklen": 8,
                                            "tickcolor": "rgb(36,36,36)",
                                            "tickwidth": 2,
                                            "outlinewidth": 0
                                        }
                                    }
                                }
                            ],
                            "histogram2dcontour": [
                                {
                                    "type": "histogram2dcontour",
                                    "colorbar": {
                                        "ticks": "outside",
                                        "ticklen": 8,
                                        "tickcolor": "rgb(36,36,36)",
                                        "tickwidth": 2,
                                        "outlinewidth": 0
                                    },
                                    "autocolorscale": true
                                }
                            ]
                        },
                        "layout": {
                            "geo": {
                                "bgcolor": "white",
                                "showland": true,
                                "lakecolor": "white",
                                "landcolor": "rgb(234,234,242)",
                                "showlakes": true,
                                "subunitcolor": "white"
                            },
                            "font": {
                                "color": "rgb(36,36,36)"
                            },
                            "polar": {
                                "bgcolor": "rgb(234,234,242)",
                                "radialaxis": {
                                    "ticks": "",
                                    "showgrid": true,
                                    "gridcolor": "white",
                                    "linecolor": "white"
                                },
                                "angularaxis": {
                                    "ticks": "",
                                    "showgrid": true,
                                    "gridcolor": "white",
                                    "linecolor": "white"
                                }
                            },
                            "scene": {
                                "xaxis": {
                                    "ticks": "",
                                    "showgrid": true,
                                    "gridcolor": "white",
                                    "gridwidth": 2,
                                    "linecolor": "white",
                                    "zerolinecolor": "white",
                                    "showbackground": true,
                                    "backgroundcolor": "rgb(234,234,242)"
                                },
                                "yaxis": {
                                    "ticks": "",
                                    "showgrid": true,
                                    "gridcolor": "white",
                                    "gridwidth": 2,
                                    "linecolor": "white",
                                    "zerolinecolor": "white",
                                    "showbackground": true,
                                    "backgroundcolor": "rgb(234,234,242)"
                                },
                                "zaxis": {
                                    "ticks": "",
                                    "showgrid": true,
                                    "gridcolor": "white",
                                    "gridwidth": 2,
                                    "linecolor": "white",
                                    "zerolinecolor": "white",
                                    "showbackground": true,
                                    "backgroundcolor": "rgb(234,234,242)"
                                }
                            },
                            "xaxis": {
                                "ticks": "",
                                "showgrid": true,
                                "gridcolor": "white",
                                "linecolor": "white",
                                "automargin": true,
                                "zerolinecolor": "white"
                            },
                            "yaxis": {
                                "ticks": "",
                                "showgrid": true,
                                "gridcolor": "white",
                                "linecolor": "white",
                                "automargin": true,
                                "zerolinecolor": "white"
                            },
                            "ternary": {
                                "aaxis": {
                                    "ticks": "",
                                    "showgrid": true,
                                    "gridcolor": "white",
                                    "linecolor": "white"
                                },
                                "baxis": {
                                    "ticks": "",
                                    "showgrid": true,
                                    "gridcolor": "white",
                                    "linecolor": "white"
                                },
                                "caxis": {
                                    "ticks": "",
                                    "showgrid": true,
                                    "gridcolor": "white",
                                    "linecolor": "white"
                                },
                                "bgcolor": "rgb(234,234,242)"
                            },
                            "colorway": [
                                "rgb(76,114,176)",
                                "rgb(221,132,82)",
                                "rgb(85,168,104)",
                                "rgb(196,78,82)",
                                "rgb(129,114,179)",
                                "rgb(147,120,96)",
                                "rgb(218,139,195)",
                                "rgb(140,140,140)",
                                "rgb(204,185,116)",
                                "rgb(100,181,205)"
                            ],
                            "hovermode": "closest",
                            "colorscale": {
                                "diverging": [
                                    [
                                        0,
                                        "#67001f"
                                    ],
                                    [
                                        0.1,
                                        "#b2182b"
                                    ],
                                    [
                                        0.2,
                                        "#d6604d"
                                    ],
                                    [
                                        0.3,
                                        "#f4a582"
                                    ],
                                    [
                                        0.4,
                                        "#fddbc7"
                                    ],
                                    [
                                        0.5,
                                        "#f7f7f7"
                                    ],
                                    [
                                        0.6,
                                        "#d1e5f0"
                                    ],
                                    [
                                        0.7,
                                        "#92c5de"
                                    ],
                                    [
                                        0.8,
                                        "#4393c3"
                                    ],
                                    [
                                        0.9,
                                        "#2166ac"
                                    ],
                                    [
                                        1,
                                        "#053061"
                                    ]
                                ],
                                "sequential": [
                                    [
                                        0,
                                        "rgb(2,4,25)"
                                    ],
                                    [
                                        0.06274509803921569,
                                        "rgb(24,15,41)"
                                    ],
                                    [
                                        0.12549019607843137,
                                        "rgb(47,23,57)"
                                    ],
                                    [
                                        0.18823529411764706,
                                        "rgb(71,28,72)"
                                    ],
                                    [
                                        0.25098039215686274,
                                        "rgb(97,30,82)"
                                    ],
                                    [
                                        0.3137254901960784,
                                        "rgb(123,30,89)"
                                    ],
                                    [
                                        0.3764705882352941,
                                        "rgb(150,27,91)"
                                    ],
                                    [
                                        0.4392156862745098,
                                        "rgb(177,22,88)"
                                    ],
                                    [
                                        0.5019607843137255,
                                        "rgb(203,26,79)"
                                    ],
                                    [
                                        0.5647058823529412,
                                        "rgb(223,47,67)"
                                    ],
                                    [
                                        0.6274509803921569,
                                        "rgb(236,76,61)"
                                    ],
                                    [
                                        0.6901960784313725,
                                        "rgb(242,107,73)"
                                    ],
                                    [
                                        0.7529411764705882,
                                        "rgb(244,135,95)"
                                    ],
                                    [
                                        0.8156862745098039,
                                        "rgb(245,162,122)"
                                    ],
                                    [
                                        0.8784313725490196,
                                        "rgb(246,188,153)"
                                    ],
                                    [
                                        0.9411764705882353,
                                        "rgb(247,212,187)"
                                    ],
                                    [
                                        1,
                                        "rgb(250,234,220)"
                                    ]
                                ],
                                "sequentialminus": [
                                    [
                                        0,
                                        "rgb(2,4,25)"
                                    ],
                                    [
                                        0.06274509803921569,
                                        "rgb(24,15,41)"
                                    ],
                                    [
                                        0.12549019607843137,
                                        "rgb(47,23,57)"
                                    ],
                                    [
                                        0.18823529411764706,
                                        "rgb(71,28,72)"
                                    ],
                                    [
                                        0.25098039215686274,
                                        "rgb(97,30,82)"
                                    ],
                                    [
                                        0.3137254901960784,
                                        "rgb(123,30,89)"
                                    ],
                                    [
                                        0.3764705882352941,
                                        "rgb(150,27,91)"
                                    ],
                                    [
                                        0.4392156862745098,
                                        "rgb(177,22,88)"
                                    ],
                                    [
                                        0.5019607843137255,
                                        "rgb(203,26,79)"
                                    ],
                                    [
                                        0.5647058823529412,
                                        "rgb(223,47,67)"
                                    ],
                                    [
                                        0.6274509803921569,
                                        "rgb(236,76,61)"
                                    ],
                                    [
                                        0.6901960784313725,
                                        "rgb(242,107,73)"
                                    ],
                                    [
                                        0.7529411764705882,
                                        "rgb(244,135,95)"
                                    ],
                                    [
                                        0.8156862745098039,
                                        "rgb(245,162,122)"
                                    ],
                                    [
                                        0.8784313725490196,
                                        "rgb(246,188,153)"
                                    ],
                                    [
                                        0.9411764705882353,
                                        "rgb(247,212,187)"
                                    ],
                                    [
                                        1,
                                        "rgb(250,234,220)"
                                    ]
                                ]
                            },
                            "plot_bgcolor": "rgb(234,234,242)",
                            "paper_bgcolor": "white",
                            "shapedefaults": {
                                "line": {
                                    "width": 0
                                },
                                "opacity": 0.5,
                                "fillcolor": "rgb(67,103,167)"
                            },
                            "annotationdefaults": {
                                "arrowcolor": "rgb(67,103,167)"
                            }
                        },
                        "themeRef": "SEABORN"
                    },
                    "hovermode": "x",
                    "separators": ".,",
                    "uniformtext": {
                        "mode": false,
                        "minsize": 1
                    }
                }
            },
            "height": null,
            "width": null,
            "user": {
                "profile_url": "https://chart-studio.plotly.com/~Kevinmb",
                "avatar_url": "https://storage.googleapis.com/plotly-prod-profiles/42.jpg",
                "background_url": "https://storage.googleapis.com/plotly-prod-profiles/bg-3.jpg",
                "bio": "",
                "nickname": "",
                "website": "",
                "stream_tokens": null,
                "feature_set_id": null,
                "csrf_token": null,
                "date_joined": "2024-04-28 17:46:33",
                "mapbox_access_tokens": null,
                "has_password": null,
                "username": "Kevinmb",
                "email": null,
                "is_active": null,
                "readonly": null,
                "is_dash_creator": null,
                "dash_created_count": null,
                "is_chart_creator": null,
                "charts_created_count": null
            }
        },
        {
            "creation_time": "2024-04-28T18:50:10.136759Z",
            "comments": {
                "results": [],
                "count": 0
            },
            "parented": true,
            "embed_url": "https://chart-studio.plotly.com/~svettelnova/5.embed",
            "fid": "svettelnova:5",
            "filename": "Plot 5",
            "filetype": "plot",
            "img_url": "https://storage.googleapis.com/plotly-prod-images/svettelnova/5/9_4NXSGFZZP8KAYM05VML7MLQ1GBCN3D.png",
            "image_urls": {
                "default": "https://storage.googleapis.com/plotly-prod-images/svettelnova/5/2_CT3R2CH8ADDQSC75N3VKZYZHPNKWU2.png",
                "block-thumb": "https://storage.googleapis.com/plotly-prod-images/svettelnova/5/8_JA39QYEF2VIPJ9BJ6KG4WJSQW1HQU5.png",
                "list-thumb": "https://storage.googleapis.com/plotly-prod-images/svettelnova/5/9_4NXSGFZZP8KAYM05VML7MLQ1GBCN3D.png"
            },
            "api_urls": {
                "files": "https://api.plotly.com/v2/files/svettelnova:5",
                "plots": "https://api.plotly.com/v2/plots/svettelnova:5",
                "parent": "https://api.plotly.com/v2/folders/home?user=svettelnova"
            },
            "owner": "svettelnova",
            "parent": -1,
            "preview": "",
            "referencers": [],
            "references": [],
            "title": "",
            "views": 1,
            "web_url": "https://chart-studio.plotly.com/~svettelnova/5/",
            "world_readable": true,
            "date_modified": "2024-04-28T18:50:10.152Z",
            "stars": {
                "results": [],
                "count": 0
            },
            "collaborators": {
                "results": [],
                "count": 0
            },
            "subfolder_count": null,
            "refresh_interval": null,
            "organize_view_url": "https://chart-studio.plotly.com/~svettelnova/5/",
            "current_user_permission": "read",
            "is_theme": null,
            "is_template": false,
            "autosize": true,
            "caption": "",
            "figure": {
                "data": [
                    {
                        "meta": {
                            "columnNames": {
                                "x": "B",
                                "y": "A"
                            }
                        },
                        "mode": "lines",
                        "type": "scatter",
                        "xsrc": "svettelnova:4:aa09b4",
                        "ysrc": "svettelnova:4:350bda"
                    }
                ],
                "frames": [],
                "layout": {
                    "title": {
                        "text": "Working capital"
                    },
                    "xaxis": {
                        "type": "linear",
                        "range": [
                            2020,
                            2023
                        ],
                        "ticks": "",
                        "tickmode": "linear",
                        "autorange": false,
                        "rangeslider": {
                            "range": [
                                2020,
                                2023
                            ],
                            "yaxis": {},
                            "visible": false,
                            "autorange": true
                        },
                        "separatethousands": false
                    },
                    "yaxis": {
                        "type": "linear",
                        "range": [
                            -1361,
                            1459
                        ],
                        "title": {
                            "text": "Click to enter Y axis title"
                        },
                        "autorange": true
                    },
                    "autosize": true,
                    "template": {
                        "data": {
                            "bar": [
                                {
                                    "type": "bar",
                                    "marker": {
                                        "colorbar": {
                                            "ticks": "",
                                            "outlinewidth": 0
                                        }
                                    }
                                }
                            ],
                            "table": [
                                {
                                    "type": "table",
                                    "cells": {
                                        "fill": {
                                            "color": "#EBF0F8"
                                        },
                                        "line": {
                                            "color": "white"
                                        }
                                    },
                                    "header": {
                                        "fill": {
                                            "color": "#C8D4E3"
                                        },
                                        "line": {
                                            "color": "white"
                                        }
                                    }
                                }
                            ],
                            "carpet": [
                                {
                                    "type": "carpet",
                                    "aaxis": {
                                        "gridcolor": "#C8D4E3",
                                        "linecolor": "#C8D4E3",
                                        "endlinecolor": "#2a3f5f",
                                        "minorgridcolor": "#C8D4E3",
                                        "startlinecolor": "#2a3f5f"
                                    },
                                    "baxis": {
                                        "gridcolor": "#C8D4E3",
                                        "linecolor": "#C8D4E3",
                                        "endlinecolor": "#2a3f5f",
                                        "minorgridcolor": "#C8D4E3",
                                        "startlinecolor": "#2a3f5f"
                                    }
                                }
                            ],
                            "mesh3d": [
                                {
                                    "type": "mesh3d",
                                    "colorbar": {
                                        "ticks": "",
                                        "outlinewidth": 0
                                    }
                                }
                            ],
                            "contour": [
                                {
                                    "type": "contour",
                                    "colorbar": {
                                        "ticks": "",
                                        "outlinewidth": 0
                                    },
                                    "autocolorscale": true
                                }
                            ],
                            "heatmap": [
                                {
                                    "type": "heatmap",
                                    "colorbar": {
                                        "ticks": "",
                                        "outlinewidth": 0
                                    },
                                    "autocolorscale": true
                                }
                            ],
                            "scatter": [
                                {
                                    "type": "scatter",
                                    "marker": {
                                        "colorbar": {
                                            "ticks": "",
                                            "outlinewidth": 0
                                        }
                                    }
                                }
                            ],
                            "surface": [
                                {
                                    "type": "surface",
                                    "colorbar": {
                                        "ticks": "",
                                        "outlinewidth": 0
                                    }
                                }
                            ],
                            "heatmapgl": [
                                {
                                    "type": "heatmapgl",
                                    "colorbar": {
                                        "ticks": "",
                                        "outlinewidth": 0
                                    }
                                }
                            ],
                            "histogram": [
                                {
                                    "type": "histogram",
                                    "marker": {
                                        "colorbar": {
                                            "ticks": "",
                                            "outlinewidth": 0
                                        }
                                    }
                                }
                            ],
                            "parcoords": [
                                {
                                    "line": {
                                        "colorbar": {
                                            "ticks": "",
                                            "outlinewidth": 0
                                        }
                                    },
                                    "type": "parcoords"
                                }
                            ],
                            "scatter3d": [
                                {
                                    "type": "scatter3d",
                                    "marker": {
                                        "colorbar": {
                                            "ticks": "",
                                            "outlinewidth": 0
                                        }
                                    }
                                }
                            ],
                            "scattergl": [
                                {
                                    "type": "scattergl",
                                    "marker": {
                                        "colorbar": {
                                            "ticks": "",
                                            "outlinewidth": 0
                                        }
                                    }
                                }
                            ],
                            "choropleth": [
                                {
                                    "type": "choropleth",
                                    "colorbar": {
                                        "ticks": "",
                                        "outlinewidth": 0
                                    }
                                }
                            ],
                            "scattergeo": [
                                {
                                    "type": "scattergeo",
                                    "marker": {
                                        "colorbar": {
                                            "ticks": "",
                                            "outlinewidth": 0
                                        }
                                    }
                                }
                            ],
                            "histogram2d": [
                                {
                                    "type": "histogram2d",
                                    "colorbar": {
                                        "ticks": "",
                                        "outlinewidth": 0
                                    },
                                    "autocolorscale": true
                                }
                            ],
                            "scatterpolar": [
                                {
                                    "type": "scatterpolar",
                                    "marker": {
                                        "colorbar": {
                                            "ticks": "",
                                            "outlinewidth": 0
                                        }
                                    }
                                }
                            ],
                            "contourcarpet": [
                                {
                                    "type": "contourcarpet",
                                    "colorbar": {
                                        "ticks": "",
                                        "outlinewidth": 0
                                    }
                                }
                            ],
                            "scattercarpet": [
                                {
                                    "type": "scattercarpet",
                                    "marker": {
                                        "colorbar": {
                                            "ticks": "",
                                            "outlinewidth": 0
                                        }
                                    }
                                }
                            ],
                            "scattermapbox": [
                                {
                                    "type": "scattermapbox",
                                    "marker": {
                                        "colorbar": {
                                            "ticks": "",
                                            "outlinewidth": 0
                                        }
                                    }
                                }
                            ],
                            "scatterpolargl": [
                                {
                                    "type": "scatterpolargl",
                                    "marker": {
                                        "colorbar": {
                                            "ticks": "",
                                            "outlinewidth": 0
                                        }
                                    }
                                }
                            ],
                            "scatterternary": [
                                {
                                    "type": "scatterternary",
                                    "marker": {
                                        "colorbar": {
                                            "ticks": "",
                                            "outlinewidth": 0
                                        }
                                    }
                                }
                            ],
                            "histogram2dcontour": [
                                {
                                    "type": "histogram2dcontour",
                                    "colorbar": {
                                        "ticks": "",
                                        "outlinewidth": 0
                                    },
                                    "autocolorscale": true
                                }
                            ]
                        },
                        "layout": {
                            "geo": {
                                "bgcolor": "white",
                                "showland": true,
                                "lakecolor": "white",
                                "landcolor": "white",
                                "showlakes": true,
                                "subunitcolor": "#C8D4E3"
                            },
                            "font": {
                                "color": "#2a3f5f"
                            },
                            "polar": {
                                "bgcolor": "white",
                                "radialaxis": {
                                    "ticks": "",
                                    "gridcolor": "#EBF0F8",
                                    "linecolor": "#EBF0F8"
                                },
                                "angularaxis": {
                                    "ticks": "",
                                    "gridcolor": "#EBF0F8",
                                    "linecolor": "#EBF0F8"
                                }
                            },
                            "scene": {
                                "xaxis": {
                                    "ticks": "",
                                    "gridcolor": "#DFE8F3",
                                    "gridwidth": 2,
                                    "linecolor": "#EBF0F8",
                                    "zerolinecolor": "#EBF0F8",
                                    "showbackground": true,
                                    "backgroundcolor": "white"
                                },
                                "yaxis": {
                                    "ticks": "",
                                    "gridcolor": "#DFE8F3",
                                    "gridwidth": 2,
                                    "linecolor": "#EBF0F8",
                                    "zerolinecolor": "#EBF0F8",
                                    "showbackground": true,
                                    "backgroundcolor": "white"
                                },
                                "zaxis": {
                                    "ticks": "",
                                    "gridcolor": "#DFE8F3",
                                    "gridwidth": 2,
                                    "linecolor": "#EBF0F8",
                                    "zerolinecolor": "#EBF0F8",
                                    "showbackground": true,
                                    "backgroundcolor": "white"
                                }
                            },
                            "title": {
                                "x": 0.05
                            },
                            "xaxis": {
                                "ticks": "",
                                "gridcolor": "#EBF0F8",
                                "linecolor": "#EBF0F8",
                                "automargin": true,
                                "zerolinecolor": "#EBF0F8",
                                "zerolinewidth": 2
                            },
                            "yaxis": {
                                "ticks": "",
                                "gridcolor": "#EBF0F8",
                                "linecolor": "#EBF0F8",
                                "automargin": true,
                                "zerolinecolor": "#EBF0F8",
                                "zerolinewidth": 2
                            },
                            "ternary": {
                                "aaxis": {
                                    "ticks": "",
                                    "gridcolor": "#DFE8F3",
                                    "linecolor": "#A2B1C6"
                                },
                                "baxis": {
                                    "ticks": "",
                                    "gridcolor": "#DFE8F3",
                                    "linecolor": "#A2B1C6"
                                },
                                "caxis": {
                                    "ticks": "",
                                    "gridcolor": "#DFE8F3",
                                    "linecolor": "#A2B1C6"
                                },
                                "bgcolor": "white"
                            },
                            "colorway": [
                                "#636efa",
                                "#EF553B",
                                "#00cc96",
                                "#ab63fa",
                                "#19d3f3",
                                "#e763fa",
                                "#fecb52",
                                "#ffa15a",
                                "#ff6692",
                                "#b6e880"
                            ],
                            "hovermode": "closest",
                            "colorscale": {
                                "diverging": [
                                    [
                                        0,
                                        "#8e0152"
                                    ],
                                    [
                                        0.1,
                                        "#c51b7d"
                                    ],
                                    [
                                        0.2,
                                        "#de77ae"
                                    ],
                                    [
                                        0.3,
                                        "#f1b6da"
                                    ],
                                    [
                                        0.4,
                                        "#fde0ef"
                                    ],
                                    [
                                        0.5,
                                        "#f7f7f7"
                                    ],
                                    [
                                        0.6,
                                        "#e6f5d0"
                                    ],
                                    [
                                        0.7,
                                        "#b8e186"
                                    ],
                                    [
                                        0.8,
                                        "#7fbc41"
                                    ],
                                    [
                                        0.9,
                                        "#4d9221"
                                    ],
                                    [
                                        1,
                                        "#276419"
                                    ]
                                ],
                                "sequential": [
                                    [
                                        0,
                                        "#0508b8"
                                    ],
                                    [
                                        0.0893854748603352,
                                        "#1910d8"
                                    ],
                                    [
                                        0.1787709497206704,
                                        "#3c19f0"
                                    ],
                                    [
                                        0.2681564245810056,
                                        "#6b1cfb"
                                    ],
                                    [
                                        0.3575418994413408,
                                        "#981cfd"
                                    ],
                                    [
                                        0.44692737430167595,
                                        "#bf1cfd"
                                    ],
                                    [
                                        0.5363128491620112,
                                        "#dd2bfd"
                                    ],
                                    [
                                        0.6256983240223464,
                                        "#f246fe"
                                    ],
                                    [
                                        0.7150837988826816,
                                        "#fc67fd"
                                    ],
                                    [
                                        0.8044692737430168,
                                        "#fe88fc"
                                    ],
                                    [
                                        0.8938547486033519,
                                        "#fea5fd"
                                    ],
                                    [
                                        0.9832402234636871,
                                        "#febefe"
                                    ],
                                    [
                                        1,
                                        "#fec3fe"
                                    ]
                                ],
                                "sequentialminus": [
                                    [
                                        0,
                                        "#0508b8"
                                    ],
                                    [
                                        0.0893854748603352,
                                        "#1910d8"
                                    ],
                                    [
                                        0.1787709497206704,
                                        "#3c19f0"
                                    ],
                                    [
                                        0.2681564245810056,
                                        "#6b1cfb"
                                    ],
                                    [
                                        0.3575418994413408,
                                        "#981cfd"
                                    ],
                                    [
                                        0.44692737430167595,
                                        "#bf1cfd"
                                    ],
                                    [
                                        0.5363128491620112,
                                        "#dd2bfd"
                                    ],
                                    [
                                        0.6256983240223464,
                                        "#f246fe"
                                    ],
                                    [
                                        0.7150837988826816,
                                        "#fc67fd"
                                    ],
                                    [
                                        0.8044692737430168,
                                        "#fe88fc"
                                    ],
                                    [
                                        0.8938547486033519,
                                        "#fea5fd"
                                    ],
                                    [
                                        0.9832402234636871,
                                        "#febefe"
                                    ],
                                    [
                                        1,
                                        "#fec3fe"
                                    ]
                                ]
                            },
                            "plot_bgcolor": "white",
                            "paper_bgcolor": "white",
                            "shapedefaults": {
                                "line": {
                                    "width": 0
                                },
                                "opacity": 0.4,
                                "fillcolor": "#506784"
                            },
                            "annotationdefaults": {
                                "arrowhead": 0,
                                "arrowcolor": "#506784",
                                "arrowwidth": 1
                            }
                        },
                        "themeRef": "PLOTLY_WHITE"
                    },
                    "showlegend": false
                }
            },
            "height": null,
            "width": null,
            "user": {
                "profile_url": "https://chart-studio.plotly.com/~svettelnova",
                "avatar_url": "https://storage.googleapis.com/plotly-prod-profiles/83.jpg",
                "background_url": "https://storage.googleapis.com/plotly-prod-profiles/bg-9.jpg",
                "bio": "",
                "nickname": "",
                "website": "",
                "stream_tokens": null,
                "feature_set_id": null,
                "csrf_token": null,
                "date_joined": "2024-04-17 16:36:26",
                "mapbox_access_tokens": null,
                "has_password": null,
                "username": "svettelnova",
                "email": null,
                "is_active": null,
                "readonly": null,
                "is_dash_creator": null,
                "dash_created_count": null,
                "is_chart_creator": null,
                "charts_created_count": null
            }
        },
        {
            "creation_time": "2024-04-28T18:30:28.768682Z",
            "comments": {
                "results": [],
                "count": 0
            },
            "parented": true,
            "embed_url": "https://chart-studio.plotly.com/~invictus.8497/11.embed",
            "fid": "invictus.8497:11",
            "filename": "HRR",
            "filetype": "plot",
            "img_url": "https://storage.googleapis.com/plotly-prod-images/invictus.8497/11/9_VVVWCWBVI8UFN7H8YPUWYHGAQ7KKBR.png",
            "image_urls": {
                "default": "https://storage.googleapis.com/plotly-prod-images/invictus.8497/11/2_XLWSYU6BMTDHXMU6RRXUWFU1Y7Z380.png",
                "block-thumb": "https://storage.googleapis.com/plotly-prod-images/invictus.8497/11/8_MA7ITX9LENE8Y3QGFN3R1ZGCNRNO1Y.png",
                "list-thumb": "https://storage.googleapis.com/plotly-prod-images/invictus.8497/11/9_VVVWCWBVI8UFN7H8YPUWYHGAQ7KKBR.png"
            },
            "api_urls": {
                "files": "https://api.plotly.com/v2/files/invictus.8497:11",
                "plots": "https://api.plotly.com/v2/plots/invictus.8497:11",
                "parent": "https://api.plotly.com/v2/folders/home?user=invictus.8497"
            },
            "owner": "invictus.8497",
            "parent": -1,
            "preview": "",
            "referencers": [],
            "references": [],
            "title": "",
            "views": 1,
            "web_url": "https://chart-studio.plotly.com/~invictus.8497/11/",
            "world_readable": true,
            "date_modified": "2024-04-29T16:09:05.833Z",
            "stars": {
                "results": [],
                "count": 0
            },
            "collaborators": {
                "results": [],
                "count": 0
            },
            "subfolder_count": null,
            "refresh_interval": null,
            "organize_view_url": "https://chart-studio.plotly.com/~invictus.8497/11/",
            "current_user_permission": "read",
            "is_theme": null,
            "is_template": false,
            "autosize": true,
            "caption": "",
            "figure": {
                "data": [
                    {
                        "line": {
                            "color": "rgb(0, 0, 0)",
                            "shape": "spline",
                            "smoothing": 1.3
                        },
                        "meta": {
                            "columnNames": {
                                "x": "M",
                                "y": "N"
                            }
                        },
                        "mode": "lines",
                        "name": "<b>H18CNG82</b>",
                        "type": "scatter",
                        "xsrc": "invictus.8497:10:b0821b",
                        "ysrc": "invictus.8497:10:d086c9",
                        "stackgroup": null
                    },
                    {
                        "line": {
                            "dash": "dot",
                            "color": "rgb(238, 141, 40)",
                            "shape": "spline",
                            "width": 4,
                            "smoothing": 1.3
                        },
                        "meta": {
                            "columnNames": {
                                "x": "J",
                                "y": "K"
                            }
                        },
                        "mode": "lines",
                        "name": "<b>H10CNG90</b>",
                        "type": "scatter",
                        "xsrc": "invictus.8497:10:911337",
                        "ysrc": "invictus.8497:10:8f8aa9",
                        "visible": true,
                        "stackgroup": null
                    },
                    {
                        "line": {
                            "shape": "spline",
                            "smoothing": 1.3
                        },
                        "meta": {
                            "columnNames": {
                                "x": "G",
                                "y": "H"
                            }
                        },
                        "mode": "lines",
                        "name": "<b>H5CNG95</b>",
                        "type": "scatter",
                        "xsrc": "invictus.8497:10:aa2a17",
                        "ysrc": "invictus.8497:10:ae7138",
                        "stackgroup": null
                    },
                    {
                        "line": {
                            "shape": "spline",
                            "smoothing": 1.3
                        },
                        "meta": {
                            "columnNames": {
                                "x": "D",
                                "y": "E"
                            }
                        },
                        "mode": "lines",
                        "name": "<b>CNG</b>",
                        "type": "scatter",
                        "xsrc": "invictus.8497:10:a58c83",
                        "ysrc": "invictus.8497:10:1c1336",
                        "stackgroup": null
                    }
                ],
                "frames": [],
                "layout": {
                    "xaxis": {
                        "type": "linear",
                        "range": [
                            -21.97372348653585,
                            73.44541765797848
                        ],
                        "ticks": "outside",
                        "title": {
                            "text": "<b>Crank Angle ( deg )</b>"
                        },
                        "showgrid": false,
                        "showline": true,
                        "zeroline": false,
                        "autorange": false,
                        "linewidth": 2
                    },
                    "yaxis": {
                        "type": "linear",
                        "range": [
                            -0.8558271574540168,
                            26.47056858794772
                        ],
                        "ticks": "outside",
                        "title": {
                            "text": "<b>HRR( J/deg )</b>"
                        },
                        "showgrid": false,
                        "showline": true,
                        "zeroline": false,
                        "autorange": false,
                        "linewidth": 2
                    },
                    "legend": {
                        "x": 0.754567901234568,
                        "y": 0.7966666666666666
                    },
                    "autosize": true,
                    "dragmode": "pan"
                }
            },
            "height": null,
            "width": null,
            "user": {
                "profile_url": "https://chart-studio.plotly.com/~invictus.8497",
                "avatar_url": "https://storage.googleapis.com/plotly-prod-profiles/36.jpg",
                "background_url": "https://storage.googleapis.com/plotly-prod-profiles/bg-5.jpg",
                "bio": "",
                "nickname": "",
                "website": "",
                "stream_tokens": null,
                "feature_set_id": null,
                "csrf_token": null,
                "date_joined": "2024-04-27 14:03:44",
                "mapbox_access_tokens": null,
                "has_password": null,
                "username": "invictus.8497",
                "email": null,
                "is_active": null,
                "readonly": null,
                "is_dash_creator": null,
                "dash_created_count": null,
                "is_chart_creator": null,
                "charts_created_count": null
            }
        },
        {
            "creation_time": "2024-04-28T17:55:35.017628Z",
            "comments": {
                "results": [],
                "count": 0
            },
            "parented": true,
            "embed_url": "https://chart-studio.plotly.com/~lahiruchathuranga19981214/1.embed",
            "fid": "lahiruchathuranga19981214:1",
            "filename": "Plot 1",
            "filetype": "plot",
            "img_url": "https://storage.googleapis.com/plotly-prod-images/lahiruchathuranga19981214/1/9_VO4LTG0NFMXZHN85NG95KHPEJFBYH9.png",
            "image_urls": {
                "default": "https://storage.googleapis.com/plotly-prod-images/lahiruchathuranga19981214/1/2_ZR13XZHU5I9MB67YD0KGA2Q04O8BVL.png",
                "block-thumb": "https://storage.googleapis.com/plotly-prod-images/lahiruchathuranga19981214/1/8_YMAHU5CYGX8PM6O860LYTHIG968HQ7.png",
                "list-thumb": "https://storage.googleapis.com/plotly-prod-images/lahiruchathuranga19981214/1/9_VO4LTG0NFMXZHN85NG95KHPEJFBYH9.png"
            },
            "api_urls": {
                "files": "https://api.plotly.com/v2/files/lahiruchathuranga19981214:1",
                "plots": "https://api.plotly.com/v2/plots/lahiruchathuranga19981214:1",
                "parent": "https://api.plotly.com/v2/folders/home?user=lahiruchathuranga19981214"
            },
            "owner": "lahiruchathuranga19981214",
            "parent": -1,
            "preview": "",
            "referencers": [],
            "references": [],
            "title": "",
            "views": 1,
            "web_url": "https://chart-studio.plotly.com/~lahiruchathuranga19981214/1/",
            "world_readable": true,
            "date_modified": "2024-04-28T17:55:35.029Z",
            "stars": {
                "results": [],
                "count": 0
            },
            "collaborators": {
                "results": [],
                "count": 0
            },
            "subfolder_count": null,
            "refresh_interval": null,
            "organize_view_url": "https://chart-studio.plotly.com/~lahiruchathuranga19981214/1/",
            "current_user_permission": "read",
            "is_theme": null,
            "is_template": false,
            "autosize": true,
            "caption": "",
            "figure": {
                "data": [
                    {
                        "meta": {
                            "columnNames": {
                                "x": "Iteration",
                                "y": " ExecutionTime(ms)"
                            }
                        },
                        "mode": "markers",
                        "type": "bar",
                        "xsrc": "lahiruchathuranga19981214:0:fecdb6",
                        "ysrc": "lahiruchathuranga19981214:0:eeb016",
                        "orientation": "v"
                    }
                ],
                "frames": [],
                "layout": {
                    "xaxis": {
                        "type": "linear",
                        "range": [
                            0.5,
                            100.5
                        ],
                        "title": {
                            "text": "Iteration"
                        },
                        "autorange": true
                    },
                    "yaxis": {
                        "type": "linear",
                        "range": [
                            0,
                            237.89473684210526
                        ],
                        "title": {
                            "text": "Execution Time (ms)"
                        },
                        "autorange": true
                    },
                    "autosize": true,
                    "template": {
                        "data": {
                            "bar": [
                                {
                                    "type": "bar",
                                    "marker": {
                                        "colorbar": {
                                            "ticks": "",
                                            "outlinewidth": 0
                                        }
                                    }
                                }
                            ],
                            "table": [
                                {
                                    "type": "table",
                                    "cells": {
                                        "fill": {
                                            "color": "#EBF0F8"
                                        },
                                        "line": {
                                            "color": "white"
                                        }
                                    },
                                    "header": {
                                        "fill": {
                                            "color": "#C8D4E3"
                                        },
                                        "line": {
                                            "color": "white"
                                        }
                                    }
                                }
                            ],
                            "carpet": [
                                {
                                    "type": "carpet",
                                    "aaxis": {
                                        "gridcolor": "#C8D4E3",
                                        "linecolor": "#C8D4E3",
                                        "endlinecolor": "#2a3f5f",
                                        "minorgridcolor": "#C8D4E3",
                                        "startlinecolor": "#2a3f5f"
                                    },
                                    "baxis": {
                                        "gridcolor": "#C8D4E3",
                                        "linecolor": "#C8D4E3",
                                        "endlinecolor": "#2a3f5f",
                                        "minorgridcolor": "#C8D4E3",
                                        "startlinecolor": "#2a3f5f"
                                    }
                                }
                            ],
                            "mesh3d": [
                                {
                                    "type": "mesh3d",
                                    "colorbar": {
                                        "ticks": "",
                                        "outlinewidth": 0
                                    }
                                }
                            ],
                            "contour": [
                                {
                                    "type": "contour",
                                    "colorbar": {
                                        "ticks": "",
                                        "outlinewidth": 0
                                    },
                                    "autocolorscale": true
                                }
                            ],
                            "heatmap": [
                                {
                                    "type": "heatmap",
                                    "colorbar": {
                                        "ticks": "",
                                        "outlinewidth": 0
                                    },
                                    "autocolorscale": true
                                }
                            ],
                            "scatter": [
                                {
                                    "type": "scatter",
                                    "marker": {
                                        "colorbar": {
                                            "ticks": "",
                                            "outlinewidth": 0
                                        }
                                    }
                                }
                            ],
                            "surface": [
                                {
                                    "type": "surface",
                                    "colorbar": {
                                        "ticks": "",
                                        "outlinewidth": 0
                                    }
                                }
                            ],
                            "heatmapgl": [
                                {
                                    "type": "heatmapgl",
                                    "colorbar": {
                                        "ticks": "",
                                        "outlinewidth": 0
                                    }
                                }
                            ],
                            "histogram": [
                                {
                                    "type": "histogram",
                                    "marker": {
                                        "colorbar": {
                                            "ticks": "",
                                            "outlinewidth": 0
                                        }
                                    }
                                }
                            ],
                            "parcoords": [
                                {
                                    "line": {
                                        "colorbar": {
                                            "ticks": "",
                                            "outlinewidth": 0
                                        }
                                    },
                                    "type": "parcoords"
                                }
                            ],
                            "scatter3d": [
                                {
                                    "type": "scatter3d",
                                    "marker": {
                                        "colorbar": {
                                            "ticks": "",
                                            "outlinewidth": 0
                                        }
                                    }
                                }
                            ],
                            "scattergl": [
                                {
                                    "type": "scattergl",
                                    "marker": {
                                        "colorbar": {
                                            "ticks": "",
                                            "outlinewidth": 0
                                        }
                                    }
                                }
                            ],
                            "choropleth": [
                                {
                                    "type": "choropleth",
                                    "colorbar": {
                                        "ticks": "",
                                        "outlinewidth": 0
                                    }
                                }
                            ],
                            "scattergeo": [
                                {
                                    "type": "scattergeo",
                                    "marker": {
                                        "colorbar": {
                                            "ticks": "",
                                            "outlinewidth": 0
                                        }
                                    }
                                }
                            ],
                            "histogram2d": [
                                {
                                    "type": "histogram2d",
                                    "colorbar": {
                                        "ticks": "",
                                        "outlinewidth": 0
                                    },
                                    "autocolorscale": true
                                }
                            ],
                            "scatterpolar": [
                                {
                                    "type": "scatterpolar",
                                    "marker": {
                                        "colorbar": {
                                            "ticks": "",
                                            "outlinewidth": 0
                                        }
                                    }
                                }
                            ],
                            "contourcarpet": [
                                {
                                    "type": "contourcarpet",
                                    "colorbar": {
                                        "ticks": "",
                                        "outlinewidth": 0
                                    }
                                }
                            ],
                            "scattercarpet": [
                                {
                                    "type": "scattercarpet",
                                    "marker": {
                                        "colorbar": {
                                            "ticks": "",
                                            "outlinewidth": 0
                                        }
                                    }
                                }
                            ],
                            "scattermapbox": [
                                {
                                    "type": "scattermapbox",
                                    "marker": {
                                        "colorbar": {
                                            "ticks": "",
                                            "outlinewidth": 0
                                        }
                                    }
                                }
                            ],
                            "scatterpolargl": [
                                {
                                    "type": "scatterpolargl",
                                    "marker": {
                                        "colorbar": {
                                            "ticks": "",
                                            "outlinewidth": 0
                                        }
                                    }
                                }
                            ],
                            "scatterternary": [
                                {
                                    "type": "scatterternary",
                                    "marker": {
                                        "colorbar": {
                                            "ticks": "",
                                            "outlinewidth": 0
                                        }
                                    }
                                }
                            ],
                            "histogram2dcontour": [
                                {
                                    "type": "histogram2dcontour",
                                    "colorbar": {
                                        "ticks": "",
                                        "outlinewidth": 0
                                    },
                                    "autocolorscale": true
                                }
                            ]
                        },
                        "layout": {
                            "geo": {
                                "bgcolor": "white",
                                "showland": true,
                                "lakecolor": "white",
                                "landcolor": "white",
                                "showlakes": true,
                                "subunitcolor": "#C8D4E3"
                            },
                            "font": {
                                "color": "#2a3f5f"
                            },
                            "polar": {
                                "bgcolor": "white",
                                "radialaxis": {
                                    "ticks": "",
                                    "gridcolor": "#EBF0F8",
                                    "linecolor": "#EBF0F8"
                                },
                                "angularaxis": {
                                    "ticks": "",
                                    "gridcolor": "#EBF0F8",
                                    "linecolor": "#EBF0F8"
                                }
                            },
                            "scene": {
                                "xaxis": {
                                    "ticks": "",
                                    "gridcolor": "#DFE8F3",
                                    "gridwidth": 2,
                                    "linecolor": "#EBF0F8",
                                    "zerolinecolor": "#EBF0F8",
                                    "showbackground": true,
                                    "backgroundcolor": "white"
                                },
                                "yaxis": {
                                    "ticks": "",
                                    "gridcolor": "#DFE8F3",
                                    "gridwidth": 2,
                                    "linecolor": "#EBF0F8",
                                    "zerolinecolor": "#EBF0F8",
                                    "showbackground": true,
                                    "backgroundcolor": "white"
                                },
                                "zaxis": {
                                    "ticks": "",
                                    "gridcolor": "#DFE8F3",
                                    "gridwidth": 2,
                                    "linecolor": "#EBF0F8",
                                    "zerolinecolor": "#EBF0F8",
                                    "showbackground": true,
                                    "backgroundcolor": "white"
                                }
                            },
                            "title": {
                                "x": 0.05
                            },
                            "xaxis": {
                                "ticks": "",
                                "gridcolor": "#EBF0F8",
                                "linecolor": "#EBF0F8",
                                "automargin": true,
                                "zerolinecolor": "#EBF0F8",
                                "zerolinewidth": 2
                            },
                            "yaxis": {
                                "ticks": "",
                                "gridcolor": "#EBF0F8",
                                "linecolor": "#EBF0F8",
                                "automargin": true,
                                "zerolinecolor": "#EBF0F8",
                                "zerolinewidth": 2
                            },
                            "ternary": {
                                "aaxis": {
                                    "ticks": "",
                                    "gridcolor": "#DFE8F3",
                                    "linecolor": "#A2B1C6"
                                },
                                "baxis": {
                                    "ticks": "",
                                    "gridcolor": "#DFE8F3",
                                    "linecolor": "#A2B1C6"
                                },
                                "caxis": {
                                    "ticks": "",
                                    "gridcolor": "#DFE8F3",
                                    "linecolor": "#A2B1C6"
                                },
                                "bgcolor": "white"
                            },
                            "colorway": [
                                "#636efa",
                                "#EF553B",
                                "#00cc96",
                                "#ab63fa",
                                "#19d3f3",
                                "#e763fa",
                                "#fecb52",
                                "#ffa15a",
                                "#ff6692",
                                "#b6e880"
                            ],
                            "hovermode": "closest",
                            "colorscale": {
                                "diverging": [
                                    [
                                        0,
                                        "#8e0152"
                                    ],
                                    [
                                        0.1,
                                        "#c51b7d"
                                    ],
                                    [
                                        0.2,
                                        "#de77ae"
                                    ],
                                    [
                                        0.3,
                                        "#f1b6da"
                                    ],
                                    [
                                        0.4,
                                        "#fde0ef"
                                    ],
                                    [
                                        0.5,
                                        "#f7f7f7"
                                    ],
                                    [
                                        0.6,
                                        "#e6f5d0"
                                    ],
                                    [
                                        0.7,
                                        "#b8e186"
                                    ],
                                    [
                                        0.8,
                                        "#7fbc41"
                                    ],
                                    [
                                        0.9,
                                        "#4d9221"
                                    ],
                                    [
                                        1,
                                        "#276419"
                                    ]
                                ],
                                "sequential": [
                                    [
                                        0,
                                        "#0508b8"
                                    ],
                                    [
                                        0.0893854748603352,
                                        "#1910d8"
                                    ],
                                    [
                                        0.1787709497206704,
                                        "#3c19f0"
                                    ],
                                    [
                                        0.2681564245810056,
                                        "#6b1cfb"
                                    ],
                                    [
                                        0.3575418994413408,
                                        "#981cfd"
                                    ],
                                    [
                                        0.44692737430167595,
                                        "#bf1cfd"
                                    ],
                                    [
                                        0.5363128491620112,
                                        "#dd2bfd"
                                    ],
                                    [
                                        0.6256983240223464,
                                        "#f246fe"
                                    ],
                                    [
                                        0.7150837988826816,
                                        "#fc67fd"
                                    ],
                                    [
                                        0.8044692737430168,
                                        "#fe88fc"
                                    ],
                                    [
                                        0.8938547486033519,
                                        "#fea5fd"
                                    ],
                                    [
                                        0.9832402234636871,
                                        "#febefe"
                                    ],
                                    [
                                        1,
                                        "#fec3fe"
                                    ]
                                ],
                                "sequentialminus": [
                                    [
                                        0,
                                        "#0508b8"
                                    ],
                                    [
                                        0.0893854748603352,
                                        "#1910d8"
                                    ],
                                    [
                                        0.1787709497206704,
                                        "#3c19f0"
                                    ],
                                    [
                                        0.2681564245810056,
                                        "#6b1cfb"
                                    ],
                                    [
                                        0.3575418994413408,
                                        "#981cfd"
                                    ],
                                    [
                                        0.44692737430167595,
                                        "#bf1cfd"
                                    ],
                                    [
                                        0.5363128491620112,
                                        "#dd2bfd"
                                    ],
                                    [
                                        0.6256983240223464,
                                        "#f246fe"
                                    ],
                                    [
                                        0.7150837988826816,
                                        "#fc67fd"
                                    ],
                                    [
                                        0.8044692737430168,
                                        "#fe88fc"
                                    ],
                                    [
                                        0.8938547486033519,
                                        "#fea5fd"
                                    ],
                                    [
                                        0.9832402234636871,
                                        "#febefe"
                                    ],
                                    [
                                        1,
                                        "#fec3fe"
                                    ]
                                ]
                            },
                            "plot_bgcolor": "white",
                            "paper_bgcolor": "white",
                            "shapedefaults": {
                                "line": {
                                    "width": 0
                                },
                                "opacity": 0.4,
                                "fillcolor": "#506784"
                            },
                            "annotationdefaults": {
                                "arrowhead": 0,
                                "arrowcolor": "#506784",
                                "arrowwidth": 1
                            }
                        },
                        "themeRef": "PLOTLY_WHITE"
                    }
                }
            },
            "height": null,
            "width": null,
            "user": {
                "profile_url": "https://chart-studio.plotly.com/~lahiruchathuranga19981214",
                "avatar_url": "https://storage.googleapis.com/plotly-prod-profiles/91.jpg",
                "background_url": "https://storage.googleapis.com/plotly-prod-profiles/bg-11.jpg",
                "bio": "",
                "nickname": "",
                "website": "",
                "stream_tokens": null,
                "feature_set_id": null,
                "csrf_token": null,
                "date_joined": "2024-04-28 17:55:00",
                "mapbox_access_tokens": null,
                "has_password": null,
                "username": "lahiruchathuranga19981214",
                "email": null,
                "is_active": null,
                "readonly": null,
                "is_dash_creator": null,
                "dash_created_count": null,
                "is_chart_creator": null,
                "charts_created_count": null
            }
        },
        {
            "creation_time": "2024-04-28T16:40:02.830615Z",
            "comments": {
                "results": [],
                "count": 0
            },
            "parented": true,
            "embed_url": "https://chart-studio.plotly.com/~nishatkhan20431/2.embed",
            "fid": "nishatkhan20431:2",
            "filename": "C:\\Users\\Admin\\Desktop\\pinterest-histogram\\style-trends.html",
            "filetype": "plot",
            "img_url": "https://storage.googleapis.com/plotly-prod-images/nishatkhan20431/2/9_VSF894WPPUKW6WIORJAB0MDSQLXMKS.png",
            "image_urls": {
                "default": "https://storage.googleapis.com/plotly-prod-images/nishatkhan20431/2/2_ZMJZX9OR3BWPDAMGHE0I97ZM7OYLLB.png",
                "block-thumb": "https://storage.googleapis.com/plotly-prod-images/nishatkhan20431/2/8_THFYKIF5244YQSCTLRTQ2S2K82277V.png",
                "list-thumb": "https://storage.googleapis.com/plotly-prod-images/nishatkhan20431/2/9_VSF894WPPUKW6WIORJAB0MDSQLXMKS.png"
            },
            "api_urls": {
                "files": "https://api.plotly.com/v2/files/nishatkhan20431:2",
                "plots": "https://api.plotly.com/v2/plots/nishatkhan20431:2",
                "parent": "https://api.plotly.com/v2/folders/home?user=nishatkhan20431"
            },
            "owner": "nishatkhan20431",
            "parent": -1,
            "preview": "",
            "referencers": [],
            "references": [],
            "title": "Pin Styles Over Time",
            "views": 1,
            "web_url": "https://chart-studio.plotly.com/~nishatkhan20431/2/pin-styles-over-time/",
            "world_readable": true,
            "date_modified": "2024-06-08T17:22:41.804Z",
            "stars": {
                "results": [],
                "count": 0
            },
            "collaborators": {
                "results": [],
                "count": 0
            },
            "subfolder_count": null,
            "refresh_interval": null,
            "organize_view_url": "https://chart-studio.plotly.com/~nishatkhan20431/2/",
            "current_user_permission": "read",
            "is_theme": null,
            "is_template": null,
            "autosize": true,
            "caption": "",
            "figure": {
                "data": [
                    {
                        "mode": "lines markers",
                        "name": "chic style",
                        "type": "scatter",
                        "xsrc": "nishatkhan20431:3:56ca5d",
                        "ysrc": "nishatkhan20431:3:3c8e34"
                    },
                    {
                        "mode": "lines markers",
                        "name": "goth style",
                        "type": "scatter",
                        "xsrc": "nishatkhan20431:3:56ca5d",
                        "ysrc": "nishatkhan20431:3:692779"
                    },
                    {
                        "mode": "lines markers",
                        "name": "kawaii style",
                        "type": "scatter",
                        "xsrc": "nishatkhan20431:3:56ca5d",
                        "ysrc": "nishatkhan20431:3:06401e"
                    },
                    {
                        "mode": "lines markers",
                        "name": "vintage style",
                        "type": "scatter",
                        "xsrc": "nishatkhan20431:3:56ca5d",
                        "ysrc": "nishatkhan20431:3:5b4cf8"
                    }
                ],
                "layout": {
                    "title": "Pin Styles Over Time",
                    "xaxis": {
                        "title": "Date"
                    },
                    "yaxis": {
                        "title": "Number of Pins"
                    }
                }
            },
            "height": null,
            "width": null,
            "user": {
                "profile_url": "https://chart-studio.plotly.com/~nishatkhan20431",
                "avatar_url": "https://storage.googleapis.com/plotly-prod-profiles/90.jpg",
                "background_url": "https://storage.googleapis.com/plotly-prod-profiles/bg-5.jpg",
                "bio": "",
                "nickname": "",
                "website": "",
                "stream_tokens": null,
                "feature_set_id": null,
                "csrf_token": null,
                "date_joined": "2024-04-21 16:11:30",
                "mapbox_access_tokens": null,
                "has_password": null,
                "username": "nishatkhan20431",
                "email": null,
                "is_active": null,
                "readonly": null,
                "is_dash_creator": null,
                "dash_created_count": null,
                "is_chart_creator": null,
                "charts_created_count": null
            }
        },
        {
            "creation_time": "2024-04-28T16:26:23.552535Z",
            "comments": {
                "results": [],
                "count": 0
            },
            "parented": true,
            "embed_url": "https://chart-studio.plotly.com/~hlockwooddesign/28.embed",
            "fid": "hlockwooddesign:28",
            "filename": "plot from API (11)",
            "filetype": "plot",
            "img_url": "https://storage.googleapis.com/plotly-prod-images/hlockwooddesign/28/9_70N1ZJZW19P4DW6RSIU5TD4N0UMS3Y.png",
            "image_urls": {
                "default": "https://storage.googleapis.com/plotly-prod-images/hlockwooddesign/28/2_VC82O4344V4NJX0HLMT33EQ5RLXKI9.png",
                "block-thumb": "https://storage.googleapis.com/plotly-prod-images/hlockwooddesign/28/8_XTS4ZIZ6S6EVFCI7V3C6WAKJTJ9VUE.png",
                "list-thumb": "https://storage.googleapis.com/plotly-prod-images/hlockwooddesign/28/9_70N1ZJZW19P4DW6RSIU5TD4N0UMS3Y.png"
            },
            "api_urls": {
                "files": "https://api.plotly.com/v2/files/hlockwooddesign:28",
                "plots": "https://api.plotly.com/v2/plots/hlockwooddesign:28",
                "parent": "https://api.plotly.com/v2/folders/home?user=hlockwooddesign"
            },
            "owner": "hlockwooddesign",
            "parent": -1,
            "preview": "",
            "referencers": [],
            "references": [],
            "title": "",
            "views": 1,
            "web_url": "https://chart-studio.plotly.com/~hlockwooddesign/28/",
            "world_readable": true,
            "date_modified": "2024-04-28T16:26:23.891Z",
            "stars": {
                "results": [],
                "count": 0
            },
            "collaborators": {
                "results": [],
                "count": 0
            },
            "subfolder_count": null,
            "refresh_interval": null,
            "organize_view_url": "https://chart-studio.plotly.com/~hlockwooddesign/28/",
            "current_user_permission": "read",
            "is_theme": null,
            "is_template": null,
            "autosize": true,
            "caption": "",
            "figure": {
                "data": [
                    {
                        "mode": "markers",
                        "xsrc": "hlockwooddesign:29:e688a8",
                        "ysrc": "hlockwooddesign:29:3ba23a",
                        "marker": {
                            "sizesrc": "hlockwooddesign:29:303f9c"
                        }
                    }
                ],
                "layout": {}
            },
            "height": null,
            "width": null,
            "user": {
                "profile_url": "https://chart-studio.plotly.com/~hlockwooddesign",
                "avatar_url": "https://storage.googleapis.com/plotly-prod-profiles/6.jpg",
                "background_url": "https://storage.googleapis.com/plotly-prod-profiles/bg-9.jpg",
                "bio": "",
                "nickname": "",
                "website": "",
                "stream_tokens": null,
                "feature_set_id": null,
                "csrf_token": null,
                "date_joined": "2024-04-28 15:09:48",
                "mapbox_access_tokens": null,
                "has_password": null,
                "username": "hlockwooddesign",
                "email": null,
                "is_active": null,
                "readonly": null,
                "is_dash_creator": null,
                "dash_created_count": null,
                "is_chart_creator": null,
                "charts_created_count": null
            }
        },
        {
            "creation_time": "2024-04-28T16:19:18.562963Z",
            "comments": {
                "results": [],
                "count": 0
            },
            "parented": true,
            "embed_url": "https://chart-studio.plotly.com/~hlockwooddesign/26.embed",
            "fid": "hlockwooddesign:26",
            "filename": "plot from API (10)",
            "filetype": "plot",
            "img_url": "https://storage.googleapis.com/plotly-prod-images/hlockwooddesign/26/9_J4739Q5WMITL27UY4JKXTK55GJTY7U.png",
            "image_urls": {
                "default": "https://storage.googleapis.com/plotly-prod-images/hlockwooddesign/26/2_58U17MDAFZFMIX5F9ADUB8VAXRSGDD.png",
                "block-thumb": "https://storage.googleapis.com/plotly-prod-images/hlockwooddesign/26/8_TGX4GIB4362VAH7N6I9V1GJNVRFJYI.png",
                "list-thumb": "https://storage.googleapis.com/plotly-prod-images/hlockwooddesign/26/9_J4739Q5WMITL27UY4JKXTK55GJTY7U.png"
            },
            "api_urls": {
                "files": "https://api.plotly.com/v2/files/hlockwooddesign:26",
                "plots": "https://api.plotly.com/v2/plots/hlockwooddesign:26",
                "parent": "https://api.plotly.com/v2/folders/home?user=hlockwooddesign"
            },
            "owner": "hlockwooddesign",
            "parent": -1,
            "preview": "",
            "referencers": [],
            "references": [],
            "title": "",
            "views": 1,
            "web_url": "https://chart-studio.plotly.com/~hlockwooddesign/26/",
            "world_readable": true,
            "date_modified": "2024-04-28T16:19:18.925Z",
            "stars": {
                "results": [],
                "count": 0
            },
            "collaborators": {
                "results": [],
                "count": 0
            },
            "subfolder_count": null,
            "refresh_interval": null,
            "organize_view_url": "https://chart-studio.plotly.com/~hlockwooddesign/26/",
            "current_user_permission": "read",
            "is_theme": null,
            "is_template": null,
            "autosize": true,
            "caption": "",
            "figure": {
                "data": [
                    {
                        "mode": "markers",
                        "xsrc": "hlockwooddesign:27:be3d56",
                        "ysrc": "hlockwooddesign:27:6e5db2",
                        "marker": {
                            "sizesrc": "hlockwooddesign:27:2c395a"
                        }
                    }
                ],
                "layout": {}
            },
            "height": null,
            "width": null,
            "user": {
                "profile_url": "https://chart-studio.plotly.com/~hlockwooddesign",
                "avatar_url": "https://storage.googleapis.com/plotly-prod-profiles/6.jpg",
                "background_url": "https://storage.googleapis.com/plotly-prod-profiles/bg-9.jpg",
                "bio": "",
                "nickname": "",
                "website": "",
                "stream_tokens": null,
                "feature_set_id": null,
                "csrf_token": null,
                "date_joined": "2024-04-28 15:09:48",
                "mapbox_access_tokens": null,
                "has_password": null,
                "username": "hlockwooddesign",
                "email": null,
                "is_active": null,
                "readonly": null,
                "is_dash_creator": null,
                "dash_created_count": null,
                "is_chart_creator": null,
                "charts_created_count": null
            }
        },
        {
            "creation_time": "2024-04-28T16:18:11.771180Z",
            "comments": {
                "results": [],
                "count": 0
            },
            "parented": true,
            "embed_url": "https://chart-studio.plotly.com/~hlockwooddesign/24.embed",
            "fid": "hlockwooddesign:24",
            "filename": "plot from API (9)",
            "filetype": "plot",
            "img_url": "https://storage.googleapis.com/plotly-prod-images/hlockwooddesign/24/9_8GZ4ENV8MJSJAG5NPTRNRKWFVELW5C.png",
            "image_urls": {
                "default": "https://storage.googleapis.com/plotly-prod-images/hlockwooddesign/24/2_MF63S75FEZF2A0SK6KM4DQ3241F33O.png",
                "block-thumb": "https://storage.googleapis.com/plotly-prod-images/hlockwooddesign/24/8_4Z4WJX9H3XEGU7R43OVR55LJC5HPRH.png",
                "list-thumb": "https://storage.googleapis.com/plotly-prod-images/hlockwooddesign/24/9_8GZ4ENV8MJSJAG5NPTRNRKWFVELW5C.png"
            },
            "api_urls": {
                "files": "https://api.plotly.com/v2/files/hlockwooddesign:24",
                "plots": "https://api.plotly.com/v2/plots/hlockwooddesign:24",
                "parent": "https://api.plotly.com/v2/folders/home?user=hlockwooddesign"
            },
            "owner": "hlockwooddesign",
            "parent": -1,
            "preview": "",
            "referencers": [],
            "references": [],
            "title": "",
            "views": 1,
            "web_url": "https://chart-studio.plotly.com/~hlockwooddesign/24/",
            "world_readable": true,
            "date_modified": "2024-04-28T16:18:12.102Z",
            "stars": {
                "results": [],
                "count": 0
            },
            "collaborators": {
                "results": [],
                "count": 0
            },
            "subfolder_count": null,
            "refresh_interval": null,
            "organize_view_url": "https://chart-studio.plotly.com/~hlockwooddesign/24/",
            "current_user_permission": "read",
            "is_theme": null,
            "is_template": null,
            "autosize": true,
            "caption": "",
            "figure": {
                "data": [
                    {
                        "mode": "markers",
                        "xsrc": "hlockwooddesign:25:f24213",
                        "ysrc": "hlockwooddesign:25:15b690",
                        "marker": {
                            "sizesrc": "hlockwooddesign:25:4dc4bc"
                        }
                    }
                ],
                "layout": {}
            },
            "height": null,
            "width": null,
            "user": {
                "profile_url": "https://chart-studio.plotly.com/~hlockwooddesign",
                "avatar_url": "https://storage.googleapis.com/plotly-prod-profiles/6.jpg",
                "background_url": "https://storage.googleapis.com/plotly-prod-profiles/bg-9.jpg",
                "bio": "",
                "nickname": "",
                "website": "",
                "stream_tokens": null,
                "feature_set_id": null,
                "csrf_token": null,
                "date_joined": "2024-04-28 15:09:48",
                "mapbox_access_tokens": null,
                "has_password": null,
                "username": "hlockwooddesign",
                "email": null,
                "is_active": null,
                "readonly": null,
                "is_dash_creator": null,
                "dash_created_count": null,
                "is_chart_creator": null,
                "charts_created_count": null
            }
        },
        {
            "creation_time": "2024-04-28T16:17:05.723108Z",
            "comments": {
                "results": [],
                "count": 0
            },
            "parented": true,
            "embed_url": "https://chart-studio.plotly.com/~hlockwooddesign/22.embed",
            "fid": "hlockwooddesign:22",
            "filename": "plot from API (8)",
            "filetype": "plot",
            "img_url": "https://storage.googleapis.com/plotly-prod-images/hlockwooddesign/22/9_DVFIA0AVSPT3SBHUDAKMUVT6FJEVET.png",
            "image_urls": {
                "default": "https://storage.googleapis.com/plotly-prod-images/hlockwooddesign/22/2_S34L38WQR8U70Q3J6AOBVWDEEAZYFS.png",
                "block-thumb": "https://storage.googleapis.com/plotly-prod-images/hlockwooddesign/22/8_B4T0H2TZQGXI32Z54DK253WHYE3QI2.png",
                "list-thumb": "https://storage.googleapis.com/plotly-prod-images/hlockwooddesign/22/9_DVFIA0AVSPT3SBHUDAKMUVT6FJEVET.png"
            },
            "api_urls": {
                "files": "https://api.plotly.com/v2/files/hlockwooddesign:22",
                "plots": "https://api.plotly.com/v2/plots/hlockwooddesign:22",
                "parent": "https://api.plotly.com/v2/folders/home?user=hlockwooddesign"
            },
            "owner": "hlockwooddesign",
            "parent": -1,
            "preview": "",
            "referencers": [],
            "references": [],
            "title": "",
            "views": 1,
            "web_url": "https://chart-studio.plotly.com/~hlockwooddesign/22/",
            "world_readable": true,
            "date_modified": "2024-04-28T16:17:06.081Z",
            "stars": {
                "results": [],
                "count": 0
            },
            "collaborators": {
                "results": [],
                "count": 0
            },
            "subfolder_count": null,
            "refresh_interval": null,
            "organize_view_url": "https://chart-studio.plotly.com/~hlockwooddesign/22/",
            "current_user_permission": "read",
            "is_theme": null,
            "is_template": null,
            "autosize": true,
            "caption": "",
            "figure": {
                "data": [
                    {
                        "mode": "markers",
                        "xsrc": "hlockwooddesign:23:25c3a9",
                        "ysrc": "hlockwooddesign:23:c87df1",
                        "marker": {
                            "sizesrc": "hlockwooddesign:23:ef6223"
                        }
                    }
                ],
                "layout": {}
            },
            "height": null,
            "width": null,
            "user": {
                "profile_url": "https://chart-studio.plotly.com/~hlockwooddesign",
                "avatar_url": "https://storage.googleapis.com/plotly-prod-profiles/6.jpg",
                "background_url": "https://storage.googleapis.com/plotly-prod-profiles/bg-9.jpg",
                "bio": "",
                "nickname": "",
                "website": "",
                "stream_tokens": null,
                "feature_set_id": null,
                "csrf_token": null,
                "date_joined": "2024-04-28 15:09:48",
                "mapbox_access_tokens": null,
                "has_password": null,
                "username": "hlockwooddesign",
                "email": null,
                "is_active": null,
                "readonly": null,
                "is_dash_creator": null,
                "dash_created_count": null,
                "is_chart_creator": null,
                "charts_created_count": null
            }
        },
        {
            "creation_time": "2024-04-28T16:08:17.158478Z",
            "comments": {
                "results": [],
                "count": 0
            },
            "parented": true,
            "embed_url": "https://chart-studio.plotly.com/~JAVIERSM/2.embed",
            "fid": "JAVIERSM:2",
            "filename": "IEB EXCEL",
            "filetype": "plot",
            "img_url": "https://storage.googleapis.com/plotly-prod-images/JAVIERSM/2/9_MLYQBZCYDV9TSBKLDAA18CW6WWU5RV.png",
            "image_urls": {
                "default": "https://storage.googleapis.com/plotly-prod-images/JAVIERSM/2/2_8D839T5ZNCE2EQ8NRTN8FZSGONIVUR.png",
                "block-thumb": "https://storage.googleapis.com/plotly-prod-images/JAVIERSM/2/8_L35VG9FEOVDM4FHD0Z6OBU6X3M5VMP.png",
                "list-thumb": "https://storage.googleapis.com/plotly-prod-images/JAVIERSM/2/9_MLYQBZCYDV9TSBKLDAA18CW6WWU5RV.png"
            },
            "api_urls": {
                "files": "https://api.plotly.com/v2/files/JAVIERSM:2",
                "plots": "https://api.plotly.com/v2/plots/JAVIERSM:2",
                "parent": "https://api.plotly.com/v2/folders/home?user=JAVIERSM"
            },
            "owner": "JAVIERSM",
            "parent": -1,
            "preview": "",
            "referencers": [],
            "references": [],
            "title": "",
            "views": 1,
            "web_url": "https://chart-studio.plotly.com/~JAVIERSM/2/",
            "world_readable": true,
            "date_modified": "2024-04-28T16:08:17.169Z",
            "stars": {
                "results": [],
                "count": 0
            },
            "collaborators": {
                "results": [],
                "count": 0
            },
            "subfolder_count": null,
            "refresh_interval": null,
            "organize_view_url": "https://chart-studio.plotly.com/~JAVIERSM/2/",
            "current_user_permission": "read",
            "is_theme": null,
            "is_template": false,
            "autosize": true,
            "caption": "",
            "figure": {
                "data": [
                    {
                        "meta": {
                            "columnNames": {
                                "x": "A",
                                "y": "B"
                            }
                        },
                        "mode": "lines",
                        "type": "scatter",
                        "xsrc": "JAVIERSM:1:e05a83",
                        "ysrc": "JAVIERSM:1:daadbd",
                        "orientation": "v"
                    }
                ],
                "frames": [],
                "layout": {
                    "title": {
                        "text": "GRUPO 4 (PATRICIA BARTOLL SERRA Y JAVIER SÁNCHEZ MUÑOZ)"
                    },
                    "xaxis": {
                        "type": "category",
                        "range": [
                            0,
                            97
                        ],
                        "autorange": true
                    },
                    "yaxis": {
                        "range": [
                            4956875.605555556,
                            5609840.294444444
                        ],
                        "title": {
                            "text": "VALOR"
                        },
                        "autorange": true
                    },
                    "autosize": true,
                    "dragmode": "zoom",
                    "template": {
                        "data": {
                            "bar": [
                                {
                                    "type": "bar",
                                    "marker": {
                                        "colorbar": {
                                            "ticks": "",
                                            "outlinewidth": 0
                                        }
                                    }
                                }
                            ],
                            "table": [
                                {
                                    "type": "table",
                                    "cells": {
                                        "fill": {
                                            "color": "#506784"
                                        },
                                        "line": {
                                            "color": "rgb(17,17,17)"
                                        }
                                    },
                                    "header": {
                                        "fill": {
                                            "color": "#2a3f5f"
                                        },
                                        "line": {
                                            "color": "rgb(17,17,17)"
                                        }
                                    }
                                }
                            ],
                            "carpet": [
                                {
                                    "type": "carpet",
                                    "aaxis": {
                                        "gridcolor": "#506784",
                                        "linecolor": "#506784",
                                        "endlinecolor": "#A2B1C6",
                                        "minorgridcolor": "#506784",
                                        "startlinecolor": "#A2B1C6"
                                    },
                                    "baxis": {
                                        "gridcolor": "#506784",
                                        "linecolor": "#506784",
                                        "endlinecolor": "#A2B1C6",
                                        "minorgridcolor": "#506784",
                                        "startlinecolor": "#A2B1C6"
                                    }
                                }
                            ],
                            "mesh3d": [
                                {
                                    "type": "mesh3d",
                                    "colorbar": {
                                        "ticks": "",
                                        "outlinewidth": 0
                                    }
                                }
                            ],
                            "contour": [
                                {
                                    "type": "contour",
                                    "colorbar": {
                                        "ticks": "",
                                        "outlinewidth": 0
                                    },
                                    "autocolorscale": true
                                }
                            ],
                            "heatmap": [
                                {
                                    "type": "heatmap",
                                    "colorbar": {
                                        "ticks": "",
                                        "outlinewidth": 0
                                    },
                                    "autocolorscale": true
                                }
                            ],
                            "scatter": [
                                {
                                    "type": "scatter",
                                    "marker": {
                                        "colorbar": {
                                            "ticks": "",
                                            "outlinewidth": 0
                                        }
                                    }
                                }
                            ],
                            "surface": [
                                {
                                    "type": "surface",
                                    "colorbar": {
                                        "ticks": "",
                                        "outlinewidth": 0
                                    }
                                }
                            ],
                            "heatmapgl": [
                                {
                                    "type": "heatmapgl",
                                    "colorbar": {
                                        "ticks": "",
                                        "outlinewidth": 0
                                    }
                                }
                            ],
                            "histogram": [
                                {
                                    "type": "histogram",
                                    "marker": {
                                        "colorbar": {
                                            "ticks": "",
                                            "outlinewidth": 0
                                        }
                                    }
                                }
                            ],
                            "parcoords": [
                                {
                                    "line": {
                                        "colorbar": {
                                            "ticks": "",
                                            "outlinewidth": 0
                                        }
                                    },
                                    "type": "parcoords"
                                }
                            ],
                            "scatter3d": [
                                {
                                    "type": "scatter3d",
                                    "marker": {
                                        "colorbar": {
                                            "ticks": "",
                                            "outlinewidth": 0
                                        }
                                    }
                                }
                            ],
                            "scattergl": [
                                {
                                    "type": "scattergl",
                                    "marker": {
                                        "colorbar": {
                                            "ticks": "",
                                            "outlinewidth": 0
                                        }
                                    }
                                }
                            ],
                            "choropleth": [
                                {
                                    "type": "choropleth",
                                    "colorbar": {
                                        "ticks": "",
                                        "outlinewidth": 0
                                    }
                                }
                            ],
                            "scattergeo": [
                                {
                                    "type": "scattergeo",
                                    "marker": {
                                        "colorbar": {
                                            "ticks": "",
                                            "outlinewidth": 0
                                        }
                                    }
                                }
                            ],
                            "histogram2d": [
                                {
                                    "type": "histogram2d",
                                    "colorbar": {
                                        "ticks": "",
                                        "outlinewidth": 0
                                    },
                                    "autocolorscale": true
                                }
                            ],
                            "scatterpolar": [
                                {
                                    "type": "scatterpolar",
                                    "marker": {
                                        "colorbar": {
                                            "ticks": "",
                                            "outlinewidth": 0
                                        }
                                    }
                                }
                            ],
                            "contourcarpet": [
                                {
                                    "type": "contourcarpet",
                                    "colorbar": {
                                        "ticks": "",
                                        "outlinewidth": 0
                                    }
                                }
                            ],
                            "scattercarpet": [
                                {
                                    "type": "scattercarpet",
                                    "marker": {
                                        "colorbar": {
                                            "ticks": "",
                                            "outlinewidth": 0
                                        }
                                    }
                                }
                            ],
                            "scattermapbox": [
                                {
                                    "type": "scattermapbox",
                                    "marker": {
                                        "colorbar": {
                                            "ticks": "",
                                            "outlinewidth": 0
                                        }
                                    }
                                }
                            ],
                            "scatterpolargl": [
                                {
                                    "type": "scatterpolargl",
                                    "marker": {
                                        "colorbar": {
                                            "ticks": "",
                                            "outlinewidth": 0
                                        }
                                    }
                                }
                            ],
                            "scatterternary": [
                                {
                                    "type": "scatterternary",
                                    "marker": {
                                        "colorbar": {
                                            "ticks": "",
                                            "outlinewidth": 0
                                        }
                                    }
                                }
                            ],
                            "histogram2dcontour": [
                                {
                                    "type": "histogram2dcontour",
                                    "colorbar": {
                                        "ticks": "",
                                        "outlinewidth": 0
                                    },
                                    "autocolorscale": true
                                }
                            ]
                        },
                        "layout": {
                            "geo": {
                                "bgcolor": "rgb(17,17,17)",
                                "showland": true,
                                "lakecolor": "rgb(17,17,17)",
                                "landcolor": "rgb(17,17,17)",
                                "showlakes": true,
                                "subunitcolor": "#506784"
                            },
                            "font": {
                                "color": "#f2f5fa"
                            },
                            "polar": {
                                "bgcolor": "rgb(17,17,17)",
                                "radialaxis": {
                                    "ticks": "",
                                    "gridcolor": "#506784",
                                    "linecolor": "#506784"
                                },
                                "angularaxis": {
                                    "ticks": "",
                                    "gridcolor": "#506784",
                                    "linecolor": "#506784"
                                }
                            },
                            "scene": {
                                "xaxis": {
                                    "ticks": "",
                                    "gridcolor": "#506784",
                                    "gridwidth": 2,
                                    "linecolor": "#506784",
                                    "zerolinecolor": "#C8D4E3",
                                    "showbackground": true,
                                    "backgroundcolor": "rgb(17,17,17)"
                                },
                                "yaxis": {
                                    "ticks": "",
                                    "gridcolor": "#506784",
                                    "gridwidth": 2,
                                    "linecolor": "#506784",
                                    "zerolinecolor": "#C8D4E3",
                                    "showbackground": true,
                                    "backgroundcolor": "rgb(17,17,17)"
                                },
                                "zaxis": {
                                    "ticks": "",
                                    "gridcolor": "#506784",
                                    "gridwidth": 2,
                                    "linecolor": "#506784",
                                    "zerolinecolor": "#C8D4E3",
                                    "showbackground": true,
                                    "backgroundcolor": "rgb(17,17,17)"
                                }
                            },
                            "title": {
                                "x": 0.05
                            },
                            "xaxis": {
                                "ticks": "",
                                "gridcolor": "#283442",
                                "linecolor": "#506784",
                                "automargin": true,
                                "zerolinecolor": "#283442",
                                "zerolinewidth": 2
                            },
                            "yaxis": {
                                "ticks": "",
                                "gridcolor": "#283442",
                                "linecolor": "#506784",
                                "automargin": true,
                                "zerolinecolor": "#283442",
                                "zerolinewidth": 2
                            },
                            "ternary": {
                                "aaxis": {
                                    "ticks": "",
                                    "gridcolor": "#506784",
                                    "linecolor": "#506784"
                                },
                                "baxis": {
                                    "ticks": "",
                                    "gridcolor": "#506784",
                                    "linecolor": "#506784"
                                },
                                "caxis": {
                                    "ticks": "",
                                    "gridcolor": "#506784",
                                    "linecolor": "#506784"
                                },
                                "bgcolor": "rgb(17,17,17)"
                            },
                            "colorway": [
                                "#636efa",
                                "#EF553B",
                                "#00cc96",
                                "#ab63fa",
                                "#19d3f3",
                                "#e763fa",
                                "#fecb52",
                                "#ffa15a",
                                "#ff6692",
                                "#b6e880"
                            ],
                            "hovermode": "closest",
                            "colorscale": {
                                "diverging": [
                                    [
                                        0,
                                        "#8e0152"
                                    ],
                                    [
                                        0.1,
                                        "#c51b7d"
                                    ],
                                    [
                                        0.2,
                                        "#de77ae"
                                    ],
                                    [
                                        0.3,
                                        "#f1b6da"
                                    ],
                                    [
                                        0.4,
                                        "#fde0ef"
                                    ],
                                    [
                                        0.5,
                                        "#f7f7f7"
                                    ],
                                    [
                                        0.6,
                                        "#e6f5d0"
                                    ],
                                    [
                                        0.7,
                                        "#b8e186"
                                    ],
                                    [
                                        0.8,
                                        "#7fbc41"
                                    ],
                                    [
                                        0.9,
                                        "#4d9221"
                                    ],
                                    [
                                        1,
                                        "#276419"
                                    ]
                                ],
                                "sequential": [
                                    [
                                        0,
                                        "#0508b8"
                                    ],
                                    [
                                        0.0893854748603352,
                                        "#1910d8"
                                    ],
                                    [
                                        0.1787709497206704,
                                        "#3c19f0"
                                    ],
                                    [
                                        0.2681564245810056,
                                        "#6b1cfb"
                                    ],
                                    [
                                        0.3575418994413408,
                                        "#981cfd"
                                    ],
                                    [
                                        0.44692737430167595,
                                        "#bf1cfd"
                                    ],
                                    [
                                        0.5363128491620112,
                                        "#dd2bfd"
                                    ],
                                    [
                                        0.6256983240223464,
                                        "#f246fe"
                                    ],
                                    [
                                        0.7150837988826816,
                                        "#fc67fd"
                                    ],
                                    [
                                        0.8044692737430168,
                                        "#fe88fc"
                                    ],
                                    [
                                        0.8938547486033519,
                                        "#fea5fd"
                                    ],
                                    [
                                        0.9832402234636871,
                                        "#febefe"
                                    ],
                                    [
                                        1,
                                        "#fec3fe"
                                    ]
                                ],
                                "sequentialminus": [
                                    [
                                        0,
                                        "#0508b8"
                                    ],
                                    [
                                        0.0893854748603352,
                                        "#1910d8"
                                    ],
                                    [
                                        0.1787709497206704,
                                        "#3c19f0"
                                    ],
                                    [
                                        0.2681564245810056,
                                        "#6b1cfb"
                                    ],
                                    [
                                        0.3575418994413408,
                                        "#981cfd"
                                    ],
                                    [
                                        0.44692737430167595,
                                        "#bf1cfd"
                                    ],
                                    [
                                        0.5363128491620112,
                                        "#dd2bfd"
                                    ],
                                    [
                                        0.6256983240223464,
                                        "#f246fe"
                                    ],
                                    [
                                        0.7150837988826816,
                                        "#fc67fd"
                                    ],
                                    [
                                        0.8044692737430168,
                                        "#fe88fc"
                                    ],
                                    [
                                        0.8938547486033519,
                                        "#fea5fd"
                                    ],
                                    [
                                        0.9832402234636871,
                                        "#febefe"
                                    ],
                                    [
                                        1,
                                        "#fec3fe"
                                    ]
                                ]
                            },
                            "plot_bgcolor": "rgb(17,17,17)",
                            "paper_bgcolor": "rgb(17,17,17)",
                            "shapedefaults": {
                                "line": {
                                    "width": 0
                                },
                                "opacity": 0.4,
                                "fillcolor": "#f2f5fa"
                            },
                            "sliderdefaults": {
                                "bgcolor": "#C8D4E3",
                                "tickwidth": 0,
                                "bordercolor": "rgb(17,17,17)",
                                "borderwidth": 1
                            },
                            "annotationdefaults": {
                                "arrowhead": 0,
                                "arrowcolor": "#f2f5fa",
                                "arrowwidth": 1
                            },
                            "updatemenudefaults": {
                                "bgcolor": "#506784",
                                "borderwidth": 0
                            }
                        },
                        "themeRef": "PLOTLY_DARK"
                    }
                }
            },
            "height": null,
            "width": null,
            "user": {
                "profile_url": "https://chart-studio.plotly.com/~JAVIERSM",
                "avatar_url": "https://storage.googleapis.com/plotly-prod-profiles/75.jpg",
                "background_url": "https://storage.googleapis.com/plotly-prod-profiles/bg-10.jpg",
                "bio": "",
                "nickname": "",
                "website": "",
                "stream_tokens": null,
                "feature_set_id": null,
                "csrf_token": null,
                "date_joined": "2024-04-28 16:06:32",
                "mapbox_access_tokens": null,
                "has_password": null,
                "username": "JAVIERSM",
                "email": null,
                "is_active": null,
                "readonly": null,
                "is_dash_creator": null,
                "dash_created_count": null,
                "is_chart_creator": null,
                "charts_created_count": null
            }
        }
    ]
}